valuation of ecosystem services - departement omgeving · 2016-06-30 · 7 economic valuation of...
TRANSCRIPT
Economic valuation of ecosystem
services

2 Economic valuation of ecosystem services Economic valuation of ecosystem services 3
A Tool for the Economic
Valuation of Ecosystem Services
in Flanders
cover: Renier Lagendijck - 60 blikken sperziebonen en 60 sperziebonenplanten 2003 links: strand Economic valuation of ecosystem services 5
index
Introduction 7
What are Ecosystem Services? 7
A tool for better informed decision making 9
Pricing nature to recognise its value in decision making 10
Different valuation methods for different services 11
Cultural services 13
Choice experiment 13
Valuation function 15
Distance decay 16
Scope and substitution 17
Use of the valuation function in cost benefit analysis 18
Regulating services 21
Provisioning services 21
Quantification of regulating services 21
Valuation of regulating services 23
Use of quantification functions and values in CBA 25
Manual and online tool for practical application 26
7
Economic valuation of ecosystem services 7
Introduction
What are Ecosystem Services?
Nature is priceless, but it is worth a lot. Although ecosystems underpin all human life and activities, people are often not aware of the benefits they receive from nature nor of their value. A good understanding of ecosystem services can lead to win-win situations. Studies for the Scheldt estuary e.g. show that floodplains can provide a cheaper protection against flooding than the construction of higher dikes only. But lack of knowledge on ecosystem services (ESS) and their value can lead to wrong decisions and even catastrophes. The overexploitation of the Aral lake in Kazakhstan and Uzbekistan has reduced this once largest inland wa-ter mass with 90%, leaving a desert and causing large economic losses and illness to the surrounding population. A lot more examples in the TEEB stu-dy (see box) illustrate of the importance of ESS.
Different groups of ESS can be distinguished (Millennium Ecosystem Assessment):
Ë provisioning services,
Ë regulating services,
Ë cultural services
Ë and the supporting services maintaining the conditions for life on
Earth, like nutrient cycling and photosynthesis.
Ecosystem services (ESS) are the benefits people obtain from ecosystems.
8 Economic valuation of ecosystem services Economic valuation of ecosystem services 9
TEEB: The Economics of Ecosystems and Biodiversity
TEEB is a major international initiative to draw attention to the global economic benefits of bio-diversity, to highlight the growing costs of biodi-versity loss and ecosystem degradation, and to draw together expertise from the fields of science, economics and policy to enable practical actions moving forward.TEEB provides five deliverables:
Ë TEEB D0 ecological and economic foundations
Ë TEEB D1 for international and national policy makers
Ë TEEB D2 for local and regional policy makers
Ë TEEB D3 for business
Ë TEEB D4 for citizensMore information can be found at www.teebweb.org
A tool for better informed decision making
A social cost benefit analysis describes and quantifies all the welfare effects of an intended new plan or project. It is a decision support tool that is used more and more, also in Flanders. A social cost benefit analysis provides an answer to the questions “Is society better off with or without this new po-licy?” and “Which policy alternative is best for society?” However, for a cor-rect answer to these questions, we have to ensure that all welfare effects have been included in the trade-off. It should also include the welfare effects of possible impacts on ecosystems. In order to include these ESS changes in the trade-off, it is useful that they are quantified and expressed in the same unit as the other elements of the cost benefit analysis, and this unit is money. In order to make this possible, the Flemish government has provided for a Tool for Economic Valuation of Ecosystem Services in Flanders. This tool
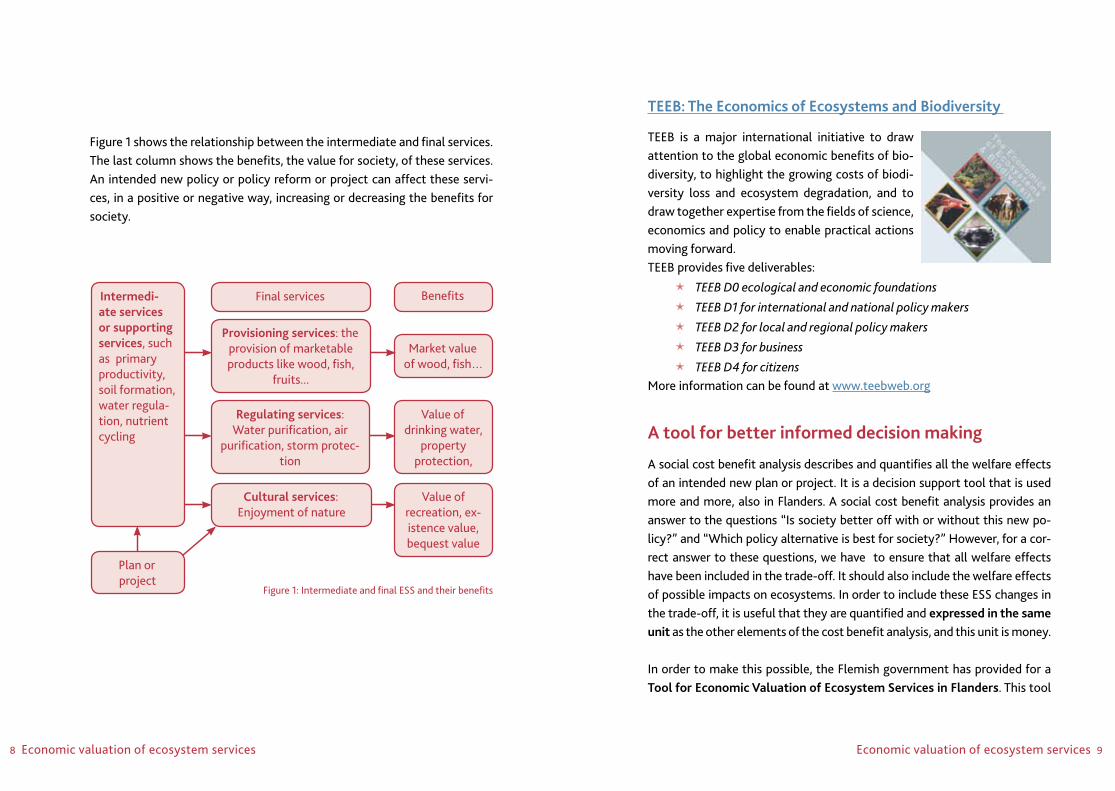
Figure 1 shows the relationship between the intermediate and final services. The last column shows the benefits, the value for society, of these services. An intended new policy or policy reform or project can affect these servi-ces, in a positive or negative way, increasing or decreasing the benefits for society.
Figure 1: Intermediate and final ESS and their benefits
Market value of wood, fish…
Final services Benefits
Provisioning services: the provision of marketable products like wood, fish,
fruits...
Regulating services: Water purification, air
purification, storm protec-tion
Cultural services: Enjoyment of nature
Value of drinking water,
property protection,
Value of recreation, ex-istence value, bequest value
Intermedi-ate services or supporting services, such as primary productivity, soil formation, water regula-tion, nutrient cycling
Plan or project
10 Economic valuation of ecosystem services Economic valuation of ecosystem services 11
Different valuation methods for different services
If goods (products) delivered by the provisioning services of ecosystems can be sold on a market, the market prices will be used to value that service. Regulating services can be valued by using stated preferences, revealed preferences (adjoining markets), marginal damage costs or marginal reduc-tion costs. Cultural services combine the value people attach to nature from a recreational, spiritual or emotional point of view. This is the value people attach to walking or cycling in a natural area, the value they attach to simply knowing that nature is preserved, even without visiting it, and the value they attach to the preservation of nature for their children and grand-children. This value can be expressed in monetary terms by using revealed and stated preferences.The economic value of supporting services, being included in the valuation of the (provisioning, regulating or cultural) services it supports, is not esti-mated separately.
This study consists of two main parts: the first part studies the cultural servi-ces and the second one the regulating services. This report is not an exhaus-tive overview of all the possible ecosystem services. It is restricted to those ecosystem services which the study “Ecosystem Services in Flanders – an exploratory inventory of ESS and potential Ecosystem Gains”1 considered important in Flanders and for which sufficient scientific research has been performed to have a sound base for the selected functions and numbers.
consists of a manual and a supporting on-line calculator. The tool results from an extensive study by a team of economists and ecologists of VITO (the Flemish institute for technological research), the University of Antwerp and the Free University of Amsterdam. This brochure presents a summary of this valuation study.
Pricing nature to recognise its value in decision making
For most ecosystem services there are no observable prices from which we can derive their value for society. Goods delivered by provisioning services like timber and firewood are an exception. For this reason we have to use economic valuation techniques.
Different methods exist to put a monetary value on ecosystem services that reflect their importance for human welfare and wellbeing. The choice of a method depends on the availability of data. In the next chapters of this summary, we explain which methods we have applied in our study.
It is important to understand that this study values a marginal change in ecosystem service provision, but does not measure the total value of certain ecosystems. The figures do provide information to policy makers about the loss/gain of welfare resulting from the degradation/improvement of eco-system services.
1 Jacobs, S. et.al. 2010. Ecosysteemdiensten in Vlaanderen: een verkennende inventarisatie van ecosysteemdiensten en potentiële ecosysteemwinsten. University of Antwerp, Ecosystem Management Research Group, ECOBE 010-R127, study for the Flemish Agency for Nature and Forests.
7
Economic valuation of ecosystem services 13
Cultural Services
We have developed a valuation function by carrying out a choice-experi-ment (CE). This is a sophisticated, state of the art questionnaire technique, based on extensive experience in different fields of economics. In a CE, res-pondents are asked to choose their preferred alternative from two or more alternative scenarios that are defined by attributes on different levels. CEs commonly present a series of such choices to each respondent: respondents get multiple chances to express their preference for a valued good over a range of payment amounts. In this choice experiment, respondents were asked to choose between different nature development scenarios, described in terms of their ecological quality and a full set of spatial characteristics to capture landscape preferences.
Choice experiment
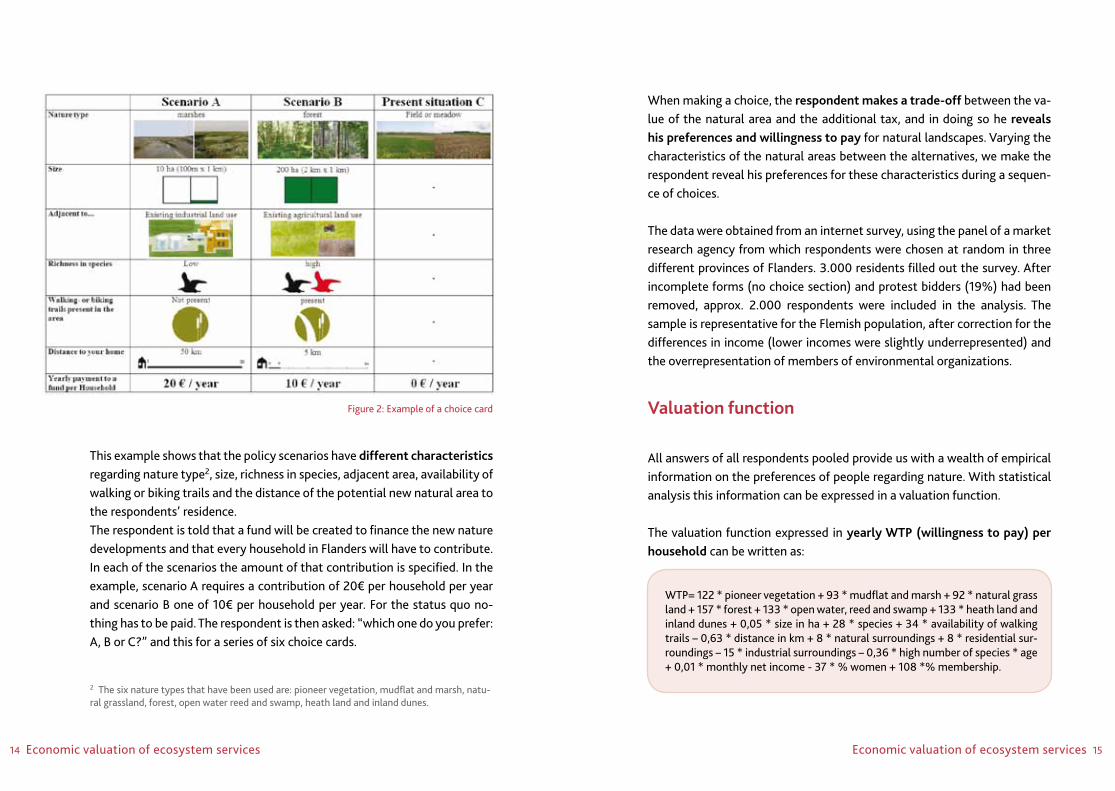
In this choice experiment, we have asked the respondents to choose be-tween two possible future policy scenarios, scenario A and scenario B on the one hand, and the status quo scenario C on the other hand. The status quo is land used for agriculture without any natural or landscape value, without walking trails through the area and with a low number of species. The two policy scenarios A and B describe the transformation from this agricultural land use into a natural land use with specific attributes. The interviews are conducted using choice cards, like the example in figure 2.
14 Economic valuation of ecosystem services Economic valuation of ecosystem services 15
This example shows that the policy scenarios have different characteristics regarding nature type2, size, richness in species, adjacent area, availability of walking or biking trails and the distance of the potential new natural area to the respondents’ residence.The respondent is told that a fund will be created to finance the new nature developments and that every household in Flanders will have to contribute. In each of the scenarios the amount of that contribution is specified. In the example, scenario A requires a contribution of 20€ per household per year and scenario B one of 10€ per household per year. For the status quo no-thing has to be paid. The respondent is then asked: “which one do you prefer: A, B or C?” and this for a series of six choice cards.
When making a choice, the respondent makes a trade-off between the va-lue of the natural area and the additional tax, and in doing so he reveals his preferences and willingness to pay for natural landscapes. Varying the characteristics of the natural areas between the alternatives, we make the respondent reveal his preferences for these characteristics during a sequen-ce of choices.
The data were obtained from an internet survey, using the panel of a market research agency from which respondents were chosen at random in three different provinces of Flanders. 3.000 residents filled out the survey. After incomplete forms (no choice section) and protest bidders (19%) had been removed, approx. 2.000 respondents were included in the analysis. The sample is representative for the Flemish population, after correction for the differences in income (lower incomes were slightly underrepresented) and the overrepresentation of members of environmental organizations.
Valuation function
All answers of all respondents pooled provide us with a wealth of empirical information on the preferences of people regarding nature. With statistical analysis this information can be expressed in a valuation function.
The valuation function expressed in yearly WTP (willingness to pay) per household can be written as:
Figure 2: Example of a choice card
WTP= 122 * pioneer vegetation + 93 * mudflat and marsh + 92 * natural grass land + 157 * forest + 133 * open water, reed and swamp + 133 * heath land and inland dunes + 0,05 * size in ha + 28 * species + 34 * availability of walking trails – 0,63 * distance in km + 8 * natural surroundings + 8 * residential sur-roundings – 15 * industrial surroundings – 0,36 * high number of species * age + 0,01 * monthly net income - 37 * % women + 108 *% membership.
2 The six nature types that have been used are: pioneer vegetation, mudflat and marsh, natu-ral grassland, forest, open water reed and swamp, heath land and inland dunes.
16 Economic valuation of ecosystem services Economic valuation of ecosystem services 17
The results show that people are willing to pay for additional natural land-scape and that the amount depends on the characteristics mentioned abo-ve. The nature type is important. Forests are valued higher, pioneer vege-tation, marshes and grass lands are valued lower than open water, swamps and heath land. The respondents are willing to pay more for easily accessible nature, but this is not a dominant attribute. As expected, people are also attaching a higher value to nature that has a rich biodiversity and is not sur-rounded by industry.
Distance decay
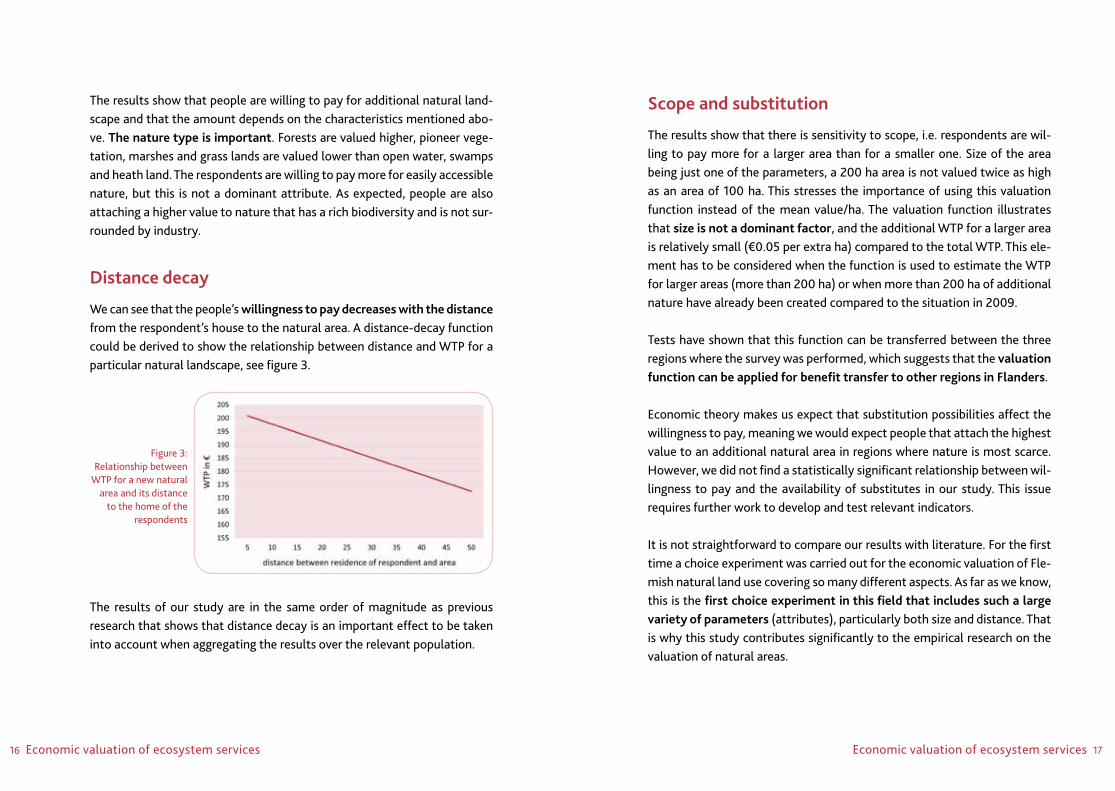
We can see that the people’s willingness to pay decreases with the distance from the respondent’s house to the natural area. A distance-decay function could be derived to show the relationship between distance and WTP for a particular natural landscape, see figure 3.
The results of our study are in the same order of magnitude as previous research that shows that distance decay is an important effect to be taken into account when aggregating the results over the relevant population.
Scope and substitution
The results show that there is sensitivity to scope, i.e. respondents are wil-ling to pay more for a larger area than for a smaller one. Size of the area being just one of the parameters, a 200 ha area is not valued twice as high as an area of 100 ha. This stresses the importance of using this valuation function instead of the mean value/ha. The valuation function illustrates that size is not a dominant factor, and the additional WTP for a larger area is relatively small (€0.05 per extra ha) compared to the total WTP. This ele-ment has to be considered when the function is used to estimate the WTP for larger areas (more than 200 ha) or when more than 200 ha of additional nature have already been created compared to the situation in 2009.
Tests have shown that this function can be transferred between the three regions where the survey was performed, which suggests that the valuation function can be applied for benefit transfer to other regions in Flanders.
Economic theory makes us expect that substitution possibilities affect the willingness to pay, meaning we would expect people that attach the highest value to an additional natural area in regions where nature is most scarce. However, we did not find a statistically significant relationship between wil-lingness to pay and the availability of substitutes in our study. This issue requires further work to develop and test relevant indicators.
It is not straightforward to compare our results with literature. For the first time a choice experiment was carried out for the economic valuation of Fle-mish natural land use covering so many different aspects. As far as we know, this is the first choice experiment in this field that includes such a large variety of parameters (attributes), particularly both size and distance. That is why this study contributes significantly to the empirical research on the valuation of natural areas.
Figure 3: Relationship between
WTP for a new natural area and its distance
to the home of the respondents
18 Economic valuation of ecosystem services Economic valuation of ecosystem services 19
Use of the valuation function in cost benefit analy-sis and other decision tools
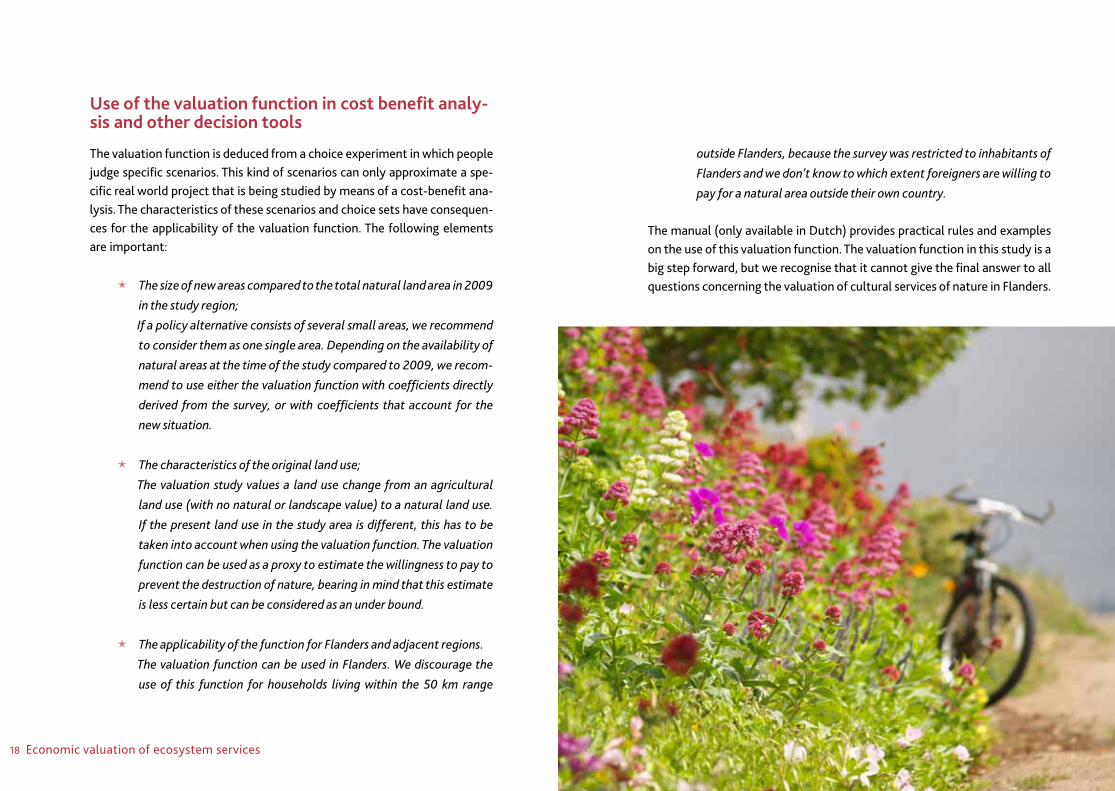
The valuation function is deduced from a choice experiment in which people judge specific scenarios. This kind of scenarios can only approximate a spe-cific real world project that is being studied by means of a cost-benefit ana-lysis. The characteristics of these scenarios and choice sets have consequen-ces for the applicability of the valuation function. The following elements are important:
Ë The size of new areas compared to the total natural land area in 2009
in the study region;
Ë If a policy alternative consists of several small areas, we recommend
to consider them as one single area. Depending on the availability of
natural areas at the time of the study compared to 2009, we recom-
mend to use either the valuation function with coefficients directly
derived from the survey, or with coefficients that account for the
new situation.
Ë
Ë The characteristics of the original land use;
Ë The valuation study values a land use change from an agricultural
land use (with no natural or landscape value) to a natural land use.
If the present land use in the study area is different, this has to be
taken into account when using the valuation function. The valuation
function can be used as a proxy to estimate the willingness to pay to
prevent the destruction of nature, bearing in mind that this estimate
is less certain but can be considered as an under bound.
Ë
Ë The applicability of the function for Flanders and adjacent regions.
Ë The valuation function can be used in Flanders. We discourage the
use of this function for households living within the 50 km range
outside Flanders, because the survey was restricted to inhabitants of
Flanders and we don’t know to which extent foreigners are willing to
pay for a natural area outside their own country.
The manual (only available in Dutch) provides practical rules and examples on the use of this valuation function. The valuation function in this study is a big step forward, but we recognise that it cannot give the final answer to all questions concerning the valuation of cultural services of nature in Flanders.
7
Economic valuation of ecosystem services 21
Regulating Services
The second part of our study provides functions and key indicators for quantification and valuation of provisioning and regulating services.
Provisioning services
In Flanders, provisioning services hardly provide any benefits in areas where biodiversity is the primary objective. There are several reasons. First of all, the quantities that can be extracted in these areas compared to commercial areas are minimal. Secondly, there often is little or only informal demand for specific products. Finally harvesting costs can be substantial, with the possible exception of timber and firewood, but there is little transferable information on quantities and the costs of harvesting.
Quantification of regulating services
Valuing changes in quantities of different regulating services is a complex, but crucial element in the valuation of impacts on ecosystems (or the creation of new ecosystems). We often lack the tools and models to assess the effect of changes in physical, biochemical and ecological processes on the delivery of ecosystem services. While performing the study, we noticed that quantification figures reported in literature can vary widely, the context and driving processes not being sufficiently detailed. We recognise that further research on the influence of different ecosystem functions on ecosystem services is required.
In order to enable the quantification of regulating services in a CBA with only limited data available, our manual provides for simplified quantification functions and indicator values. We have translated the information from literature into practical quantification functions for the most relevant services for which sufficient information is available.
22 Economic valuation of ecosystem services Economic valuation of ecosystem services 23
These are:
Ë denitrification (contribution to water quality),
Ë N, P and C sequestration in soils (contribution to water quality and to
climate regulation),
Ë N, P and C sequestration in forest biomass (contribution to water
quality and climate regulation),
Ë improvement of air quality by capturing pollutants as PM10,
Ë noise mitigation by providing a buffer function.
For the service “pollination”, it is impossible with the information avail- able at present to provide quantification functions and hence the study only gives an overview of the available literature. The quantification of the ser-vice “water retention” (flood control) depends on too many factors for a simple quantification function, and requires the running of a hydrological model.
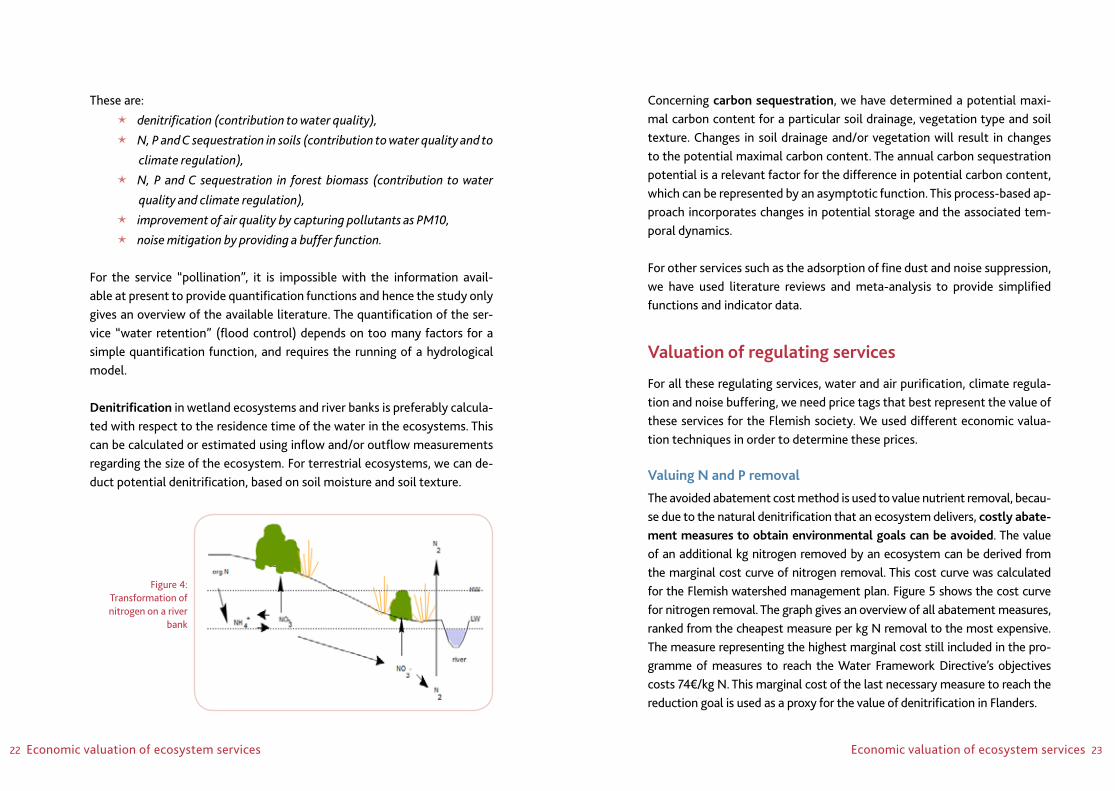
Denitrification in wetland ecosystems and river banks is preferably calcula-ted with respect to the residence time of the water in the ecosystems. This can be calculated or estimated using inflow and/or outflow measurements regarding the size of the ecosystem. For terrestrial ecosystems, we can de-duct potential denitrification, based on soil moisture and soil texture.
Figure 4: Transformation of nitrogen on a river
bank
Concerning carbon sequestration, we have determined a potential maxi-mal carbon content for a particular soil drainage, vegetation type and soil texture. Changes in soil drainage and/or vegetation will result in changes to the potential maximal carbon content. The annual carbon sequestration potential is a relevant factor for the difference in potential carbon content, which can be represented by an asymptotic function. This process-based ap-proach incorporates changes in potential storage and the associated tem-poral dynamics.
For other services such as the adsorption of fine dust and noise suppression, we have used literature reviews and meta-analysis to provide simplified functions and indicator data.
Valuation of regulating services
For all these regulating services, water and air purification, climate regula-tion and noise buffering, we need price tags that best represent the value of these services for the Flemish society. We used different economic valua-tion techniques in order to determine these prices.
Valuing N and P removal
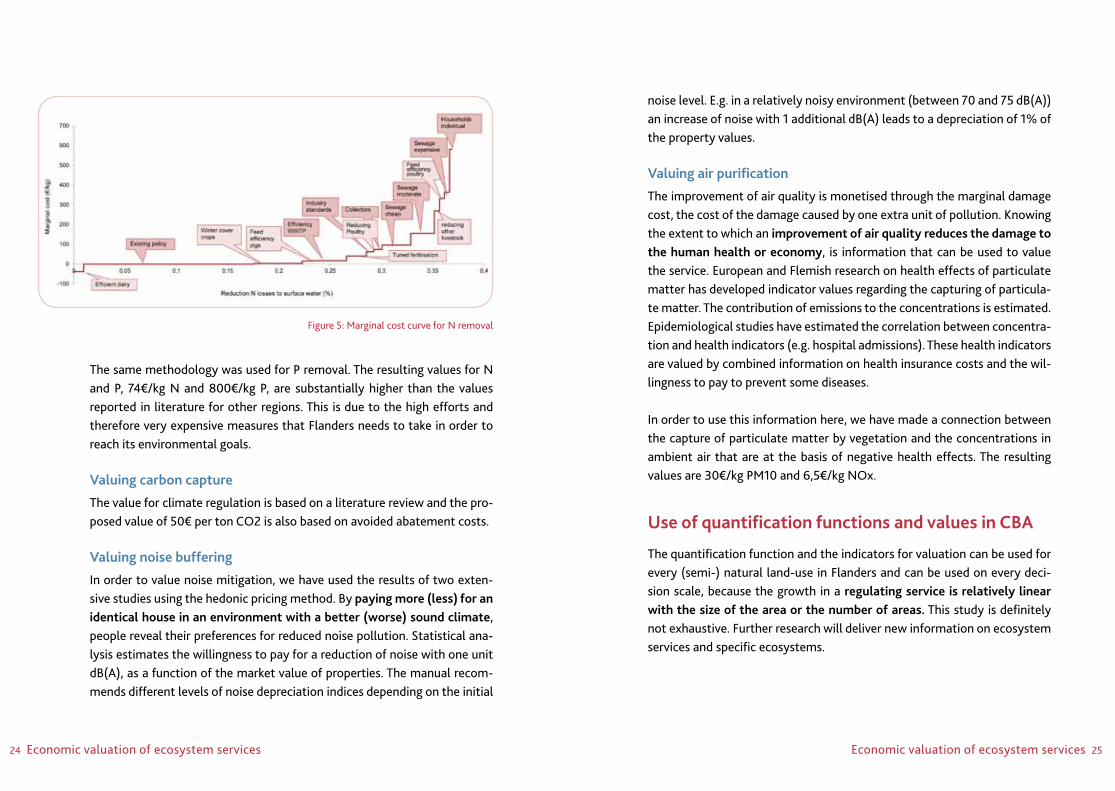
The avoided abatement cost method is used to value nutrient removal, becau-se due to the natural denitrification that an ecosystem delivers, costly abate-ment measures to obtain environmental goals can be avoided. The value of an additional kg nitrogen removed by an ecosystem can be derived from the marginal cost curve of nitrogen removal. This cost curve was calculated for the Flemish watershed management plan. Figure 5 shows the cost curve for nitrogen removal. The graph gives an overview of all abatement measures, ranked from the cheapest measure per kg N removal to the most expensive. The measure representing the highest marginal cost still included in the pro-gramme of measures to reach the Water Framework Directive’s objectives costs 74€/kg N. This marginal cost of the last necessary measure to reach the reduction goal is used as a proxy for the value of denitrification in Flanders.
24 Economic valuation of ecosystem services Economic valuation of ecosystem services 25
The same methodology was used for P removal. The resulting values for N and P, 74€/kg N and 800€/kg P, are substantially higher than the values reported in literature for other regions. This is due to the high efforts and therefore very expensive measures that Flanders needs to take in order to reach its environmental goals.
Valuing carbon capture
The value for climate regulation is based on a literature review and the pro-posed value of 50€ per ton CO2 is also based on avoided abatement costs.
Valuing noise buffering
In order to value noise mitigation, we have used the results of two exten-sive studies using the hedonic pricing method. By paying more (less) for an identical house in an environment with a better (worse) sound climate, people reveal their preferences for reduced noise pollution. Statistical ana-lysis estimates the willingness to pay for a reduction of noise with one unit dB(A), as a function of the market value of properties. The manual recom-mends different levels of noise depreciation indices depending on the initial
Figure 5: Marginal cost curve for N removal
noise level. E.g. in a relatively noisy environment (between 70 and 75 dB(A)) an increase of noise with 1 additional dB(A) leads to a depreciation of 1% of the property values.
Valuing air purification
The improvement of air quality is monetised through the marginal damage cost, the cost of the damage caused by one extra unit of pollution. Knowing the extent to which an improvement of air quality reduces the damage to the human health or economy, is information that can be used to value the service. European and Flemish research on health effects of particulate matter has developed indicator values regarding the capturing of particula-te matter. The contribution of emissions to the concentrations is estimated. Epidemiological studies have estimated the correlation between concentra-tion and health indicators (e.g. hospital admissions). These health indicators are valued by combined information on health insurance costs and the wil-lingness to pay to prevent some diseases.
In order to use this information here, we have made a connection between the capture of particulate matter by vegetation and the concentrations in ambient air that are at the basis of negative health effects. The resulting values are 30€/kg PM10 and 6,5€/kg NOx.
Use of quantification functions and values in CBA
The quantification function and the indicators for valuation can be used for every (semi-) natural land-use in Flanders and can be used on every deci-sion scale, because the growth in a regulating service is relatively linear with the size of the area or the number of areas. This study is definitely not exhaustive. Further research will deliver new information on ecosystem services and specific ecosystems.
26 Economic valuation of ecosystem services Economic valuation of ecosystem services 27
Manual and Online Tool for Practical Application
A practical manual explains and illustrates the use of all the numbers and functions. This manual, the supporting web tool and the underpinning study are available on the environmental economics webpage of the Department Environment, Nature and Energy of the Flemish Government, http://mili-eueconomie.lne.be. Several scientific papers emerging from this study are forthcoming. A paper focusing on the spatial elements in the valuation func-tion is already available (http://www.bioecon.ucl.ac.uk/10papers12.htm).
The manual and online tool will not remain static. The quantification and valuation functions that are presented are built on the present knowledge and data-availability. The list of ecosystem services described in this manual is not complete, because it was not possible to derive quantification functi-ons for all the ecosystem services. They will be improved in the future when new scientific insights emerge and better data become available.
Colophon
Flemish GovernmentEnvironment, Nature and Energy DepartmentEnvironmental, Nature and Energy Policy DivisionPolicy Design and Evaluation ServiceEnvironmental Economics Unit
Research team:Inge Liekens, VITO (Flemish Institute for Technological Research)Marije Schaafsma, IVM, VUAmsterdam (Free University of Amsterdam)Jan Staes, ECOBE, UAntwerpen (University of Antwerp)Roy Brouwer, IVM, VUAmsterdam (Free University of Amsterdam)Leo De Nocker, VITO (Flemish Institute for Technological Research)Patrick Meire, ECOBE, UAntwerpen (University of Antwerp)
Editing and design:Flemish government
Images:Environment, Nature and Energy Department,Stock.XCHNG
Responsible publisher:Jean-Pierre Heirman, Secretary-GeneralEnvironment, Nature and Energy DepartmentKoning-Albert II-Laan 20, box 81000 Brussels
Number: D/2010/3241/395
References
This summary is based on the following two publications. A complete list of the references can be found in these publications.
Liekens I., Schaafsma M., Staes J., De Nocker L., Brouwer R. en P. Meire (2009) Economische waarder-ingsstudie van ecosysteemdiensten voor MKBA. Studie in opdracht van LNE, Afdeling Milieu-, Natuur- en Energiebeleid, VITO, 2009/RMA/R308.
Liekens I., Schaafsma M., Staes J., De Nocker L., Brouwer R. en P. Meire (2010) Economische waardering van ecosysteemdiensten, een handleiding. Studie in opdracht van LNE, Afdeling Milieu-, Natuur- en Energiebe-leid, maart 2010.

Departement Leefmilieu, Natuur en EnergieKoning Albert II - laan 20 bus 8 - 1000 BrusselTelefoon: 02 553 80 11 - Fax: 02 553 80 05 - [email protected] - www.lne.be