economic feasibility analysis of the use of innovative
TRANSCRIPT

Economic feasibility analysis of the use of innovative alternative water sources in Cuba:
A case study
Carlos Alfredo Lanza Martinez
MSc Thesis UWS-SE 2017 Student Number 42355
July 2017


Economic feasibility analysis of the use of innovative alternative
water sources in Cuba: A case study
Master of Science
by
Carlos Alfredo Lanza Martinez
Supervisors Carlos Arturo Madera Parra, Eng., MSc., PhD Associate Professor, Universidad del
Valle, Cali, Colombia
Mentors Carlos M. Lopez Vazquez, PhD, MSc, Associate Professor of Sanitary Engineering,
UNESCO-IHE Institute for Water Education, Delft, The Netherlands
Orestes A. Gonzalez Diaz, PhD, MSc, Professor of Sanitary Engineering, Centro de
Investigaciones Hidraulicas de la CUJAE, La Havana, Cuba
Jhonny Harold Rojas Padilla, Eco.,MSc, Assistant Profesor, Instituto Cinara,
Universidad del Valle, Cali, Colombia
Examination committee
Fernando J. Diaz Lopez, PhD, MSc, Senior Advisor & Programme Manager Innovation
for Sustainable Development, TNO Caribbean, Netherlands Organisation for Applied
Scientific Research TNO, the Hague, Netherlands & Associate Professor Extra-ordinary
in Sustainablity Systems, Stellenbosch University, Matieland, South Africa
This research is done for the partial fulfilment of requirements for the Master of Science degree at the
UNESCO-IHE Institute for Water Education, Delft, the Netherlands
Delft
July 2017


Although the author and UNESCO-IHE Institute for Water Education have made every effort
to ensure that the information in this thesis was correct at press time, the author and UNESCO-
IHE do not assume and hereby disclaim any liability to any party for any loss, damage, or
disruption caused by errors or omissions, whether such errors or omissions result from
negligence, accident, or any other cause.
© Carlos Alfredo Lanza Martinez, 2017.
This work is licensed under a Creative Commons Attribution-NonCommercial 4.0 International License.

i
Abstract
Water scarcity is a worldwide issue mainly caused by climate change and rapid growth with
increased urbanization. Nowadays, many countries, even traditional countries considered as
water ample are suffering of water scarcity. The direct use of seawater for toilet flushing and
the wastewater reuse are are not only economically competitive under specific conditions
(Cuban conditions). But, also has many environmental and social benefits such as: reducing the
problematic of water shortage by providing a source of water and improving the water quality
discharged into surface and groundwater.
The first case assessed was conducted towards the Cuban population with domestic water
consumptions from 145 LPPD up to 175 LPPD. Comparing the introduction of the use of
seawater for toilet flushing to when only freshwater is used to supply the population, several
scenarios were evaluated. When water scarcity occurs from 1 to 9 months, being this last one,
the most critical reported in Cuba. The Net Present Values (NPV) and the performance indicator
(Cost of water in US$/m3) of the different alternatives and scenarios showed interestingly
results that must be considered such as economic, social and environmental benefits.
When only freshwater is used to supply the population, the cost is US$ 0.37/m3 water supplied.
But, when water scarcity occur, this cost can rise up to US$ 0.80/m3 for 9 months of water
shortage. This happens because there is a need to purchase water to water trucks at an extremely
high cost of US$ 1.74/m3. The Dual water supply system shows cost of water supplied from
US$ 0.36/m3 for systems from 50 to 1000 persons and US$ 0.32/m3 for 15,000 persons.
Interestingly, this cost remains the same when evaluated from 1 to 3 months of water shortage.
This occurs, because there is enough freshwater saved by the use of seawater for toilet flushing
to cover this water shortage period and consequently there is no need to purchase water from
water trucks.
For the touristic market, the economy of scale has also affected in the results. A small hotel of
capacity for around 54 persons, with a water consumption around 950 LPPD, shows a cost for
the alternative of the use of seawater for toilet flushing of US$ 0.49/m3. For this condition, the
amount of saved freshwater allows a water shortage coverage period of 45 days remaining with
the same cost of water. When water scarcity extends, this cost can rise up to US$ 0.70/m3 for 9
months of water shortage. Regarding the reuse of wastewater, a conventional WWTP with a
capacity of 4500m3/day was evaluated by upgrading the plant with an MBR system. Membrane
replacement every 12 years was considered, as the water that is being treated is not industrial
wastewater. The cost of the treated water is of US$ 0.23/ m3.
The use of seawater for toilet flushing in a touristic hotel with capacity of 500 persons allows
to save enough freshwater to supply 103 people. The implementation of RO desalination water
plant produces the equivalent volume of water that can be used to supply 3,172 persons by not
consuming freshwater. In this same hotel, a WWTP with capacity of 380 m3/day was assessed
producing 138,700 m3/ year of treated wastewater ready for reuse. If this water is used for
irrigation, the amount of saved freshwater is sufficient to supply 2,620 persons. Assessing the
potential combination of the innovative alternatives water sources in a hotel with capacity of
500 persons, a total of 5,895 locals can be benefited with the saved freshwater.

ii
iii
Acknowledgements
I want to start thanking God for being my protector in every single moment in my life and
especially during this 2 year of MSc period. Without your presence nothing of this could be
possible. Thank you God again.
I appreciate the Bill and Melinda Gates foundation who granted me a scholarship covering half
of my studies to pursue my career as a Sanitary and Environmental Engineer in one of the most
prestigious, Institute for water Education UNESCO-IHE Delft, The Netherlands and
Universidad Del Valle (UNIVALLE), one of Colombia’s renowned universities.
To my daughters: Cristina, Adriana, Sophia and Mia Lanza, who gave me the strength at all
times to achieve the goal.
I am very thankful to my grandmother, Olga Wong, who has been there in every single phase
of my education, without your support this could not be possible. To my parents, Carlos R.
Lanza and Olga C. Martinez, who were every single day taking care of me from far away.
To my siblings Suyen, Olga, Carlos J. Lanza and my cousin Fernando Cruz, who were there in
my lonely moments, behind the computer, giving me all the support through video-calls. In the
same way to all my big family.
Special thanks to my Research team: Dr. Carlos Lopez Vazquez, since the beginning, the ones
working under your mentoring, we were clear that we had the best mentor. Thanks for all the
advices and guidance along the research. To Dr. Carlos Madera who gave me support all time,
not only during the research but through all the period of study. Dr. Orestes Gonzales for all the
guidance during my field work in Cuba and Professor Johnny H. Rojas for the guidance during
my office work in Colombia.
I would like to end thanking my new friends in the water sector, Hydrodynamics, Water and
governance, Hydrology, Coastal, and Flood Risk Management. New people who I met enjoying
good moments and also the tough times UNESCO-IHE and UNIVALLE gives, but special
thanks to the Sanitary Engineering class of 2015-2017. This new water network among different
cultures was seeded and with new careers better opportunities should come for all of us.
Expecting to see each other at some other time I wish you all good luck.

iv

v
Table of Contents
1. Introduction 1 1.1 Background 2 1.2 Problem Statement 4
2. Literature Review 5 2.1 Water availability 5
2.1.1. Freshwater 5 2.1.2. Saline water (brackish or seawater) 6
2.2 Water consumption 7 2.2.1 Agricultural use 9
2.2.2 Industrial use 9 2.2.3 Domestic use 9
2.2.4 Water consumption in Cuba 10 2.3 Water supply systems and technologies 11
2.3.1 Water supply 11 2.3.2 Conventional water treatments processes 12 2.3.3 Advanced water treatments 12
2.3.4 Alternative sources (Seawater for toilet flushing) 14 2.4 Wastewater treatment and technologies 17
2.4.1 Conventional wastewater treatment 17 2.4.2 Advanced wastewater treatment 17
2.4.2.1 Membrane Bioreactor 17 2.4.2.2 SANI Process 19
2.4.3 Wastewater reuse systems 20 2.5 Social and economic evaluation of projects 21
2.5.1 Principles 21
2.5.2 Project evaluation tools 23 2.5.2.1 The net present value methods 23
2.5.2.2 The internal rate of return 24 2.5.2.3 Return on investment 25 2.5.2.4 Benefit/Cost ratio 25
2.5.2.5 Payback period method 26
2.5.2.6 Other methods 27 2.5.3 Summary of project evaluation techniques 27 2.5.4 Case studies 28
2.5.4.1 Case 1. Comparison of engineering costs of raw freshwater, reclaimed
water and seawater for toilet flushing in Hong Kong. (Tang, Yue and
Li, 2007) 28 2.5.4.2 Case 2. Cost-benefit analysis in the Yarqon Recycling Project case
study in Israel. (Garcia and Pargament, 2015) 29
vi
3. Research Questions 32 3.1 General Question 32 3.2 Specific research questions 32
4. Research Approach 33
5. Research Objectives 35 6.1 General Objective 35 6.2 Specific Objectives 35
6. Methodology 36 7.1 Phase 1. Data Collection 36
6.1.1. Primary Data 36 6.1.2. Secondary Data 37 6.1.3. Determination of CAPEX and OPEX 37
7.2 Phase 2. Economic analysis 41
7.3 Phase 3. Scenario analysis 42
7.3.1 Case study of the replacement by seawater for toilet flushing in a
Cuban community 42 7.3.2 Case study of the touristic resort Villa Playa Hermosa in Guanabo 43
7.3.3 Case study of Punta de Hicacos, in La Peninsula de Varadero 45 7.4.4 Case study of Hotel Breezes Jibacoa: 47
7.5 Performance indicator 49
7. Results and Discussions 50 7.1 Cuban Economy 50
7.2 Economic and Scenario analysis 51 7.2.1 Case-study: domestic use of seawater for toilet flushing in Cuban
urban environments 51 7.2.2 Case-study of the touristic resort Villa Playa Hermosa: use of seawater
for toilet flushing in the tourism sector in Cuba 74 7.2.3 Case-study: wastewater reuse in Punta de Hicacos at La Peninsula de
Varadero 76 7.2.4 Case study at Hotel Breezes Jibacoa 79
8. Conclusions 84
9. Reference
10. Appendix 87 A. Case-study: domestic use of seawater for toilet flushing in Cuban urban
environments 91 B. Case-study of the touristic resort Villa Playa Hermosa: use of seawater for toilet
flushing in the tourism sector in Cuba 98 C. Case-study: wastewater reuse in Punta de Hicacos at La Peninsula de Varadero 99 D. Case study at the Hotel Breezes Jibacoa 100

vii
List of Figures Figure 1 Domestic water consumption by activity according to WHO (HIDROCAPITAL, 2003). ......................... 7 Figure 2 Percentages of water consumption in The United States (EPA, 2005). ............................................... 8 Figure 3 Water distribution by households in the U.S (EPA, 2005).................................................................... 8 Figure 4 A typical sea water supply system (Water-Supplies-Department, 2016) ........................................... 14 Figure 5 Conceptual diagram of the TWS system (Leung, Li, Yu, Chui, Lee, van Loosdrecht and Chen, 2012) . 16 Figure 6 MBR process configuration ............................................................................................................... 18 Figure 7 The SANI process concept (Tsang, Wang, Lu, Li, Chen and van Loosdrecht, 2009) ............................. 20 Figure 8 Research approach of the study ........................................................................................................ 34 Figure 9 Example of the data provided by PRESWIN 8.1. The table displays the costs of materials and hand
labour of the replacement of the sanitary equipment ............................................................................ 40 Figure 10 Description of the sanitary parts of a toilet that are replaced twice a year due to the use of
seawater for toilet flushing .................................................................................................................... 40 Figure 11 Monthly Salary of employees in the water sector (According to Water utility services) ................. 41 Figure 12 Estimated fresh water consumption in Cuba as a function of number or people served and local
standards. .............................................................................................................................................. 42 Figure 13 Location of Hotel Villa Playa Hermosa(Google-EarthPRO, 2016) ..................................................... 44 Figure 14 Location of Pensinsula Hicacos mostly known as pensinsula de Varadero (Google-EarthPRO, 2016)
............................................................................................................................................................... 45 Figure 15 Location of wastewater treatment plant Hicacos (Google-EarthPRO, 2016) ................................... 46 Figure 16 Location of Hotel Breezes Jibacoa (Google-EarthPRO, 2016) ........................................................... 47 Figure 17 Location of wastewater treatment plant of Hotel Breezes Jibacoa (Google-EarthPRO, 2016) ......... 48 Figure 18 Water consumption for 50 persons in m3/year assessed for the different scenarios ....................... 53 Figure 19 Percentage of water consumptions for the different scenarios ...................................................... 54 Figure 20 Percentage of fresh water saved by the use of seawater for toilet flushing ................................... 55 Figure 21 Percentage of persons that can be served with freshwater waved by the use of seawater for toilet
flushing .................................................................................................................................................. 55 Figure 22 Net Present Value (NPV) of Capital Expenditures (CAPEX) and Operation and Maintenance
Expenditures (OPEX) for a period of 20 years for the different scenarios and alternatives. .................... 57 Figure 23 Cost of water in US$/m3 of water for the different scenarios and alternatives .............................. 58 Figure 24 Number of persons that can be served with freshwater saved by the use of seawater for toilet
flushing .................................................................................................................................................. 60 Figure 25 Number of houses that can be served with freshwater saved by the use of seawater for toilet
flushing .................................................................................................................................................. 60 Figure 26 Water consumption for 5000 persons in m3/year assessed for the different scenarios .................. 62 Figure 27 Percentage of water consumptions for the different scenarios ...................................................... 63 Figure 28 Percentage of persons that can be served with freshwater waved by the use of seawater for toilet
flushing .................................................................................................................................................. 64 Figure 29 Number of houses that can be served with freshwater saved by the use of seawater for toilet
flushing .................................................................................................................................................. 64 Figure 30 Net Present Value (NPV) of Capital Expenditures (CAPEX) and Operation and Maintenance
Expenditures (OPEX) for a period of 20 years for the different scenarios and alternatives. .................... 66 Figure 31 Cost of water in US$/m3 of water for the different scenarios and alternatives ............................... 67 Figure 32 Fresh water saved by the use of seawater for toilet flushing for the scenarios of 50 up to 15,000
persons .................................................................................................................................................. 69 Figure 33 Cost of water in US$/m3 for the scenarios from 50 up to 15,000 persons ....................................... 70 Figure 34 Costs saved in US$/m3 when applying a dual water supply system................................................. 72 Figure 35 Percentage of the costs from saved freshwater due to the use of seawater for toilet flushing ...... 73 Figure 36 Water consumption of Hotel Guanabo for the different scenarios ................................................. 75

viii
Figure 37 NPV for a period of 20 years for the different scenarios and alternatives for the Hotel Villa Playa
Hermosa. ................................................................................................................................................ 75 Figure 38 Cost of water in US$/m3 of water for the different scenarios and alternatives for the Hotel Villa
Playa Hermosa. ...................................................................................................................................... 76 Figure 39 NPV for a period of 20 years for the different scenarios for the WWTP Hicacos in the Peninsula of
Varadero ................................................................................................................................................ 78 Figure 40 Cost of water in US$/m3 of treated water for the different scenarios for the different scenarios and
alternatives for the WWTP Hicacos in the Peninsula of Varadero .......................................................... 78 Figure 41 Water consumption of Hotel Breezes Jibacoa for the different scenarios (Scenario 1 to 3) ............. 80 Figure 42 NPV for a period of 20 years for the different scenarios and alternatives for the Hotel Breezes
Jibacoa ................................................................................................................................................... 81 Figure 43 Cost of water in US$/m3 of water for the different scenarios and alternatives for the Hotel Breezes
Jibacoa ................................................................................................................................................... 82 Figure 44 NPV for a period of 20 years for the different scenarios (Scenario 4 to 7) for the WWTP of Hotel
Breezes Jibacoa ...................................................................................................................................... 82 Figure 45 Cost of water in US$/m3 of treated water for the different scenarios for the different scenarios and
alternatives for the WWTP of Hotel Breezes Jibacoa .............................................................................. 83

ix
List of Tables Table 1 Annual freshwater use per regions (United Nations Environment, 2003) ............................................. 9 Table 2 Water consumption of freshwater in Cuba (NC-53:91, 1983). ............................................................ 10 Table 3 Water consumption for Hotels according to Torres-Rodriguez (2015). ............................................... 11 Table 4 WQO'S proposed by the WSD in Hong Kong (Water-Supplies-Department, 1992) ............................. 15 Table 5 Economic evaluation factors (Remer and Nieto, 1995) ....................................................................... 22 Table 6 Project evaluation techniques (Remer and Nieto, 1995) .................................................................... 23 Table 7 Acceptance criteria for the benefit/cost ratio method ....................................................................... 26 Table 8 Summary of project evaluation techniques characteristics (Remer and Nieto, 1995) ......................... 27 Table 9 Example of the CAPEX for the case study of the Cuban population where water is supplied to 50
persons .................................................................................................................................................. 38 Table 10 Example of the OPEX for the case-study of the Cuban population where water is supplied to 50
persons .................................................................................................................................................. 39 Table 11 Water prices according to the regulation of Cuba: (NORMA: Resolucion 287/2015) ........................ 51

x

xi
Abbreviations
AW: Annual worth
AYI: Average yearly interest
AYP: Average yearly profit
B/C: Benefit Cost ratio
CAPEX: Capital Expenditures
CAS: Conventional Activated Sludge
CBA: Cost Benefit Analysis
CUC: Cuban Convertible peso (one of the two official currencies in Cuba)
CWR: Clear Water Reservoir
D.C: Data Collection
EPA: Environmental Protection Agency
FAO: Food and Agriculture Organization
FW: Future worth
HKIA: Hong Kong International Airport
HKUST: Hong Kong University of Science and Technology
I: Interest
iMBR: Immersed Membrane Bioreactor
IRR: Internal Rate of Return
L: Litre
LPCPD: Litre per capita per day
MARR: Minimum attractive rate of return
MBR: Membrane Bioreactor
MED: Multiple effect distillation
MF: Microfiltration
MLSS: Mixed liquor suspended solids
MSF: Multi-stage flash
NPV: Net Present Value
xii
OPEX: Operational Expenditures
PAHO: Pan American Health Organization
PP: Payback period
PW: Present worth
RO: Reverse Osmosis
SANI: Sulphate reduction, Autotrophic denitrification and Nitrification Integrated process
sMBR: Side stream Membrane Bioreactor
SRB: Sulphate reducing bacteria
TVM: Time value money
TWS: Triple water supply
UF: Ultra filtration
UN: United Nations
USGS: The United States Geological Survey
UV disinfection: Ultraviolet disinfection
WFP: World Food Program
WSD: Water Supply Department in Hong Kong
WHO: World Health Organization
WQO’s: Water Quality Objectives
WTP: Water treatment plant
WWTP: Wastewater treatment plant

Introduction 1
CHAPTER 1
Introduction
Water scarcity is a worldwide issue mainly caused by climate change and rapid population
growth with increased-urbanisation. Temperature increase is a factor affecting the water cycle
raising the evaporation rate resulting in high water losses. Precipitation is the source of almost
all fresh water and uneven precipitations are resulting in flooding and drought which is
increasing the vulnerability of water resources. All this together results into different concepts
that are involved into water scarcity as water stress and water crisis.
Water scarcity is also being affected by human activities particularly in areas with high
population density, tourist inflow, intensive agriculture and water demanding industries. Today
many large urban areas, even in regions that were traditionally considered as water ample
(Japan, Europe), suffer from water scarcity. This implies the need for the development of
additional sources (Friedler and Hadari, 2006).
Seawater is an alternative source of water and is available in abundance as 96.5% of the total
available water in earth is in oceans (USGS, 2016). Seawater desalination is an advanced
technology that has been introduced successfully during the last decades to augment the water
supply in arid regions. Due to the high costs many countries are unable to afford the seawater
desalination technology. Nevertheless, the adoption of this technology by some countries has
demonstrated that seawater desalination offers a new water resource free from variations in
rainfall (Khawaji, et al., 2008). The direct use of seawater for toilet flushing can reduce the
highly treated seawater demand because does not require a strict treatment as for drinking water
and can be a potential solution to reduce the freshwater demand. One example of this alternative
is the dual water supply system that Hong Kong has been using since 1950’s (Lee and Yu,
1997).
Wastewater reuse is another alternative that has been recognized as an encouraging solution to
cope with the problem of water scarcity around the globe (Garcia and Pargament, 2015).
Reclaimed wastewater may also be used to restore the natural water bodies maintaining the
water quality to be environmentally friendly. Agricultural, fish farms, and park irrigations are
just some examples of the possible uses which can decrease the fresh water demand. Depending
on the type of reuse, different level of treatments can be chosen to comply with the standards.
One example of this alternative is the case of Singapore which imports water from Malaysia
since 1961 and due to failed water negotiations for extension from 2011 to 2061 Singapore was
forced to initiate with the NEWater study which consisted in the Singapore Water Reclamation
Study in 1998 to determine if reclaimed water treated comply with potable standards and if was
a viable source of water (Chew, et al., 2011).

Introduction 2
1.1 Background
Cuba is comprised by the Island of Cuba, Isla de la Juventud and several minor archipelagos.
Located in the northern Caribbean where the Caribbean Sea, the Gulf of Mexico, and the
Atlantic Ocean encounter each other. Due to its geographical location, topography and insular
character, Cuba is particularly vulnerable to climate change effects where water scarcity is one
of the consequences of major concern. Water scarcity is being affected also because water
sources with quality and quantity are insufficient, the water supply system is outdated and the
inappropriate wastewater treatments limits its reuse (López-Vázquez, et al., 2013).
According to CIH-UNESCO-IHE (2010) Cuba has a limited capacity of water storage and the
drought periods due to low precipitation has made the island susceptible to saline intrusion
which has been an increasing problem due to the excessive use of groundwater.
With a population of about 11.4 million (World-Bank, 2016)and a coverage of drinking water
sector in the urban areas reaching 98.2 % and in the rural zone an 87.3% around 79 % of the
population is receiving an intermittent service (average of 12 hours per day). It does not comply
with the normal standards of human use and consumption (López-Vázquez, Brjanovic,
Hooijmans and González Díaz, 2013).
Water scarcity in Cuba is being affected by the lack of water sources with the quantity and
quality to satisfy the water demand for human consumption. The old established water supply
network has a high percentage of water losses (55%) and the lack of an appropriate wastewater
treatment that can allow a possible reuse results in the intermittent water supply in Cuba (López-
Vázquez, Brjanovic, Hooijmans and González Díaz, 2013). This is a clear example of water
stress affecting a country, distributing around 1,220 m3/ person-year which is lower than the
United Nations (UN) minimum desired level of 1,700 m3/person-year. When water drops below
1000 m3/person-year the population faces water scarcity (U.N, 2014)
Water supply in Cuba estimates a demand of 604 LPCPD (Litre per capita per day) and around
55% are water losses due to leakage in the water supply network. The wastewater collection in
Cuba is up to 98%, but only 19% receives some treatment being discharged in the water bodies
affecting the freshwater sources (López-Vázquez, Brjanovic, Hooijmans and González Díaz,
2013).
Tourism in Cuba is one of the main sources of revenue for the island. Because of the beaches,
colonial architecture and cultural history, Cuba receives around 3 million of tourist per year
(World-Bank, 2016). Water consumption is around 1000 litres per tourist per day (Romero
López, et al., 2015, Torres-Rodriguez, 2015). The reduction of water consumption by the above
alternatives can contribute to the reduction of fresh water demand in the tourism sector. This
can enable more fresh water to the population, reducing one of the water problems and
potentially also contributing to solve the problematic of an intermittent water supply service.
Another important activity in Cuba is agriculture, and has been being affected by water
shortages because of drought and uneven precipitation that occur on the island. Agriculture in
Cuba is based on rice production, being this, basic in Cuban daily diet, grains, sugar cane, citrus,
banana, potato, and corn (F.A.O, 2016). However, a 70 to 80% of its domestic food is imported
Introduction 3
because of low agricultural productivity (W.F.P, 2016). To increase the agricultural production
the alternatives mentioned above like wastewater reuse for irrigation can be helpful and thus
contribute to the reduction of freshwater demand and thus reducing water scarcity in the
country.
Several cases can be used to illustrate the water scarcity issues affecting Cuba.
For example, in La Havana the touristic resort Villa Playa Hermosa in the city of Guanabo and
because of the proximity to the sea is one of the main options for National tourists with capacity
to hold around 54 guests. The actual situation in this city is critical. The overexploitation of the
freshwater wells has led to their exhaustion and intrusion of saline water to the wells themselves
and to the whole water supply system. This affects the whole population of the City of Guanabo,
including the economic sectors. For instance, the touristic resort previously mentioned pays
around $300.00 CUC1 (Banco-Central-Cuba, 2016) for saline water and a daily water truck of
8 m3 for $16.00 CUC per day which makes a total of $780 CUC per month. The yearly costs
rise up to around $ 9360.00 CUC. (Villasante-Castañeda, 2013)
In Matanzas, the city of Varadero, in the peninsula of Hicacos, is a touristic zone with several
hotels and, for instance, the hotels located in the end of the Peninsula (Punta Hicacos) discharge
the wastewater to the wastewater treatment plant (WWTP) of Hicacos located in the same area.
The total discharge from each room is around 378 L which 26.46 L are being reused for
irrigation representing a 7% of the total discharge (Torres-Rodriguez, 2015). With an increasing
and booming tourist sector it becomes essential to explore the potential increase in the reuse of
treated wastewater to alleviate the upcoming water consumption needs. This is a potential
strategy that an economic sustainability analysis should support.
In Mayabeque, the Hotel Breezes Jibacoa located in the Arroyo Bermejo Beach has 250 rooms
with one bathroom in between, pool area, bars, restaurants, nightclubs and sports area. This
hotel has a Reverse Osmosis (RO) treatment plant of two stages. Due to aggressive conditions
only one is in operation for a 24 hours period. Has a flowrate of 240 m3/day desalinating 233
m3/day. The water demand of the hotel ranges between 360-410 m3/day meaning that the plant
is insufficient and the water supply has to be covered by water trucks (Romero López, Lafargue
Verdecia, González Díaz and Medina Correa, 2015). The company responsible supplying water
has water trucks of 18, 20 and 30 m3 and different prices according to different circumstances
between $8.00, $9.75, or $ 21.00 CUC/ m3.
With a water consumption of 972 L and taking into account that 30 to 40 L/day is for toilet
flushing (López-Vázquez, Brjanovic, Hooijmans and González Díaz, 2013), a considerable
study can be done to implement the alternative of the seawater use for this particular activity.
Lopez-Vazquez (2013) analyses a case for the coastal zones of Cuba. Concluding that if the use
of this alternative source of water is applied to the 20% of the population living along the coastal
zone (4’631,377), a daily saving of 27’788,262 L/day or 27,798 m3/day of fresh water will be
achieved. This will be equivalent to a yearly saving of 10’142,716 m3 of fresh water.
According to the Standards, the tourist facilities pay $1.55 CUC per m3 of fresh water and $0.20
CUC per m3 of brackish water (Villasante-Castañeda, 2013). 1 tourist uses 30 L/day for toilet
1 $1.00 CUC = USD$0.87

Introduction 4
flushing that will be equivalent to $0.05/day. If brackish water is used the price will be reduce
to $0.003/day. If 3 million of tourists per year visit the island, using freshwater for toilet
flushing will cost around $150,000.00 while the use of brackish water will be $18,000.00 having
a total saving of $132,000.00 per year. This can be a promising strategy but inherently
associated operation and maintenance costs need to be considered to fully assess their potential
cost-effectiveness.
1.2 Problem Statement
The lack of an economic study in the area is leaving behind the implementation of the different
promising alternatives to reduce the fresh water demand. Replacing freshwater by the direct use
of sea water for flushing toilets and reuse of wastewater for irrigation can reduce the problem
of water scarcity.
As mentioned in a previous section the proposed alternatives have been implemented in other
places in the world. In the case of the use of saline water as a second quality water for toilet
flushing, Hong Kong has operated a dual water supply since 1950’s. The seawater supply has
contributed to preserve almost 16% of the freshwater supply which otherwise would be
provided for flushing toilet if seawater was unavailable (Lee and Yu, 1997). A study was made
evaluating flushing water sources in which the use of seawater for toilet flushing has the lowest
engineering cost compared with the use of raw freshwater and reclaimed water, even though
import and export pipelines are built for delivering seawater into and out of the seawater supply
zone (Tang, et al., 2007). The most recent innovative application in the Hong Kong
International Airport (HKIA) to conserve valuable freshwater resources was the
implementation of the triple water supply (TWS) system. This system saves up to 52% of
freshwater (Leung, et al., 2012).
For the wastewater reuse alternative there are several examples where it has been implemented.
In arid areas of Middle East and North Africa, wastewater reuse is commonly reused for
irrigation. In areas densely populated like Japan and without reliable water sources the
implementation of reuse systems have been implemented (Asanao, et al., 1996). Singapore
having one of the most crucial problems of water supply was forced to implement strategic
alternatives including local catchment, importing water, desalination and recycling water.
Adopting these options they develop NEWater (recycled water) by innovation. This enabled
the nation to successfully substitute 30% of freshwater demand (Chew, Watanabe and Tou,
2011). A study was made to analyse Singapore’s successive endeavours toward technology-
driven water. It shows how emerging economies can build up indigenous capabilities with long-
term planning and appropriate and timely government stimulations efforts. This is particularly
applicable since the intellectual property regime in most emerging economies is not well
enforced (Chew, Watanabe and Tou, 2011).
To assess the economic sustainability of these promising technologies applied in other parts of
the world but not validated in other latitudes like Latin America and the Caribbean, an economic
feasibility analysis can indicate whether they are or not promising alternatives to other regions
prone to and suffering of water scarcity like Cuba. A thorough analysis can help in the decision
making process concerning potential alternative water sources to reduce the freshwater demand
and contribute to minimize the water scarcity in Cuba, and regions with similar conditions.

Literature Review 5
CHAPTER 2
Literature Review
2.1 Water availability
2.1.1. Freshwater
Freshwater is all water forms on earth’s surface as ice sheets, icecaps, glaciers, icebergs, ponds,
lakes, rivers and streams and underground as groundwater in aquifers and underground streams.
Characterized by having low concentrations of dissolved salts and other total dissolved solids.
This term is used to differentiate to saline water (brackish or seawater). Fresh water is not
potable water due to the presence of chemical or biological contaminants.
Fresh water is mostly precipitation from the atmosphere in form of mist, rain and snow. In
industrialized areas rain is typical acidic because of dissolved oxides of sulphur and nitrogen
formed from burning of fossil fuels in cars, trains, aircrafts and factories. In coastal areas
freshwater may contain significant concentrations of salts derived from the sea if windy
conditions have lifted drops of seawater into the rain-bearing clouds. In desert areas rain-
bearing winds can pick up sand and dust and this can be deposited elsewhere in precipitation
and causing the freshwater flow to be measurably contaminated both by insoluble and soluble
components of the solids.
The climate in Cuba is tropical and characterised by a humid, warm and wet environment. The
maximum monthly temperatures in January around 16.7 °C and for August 31°C with a yearly
mean temperature of 24.5°C (Hernandez and Mon, 1996). The rainfall for the island is generally
high around 133 cm per year. The maximum yearly rainfall occurs on the western side of the
island (175 to 200 cm per year) and the minimum occurs in Guantanamo Bay area (71 cm per
year) (Solo-Gabriele and Perez, 2008).
Garcia Fernandez (2006) describes 8 watersheds along the country with several problems of
pollution. Almendares-Vento watershed and Ariguanabo which are close together presents
contamination of industrial and domestic wastewater with poorly treatment or untreated. The
Cauto Watershed is the largest in Cuba presents problems of soil erosion and poor drainage,
and the degradation of soil through salt accumulation. Similar problems of erosions occur in
The Cuyaguateje River which is located in Pinar del Rio. The Guantanamo-Guaso watershed is
known for its drought conditions, with some areas receiving less than 100 cm of rainfall per
year. The Habanilla watershed located in a mountainous terrain which has a large hydroelectric
plant and a man-made reservoir with very good water quality.
For example in the city of La Havana there are many small water supplies located along the
periphery of the city. Of the 55 water supplies along Almendares-Vento watershed, 42 are

Literature Review 6
freshwater and 13 are brackish. The water supply Vento Aquifer supplies 47% of Havana’s
drinking water and is located below one of the primary rivers (Almendares River) with a length
of 50 km and a contributing watershed of 402 km2 from the southeast to the northwest (Artiles
Egües and Gutiérrez Díaz, 1997).
2.1.2. Saline water (brackish or seawater)
Saline water is water that contains a significant concentration of dissolved salts (mainly NaCl).
The United States Geological Survey (USGS) classifies saline water in three salinity categories.
Salt concentrations in slightly (1000 to 3000 ppm), moderately (3000 to 10,000 ppm), and high
saline water (10,000 to 35,000 ppm) (USGS, 2016).
Seawater has a salinity of roughly 35,000 ppm equivalent to 35 grams of salt per one litre of
water (USGS, 2016). Brackish water has more salt concentrations than freshwater but not as
much as seawater. It may result from mixing of seawater with freshwater as in estuaries or in
brackish fossil aquifers. Certain human activities can produce brackish water, in particular civil
engineering projects such as dikes and the flooding of coastal marshland to produce brackish
water pools for freshwater prawn farming.
The over abstraction of freshwater wells has led to their exhaustion and intrusion of saline water
to the wells themselves and to the whole water supply system (Torres-Rodriguez, 2015). Also,
the large amount of yearly rainfall over most of the island water resources in Cuba are
susceptible to salt water intrusion. Salt water intrusion occurs probably due to pronounced
temporal variability of rainfall which results in exceedingly wet conditions followed by
exceedingly dry conditions or due to the topographic features of the island which promotes the
rapid loss of rainfall runoff to the sea (Scarpaci and Coyula, 2002).
Rainwater runoff reaches the sea within at most few hours. The mean length of all major Cuban
rivers is 93 Km. The country’s longest and most voluminous river (Cauto River) has a length
of 370 km. Other rivers as Sagua La Grande and Zaza has only 170 km and due to this short
distances the rainfall reaches the sea in a rapid way. Thus, a limited amount is recharged into
underground freshwater aquifers (Diaz-Briquets and Perez-Lopez, 1993). Thereby making the
aquifers vulnerable to saltwater intrusion from the coast.
For example in the city of La Havana as mentioned before in the previous section, 13 water
supplies from 55 are brackish. Another example is in the Hotel Breezes Jibacoa located between
La Havana and Varadero that has a desalination water treatment plant. Actually using
groundwater from two wells and due to the intrusion of saline water the desalination process of
Reverse Osmosis is included for the production of drinking water (Solo-Gabriele and Perez,
2008).

Literature Review 7
2.2 Water consumption
Water consumption in the world is based on different activities being agriculture with a 70% of
all water consumption. Followed by the industry with a 20% and a 10% for domestic use.
Industrialized countries have an 80% of water consumption in industries being the rest in
agricultural and domestic use (UN, 2006).
Regarding the domestic use, a high percentage of water consumption is for toilet flushing,
followed by the shower, washing cloth, dishes and others. In the following figure the
percentages for water consumption by activity according to WHO are shown:
Figure 1 Domestic water consumption by activity according to WHO
(HIDROCAPITAL, 2003).
Water consumption in the United States plays a big role starting from the thermoelectrical
power plant business and industries. Firefighting, municipal parks, and public swimming pools
all need high volumes of water. In the following figure is shown the percentages of water
consumption in the US.
40
48
24
4
20
Water consumption by activity according to WHO
Toilet flushing house cleaning dish washing Washing Cloth faucet shower

Literature Review 8
Figure 2 Percentages of water consumption in The United States (EPA, 2005).
In the United States the access to safe treated water is easily obtained. The average American
family uses more than 300 gallons of water per day at home. Roughly 70% of this use is indoors
and the rest use is outdoors. U.S Freshwater withdrawal (2005) apart from domestic use comes
from commercial, industrial, agricultural, and electric water use. The following figure shows
the U.S Freshwater withdrawals.
Figure 3 Water distribution by households in the U.S (EPA, 2005).
41.5
37
2.6 5
8.55.4
U.S Freshwater withdrawals (2005)
Thermoelectric Power Irrigation Aquaculture
Industrial Domestic Other public supplied users
26.7
13.7
5.321.7
15.7
16.8
Water distribution by households in the U.S
Toilet Leaks other Clothes washer Faucet Shower

Literature Review 9
2.2.1 Agricultural use
In Latin America and the Caribbean, more than 70% of freshwater use is in agriculture. Only
Brazil, Colombia, Cuba, Venezuela, and the countries in Lesser Antilles are below the regional
average (United Nations Environment, 2003). Regional values are shown in Table 1.
2.2.2 Industrial use
After agriculture, industry is the second largest user of water. However, in Latin America and
the Caribbean there are not industrialized countries and the amount of water use for the industry
sector is between 1 and 11%.
2.2.3 Domestic use
The most important uses for water are at our homes. Domestic water use is water used for indoor
and outdoor households purposes. Drinking, preparation of food, bathing, washing clothes and
dishes, brushing teeth, toilet flushing, watering the yard and gardens. Domestic use of water in
Latin America and the Caribbean fluctuates between 17 and 25% in the region as shown in
Table 1.
Table 1 Annual freshwater use per regions (United Nations Environment, 2003)
Area
Total water
consumption Agricultural
consumption per
sector in %
Industrial
consumption
per sector in %
Domestic
consumption per
sector in % Km3
Latin America and
the Caribbean 262.8 73.5 8.7 17.8
Caribbean 15.9 74 1 25
Mesoamerica 90 77.9 5.4 16.7
South America 156.9 70.9 11.4 17.7

Literature Review 10
2.2.4 Water consumption in Cuba
In Table 2 the water consumption of freshwater in Cuba is obtained from the Cuban Standards
of freshwater consumption. The following figures are used for water supply design and are
considered as the water consumption of freshwater in Cuba.
Table 2 Water consumption of freshwater in Cuba (NC-53:91, 1983).
Thousands
of people
Domestic
Use
Commercial
Use
Public
Use
Industrial
Use
Own
System
Total
Consumption
L/person-day
<2 145 87 44 15 9 300
2 to 10 160 96 48 16 10 330
10 to 25 175 105 51 18 11 360
25 to 50 190 112 57 19 12 390
50 to 100 200 116 59 20 15 410
100 to 250 215 125 62 22 16 440
250 to 500 220 132 66 23 19 460
>500 225 135 68 23 19 470
Tourism in Cuba is one of the main sources of revenue for the island. Because of the beaches,
colonial architecture and cultural history, Cuba receives around 3 million of tourist per year
(World-Bank, 2016). In this area water consumption has a different use than urban areas.
Potable water in the Touristic resorts is used in several activities depending on the water quality
received, for example in rooms, kitchens, restaurants, cafeterias, laundries, central air
conditioning systems, kids club, sport clubs, night clubs, service rooms for employees, the daily
replacement of water for pools for maintenance purposes, and irrigation for green areas in the
case that no wastewater reuse is available.
According to the Cuban Standards, the estimated water consumption as a function of the type
of touristic resort, accommodation or service are shown in Table 3.

Literature Review 11
Table 3 Water consumption for Hotels according to Torres-Rodriguez (2015).
Activity Unit m3/ unit
Hotels 4* and 5* Room 0.65
Hotels 3* Room 0.51
Hotels 1* Room 0.28
Motels 3* Room 0.60-0.70
Motels 1* and 2* Room 0.50-0.60
Restaurants User 0.04
Cafeterias User 0.03-0.006
Cafeterias ( fast food) User 0.15-0.012
Bars User 0.01
This values does not include:
A daily replacement of water for pools around 1.5% of the volume and a total
replacement of water every 3 months for maintenance purposes (60 L per day per
room).
Laundry service around 0.052 m3/ kg of clothes.
Central air conditioning system around 0.130 m3/room.
2.3 Water supply systems and technologies
2.3.1 Water supply
Water supply is the provision of water for domestic, urban, industrial, or agricultural use of any
type, for which the uptake of this resource in nature and the corresponding treatment is needed
before the distribution to the population.

Literature Review 12
Water is obtained from the available sources as surface or groundwater nearby the area. The
uptake for water consumption depends on the source. If it is surface water the uptake can be by
canals or pumping stations. If the source is groundwater the uptake must be through wells and
pumping stations in addition to this considering the groundwater table and the type of aquifer.
These sources of water do not have the characteristics for direct human consumption and is in
need of a drinking water treatments.
Drinking water in Cuba is available up to 72% through pipes. Via public taps or water trucks
around 21% of the population is served. Suggesting that 93% of the population is served by an
improved drinking water source (PAHO, 2000) from which 98% is access in urban areas and
82% access in rural areas (Vazquez, et al., 2002). The remaining 7% of the overall populations
without improved water sources. The time of service is also variable, PAHO (2000) reports that
79% of the population has access to an intermittent water supply (average of 12 hours per day).
The water supply system is unstable because pumps are in need of repair and because of
frequent interruptions in the electrical supply need to run the pumps. The network is in need of
additional water storage capacity and would benefit from increasing the interconnectedness of
various sections of the distribution network. Also, metering is needed to document water usage
by users, for purposes of charging for the water supplied (Hernandez and Mon, 1996).
2.3.2 Conventional water treatments processes
The conventional treatments process varies from the water quality of the source and consists
mainly of bars, sand trap, coagulation and flocculation, filtration, disinfection, sludge treatment,
desalination and softening.
Water treatment in Cuba is typically focused on Chlorination for disinfection. Some evidence
suggest that the water is not reliably chlorinated partly due to the lack of chlorine e.g. Canada’s
International Development Research Centre (2002) indicates that Santiago de Cuba chlorine
plant was no longer operating. In an attempt to improve the quality of drinking water within
this region, slow sand filters were installed within the area. This was an alternative mean for
treating water but not for disinfection. Urban systems with disinfection are estimated to be
around 84%.
Alonso Hernandez and Mon (1996) also reported that chlorination equipment at the water
treatment plant would benefit from improved maintenance. Given pressure losses of water
within the system due to intermittent power supply and lack of back-up generators, water within
the distribution system is at risk from contamination due to infiltration of untreated water during
times of low pressure. As a result, many residents are self-treating their water by adding
chlorine-tablets or boiling.
2.3.3 Advanced water treatments
Advanced desalination technologies are needed because saline water is unsuitable for human
consumption due to the high salt contents. Saline water can be considered to be unlimited source
of water and with the help of this advanced technologies can be converted into freshwater.

Literature Review 13
A seawater desalination process separates the saline water into fresh water with low
concentrations of dissolved salts and a concentrated brine. To obtain this separation a variety
of technologies has been developed over the years and can be distillation, membrane separation,
freezing, electrodialysis but the most important technologies are based on Multi-stage flash
(MSF), multiple-effect distillation (MED) , and Reverse Osmosis (RO) which has emerged as
the most cost-effective technology (Khawaji, Kutubkhanah and Wie, 2008).
Reverse Osmosis (RO) is a process that overcomes the osmotic pressure by applying external
pressure higher than the osmotic pressure on the seawater. Thus, water flows in the reverse
direction of the natural flow across the membrane, leaving the dissolved salts behind with an
increase in salt concentration. The major energy required for desalting is for pressurizing the
seawater feed. A typical large seawater RO plant consists of feed water pre-treatment, high
pressure pumping, and membrane separation and permeate post-treatment.
Pre-treatment is needed to eliminate the undesirable constituents present in seawater, which
could cause membrane fouling. The typical pre-treatments include chlorination, coagulation,
acid addition, multi-media filtration, and dechlorinating. The pre-treatment will depend on the
feed water characteristics, membrane type and configuration, recovery ratio and product water
quality (Sheikh, 1997).
After any of these treatments water is ready for storage, distribution and transport to the users.
Water storage is essential to comply with the water demand and water consumption of the
population. The capacity of Storages has to consider any emergency to supply the community.
Water reservoirs are essential in the water network. Water treatment plants (WTP) works well
if there are dealing with lower flows. Being the reservoirs the ones to receive the impact of the
water demand and not the WTP. The water network initially begins with the clean water
reservoir (CWR), pumping stations, main pipes, secondary and tertiary lines (Khawaji,
Kutubkhanah and Wie, 2008).
This technology has been introduced successfully during the last several decades to augment
the water supplies in arid regions of the world (Khawaji, Kutubkhanah and Wie, 2008). Due to
high costs, many countries are unable to afford these technologies as a freshwater source. RO
is a process using high amount of energy estimated around 3.5 to 5 kWh/m3 (López-Vázquez,
Brjanovic, Hooijmans and González Díaz, 2013) but recent research have been done to reduce
this energy consumption and operational costs showing values around 0.38 to 1.30 euro/m3
when is seawater and 0.21 to 0.43 euro/m3 when is brackish water (Karagiannis and Soldatos,
2008). Despite the reduction of costs, RO and other desalination processes remains expensive
and inefficient if comparable with the conventional treatments for drinkable water using surface
water as a source which have been estimated in 0.18 euro/m3(Costa and De Pinho, 2006).
In recent studies, the total cost of a project (CAPEX+OPEX), a seawater RO plant producing
100,000 m3/day is of 266 million USD. The average relative engineering procurement and
construction cost is of USD 1,207 per m3/day. This cost includes a 25.0% of equipment and
material, a 5.5% of membranes, a 1.5% in pressure vessels, 7.3% in pumps, a 2% in energy
recovery, 12.5% of piping and high grade alloy metals and a 69.5% of construction cost
(Linares, 2016).

Literature Review 14
2.3.4 Alternative sources (Seawater for toilet flushing)
Hong Kong is one of the most severe water-scarce areas in the world. Due to extremely high
population density the annual per capita renewable water supply is limited to only 125 m3. This
number is far below the scarcity level of 1000 m3 (World-Bank, 2007). To alleviate this problem
since the 1950’s Hong Kong has applied a dual water supply system which provides fresh water
for potable uses and seawater for toilet flushing.
The dual water supply system requires a separate network. One of them is for potable freshwater
supply and the other is for seawater for toilet flushing. The last one consists of pumping stations,
distribution mains and service reservoirs. Seawater is extracted and treated at the seafront
pumping stations and then supplied to the consumers via the water trunk and the distribution
mains (Lee and Yu, 1997).
Seawater for toilet flushing does not require treatment to the same standard as potable
freshwater, but its standard has to comply with the guidelines laid down by the authorities to
prevent objectionable characteristics. The current treatment is relatively simple and easy.
Seawater is screened by strainers to remove sizeable particles, and then disinfected by
chlorination before being pumped to service reservoirs and for distribution to consumers(Tang,
Yue and Li, 2007).
Figure 4 A typical sea water supply system (Water-Supplies-Department, 2016)
Literature Review 15
In Hong Kong, an electro chlorinator technique has been widely applied for the disinfection of
such flushing water instead of conventional chlorination process, because seawater contains
large amounts of sodium chloride. In some cases, after screening, aeration may be applied in
the intake culvert at the pumping station if the seawater is found to be low in dissolved oxygen.
The purpose of aeration is to refresh the water with sufficient oxygen to avoid anaerobic
conditions that may give rise to bad odours (Tang, Yue and Li, 2007).
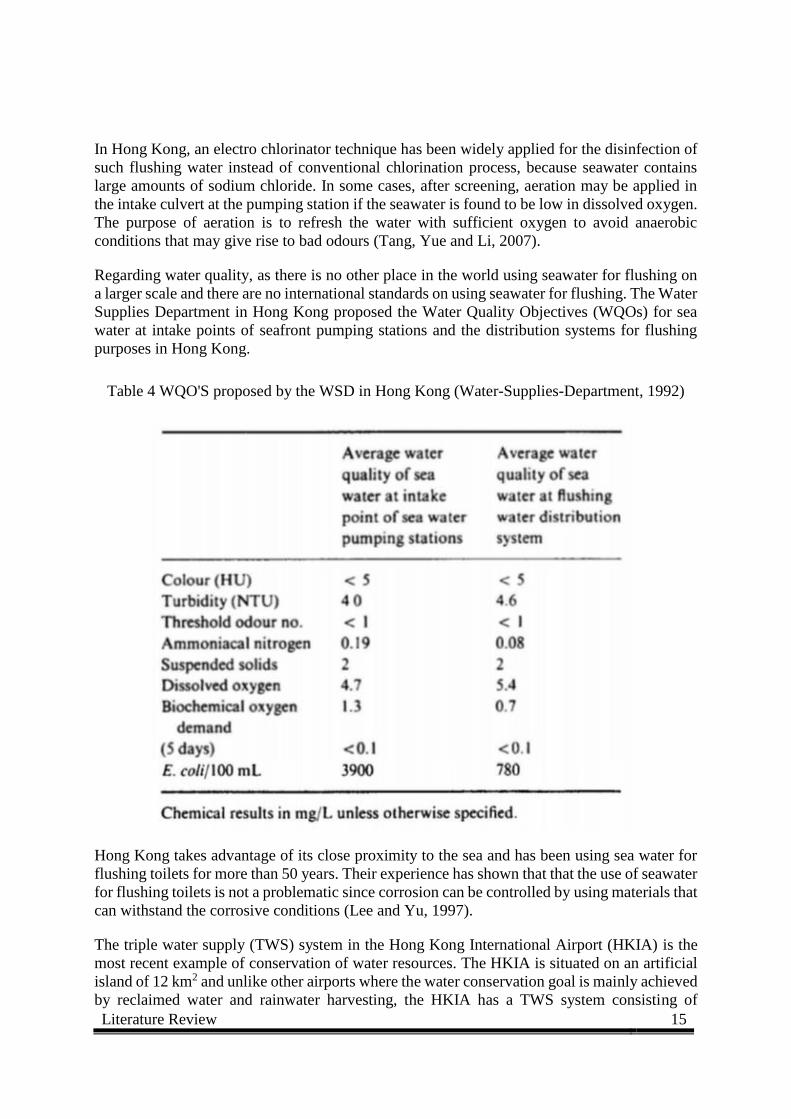
Regarding water quality, as there is no other place in the world using seawater for flushing on
a larger scale and there are no international standards on using seawater for flushing. The Water
Supplies Department in Hong Kong proposed the Water Quality Objectives (WQOs) for sea
water at intake points of seafront pumping stations and the distribution systems for flushing
purposes in Hong Kong.
Table 4 WQO'S proposed by the WSD in Hong Kong (Water-Supplies-Department, 1992)
Hong Kong takes advantage of its close proximity to the sea and has been using sea water for
flushing toilets for more than 50 years. Their experience has shown that that the use of seawater
for flushing toilets is not a problematic since corrosion can be controlled by using materials that
can withstand the corrosive conditions (Lee and Yu, 1997).
The triple water supply (TWS) system in the Hong Kong International Airport (HKIA) is the
most recent example of conservation of water resources. The HKIA is situated on an artificial
island of 12 km2 and unlike other airports where the water conservation goal is mainly achieved
by reclaimed water and rainwater harvesting, the HKIA has a TWS system consisting of

Literature Review 16
freshwater supply system, seawater supply system for toilet flushing and air conditioning
system and a reclaimed greywater irrigation system (BAC, 2009, CA, 2009).
About 9000 m3/day of freshwater is used for catering services, water sinks, aircraft washing
and firefighting services in HKIA. To conserve the valuable freshwater resource, a grey and
black water separation system is provided for the terminal building, airport catering and
washing area while the rest is served by a combined system.
This system not only minimizes the risk of cross-connection between freshwater and seawater
supply as seawater can be easily detected through its taste, but also saves a significant amount
of energy and greenhouse gas emissions as compared to a water supply system supplying solely
potable freshwater. The application of this TWS system has been applied in the Hong Kong
International Airport with up to 52% of freshwater saved (Leung, Li, Yu, Chui, Lee, van
Loosdrecht and Chen, 2012).
Figure 5 Conceptual diagram of the TWS system
(Leung, Li, Yu, Chui, Lee, van Loosdrecht and Chen, 2012)
Literature Review 17
2.4 Wastewater treatment and technologies
Wastewater is any water that has been affected in quality by any human activity. Wastewater
can be originated by a combination of domestic, industrial, commercial or agricultural use,
storm water and from sewer infiltration. Municipal wastewater is usually conveyed in a sanitary
sewer and treated in a wastewater treatment plant (WWTP). Wastewaters generated in areas
without access sewer systems rely on on-site sanitation systems as septic tanks, pit latrines and
the worst case which is open defecation.
2.4.1 Conventional wastewater treatment
Conventional wastewater treatment consists of a combination of physical, chemical or
biological process and operations to remove solids, organic matter and sometimes nutrients
from wastewater. In general different degrees of treatment can be considered from a
preliminary, primary, secondary and tertiary or advanced wastewater treatments, and
sometimes some level of pathogen removal. Disinfection to kill pathogen organisms is needed
and is followed as a last treatment step. The sewage sludge that is produced in sewage treatment
plants undergoes sludge treatment.
In the preliminary treatment the removal of coarse solids and other large materials often found
in raw water occurs. A preliminary treatment typically is composed of coarse screens, grit
removal, flow measurements devices, often standing wave flumes are always included at this
preliminary treatment.
The primary treatment is basically the removal of settleable organic and inorganic solids by
sedimentation, and the removal of materials that will float by skimming. The secondary
treatment is the further treatment of the effluent from the primary treatment to remove the
residual organics and suspended solids. In most cases, secondary treatment follows the primary
treatment and involves the removal of biodegradable dissolved and colloidal organic matter
using aerobic biological treatment process.
One common example of the secondary treatment is the activated sludge. The dispersed-growth
reactor is an aeration tank or basin containing a suspension of the wastewater and
microorganisms known as the mixed liquor. The contents of the aeration tank are mixed by
aeration devices which also supply oxygen to the biological suspension. Following this aeration
step the microorganisms are separated from the liquid by sedimentation and the clarified liquid
is secondary effluent. A portion of the biological sludge is recycled to the aeration basin to
maintain a high mixed-liquor suspended solids (MLSS) level.
2.4.2 Advanced wastewater treatment
2.4.2.1 Membrane Bioreactor
Membrane bioreactor (MBR) specifically are a combination of bio treatment with membrane
separation by microfiltration (MF) or ultrafiltration (UF). Compared with conventional

Literature Review 18
activated sludge process (CAS), MBR ensures higher effluent quality for wastewater
reclamation and reuse. MBR’s have been widely used in wastewater treatment and reclamation.
The advantages offered by the process over conventional bio treatment process are widely
recognised (Henze, et al., 2008).
The configuration can refer to both the MBR process (and specifically how the membrane is
integrated with the bioreactor) or the membrane module. There are two main configurations:
submerged or immersed (iMBR), and side stream (sMBR). iMBR’s are generally less energy-
intensive than sMBR’s, since employing membrane modules in a pumped side stream crossflow
to scour the membrane incurs an energy penalty due to high pressures and volumetric flows
imposed.
Figure 6 MBR process configuration
This advanced technology has gained increasing popularity in municipality/domestic and
industrial wastewater treatment, in particular in the places where the footprint is limited and a
high product water quality is demanded (Judd, 2008). To date, there have been at least 50
individual MBR membrane suppliers and hundreds of large-scale MBR plants (with treatment
capacity larger than 10.000 m3/day) in operation worldwide (Wang, et al., 2008). In addition to
this, MBR systems are expected to continuously increase in capacity and broaden in application
areas due to more stringent regulations and water reuse initiatives.
The costs for complete MBR facilities have also been declining. For example, in 2001, the total
price of water for unrestricted urban irrigation produced by a 3800-m3/day MBR was $0.80/m3.
By 2004 the same facility declined to $0.48-$0.58/m3 (Daigger, et al., 2005). Despite of its
alleged benefits of better treatment performance and occupation of much less land, broader
application of MBR’s is still hindered by their relatively high construction cost and energy
consumption. Choosing between MBR and CAS for wastewater treatment remains unsettled,
Literature Review 19
even some researchers and engineers now reconsider whether MBR has been the best choice
for various engineering cases (Lesjean, et al., 2011).
Larger municipalities often include factories discharging industrial wastewater into the
municipal sewer system. If the final disposal requires higher quality than that given by the
secondary treatment, a polishing method must be used as a tertiary treatment. Nowadays
industrialised countries are applying most common technologies as microfiltration or synthetic
membranes. After membrane filtration, the treated has an excellent quality (Hammer, 2001).
2.4.2.2 SANI Process
Since the introduction of the Biological Nitrogen Removal (BNR) process in 1960’s (Ludzack
and Ettinger, 1962), the key biological process in municipal sewage treatment works has been
relying on the electron flow from organic carbon and nitrogen cycle, namely autotrophic
nitrification and heterotrophic denitrification. Depending on the sludge age, about 50-60% of
the organic carbon in the sewage will be converted to CO2 and the remaining to sewage sludge.
The innovative advanced technology developed by a research team from Honk Kong University
of Science and Technology (HKUST) called SANI Process which stands for Sulphate
reduction, Autotrophic denitrification and Nitrification Integrated process is an energy efficient
and low carbon sewage treatment technology that uses Sulphate in seawater as an oxidizer to
eliminate pollutants. It has shown remarkable results for saline wastewater treatment (Figure 7)
(Tsang, et al., 2009).
In the first stage of the SANI process, organic matter is removed anaerobically by sulphate
reducing bacteria (SRB) which grow on the sulphate concentrations (up to 600 mg/L)
outcompeting the methanogenic bacteria and producing sulphide (Lu, et al., 2009). In the
second stage autotrophic denitrifying organisms use the sulphide present in the water phase as
electron donor and the nitrate recirculated from the aerobic phase (third stage) as final electron
acceptor for denitrification purposes. Thus, sulphide is oxidized to sulphate during
denitrification ensuring full sulphur recovery and negligible hydrogen sulphide losses to the
environment (Lu, Wang, Li, Chen, van Loosdrecht and Ekama, 2009). Furthermore, CO2
production has been observed to be also negligible as most of the influent COD is converted to
alkalinity (Lu, Wang, Li, Chen, van Loosdrecht and Ekama, 2009). Finally in the third stage,
ammonia is aerobically oxidized to nitrate by nitrifying bacteria and recirculated to the anoxic
phase to drive the autotrophic denitrification and accomplish nitrogen removal (Tsang, Wang,
Lu, Li, Chen and van Loosdrecht, 2009).
Since all microorganisms involved in the SANI process are slow-growing bacteria, zero sludge
discharge has been observed (Lu, Wang, Li, Chen, van Loosdrecht and Ekama, 2009), which
makes it also very attractive in view of the major environmental concerns and high costs
associated to sludge handling and disposal (Øegaard, 2004).

Literature Review 20
Figure 7 The SANI process concept (Tsang, Wang, Lu, Li, Chen and van Loosdrecht, 2009)
2.4.3 Wastewater reuse systems
Wastewater can be reused after treatment or barely treated for a variety of beneficial purposes.
The direct wastewater reuse system consists of directly using the reclaimed effluents for urban
or agricultural purposes. (Bouwer, 2000) Untreated or barely treated wastewater may also be
reused for irrigation of crops following some technical guidelines to reduce health and
environmental risks. (WHO, 2006). The most relevant benefit of the direct wastewater reuse is
making a new water supply source available. This new source guarantees a high level of supply
reliability because its production is constants through the year and in between years (Friedler,
2001) which will bring benefits to users that suffer water shortages (Mesa-Jurado, 2012).
Reclaimed wastewater may be used to restore the previous characteristics of the natural water
bodies’ ecological status. This is the traditional wastewater disposal into a receiving media, but
fulfilling certain water quality and quantity standards, to restore wetlands, wildlife refuges,
urban lakes and rivers (Plumlee, 2012).
Several examples of this alternative source is being implemented in different parts of the world.
In the arid areas of Middle East and North Africa, wastewater is commonly reused for urban
irrigation. In japan, dense urban areas without reliable water sources have required the
development of innovative dual reticulation systems where wastewater is reused (from sink to
toilet flushing), within buildings, districts, and cities. In California, high per capita water
demand in densely populated cities has led to indirect potable reuse of wastewater. Wastewater
is treated to a high standard, pumped underground to replenish groundwater aquifers, and then
abstracted and transmitted as potable water.
Almeria province is an arid region of the southern Spain. The main activity of the region is
irrigated greenhouse horticulture (market gardening) which is spread over a surface of 22,000
ha. Due to over abstraction of the groundwater resources, saline intrusion appeared resulting in
abstraction from deeper aquifers. However, the pumped water salinity reached 3 g Cl/L and the
pumping costs increased to a point where it became too expensive for the farmers (Thomas and
Durham, 2003). The wastewater treatment system used is an activated sludge. The effluent is
then stored in a 10,000 m3 reservoir and treated through rapid sand filtration. Then is followed
by an ozonation system and is stored in a reservoir before gravity distribution to the farmers
occur.

Literature Review 21
Livermore is located southeast of San Francisco in the centre of California. The climate is semi-
arid. The main water sources are from the local aquifers and imported water. The treatment
plant is mainly a primary treatment followed by an activated sludge. Most of the effluent is
disinfected before being discharged into the San Francisco Bay, the remaining flow passes
through activated carbon filters and disinfection and then irrigates golf courses (up to 4,600
m3/day)(Thomas and Durham, 2003).
Singapore located just one degree north of the equator, south of the southernmost tip of
continental Asia and peninsular Malaysia, with Indonesia’s Riau Islands to the south is having
one of the most crucial problems related to water supply. It is dependent on a 33% on imported
water. As a consequence, strategic options including local catchment, importing water,
desalination and recycling water were adopted. Singapore has adopted these options uniquely
to develop NEWater (recycled water) by innovation which has enabled the nation to
successfully substitute 30% of freshwater demand (Chew, Watanabe and Tou, 2011).
The production process NEWater involves a comprehensive system of innovation conferred by
a sophisticated combination of innovation in membrane technologies and the optimal utilization
under extremely subtle operating parameters, enabling technology substitution for
conventionally treated water. The process has a conventional wastewater treatment in the water
reclamation plants in which the effluent is treated in the first stage of the NEWater production
process using membrane technology (microfiltration or ultrafiltration) to remove suspended
solids, colloidal particles, disease-causing bacteria, some viruses and protozoan cysts. The filter
water after passing through the membranes contains only dissolved salts and organic molecules.
To remove the salts and organic molecules, this effluent is treated in reverse osmosis process
which will be the second stage of the NEWater production process. A semi permeable
membrane filters out contaminants such as bacteria, viruses, heavy metals, nitrates, chlorides,
sulphates, disinfection by-products, aromatic hydrocarbons, and pesticides. After these process
NEWater is thus free from viruses and bacteria and the water is of potable quality. But still for
safety precaution a third stage in the NEWater production process of UV disinfection is used to
ensure that all organisms are inactivated and the purity of the water can be guaranteed (Chew,
Watanabe and Tou, 2011).
The first year tender price for NEWater was S$0.30/m3 or USD$0.23/m3 which is significantly
less than the cost of desalinated water in Singapore. The selling price of NEWater is S$1.15/m3
or around USD$0.85/m3 which is covering production, transmission and distribution costs.
Because the production costs of NEWater is less than that of desalinated water, future water
demands plan to be covered with more NEWater rather than with the construction of
desalination plants (Chew, Watanabe and Tou, 2011).
2.5 Social and economic evaluation of projects
2.5.1 Principles
Profitable capital investment leads to the growth and prosperity of an economy. If profitability
is low, investment will be reduced. The investor needs tool to predict the profitability of

Literature Review 22
proposed investments (Remer and Nieto, 1995).There are many methods and techniques that
can be applied to help the investor make wise economic decisions. These evaluation methods
and techniques can be applied to independent projects to determine whether or not to invest in
each one, or they can be applied to several mutually exclusive projects for the purpose of
determining which, if any, should be pursued (Remer and Nieto, 1995).
To understand the use and application of most project evaluation methods, concepts as time
value of money (TVM), cash flow diagrams, minimum attractive rate of return (MARR) and
economic evaluation factors is required to be known. In the following table formulas, symbols
and purpose of each concept are shown.
Table 5 Economic evaluation factors (Remer and Nieto, 1995)
The steps of an economic evaluation are:
Define a set of investment projects for consideration
Establish the planning horizon (or analysis period) for economic study
Estimate the cash flow profile for each project
Specify the time value of money or minimum attractive rate of return (MARR)
Examine the objective and establish criteria to measure effectiveness
Apply the project evaluation technique (s)
Compare each project proposal for preliminary acceptance or rejection
Perform sensitivity analysis
Accept or reject a proposal on the basis of the established criteria

Literature Review 23
2.5.2 Project evaluation tools
There are many different evaluation tools; some are more widely used than others. According
to Remer and Nieto (1995) they categorized many various methods of project evaluation into
five basic types: net present value method, rate of return methods, ratio methods, payback
methods and accounting methods. Each method is shown in the following table.
The most popular techniques are the net present value criterion methods, the internal rate of
return method, external rate of return method, return on investment method, benefit/cost ratio
method and payback period method.
Table 6 Project evaluation techniques (Remer and Nieto, 1995)
2.5.2.1 The net present value methods
The net present value criterion method (NPV) is also known as the net present worth criterion
(Remer and Nieto, 1995). The net present value criterion method can be divided into four
subtopics or time analysis periods: present worth, future worth, annual worth, and capitalized
worth method.
One assumption that must be made whenever using any of the equivalence methods is that all
cash flows received from a project are reinvested at the same fixed rate used to calculate the
equivalent worth (Remer and Nieto, 1995). This rate is known as the minimum attractive rate
of return (MARR). Since all four methods are needed to judge the profitability of a project.
Thus, the use of the term net present value encompasses all the equivalence methods.
Literature Review 24
The present worth method examines the cash flows of a project over a given period of time and
resolves them to one equivalent present date cash flow through the use of an economic factors
listed in table 5. This method provides an easy way to evaluate projects by moving all cash
flows to the present. The steps to apply the present worth method are the following:
Determine the interest rate for which all future cash flows can be reinvested. This is
known as the required rate of return or minimum attractive rate of return (MARR)
Estimate the economic useful life of the project
Estimate the positive and negative cash flows for each period over the analysis period
Calculate the net cash flow of each period
Calculate the present worth of each of the net cash flows.
In general, a project is accepted if the net present value is positive and rejected if the net present
value is negative. If the net present is equal to zero, then the investor is indifferent to the project.
Also, if two or more projects are considered, the project which has the greater present value is
generally selected (Miranda, 2005). However, depending on the project situation, a project with
a lower present worth may be better.
Similarly, the future worth method resolves them to one equivalent cash flow at a future date.
This method can be thought of as a way to determine the future consequences of an investment.
The process for calculating the future worth of a project is similar to the one of the present
worth. Except that all cash flows are resolved to a future date, usually the end of the projects
life. The factors used when calculating this value are in table 5. Just as with the present worth
method, a project is accepted if the future worth is positive and rejected if the future worth is
negative. As before, if the future worth is equal to zero, then the investor is indifferent to the
project.
The annual worth method also examines the cash flow of a project, but does not resolve them
to any one cash flow at any one date. Instead, the annual worth method resolves all cash flows,
but, over an infinite time period from any given starting date. One disadvantage of this method
is that ignores the size of the project.
2.5.2.2 The internal rate of return
The internal rate of return method (IRR) is a measure of investment worth which calculates the
interest rate for which the present worth of a project equals to zero. The term “internal” implies
that the interest rate does not represent any “external” factors, such as the MARR, but only
“internal” confines of the cash flow (Remer and Nieto, 1995). Although this method does not
included the MARR in the calculation, the criteria to accept or reject a project depends on the
available MARR. If the interest rate is greater than MARR the project is accepted. If the interest
rate is less than the MARR the projects is rejected and if the interest is equal to the MARR,
then the investor remains indifferent to the project.
The calculations are based on the net present value criterion method, those same assumptions
of immediately reinvesting all future cash flows at the same interest rate must still hold. In
general, the value for interest of any project can be found either by using the exact formula

Literature Review 25
given in table 5 and solving directly for interest, or by using tables of interest factors for various
interest rates.
2.5.2.3 Return on investment
There are two variations of the return of investment (ROI) method. The first is the return on
original investment method. The second is the return on average investment method. The return
on original investment method measures a percentage relationship between the average yearly
profit and the initial investment the return on average investment method measures the
percentage relationship between the average yearly profit and the average yearly investment.
The amounts used to calculate the average are not discounted or not considering the time value
money (TVM) (Almond and Remer, 1979).
The return on original investment can be expressed as:
𝑅𝑂𝐼 = 𝐴𝑌𝑃
𝐼
Where: AYP is the average yearly profit
I is the initial investment
The return on average investment can be expressed as
𝑅𝐴𝐼 = 𝐴𝑌𝑃
𝐴𝑌𝐼
Where: AYP is the average yearly profit
AYI is the average yearly investment
This method does not have a set criteria for project acceptance. The greater rate is the one said
to be more favourable. One disadvantage is that this method does not consider the time value
of money and Remer and Nieto (1995) recommends the use of more than just one project
evaluation technique when used the rate of investment method.
2.5.2.4 Benefit/Cost ratio
The benefit/cost ratio method (B/C) was introduced primarily as a result of the US
Government’s need to evaluate project proposals submitted to Congress. In the 1930’s Congress
established the criterion for the acceptance of a project, which stated that the “benefits” of a
project must outweigh the “costs”. Thus the benefit/cost ratio method developed out of
Congressional legislation (Almond and Remer, 1979).
The criteria for the benefit/cost ratio method is described in the following table:

Literature Review 26
Table 7 Acceptance criteria for the benefit/cost ratio method
Benefit Cost Ratio (B/C) Decision
Positive Positive >1 Accept
Positive Positive equal 1 Indifferent
Positive Positive <1 Reject
Positive Negative any Accept
Negative Positive any Reject
Negative Negative >1 Reject
Negative Negative equal 1 Indifferent
2.5.2.5 Payback period method
The payback period method (PP) examines the number of years required for a project’s earnings
to equal the initial investment. In other words, it is the amount of time required for the project
to pay for itself. Thus, the name payback period method (Almond and Remer, 1979)
The procedure for applying the payback period method is analogous to the procedure for
applying the internal rate of return method. The only difference are that (1) the unknown
variable is n and (2) not all future cash flows need to be considered. Remer and Nieto (1995)
reported that most companies usually use either the net present value criterion method or the
internal rate of return method in conjunction with the payback period method.
There are two commonly used types of the payback period method. They are the conventional
payback period method and the discounted payback period method. The conventional payback
period method is sometimes easier to explain to people unfamiliar with project evaluation
techniques. However, the conventional payback period method assumes an interest of 0% while
the discounted payback period method usually uses the MARR. This is one criteria used to
recommend the discounted payback period method. In the case of two or more projects, the
project with the lowest payback period is usually preferred.
One of the disadvantages of this method is that it does not look at the cash flows after the
payback period. The cash flows after the payback period determine the project’s rate of return.
Remer and Nieto (1995) states that the payback period method should be used in conjunction
with other methods, such as the internal rate of return method or the net present value criterion
method.

Literature Review 27
An advantage of this method is that it sometimes provides a quick way of determining the risk
of a project based upon the length of the payback period. Also, as with the annual worth method,
this method is often easier understood by people without an economics background.
2.5.2.6 Other methods
Other less common methods include the life cycle costing method, maximum prospective value
criterion method, growth rate of return method, and profit to investment ration method, cost
effectiveness method, project balance method, and accounting methods. Remer and
Nieto(1995) states that no project evaluation using these methods was ever done without using
either the internal rate of return method or the net present value criterion methods.
2.5.3 Summary of project evaluation techniques
Table 8 Summary of project evaluation techniques characteristics (Remer and Nieto, 1995)

Literature Review 28
2.5.4 Case studies
2.5.4.1 Case 1. Comparison of engineering costs of raw freshwater, reclaimed water and seawater for toilet flushing in Hong Kong. (Tang, Yue and Li, 2007)
Hong Kong is a coastal city with a population of about 6.9 million and successfully utilizes
“dual water supply systems” operated by the Water Supplies Department (WSD) of Hong Kong
government from the 1950’s. The dual water supply systems include a freshwater distribution
system for potable use and a seawater distribution system for toilet flushing.
For this study seawater, raw freshwater from the Guaungdong of China and treated effluent
from the sewage treatment plant (STP) are assumed to be three water resources for the separate
flushing systems. Four areas of study were selected, in which they denominated Southern
District (SD), Sai Kung (SK), Northern New Territories (NNT), and Northwest New Territories
(NWNT). Six cases in the different areas of the country were selected to carry out an
engineering cost comparison. The cases were:
(1) The toilet flushing system using seawater in SD, SK, NNT, and NWNT.
(2) The toilet flushing system using raw water in SD, SK, NNT, and NWNT.
(3) The toilet flushing system using reclaimed water in SD, SK, NNT, and NWNT.
(4) The toilet flushing system using seawater in SD and SK, and raw water in NNT and
NWNT.
(5) The toilet flushing system using seawater in SD and SK and reclaimed water in NNT
and NWNT.
(6) The toilet flushing system using seawater in SD and SK, and raw water in NNT, and
reclaimed water in NWNT.
More possible cases can appear but only this six have been considered by the authors as sensible
and worthwhile for comparison.
In the analysis, the time duration (or time horizon) for comparison was the same for all six
cases. A time horizon of 60 years was assumed, which was the least common multiple of three
important renewal years of different categories of facilities: 15 years of E&M (electronic and
mechanical) equipment, 20 years for seawater mains, and 30 years for freshwater mains, plant
and machinery and meters. It was also assumed that water demand and supply was constant
throughout the running period of 60 years.
The NPV method was used for carrying out the comparisons. The NPV determined from the
calculation will be used to compare directly the engineering costs of the cases.
NPV= Fo +F1/ (1+i)1 + F2 +F2/ (1+i)2 +… + Fn +Fn/ (1+i)n
Where Fn is the net cash flow or (income – expenditure) in year n. Expenditure includes the
running cost for each year (n=1, 2,…, 60), the capital cost when n=0, the renewal cost when
n=30 for the freshwater, raw water and reclaimed water supply systems, and the renewal cost
when n=20 and 40 for the seawater supply system. E&M items are renewed when n=15, n=30,
n=45. The incomes for the six cases are not considered in this study and are assumed to be the

Literature Review 29
same in all cases, because they are practically so. If they are not considered, their values are set
to be zero when the above NPV formula is applied, and therefore the NPV calculated for each
of the six cases is in fact the present value of total cost. This will adequately serve the purpose
of the study to compare the present values of total costs of the six cases.
The results of this study showed that the dual water supply systems by adopting seawater for
toilet flushing in these areas have the best engineering economy then raw freshwater and then
reclaimed water. The use of seawater for toilet flushing is less expensive than the other options.
In addition using seawater provides a number of benefits, including reliability of supply,
cutting, cutting down the demand for potable water and reducing reliance on Dongjiang water.
The use of reclaimed water is more expensive than using raw water. But if the price of raw
water increases in the same way as it has been increasing the situation will reverse after some
time. From the results of cases 2 and 3, the NPV’s are HK$ -2492M and -2740M, respectively.
The current unit price of raw water purchased is HK$3.085/m3. When this unit increases and
reaches certain level, the raw water alternative would no longer be attractive. Repeated trial
calculations have been carried out by adjusting the unit price of raw water, and when the uit
price increases to HK$4.25 (based on year 2000 money value), the NPV of case 2 would
become HK$-2740M and is equal to the case 3.
Similar results were obtained when evaluating cases 5 and 6. This concludes that although the
use of reclaimed water is more expensive than that of raw freshwater at present, the situation
may reverse after some time if the price for raw water increases in the same way if=t has been
doing. The other conclusion was that the use of seawater for toilet flushing has the lowest
engineering cost compared with the use of the other water sources even though import and
export pipelines are built for delivering seawater into and out of the seawater supply zone.
2.5.4.2 Case 2. Cost-benefit analysis in the Yarqon Recycling Project case study in Israel. (Garcia and Pargament, 2015)
The Yarqon River flows through the Tel-Aviv Metropolitan Area and was once the second
biggest river in Israel in terms of volume of flow. Before the 1950’s, its annual discharge was
220 million m3 coming mainly from springs supplied by a large Karst aquifer. However, after
the creation of the State of Israel in 1948, the demand for water for agricultural, industrial and
drinking purposes increased, and so pumping rates from the aquifer almost ended the flow of
spring water into the Yarqon River (Garcia and Pargament, 2015).
As predetermined in the Yarqon River Rehabilitation project, in the upper reach of the river,
since the 1990’s the river received 200 m3 of the spring water pumped every hour from the
Yarqon Spring pumping station, allocated by the National Water Authority. In recognition of
the ecological needs of the river, this rate of flow was increasing, by June 2011 to 600 m3/h and
to 850 m3/h in July 2012.
In the middle and lower reaches of the river one of the main priorities was to stop the discharge
of poorly treated sewage water to this area. The Yarqon River Authority prompted upgrades to
the Kfar Sava-Hod Hasharon wastewater treatment plant (WWTP) established in 2009, and the

Literature Review 30
Ramat Hasharon WWTP, completed in 2011, by improving the water quality to a tertiary lever
treatment. Nowadays, the volume discharged into the river comply with the standards of the
Public Health Regulations.
By 2016, the National Water Company of Israel, Mekorot, will operate a water reuse facility
for the water flowing in the river at the end of the middle section. This facility will use a
submerged membrane bioreactor in order to enable reuse of the water for irrigating Tel-Aviv’s
parks as well as parks in the neighbouring municipalities. The main park that will reuse this
water for irrigation is the Yarqon Park. The reuse system will also supply water to the farmers
who currently are extracting water directly from the river and this will allow more flow in the
river. They state in this case that installing a water reuse facility downstream is the best solution
to solve the issues between competing uses of water for environmental and irrigation purposes.
The economic feasibility assessment of the Yarqon recycling project consists of a cost-benefit-
analysis. The procedure to achieve the objective consists of five steps.
Step 1. Selecting and evaluating the wastewater reuse plan: In this cases a “do nothing”
scenario is natural water body augmentation, and evaluated plan is an indirect
wastewater reuse plan, in this case the Yarqon Recycling Project. They applied a cost-
benefit analysis for a 20 year period to determine the economic efficiency of the project.
Step 2. Estimating the internal costs of the project: The total initial investment was
estimated to be $14,700,000 over the period 2014-2016. The capital costs of the pipes
represented a 5.84% of the investment costs ($857,000). The operation and
maintenance costs were estimated to be $0.16/m3. For this study three scenarios were
considered in the cost-benefit analysis, pessimistic, base case, optimistic. To take into
account the uncertainty in the capital and operating and maintenance cost estimates, a
range of -20% and +30% of the base-case was uses to estimate the optimistic and
pessimistic scenarios (Halaburka, et al., 2013).
Step 3. Estimating the external trade off: In this step the benefits and costs for
agricultural usage, urban use and environmental use were evaluated. For the agricultural
use elements as the water price of treated water, fertilization savings, and crop
composition were indicators. For the urban usage water price for park irrigation and
recreational costs were the indicators. For the case of the environmental usage the
pollution that could generate the discharge of nitrogen and phosphorus were indicators
to evaluate.
Step 4. The implementation of the cost-benefit analysis: for this study, a 3.5 and a 5.5%
discount rates are used to calculate both the present costs and benefits in the optimistic
and pessimistic scenarios. The net present value results for the base case scenario were
approximately $4.83 million. For the optimistic scenario resulted in $39.70 million.
However for the pessimistic scenario was negative with a result of -$26.92 million. This
results shows that the benefits obtained from the supply of water for irrigating the urban
parks are the factor that contributed the most benefits side, proportionally higher than
the benefits obtained from water supply for agricultural irrigation. The recreational costs
derived by the attitudinal impact on park visitors represented the largest costs in the
calculation of the net present value.
Step 5. A sensitivity analysis: the evaluation of the impact on the net present value
because of the uncertainty of the cost-benefit analysis parameters. A multi regression

Literature Review 31
analysis with standardized regression coefficients was used for that purpose.
Standardized regressions coefficients method requires performing Monte Carlo
simulation, 5000 in this case in order to get stable estimates of the coefficients.
Regarding the results it was found that obtaining a positive net present value was
64.28%. The simulated median net present value was %3.53 million, the percentile 25
was approximately -$2.57 million, and the percentile 75was $9.52 million. The
estimation of the standardized regression coefficients made possible to indicate which
of the input parameter has the greatest influence on Net Present Value. The 3 parameters
with a higher value of influence in the Net Present Value were: (1) the rate of change in
the recreational costs, (2) the water price for urban park irrigation, (3) the rate of change
in the capital costs.
The main objective of this CBA was to analyse the economic, social and environmental aspects
around the concept of wastewater reuse in order to assist policy makers, managers on the
implementation of the economic instruments for decision-making. The results of this cost
benefit analysis showed an economic viability obtaining a positive Net Present Value but when
a risk analysis was implemented the Net Present Value was not that high as expected.
The implementation of economically based decision-support tools has become essential in order
to advance towards water efficiency and assisting decision-makers in achieving Integrated
Water Resources Management socio-economic goals. As a relevant element in water
management particularly in water scarce regions, will require a helpful use of tools like cost-
benefit analysis. However, external costs and benefits also have to be considered to properly
assess the trade-offs involved in these kind of schemes (Garcia and Pargament, 2015).

Research questions 32
CHAPTER 3
Research questions
3.1 General Question
Is economically feasible the implementation of innovative alternative sources of water under
Cuban conditions to reduce the freshwater demand and alleviate water scarcity?
3.2 Specific research questions
1. What is the economic feasibility of the implementation of seawater for toilet flushing
in Cuba as an innovative alternative source of water to reduce freshwater demand?
2. What is the economic feasibility of practicing the treated wastewater reuse as
innovative alternative water source to reduce freshwater demand?
3. Is economically feasible to combine the use of seawater for toilet flushing and the reuse
of treated wastewater to reduce freshwater demand and contribute to alleviate water
scarcity?

Research approach 33
CHAPTER 4
Research approach
The following study will be done in three phases to carry out the Economic feasibility analysis
of the innovative water management approaches. In this research, four case-studies will be
selected to assess the feasibility of the innovative water practices: (1.) A case-study to assess
the use of seawater for toilet flushing by the Cuban population, (2.) A case-study at the touristic
resort Villa Playa Hermosa to study the potential replacement of freshwater by seawater for
toilet flushing and other potential non-potable uses, (3.) A case-study at Punta de Hicacos, in
La Peninsula de Varadero, where the potential reuse of treated wastewater is studied and (4.) A
case-study at Hotel Breezes Jibacoa, where the potential combination of seawater for toilet
flushing, wastewater reuse and seawater desalination are combined.
Figure 8 shows the research approach that was carried out in this study. The first phase consisted
of the Data Collection. The determination of capital expenditures (CAPEX) or all the
investment costs and operational expenditures (OPEX) mostly composed of the operation and
maintenance costs. The second phase involves the Economic analysis based on the Net Present
Value, economic and social benefits on the four cases. In the third phase, a scenario analysis
was undertaken incorporating a sensitivity analysis from each selected scenario on each of the
four case studies.
For the case study No.1, the sensitivity analysis was performed with the purpose of determining
the effects of water shortage periods from 1 to 9 months on the estimation of the cost, benefits,
and the indicators of interest. In the same way, for the case 2, the effects of experiencing water
shortage periods of 1.5, 3, 6, and 9 months. For the Case-study 3, the Hicacos WWTP, the
effects of the replacement of the membrane replacements every 5, 6, 8, 10 or 12 years were
studied on the overall costs. The upgrade of the RO desalination plant with the use of seawater
for toilet flushing and the membrane replacements for the WWTP of the hotel every 5, 6, 8 and
12 years were considered to execute the sensitivity analysis of the for the Case-study 4.

Research approach 34
Figure 8 Research approach of the study
Research Objectives 35
CHAPTER 5
Research Objectives
6.1 General Objective
To assess the economic feasibility of the implementation of innovative alternative water
sources under Cuban conditions to reduce freshwater demand and alleviate water scarcity.
6.2 Specific Objectives
To evaluate the economic feasibility of:
1. The implementation of seawater for toilet flushing as an innovative alternative source
of water to reduce freshwater demand in Cuba.
2. Of practicing the treated wastewater reuse as innovative alternative water source in
Cuba to reduce freshwater demand.
3. Of combining both, seawater use for toilet flushing and treated wastewater reuse, as
innovative alternative water sources to reduce freshwater demand and contribute to
alleviate water scarcity in Cuba.
Methodology 36
CHAPTER 6
Methodology
Based on the previous literature Review, this chapter presents the methodology that was applied
to execute an economic analysis based on the net present value criterion method (NPV) with
the objective of assessing the economic feasibility of the implementation of innovative
alternative water sources to reduce freshwater demand and alleviate water scarcity in Cuba.
This analysis was performed in three phases:
7.1 Phase 1. Data Collection
The first phase was the Data Collection. The determination of capital expenditures (CAPEX)
or of all the investment costs, and operational expenditures (OPEX) or operation and
maintenance costs. In order to gather accurate information, in this research two main ways to
collect data are identified: Primary data and secondary data.
6.1.1. Primary Data
The primary data was collected in two ways:
Interviews: A face-to-face interview was designed to gather information to collect more precise
information of CAPEX. Meetings with constructors, designers, directors in the ministry of
construction as a starting point to find out who is familiar with the facility and can provide
accurate information about real costs of capital investment. Capital investment can be divided
into initial capital costs and the renewal costs of the facilities. This included the costs of
purchasing equipment and the land costs. However, the land on which the facilities are going
to be built are owned by Cuba. This kind of information could be verified through interviews
directly with the corresponding authorities. As such, land costs were ignored. In the case of
Hotels, this information was gathered by questionnaires. The water work facilities for
freshwater supply system will include impounding reservoirs, water treatment plants, pumping
stations, service reservoirs, water mains. When upgrading RO water plants, the main costs were
represented mostly by the energy consumption and the investment costs for the upgrade. For
the case of the seawater supply system the facilities include only pumping stations, service
reservoirs, and seawater mains.
Questionnaires and surveys
This method was used to obtain data from the final users, directors and operators of hotels and
directors of water utilities. The results obtained from this method focused on the OPEX. These

Methodology 37
are expenditures spent every year in order to the hotels operate successfully. Other parameters
were water consumption, occupancy and awareness of flow rate in water supply appliances and
sanitary equipment to improve efficiency of water use. This information together will allow to
continue with the next phase of this research.
The interviews were hold with:
Owner of Hotel Playa Villa Hermosa
Director and Economist of Hotel Breezes Jibacoa
Director of Aguas de La Havana
Director of Aguas de Varadero
6.1.2. Secondary Data
Literature review
The data collected hereby consisted in the collection of all prices from suppliers, chambers of
commerce and construction, databases of ministries of construction. Previous theses were also
considered that contained technical designs, and costs of CAPEX and some OPEX that could
not be found or obtained from the primary data.
6.1.3. Determination of CAPEX and OPEX
Based in previous sections (Primary and Secondary Data), the data needed to calculate the
CAPEX and OPEX was gathered. In the execution of any project, one important point is the
budget preparation, which determines if it is possible the construction of the work and what the
cost is. To build-up the budget, it was necessary to identify the activities, material supplies,
pipes, labour and other activities that are carried out in the work during its execution and that
have a cost that influences the preparation of the budget.
Secondary data was used to obtain the CAPEX for the cases involving the use of seawater for
toilet flushing. Villasante-Castañeda (2013) used the PRESWIN software in version 8.1 taking
into account the provisions of PRECONS II of 2005.
Once all the data was identified, the CAPEX were calculated by quantifying the amount of
materials, labour, and the use of equipment with the support of PRESWIN 8.1. In a
representative way, to show how the CAPEX and OPEX are expressed in this document for the
different case studies and their respective scenarios, the case of the Cuban population where
water is supplied to a group of 50 people is described in Table 9.
The cost of the construction service were calculated for the first case study (Study of the Cuban
Population- for 50 persons) being of US$ 10,480.03. As shown in Table 9, this value has several
independent budgets as temporal facilities, bank costs, insurance of the construction works,
unforeseen costs that can occur during the construction work and other additional costs (this
independent budgets are regulated by the Cuban government for the different types of
construction works like the percentage rate applied to each independent budget), this presents

Methodology 38
a total cost of US$ 2012.19. To estimate the actual cost of construction, the independent budgets
can be neglected. Thus, for this case the actual cost of the construction is US$ 8467.84
(Villasante-Castañeda, 2013). As mentioned before, in the same way, the CAPEX for this first
case-study with all the scenarios from 100 up to 5000 persons was calculated (see appendix 1).
Similar calculations were done for case-study 2 (Hotel Villa Playa Hermosa) and the study of
the use of seawater for toilet flushing (case-study 4, Hotel Breezes Jibacoa) which can be seen
in the appendix 2 and 4, respectively for the scenarios proposed.
Table 9 Example of the CAPEX for the case study of the Cuban population
where water is supplied to 50 persons
The OPEX of the cases-studies (1, 2 and 4) are shown in Table 10, assessing the use of seawater
for toilet flushing. It was obtained based on the replacement of the sanitary equipment and parts
due to the potential corrosion caused by the seawater. This considers that the pieces described
in Figure 9 are replaced twice a year, the depreciation of the system by a 10% per year of the
cost of investment of the system, hand labour (qualified and non-qualified), and the staff needed
(technicians, engineers, sub-directors and directors if needed). In Figure 11, the monthly
salaries taken into account each of the staff members are shown. This data was collected from
the water utilities company in Havana.

Methodology 39
Table 10 Example of the OPEX for the case-study of the Cuban population
where water is supplied to 50 persons

Methodology 40
Figure 9 Example of the data provided by PRESWIN 8.1. The table displays the costs of
materials and hand labour of the replacement of the sanitary equipment
Figure 9 was obtained from the PRESWIN 8.1 software and it shows the materials that are
replaced twice a year. To better understand the sanitary equipment that is replaced twice a year
(as considered in the estimation of the OPEX). Figure 10 illustrates the pieces replaced.
Actually, they are:
Manguera Metalica P/inodoro (water line)
Sellador con rosca (Tank-to-bowl Gasket)
Latiguillo flexible ½ x ½ (water line)
Tornillo para piso (Tank bolt)
Valvula de entrada de inodoro (Fill valve)
Valvula de salida de inodoro (Flush valve and flapper)
Ayudante de construccion del grupo salarial II (Non-qualified labour)
Plomero del grupo salaria V (Qualified labour)
Figure 10 Description of the sanitary parts of a toilet that are replaced twice a year due to the
use of seawater for toilet flushing

Methodology 41
Figure 11 Monthly Salary of employees in the water sector
(According to Water utility services)
7.2 Phase 2. Economic analysis
After evaluating the advantages and disadvantages of the most used techniques in the evaluation
of projects shown in Table 8 of Chapter 2 (Literature Review) there are many different
evaluation tools; some are more widely used than others. According to Remer and Nieto (1995)
they categorized many various methods of project evaluation into five basic types: net present
value method, rate of return methods, ratio methods, payback methods and accounting methods.
The most popular techniques are the net present value criterion methods, the internal rate of
return method, external rate of return method, return on investment method, benefit/cost ratio
method and payback period method being the first one, the most commonly used. The technique
decided to be applied to develop the economic analysis is:
2.1 Net Present Value (NPV)
At this phase the external costs were identified and valuated to be included in the economic
analysis. Following the representative case-study (Study of the Cuban Population- for 50
persons) to show how the NPV was calculated using Excel software. Considering the total
CAPEX (See example Table 9) and OPEX (See example Table 10) of each case and each
scenario assessed for a lifetime period of 20 years. The NPV for the first case (Case study for
the Cuban population for 50 persons being supplied with inly freshwater) is US$ 19,417.37.
The NPV was calculated of the investment by assuming an interest rate of 14% according to
Miranda (2005) which states that common interest rates can be from 7% to 14%. Due to lack
of data from Cuban banks and according to data from the World-Bank, similar countries from
the area reported an interest of 13, 2% (Haiti) and 15, 1% (Dominican Republic) (World-Bank,
2016). Considering the average of both countries is 14, 1%.
The detailed description of the NPV of each case and respective scenario assessed in this study
are shown in the appendix section.

Methodology 42
7.3 Phase 3. Scenario analysis
In the third phase, a scenario analysis was performed by analysing possible scenarios that may
take place and considering alternative possible outcomes of every scenario for each case study
selected. In this phase an economic sensitivity analysis was studied for each selected scenario
from the four case studies. The sensitivity analysis was performed for the purpose of
determining the most critical parameter affecting the estimation of the cost in US$/m3 water
supplied for the case of the use of seawater for toilet flushing or US$/m3 treated water for the
case of reuse of treated wastewater. Several examples can be shown from the different
techniques. This was evaluated after phase two to determine which ones are the most critical.
The critical parameters of interest assessed in the sensitivity analysis were: (1.) water shortage
periods from 1 to 9 months, (2.) periods of expanded water coverage using freshwater saved by
the use of the different alternatives proposed, (3.) to identify for how long the scenarios will be
economically viable, (4) to study or estimate, when the WWTP are upgraded with a MBR
system, what are the periods of replacement of the membrane that still make the scenarios
feasible.
The following case-studies were evaluated in this phase:
7.3.1 Case study of the replacement by seawater for toilet flushing in a Cuban community
This study analyses several scenarios to assess the economic feasibility of the implementation
of innovative alternative water sources under Cuban conditions like the use of seawater for
toilet flushing to reduce freshwater demand and alleviate water scarcity. In Figure 12 are
presented the main key scenarios evaluated as a function of the Cuban population served and
the water consumption used for this analysis.
Figure 12 Estimated fresh water consumption in Cuba as a function of number or people
served and local standards.
Methodology 43
The water consumption volumes shown in Figure 12 are obtained from Table 2 presented in
Chapter 2 (Literature review). As such, it states that for less than 2000 persons the water supply
design consider a water consumption of 145 LPPD, for 2000 to 10,000 persons 160 LPPD and
from 10,000 to 25,000 a water consumption of 175 LPPD.
For each population served, several situations assessed considering: a) fresh yearly water use
per No. of persons, (b) potential length or duration of water shortages (ranging from 1 to 9
months of water shortage), and (c) the potential replacement of freshwater by seawater for toilet
flushing to alleviate the impact of water shortages. As such, several scenarios and potential
situations were developed and assessed, such as:
Scenario FW (Use of only fresh water)
Scenario FW+1 month of water shortage (Use of only fresh water and supplying water
with water trucks for the water shortage period)
Scenario FW+2 months of water shortage (Use of only fresh water and supplying water
with water trucks for the water shortage period)
Scenario FW+3 months of water shortage (Use of only fresh water and supplying water
with water trucks for the water shortage period)
Scenario FW+4 months of water shortage (Use of only fresh water and supplying water
with water trucks for the water shortage period)
Scenario FW+6 months of water shortage (Use of only fresh water and supplying water
with water trucks for the water shortage period)
Scenario FW+9 months of water shortage (Use of only fresh water and supplying water
with water trucks for the water shortage period)
Scenario FW+SW (Use of fresh water and the use of seawater for toilet flushing or the
Dual water supply system)
Scenario FW+SW+1 month of water shortage (Dual water supply system and 1 month
of water shortage)
Scenario FW+SW+2 months of water shortage (Dual water supply system and 2 months
of water shortage)
Scenario FW+SW+3 months of water shortage (Dual water supply system and 3 months
of water shortage)
Scenario FW+SW+4 months of water shortage (Dual water supply system and 4 months
of water shortage)
Scenario FW+SW+6 months of water shortage (Dual water supply system and 6 months
of water shortage)
Scenario FW+SW+9 months of water shortage (Dual water supply system and 9 months
of water shortage)
7.3.2 Case study of the touristic resort Villa Playa Hermosa in Guanabo
Because of its proximity to the sea, the touristic resort Villa Playa Hermosa in the 5th avenue
between 472 and 474 in the City of Guanabo (See Figure 13), is one of the main options for
National tourists with a capacity to hold around 54 guests.

Methodology 44
The actual situation in this city is critical. The overexploitation of the freshwater wells has led
to their exhaustion. Moreover, intrusion of saline water to the wells themselves and to the whole
water supply system has affected the water quality. This affects the whole population of the
City of Guanabo, including the economic sectors. For instance, the touristic resort previously
mentioned pays around $300.00 CUC for saline water and a daily water truck of 8 m3 for $16.00
CUC per day which makes a total of $780 CUC per month. The yearly costs rise up to around
$ 9360.00 CUC (Villasante-Castañeda, 2013). The proposed scenario to be analysed are the
following:
Figure 13 Location of Hotel Villa Playa Hermosa(Google-EarthPRO, 2016)
7.4.2.1 Scenario 1 (Real water consumption of potable water, the maintenance of the
swimming pool and floor washing)
7.4.2.2 Scenario 2 (Real water consumption of potable water and the use of seawater
for toilet flushing and other potential uses as the maintenance of the swimming
pool and floor washing)
7.4.2.3 Scenario 3 (Real water consumption of potable water and the use of seawater
for toilet flushing and other potential uses as the maintenance of the swimming
pool and floor washing with a 1.5 months period of water shortage)
7.4.2.4 Scenario 4 (Real water consumption of potable water and the use of seawater
for toilet flushing and other potential uses as the maintenance of the swimming
pool and floor washing with a 3 months period of water shortage)

Methodology 45
7.4.2.5 Scenario 5 (Real water consumption of potable water and the use of seawater
for toilet flushing and other potential uses as the maintenance of the swimming
pool and floor washing with a 6 months period of water shortage)
7.4.2.6 Scenario 6 (Real water consumption of potable water and the use of seawater
for toilet flushing and other potential uses as the maintenance of the swimming
pool and floor washing with a 9 months period of water shortage)
7.3.3 Case study of Punta de Hicacos, in La Peninsula de Varadero
In Matanzas, the City of Varadero, in the peninsula of Hicacos, is a touristic zone with many
hotels that discharge the wastewater to the wastewater treatment plant (WWTP) of Hicacos
located in the same area (See Figure 14).
According to Aguas de Varadero the rate for freshwater is $1.50 CUC/m3 and for wastewater
reuse is $0.50 CUC. The total discharge from each room is around 378 L which 26.46 L are
being reused for irrigation representing a 7% of the total discharge from each room (Torres-
Rodriguez, 2015). With an increasing and booming tourist sector it becomes essential to explore
the potential increase in the reuse of treated wastewater to alleviate the upcoming water
consumption needs. This is a potential strategy that an economic sustainability analysis should
support. For this reasons, the following scenarios are proposed to be assessed:
Figure 14 Location of Pensinsula Hicacos mostly known as pensinsula de Varadero (Google-
EarthPRO, 2016)
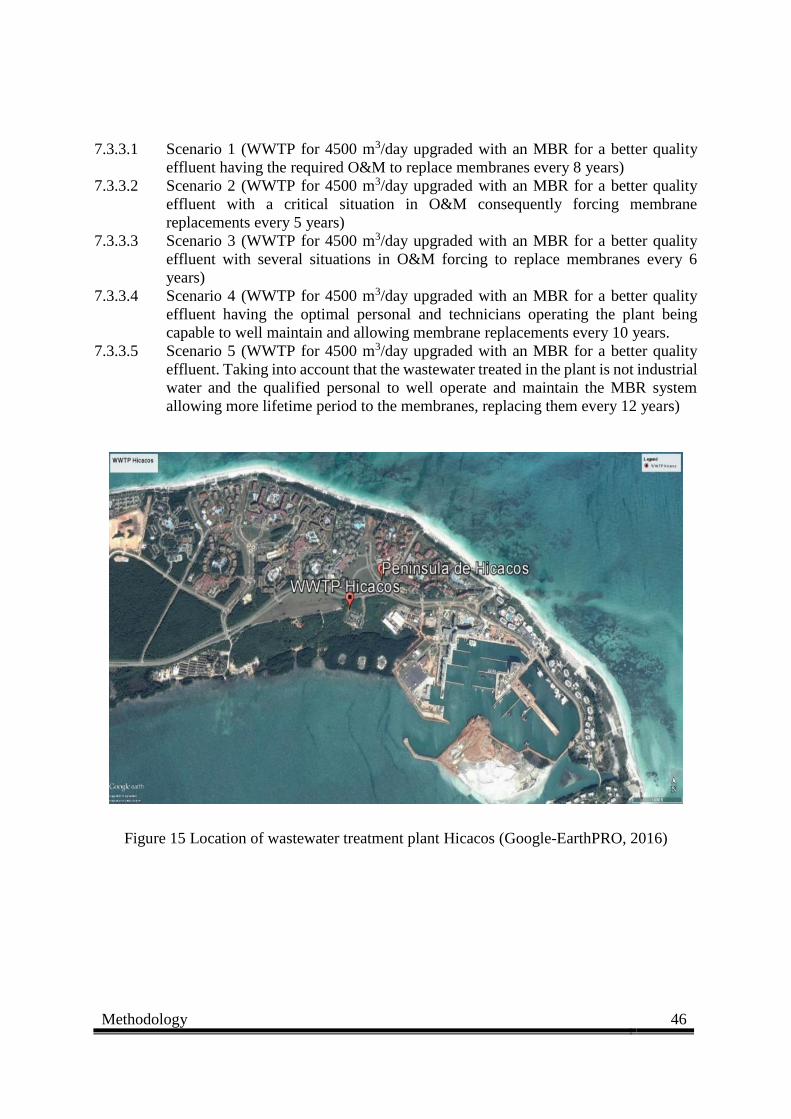
Methodology 46
7.3.3.1 Scenario 1 (WWTP for 4500 m3/day upgraded with an MBR for a better quality
effluent having the required O&M to replace membranes every 8 years)
7.3.3.2 Scenario 2 (WWTP for 4500 m3/day upgraded with an MBR for a better quality
effluent with a critical situation in O&M consequently forcing membrane
replacements every 5 years)
7.3.3.3 Scenario 3 (WWTP for 4500 m3/day upgraded with an MBR for a better quality
effluent with several situations in O&M forcing to replace membranes every 6
years)
7.3.3.4 Scenario 4 (WWTP for 4500 m3/day upgraded with an MBR for a better quality
effluent having the optimal personal and technicians operating the plant being
capable to well maintain and allowing membrane replacements every 10 years.
7.3.3.5 Scenario 5 (WWTP for 4500 m3/day upgraded with an MBR for a better quality
effluent. Taking into account that the wastewater treated in the plant is not industrial
water and the qualified personal to well operate and maintain the MBR system
allowing more lifetime period to the membranes, replacing them every 12 years)
Figure 15 Location of wastewater treatment plant Hicacos (Google-EarthPRO, 2016)

Methodology 47
7.4.4 Case study of Hotel Breezes Jibacoa:
In Mayabeque, the Hotel Breezes Jibacoa located in the Arroyo Bermejo Beach has 250 rooms
with one bathroom in between, pool area, bars, restaurants, night clubs and sports area.
Figure 16 Location of Hotel Breezes Jibacoa (Google-EarthPRO, 2016)
This hotel has a Reverse Osmosis (RO) treatment plant of two stages. Due to aggressive
conditions just one is in operation for a 24 hours period. It has a flowrate of 240 m3/day
desalinating 233 m3/day. The water demand of the hotel ranges between 360-410 m3/day
meaning that the plant is insufficient to cover the freshwater demand and that the water supply
has to be covered by water trucks (Romero López, Lafargue Verdecia, González Díaz and
Medina Correa, 2015).
The company responsible of supplying water has water trucks of 18, 20 and 30 m3 and different
prices according to different circumstances ( between $8.00, $9.75, or $ 21.00 CUC/ m3) for
this study an average around $11.00 CUC was used to estimate the costs needed to complete
the required water demand (Romero López, Lafargue Verdecia, González Díaz and Medina
Correa, 2015). If it is needed around 127 to 177 m3/day of water by water trucks, the total cost
will be approximately $1,397.00 CUC/ day to $1,947.00 CUC/day being annually costs around
$502,920.00 CUC to $700,920.00 CUC. Such costs can also be considered high, and the role
and importance of alternative practices to reduce the water consumption needs to become

Methodology 48
essential to secure the water supply if they are cost-effective. For this case study the following
scenarios are proposed:
7.4.4.1 Scenario 1 (Actual Reverse Osmosis water plant and supplying water from water trucks
to comply with the total water demand of the hotel)
7.4.4.2 Scenario 2 (Actual Reverse Osmosis water plant, the use of seawater for toilet flushing,
and to meet the water demand of the hotel purchasing water trucks)
7.4.4.3 Scenario 3 (Actual Reverse Osmosis water plant with an upgrade of 227 m3/day of the
plant and the use of sea water for toilet flushing)
7.4.4.4 Scenario 4 (WWTP for 380 m3/day upgraded with an MBR for a better quality effluent
having the required O&M to replace membranes every 8 years)
7.4.4.5 Scenario 5 (WWTP for 380 m3/day upgraded with an MBR for a better quality effluent
with a critical situation in O&M consequently forcing membrane replacements every 5
years)
7.4.4.6 Scenario 6 (WWTP for 380 m3/day upgraded with an MBR for a better quality effluent
with several situations in O&M forcing to replace membranes every 6 years)
7.4.4.7 Scenario 7 (WWTP for 380 m3/day upgraded with an MBR for a better quality effluent.
Taking into account that the wastewater treated in the plant is not industrial water and
the qualified personal to well operate and maintain the MBR system allowing more
lifetime period to the membranes, replacing them every 12 years)
Figure 17 Location of wastewater treatment plant of Hotel Breezes Jibacoa (Google-
EarthPRO, 2016)

Methodology 49
7.5 Performance indicator
The process of collecting, analysing and reporting the information of this research allowed to
select a performance indicator. This was carried out from the information related to the CAPEX
and OPEX, the economic analysis and the scenario analysis. The performance indicator or the
key parameter indicator is USD$/m3 of water of each innovative alternative water source. This
type of performance measurement allowed the assessment of the innovative alternatives applied
in each scenario for all the life time of the system (20 years) and is unified for an easy
comparison between them.
Other parameters or indicators that can be used for the assessment in this economic feasibility
analysis could be energy consumption in kWh/m3. This parameter will allow the comparison
based on energy consumption of each technology between the different scenarios evaluated.
Water consumption in m3/day or L/day will indicate not just how much consumption but how
much water is saved. This parameter will be linked to the water used by each tourist in m3/
tourist-day and consequently the water used per room in m3/room-day. This parameters will
facilitate each of the different stakeholders to choose their value of convenience. For example
the engineering cost manager or investor in USD$/m3, the engineer operator in kWh/m3, the
hotel managers or owners in m3/day or L/day, m3/ tourist-day or m3/room-day. As mentioned
before, this parameters will facilitate to achieve our key parameter in USD$/m3 of water from
each innovative alternative source of water in each scenario analysed.

Results and Discussions 50
CHAPTER 7
Results and Discussions
This chapter presents the results summarized of every step that was followed during the
methodology procedure and further discussed in detail. This chapter presents the CAPEX and
OPEX of the different alternatives proposed to alleviate water scarcity under Cuban conditions.
The different problems phased under the Cuban economy and the realistic situation to develop
the application of this technologies.
The objectives of this case study is to assess the economic feasibility of the different alternatives
as the use of seawater for toilet flushing and treated wastewater reuse, as innovative alternative
water sources to reduce freshwater demand and alleviate water scarcity.
7.1 Cuban Economy
As part of the process to understand the methodology applied during this case study, a primary
indicator was proposed which was the total cost in present value as US$/m3 of water either
water served in the case of the use of saline water for toilet flushing and water treated in the
case for the reuse of wastewater. All costs in this case study are expressed in US $ and this is
the importance to understand the different currencies that exist in Cuba. In this way trying to
obtain the best procedure to get acceptable results to analyse the economic feasibility of the
different alternatives.
It must be taken into account the characteristics of the Cuban economic system affecting
directly different situations. The conversion of the two currencies that exist in the country is
also being affected. The amplitude of the distortion of the prices, presence of the CUC
(Convertible Cuban Peso) in some markets and the difference between the accounting systems.
Due to a controlled system of prices and subsidies throughout the economy, the prices found in
the market are not fully representative to a real international price. The different variations in
prices is determined by the governmental institutions. Moreover, several products, construction
materials, and goods need to be imported which increases their price in Cuba.
For example, there is a drop in their monthly income because in most cases, the small quantity
of subsidized products received by the government makes the consumer to buy more products
in the market which uses the CUC currency and therefore makes the prices higher than usual.
Other utility services, like public transportation, electricity and water are also affected. Locals
pay for a ride in bus around US$ 0.008 (20 cents of Cuban Peso), for a ride in a Taxi between

Results and Discussions 51
specific points around the city about US$ 0.40. In contrast, a taxi for a foreigner is around US$
25.00- US$ 30.00 from the airport-to the centre of Havana. Electricity for Cubans is also
subsidized and they pay around US $ 2.00 for a family of 3 or 4 members. In the same way,
Cubans pay around US$ 0.20 for water per house (family around 4 members). This is because
they pay per inhabitant rather than volume of water consumed (e.g. per m3). Mostly caused by
the fact that the water consumption is not metered. But, metering is currently being deployed at
least in the most important cities of the country.
Water consumption in hotels and certain industries, is metered and regulated by the
corresponding institutions in each city under the regulation 287/2015 of the Republic of Cuba
(Norma: Resolucion 287/2015). This regulation states the prices of water as a function of the
two currencies, the CUC and the CUP. Therefore, the price of 1 m3 of freshwater for the non-
residential sector is CUP 1.55 (which is around US $ 0.062). For hotels, industries and any
commercial activity if their income is in CUP. In contrast, for the hotels and industries that
receive their income in CUC, the cost of 1 m3 of freshwater is CUC 1.55 (or approximately US
$ 1.35). This is a clear example of the condition of the Cuban economy which leads to a complex
analysis of any economic study in the country.
Table 11 Water prices according to the regulation of Cuba: (NORMA: Resolucion 287/2015)
Water price per cubic meter CUC US $
Potable water costs 1.55 1.35
Saline water costs 0.20 0.17
Wastewater reuse 0.55 0.48
7.2 Economic and Scenario analysis
7.2.1 Case-study: domestic use of seawater for toilet flushing in Cuban urban environments
The water consumption of 50 persons is 2,646.25 m3/year as shown in Figure 12. When water
shortage occurs, water should be supplied by other means and usually it is done through water
trucks to compensate the lack of water. If there is 1 month of water shortage in a year, 50
persons could use 2,425.73 m3/year of fresh water but they need 220.52 m3/year to be supplied
by water trucks to meet the yearly water demand. If there are 2 months of water shortage, they
could use 2205.21 m3/year of fresh water but 441.04 m3/year should be supplied by water
trucks. As the periods of water shortage extends the need of water trucks rises.
Under critical scenarios, the water scarcity periods can reach up to 9 months (Mekonnen, 2016).
As such, to evaluate the effect of a period of 9 months of water shortage in a year, 50 persons
in Cuba consume 661.56 m3/year of fresh water. To comply with their water demand they need
1984.69 m3/year extra which are supplied by water trucks.
The introduction of a dual water supply system as shown in Figure 18, can lead to a reduction
of fresh water demand. 50 persons consume 2098.75 m3/year of fresh water and 547.50 m3/year

Results and Discussions 52
of seawater can be used for toilet flushing. Evaluating a scenario of 1 month of water shortage,
if seawater for toilet flushing is implemented, they will use 1923.85 m3/year of fresh water,
547.50 m3/year of seawater for toilet flushing and there will be no need to supply water by
water trucks due to the fresh water saved by the use of seawater. This also happens for a 2 and
3 months period of water shortage.
Similarly to the scenarios where only fresh water is supplied, two more critical situations of 6
and 9 months with water scarcity were evaluated. For a 6 months water shortage period, 50
persons consumes 1399.17 m3/year of fresh water, 547.50 m3/year of seawater for toilet
flushing, part of this water shortage period is covered by the water saved from the use of
seawater for toilet flushing and to comply with the total water demand, 501.88 m3/year need to
be supplied by water trucks. For a 9 months water shortage period, they will utilize 524.69
m3/year of fresh water, 547.50 m3/year of seawater for toilet flushing, 547.50 m3/year with the
freshwater saved by the use of seawater and to meet the total water demand 1026.56 m3/year of
water will be needed to be purchased to water trucks.
As shown in Figure 19, if the number of months with water scarcity ranged from 1 to 9
(Scenarios FW+1 month of water shortage to FW+9 months of water shortage), the volumes of
water that need to be purchased from water trucks to cope with the lack of water increases from
8.3% to even 75% to satisfy the increasing demand. In this regard the evaluation of the
introduction of the dual system shows that fresh water consumption can be reduced by around
20.7% (Scenario FW+SW) with regard to the conventional or baseline scenario (Scenario FW).
This considerable reduction of about 20.7 % allows that, if the water shortage takes place as
previously discussed, the introduction of this alternative could allow a water coverage of at least
3 months and consequently avoid the supply of water by water trucks (from scenario
FW+SW+1 month of water shortage to FW+SW+3 months of water shortage).
If the length of the water scarcity scenarios expand to 4, 6, and 9 months the use of SW for
toilet flushing becomes insufficient to satisfy the water demand as higher volumes of freshwater
are required. As such, if a water shortage of 4 months takes place (Scenario FW+SW+ 4 months
of water shortage) there is a need to cope with the lack of water by continuing to purchase
around 5.7% of water from water trucks. If this critical scenario prevails and extends, after 6
and 9 months of water shortage there is a need to purchase about 19% and 38.8% of water,
respectively from water trucks. Still, when comparing scenarios FW+SW+4, FW+SW+6 and
FW+SW+9 months of water shortage these percentages (of 5.7%, 19.0%, and 38.8%) represent
less than half the water volumes that would need to be purchased from water trucks if there is
not SW for toilet flushing (Scenarios FW+4, FW+6 and FE+9 months of water shortage,
respectively, with purchase volumes of 33.3%, 50.0% and 79.3%).
Comparing the percentages of fresh water saved (Figure 20) shows how much fresh water is
saved by the use of sea water for toilet flushing as well as the percentage of water used during
water shortage periods. In particular, the volumes of water saved even during water shortage
periods (Scenarios FW+SW, FW+SW+1, FW+SW+2 and FW+SW+3 months of water
shortage) indicate that the replacement of freshwater by seawater for toilet flushing can allow
savings in freshwater. This data allows the presentation of how many cubic meters of freshwater
can be saved along the different scenarios. When the introduction of the seawater alternative is
applied 547.50 m3/year of freshwater are being saved (20.7%), when there is 1 month of water

Results and Discussions 53
shortage 372.60 m3/year of freshwater are being saved (14.1%), for 2 months of water shortage
197.71 m3/year (7.5%), and for 3 months of water shortage 22.81 m3/year of freshwater are
saved (0.9%).
Figure 18 Water consumption for 50 persons in m3/year assessed for the different scenarios

Results and Discussions 54
Figure 19 Percentage of water consumptions for the different scenarios
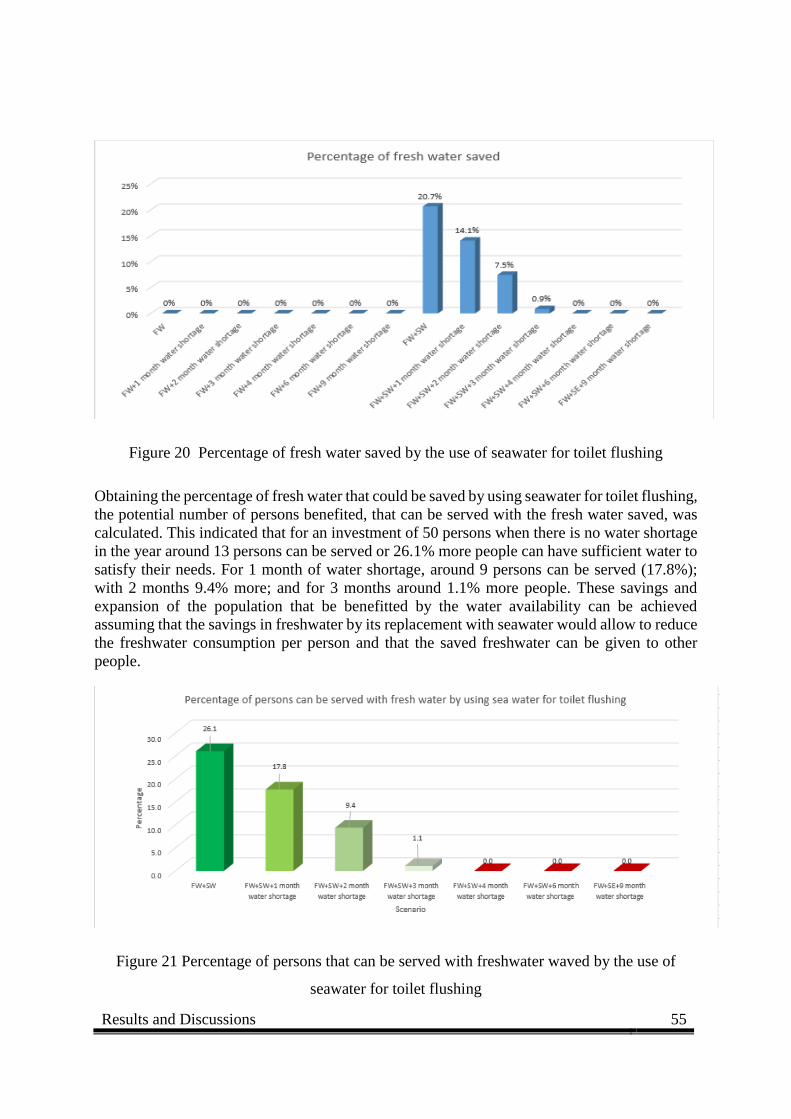
Results and Discussions 55
Figure 20 Percentage of fresh water saved by the use of seawater for toilet flushing
Obtaining the percentage of fresh water that could be saved by using seawater for toilet flushing,
the potential number of persons benefited, that can be served with the fresh water saved, was
calculated. This indicated that for an investment of 50 persons when there is no water shortage
in the year around 13 persons can be served or 26.1% more people can have sufficient water to
satisfy their needs. For 1 month of water shortage, around 9 persons can be served (17.8%);
with 2 months 9.4% more; and for 3 months around 1.1% more people. These savings and
expansion of the population that be benefitted by the water availability can be achieved
assuming that the savings in freshwater by its replacement with seawater would allow to reduce
the freshwater consumption per person and that the saved freshwater can be given to other
people.
Figure 21 Percentage of persons that can be served with freshwater waved by the use of
seawater for toilet flushing

Results and Discussions 56
The Net Present Value (NPV) of the Capital Expenditures or Capital Costs (CAPEX) and the
Operation and Maintenance Expenditures or Operation and Maintenance Costs (OPEX) was
calculated for a period of 20 years for the different scenarios and alternatives. This includes the
initial investment for the Dual water supply system, and the operation and the maintenance
(O&M) costs of this alternative. In the O-&-M, it is considered that, for the use of seawater for
toilet flushing, the replacement of the sanitary accessories twice a year and also the system
depreciation for a 10% per year of the cost of investment.
As shown in Figure 22, for the situation in which just fresh water is being used, when the months
of water shortage increase the NPV rises, making the situation more costly. The scenario where
only freshwater is supplied (Scenario FW) presents a NPV of US$ 19,417.37 and when water
shortage periods appear, for 1 month of water shortage (Scenario FW+1 month of water
shortage) the NPV increases to US$ 21,879.92, for 3 months of water shortage (Scenario FW+3
months of water shortage) the NPV is of US$ 26,805.03. As analysed before, the critical
situation of water scarcity can take up to 6 and 9 months of water shortage and the NPV for this
scenarios (FW+ 6, FW+ 9 months of water shortage) is of US$ 34,192.70 and US$ 41,580.37
respectively. This is because in these months there is a need to supply water by water trucks
with a cost of US$ 13.92 a truck of 8 m3 of water to compensate for the water shortage and the
price of the water provided by the water trucks is extremely high being US$ 1.74/m3.
Comparing the NPV of the Dual System (Scenario FW+SW), it can be seen that it is relatively
similar when there is no water shortage compare to the supply of only fresh water (Scenario
FW) with an NPV of US$ 19,247.01. But interestingly, when there is a water shortage from 1
up to 3 months, (from Scenario FW+ SW+1 to Scenario FW+SW+3 months of water shortage),
the NPV remains almost the same due to fresh water saving favoured by the use of sea water
for toilet flushing and by giving the saved water to more people since there is enough water and
there is no need of supplying water by water trucks.
Figure 22 shows the NPV for the scenarios previously studied and it is shown that for the
situations in which there is water shortage for 4,6 and 9 months (from Scenario FW+SW+4 to
Scenario FW+SW+9 months of water shortage), there is not enough water saved and water
trucks must be purchased. But, even under these conditions where there is a need to supply
water by trucks the NPV is lower when using seawater for toilet flushing (Scenarios
FW+SW+4, FW+SW+6, FW+SW+9 months of water shortage) than when only fresh water
and water trucks are needed (Scenarios FW+4, FW+6, FW+9 months of water shortage).
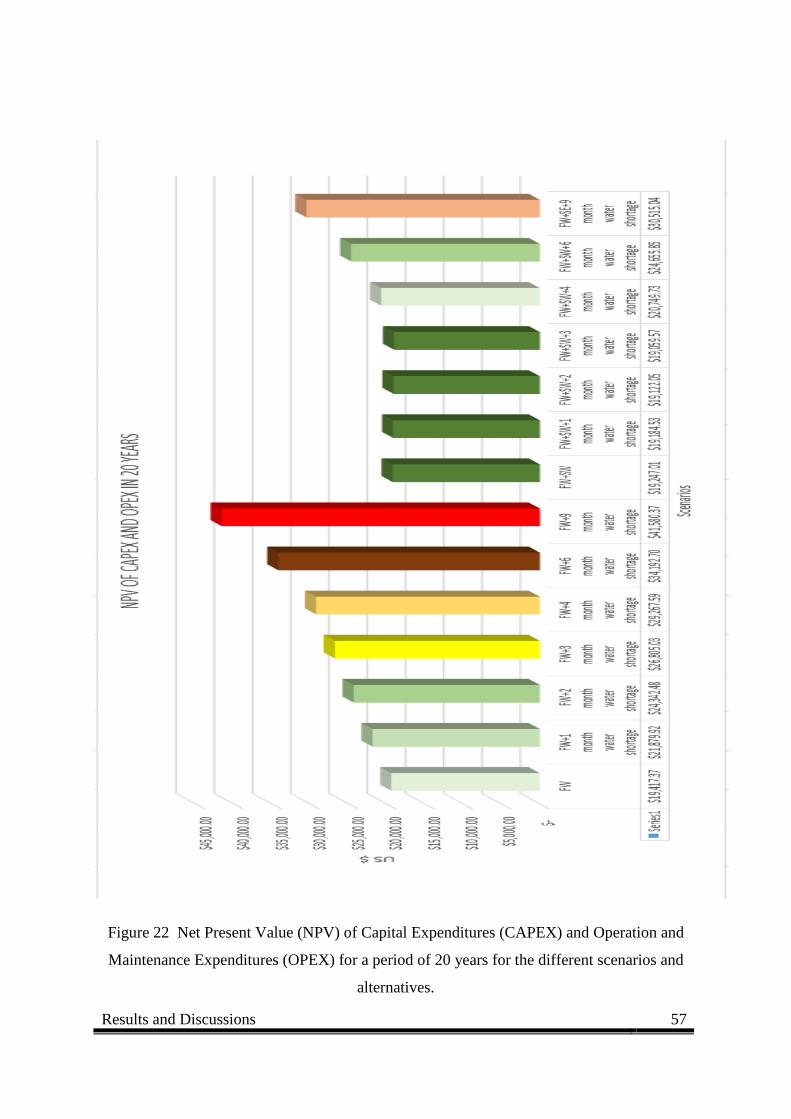
Results and Discussions 57
Figure 22 Net Present Value (NPV) of Capital Expenditures (CAPEX) and Operation and
Maintenance Expenditures (OPEX) for a period of 20 years for the different scenarios and
alternatives.

Results and Discussions 58
Figure 23 Cost of water in US$/m3 of water for the different scenarios and alternatives

Results and Discussions 59
For comparison purposes, a performance indicator consisting of the cost of cubic meter of water
supplied as US$/m3 was calculated from the NPV and the total amount of water supplied for 50
persons during the whole life span of the system. In Figure 23, the costs of water is shown in
US $/m3. As expected, the behaviour is similar to the NPV chart. The estimated cost of the
supply of fresh water when there is no water shortage is around US$ 0.37/m3. However, if water
shortage periods occur (Scenarios FW+1 to FW+9 months of water shortage), the cost can
increase up to US$ 0.79/m3 because the supply of freshwater is assumed to be insufficient and
water needs to be purchased from water trucks at a cost of US$ 1.74/m3. Interestingly, it can be
seen that US$ 0.36/m3 is the cost for the alternative of using seawater for toilet flushing
(Scenario FW+SW). And this cost remains for up to 3 months of water shortage (from Scenarios
FW+SW+1 to FW+SW+3 months of water shortage) and only increases marginally to US$
0.39/m3 for 4 months of water shortage (Scenario FW+SW+4 months of water shortage).
Compared to the scenarios where there is just fresh water supplied and water trucks the cost
can rise up to US$ 0.55/m3 (Scenario FW+4 months of water shortage).
As the water shortage periods increase (Scenarios FW+6, FW+9, FW+SW+6, FW+SW+9
months of water shortage) the cost continues rising, but even when with a 9 month water
shortage the dual system has a cost of water of US$ 0.58/m3 having US$ 0.21/m3 saved
compared to the costs of freshwater and water trucks for the same period of water shortage of
US$ 0.79/m3 (Scenario FW+9 months of water shortage).
In the same, several similar scenarios were evaluated, for 100, 200, 500, 1000 persons. Overall,
the results and trends (see Appendix A) were rather similar like for the scenarios assessed for
50 people, obtaining the same percent of water consumption, for fresh water saved and
percentage of persons that can be served with fresh water by using seawater for toilet flushing.
As an example (Figure 24), the scenarios performed for 1000 persons are presented in the
following paragraphs. It can be observed that when applying the use of seawater for toilet
flushing there is 10,950.00 m3 of fresh water saved being capable to supply freshwater to around
261 more persons when there is no water shortage. Around 177 persons when there is 1 month
of water shortage, 94 more persons when there is 2 months of water shortage and 11 persons
when there is 3 months of water shortage. Proportionally, this represents an increase in
freshwater availability and increase in population served of 26.1%, 17.7%, 9.4% and 1.1% by
the use of seawater for toilet flushing.

Results and Discussions 60
Figure 24 Number of persons that can be served with freshwater saved by the use of seawater
for toilet flushing
Furthermore, assuming that there is 6 persons per house living in a typical Cuban family, the
number of houses that can be benefitted by the water supply obtained from the fresh water saved
can be calculated. If there is no water shortage 43 more houses can be served (for Scenario
FW+SW), when there is 1 month of water shortage 30 houses can be served (for Scenario
FW+SW+1 month of water shortage), 2 months of water shortage 16 houses (for Scenario
FW+SW+2 months of water shortage) and 2 houses when there is a period of 3 months of water
shortage (for Scenario FW+SW+3 months of water shortage) as shown in Figure 25.
Figure 25 Number of houses that can be served with freshwater saved by the use of seawater
for toilet flushing

Results and Discussions 61
For a population of 5000 persons, the similar scenarios were analysed. Important to underline
that and as shown in Figure 12, the water consumption for a population of 5000 people is 160
LPPD. As such, a total water consumption of 292,000 m3/year is estimated as shown in Figure
26. Similar scenarios to those assessed previously for 50 persons were also evaluated.
It can be seen that the water supplied by water trucks increases for the scenarios where only
freshwater is supplied (from Scenario FW+1 to FW+9 months of water shortage) from
24,333.33 m3/year up to 219,000.00 m3/year. As seen in Figure 27, this increases from 8.3%
for 1 month of water shortage up to 75% for the most critical scenario (of 9 months of water
shortage). Introducing the dual water supply system around 18.8 % (Scenario FW+SW) of fresh
water consumption can be reduced compared to the baseline scenario (Scenario FW). If water
shortage occurs, this reduction will allow a water coverage of about 2 months avoiding the
purchase of water by water trucks (Scenario FW+SW+1 and FW+SW+2 months of water
shortage). It is important to underline that, with regard to the evaluations performed from 50 up
to 1000 persons, the amount of water saved is capable to cover up to 3 months of water shortage,
which is different from the previous analysis.
In the same way, as the periods of water scarcity extends from 3 to 9 months, the use of seawater
for toilet flushing becomes insufficient to comply with the water demand. Supplying water with
water trucks under these scenarios is rather needed and a 1.6% of water should be supplied by
water trucks for the Scenario FW+SW+3 months of water shortage. For Scenario FW+SW+4
months of water shortage an 8.3%, for 6 months a 21.9% (Scenario FW+SW+6 months of water
shortage) and for the most critical scenario of 9 months of water shortage a 42.2% (Scenario
FW+SW+9 months of water shortage) of water must be purchased to water trucks.
In Figure 28, it can be seen the percentages of fresh water saved by the use of a dual water
supply system. The number of persons benefited that can be served with this freshwater saved
was calculated resulting that for an investment of 5000 persons when there is no water shortage
in the year around 1154 persons can be served or 23.1% more people can have sufficient water
to satisfy their needs. For 1 month of water shortage around 737 persons can be served (14.7%)
and for a 2 month of water shortage 321 more persons can be served or 6.4% more people.
Moreover, as assumed that there is 6 persons per house living in a typical Cuban family, the
number of houses that can be benefitted by the supply of water obtained from the fresh water
saved can be calculated. If there is no water shortage 192 houses can be served (Scenario
FW+SW), when there is 1 month of water shortage 123 houses (Scenario FW+SW+1 month of
water shortage) and when there is 2 months of water shortage 53 houses can be served (Scenario
FW+SW+2 months of water shortage) as shown in Figure 29.
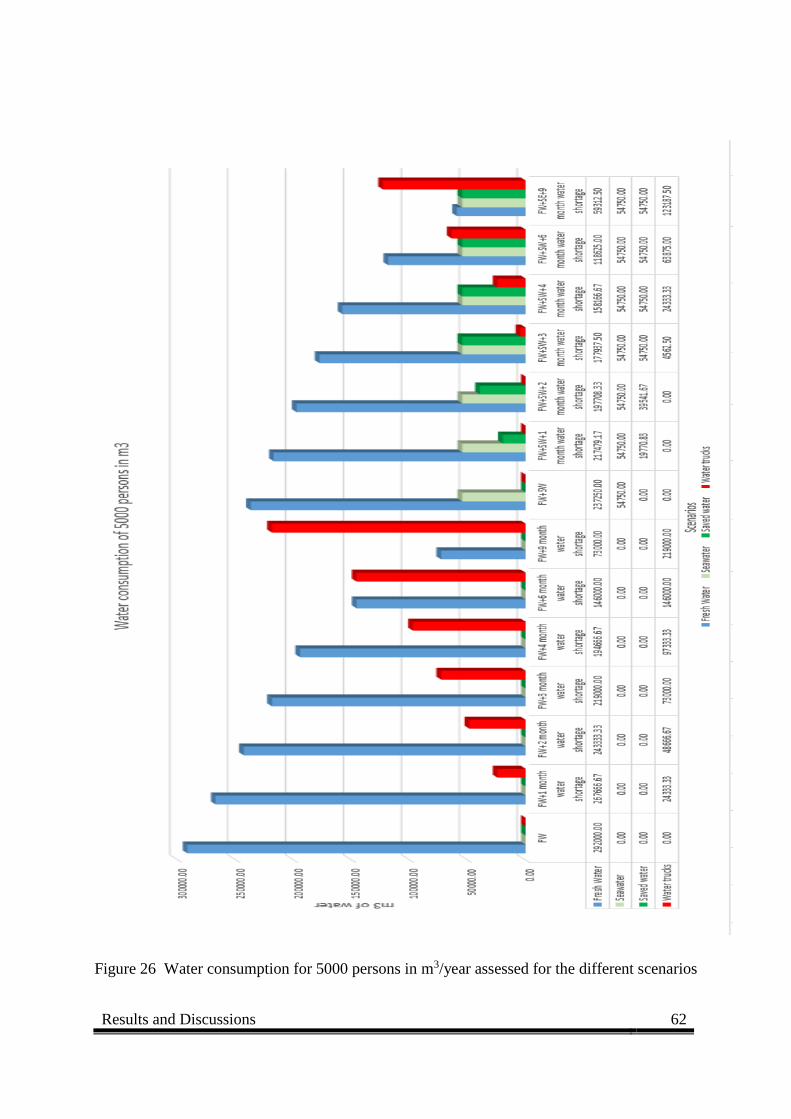
Results and Discussions 62
Figure 26 Water consumption for 5000 persons in m3/year assessed for the different scenarios
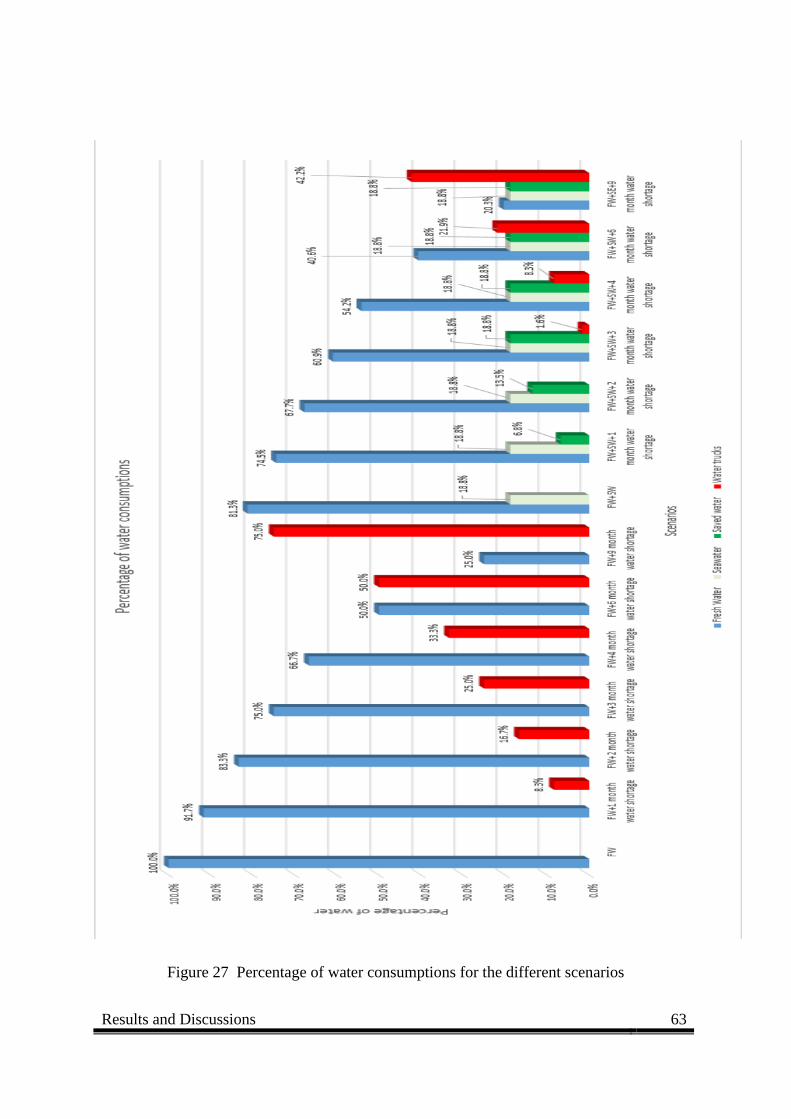
Results and Discussions 63
Figure 27 Percentage of water consumptions for the different scenarios

Results and Discussions 64
Figure 28 Percentage of persons that can be served with freshwater waved by the use of
seawater for toilet flushing
Figure 29 Number of houses that can be served with freshwater saved by the use of seawater
for toilet flushing

Results and Discussions 65
The NPV of the CAPEX and OPEX was calculated for a period of 20 years for the different
scenarios and alternatives in the same way like for the previous scenarios from 50 persons up
to 1000 persons. Figure 30 shows the scenario where freshwater is only supplied (Scenario FW)
with a NPV of US$ 2,027,713.66. As water shortage periods occur an increment in the NPV is
seen because there is a need of purchasing water to water trucks. For 1 month of water shortage
(Scenario FW+1month of water shortage) the NPV is US$ 2,299,443.88, for a 2 month water
shortage (Scenario FW+2 months of water shortage) the NPV is of US-$ 2,571,174.10, for a 3
months of water shortage (Scenario FW+3 months of water shortage) the NPV is US$
2,842,904.33. The increment in the NPV gets higher as the water shortage period extends and
at the most critical situation of 9 months (Scenario FW+9 months of water shortage) the NPV
reaches US$ 4,473,258.67. This value represent an increment of almost 120% more from the
baseline scenario where no water shortage occurs (Scenario FW).
The introduction of the Dual System (Scenario FW+SW) shows an NPV of US$ 2,010,677.94
being relatively similar when compared to the supply of only freshwater (Scenario FW).
Emphasizing that in the previous analysis for the scenarios from 50 up to 1000 persons there is
enough water saved from the use of seawater for toilet flushing to cover up to 3 months of water
shortage. Different from this scenario of 5000 persons which is able to cover periods up to 2
months of water shortage, the NPV remains almost the same from a period of 1 up to 3 months
of water shortage (from Scenarios FW+SW+1 up to Scenario FW+SW+3 months of water
shortage).
Interestingly for a water shortage period of 4 months, where there is a need to purchase water
for water trucks, the NPV is of US$ 2,262,848.63 (Scenario FW+SW+4 months of water
shortage) indicating a slightly small increment from the previous scenarios. And as shown in
Figure 12 is slightly lower than the scenario supplying just freshwater with 1 month of water
shortage (FW+1 month of water shortage). As the water shortage periods expands from 6 up to
9 months (from Scenario FW+SW+6 and FW+SW+9 months of water shortage) the NPV
increases. But the NPV is still lower when compared to the scenarios being supplied with just
freshwater (Scenarios FW+6, FW+9 months of water shortage).
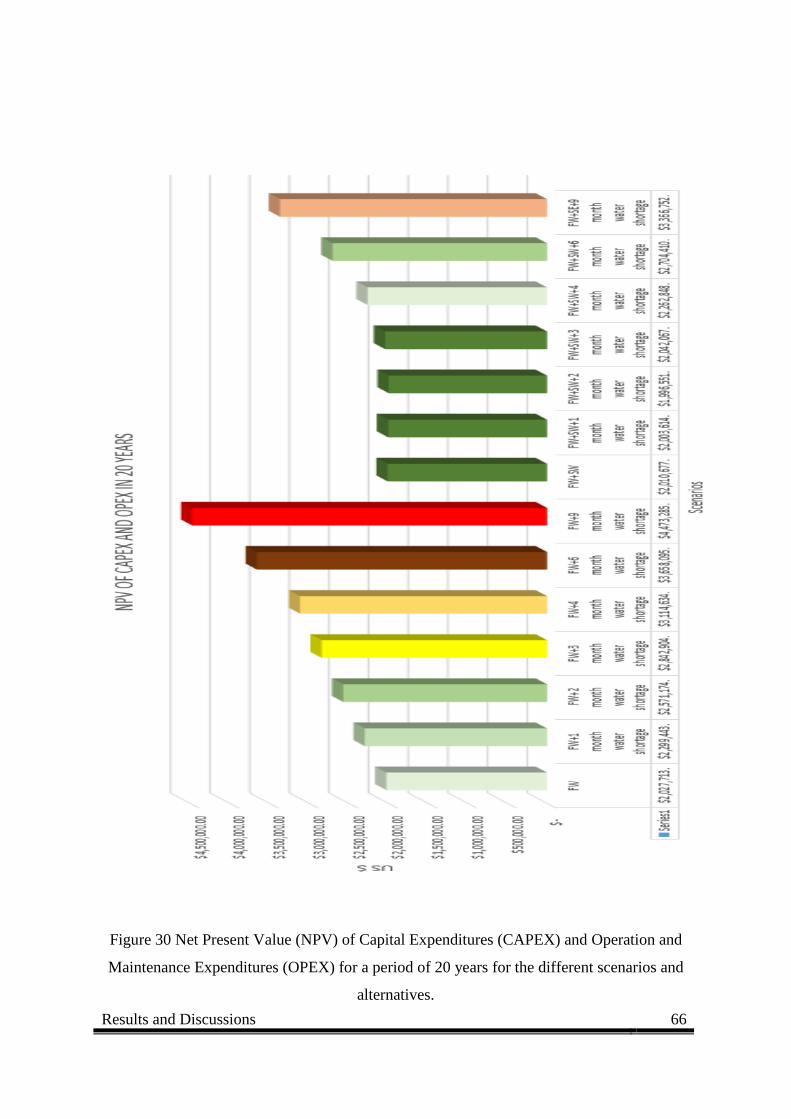
Results and Discussions 66
Figure 30 Net Present Value (NPV) of Capital Expenditures (CAPEX) and Operation and
Maintenance Expenditures (OPEX) for a period of 20 years for the different scenarios and
alternatives.

Results and Discussions 67
Figure 31 Cost of water in US$/m3 of water for the different scenarios and alternatives

Results and Discussions 68
In figure 31, the costs of water are shown for the Scenario of 5000 persons. The behaviour of
the chart is similar to the NPV chart. The estimated cost of supply freshwater when there is no
water shortage is around US$ 0.35/m3 (Scenario FW). As the water shortage periods appear
(from Scenario FW+1 to Scenario FW+9 months of water shortage), the cost increases from
US$ 0.39 up to US$ 0.77/m3 because the supply of freshwater is assumed to be insufficient and
water is in need to be supplied by water trucks. Retaking previous analysis of the NPV chart,
in the same way, the cost of water for the alternative of the use of seawater for toilet flushing
(Scenario FW+SW) has a cost of US$ 0.34/m3. And this cost remains for up to 2 months of
water shortage (from Scenario FW+SW+1 and Scenario FW+SW+2 months of water shortage).
Interestingly, when 3 months of water shortage period occurs (Scenario FW+SW+3 months of
water shortage), the water cost is of US$ 0.35/m3. Taking into account that for this Scenario of
5000 persons served, for a period of 3 months of water shortage, there is already a need to
supply freshwater by water trucks and the cost of water shows a slightly increment of one cent
and being the same as that of the baseline scenario (Scenario FW).
The same trend occurs when there is a period of 4 months of water shortage (Scenario
FW+SW+4 months of water shortage) increasing marginally to US$ 0.39/m3. Compared to the
scenario where there is just freshwater supplied and water trucks needed to comply the water
demand for a period of 4 months of water shortage (Scenario FW+4 months of water shortage)
the cost can rise up to US$ 0.53/m3.
The costs continues rising as the water shortage periods extends. The critical scenarios for 6
and 9 months of water shortage presents for scenarios just supplying freshwater and purchasing
freshwater from water trucks (from Scenario FW+6 and FW+9 months of water shortage) costs
of US$ 0.63/m3 and US$ 0.77/m3 respectively. Compared to when a dual water supply system
is introduced and for the same period of water shortage (Scenarios FW+SW+6 and FW+SW+9
months of water shortage) the water cost is of US$ 0.46/m3 and US$ 0.58/m3 respectively. It is
clearly seen that applying this alternative of the use of seawater for toilet flushing can save
between US$ 0.16 and US$ 0.19/m3 of water.
Comparing the different scenarios from 50, 100, 200, 500, 1000, 5000 and 15,000 persons
(Figure 32) there is a potential effect of the economy of scale affecting the amount of water
saved. This assessment shows that increasing the number of people served leads to a lower
amount of freshwater saved, decreasing from 21% to 17% for 50 to 15,000 persons when there
is no water shortage. It is also shown that for 50 up to 1000 persons there is enough water saved
by the use of seawater for toilet flushing to cover up to 3 months of water shortage. But the
latter cannot be achieved when 5000 and 15,000 persons are served because the water
consumption for this population is higher.

Results and Discussions 69
Figure 32 Saved Fresh water by the use of seawater for toilet flushing for the scenarios from
50 up to 15,000 persons
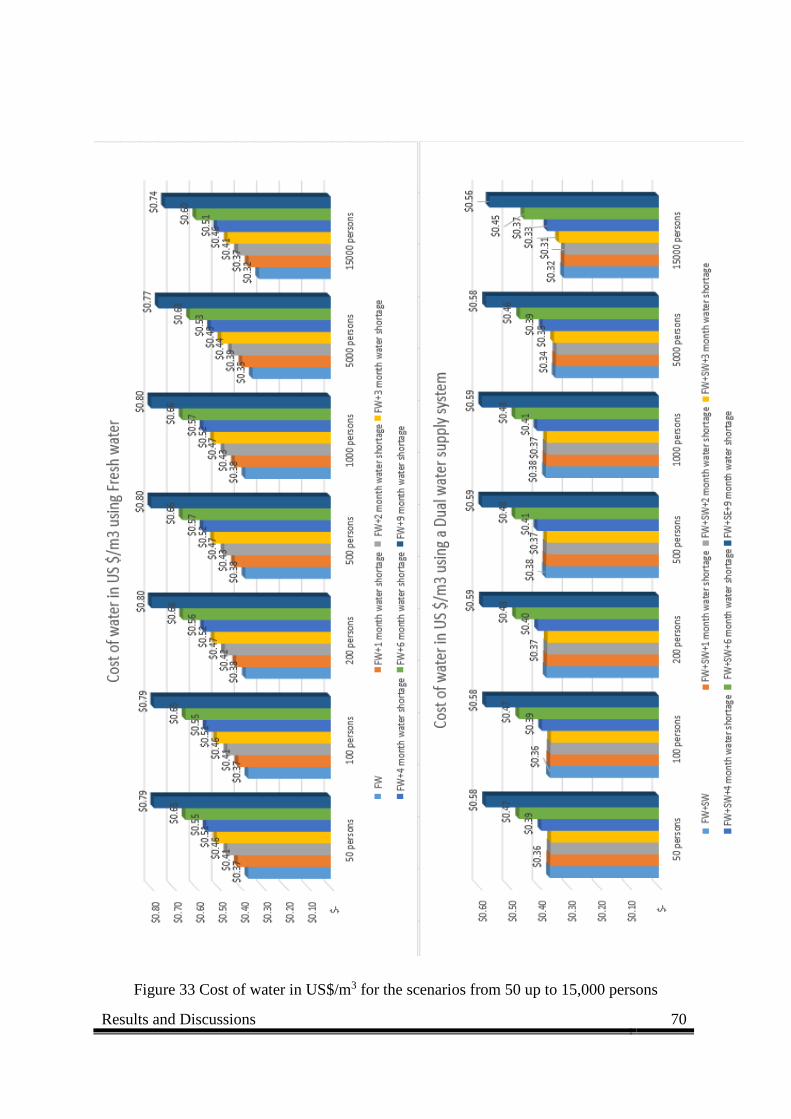
Results and Discussions 70
Figure 33 Cost of water in US$/m3 for the scenarios from 50 up to 15,000 persons

Results and Discussions 71
The cost of water in US$/m3 for the different scenarios is also being affected by the economy
of scale showing that increasing the number of persons served results in a drop in the cost per
cubic meter of water as shown in Figure 33. When the Dual water supply system is applied it
is shown that the cost of water remains the same for up to 3 months of water shortage and with
a lower cost than when using just fresh water. As the water shortage periods extends for 4 ,6
and 9 months there is a slight increment when compared to when there is just water supplied
by fresh water and water trucks.
The cost of fresh water for populations of 50 and 100 persons served, the cost of fresh water is
about US$ 0.37/m3. As periods of water shortage occur this cost can rise up to US$ 0.79/m3,
this is because in this periods the population is being supplied by water trucks. For populations
of 200, 500, and 1000 persons the cost of water is about US$ 0.38/m3 and rises up to US$
0.80/m3 as water shortage periods extends up to 9 months. As mentioned before the economy
of scale affects when the number of people served increments. The cost of water for 5000
persons is of US$ 0.35/m3 and can rise up to US$ 0.77/m3 when water shortage occurs. For
15,000 persons the cost of water is being reduced by 3 cents to US$ 0.32/m3 rising up to US$
0.74/m3 for the most critical scenario of 9 months of water shortage.
The use of seawater for toilet flushing shows a reduction of 1 cent being of US$ 0.36/m3 for 50
and 100 persons. For 200 up to 1000 persons the cost of water for a dual water supply system
is of US$ 0.38/m3. Interestingly, the benefit of the dual water supply system is that this cost
remains for up to 3 months of water shortage. When compared for example 1000 persons served
for a period of 3 months being supplied by fresh water and water trucks the cost is of US$
0.52/m3 and for the dual water supply system is still of US$ 0.37/m3 having US$ 0.15/m3 saved
representing a 28.4% saved. (See Figures 34 and 35). This savings can be obtained because the
water needed to supply the population when water scarcity extends is enough due to the use of
seawater for toilet flushing and the freshwater saved by implementing this alternative.
As the water shortage period extends to 4 months there is a slight increment to US$ 0.41/m3.
This is because there is a need to supply water by water trucks. For the most critical scenarios
of 6 and 9 months of water shortage the cost of water is of US$ 0.48 and US$ 0.59/m3
respectively but even when compared to when just fresh water and water trucks are supplying
the population (US$ 0.80/m3) the saved cost can be up to US$ 0.21/m3 as shown in Figure 34.
For populations of 5000 and 15,000 persons the cost of water is of US$ 0.34 and US$ 0.32/ m3.
In this case the water consumption is of 160 and 175 LPPD as shown in Figure 12. As mentioned
before for this scenarios there is enough water to supply the population up to 2 months of water
shortage. For example the scenario for 15,000 persons the cost of water increments from US$
0.31/m3 to US$ 0.33/m3 (for 3 months of water shortage). For the most critical situation of 9
months of water shortage, the cost rises up to US$ 0.56/m3 (FW+SW+9 months of water
shortage) but compared to when just freshwater and water trucks are used (US$ 0.74/m3) the
savings can be up to 17 cents per cubic meter.
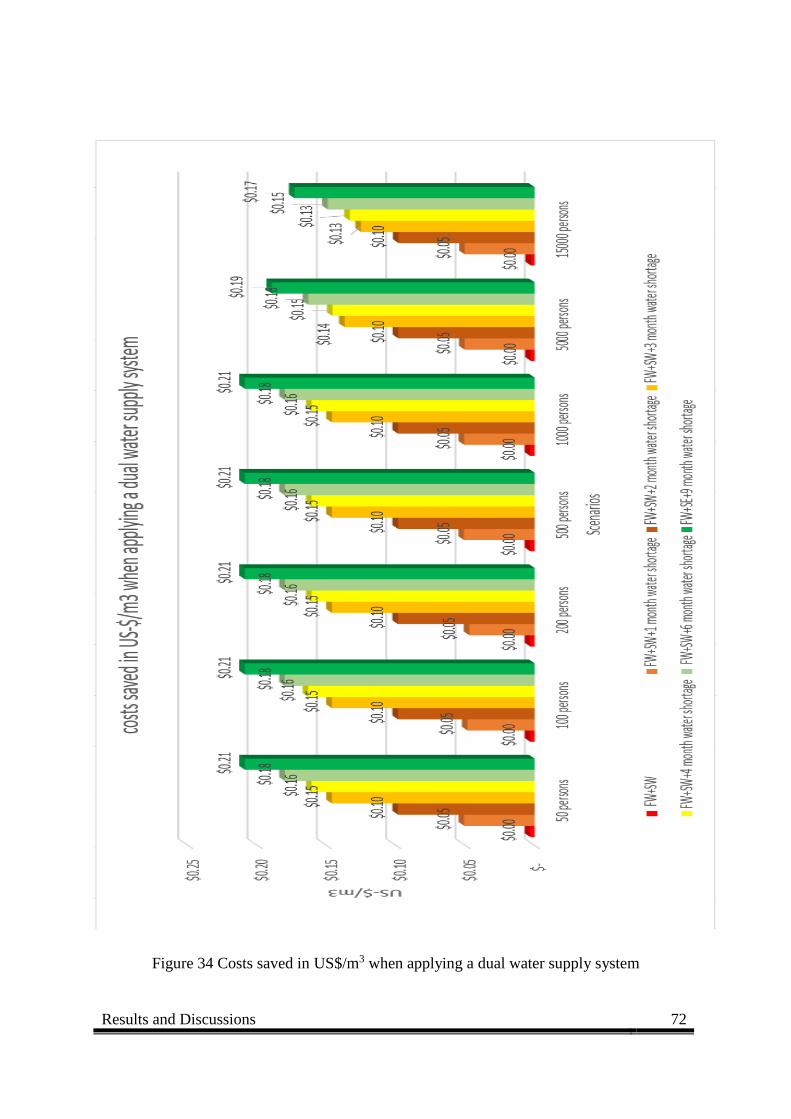
Results and Discussions 72
Figure 34 Costs saved in US$/m3 when applying a dual water supply system

Results and Discussions 73
Figure 35 Percentage of the costs from saved freshwater due to the use of seawater for toilet
flushing

Results and Discussions 74
7.2.2 Case-study of the touristic resort Villa Playa Hermosa: use of seawater for toilet flushing in the tourism sector in Cuba
The touristic resort Villa Playa Hermosa for 54 guests is located in the City of Guanabo. The
critical situation that the city is facing with the intrusion of saline water to the freshwater wells
have already forced them to use saline water. As mentioned before in Chapter 3, the touristic
resorts pays around CUC 780.00 per month which is around CUC $ 9,360.00 (US$
8,143.20/year).
The analysis for this case was based in different scenarios ranging from the only use of potable
water, the introduction of a dual water supply system and evaluating the critical situation when
water scarcity occurs and water shortage periods extends from 3 up to 9 months (See Appendix
2).
Scenario 1 (Actual water consumption of potable water, the maintenance of the
swimming pool and floor washing)
Scenario 2 (Actual water consumption of potable water and the use of seawater for toilet
flushing and other potential uses as the maintenance of the swimming pool and floor
washing)
Scenario 3 (Actual water consumption of potable water and the use of seawater for toilet
flushing and other potential uses as the maintenance of the swimming pool and floor
washing with a 1.5 months period of water shortage)
Scenario 4 (Actual water consumption of potable water and the use of seawater for toilet
flushing and other potential uses as the maintenance of the swimming pool and floor
washing with a 3 months period of water shortage)
Scenario 5 (Actual water consumption of potable water and the use of seawater for toilet
flushing and other potential uses as the maintenance of the swimming pool and floor
washing with a 6 months period of water shortage)
Scenario 6 (Actual water consumption of potable water and the use of seawater for toilet
flushing and other potential uses as the maintenance of the swimming pool and floor
washing with a 9 months period of water shortage)
As shown in Figure 36 and taking into account that the water consumption for each tourist is
around 950 LPPD (18,724.50 m3 per year) and other water uses as the maintenance of the
swimming pool and washing floors is of 1,683.91 m3 per year makes a total water consumption
per year of 20,408.41 m3. The introduction of the Dual water supply system allows savings of
2,275 m3 of water per year representing about an 11 %. Interestingly, saved freshwater by the
use of seawater for toilet flushing is enough to supply a 45 days period of water shortage. When
water shortage extends for a period of 3 months there is a need of purchasing 2,236.30 m3 of
water to water trucks. As water scarcity extends the amount of water needed to be purchased
can rise up to 11,178.60 m3 for a period of 9 months being around the 54.8% of the water
demand.
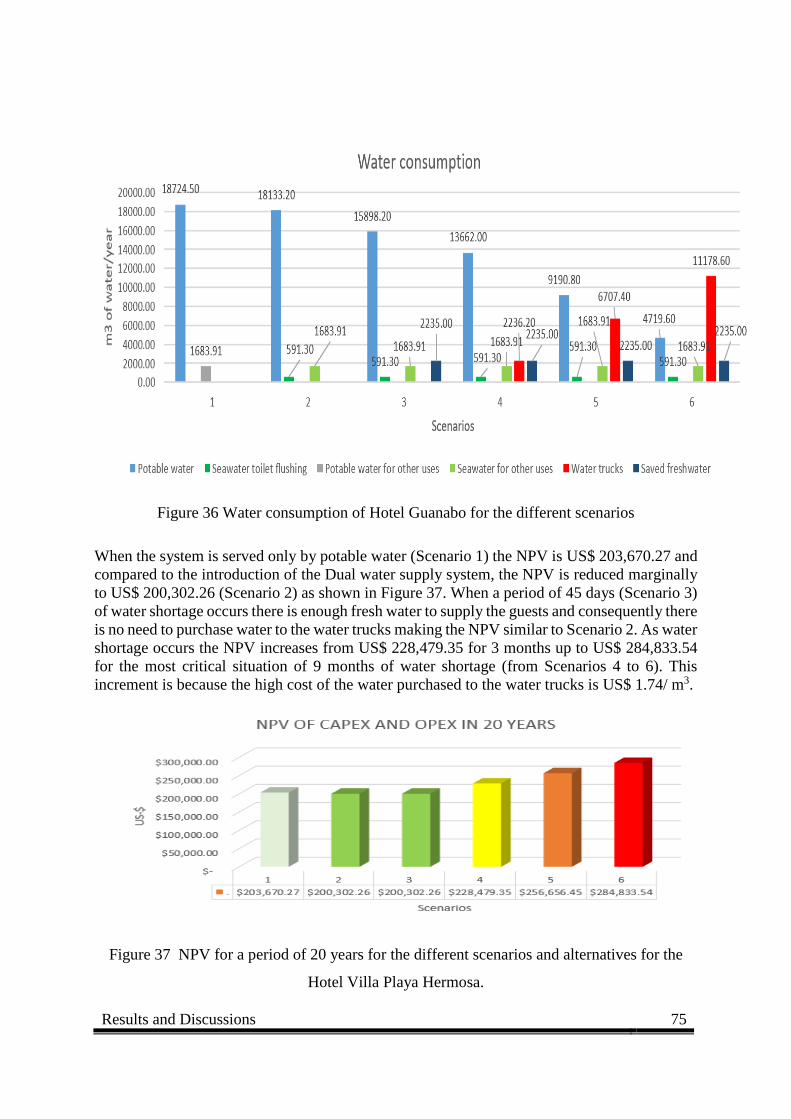
Results and Discussions 75
Figure 36 Water consumption of Hotel Guanabo for the different scenarios
When the system is served only by potable water (Scenario 1) the NPV is US$ 203,670.27 and
compared to the introduction of the Dual water supply system, the NPV is reduced marginally
to US$ 200,302.26 (Scenario 2) as shown in Figure 37. When a period of 45 days (Scenario 3)
of water shortage occurs there is enough fresh water to supply the guests and consequently there
is no need to purchase water to the water trucks making the NPV similar to Scenario 2. As water
shortage occurs the NPV increases from US$ 228,479.35 for 3 months up to US$ 284,833.54
for the most critical situation of 9 months of water shortage (from Scenarios 4 to 6). This
increment is because the high cost of the water purchased to the water trucks is US$ 1.74/ m3.
Figure 37 NPV for a period of 20 years for the different scenarios and alternatives for the
Hotel Villa Playa Hermosa.

Results and Discussions 76
Similarly, the performance indicator was calculated to compare the costs of water of the
different scenarios evaluated. It can be seen in Figure 38 that the trend is similar to the NPV
chart and the cost of water for scenario 1 (the use of only potable water) is of US$ 0.50/m3. The
introduction of the Dual water supply system shows a reduction of 1 cent per cubic meter being
US$ 0.49/m3. This cost remains stable for Scenario 3 in which there is no need to purchase
water from water trucks. When water scarcity occurs for 3 months the increase in the cost is of
7 cents being of US$ 0.56/m3. For a period of 4 months of water shortage (Scenario 4) the cost
is US$ 0.63/m3 and for a 9 months of water shortage is US$ 0.70/m3.
The major benefit of applying this technology in the touristic area is that the total water saved
by the use of seawater for toilet flushing allows a coverage of more or less 45 days of water
scarcity. The water demand for this period is of around 2,235.6 m3 and the fresh water saved
can reach up to 2275 m3. This makes the cost of this alternative lie around US$ 0.49/m3.
Figure 38 Cost of water in US$/m3 of water for the different scenarios and alternatives for the
Hotel Villa Playa Hermosa.
7.2.3 Case-study: wastewater reuse in Punta de Hicacos at La Peninsula de Varadero
In Matanzas, the city of Varadero, in the peninsula of Hicacos, for the wastewater treatment
plant (WWTP) of Hicacos located in the same area, it was proposed to improve the WWTP by
adding a MBR wastewater treatment system. Currently, the WWTP has a conventional
wastewater treatment process of 3 treatment lines with a total installed capacity of 4500 m3/day.
The CAPEX was estimated by focusing on the unit membrane cost since the energy costs was
stated to be included in the OPEX. This are generally the most costly capital equipment for
most large MBR installations (JUDD 2016). CAPEX must necessarily include installation, land
and legal/ administrative costs. As Judd (2016) states the estimation of the installation costs
vary widely between geographical regions and for this study it was focused on the unit of
membranes. However, labour costs for OPEX was gathered. The alternative of upgrading the
conventional wastewater treatment plant with an MBR are being evaluated for a lifetime period
of 20 years.
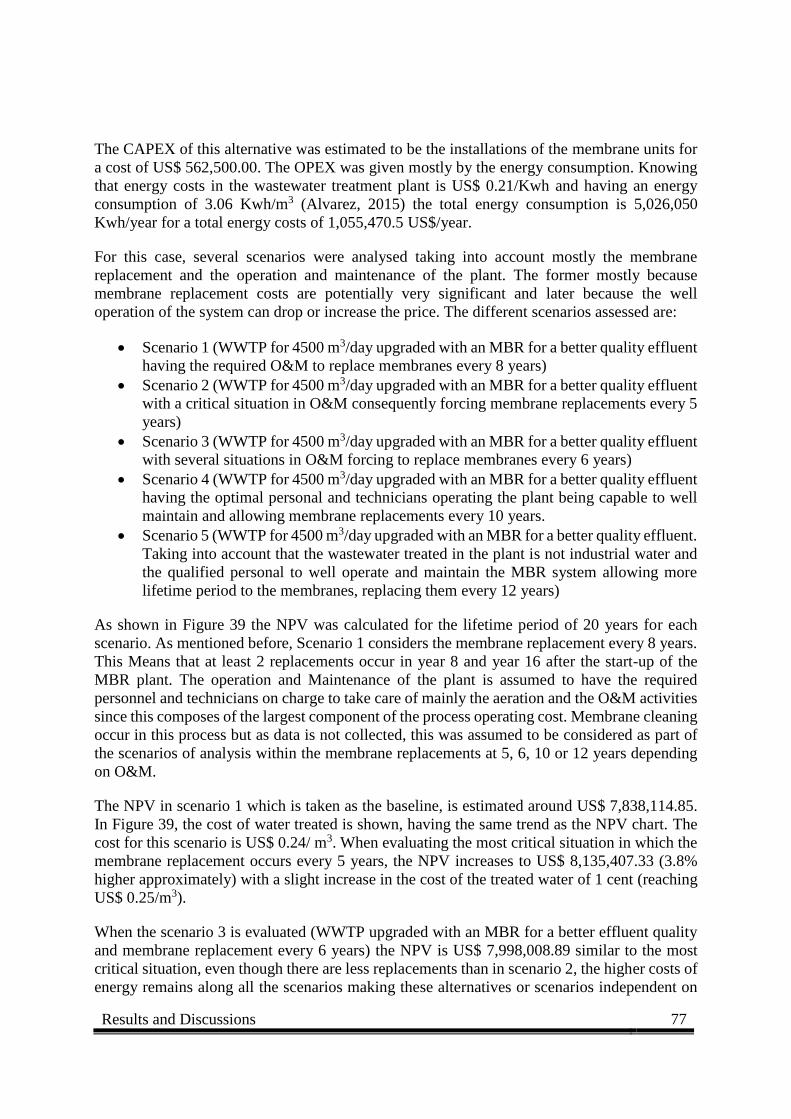
Results and Discussions 77
The CAPEX of this alternative was estimated to be the installations of the membrane units for
a cost of US$ 562,500.00. The OPEX was given mostly by the energy consumption. Knowing
that energy costs in the wastewater treatment plant is US$ 0.21/Kwh and having an energy
consumption of 3.06 Kwh/m3 (Alvarez, 2015) the total energy consumption is 5,026,050
Kwh/year for a total energy costs of 1,055,470.5 US$/year.
For this case, several scenarios were analysed taking into account mostly the membrane
replacement and the operation and maintenance of the plant. The former mostly because
membrane replacement costs are potentially very significant and later because the well
operation of the system can drop or increase the price. The different scenarios assessed are:
Scenario 1 (WWTP for 4500 m3/day upgraded with an MBR for a better quality effluent
having the required O&M to replace membranes every 8 years)
Scenario 2 (WWTP for 4500 m3/day upgraded with an MBR for a better quality effluent
with a critical situation in O&M consequently forcing membrane replacements every 5
years)
Scenario 3 (WWTP for 4500 m3/day upgraded with an MBR for a better quality effluent
with several situations in O&M forcing to replace membranes every 6 years)
Scenario 4 (WWTP for 4500 m3/day upgraded with an MBR for a better quality effluent
having the optimal personal and technicians operating the plant being capable to well
maintain and allowing membrane replacements every 10 years.
Scenario 5 (WWTP for 4500 m3/day upgraded with an MBR for a better quality effluent.
Taking into account that the wastewater treated in the plant is not industrial water and
the qualified personal to well operate and maintain the MBR system allowing more
lifetime period to the membranes, replacing them every 12 years)
As shown in Figure 39 the NPV was calculated for the lifetime period of 20 years for each
scenario. As mentioned before, Scenario 1 considers the membrane replacement every 8 years.
This Means that at least 2 replacements occur in year 8 and year 16 after the start-up of the
MBR plant. The operation and Maintenance of the plant is assumed to have the required
personnel and technicians on charge to take care of mainly the aeration and the O&M activities
since this composes of the largest component of the process operating cost. Membrane cleaning
occur in this process but as data is not collected, this was assumed to be considered as part of
the scenarios of analysis within the membrane replacements at 5, 6, 10 or 12 years depending
on O&M.
The NPV in scenario 1 which is taken as the baseline, is estimated around US$ 7,838,114.85.
In Figure 39, the cost of water treated is shown, having the same trend as the NPV chart. The
cost for this scenario is US$ 0.24/ m3. When evaluating the most critical situation in which the
membrane replacement occurs every 5 years, the NPV increases to US$ 8,135,407.33 (3.8%
higher approximately) with a slight increase in the cost of the treated water of 1 cent (reaching
US$ 0.25/m3).
When the scenario 3 is evaluated (WWTP upgraded with an MBR for a better effluent quality
and membrane replacement every 6 years) the NPV is US$ 7,998,008.89 similar to the most
critical situation, even though there are less replacements than in scenario 2, the higher costs of
energy remains along all the scenarios making these alternatives or scenarios independent on
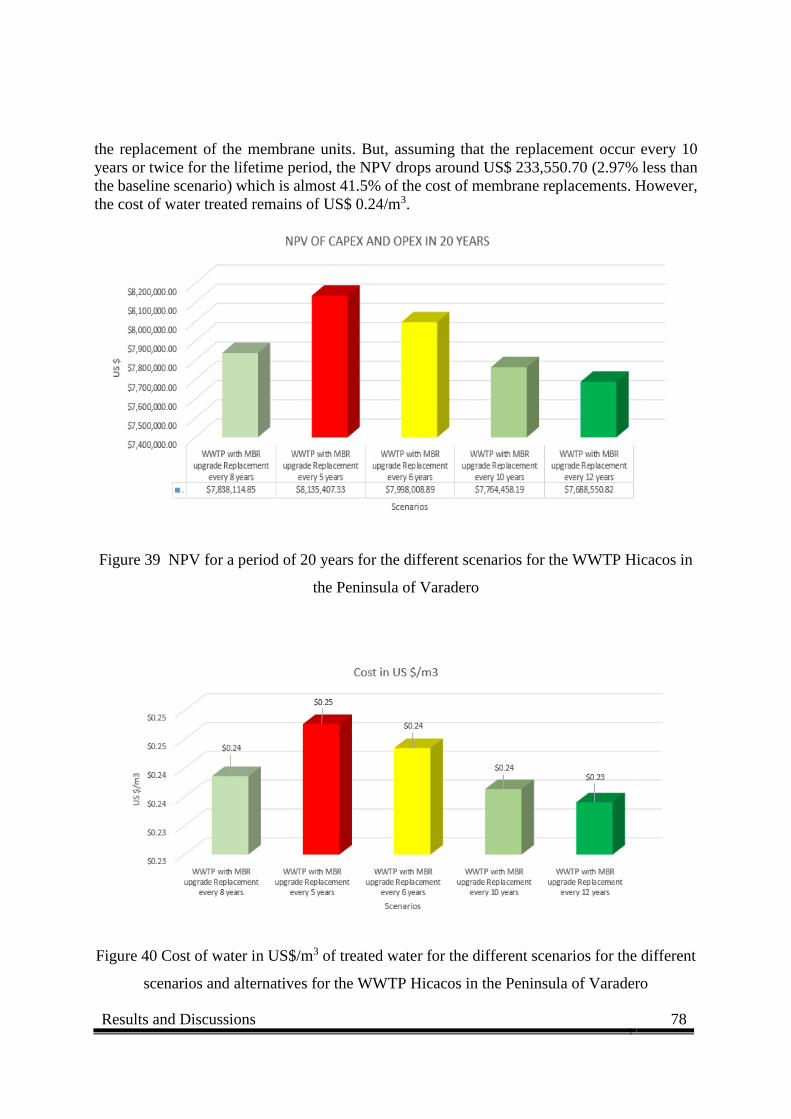
Results and Discussions 78
the replacement of the membrane units. But, assuming that the replacement occur every 10
years or twice for the lifetime period, the NPV drops around US$ 233,550.70 (2.97% less than
the baseline scenario) which is almost 41.5% of the cost of membrane replacements. However,
the cost of water treated remains of US$ 0.24/m3.
Figure 39 NPV for a period of 20 years for the different scenarios for the WWTP Hicacos in
the Peninsula of Varadero
Figure 40 Cost of water in US$/m3 of treated water for the different scenarios for the different
scenarios and alternatives for the WWTP Hicacos in the Peninsula of Varadero

Results and Discussions 79
Is important to consider that Scenario 5 (WWTP upgraded with MBR for a better quality
effluent replacing the membranes every 12 years) could have high chances to occur, if there is
adequate operation and maintenance of course but also taking into account that the water treated
comes from hotels. Thus, because it is wastewater from hotels and resembles or has the
characteristics of domestic wastewater (rather than that of industrial effluents) then it could
have a lower deleterious impact on the membranes. This will allow an extension period of up
to 12 years of membrane replacement showing a cost of water treated of US$ 0.23/m3. This
represents a decrease of 1 cent when compared to previous scenarios.
7.2.4 Case study at Hotel Breezes Jibacoa
This case study assesses the introduction of the combination of both alternatives, the use of
seawater for toilet flushing and the wastewater reuse by upgrading the conventional wastewater
treatment plant with an MBR, to obtain better quality effluent for reuse purposes. The Hotel
Breezes Jibacoa located in Mayabeque has 250 rooms with one bathroom in between. The full
capacity of the Hotel is assumed to be 500 guests for double rooms.
Actually the hotel has a reverse osmosis (RO) treatment plant desalinating 233 m3/day. This
amount of water is insufficient to comply with the water demand of the hotel and thus it is in
the need to get water by water trucks at a cost of US$ 9.57/m3 which is an extremely high price
for water. Monthly costs for a full capacity in the hotel can reach up to US$ 70, 443.16 for the
purchases of water to water trucks.
The CAPEX for the desalinating plant was obtained from Chapter 2 (Literature Review) which
states that the cost of 1m3/day is US$ 1207.00. This includes equipment and materials,
membranes, pressure vessels, pumps, energy recovery, piping and construction. The OPEX cost
considers that, for the use of seawater for toilet flushing, the replacement of the sanitary
accessories is performed twice a year and also the system depreciation by 10% per year with
regard to the cost of investment. The energy cost is significantly high being in the range of US$
0.21/ kWh. The energy consumption is set to be 0.91 Kwh/m3 for a total consumption of the
actual plant of 77,390.95 Kwh/ year.
For the case of the WWTP, the plant capacity is 380 m3/day. Upgrading the plant with an MBR
for a better quality effluent for reuse purposes is one of the objectives to reduce freshwater
demand and alleviate water scarcity. Like in the previous case study of Punta de Hicacos, the
present case-study evaluates the replacement of the membrane as one more of the several
circumstances that can occur regarding operation and maintenance. Membrane cleaning
requirements and operating conditions is set to be the factor determining the membrane
replacement. For this case, the energy cost is the highest cost of those that compose of the
OPEX in the same way like in the case-study in Punta de Hicacos.
Several Scenarios were evaluated to determine the economic feasibility of the innovative
alternatives comprising:
Scenario 1 (Actual Reverse Osmosis water plant and supplying water from water trucks
to satisfy the total water demand of the hotel)
Scenario 2 (Actual Reverse Osmosis water plant, the use of seawater for toilet flushing,
and to meet the water demand of the hotel purchasing water trucks)

Results and Discussions 80
Scenario 3 (Actual Reverse Osmosis water plant with an upgrade of 227 m3/day of the
plant and the use of sea water for toilet flushing)
Scenario 4 (WWTP for 380 m3/day upgraded with an MBR for a better quality effluent
having the required O&M to replace membranes every 8 years)
Scenario 5 (WWTP for 380 m3/day upgraded with an MBR for a better quality effluent
with a critical situation in O&M consequently forcing membrane replacements every 5
years)
Scenario 6 (WWTP for 380 m3/day upgraded with an MBR for a better quality effluent
with several situations in O&M forcing to replace membranes every 6 years)
Scenario 7 (WWTP for 380 m3/day upgraded with an MBR for a better quality effluent.
Taking into account that the wastewater treated in the plant is not industrial water and
the qualified personal to well operate and maintain the MBR system allowing more
lifetime period to the membranes, replacing them every 12 years)
Scenario 1 consists of the evaluation of the actual RO water plant that desalinates 85,045 m3
per year. To comply with the water demand, 88,330.00 m3 of water need to be purchased by
water trucks for a total water consumption of 173,375.00 m3. It is important to highlight that 1
tourists consumes around 950 LPPD. As shown in Figure 41, when evaluating the introduction
of a dual water supply system (Scenario 2), the amount of freshwater saved by the use of
seawater for toilet flushing is of 5,475.00 m3 representing a 3.15%. This value seems to be
insignificant, but when it is compared with the water consumption of a Cuban resident (160
LPPD), this amount of freshwater saved could be used to supply around 115 more persons in
the city. For scenario 3 (Actual RO with an upgrade of 277 m3/day plant to comply with the
water demand of the hotel and the use of seawater for toilet flushing) the water consumption is
being supplied mostly by RO water plant and the use of 5,475 m3/year of seawater for toilet
flushing.
Figure 41 Water consumption of Hotel Breezes Jibacoa
for the different scenarios (Scenario 1 to 3)

Results and Discussions 81
As shown in Figure 42, the NPV for the lifetime period of 20 years was calculated for the
different scenarios. Scenario 1 (which is the actual and critical situation) has the highest NPV
reaching US$ 6,153,880.09. As mentioned before, the need to supply water by water trucks is
of around 50.9 % making this alternative extremely costly. When the introduction of the Dual
water supply system is evaluated, the NPV is US$ 6,015,070.53, this is because there is still a
need to purchase 47.8% of the freshwater to water trucks. Interestingly, when upgrading the
RO water plant to reach a water desalination flowrate of up to 227 m3/day, the NPV is US$
1,130,143.60. This is because the cost of investment of the plant is not that high (US$
273,989.00) when compared with the cost of the water purchased by water trucks (US$
792,922.35 per year).
Figure 42 NPV for a period of 20 years for the different scenarios and alternatives for the
Hotel Breezes Jibacoa
For comparison purposes, the cost of water in US$ per cubic meter is calculated as a
performance indicator. In Figure 43 it can be seen that the trend of the performance indicator
has the same trend like the NPV chart. For scenario 1 the cost of water is extremely high, being
of US$ 1.77/m3. When the introduction of the Dual water supply system is evaluated, the
alternative of the use of seawater for toilet flushing drops the cost by 4 cents (US$ 1.73/m3). In
the same way, like in the NPV chart, the cost of water when upgrading the RO water plant to
reach a flowrate of up to 227 m3/day (Scenario 3) drops almost US$1.40/m3 being of US$
0.33/m3. This is because if this scenario is applied there will be no need to purchase the
extremely high cost water to water trucks and the use of seawater as an infinite source of water
will be used.
Results and Discussions 82
Figure 43 Cost of water in US$/m3 of water for the different scenarios and alternatives for the
Hotel Breezes Jibacoa
As shown in Figure 44, for the scenarios that evaluate the potential upgrade of the wastewater
treatment plant with an MBR the NPV of the baseline is US$ 669,649.67 (Scenario 4). The
Capex in this Scenario is affected mostly by the membrane replacement which in this scenario
occurs every 8 years. The OPEX, as stated previously, is mainly based on the energy
consumption which is almost constant for all scenarios evaluated in this case. For the most
critical scenario (Scenario 5), in which the membrane replacement is needed every 5 years, the
NPV is US$ 694,764.94. In the same way like for the case study of Punta de Hicacos, this
replacement period depends on the operating conditions and maintenance of the MBR. When
evaluated for a replacement period that occurs every 6 years the NPV is relatively similar, this
is because the energy cost is the parameter that has the strongest influence on the total cost of
this alternative.
Figure 44 NPV for a period of 20 years for the different scenarios (Scenario 4 to 7)
for the WWTP of Hotel Breezes Jibacoa

Results and Discussions 83
For comparison purposes, Figure 45 shows the cost of water treated for each scenario. This was
calculated based on the NPV and the total capacity of the WWTP. The behaviour is similar to
the NPV chart, showing that the baseline scenario (Scenario 4) has a cost of US$ 0.24/m3 of
treated water. This cost rises when the periods of replacement of the membranes is reduced to
5 and 6 years (Scenarios 5 and 6) with a cost of US$ 0.25/m3 of treated water for both scenarios.
For scenario 7, that evaluates the membrane replacement period every 12 years, the cost of the
treated wastewater is US$ 0.24/m3. Overall, this is the optimal scenario for the Hotel Breezes
Jibacoa with high operating conditions and qualified technicians to well maintain the MBR.
Figure 45 Cost of water in US$/m3 of treated water for the different scenarios for the different
scenarios and alternatives for the WWTP of Hotel Breezes Jibacoa

Conclusions 84
CHAPTER 8
Conclusions
The innovative alternative water sources as the use of seawater for toilet flushing and the reuse
of wastewater to reduce freshwater demand and alleviate water scarcity are not only
economically competitive under specific conditions (Cuban conditions). But, also has many
environmental and social benefits such as: reducing the problematic of water shortage by
providing a source of water and improving the water quality discharged into surface and
groundwater.
8.1 The use of seawater for toilet flushing in Cuban urban environments
The cost of water supplied with only freshwater under Cuban conditions is US$
0.37/m3 (from Cuban water supply systems from 50 to 1000 persons) and US$
0.32/m3 (for a Cuban system for 15,000 persons), but when water scarcity occurs,
this cost can rise up to US$ 0.79/m3 for a 9 months period of water shortage.
The introduction of the Dual water supply system (use of seawater for toilet
flushing) has a water cost of US$ 0.36/m3 (from Cuban water supply systems from
50 to 1000 persons) and US$ 0.32/m3 (for a Cuban system for 15,000 persons), but
when water scarcity occurs, this cost remains for the first 3 months and in the most
critical scenario can rise up to US$ 0.58/m3 for 9 months of water shortage.
The increase of cost when water scarcity occurs is because there is a need to
purchase water from water trucks at an extremely high cost of US$ 1.74/m3 making
the situation more costly.
Around 26.1 % more people can have sufficient water to satisfy their need with the
saved freshwater by the use of seawater for toilet flushing when no water scarcity
occurs.
When a period of 1 month of water shortage happens, 17.8 % more people can be
served, a 9.4 % more with a 2 months of water shortage and a 1.1 % more people
when there is 3 months of water shortage.
The economy of scale interfere in the cost of water. As more people is served, a
significant reduction can be observed. This is also affecting in the amount of
freshwater saved, because as more people is served, the water consumption is
higher.
8.2 The use of seawater for toilet flushing in the touristic sector
A small hotel of capacity for around 54 persons with a water consumption around
950 LPPD, shows a cost for this alternative of the use of seawater for toilet flushing
of US$ 0.49/m3.
The amount of saved freshwater by the use of seawater for toilet flushing allows a
coverage period of water shortage of 45 days (1 month and a half) remaining with
Conclusions 85
the same cost of water. As water shortage periods extends, the need of purchasing
water to water trucks makes more costly the situation rising this cost up to US$
0.70/m3 for a 9 month of water shortage.
The amount of freshwater saved of 54 tourists by the use of seawater for toilet
flushing and other potential uses as the maintenance of the pool and floor washing
is 2,275 m3/ year, equivalent water volume to supply around 43 locals per year.
8.3 Wastewater reuse by the upgrade of a conventional WWTP with a MBR treatment system
A conventional WWTP of Punta de Hicacos, with capacity of 4500 m3/day, was
evaluated with membrane replacement every 8 years and showed a cost of water
treated of US$ 0.24/ m3.
The water treated in the WWTP is not industrial, after assessments for a replacement
period of 12 years since the treated wastewater is from hotels with domestic
wastewater characteristics (not industrial wastewater) it showed a cost of treated
water of US$ 0.23/ m3 assuming that there is well O&M of the plant, since is the
largest component of the process operating cost.
A WWTP with MBR treatment system of 4500 m3/day produces annually 1,642,500
m3 of treated water ready for reuse. A population of 15,000 in Cuba has a water
consumption of 175 LPPD, the freshwater saved by practicing the reuse of treated
wastewater from this WWTP is enough to supply around 31,031 locals.
8.4 Potential combination of the use of seawater for toilet flushing, reverse osmosis desalination
and the reuse of treated wastewater
A touristic hotel with capacity of 500 persons using a RO water plant supplying
almost 233 m3/day which are insufficient to cover the total water demand forces the
hotel to purchase water at an extremely high price to water trucks of US$ 9.74/m3
showing the actual cost of water around US$ 1.77/m3.
The upgrade of the water plant by 227 m3/day more and the introduction of the Dual
water supply system drops the cost almost by US$ 1.40/m3 making the cost for the
alternative of US$ 0.33/ m3.
Similar to the WWTP of Punta de Hicacos, the WWTP of the Hotel with capacity
of 380 m3/day was evaluated showing a cost of US$ 0.24/m3 of treated water with
membrane replacements every 12 years.
In the hotel, by the use of seawater for toilet flushing, the amount of saved
freshwater is 5,475 m3/year which is enough water to supply around 103 locals.
After the upgrade of the RO desalination water plant in the hotel, the amount of
saved freshwater is equivalent to supply around 3,172 locals.
After the upgrade of the conventional WWTP of the hotel by MBR treatment
system, the quality effluent is ready for reuse. Producing approximately 138,700
m3/year which are equivalent to the amount of saved freshwater needed to supply
2620 locals.
In general, in a hotel of capacity of 500 persons (tourist), the potential combination
of the use of seawater for toilet flushing, the RO desalination and the reuse of treated
wastewater will allow to save enough freshwater (312,027 m3/year) to supply
around 5,895 locals.
Special acknowledgements 86
Special acknowledgements
This research study of the “Economic feasibility analysis of the use of innovative alternative
water sources in Cuba: A study case” was part of the project “Mas Agua Para Todos”. This
project whose English translation is “More Water for All”, and led by Dr. Carlos Lopez
Vazquez from UNESCO-IHE, contributes to the alleviation of water scarcity in Cuba through
the introduction of innovative practices, including decreasing the freshwater demand,
encouraging wastewater reuse, and the use of seawater as second quality water in the urban
environment. This project is funded by the European Union (project No. DCI-
ENV/2010/247-301).

References 87
CHAPTER 9
References
Almond B, Remer DS (1979) Case Study: An Economic Analysis of S&L Savings Certificates
and Treasury-Bill Accounts. THE ENGINEERING ECONOMIST 25: 209-228
Artiles Egües R, Gutiérrez Díaz J (1997) Saneamiento de la cuenca AlmendaresCongreso
Regional de AIDIS para Norteamérica y El Caribe AIDIS, pp. 1-11.
Asanao T, Maeda M, Takaki M (1996) Wastewater reclamation and reuse in Japan: overview
and implementation examples. Waster Science and Technology 34: 219-226
BAC (2009) Brisbane Airport 2009 Master Plan. Brisbane Airport Corporation Pty LTD,
Australia
Tipo de cambio oficial de monedas extranjeras y peso convertible (cuc) con relacion al peso
cubano (cup) (2016) http://www.bc.gob.cu/Espanol/tipo_cambio.asp. Cited 26-09-16
2016
Bouwer H (2000) Integrated water management: emerging issues and challenges. Agri Water
manage: 217-228
CA (2009) Canberra Airport 2009 Water Management Plan. Canberra Airport, NSW, Australia
Chew MYC, Watanabe C, Tou Y (2011) The challenges in Singapore NEWater development:
Co-evolutionary development for innovation and industry evolution. Technology in
Society DOI 10.1016/j.techsoc.2011.06.001
Costa AR, De Pinho MN (2006) Performance and cost estimation of nanofiltration for surface
water treatment in drinking water production. Desalination 196: 55-65
Daigger GT, Rittmann BE, Adham S, Andreottola G (2005) Are membrane bioreactors ready
for widespread application? Environmental science & technology 39: 399A-406A
Diaz-Briquets S, Perez-Lopez JF (1993) Water Development, and Environment in Cuba;A first
look. Cuba in Transition 3
Estimated use of water in the United states (2005)
https://www3.epa.gov/watersense/our_water/water_use_today.html. Cited 7-9-16 2016
Food and Agriculture Organization of the United Nations (2016)
http://www.fao.org/countryprofiles/index/en/?iso3=CUB&subject=4. Cited 09/12/16
2016
Fernandez JMG (2006) Experiencias cubanas en la institucionalizacion del manejo integrado
de cuencas. Voluntad Hidraulica 98: 15-28
Friedler E (2001) Water reuse- an integral part of water resources management: Israel as a case
study. water policy 3: 29-39
Friedler E, Hadari M (2006) Economic feasibility of on-site greywater reuse in multi-storey
buildings. Desalination 190: 221-234 DOI 10.1016/j.desal.2005.10.007
Garcia X, Pargament D (2015) Reusing wastewater to cope with water scarcity: Economic,
social and environmental considerations for decision-making. Resources, Conservation
and Recycling 101: 154-166 DOI 10.1016/j.resconrec.2015.05.015
Google-EarthPRO (2016) US Dept of State Geographer,Cuba.Google, Inc.

References 88
Halaburka BJ, Lawrence JE, Bischel HN, Hsiao J, Plumlee MH, Resh VH, Luthy RG (2013)
Economic and Ecological Costs and Benefits of Streamflow Augmentation Using
Recycled Water in a California Coastal Stream. Environmental Science & Technology
47: 10735-10743 DOI 10.1021/es305011z
Hammer Ø, Harper, D.A.T., Ryan, P.D. (2001) Paleontological statistics software package for
education and data analysis. . Paleontología Electrónica 4
Henze M, Loosdrecht MCMv, Ekama GA, Brdjanovic D (2008) Biological Wastewater
Treatment Principles, Modelling and Design
Hernandez A, Mon (1996) Caracterizacion del abastecimiento de agua potable y saneamiento
de la ciudad de la Habana. Documuent Number 50443-1011/A81/036473. AIDS
(Interamerican Sanitary and Environmental Engineering Association) Sao Paulo, Brazil
and CEPIS (Panamerican Health Organization, Centro Panamericano de Ingenieria
Sanitaria y Ciencias del Ambiente)
HIDROCAPITAL (2003) Vertientes. La sed de la tierra. Revista de Hidrocapital Abril 2003 12
IRDC Idrc (2002) coping with water crisis in Cuba. International Development Research
Centre, Ottawa, ON, Canada
Judd S (2008) The status of membrane bioreactor technology. Trends Biotechnol 26: 109-116
DOI 10.1016/j.tibtech.2007.11.005
Karagiannis IC, Soldatos PG (2008) Water desalination cost literature: review and assessment.
Desalination 223: 448-456
Khawaji AD, Kutubkhanah IK, Wie J-M (2008) Advances in seawater desalination
technologies. Desalination 221: 47-69 DOI 10.1016/j.desal.2007.01.067
Lee CK, Yu CW (1997) Conservation of Water resources-use of sea water for flushing in Hong
Kong. Water SRT-Aqua 46: 202-209
Lesjean B, Tazi-Pain A, Thaure D, Moeslang H, Buisson H (2011) Ten persistent myths and
the realities of membrane bioreactor technology for municipal applications. Water
Science and Technology 63: 32-39 DOI 10.2166/wst.2011.005
Leung RWK, Li DCH, Yu WK, Chui HK, Lee TO, van Loosdrecht MCM, Chen GH (2012)
Integration of seawater and grey water reuse to maximize alternative water resource for
coastal areas: the case of the Hong Kong International Airport. Water Science and
Technology 65: 410-417 DOI 10.2166/wst.2012.768
Linares, R. V., Li, Z., Yangali-Quintanilla, V., Ghaffour, N., Amy, G., Leiknes, T., &
Vrouwenvelder, J. S. (2016). Life cycle cost of a hybrid forward osmosis–low pressure
reverse osmosis system for seawater desalination and wastewater recovery. Water
research, 88, 225-234.
López-Vázquez CM, Brjanovic D, Hooijmans CM, González Díaz OA (2013) Uso de aguas de
segunda calidad en ciclo urbano del agua para las condiciones cubanas. Ingeniería
Hidráulica y Ambiental 34: 86-94
Lu H, Wang J, Li S, Chen GH, van Loosdrecht MC, Ekama GA (2009) Steady-state model-
based evaluation of sulfate reduction, autotrophic denitrification and nitrification
integrated (SANI) process. Water Res 43: 3613-3621 DOI
10.1016/j.watres.2009.05.013
Ludzack FJ, Ettinger MB (1962) Controling operation to minimize activated sludge effluent
nitrogen. Water pollution control federation 34: 920-931
Mekonnen, M. M., & Hoekstra, A. Y. (2016). Four billion people facing severe water
scarcity. Science advances, 2(2), e1500323.

References 89
Mesa-Jurado MA, Martin-Ortega,J.,Ruto,E.,Berbel,J., (2012) The economic value of
guaranteed water supply for irrigation under scarcity conditions. Agric Water Manage
113: 10-18
Miranda JJM (2005) Gestión de proyectos: identificación, formulación, evaluación financiera-
económica-social-ambiental MMEditores
NC-53:91 (1983) Determinacion de la demanda de Agua Potable en la poblacion. . In:
Normalizacion ONd (ed) NC-53:91, Cuba.
Øegaard H (2004) Sludge minimization technologies - an overview. Water Science and
Technology 49: 31-40
PAHO PAHO (2000) Evaluacion de los servicios de agua potable y saneamiento 2000 en las
Americas, Informe Analitico. Washington DC
Plumlee MH, Gurr,C.J.,Reinhard,M., (2012) Recycled water for stream flow augmentation
benefits, challenges, and the presence of wastewater-derived organic compounds. Sci
Total Environ: 541-548
Remer DS, Nieto AP (1995) A compendium and comparison of 25 project evaluation
techniques. Part 1: Net present value and rate of return methods. International Journal
of Production Economics 42: 79-96
Remer DS, Nieto AP (1995) A compendium and comparison of 25 project evaluation
techniques. Part 2: Ratio, payback, and accounting methods. International Journal of
Production Economics 42: 101-129
Romero López TdJ, Lafargue Verdecia D, González Díaz OA, Medina Correa E (2015) Uso de
ósmosis inversa en el hotel Breezes Jibacoa para la desalación de agua de consumo.
Ingeniería Hidráulica y Ambiental 36: 112-125
Scarpaci JL, Coyula RSM (2002) Havana, Two Faces of the Antillean Metropolis. The
University of North Carolina Press, Chapel Hill,NC
Sheikh AHHA (1997) Seawater reverse osmosis pretreatment with an emphasis on the Jeddah
Plant operation experience. Desalination 110: 183-192
Solo-Gabriele HM, Perez AI (2008) Cuba’s water and wastewater sector: environmental
literature, institutional and economic issues and future work. Cuba in Transition 18:
378-389
Tang SL, Yue DPT, Li XZ (2007) Comparison of engineering costs of raw
freshwater,reclaimedwater and seawater for toilet flushing in Hong Kong. Water and
Environmental Journal DOI 10.1111/j.1747-6593.2006.00036.x
Thomas J-S, Durham B (2003) Integrated Water Resource Management: looking at the whole
picture. Desalination 156: 21-28 DOI http://dx.doi.org/10.1016/S0011-9164(03)00320-
5
Torres-Rodriguez R (2015) Estudio de factibilidad para la reutilizacion del agua residual tratada
en la EDAR Hicacos I. Diploma, Instituto Superior Politecnico Echeverria
Tsang WL, Wang J, Lu H, Li S, Chen GH, van Loosdrecht MCM (2009) A novel sludge
minimized biological nitrogen removal process for saline sewage treatment. Water
Science and Technology 59: 1893-1899 DOI 10.2166/wst.2009.194
Water stress versus water scarcity (2014) http://www.un.org/waterforlifedecade/scarcity.shtml.
Cited 09/15/2016 2016
UN W (2006) Wa ter, Facts and Trends. World Business Council for Sustainable Development
United Nations Environment P (2003) GEO Latin America and the Caribbean : environment
outlook 2003 United Nations Environment Programme, Regional Office for Latin
America and the Caribbean, Mexico

References 90
United States Geological Survey.The World's Water. Distribution of Earth's Water (2016)
http://water.usgs.gov/edu/earthwherewater.html. Cited 22/08/2016 2016
Vazquez MF, Echeverria JA, Guerra H, Martinez Y, Cabrera A (2002) Situacion del Programa
Rural Cubano para el abasto de agua y la evacuacion de los residuos liquidos. Ingenieria
Hidraulica y Ambiental XXIII: 57-64
Villasante-Castañeda JE (2013) Valoracion de alternativas para el manejo integral del agua en
zonas costeras. Diploma, Instituto Superior Politecnico Jose Antonio Echeverria
World Food Programme (2016) https://www.wfp.org/countries/cuba. Cited 13/09/16 2016
Wang Z, Wu Z, Mai S, Yang C, Wang X, An Y, Zhou Z (2008) Research and applications of
membrane bioreactors in China: Progress and prospect. Separation and Purification
Technology 62: 249-263 DOI 10.1016/j.seppur.2007.12.014
Water-Supplies-Department (1992) Report on the study on improvement of seawater quality
for flushing purposes. Hong Kong Government
Seawater for flushing. Water supplies Department. The government of the Hong Kong Special
Administrative Region (2016)
http://www.wsd.gov.hk/en/water_resources/water_treatment_and_distribution_process
/seawater_for_flushing/index.html. Cited 16-09-16 2016
WHO (2006) Guidelines for the Safe Use of Wastewater, Excreta and Greywater: Policy and
regulatory aspects1
World-Bank (2007) Making the Most of Scarcity: accountability for better Management Results
in the Middle East and North Africa. The World BankWashington DC 20433
(2016) http://data.worldbank.org/country/cuba. Cited 22/08/2016 2016
(2016) http://data.worldbank.org/indicator/st.int.arvl. Cited 23/08/2016 2016
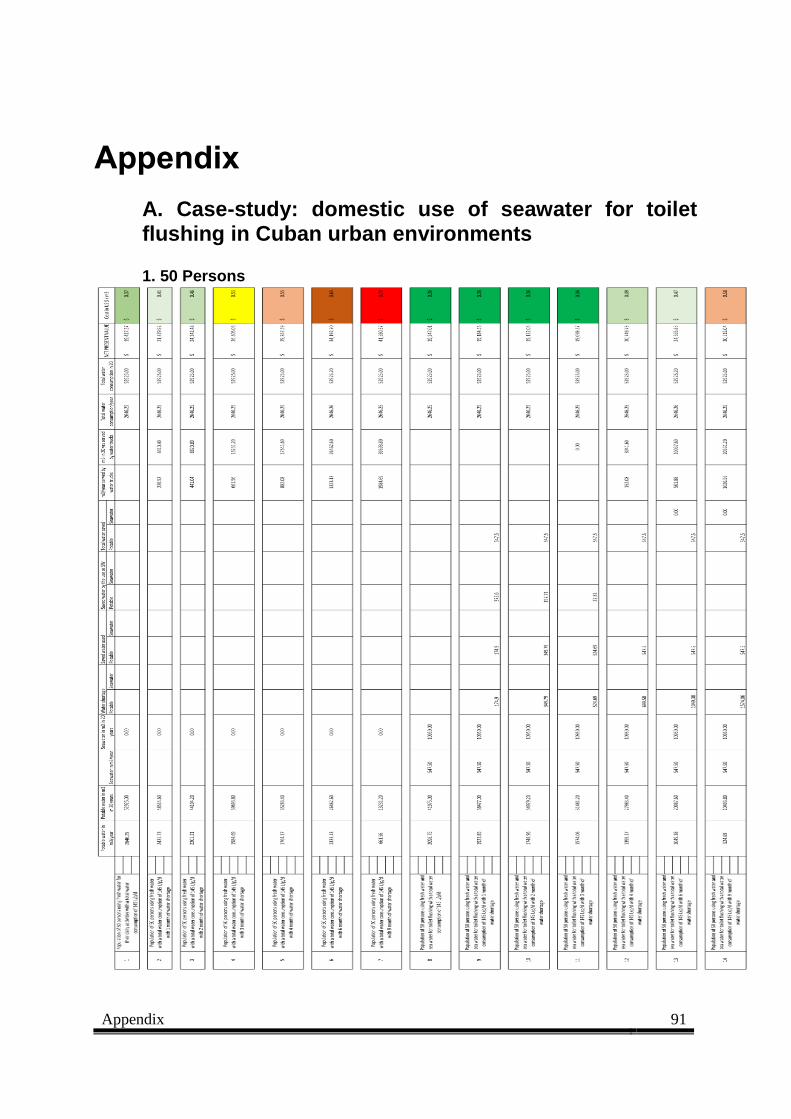
Appendix 91
Appendix
A. Case-study: domestic use of seawater for toilet flushing in Cuban urban environments
1. 50 Persons

Appendix 92
2. 100 Persons

Appendix 93
3. 200 Persons

Appendix 94
4. 500 Persons

Appendix 95
5. 1000 Persons

Appendix 96
6. 5000 Persons

Appendix 97
7. 15,000 Persons
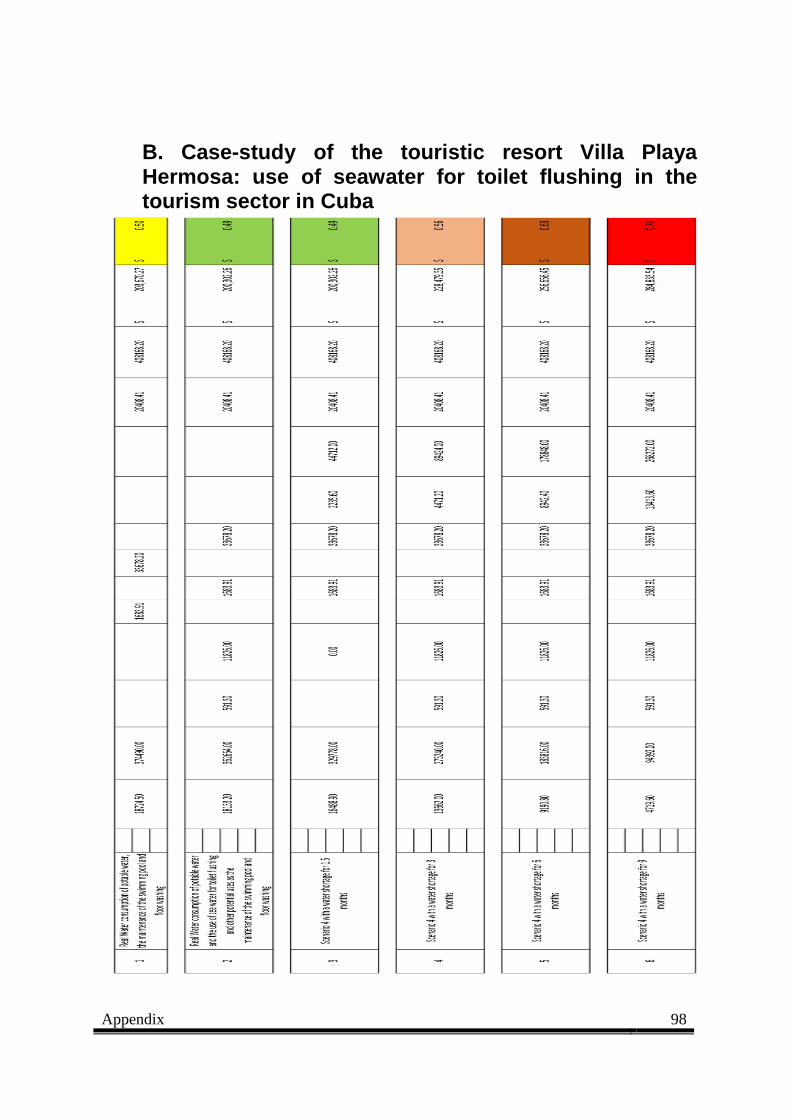
Appendix 98
B. Case-study of the touristic resort Villa Playa Hermosa: use of seawater for toilet flushing in the tourism sector in Cuba

Appendix 99
C. Case-study: wastewater reuse in Punta de Hicacos at La Peninsula de Varadero

Appendix 100
D. Case study at the Hotel Breezes Jibacoa