draft - solano transportation authority · chapter 5 - arterials, highways and freeways goals and...
TRANSCRIPT

DRAFT
Arterials, Highways and Freeways Element

Arterials, Highways and Freeways Element
Table of Contents Executive Summary ...................................................................................................................................... 4
Chapter I - Introduction ................................................................................................................................ 5
Chapter 2 - Purpose ....................................................................................................................................... 8
Chapter 3 – The Arterials, Highways and Freeways System ...................................................................... 11
Section 1: The Arterials, Highways and Freeways System Defined...................................................... 11
1. All roadways in the Solano Congestion Management Program (CMP) network ....................... 11
2. Roadways providing access to and from Transit Facilities of Regional Significance ................ 12
4. Roads providing intercity and Freeway/Highway connections .................................................. 13
5. Other roads critical to providing countywide emergency response ............................................ 13
6. Supporting Facilities in the Right-Of-Way ................................................................................. 13
The RORS System - By The Numbers. .................................................................................................. 14
Interstate Freeways ............................................................................................................................. 14
State highways .................................................................................................................................... 14
Local Arterials .................................................................................................................................... 15
Other Right-of-Way Facilities ............................................................................................................ 15
Chapter 4 – State of the System .................................................................................................................. 18
Chapter 5 - Arterials, Highways and Freeways Goals and Goal Gap Analysis .......................................... 49
Chapter 6 – Arterials, Highways and Freeways Element Resources .......................................................... 58
What is a Roadway? ................................................................................................................................ 58
Roadway Construction – Past Revenue .................................................................................................. 59
Federal .................................................................................................................................................... 59
Table 1: Federal Construction Funds FY 2009-10 to FY 2015-16 ........................................................ 62
State ........................................................................................................................................................ 62
Fuel Tax .................................................................................................................................................. 62

Table 3: State Fuel Tax Rates (Fiscal years 2010-11 through 2016-17) ................................................ 62
Highway Safety Improvement Program (HSIP) ..................................................................................... 63
Highway Bridge Program (HBP) ............................................................................................................ 64
Bonds ...................................................................................................................................................... 64
Table 4: State Funding for Construction ................................................................................................ 64
Regional Funding .................................................................................................................................... 64
Table 6: Regional Funding for Construction ......................................................................................... 65
Local Funding ......................................................................................................................................... 65
The Whole Funding Picture .................................................................................................................... 66
Table 8: Total Construction Funding FY 209-10 through FY 2015-16 ................................................. 66
Conclusions – Construction Funding ...................................................................................................... 66
Roadway Maintenance– Past Revenue ................................................................................................... 67
Table 10: State Gas Tax Funds for Solano Road Operations and Maintenance .................................... 68
Table 11: OBAG 1 Local Streets and Roads Projects............................................................................ 68
Table 12: SHOPP Funds ........................................................................................................................ 69
Table 13: Total Operation and Maintenance Funds ............................................................................... 70
Future Revenue ....................................................................................................................................... 71
Roadway Construction – Future Revenue .............................................................................................. 71
Federal funds ....................................................................................................................................... 71
State funds ........................................................................................................................................... 72
Revenue Gap ........................................................................................................................................... 74
Construction Funds ................................................................................................................................. 75
Table 12: Projected Federal Funds for Road Construction .................................................................... 76
Table 13: Projected State Funds for Road Construction ........................................................................ 76
Table 14: Projected Regional Funds for Road Construction ................................................................. 76
Table 15: Projected RTIF Funds for Road Construction ....................................................................... 76
Table 16: Projected Total Funds for New Capacity Road Construction (best case) .............................. 77
Maintenance Funds ................................................................................................................................. 77
Table 18: Projected Total Funds for Road Operation and Maintenance ................................................ 77
Table 19: Identified Projects on Routes Of Regional Significance ....................................................... 78
Table 20: Identified Projects on RORS that may be Self-Funded ......................................................... 79

Chapter 7 – Arterials, Highways and Freeways Element Policies, Performance Measures and Milestones .................................................................................................................................................................... 81
Chapter 8 – Priorities .................................................................................................................................. 88
Table 21 - TIER 1 ARTERIALS, HIGHWAYS AND FREEWAYS PROJECTS AND PROGRAMS .................... 90
Table 22 - TIER 2 ARTERIALS, HIGHWAYS AND FREEWAYS PROJECTS AND PROGRAMS .................... 92
Table 23 - TIER 3 ARTERIALS, HIGHWAYS AND FREEWAYS PROJECTS AND PROGRAMS .................... 93
Chapter 9 – Moving Forward; or, Making a Better Garment.................................................................. 96
Executive Summary
Fill in once element finalized.

Chapter I - Introduction
“It really boils down to this: that all life is interrelated. We are all caught in an inescapable network of mutuality, tired into a single garment of destiny. Whatever
affects one destiny, affects all indirectly.” Martin Luther King Jr.
Connections – that is the core of the Arterials, Highways and Freeways Element of the Solano Comprehensive Transportation Plan (CTP). The roadways covered by the Arterials, Highways and Freeways Element are what connect us all: not just cities and regions to one another, but also various modes of travel. Roadways handle cars, buses, local delivery vehicles, bicycles, taxies, carpools, heavy equipment haulers and long distance cargo trucks, and local agricultural machinery. The only transportation not on the roadways are trains, ships and airplanes - and access to rail, port and airport facilities all comes by way of roads. And like a garment, the whole is greater than the individual parts, and the failure of one part impacts the whole. There are two other ways in which the Arterials, Highways and Freeways system resembles a garment. First, it must change as the community does or it will no longer fit its purpose. And second, it wears out over time, and proper care and attention can only slow, not prevent, that process. The overarching theme of the Solano CTP is to Strengthen the System and Reduce Stress by developing, operating and maintaining an integrated local and regional transportation system anchored on the I-80 corridor (Interstate highways 80, 680 and 780). The I-80 corridor is the core of the Arterials, Highways and Freeways system, and if its functionality breaks down, the remainder of the system - both locally and regionally - also begins to fail. As a result, the greatest emphasis found in this Element is on the proper form and function of the I-80 corridor.

But the I-80 corridor is not the whole system, and all of the other elements that feed into it, from state highways to local arterials, must also function for the whole system to be useful. A free-flowing
interstate highway system to which no one can gain access is an asset to the region, but not to anyone in Solano County. This means that one of the most vital balancing tasks in the Element is how to allocate resources between the core I-80 system and the connecting highways and arterials.
A second vital balancing task is between system construction and system maintenance. The funding sources for these two tasks are mostly separate (money in a construction account can’t be used for maintenance and vice-versa), and there are currently few local funds available for either purpose.
Expansion of the system adds to the maintenance burden, with one exception: Express Lanes can provide toll revenues that help maintain the roads on which they are located, and have the potential to also support facilities and programs that Reduce Stress by moving single occupant drivers into some form of transit. This is why expansion of the Express Lane system in Solano County is one of the highest priorities in the Solano CTP Transit and Rideshare Element.
Another aspect of AFH investments is how critical they are to local and regional economic health. Even in the modern "knowledge-based" economy of software and social media, movement of goods is THE most basic factor in a healthy economy. Those goods may be Suisun Valley wine grapes, Discovery Kingdom visitors, Genentech pharmaceuticals, Montezuma Hills lambs - or workers at those afore-mentioned Knowledge Economy businesses in Benicia, Dixon and Fairfield. No matter what the goods are or where their trip starts or ends, some of the journey is on the Arterials, Highways and Freeways network. Construction and maintenance costs for the Arterials, Highways and Freeways system are also far greater - as much as an order of magnitude greater - than are those of the Transit and Rideshare system. Decisions on roadways also tend to have a larger influence on land use policy than do Transit and Rideshare or Active Transportation policies and investments. This means that Arterials, Highways and Freeways decisions are some of the most important ones contained in the Solano CTP, and the analysis needed for those decisions should be correspondingly more thorough. This includes using the Solano Napa Travel Demand Model to anticipate where traffic congestion will be in future years, in order to direct projects and programs to those areas that have the greatest anticipated needs. An important difference between the overall Bay Area and Solano County is the question of road network maturity. In some portions of the central Bay Area, the roadway network is at or near maturity - there simply is not room to add more major roadways, and those that exist are at their practical limits regarding
The I-80 system is the core of the Solano transportation system – but it is not the whole of the system
Freight is the economy in motion

the number of lanes. The Arterials, Highways and Freeways Element will use the Solano-Napa Travel Demand Model and land use projections from ABAG, MTC and the Solano cities to project future roadway needs, but will also begin the discussion on what the mature Arterials, Highways and Freeways network in Solano look like should. This brings us to the final potentially controversial area to be addressed in the Arterials, Highways and Freeways element - the concept of "induced demand," or, in a more common phrase, "if you build it, they will come." This is the theory - broadly but not completely accept in the transportation field - that new roadways do not just serve existing traffic, they actually produce new traffic by making trips easier (faster, more reliable). Given the current emphasis at the state and national level on reducing emissions of greenhouse gasses, projects that result in more trips, and therefore more GHG emissions, are seen as counterproductive. But a lack of projects, resulting in more time with vehicles spent idling or moving slowly down a congested roadway, also contributes to the generation of GHG and other air pollutants. In the world of transportation, everything really is interconnected, and most of how those connections occur is by roadway. Pull, push, build, restore or ignore one segment of the system, and all the others are impacted as well. This Element of the Solano CTP provides the best guidance as to which roadways should get which sort of attention.

Chapter 2 - Purpose The Solano CTP: Arterials, Highways and Freeways Element is the STA's foundational document for planning and maintaining the major roadway network that connects Solano's communities with each other and with the broader region. The Arterials, Highways and Freeways Element is designed to serve the following purposes:
• Define the roadway network covered by this element. Those roadways are collectively referred to as Routes of Regional Significance (RORS). This step includes identifying roadways with special state and national designations such as goods movement corridors.
• Identify those roadways eligible to receive funding administered in some way by the STA. • Compare the RORS system of today with the system desired by 2040, and identify the most
important gaps between what exists and what is desired. • Address the costs and funds available to both develop and maintain the current and ultimate
RORS network. • Identify programs and projects that allow for more efficient use of the existing system. • Identify and prioritize projects to expand the RORS system in order to meet anticipated increases
in traffic that cannot be accommodated by increased system efficiency. • Ensure that Solano County efforts are coordinated and consistent with regional roadway plans,
most notably MTC's Plan Bay Area; and, are taking into account state-mandated initiatives such as achieving a reduction in GHG emissions.
Like the other Elements of the Solano CTP, the Arterials, Highways and Freeways Element is designed to be both internally and externally integrated. Internally integrated means that the roadways in the Arterials, Highways and Freeways match those identified in the Transit and Ridesharing and the Active Transportation Elements. Just as importantly, these roadways match those contained in the planning documents of the STA member jurisdictions. Externally integrated means that the Arterials, Highways and Freeways roadway network matches network identified by MTC and Caltrans District 4. Externally Integrated also means matching with the plans of neighboring regions such as Sacramento and San Joaquin counties. The Arterials, Highways and Freeways Element interacts with the long range planning done by the 8 STA member jurisdictions and MTC. The cities and county of Solano can make their land use and transportation plans based in part upon the policies and projects identified in this document, which is in

turn periodically modified to take into account the member agency’s plans. The Arterials, Highways and Freeways Element identifies priorities for Solano County that will be recommended for inclusion in the RTP/SCS, and the RTP/SCS policies and investments will then help shape the Arterials, Highways and Freeways Element when it is updated. The document serves as a guide for local and regional planners and engineers, elected officials and citizen committees, members of the public and advocacy groups. If the Element is Externally Integrated, the question arises – who do we work with on roadway issues? The answer is ……
Who’s Who, and What Do They Do?
United States Department of Transportation (US DoT) - The federal Department, with a Cabinet Secretary, that coordinates all federal transportation activities. Within the Department are a number of specialized agencies. The one that most directly influences this Element is:
• Federal Highway Administration (FHWA) - The FHWA’s role in the Federal-aid Highway Program is to oversee federal funds used for constructing and maintaining the National Highway System (primarily Interstate Highways, U.S. Routes and most State Routes). This funding mostly comes from the federal gasoline tax and mostly goes to state departments of transportation. FHWA oversees projects using these funds to ensure that federal requirements for project eligibility, contract administration and construction standards are adhered to.
Other US DoT agencies that impact surface transportation are:
• Federal Motor Carrier Safety Administration (FMCSA) • Federal Railroad Administration (FRA) • Federal Transit Administration (FTA) • National Highway Traffic Safety Administration (NHTSA)
The Surface Transportation Board (STB) was spun off from the US DoT as an independent federal agency in 2015.
California Department of Transportation (Caltrans) – The state equivalent of the US DoT, and is a part of the California State Transportation Agency (CalSTA). Caltrans is responsible for construction, operation and maintenance of the state highway system, as well as other functions such as operating the state ferry system and oversight of the Capitol Corridor train system. Solano County is in Caltrans District 4, headquartered in Oakland. The California Highway Patrol manages incidents on the State Highway System.
Metropolitan Transportation Commission (MTC) – MTC is the transportation planning agency for the nine-county Bay Area, including Solano County. There are two agencies that are sub-sets of MTC that are important to Solano County’s transportation system and decision making:
• BAIFA is the Bay Area Infrastructure Financing Authority, which oversees the planning, financing, construction and operation of freeway express lanes and related transportation projects.
• BATA, the Bay Area Toll Authority, manages the revenues from the region’s seven state-owned toll bridges and manages the Bay Area's FasTrak electronic toll payment system. BATA funds the toll bridges' operations, maintenance and administration; and the long-term capital improvement and rehabilitation of the bridges.
The Association of Bay Area Governments (ABAG) is similar to MTC, but deals primarily with land use and housing issues such as the every-eight-year Regional Housing Needs Analysis. ABAG also addresses regional earthquake preparedness, environmental concerns and regional trail systems.


Chapter 3 – The Arterials, Highways and Freeways System
Section 1: The Arterials, Highways and Freeways System Defined The Arterials, Highways and Freeways system is the essential roadways and interchanges that connect the cities in Solano County with each other and the region, and provide access to key activity centers. It includes all interstate freeways, state highways, and selected local arterials. The Arterials, Highways and Freeways system also includes those facilities that are in the right-of-way and act to make the system more useable, such as ramp metering lights, overhead message boards, travel advisory and changeable message signs signage and landscaping - collectively known as Intelligent Transportation System (ITS) infrastructure. In many instances, there is significant overlap in facility use between the various modes of transportation in Solano County. For example, an intercity arterial may include a Class 2 bike lane, a state highway may be crossed by students by means of a Safe Routes to Schools pathway, and interstate freeways carry both express buses and large trucks moving freight to a local employment center. The Arterials, Highways and Freeways element addresses the Solano Routes of Regional Significance, which are defined below, and explained in detail in the following paragraphs. The Arterials, Highways and Freeways Element does not address local roadways that are not RORS, even though these roadways are connected to the RORS. Appendix A contains the definition, map and list of all RORS. The criteria for a road to be designated a Solano RORS are:
1. All roadways in the Solano Congestion Management Program network 2. Roadways providing access to and from Transit Facilities of Regional Significance 3. Roadways providing access to and from major employment centers, identified by STA, with
higher traffic volumes 4. Roads providing intercity and Freeway/Highway connections 5. Other roads critical to providing countywide emergency response
1. All roadways in the Solano Congestion Management Program (CMP) network. The CMP "is a mobility monitoring and planning tool for California counties that contain an urbanized area with a population of 200,000 or more." The 1991 CMP legislation allows the local Congestion Management Agency (CMA) to prepare, monitor, and update the CMP. As the CMA for Solano County, the Solano Transportation Authority (STA) has revised the Solano County CMP once every two years since 1991. The CMP network is defined as “all State highways within Solano County and principal arterials, which provide connections from communities to the State highway system and between the communities within Solano County." Appendix A is a list and map showing the CMP network.

2. Roadways providing access to and from Transit Facilities of Regional Significance. The criteria STA has established for Transit Facilities of Regional Significance (TFORS) are:
1. All passenger rail lines, and all passenger train stations, current or planned, identified in an adopted STA Plan.
2. All ferry facilities, including terminals, maintenance docks and fueling stations, current or planned, identified in an adopted STA Plan.
3. Bus stations providing all of the following services: a. Routes to destinations outside Solano County or between two or more cities in
Solano County b. Peak hour headways of 1 hour or less
4. Maintenance and parking facilities for busses providing services identified in 1, 2 or 3 above. 5. Interchanges that provide access to and from the highway system for stations identified in 1,
2 or 3 above.
The Transit and Rideshare Element has a more detailed discussion of TFORS, including a list and map showing all designated RORS.
3. Roadways providing access to and from major employment centers with higher
traffic volumes. Major employment centers, as designated by the STA, are those facilities that employ workers from throughout the county or region, rather than primarily local residents, or
that draw visitors or customers from throughout the county or region, rather than primarily local residents. In addition, they are of sufficient size that they require one or more two-lane arterials to serve their peak-hour traffic demands. The
arterials serving these employment centers are RORS.
There are major employment centers with higher traffic volumes in Benicia (the port and the Benicia Industrial Park, including the Valero refinery), Dixon (the Northeast Dixon Industrial Park), Fairfield (Cordelia Business Park, SR 12 Industrial Park, Fairfield Tolenas Industrial Park, County Government Center and Court complex, Solano Town Center Mall, Anheuser Busch, and Travis Air Force Base), Vacaville (California State Prison-Solano, Vacaville 80/505 Industrial Park and the Factory Stores/Nut Tree area) and Vallejo (Solano County Fairgrounds/Six Flags Discovery Kingdom, Kaiser-Vallejo and Mare Island).

Appendix B contains a map and more detailed description of the major employment centers in Solano County.
4. Roads providing intercity and Freeway/Highway connections. A small number of
arterial roadways provide important, short-length connections between freeways and highways, such as Vaca Valley Parkway between I-80 and I-505 in Vacaville and Lake Herman Road between I-80 and I-680.
5. Other roads critical to providing countywide emergency response. This final RORS category covers other roadways that are important to providing access through chokepoints in Solano County in the event of an emergency, whether that emergency is a short-term event like an automobile accident or a long-term disaster such as a levy breach or a landslide. Several roadways meet this criteria, including McGary Road, parallel to I-80 between American Canyon Road and Red Top Road; Lopes Road, parallel to I-680 from Red Top Road to Lake Herman Road and McCormack Road (and associated shorter roads) parallel to SR 12, between SR 113 and Liberty Island Road.
6. Supporting Facilities in the Right-Of-Way. A RORS consists of more than just the
pavement on which vehicles drive. Other hard-scape features include the curb, gutter, stormwater drainage inlets and sidewalk. Additional elements include signs providing directions and traffic or road condition information, traffic signals, ramp metering loops and lights, and signal priority/preemption equipment. In some cases, equipment also includes emergency call boxes and roadway monitoring cameras. Many of the signs and detectors work together to provide what is referred to as an Intelligent Transportation System (ITS). ITS is meant to reduce congestion by providing drivers with information about road conditions ahead, and by smoothing out the peaks in traffic volume that often lead to roadway congestion on either a local or system-wide basis.
A final element of the right-of-way improvements is landscaping and sound walls. These facilities generally don't impact the performance of the system (although median landscaping and barriers block headlights of oncoming vehicles and reduce head-on accidents). In the case of soundwalls, they do provide a very real benefit to the community by reducing noise impacts and improving community livability.

The RORS System - By The Numbers. Interstate Freeways. The interstate freeway system in Solano County covers 72.9 linear miles and 284.6 lane miles, as detailed below. Freeways have limited access (only provided through grade-separated interchanges) and are designed for high-speed travel. Annual Average Daily Trips (AADT) data is from the 2015 Caltrans traffic volume report.
Designation Start End Linear Miles
Lane Miles Description
I-80 Yolo County Line (Davis)
Contra Costa County Line (Al Zampa Bridge)
43 165
6- to 10-lane divided interstate freeway. Main freeway corridor in Solano County. AADT 116,000 (Solano/Contra Costa county line) to 132,000 (Solano/Yolo county line) trucks average 5.8% of AADT Designated freight corridor
I-680 I-80 (Fairfield)
Contra Costa County Line (George Miller Bridge)
12.5 50
4-lane divided freeway along the Suisun Marsh. AADT 115,000 (Solano/Contra Costa county line) to 70,000 (I-80/I-680 interchange) trucks average 5.3% of AADT Designated freight corridor
I-780 I-80 (Vallejo)
I-680 (Benicia)
6.8 27.2
4-lane divided freeway connection I-80 and I-680. AADT 55,000 (I-680/I-780 interchange) to 57,000 (I-780/I-80 Interchange) trucks average 4.5% of AADT
I-505 Yolo County Line (Winters)
I-80 interchange (Vacaville)
10.6 42.4
4-lane divided freeway, connection I-80 in Solano County to I-5 in Yolo County. AADT 38,000 (I-80/I-505 interchange) to 22,300 (Solano/Yolo county line) trucks average 9.9% of AADT
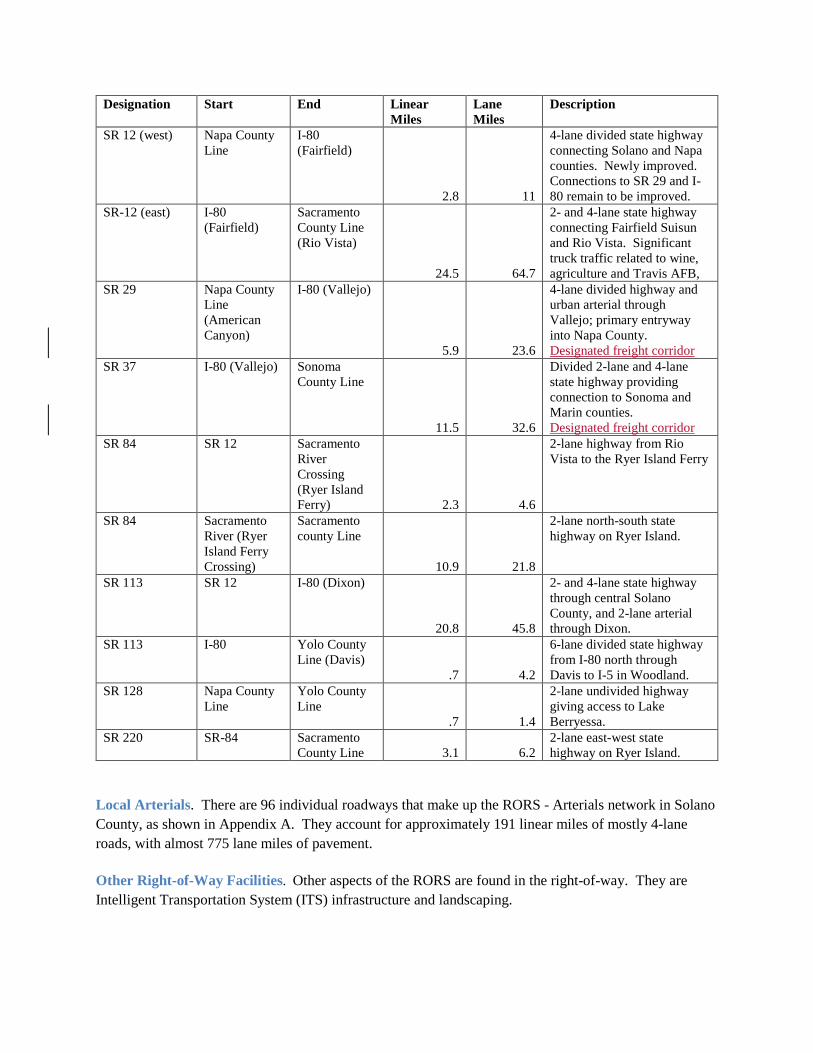
State highways. The state highway system in Solano County covers 83.2 linear miles and 215.9 lane miles, as detailed below. Highways have more access than freeways (both grade-separated and at-grade) and, in some cases, act as city main streets (in Solano County this occurs in Dixon, Rio Vista and Vallejo), and access is frequent and may come from city streets. :
Designation Start End Linear Miles
Lane Miles
Description
SR 12 (west) Napa County Line
I-80 (Fairfield)
2.8 11
4-lane divided state highway connecting Solano and Napa counties. Newly improved. Connections to SR 29 and I-80 remain to be improved.
SR-12 (east) I-80 (Fairfield)
Sacramento County Line (Rio Vista)
24.5 64.7
2- and 4-lane state highway connecting Fairfield Suisun and Rio Vista. Significant truck traffic related to wine, agriculture and Travis AFB,
SR 29 Napa County Line (American Canyon)
I-80 (Vallejo)
5.9 23.6
4-lane divided highway and urban arterial through Vallejo; primary entryway into Napa County. Designated freight corridor
SR 37 I-80 (Vallejo) Sonoma County Line
11.5 32.6
Divided 2-lane and 4-lane state highway providing connection to Sonoma and Marin counties. Designated freight corridor
SR 84 SR 12 Sacramento River Crossing (Ryer Island Ferry) 2.3 4.6
2-lane highway from Rio Vista to the Ryer Island Ferry
SR 84 Sacramento River (Ryer Island Ferry Crossing)
Sacramento county Line
10.9 21.8
2-lane north-south state highway on Ryer Island.
SR 113 SR 12 I-80 (Dixon)
20.8 45.8
2- and 4-lane state highway through central Solano County, and 2-lane arterial through Dixon.
SR 113 I-80 Yolo County Line (Davis)
.7 4.2
6-lane divided state highway from I-80 north through Davis to I-5 in Woodland.
SR 128 Napa County Line
Yolo County Line
.7 1.4
2-lane undivided highway giving access to Lake Berryessa.
SR 220 SR-84 Sacramento County Line 3.1 6.2
2-lane east-west state highway on Ryer Island.
Local Arterials. There are 96 individual roadways that make up the RORS - Arterials network in Solano County, as shown in Appendix A. They account for approximately 191 linear miles of mostly 4-lane roads, with almost 775 lane miles of pavement. Other Right-of-Way Facilities. Other aspects of the RORS are found in the right-of-way. They are Intelligent Transportation System (ITS) infrastructure and landscaping.

ITS Infrastructure. ITS infrastructure consists of cameras, electronic message boards and changeable message signs, ramp metering lights, road sensors and command centers.
• Cameras: Caltrans has closed circuit TV cameras in two locations in Solano County - I-80 just east of the I-80/I-680 interchange, and I-680 just south of the I-80/I-680 interchange. These cameras give Caltrans, CHP and the general public the opportunity to observe traffic conditions in real time at these locations.
• Electronic Message Boards: Caltrans operates 7 electronic message boards/changeable message signs in Solano County. These message boards can have new messages sent to them remotely, allowing them to provide timely information on traffic conditions or other important information. The message boards are located in Vallejo on I-80 and SR-37; in Fairfield on I-80 and I-680; and, in Dixon on I-80. Additional temporary message signs can be placed by Caltrans to warn of construction or lane closures, or for events such as the SR 12 safety campaign in 2008. These are complimented by the Caltrans Highway Advisory Radio (HAR) network.
• Mainline Vehicle Detection (MVD) & Vehicle Detection System (VDS) to conduct
traffic counts.
• Ramp Metering: Ramp metering is the process by which the rate at which cars enter the freeway is controlled by lights on the entry ramps. The system is designed to maintain a stable flow of traffic on the freeway by avoiding temporary clumping clustering of traffic where a large number of vehicles all enter the freeway at the same point and time. Sensors measure the traffic flow on both the freeway and the on-ramp, and red/green lights meter the rate at which cars are allowed to enter the freeway.
Caltrans and Tthe Metropolitan Transportation Commission (MTC) has required the installation, and eventual activation, of ramp metering facilities for all freeway entrances in Solano County, and for some freeway-to-freeway connections. In 2015, Caltrans activated ramp metering for both east-bound and westbound ramps from Redwood Street in Vallejo to I-505 in Vacaville as part of their 2nd phase of Ramp Metering Implementation in Solano County. Metering for the remaining ramps in Solano County (Phase 3) is not funded or scheduled at this time.

• Truck weight and inspection stations. In addition to the ITS infrastructure listed above and found in almost every California county, Solano County also hosts a pair of Caltrans truck scales. These facilities, located on I-80 just east of Suisun Valley Road and the I-80/I-680/SR-12 interchange, weigh large cargo trucks and conduct other safety inspections. The westbound truck scales were constructed in 1958; the eastbound scales were redesigned, relocated and rebuilt in 2013 by Caltrans and STA.
Landscaping and soundwalls. These elements of the RORS system are generally intended to buffer adjoining land uses from the negative impacts of nearby roadways - sound and light. Center-of-the-road landscaping can also buffer the impacts of on-coming traffic by blocking visibility of headlights. Finally, walls and landscaping can provide safety benefits by keeping unauthorized people and vehicles out of road rights-of-way and providing a physical barrier that prevents head-on accidents.
Soundwalls and landscaping on the interstate freeways and state highways are owned and maintained by Caltrans. Similar facilities on arterial roadways are owned and maintained by the jurisdiction in which it is located. The STA does not have an inventory of soundwalls or landscaping in Solano County.

Chapter 4 – State of the System
Arterials, Highways and Freeways State of the System
The previous section of the Arterials, Highways and Freeways Element describes the system - the roadways and other components that make up the Routes of Regional Significance. This next section describes the state of the Routes of Regional Significance system as of mid-2015. The reason for reporting on the state of the system is simple: if the purpose of the CTP - Arterials, Highways and Freeways element is to identify the desired future Arterials, Highways and Freeways system and set policies to get us from where we are to where we want to be, we need to know where we are. The state of the system chapter defines where we are.
The state of the Arterials, Highways and Freeways system is measured in two ways - how well it performs, and how well it is maintained. As with so much of the overall transportation system, these two features interact with each other. Well-maintained roads can handle more traffic, and more traffic leads to more wear and tear on the roadways. Well maintained roads can also handle more transit vehicles quickly, which leads to less wear and tear; and, they support a local economy that generates more taxes that support keeping the roads in good shape.
How Well It Performs
Drivers on Solano roadways know to expect delays in certain locations and times: I-80 westbound around the I-80/I-680/SR-12 interchange in the morning, and in both Vallejo and much of Fairfield in the evening, SR 37 west around the Mare Island Bride in the morning are two some of the most prominent examples. But where else does long-lasting congestion occur, and how is it measured?
The traditional measure of local roadway performance is Level of Service (LoS), usually measured by the Volume to Capacity (V:C) ratio. LoS is measurement is summarized as: every roadway and intersection has a capacity, based primarily on the number of lanes and design speed. During the peak hour of traffic, the number of cars traveling the roadway is measured, and the ratio of capacity to actual volume is measured and reported as a letter grade. When the volume exceeds the capacity - a V:C ratio of 1 or greater - the roadway receives an "F" grade, and is essentially in gridlock.
The following graphic, prepared by the Virginia Department of Transportation, provides a good summary of capacity-based LoS.

There are additional measures of performance for roadways. These include Vehicle Hours of Delay (VHD), which also measures congestion, Vehicle Miles Traveled (VMT) and collision rates. VMT is often used as a proxy for measuring air emissions, especially greenhouse gases; more VMT means more air emissions, so long as the makeup of the fleet remains constant. Collision rates on freeways and highways are reported in comparison to the statewide average for similar roads because this is the standard reporting metric used by Caltrans.
Total volume for a roadway is reported as Annual Average Daily Trips (AADT) – the average number of trips on a roadway, in a specific direction. AADT gives an idea of the volume of traffic on a road. Another important measure is the percentage of trucks in the traffic flow, as trucks have an oversized impact upon congestion due to their large size and limited mobility.
Cities and counties set their own LoS standard; most typically have a standard of C, D or E. LoS C allows for better traffic flow than LoS E, but typically requires wider roadways and more turn lanes. These wider roadways are more expensive to construct and maintain. On the other hand, once a roadways has an LOS that has deteriorated to E, the cost of expanding that roadway to bring the LoS back to C can be prohibitive. The community must then balance several competing outcomes: accepting congestion, funding expanded streets or changing he number, mix and timing of vehicle travel on the road network.
The California Department of Transportation (Caltrans) uses a different measure of congestion. Caltrans Mobility Performance Report and Analysis Program (MPRAP) reports freeway system operations in its Annual Mobility
Caltrans to use the speed of traffic flow as a measure of
system performance

Performance Report (MPR) and in Annual /Quarterly Statistics web releases. The Caltrans methodology is summarized below.
Except for areas where a highway or freeway acts as a ‘main street,’ such as SR 12 in Rio Vista, SR 113 in Dixon and SR 29 in Vallejo, all Caltrans freeways and highways have similar speed limits (55 MPH, 65 MPH or, rarely in Solano County, 70 MPH). This allows Caltrans to use the speed of traffic flow as a measure of system performance. Caltrans uses a standard of 35 MPH; if traffic is moving below that speed, the roadway is considered congested. The MPRAP uses the Caltrans Performance Monitoring System (PeMS) which collects and archives vehicle counts and calculates speeds at all hours of the day and all days of the week and has analytical tools. Delay is determined by comparing the travel times over a segment of roadway at the speed of travel and the threshold speed where congestion is considered to occur.
The following pages show maps and tables showing how well the Routes of Regional Significance system is performing as of May 2015, when STA had actual traffic counts collected on several key arterial roadways. The information comes from a variety of sources: direct measurements taken by the cities and county by placing measuring tubes cross the road (captures all traffic), cell phones, Bluetooth transmitters and other electronic device (measures speed of vehicles with electronic devices onboard), cameras that measure vehicle numbers and occupancy, and even on-site observers using the standard Mark I eyeball and manual counters. As the Bay Area economy improves, all of these systems are expected to show that local and regional traffic conditions are worsening.
Freeway Performance. The Interstate Freeway portion of the Routes of Regional Significance consists of I-505, I-780 I-680 and I-80. The Caltrans corridor reports that form the basis for this summary are provided in Appendix A.
A freeway is considered congested when the speed of traffic flow drops below 35 miles per hour. Congestion is referred to as recurring or non-recurring. Recurring congestion happens on a regular, often daily basis. An example of this is the Bay Bridge toll plaza on a weekday morning. Non-recurring congestion happens irregularly, and is usually associated with a one-time event like a vehicle break-down or an accident. The location of recurring congestion can be mapped and predicted, and engineering solutions such as improved exit ramps can be implemented. Non-recurring congestion occurs because of an unplanned event and cannot be predicted, and the response is usually a mobile service such as a Freeway Service Patrol vehicle. This Recurring and non-recurring congestion measure is a measure used on freeways and highways only. Local roads, because of their frequent controlled intersections, do not measure recurring or non-recurring congestion.
Caltrans has a formal reporting system for recurrent congestion. The MPR also reports Bottleneck locations. PeMS is also used to determine bottleneck locations. PeMS defines a bottleneck as “a persistent and significant drop in speed between two locations on a freeway.” Bottlenecks are determined by the bottleneck identification algorithm in PeMS. This algorithm looks at speeds along a facility and declares a bottleneck at a location where there has been a drop in speed of at least 20 mph between the current detector and the detector immediately downstream. This speed drop must persist for at least five out of any seven contiguous five-minute data points, and the speed at the detector in question must be below 40 mph. While PeMS identifies the detector locations where these conditions are met, these bottleneck locations are only approximate (based on the locations where detectors are present). The

bottlenecks identified through the PeMS Bottleneck Identification Algorithm are filtered by a number of factors to obtain the bottlenecks mapped in the documents below. This filtering was done to create a consistent bottleneck analysis process for all districts, and to only report bottlenecks that are recurrent and causing large amounts of delay. The bottlenecks reported include bottleneck locations that were active on at least 20 percent of all weekdays during the year, persisted for at least 15 minutes on average, and caused more than 100 vehicle hours of delay (VHD) per weekday.
The following pages show Caltrans most recent Average Annual Daily Trips (AADT) maps for Solano County and the surrounding area. Note that these maps are based on 2015 data.

Using more recent data and observations, the figure below shows STA’s analysis of significant recurring congestion on the freeways and highways in the county.
Figure 1 – Recurring Freeway and Highway Congestion in Solano County
Solano Highways
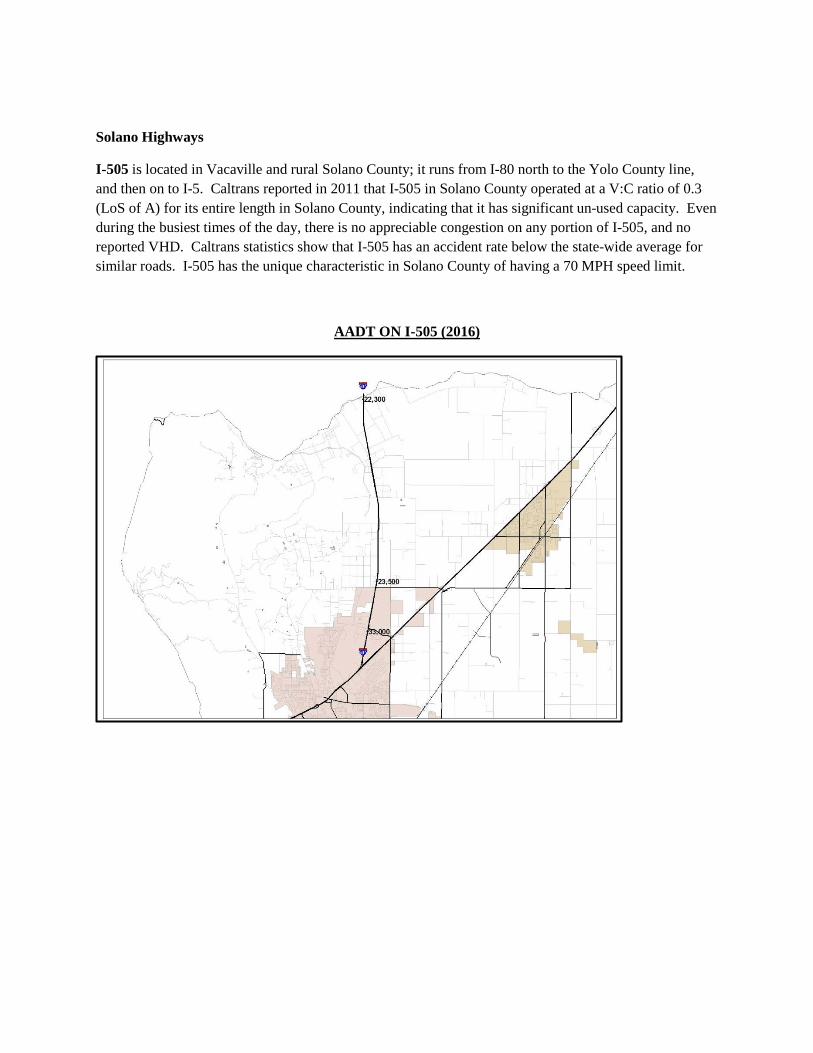
I-505 is located in Vacaville and rural Solano County; it runs from I-80 north to the Yolo County line, and then on to I-5. Caltrans reported in 2011 that I-505 in Solano County operated at a V:C ratio of 0.3 (LoS of A) for its entire length in Solano County, indicating that it has significant un-used capacity. Even during the busiest times of the day, there is no appreciable congestion on any portion of I-505, and no reported VHD. Caltrans statistics show that I-505 has an accident rate below the state-wide average for similar roads. I-505 has the unique characteristic in Solano County of having a 70 MPH speed limit.
AADT ON I-505 (2016)

I-780, in the cities of Benicia and Vallejo, connects I-80 and I-680. Caltrans' 2012 report on I-780 shows the roadway operating at a V:C ration of 0.6 (LoS of C). Reports from city and STA staff and observation of real-time traffic reports show periodic short-term congestion at some off-ramps in Benicia during the evening commute, and at the I-780/I-80 interchange in Vallejo during both morning and evening peak hours, but I-780 generally operates at an acceptable LoS and has some un-unused capacity. There is no reported VHD. I-780 has an accident rate below the state-wide average for similar roads. In 2014, I-780 had a 2014 AADT that ranged from 52,000 vehicles (at the junction with I-680) to 57,000 (western Benicia) to 24,700 (at the junction with I-80), as shown below. Trucks account for approximately 4.5% of the AADT on I-780.
AADT ON I-780 (2016)

I-680, in Solano County runs from I-80 to the Benicia Martinez Bridge (two spans) and the Contra Costa County line; it then continues south, through Contra Costa and Alameda counties to US 101 in Santa Clara County. The 2013 report from Caltrans for I-680 in the cities of Benicia and rural Solano County shows this roadway also operates at a low V:C ratio of 0.7 (Los D). For the portion of the roadway in Fairfield, however, traffic congestion is much more significant at times. Specifically, the north-bound lanes approaching the interchange with I-80 and SR-12 see frequent PM peak congestion, with the worst being found on Friday evenings. The most recently-reported (2010) V:C ratio for northbound I-680 approaching I-80 is only 0.46, but the actual LoS is reported as D because of delays caused by the compact location of the I-680/SR-12 and I-80 merges. Accident rates on I-680 are below the state-wide average for similar roads. Except for Friday evenings, especially on holidays, this degraded ratio and resulting congestion usually do not last for an entire hour.
AADT ON I-680 (2016)
I-80, the main roadway through Solano County, has significant variations in V:C and operations during the course of a typical day. The other freeways all have distinct morning and evening commute directions, while I-80 handles morning commutes to both the east (Davis and Sacramento) and west (Marin/Sonoma and Napa via SR 37 and SR 12, and the inner Bay by the Carquinez bridge), with reverse commutes in the evening. I-80 also handles in-county commuters during approximately the same time.

Friday evening and holiday traffic patterns are similar to regular commutes but with larger peak hour volumes, while weekend traffic typically follows a somewhat different pattern.
I-80 has the only High Occupancy Vehicle (HOV) lanes in Solano County. There is one lane in each direction of travel. They extend from Red Top Road to half-way between Airbase Parkway and North Texas Street, and operate during the morning and evening week-day peak hours.
Unfortunately, the most recent Caltrans report on I-80 in Solano County (approved in 2010) does not include V:C data. Instead, congested areas are shown on report maps, and vehicle hours of delay are reported. The report does indicate 2,200 VHD in 2008 alone. The segments of I-80 just north of the Carquinez Bridge in Vallejo and between the two connections with SR 12 in Fairfield have accident rates above the statewide average for similar roadways; the remaining portions have accident rates below the average.
The following maps show I-80 traffic volumes in the western portion of the county (Fairfield and Vallejo) and he eastern portion of the county (Dixon and Vacaville).
Western Solano County AADT ON I-80 (2016)

Eastern Solano County AADT ON I-80 (2016)

Below is a summary, based upon the 2010 Caltrans report, observations by STA and agency staff, and monitoring of real-time traffic reports such as the Caltrans Quickmap site, of I-80 congestion patterns in Solano County:
Weekday Commute Congestion - morning commute
Eastbound commuters from central and eastern Solano cities do not routinely face significant morning congestion. There are some locations - such as east of Leisure Town Road in Vacaville where the number of lanes drops from four to three - where there are short-term delays, but these do not last for the whole of the peak commute period. Similarly, I-80 EB at the merge point from I-780 sees short-term periodic congestion due to the configuration of the ramp.
Westbound commuters face significant backups over a multi-hour time period during their morning commute. From east to west, recurring periodic congestion is encountered in the Lagoon Valley area of Vacaville and at Airbase Parkway and West Texas Street in central Fairfield. The next point of significant recurring congestion is in the area of the I-80/I-680/SR-12 interchange complex, beginning around the westbound truck scales and continuing to the lane-reduction point west of the SR-12 West (Jameson Canyon) ramp. Finally, there are frequent spots of slow traffic in Vallejo as new vehicles enter the freeway, but the more persistent congestion caused by lane drops or complex weaving movements found in the central county are typically not found in Vallejo during the morning commute.
Weekday Commute Congestion - evening commute
Eastbound commuters face several congestion points in Solano. From west to east, they begin in Vallejo at the I-80/I-780 interchange, where traffic exiting I-80 onto Benicia Road mix with vehicles from I-780 entering I-80 on a short ramp. This mixing of traffic trying to decelerate with traffic trying to accelerate on the same short ramp segment leads to traffic backing up onto I-80. Traffic on I-80 again becomes congested at the Columbus Parkway/SR-37 ramp off of I-80.
Traffic flows smoothly until the I-80/I-680/SR-12 interchange complex; traffic is often congested from this point through Fairfield, as far east as the North Texas Street off ramp or even Cherry Glen Road. The most significant point of congestion is where the freeway width is reduced from 5 lanes to 4 between Air Base Parkway and North Texas Street in Fairfield. Congestion at a smaller scale is also common at the Alamo Drive exit in Vacaville. Friday evening congestion occurs at the same points mentioned above, but lasts longer and extends further back down the freeway.
Westbound I-80 commuters face little in the way of evening congestion in Solano County.
Holiday Congestion
During holidays, particularly the Friday of a three-day weekend and the Wednesday before Thanksgiving, the evening commute congestion points remain the same as a regular week day, but the length of the back-up queues and their duration are both larger. In addition, the lane drop

east of Leisure Town Road in Vacaville is also congested, and the multi-lane drop at Richards Boulevard in Davis (Yolo County) can extend into Solano County.
Weekend Congestion
Weekend congestion on I-80 is mostly variable, depending upon where and when special events (such as the Dixon May Fair or the Solano County Fair) are taking place. However, on Sunday afternoons and evenings, there are three typical congestion spots, all impacting westbound traffic. From east to west, these are in Dixon, from Kidwell Road to as far west as Pitt School Road; in Vacaville approaching the lane drop at the I-505 interchange; and, in Fairfield at the I-80/I-680/SR-12 interchange complex.

Highway Performance. The major elements of the State Highway system in Solano County consists of SR 12, SR 29, SR 37 and SR 113. There are other state routes in the Routes of Regional Significance (SRs 84, 128 and 220), but they experience no significant congestion, and are not analyzed further in this chapter.
SR 12 has two segments in Solano County - from the Napa County line to I-80 (the Jameson Canyon or SR 12 West segment) and from I-80 to the Sacramento County line in Rio Vista (SR 12 East).
AADT ON SR 12 (2014)
SR 12 west (a.k.a. Jameson Canyon) is primarily a commute corridor, with a handful of rural residences, a winery and access to a golf course on the Napa side. The corridor has recently undergone a major expansion from a two-lane highway to a four-lane divided expressway, and past information on congestion, delay and safety is no longer applicable. Anecdotal descriptions of the roadway's operation show that there is no west-bound congestion on SR 12 west in Solano County, while east-bound traffic does experience evening peak hour and weekend congestion backing up from the lane reduction at Red Top Road. The shoulders on SR 12 west are allowed to be used as a bike lane, although connections for bicyclists onto SR 12 are currently inadequate. This is a good example of ‘context sensitive’ application of Complete Streets.
SR 12 east has two areas of congestion - the cities of Fairfield and Suisun City, and approaching the Rio Vista Bridge. In Fairfield and Suisun City, the congestion occurs during the morning commute (westbound) and evening commute (eastbound), and occurs at the controlled

intersections (from west to east, Beck Avenue, Pennsylvania Avenue, Marina Boulevard and Sunset Avenue). The delays are almost entirely caused by the need to stop through traffic on SR 12 so that traffic from side streets can cross or enter on to SR 12. Vehicles may take several light cycles to pass through an intersection - one of the definitions of LoS F. During weekday morning commute hours, congestion is exacerbated by the need of school children to cross SR 12 as they walk from home to school.
The portion of SR 12 in Fairfield and Suisun City exceeds the state average for accidents, primarily due to rear end accidents at controlled intersections. The portion of the roadway between Suisun City and Rio Vista is a double fine zone due to the lack of shoulders, turn pockets and median separation and high number of fatal accidents in the 2007-2015 time period.
In Fairfield, the shoulders of SR 12 are not designed or designated for bicycle or pedestrian use. There are several collector and arterial streets to the north, including West Texas Street, that provide a parallel alternative to SR 12. In Suisun City, there is an extensive network of biked paths on one or both sides of SR 12 to provide bicycle, pedestrian and student travel options. There are no bus turn-outs on SR 12 in Suisun City.
In Rio Vista, traffic on portions of SR 12 stops when the draw bridge is opened to allow water traffic to pass. As documented in the Rio Vista Bridge study of 2010, these back-ups can extend for more than a mile on either side of the bridge. Commercial water-borne traffic is not generally predictable, but recreational traffic (involving smaller boats and therefore shorter span openings) is more common in the summer months. The stopped traffic on SR 12 impacts not only through traffic on the highway, but also in-town traffic that is obstructed by the queued vehicles when trying to cross SR 12. Accidents in this segment do not exceed the state average for similar roadways.
In Rio Vista, the Complete Streets status of SR 12 is variable, but in no place is it high quality. From Summerset Drive to Drouin Drive, there is no access at all due to the lack of shoulders and steep drop-offs or cuts through hills. Once the main urban area of Rio Vista is entered, there is a variable mix of shoulders and sidewalks that can allow for bicycle and pedestrian access along the SR 12 corridor, but there are gaps in this system.
SR 29 in the City of Vallejo runs from the Napa County line south to I-80, near the Carquinez Strait. It is also known as Sonoma Boulevard. SR 29 acts as a primary arterial for Vallejo, including the historic downtown area (Florida Street to Maine Street). SR 29 is crossed by railroad tracks north of downtown near Missouri Street, and south of downtown south of Ryder Street. There is little use of these tracks

right now, so they do not impact traffic flow. If their use increases in the future, they could be a source of additional congestion on SR 29.
Caltrans has not published recent safety data on SR 29 in Solano County.
Traffic on SR 29 is restricted by a large number of controlled intersections and by cross-streets that also carry heavy traffic. In fact, the main characteristic of SR
29 in Vallejo is that it acts more as an arterial street and a downtown main street than as a highway. As a result, traffic congestion on SR 29 in downtown Vallejo is more of a condition than an incident; it occurs at many times of the day, and the duration of the congestion is variable. Some level of congestion is common through the course of the day.
SR 29 through Vallejo does not provide consistent Complete Streets facilities. From Mini Drive south to Lewis Brown Drive, there are shoulders that are adequate for bicycle use, but are not designated as such. South of Lewis Brown Drive, there are sidewalks on one or both sides of SR 29 in many, but not all, areas. South of Redwood Street, sidewalks become commonplace, although on-street parallel parking makes bicycle access difficult. There is adequate room for transit stops. South of Cherry Street, the shoulder is marked by a solid while line, but the shoulder area is still not painted as a bike lane.
Outside of downtown Vallejo, congestion can occur on SR 29 at the intersection with SR 37 during peak traffic periods, but this is not a consistent problem. South of Curtola Parkway, congested traffic is rare.
AADT ON SR 29 (2014)

SR 37 is located in the City of Vallejo and unincorporated Solano County, and runs from I-80 across the Napa River Bridge, and then along the northern edge of San Pablo Bay to the Solano/Sonoma County line. SR 37 is a 4-lane highway with grade separated interchanges from I-80 to just west of the Mare Island bridge, where it drops down to 2 lanes. During the week, congestion on SR 37 occurs in the west-bound direction during the morning commute, as vehicles merge from the two-lane segment to the one-lane segment. The back-up sometimes extends onto the Mare Island Bridge. While the most recent Caltrans document on SR 37 does not contain safety data, the overall impression is of a safe corridor due to the concrete median barrier along its entire Solano County length.
On weekends, congestion on SR 37 can occur at the lane merge as discussed above, but may occur at any time of the day. Congestion is especially common when events are held at the Sonoma Raceway at Sears Point. In addition, occasional congestion can occur in both the west-bound and east-bound direction at Fairgrounds Drive/Marine World Parkway, where visitors to the county fairgrounds and/or the Discovery Kingdom theme park exit and enter the highway. The timing of this congestion is variable, depending upon the opening time of the two facilities.
The White Slough Trail is a Class 1 bike path parallel to SR 37, from SR 29 to Sacramento Street. There are no Complete Streets facilities on the remainder of the route.
AADT ON SR 37 (2014)
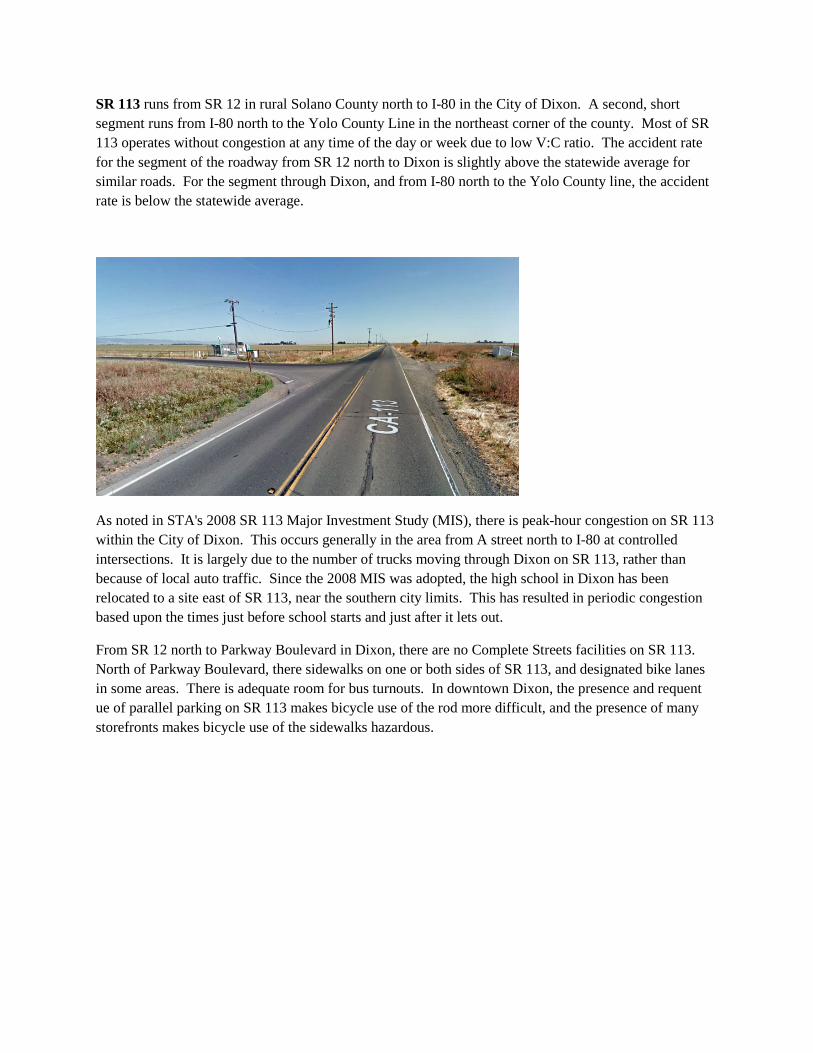
SR 113 runs from SR 12 in rural Solano County north to I-80 in the City of Dixon. A second, short segment runs from I-80 north to the Yolo County Line in the northeast corner of the county. Most of SR 113 operates without congestion at any time of the day or week due to low V:C ratio. The accident rate for the segment of the roadway from SR 12 north to Dixon is slightly above the statewide average for similar roads. For the segment through Dixon, and from I-80 north to the Yolo County line, the accident rate is below the statewide average.
As noted in STA's 2008 SR 113 Major Investment Study (MIS), there is peak-hour congestion on SR 113 within the City of Dixon. This occurs generally in the area from A street north to I-80 at controlled intersections. It is largely due to the number of trucks moving through Dixon on SR 113, rather than because of local auto traffic. Since the 2008 MIS was adopted, the high school in Dixon has been relocated to a site east of SR 113, near the southern city limits. This has resulted in periodic congestion based upon the times just before school starts and just after it lets out.
From SR 12 north to Parkway Boulevard in Dixon, there are no Complete Streets facilities on SR 113. North of Parkway Boulevard, there sidewalks on one or both sides of SR 113, and designated bike lanes in some areas. There is adequate room for bus turnouts. In downtown Dixon, the presence and requent ue of parallel parking on SR 113 makes bicycle use of the rod more difficult, and the presence of many storefronts makes bicycle use of the sidewalks hazardous.

AADT ON SR 113 (2014)

Arterial Performance. The third major element of the Routes of Regional Significance consists of local arterials, and streets serving Transit Centers of Regional Significance and major employment and civic centers. There are 63 individual roadways in the Routes of Regional Significance network. However, the operational section of the State of the System report will focus on only 12 of them; those that provide inter-city connections or critical routes that parallel interstate freeways or state highways. Those roadways are:
• Midway Road, from SR 113 to I-505 • Jepson Parkway, from I-80 to SR 12 • Peabody Road, from Elmira Road to Airbase Parkway • Hillborn Road/Waterman Blvd/Abernathy Road/Rockville Road/Suisun Valley Road,
from I-80 to I-80. • Cordelia Road, from Suisun Main Street to I-680 • Lake Herman Road, from I-680 to Columbus Parkway • Columbus Parkway, from I-80 to I-780 • Military West, from I-780 to E. 5th Street • Fry Road (Leisure Town Road to SR 113) • McCormack, Canright and Azevedo Roads
STA’s Travel Safety Report is being updated and will provide information on roadways that have the higher reported numbers of collisions, whether or not they are Routes of Regional Significance.
Midway Road, from SR 113 to I-505, is a two-lane roadway mostly in unincorporated Solano County; the western 0.6 miles (Leisure Town Road to I-505) are in the City of Vacaville. The road serves businesses and public facilities near the intersection with I-80, and will provide future access to Vacaville's North Village development project. Midway Road is also the access road for the Sacramento Valley National Cemetery, located just east of I-80. For most of its length, the road provides access to agricultural properties and widely-spaced rural residences. The roadway also acts as an alternative to I-80 for traffic between Vacaville and Dixon, or for those seeking to bypass freeway congestion on I-80 in the Dixon and Davis area.
Midway Road does not currently experience significant traffic congestion.
There are no Complete Streets facilities on Midway Road.
Jepson Parkway, from I-80 in Vacaville to SR 12 in Suisun City, is located in four jurisdictions: Vacaville, Solano County, Fairfield and Suisun City. Jepson Parkway is made up of several local roadways: Leisure Town Road, Vanden Road and Walters Road. For several years, Peabody Road will be a portion of Jepson Parkway until the northern extension of Walters Road is constructed.

In Vacaville, Jepson Parkway is a mix of two, three and four lane segments from I-80 to Alamo Drive. South of Alamo, it is a mix of three-lane and two-lane segments to Vanden Road. Vanden Road is a two-lane road from Leisure Town Road to Peabody Road. Peabody Road is a similar mix of two and three lanes. Air Base Parkway is a 4-lane express way, and Walters Road is a divided four-lane roadway.
Peak-hour congestion on the northern and central portions of the Jepson Parkway is episodic, rather than continuous. The southern segments, primarily Air Base Parkway and Peabody Road, often see significant peak-hour congestion. AM peak hour congestion is almost exclusively on southbound Peabody Road, and can extend as far north as the Putah South Canal. During the PM peak hour, the congestion is on Air Base Parkway east-bound at the Peabody Road intersection, and on Peabody Road northbound to the lane-drop at the Putah South Canal.
The Jepson Parkway is a highly-mixed complete Streets corridor, with bus shelters (and room for turn-outs), sidewalks and bike lanes in some areas and nothing but narrow shoulders on others. However, the Jepson Parkway Concept Plan identifies a comprehensive Complete Streets system for the entire length of the roadway when it is completed.
Peabody Road, from Elmira Road in Vacaville to Air Base Parkway in Fairfield, is a six to four lane arterial in the City of Vacaville, a two-lane arterial in the unincorporated portion of the county between the two cities, and a two- and three-lane arterial in the City of Fairfield. As discussed in the Jepson Parkway segment above, Peabody Road periodically experiences peak-hour congestion in the Fairfield segment. In the Vacaville segment, briefer periods of congestion occur at major intersections, but they typically resolve quickly. The two-lane county segment does not suffer from peak hour congestion.
Peabody Road has comprehensive Complete Streets aspects from Elmira Road south through the entirety of the City of Vacaville. In the unincorporated county, it has a designated bike lane. Once in the City of Fairfield, it once again has sidewalks, buke lanes and room for bus turnouts for most of its length, although the area just south of Waterworks Drive is lacking in facilities.
Hillborn Road/Waterman Blvd/Abernathy Road/Rockville Road/Suisun Valley Road is mostly in the City of Fairfield, although some portions are in the unincorporated county. This linked series of roads provides a parallel route to I-80, and can be used to bypass accidents or other major congestion points on the Interstate. This complicated network is broken down as follows:
• Hillborn Road runs for 2.2 miles from North Texas Street to Waterman Boulevard. It is a four-lane arterial that is primarily bordered by residences; other adjacent uses are an elementary school and open space.
• Waterman Blvd runs from Hillborn Road west to Abernathy Road. Its western segment is called Mankas Corner Road. Waterman Blvd. is, like Hillborn Road, a four-lane arterial that serves primarily residential areas, but also abuts open space and agricultural areas.

• Abernathy Road in Solano County runs for 1.8 miles from Mankas Corner Road to Rockville Road. It passes through largely agricultural areas in the Suisun Valley.
• Rockville Road, from Abernathy Road to Suisun Valley Road, is similar to Abernathy Road in all important aspects.
• Suisun Valley Road, from Rockville Road to I-80, is in both the unincorporated county and the City of Fairfield. It is a rural two-lane road in the north, but a four-lane arterial providing access to Solano College and other corporate campuses in the south.
An alternative at the southwest end is to follow Abernathy Road to the Suisun Parkway (a.k.a. the North Connector), and take this road to Suisun Valley Road.
As with many of the other most important Routes of Regional Significance, congestion on this roadway system is variable. The ends of the system are most likely to be congested, especially where the major roadways intersect and are controlled by traffic lights. At the southern end, congestion is most frequently associated with classes at Solano College and workers traveling to/from the office buildings in the area. The southern end is particularly impacted by irregular on-off ramp configuration for Suisun Valley Road and Green Valley Road, and the two-lane bridge that provides for access to east-bound I-80.
The provision of Complete Streets on this series of roadways is, as in other areas, variable. The initial segments of Hillborn Road and Waterman Boulevard have extensive bike lane and sidewalk facilities, with adequate room for transit vehicle stops. Once Waterman Boulevard becomes Mankas Corner Road, the corridor becomes rural, with no sidewalks or transit facilities and no shoulders. The more rural segments along Abernathy and Rockville have shoulders but no sidewalks. Suisun Valley Road does have shoulders and, in some areas, sidewalks and room for transit stops. The Suisun Parkway alternative has Complete Streets facilities for its entire length.
Cordelia Road, from Suisun Main Street to I-680, is located in Suisun City, Fairfield and the unincorporated County. It is a two-lane road of 6 miles length. Cordelia Road also provides an alternative route to the interstate system, allowing local traffic to bypass the I-80/I-680 interchange. It is primarily useful to residents of Suisun City.
Recent information on congestion on Cordelia Road is difficult to assess because of a multi-year closure of the road where it crosses the Union Pacific Railroad Tracks near Hale Ranch Road.
The roadway segment in Old Town Cordelia has sidewalks and bike lanes. The rest of the roadway does not provide Complete Streets facilities.
Lake Herman Road, from I-680 to Columbus Parkway. This 5 mile roadway starts in the City of Benicia, passes through unincorporated Solano County, and connects to Columbus Parkway in Vallejo. It is a two-lane road for almost its entire length, with a four-lane segment extending for a quarter of a mile

southeast from Columbus Parkway to. Lake Herman Road provides an alternative means of access from Vallejo into the Benicia Industrial Park. It does not experience significant recurring congestion.
Lake Herman Road has shoulders useable to bicyclists along its length, with wider shoulders at either end. There are no other Complete Streets facilities at this time.
Columbus Parkway, from I-80 to I-780, is in the City of Vallejo for almost its entire 5.4 mile length; the southern end is in the City of Benicia. It is a 4-lane divide arterial for most of its length, with a 1-mile segment of 2-lane divided roadway from Benicia Road to Regents Park Drive. Columbus Parkway provides access to numerous newer residences long its length, with commercial complexes at each end. It does not experience significant recurring congestion.
Complete Streets facilities on Columbus Parkway do not begin until the intersection with Admiral Callaghan Way. A sidewalk/bike path is then present until Aragon Way, along with shoulders that are adequate for bicycle use. From Aragon Way to the Benicia city limits, a shoulder adequate for bicycle use is present. Within the City of Benicia, there are sidewalks and marked bike lanes.
Military Road, from I-780 to E. 5th Street, is the shortest of the selected Routes of Regional Significance arterials. It is entirely within the City of Benicia, and has a changing configuration - two, three and four lanes. This roadway provides access to residences, schools, and downtown Benicia.
Military Road experiences periodic congestion on its western segment during the opening and closing hours of the adjacent schools, but otherwise uncongested. The downtown area (1st to 5th Street) is much more likely to be congested throughout the day due to high volumes of traffic and closely-spaced traffic signals.
Military Road is an example of a developed Complete Streets corridor, with pedestrian, bicycle and transit facilities along its length, and room for transit stops generally available. Limits on effective bicycle and transit access is found only in the eastern segment of the corridor, where parallel parking is used.
Fry Road (Leisure Town Road to SR 113), provides a link from the Fairfield/Vacaville area to SR 113, and from there to either Dixon to the north or SR 12 and Rio Vista to the south and east. Fry Road is six miles long, has two lanes with no turn pockets and stop signs at only 3 locations – Leisure Town Road, Meridian Road and SR 113. Aside from acting as a link from Vacaville to SR 113, Fry Road also provides access to agricultural areas in central Solano County. Fry Road is occasionally used by recreational bicyclists, but is not designated as a bike route.
McCormack Road, Canright road and Azevedo Road. These three roads in unincorporated Solano County provide a parallel route to SRS 12 between SR 113 and the City of Rio Vista. The form a 4.5 mile route that can be used when road repair work or a collision closes down SR 12. The roadway typically serves agricultural uses and a few rural residences, and is not usually used by bicycle riders.
The three segments are:

• McCormack Road, from SR 113 east for 3 miles to Canright Road. This is a gravel road for its entire length, and has no turn lanes, stop signs or shoulders.
• Canright road, from McCormack to Azevedo Road, is 1 mile long, and is paved, with gravel shoulders. There is a stop sign on Canright Road where it joins McCormack Road.
• Azevedo Road is 0.5 miles long, paved with no shoulders, and has stop signs at Canright Road and SR 12. There is no painted center line except at the intersection with SR 12.

How Well It Is Maintained
As with traffic congestion, there is a traditional measure of a roadway’s physical condition. Another parallel between measures of roadway operation and roadway maintenance is that local agencies and Caltrans use different tools to measure maintenance and condition.
Arterials - For arterials and other local roads, the Pavement Condition Index, or PCI, is the tool to measure and grade roadway condition. PCI is a numeric score, with a PCI of 100 being a perfect, new road with no flaws in the pavement surface or substrata (such as the sand and gravel bed underlying the pavement). PCI also includes the smoothness of driving on the roadway.
Very Good-Excellent (PCI = 80-100)
Pavements are newly constructed or resurfaced and have few if any signs of deterioration.
Good (PCI = 70-79)
Pavements require mostly preventive maintenance and have only low levels of distress, such as minor cracks or peeling or flaking off of the top layer of asphalt as a result of water permeation.
Fair (PCI = 60-69)
Pavements at the low end of this range have significant levels of distress and may require a combination of rehabilitation and preventive maintenance to keep them from deteriorating rapidly.
At Risk (PCI = 50-59)
Pavements are deteriorated and require immediate attention including rehabilitative work. Ride quality is significantly inferior better pavement categories.
Poor (PCI = 25-49)
Pavements have extensive amounts of distress and require major rehabilitation or reconstruction. Pavements in this category affect the speed and flow of traffic significantly.
Failed (PCI = 0-24)
Pavements need reconstruction and are extremely rough and difficult to drive on.
A roadway’s PCI goes down as the surface deteriorates and cracks or holes appear in the pavement. This is especially important because surface flaws allow water to penetrate into and degrade the substrata, which then further accelerates deformation of the roadway surface.

As a result of the shortfall in available funds and the resultant deferral of maintenance and repair work, the 3-year rolling average of PCI in Solano County is:
Roadway PCI deteriorates at a predictable rate, as shown in the following figure:
2014 2015 2016
BENICIA 59 57 54
DIXON 75 72 67
FAIRFIELD 71 71 71
RIO VISTA 57 57 56
SOLANO COUNTY 77 79 81
SUISUN CITY 59 55 64
VACAVILLE 69 69 68
VALLEJO 47 49 53
COUNTYWIDE 64 66 67

Early preventive maintenance of a roadway surface is a key, highly cost-effective method to reduce long-term repair costs. A dollar of maintenance expended when a roadway’s PCI is in the Good range generally avoids $5 needed to repair not only the surface but also the substrata that becomes necessary when the roadway falls into the Fair category.
In 2014, STA adopted its first annual Pothole Report, which reports the PCI for individual roadways throughout the county. The overall PCI for all roadways in each jurisdiction is reported – individual roadways may have a higher or lower PCI than the overall jurisdiction average. A summary of the 2014 Porthole Report is provided below, with the entire report included as Appendix C.
As of June 2014, unincorporated Solano County and its 7 cities are cumulatively investing slightly less than half of the $44M needed annually to maintain local streets and roads with a Pavement Condition Index (PCI) of 60 “fair condition.” To reach the higher PCI goal of 75 “good condition”, the approved goal in the Solano Comprehensive Transportation Plan, $50M additional funds are needed annually over the next 15 years to reach a ‘state of good repair’ – two and a half times more than our current investment. Solano County needs a healthy investment in our roadway infrastructure or pavement quality will decline substantially. More money spent now in long-term roadway maintenance can save our communities millions in the future and strengthen our local economy.
Freeways and Highways - Caltrans rates pavement by visual inspection of the pavement surface and use high tech lasers mounted on a Caltrans vehicle to collect the International Roughness Index (IRI) data; a measurement relating to ride quality. For asphalt pavement visual inspection, samples are taken at the beginning of each highway post mile. For concrete pavement visual inspection, the concrete slabs are continuously rated by their number and type of faults in one mile segments.
Concrete slab faulting is determined by Caltrans engineers who measure the faulting height and number of faults. To monitor the pavement smoothness, a Caltrans vehicle gathers accurate data from speeds of 10 miles per hour (mph) up to 70 mph and the IRI is
computed for every tenth of a mile. The IRI data measures the relative up and down movement of the vehicle. This IRI is collected in each wheel path on the road in inches per mile. The Federal Highway Administration (FHWA) standard of greater than 170 inches per mile is also the Caltrans standard for poor ride.

In 2015, Senate Bill 486 was signed into law by Governor Brown, requiring Caltrans to develop and implement a robust Asset Management Plan by the end of the 2020. The State Highway Operation and Protection Program (SHOPP) is the primary program available to Caltrans to execute the Asset Management Plan. The SHOPP addresses the State’s fix-it-first approach to the State Highway System. For future SHOPP cycles, priorities will be evaluated to match funding and the goals established in the Caltrans Strategic Management Plan, such as Safety, Sustainability, Livability, Economy and Performance. SHOPP projects can address a variety of needs such as Complete Streets, pavement condition, Transportation Management Systems and strategies, the Americans with Disabilities Act (ADA) and sea level rise, depending on project category. The SHOPP is limited to maintenance, safety, and rehabilitation projects on existing State highways and bridges, with generally no projects that add new traffic capacity.
The following information and charts is taken from the 2013 Caltrans State of the Pavement (PCS) report, the most recent that is available. Because it is a statewide report, details for Solano County are not provided.
About 16% of California’s highway miles (7,820 lane miles) are in poor condition, which is an improvement of 9% from the previous PCS, and 12,364 lane miles need low cost preventive maintenance to keep it in good condition. The remaining 29,534 lane miles had no distress. This examination shows that the system is recovering and continues to monitor the health of a 60-year-old system.
The SHS has about 15,000 centerline miles and 50,000 lane miles. In the past, Caltrans conducted the PCS once a year to measure the changes in the pavement condition. However, in 2008, the data collection method was changed to provide pavement performance data for the future Pavement Management System (PMS). The 2013 PCS was started in August 2011 and completed in April 2013.
To maintain the health of the system and assist in tracking pavement performance, the pavement condition data has been mapped to condition states. As shown in Figure 1, there are pictures of the three different pavement condition states with corresponding colors of green, yellow and red. These condition states are:
State 1: Green Pavement in good/excellent condition with no or few potholes or cracks. This pavement requires a preventive maintenance pavement project. State 2: Yellow Pavement is in fair condition with minor surface distress that only needs corrective maintenance. The types of minor surface distress include minor cracking, slab cracking, raveling and potholes. The repair is a corrective maintenance pavement project. State 3: Red Pavement includes major distress (pavement in poor condition with extensive cracks), minor distress (pavement in poor condition with significant cracks), and poor ride only. The severity of distressed pavement is defined by both the visual appearance of the pavement and the IRI. The ride quality is based on the FHWA standard that defines an acceptable IRI as 170 or less. The repair is a Pavement Rehabilitation or Reconstruction, lane replacement project or a Capital Preventive Maintenance (CAPM) project.

Caltrans uses the graphic below in their system planning documents to describe the various levels of pavement degradation and the rehab/restore process

Using the 2011 and 2013 PCS, the health of each Caltrans district can be compared as shown in Figure 2. All districts have improved the health by targeting pavement projects at the right locations and reducing the distressed lane miles. The most notable improvements in distressed lane mile reduction were made by Districts 2, 3, 4, 6, 7 and 8.

As noted in the above-information from Caltrans’ 2013 report, District 4, including Solano County, has seen an improvement in pavement condition. Such projects as the new Jameson Canyon segment of SR 12, the completed repavement of I-80 and I-505 and the on-going repavement of I-680 have substantially improved the average condition of the highways in freeways in Solano County. The most notable exceptions to this are the segment of SR 12 from Somerset drive to Durin Drive in Rio Vista, and SR 113 from SR 12 north into the City of Dixon. Segments of SR 12 in the Fairfield/Suisun City area are also distressed. The following map shows the results of Caltrans’ 2013 Pavement Condition Survey for Solano County.


Chapter 5 - Arterials, Highways and Freeways Goals and Goal Gap Analysis
Create an Arterials, Highways and Freeways System that improves mobility for all modes of travel.
1. Prioritize funds for projects that improve Routes of Regional Significance. o Special emphasis should be given to roadways that support regionally important
economic centers and goods movement.
As has been noted several times, the focus of both the Solano CTP and this Element is the RORS network, anchored by the I-80 network. Roadways that are not identified as a RORS should only receive STA administered funding in extraordinary circumstances.
STA and its member agencies have also identified the further development of the Solano County economy as a priority for a number of reasons, including additional tax revenues (which includes transportation funds) and shorter commutes for Solano residents. To advance this goal, STA has identified locations and projects that merit priority in investing transportation funds.
2. Freeways – support development and operation of a comprehensive Express/HOV network on I-80 and I-680. Express/HOV lanes support a variety of transit modes, help achieve both air pollution and congestion reduction goals, make goods movement easier and, in the case of express lanes, help pay for their own construction and operation. As such, they are one of the most effective tools available to improve mobility in and through Solano County.
3. Seek consistent width to avoid congestion caused by reduction in number of lanes. Traffic modeling, real-time congestion mapping and comments from citizens all identify congestion from lane reductions as both frequent and frustrating. Studies of traffic patterns related to Induced Demand also show that projects that eliminate lane reductions of fill in network gaps are examples of the rare project that does not induce new trips. The major lane reduction back-up areas in Solano County re I-80 eastbound at North Texas Street, I-80 eastbound east of Leisure Town Road, I-80 westbound east of Dixon and I-80 westbound at I-505.
4. Implement Complete Streets appropriate to the context of the roadway.
5. Improve system efficiency through technology prior to adding lanes. System efficiency technologies include advanced notification of congestion and alternative means and routes, arterial street prioritization for transit vehicles and ramp metering. These solutions

are notably less expensive than constructing and maintaining new travel lanes.
6. Identify and preserve needed rights of way for future transportation projects.
7. Develop and implement corridor plans for all interstate freeways and state highways, in conjunction with Caltrans. Develop corridor plans in cooperation with STA member agencies for multi-jurisdictional arterials on the RORS network. Use these corridor plans to prioritize improvements within each corridor. Periodically update the corridor plans and adjust project priorities as needed. Due to the long timeframes needed to deliver roadway projects, priority should generally be assigned to projects that have already been initiated. The various forms of corridor plans allow for sufficiently detailed examination of project locations, features and relationships to act as the best means of assigning funding priorities. Using priories identified in these Plans can also provide the needed long-term commitment to projects that justifies the early investment in planning and design that leads to a project ready for development funds. The STA Board may need to periodically review priorities that come from different corridor plans.
Improve system safety
8. Identify locations on local arterial streets with above-average number or rates of collisions, and fund improvements to reduce collisions to average.
Maintain the system at an appropriate level
9. Invest funds to maintain a minimum Pavement Conditions Index (PCI) of Fair and an average rating of Good on the RORS network. Work with Caltrans to ensure that a similar standard is maintained on the State system.
Pavement conditions are rated by their PCI score with the following ranks: Score Rating 80-89 Very Good 70-79 Good 60-69 Fair 50-59 At-Risk 25-49 Poor The STA currently allocates federal Surface Transportation Program funds for Local Streets and Roads projects through a funding distribution formula. Funding amounts are determined based on a formula using population, lane mileage, arterial and collector maintenance shortfall, and preventative maintenance activity. This is different from the MTC regional formula established in Plan Bay Area, which is based upon population and housing production.

Support the creation of Solano County jobs and other locally-decided land uses
10. Identify roadway improvements that improve goods movement or reduce the impact of goods movement in Solano County.
11. Identify roadway improvements that support retention or expansion of regionally important employment centers, retail centers and civic facilities.
12. Prioritize available funds to support PDAs and PCAs, with special emphasis being given to support for Transit Facilities of Regional Significance.
o All TFORS are in or adjacent to PDAs
Anticipate and mitigate system construction and operation impacts
13. Special emphasis should be given to projects and designs that reduce emissions of criteria pollutants and greenhouse gasses.
o Support projects that reduce emissions of criteria pollutants in sensitive communities or Communities of Concern.
14. Where possible, use the avoidance and mitigation standards from the Solano Habitat Conservation Plan for STA transportation projects.

GOAL GAP ANALYSIS
PURPOSE STATEMENT: The Solano Comprehensive Transportation Plan will help fulfill the STA’s mission by identifying a long-term and sustainable transportation system to provide mobility, reduce congestion, and ensure travel safety and economic vitality to Solano County. Arterials, Highways, and Freeways Element Purpose Statement: Identify existing and future safety, capacity, and enhancement needs for the major arterials, highways, and freeways in Solano County that serve inter-city and interregional travel.
Measuring Goals. The following criteria are used to measure the progress on meeting the goals of the Arterials, Highways and Freeways Element:
• Completed – this is a goal with a specific end-point that has been reached, such as the construction of a facility or the identification of Transit Facilities of regional Significance. This also includes studies that have been adopted (even if recommendations have not yet been implemented) and the initiation of an on-going program.
• Significant Progress – this is a project with substantial completion; typically, more than 10% Plans, Specifications and Estimates (PS&E) but not yet into construction or completion. It also includes studies where data collection and analysis has started, but final recommendations have not been adopted.
• Preliminary Proposal – finally, this category covers projects that have less than 10% PS&E, plans that have not started data collection, and programs that have no administrative and/or financial commitments and no start date.
For some Arterials, Highways and Freeways Goals, the Gap analysis is mixed: Significant Progress in terms of policy establishment, but only Preliminary implementation. This is largely a function of the on-going significant shortfall of funding for both new projects and maintenance of existing facilities.
Goals. Goals are the milestones by which achievement of the Purpose Statement are measured. In order to implement the Arterials, Highways, and Freeways Element of the overall purpose of the Solano CTP, the following goals are established:
Create an Arterials, Highways and Freeways System that improves mobility for all modes of travel.
15. Prioritize funds for projects that improve Routes of Regional Significance. This goal has seen Significant Progress. STA funding choices have been focused on RORS, but STA staff reports and recommendations do not routinely identify to the TAC and Board whether or not a roadway is an RORS.
o Special emphasis should be given to roadways that support regionally important economic centers and goods movement. Preliminary Proposal – Formal identification of a goods movement (aka freight) network is a relatively new task, both at a local and a regional level. However, the National Freight Strategic Plan was recently completed and does include I-80 on the National Highway Freight Network. Additionally, the California Freight Mobility Plan was adopted in December 2014. I-80 and State Route 12 corridors are on the State freight network. In addition, MTC has recently completed a regional goods movement plan, and this complements goods movement investments

efforts at the state and national level. STA has significantly invested in goods movement infrastructure in the past, notably the I-80 Eastbound truck scales in Cordelia and the first construction Package of I-80/I680/SR 12 Interchange. As the routes of regional significance definition has been expanded to include roadways serving major economic centers in Solano County, this will increase the ability of STA to make future investment decisions in projects that support goods movement. STA will use information from these plans to help further identify and seek funding for goods movement facilities. It should be noted that goods movement also includes rail and ship born traffic, and not just vehicles on roadways.
16. Freeways – support development and operation of a comprehensive Express/HOV network on I-80 and I-680. Preliminary Proposal. A HOV lane extends for 8.7 miles in each direction on I-80 (Red Top Road to Air Base Pkwy), and design funds have been allocated to convert the existing HOV lanes to Express lanes and extend them past I-505. In addition, the Express Lane connector ramps in the I-80/I-680/SR-12 Interchange complex and the actual construction of Express Lanes is proposed for regional funding in Plan Bay Area. The remaining portions of the network are from Vacaville to the Yolo County line, through the City of Vallejo, and along the length of I-680 in Solano County. MTC has indicated that the project will be included in Plan Bay Area, but currently no additional funding for project implementation has been approved.
17. Seek consistent width to avoid congestion caused by reduction in number of lanes. Preliminary Proposal. This goal is a direct response to comments received during the public outreach performed by STA in May – October of 2015 and to observations included in the Arterials, Highways and Freeways State of the System report. Most of the significant areas of recurring delay on the interstate freeway and the state highway system are found where the number of lanes is reduced. One major drop lane location is along Eastbound I-80 at Air Base Pkwy. This drop lane will be removed one the I-80 Express Lanes are constructed past I-505. This project will reduce the congestion caused by the drop lanes at this location.
18. Implement Complete Streets appropriate to the context of the roadway. This goal has seen Significant Progress in terms of Policy. Most Solano jurisdictions have complete streets Incorporated into their General Plan, Zoning Ordinance, or have a resolution committing to complete streets implementation. This means new development proposals have the opportunity to fully incorporate complete streets standards. However, No jurisdiction in Solano County has chosen to adopt a Complete Streets Plan that designates specific streets that will require which facilities in order to implement the ideals of complete streets. Implementing this goal will be an on-going activity for the County. Preliminary Proposal in terms of implementation. Complete Streets features have been incorporated into the construction of roadways such as Military West, Wilson Avenue, Suisun Parkway and Jepson Parkway. Most Routes of Regional Significance were constructed before Complete Street became a requirement, and require some sort of retrofit to properly accommodate all forms of transportation. Jurisdictions have typically not updated their standard specifications to include a complete streets standards.
19. Improve system efficiency through technology prior to adding lanes. Significant Progress. In 2010 the STA adopted the Solano Highways Operations Plan. This Plan identified ITS strategies to improve operations along the I-80 corridor through lower cost capital investments.

Implementation of the Plan has been on-going through the investments of Ramp Metering from Fairfield through Vacaville. Further, pavement detection loops along I-80 were installed as part of the major roadway rehabilitation work that was completed. Recently MTC is developing a Managed Lanes Implementation Plan (MLIP) that will link transit through the corridor to increase through put.
20. Identify and preserve needed rights of way for future transportation projects. Significant Progress for four projects. Right-of-Way has been identified and/or set aside for the Jepson Parkway, North Connector, Vaca Valley Parkway and I-80/I-680/SR-12 projects.
Preliminary Proposal for other projects. Even though this is a Goal in the adopted Solano CTP – Arterials, Highways and Freeways element, no specific steps have been taken to implement this Goal for projects aside from those listed above. However, the I-80/I-680/SR 12 Interchange environmental Document has been completed, that can serve as the basis for land development restrictions within the identified foot print of the project.
21. Prepare and periodically update corridor studies to identify and prioritize specific projects. This goal has seen Significant Progress. Corridor plans have been completed for I-80, -680 and -780: SRs 12 and 113; and some corridor planning work has been done for SR 29. Planning work is underway for SR 37. The only major roadway lacking recent corridor planning is I-505, and the conditions and volumes on I-505 place this route on a low priority for a corridor study; the existing Caltrans Interstate 505 Corridor Plan is sufficient at this time. Similarly, roadways such as SRs 84, 128 and 220 are adequately covered by Caltrans documents, and do not require additional work by STA. A schedule or set of conditions to trigger updates of these plans has not been developed. Staff is recommending that each corridor plan be reviewed for minor updates every five years to update traffic volumes and the status of implementation with a more detailed update every ten years.
Improve system safety
22. Identify locations on local arterial streets with above-average number or rates of collisions, and fund improvements to reduce collisions to average. This goal has seen Significant Progress. The STA adopted a Solano Travel Safety Plan in January of 2016; this was an update to the 2005 Solano Travel Safety Plan. Forty-five projects identified in the 2015 plan have been completed. Recent corridor studies, such as the SR 12 multi-jurisdictional study, have gathered and analyzed safety and accident data. However, there is not a standard format for gathering and analyzing such data, and not all corridor plans of other studies have up-to-date safety information. In addition, STA will continue to work with Caltrans to identify and address portions of the freeway and highway system with above-average collision rates or conditions that can increase the likelihood of severe or frequent collisions.
Maintain the system at an appropriate level
23. Seek to fund an average PCI rating of all RORS as 75, with no RORS being rated below 60. This goal has seen Significant Progress in terms of policy and focus. The adopted 2005 Solano CTP – Arterials, Highways and Freeways element does not have a PCI Goal. MTC’s 2013 Plan Bay

Area has a PCI goal of 75. The Solano County Pothole Report, first adopted in 2014, also contains information on the PCI of local roadways and the funds needed to maintain or improve that PCI, but does not call out the PCI of the RORS. This is a Preliminary Proposal in terms of implementation. Establishing a target PCI is only a first step. The next task is to identify those roadways that fall below the target PCI. The 2014 Solano pothole report, which is based the identification of each segment using Street Saver Software. The 2014 Solano pothole report also identifies the trend in PCI over the last five years. Those communities building new roadways have seen an increase or steady PCI. Those strictly seeking to maintain existing roadways, without the new roadways associated with new construction, have seen their PCI decrease. PCI decreases can be largely attributable to a substantial reduction in state gas tax revenues provided to the cities and county needed to achieve the PCI targets established in the Solano CTP. Information in the 2014 pothole report shows that, at the current funding levels, the existing PCI for local streets and roads and arterials cannot be maintained. The Solano Pothole Report shows an annual shortfall of $24 million dollars per year simply to maintain current PCI of 65. In order to improve the PCI and eventually gain the target of 75, an additional $50 million per year in new revenue for local streets and roads maintenance would be required.
24. Work with Caltrans to ensure that a similar standard is maintained on the State system. This goal has seen Significant Progress in terms of Policy and Implementation. Caltrans rates pavement by visual inspection of the pavement surface and use lasers mounted on a Caltrans vehicle to collect the International Roughness Index (IRI) data, and has set a target of an IRI of 170 inches or less per mile. Funding for maintenance of the state highway system is done throughout the SHOPP. While the SHOPP faces a situation similar to local roads maintenance; namely, lack of funding. Caltrans does not currently have adequate funding to maintain the entire state freeway and highway system at the desired level. Solano County has however, had recent significant SHOPP investment along I-80, and I-680, and SR 12 in recent years.
Support the creation of Solano County jobs and other locally-decided land uses
25. Identify roadway improvements that improve goods movement or reduce the impact of goods movement in Solano County. Preliminary Proposal. Both MTC and the Alameda County CMA have completed Goods Movement plans, and there are freight plans at state and federal levels as well. These plans cover the gamut of goods movement modes – road, rail, port and air. All four of these modes are present in Solano County. At every level of goods movement planning (Federal, State and Regional), the I-80 / I-680 / SR-12 interchange is identified as a key facility. In addition, the I-80 Cordelia Truck Scales are also key goods movement facilities. The Westbound Truck facility need to be replaced and has been identified as a project in MTC’s Regional Goods Movement Plan. The I-80 corridor is identified in the National Freight Plan and the SR 12 corridor is recognized as a Goods Movement corridor along with I-80 in the State Freight Plan.

While STA has identified individual projects that are important to local and regional goods movement, it has not undertaken a comprehensive study to identify these facilities in a single document. An initial list of goods movement priorities will be included as part of the CTP.
26. Identify roadway improvements that support retention or expansion of regionally important employment centers, retail centers and civic facilities. This goal has seen Significant Progress. STA has identified regionally significant employment centers, and designated the major roads that serve them as Routes of Regional Significance. STA has not identified those improvements to the roadways that are needed to support each center’s continued economic viability. This task will be undertaken has part of the Solano County’s Moving Solano Forward (MSF) Phase 2 effort. . MSF is a multi-agency effort to identify and find users for major industrial sites in Solano County while still keeping existing employers in the county.
27. Prioritize available funds to support PDAs and PCAs, with special emphasis being given to support for Transit Facilities of Regional Significance. This goal has seen Significant Progress. STA has assisted local agencies in funding road and transit projects in PDAs in each of the seven Solano cities, and has designated PCA funding (both planning and project construction) in Solano County. The requirements of the OBAG 2 funding program require that at least 50% of those funds be spent on projects located in or directly supporting PDAs. In addition, the STA Board has approved a list of priority Managed Lanes Implementation Program (MLIP) facilities. These facilities include express Lanes that directly support carpool, vanpool and express bus services. Large facilities such as the Curtola Park and Ride and Fairfield Transportation Center expansions and upgrades, which serve both carpool and express bus services, are located in or directly adjacent to the PDAs.
o All TFORS are in or adjacent to PDAs
Anticipate and mitigate system construction and operation impacts
28. Special emphasis should be given to projects and designs that reduce emissions of criteria pollutants and greenhouse gasses. Preliminary Proposal. Analysis of GHG emissions occurs during the environmental phase of a project, but so far has not been an explicit quantative criteria in the early prioritization and selection of projects or programs. New state requirements require projects to use Vehicle Miles Traveled (VMT) as a measure of assessing a project’s traffic impacts, rather than the traditional Level of Service (LoS). This change will how project GHG emissions are calculated at an early stage in the project’s development, and may serve as an effective tool to implement this policy. STA can use the VMT or other Best Available Technology to assess GHG emissions and reduction strategies. STA has elected to focus funds for recapitalization of express buses on alternative fuel vehicles to meet federal and state low and zero emission requirements. STA has also adopted an Alternative Fuels plan and sought Cap and Trade funds for projects to reduce GHG emissions.
o Support projects that reduce emissions of criteria pollutants in sensitive communities or Communities of Concern. Preliminary Proposal. STA has not done a statistical or

mapping project to identify projects with Communities of Concern.
29. Where possible, use the avoidance and mitigation standards from the Solano Habitat Conservation Plan for STA transportation projects. Preliminary Proposal. The Solano HCP has not yet been adopted nor is the STA a signature to the HCP. STA regularly mitigates projects in accordance with the draft HCP’s mitigation ratios.

Chapter 6 – Arterials, Highways and Freeways Element Resources
Roads of all types are expensive to build. Once they are built, they are also expensive to operate and maintain, although how they are built has a significant impact on their long-term maintenance costs. The purpose of this Chapter of the Solano CTP Arterials, Highways and Freeways element is to:
• look at the financial resources STA has received since 2010 to pay for road construction, operations and maintenance;
• look at the anticipated revenue over the next 5 years to pay for road construction, operations and maintenance; and,
• project the difference between anticipated revenues and needs.
It is important at this point to remember that the Element focuses on Routes of Regional Significance – those roadways that connect the communities of Solano County to each other and to the broader region, and within Solano County to downtowns, transit centers and major employment centers. Many local roadways, such as collector streets in a residential subdivision, are built and maintained solely with local resources. What is a Roadway? When people talk about roads, they most typically think of the surface upon which they drive. Actual roadways are much more than this. The right of way – the land on which the roadway is located – extends out beyond the pavement area. Right-of-way can include landscaping, control boxes for traffic lights, street lights and, in some cases, the edge of the right-of-way is demarcated by a fence or soundwall. Beneath the pavement is found sand, gravel and rock that acts as the base for the roadbed. Also under the roadway are facilities to collect and carry away stormwater and utilities such as water and wastewater lines, and conduits for power, phone and internet cables. Adjacent to almost all arterial roadways, and some state highways, are curbs and in most cases sidewalks.
Building or expanding a roadway network is expensive. The actual construction of the driving surface is only part of the story. The need for and general location of a roadway must be established in a document such as a city General Plan or an STA or Caltrans corridor study. Environmental impacts of the project must be assessed, and any negative impacts either avoided or mitigated. The land on which the roadway is built must be acquired. The project must be designed by registered engineers. Only when all these steps have been completed can the roadway be built.
Depending upon the size of the roadway project, it can take several years to complete. The longer the roadway, or the more major structures such as bridges that are involved, the longer the construction time. The amount of time it takes to build a project is often delayed by conditions such as winter weather and the need to avoid environmentally sensitive areas during some

portions of the year or the breeding and nesting season for sensitive bird species living in the project area.
Roadway Construction – Past Revenue It is rare for a roadway project to be built with money from a single fund source because of how extensive the projects are. Rarely can a single source cover all of a project’s costs. Because of this, nearly every road is built with money that comes from multiple sources, whether they be Federal, state, regional or local.
So, if the roadways that are the skeleton of the transportation system, connecting everything to everything else, are expensive and time consuming to build, what are the financial resources that are available to build (and maintain) them? Federal Federal transportation funds come from a tax on gasoline sales. The Federal gasoline tax has been fixed at $0.184 per gallon since 1994. One result of this has been a reduction in the purchasing power of this tax by some 40% due to inflation. Because of the Federal government’s ability to shift money between funds and to run a deficit, it is difficult to say that the only source of Federal transportation funds is the Federal gasoline tax. Some of it is also from deficit borrowing, which is a tool unavailable to state and local jurisdictions. In the most recent Federal transportation bill, the $305 billion in authorized funds included $140 billion in general federal revenues. Federal funding for transportation projects is determined by legislation approved and periodically renewed by Congress. Federal transportation funding was guided by what was known as SAFETEA-LU (Safe, Accountable, Efficient Transportation Equity Act: A Legacy for Users) from 2005 until September 2012. SAFETEA-LU was originally intended to guide transportation funding for four years but was repeatedly extended. SAFETEA-LU continued some longstanding funding programs and created some new ones. In 2012, a new two-year transportation bill was approved, known as Moving Ahead of Progress in the 21st Century, or MAP-21. Subsequent to MAP-21’s original expiration date of September 30, 2014, Congress enacted short-term extensions through the end of October 2015. In December 2015, a new five-year transportation funding bill was approved and became known as
the FAST (Fixing America’s Surface Transportation) Act. The FAST Act is the current Federal transportation bill.
SAFETEA-LU (2005 – 2012)
MAP-21 (2012 – 2015)
FAST Act (2015 – present)

Federal funds come in one of two ways. First of all, “formula funds” are distributed from the Federal government to states and, from there, to large metropolitan regions. In the Bay Area, the recipient of Federal formula funds is the Metropolitan Transportation Commission. The second way that Federal funds are distributed is through competitive grant programs. These include the Transportation Investment Generating Economic Recovery (TIGER) and Fixing America’s Surface Transportation Long-term Achievement of National Efficiencies (FAST LANE) grants, both of which are explained below and have been the subject of Solano county applications. In 2010, the old system of congressional earmarks, where members of the House and Senate could assign funds to priority projects in their districts, was discontinued. When MTC receives federal formula funds, they first take a portion of them for regional programs, such as MTC planning activities and support of future programs addressing climate change. MTC usually claims about 60% of these funds. The remaining funds are distributed to the CMAs based upon a formula adopted by MTC. In previous years, the MTC formula was based upon roadway factors such as the total lane miles and the maintenance backlog in each county. Starting with the OneBayArea Grant (OBAG) cycle 1 in 2012, MTC changed the basis of the formula to population and housing, in order to better reflect the priorities found in one of the state’s signature climate change bills, known as SB 375. MTCs federal funds distribution formula for 2017’s OBAG 2 is based 50% on current population, 30 % on actual housing production from 1999 to 2014, and 20% on the Regional Housing Needs Allocation from 1999 to 2014. Within the two housing allocations, extra weight is given to the production or commitment to produce affordable housing. Federal formula funds have been generally split into two categories over the time period covered by this Element, along with several smaller funding categories that have been changed. The current split of Federal surface transportation funding is expected to continue at least until the expiration of FAST Act in 2020. The categories of Federal transportation funding are:
• Surface Transportation Block Grant Program (STBG) – formerly the Surface Transportation Program or STP. STBG funds can be used for a broad variety of purposes, including adding capacity to roadways, roadway maintenance and repair, safety projects and transportation planning.
• Congestion Mitigation and Air Quality (CMAQ). CMAQ funds must be used for projects that reduce congestion or improve air quality. The sorts of projects that qualify for CMAQ include active transportation (bike lanes are an example), programs that promote and support transit use, pilot transit programs and zero emission vehicle support.
• Transportation Enhancement (TE). This fund category was discontinued when MAP 21 was passed, but was previously used for roadway enhancements such as lighting and landscaping.

The FAST Act contains the following competitive grant programs that are applicable to Solano county projects:
• FAST LANE funds specifically designed to support the interstate movement of cargo. The FAST Act authorizes $800 million in funding for the FASTLANE program for fiscal year 2016, with 25 percent reserved for rural projects, and 10 percent for smaller projects.
• The TIGER grant program is another Federal transportation grant program that is designed to “support innovative projects, including multi-modal and multi-jurisdictional projects, which are difficult to fund through traditional federal programs.”
The American Recovery and Reinvestment (ARRA) of 2009 augmented funds available to STA member agencies for roadway construction and maintenance. Maintenance funds will be discussed later on in this chapter. ARRA provided $31.2 million over a three year period to fund ready-to-build construction projects in Solano County. Federal funds for road construction and maintenance have been stagnant for the last decade; when inflation is factored in, the actual purchasing power of those funds has been in decline. This is illustrated by the following figure.
The table below shows federal funds provided to Solano County since 2010 for roadway construction.

Table 1: Federal Construction Funds FY 2009-10 to FY 2015-16 Actual (in $1,000s)
SOURCE – Federal
2009-10 2010-11 2011-12 2012-13 2013-14 2014-15 2015-16
STP $3,835 $2,650 $8,651 $2,120 $4,982 $1,717 $784 CMAQ $580 $4,658 $2,365 $1,875 $3,270 $908 $1,260
TE $400 $77 - $1,141 - - - Earmark $2,452 $895 $880 $1,030 $907 $5,302 $2,020
ARRA $10,431 $10,431 $10,431 - - - - TOTAL $17,698 $18,711 $22,327 $6,166 $9,159 $7,927 $4,064
The average over this 7 year period is $12.3 million per year, but the large addition provided by the ARRA in the 2009-2012 time period distorts this amount. State State transportation funds come from two primary sources: on-going fuel taxes and periodic state bond measures.
Fuel Tax California’s fuel tax system is complex. Originally, there were two taxes on gasoline and an excise tax on diesel fuel. The gasoline taxes consisted of the general sales tax applied to all purchases in the state, and a specific tax on gasoline sales. The state sales tax on gasoline has been 2.25% since mid-2010, and the fuel excise tax has been in the range of $0.36 to $0.278. The tax rates are shown in the following table:
Table 3: State Fuel Tax Rates (Fiscal years 2010-11 through 2016-17)
Fiscal Year Base Tax
Price-Based Tax
Total Gas Tax Rate
2010-2011 $0.18 $0.17 $0.35 2011-12 $0.18 $0.18 $0.36 2012-13 $0.18 $0.18 $0.36 2013-14 $0.18 $0.22 $0.40 2014-15 $0.18 $0.18 $0.36 2015-16 $0.18 $0.12 $0.30 2016-17 $0.18 $0.10 $0.28
The table above lists an excise tax rate. In the California system, this is not a traditional excise tax. Instead it is an estimation of what the sales tax would be if the state legislature have not shifted the gasoline sales tax calculation and terminology in 2010.

The state also charges an excise tax on motor vehicle fuel at a rate of $0.18 per gallon.
State gas tax funds are distributed directly to local agencies, and do not go through regional agencies such as MTC or STA. These funds are primarily used for local streets and roads maintenance, but can also be used for new roadway capacity.
Gas tax funds that are collected at the state level are put into the State Transportation Improvement Program (STIP) and the State Highway Operation and Preservation Programs (SHOPP) accounts. SHOPP projects are for operation and maintenance projects focused on state highway system prioritized by Caltrans, and are addressed in that section of this Chapter. The STIP account is the primary state funding source for the construction of new capacity in California, and is programmed by regional agencies and the California Transportation Commission.
As with federal funds, the funds from the STIP for Solano projects have been decreasing, as shown in the following figure.
Highway Safety Improvement Program (HSIP) The HSIP is a program created under MAP 21, but administered by the state. The purpose of HSIP is "for the purpose of achieving a significant reduction in fatalities and serious injuries on all public roads”. HSIP projects must be identified on the basis of crash experience, crash potential, crash rate, or other data-supported means. For the time period of FY 2009-10 through FY 2015-16, Solano cities have been awarded $6.14 million in HSIP funds. $2.6 million of those funds have been obligated to projects, with the remaining scheduled for obligation and construction in FY 16-17 and FY 17-18.

Highway Bridge Program (HBP) The purpose of the federal HBP is to “replace or rehabilitate public highway bridges over waterways, other topographical barriers, other highways, or railroads when the State and the Federal Highway Administration determine that a bridge is significantly important and is unsafe because of structural deficiencies, physical deterioration, or functional obsolescence.” As with HSIP, it is administered on a competitive basis by the state. The County of Solano has aggressively pursued HBP funds, and $37.5 million has been received since the time period of FY 2009-10 through FY 2015-16.
Bonds State bonds are debt instruments sold on the open market in order to generate a large amount of funds at a single time. The bonds (principle and interest) are then repaid over time with funds generated from the state property tax. Other fund sources, such as fuel taxes or road tolls, can also serve as the basis for bond repayment funds. Bond sales to either have specific expenditure plans and listed projects, or guidelines for what sort of projects can be funded.
Within the last decade, there has only been one California transportation bond – Proposition 1B, approved by California voters in November of 2006. Proposition 1B was designed to finance a major transportation infrastructure program in California. Project selection was done by the California Transportation Commission, based upon criteria that were included in the bond package approved by voters. In Solano County, Proposition 1B funds were used to fund the Jameson Canyon (SR 12) widening, the Eastbound Truck Scales on I-80 and several projects that are part of the I-80/I-680/SR-12 interchange (I-80 HOV lanes, North Connector and construction package 1 of the Interchange) as well as transit operations support.
The table below shows state funds provided to Solano County since 2010 for roadway construction.
Table 4: State Funding for Construction Actual
(in $1,000s) 2009-10 2010-11 2011-12 2012-13 2013-14 2014-15 2015-16
Prop 1B $4,998 - - $309 - $15,500 $12,259 Gas Tax - - - - - - - STIP - - $3,800 - $13,874 $4,400 $23,800 HSIP - - - - $220 $47 $2,387 HBP $330 $200 $3,680 $17,338 - $11,285 $4,615 TOTAL $5,328 $200 $7,480 $17,647 $14,094 $31,618 $42,670
Regional Funding Regional funds for roadway construction come from bridge toll funds, referred to as Regional Measure 2 (RM 2) and RM 3 approved by Bay Area voters (the latter also referred to as

AB1171-AB144 funds), which are limited to projects that reduce traffic on one of the Bay Area toll bridges. The sorts of projects that qualify for these funds include express lane improvements and local roadways that improve access for Express buses from a local transit center to the freeway system. The table below shows regional funds provided to Solano County since 2010 for roadway construction. It is important to note the capital program from RM 2 was for 10 years and began to conclude in FY 2015-16.
Table 6: Regional Funding for Construction Actual
(in $1,000) 2009-10 2010-11 2011-12 2012-13 2013-14 2014-15 2015-16 $47,619 $46,775 $10,708 $23,403 $22,645 $18,591 $10,950 - - $7,000 $36,863 $29,276 $34,039 - TOTAL $47,619 $46,775 $17,708 $60,266 $51,921 $52,630 $10,950
Local Funding There are several local sources of construction money for roadways. The most substantial source of funds for local roadway construction are development impact fees. Impact fees are collected at the time building permits are issued, and they are intended to pay some or all of the costs of improvements needed to offset the traffic impact of new development. Each city, and the county, establishes its own impact fee using what is known as an AB 1600 process. Impact fees can also be covered by a developer installing a new roadway themselves. Impact fees are usually spent on local roadways and occasionally paid to Caltrans for improvement on the state highway system. Sometimes, because of the size and nature of the project, its transportation impacts are not fully covered by collection of impact fees. In these cases, the impact is usually identified in the project’s environmental documentation. At this time, a mitigation measure can be identified and required as a condition of the project’s approval. While this process is different from the collection of impact fees, the practical result is the same – a developer-funded or -built new roadway. In 2013, Solano County began collecting a Regional Transportation Impact Fee (RTIF), as part of the County’s Public Facility Fee, to help cover some of the costs of projects that benefit multiple jurisdictions. The RTIF is administered by STA. Since its inception in 2013 (FY 2013-14), the RTIF has collected $3 million; 91% of these fees have already been allocated to project design and construction. Finally, 7 of the 8 jurisdictions in Solano County have locally approved sales tax measures. While these measures are all general fund measures, allowing the city to spend the money as the

City Council sees fit, local streets and roads are typically identified as one of the local priorities for the local sales tax measure. Local sales tax funds spent on roadway construction may be on strictly local streets or on Routes of Regional Significance, so they are not reported below. The Whole Funding Picture Based the tables and figures above, the table below show overall construction funding for Routes of Regional Significance in Solano County from FY 2009-10 through FY 2015-16. Table 8: Total Construction Funding FY 209-10 through FY 2015-16
Actual (in $1,000s)
2009-10 2010-11 201112 2012-13 2013-14 2014-15 2015-16 Federal $17,698 $18,711 $22,327 $6,166 $9,159 $7,927 $4,064 State $5,328 $200 $7,480 $17,647 $14,094 $31,232 $43,061 Regional $47,619 $46,775 $17,708 $60,266 $51,921 $52,630 $10,950 RTIF 0 0 0 0 $383 $1,374 $1,287 TOTAL $70,645 $65,686 $47,515 $84,079 $75,557 $93,163 $59,362
Conclusions – Construction Funding There are few roadway projects that can be constructed with a single fund source, and those projects that can be are typically smaller, local-serving roads. The Routes of Regional Significance that connect the communities of Solano County, and that connect Solano to the broader Northern California region, are by definition multi-jurisdiction and almost always multi-fund-source projects.
That broad range of funding needs is matched by the broad range of funding sources, and that is a source of difficulty for delivering projects. Federal, state and regional funding providers want to see funds spent quickly, while multi-sourced projects take time to assemble funding packages (much less obtain project permits). Local funds, which can be spent with fewer of the procedural restrictions than those funds from other sources, are often the best way to get a project “shovel ready.” Shovel ready projects are those that have all environmental, right-of-way and design work completed, and need only adequate funding to be ready for shovels to begin moving dirt (i.e. construction started). The lack of a dedicated countywide transportation fund source makes construction of major roads in Solano County much more difficult.

Roadway Maintenance– Past Revenue Building or expanding a roadway network is expensive. Once it is built, the maintenance expenses kick in. Depending upon the type of construction and the volume and nature (proportion of cars, buses and trucks) of the traffic, the early maintenance can range from cleaning and keeping gutters clean to patching cracks and dealing with subsidence.
In general, one of the most significant factors in a road’s maintenance needs is simply its age. Pavement dries and it cracks, it bears loads unevenly, water seeps in and washes away the underlying sand and rock, leading to more cracking that allows in more water – all things that lead to the accelerating deterioration of a road. The wet winter of 2016-17 has been a reminder that sometimes non-scheduled maintenance and repair of roadways is needed due to extreme events such as flooding.
The condition of a road is measured by the Pavement Condition Index (PCI), as explained earlier in the State of the System chapter. The chart below shows how the cost to maintain a road goes up over time.
Unlike construction funding, maintenance resources do not come from a large variety of sources. Instead, there are two primary sources of maintenance funding: gas tax funds returned to the local community, and locally-adopted sales taxes. State gas tax revenues are reported below by calendar year rather than fiscal year.

Table 10: State Gas Tax Funds for Solano Road Operations and Maintenance Actual
(in $1,000) 2010 2011 2012 2013 2014 2015 2016
$13,751 $19,781 $22,074 $18,981 $ 23,980 $23,507 $17,333
In addition to the yearly sales tax receipts, there were two one-time infusions of money for roadway maintenance since 2010: The American Recovery and Reinvestment Act of 2009 (ARRA), which provided money in 2010, and the One Bay Area Grant (OBAG) funds from the 2013 Regional Transportation Plan (RTP).
As noted above, the American Recovery and Reinvestment (ARRA) of 2009 augmented funds available to Solano County’s seven cities and the County for roadway construction and maintenance. ARRA provided $31.2 million over a three year period to fund ready-to-build construction and rehabilitation projects in Solano County. OBAG is a block grant program administered by MTC, and includes CMAQ and STBG funds. During the time period of FY 2011-12 through FY 2016-17, STA allocated $5,863,000 of federal STBG funds for local streets and roads maintenance. The funds were spent on the following projects:
Table 11: OBAG 1 Local Streets and Roads Projects
Local sales tax funds spent on roadway maintenance may be on strictly local streets or on Routes of Regional Significance, so they are not reported below. Improvements to the freeways and highway comes from the SHOPP account. SHOPP projects range from repaving and other typical maintenance to new shoulders and turn lanes that improve operations but do not add to roadway capacity. The recent history of SHOPP funding in Solano County is shown in the table below and the two maps on the next page.

Table 12: SHOPP Funds Actual
(in $1,000s) 2009-10 2010-11 201112 2012-13 2013-14 2014-15 2015-16 SHOPP $4,400 $689 $1,550 $80,345 $36,516 $2,201 $25,797
SHOPP Projects as of 2016.
SHOPP Projects including 2016-2017 storm damage repair.

Taken together, the gas tax, SHOPP and OBAG 1 funds for the last seven fiscal total: Table 13: Total Operation and Maintenance Funds
Actual (in $1,000s)
2009-10 2010-11 201112 2012-13 2013-14 2014-15 2015-16 Gas Tax $13,751 $19,781 $22,074 $18,981 $ 23,980 $23,507 $17,333 SHOPP $4,400 $689 $1,550 $80,345 $36,516 $2,201 $25,797 OBAG 1 $977 $977 $977 $977 $977 $977 $977 TOTAL $19,128 $21,447 $24,601 $100,303 $61,473 $26,685 $44,107

Future Revenue Some of the future funding stream for local streets and roads construction and maintenance can be predicted, but much of it cannot. There are few stable funding sources. One thing that can be predicted about the funding is that, barring a major change, it will not be enough to meet either construction or maintenance needs. This important point bears repeating. There is not enough funding for new roads to handle existing congestion. There is not enough funding to build new roads to handle expected growth in housing and jobs. There is not enough funding to improve the condition of existing roads to an acceptable PCI, much less properly maintain new roads as they begin to age. There are several fund sources that have at least some level of predictability. Other are based upon variables such as economic performance, and therefore tax or building permit revenues. As with the Past Revenue section of this chapter, the Future Revenue section will examine construction and maintenance funds separately. With the approval by the California Legislature of SB-1 on April 6, 2017, the funding picture is somewhat improved. Additional funds will start being collected in the fall of 2017, and likely find their way into regional and local accounts starting in early 2018. The state-wide tax and fee increases that will fund SB-1 are:
• Base excise tax raised by $0.12/gal and tacked to inflation thereafter. (November 1, 2017)
• Excise tax on diesel fuel raised by $0.20/gal. (November 1, 2017) • Annual vehicle fee ranging from $25 to $175, depending on value of the car. (January 1,
2018) • Price-based excise tax raised to $.17/gal; currently $.098/gal (July 1, 2019) • Electric cars pay a $100 fee (January 1, 2020.)
Roadway Construction – Future Revenue
Federal funds As discussed above under roadway construction, Federal formula funds are split into two categories. The categories of Federal transportation funding are:
• Surface Transportation Block Grant (STBG). STBG funds can be used for a broad variety of purposes, including adding capacity to roadways, roadway maintenance and repair, Safety projects and planning.
• Congestion Mitigation and Air Quality (CMAQ). CMAQ Funds must be used for projects that reduce congestion or improve air quality. The sorts of projects that qualify for CMAQ include active transportation (bike Lanes are an example), Programs that promote and support transit use, pilot transit programs and zero emission vehicle support.

The predictable federal funds come to STA through MTC’s OBAG 2 program, which covers FYs 2017-18 through FY 2021-22. During that time period, OBAG 2 will provide $7,397,027 of STBG funds (including $1,500,000 of Federal Air Secondary funding reserved exclusively for projects in the unincorporated County) that can be used for either construction or maintenance of roadways. Also as discussed above, the FAST Act contains the following competitive grant programs that are applicable to Solano county projects. These are competitive grant programs, and there is no assurance that any projects in Solano County will receive funding.
• FASTLANE. Fixing America’s Surface Transportation Long-term Achievement of National Efficiencies (FAST LANE) funds specifically designed to support the interstate movement cargo.
• TIGER. The Transportation Investment Generating Economic Recovery (TIGER) grant program is another Federal transportation grant program that is designed to “supports innovative projects, including multi-modal and multi-jurisdictional projects, which are difficult to fund through traditional federal programs.”
There may be other federal grant programs in future years, but the existence, funding and requirements of such programs is dependent upon federal legislative action and administrative rule making. Similarly, the federal fuel tax could be updated (raised and/or indexed) in a manner that would provide supplemental STBG or CMAQ funds. These are not reliably predictable actions.
State funds Future state revenues have been an unreliable source of future funds. The primary state construction funding mechanism is the STIP, and the maintenance fund is the SHOPP, both discussed above. The source of these funds is state fuel tax/excise tax.
Over the 2010-2016 time period, changes made by the state government made the STIP a much less reliable stream of funding. The reasons for these changes have ranged from a desire to encourage less driving by creating fewer lane miles, to a response to the financial crash of 2008 and the resultant drop in fuel tax revenues, to a desire to pay off state transportation bonds quickly. A specific example of this is the diversion of truck weight fees collected by the state. Previously, these fees had been allocated to the State Highway Fund and used to fund the SHOPP. In 2010, the state shifted these fees to paying off Proposition 1B bond debt. The result has been about $1 billion per year that should be but is not, programmed into the SHOPP.
As a result, prior to the April 2017 approval of SB-1 the identified STIP for allocation to Solano County in FY 2016-17 is $33,197,300 – all of which is already committed to the Jepson Parkway project, which is designed and ready for construction.

With the passage of SB-1, the Solano County STIP share is expected to be restored, at a rate of about $9 million per year, starting in 2018-19.
There are two other state fund sources for future roadway work in Solano County. Funds for both programs are awarded on a competitive basis rather than distributed according to a formula, so they are not reliable revenue sources.
HSIP – This is as program created under the FAST Act but administered by the state. The purpose of HSIP is "for the purpose of achieving a significant reduction in fatalities and serious injuries on all public roads”. HSIP projects must be identified on the basis of crash experience, crash potential, crash rate, or other data-supported means. There are currently two HSIP awards for Solano jurisdictions - $3,269,600 for FY 2016-17, and $1,651,400 for FY 2017-18.
HBP – The purpose of this federal program is to “replace or rehabilitate public highway bridges over waterways, other topographical barriers, other highways, or railroads when the State and the Federal Highway Administration determine that a bridge is significantly important and is unsafe because of structural deficiencies, physical deterioration, or functional obsolescence.” As with HSIP, it is administered on a competitive basis by the state. The County of Solano has aggressively pursued HBP funds as noted previously, and currently has one HBP award of $3,400,000 for FY 2017-18.
Regional fund sources are all described under the existing revenues section. At this time, STA and its member agencies cannot predict any roadway construction funding from existing regional fund sources for fiscal years 2016-17 and beyond. A new bridge toll program has been discussed, but no legislation to enable such funding has been introduced, and the amount of funds and/or specified projects are also not known.
Local funds for roadway construction are one of the few areas where some level of predictability exists, but dependent upon a factor that is outside of local control: the health of the construction market, which directly translates into collection of the RTIF. Based upon development predictions from the County and seven Cities, STA estimates it will receive $11.7 million during the period of 2017 through 2021.
State gas tax subvention to local governments for maintenance work has been severely reduced in the last few years by legislative action. From FY 09-10 through FY 2014-15, the gas tax receipts to Solano County averaged $20.3 million per year. For FY 2015-16, that amount dropped to $16 million, to $27 million in FY 2015-16, $15.7 million in FY 2016-17, and a projected $13.2 million in FY 2017-18. Since this fund source is dependent upon either legislative action (or inaction) and on the performance of the economy, projecting revenues beyond one to two years is problematic.

Support for SHOPP funds for Solano County projects by the CTC and Caltrans have been positive in recent years. There are two SHOPP allocations for Solano County in future years - $17,300,000 for FY 2017-18, and $29,200,000 for FY 2018-19. However, SHOPP funds are awarded based on project need, and there is a tremendous need across the state for highway and freeway maintenance, even before the damage from the early-2017 storms is accounted for.
With the approval of SB-1, local agencies are expected to see an across-the-board increase in gas tax funds of 94%, starting in FY 18-19. Initial projections show $8.5 million going to Solano County and the remainder distributed to the cities based upon the proposed state formula.
Revenue Gap There are two types of new road capacity construction needed: new capacity to address existing traffic congestion, and new capacity to handle new development. While both of these have funding gaps, the lack of resources to add capacity for existing traffic is more substantial.
Road capacity to address growth has an identified funding source, even if it is sometimes inadequate. That source is the impact fees collected by local jurisdictions, including the Solano RTIF. In theory, an impact fee can be set to collect 100% of the costs of new capacity needs, although in reality they are often lower.
Local impact fees are traditionally directed towards projects on local roads, and not on the highway and freeway system. Impact fees collected by the cities and the county can be spent on a roadway that is impacted by growth and, in Solano County, this includes Routes of Regional Significance (RORS) identified in this Element as well as strictly local roadways. As a result, it is difficult to know what resources are truly available to address the funding gap for RORS.
Development impact fees can only be used to build capacity that addresses growth. They cannot be used to correct existing capacity deficiencies.
The most common fund source for dealing with existing deficiencies is the STIP, combined with a local sales tax. Solano County is the only Bay Area County without a voter approved local sales tax dedicated to transportation, and with no projected STIP funding. This combination is leading to a large gap between need and capacity to address that need. The provision every five years of Federal STBG funds that can be used for additional capacity provide a small amount of funds for meeting a growing need for local road construction, and STBG funds can be used for either maintenance or new capacity. In addition, MTC rules restrict the ability of STBG funds to be used for new capacity.
The main cause for this gap is a lack of locally-controlled funding source that can be used for projects that address existing capacity shortfalls. Every Bay Area county except for Solano has a countywide sales tax dedicated to transportation improvements. These funds can be used for new capacity, maintenance, transit support and active transportation. The uses depend upon the local measure that is approved by the county voters. Because these are local funds, they cannot be

diverted by the state. In Solano County, this fund source does not exist. Individual cities have locally-approved sales tax measures, but these are multi-purpose measures that also fund law enforcement and fire personnel and road maintenance. New capacity gets few or none of these funds.
A second cause for the lack of new funds for existing shortfalls is the rapidly diminishing STIP. As discussed above, the state has substantially changed the way the STIP is funded and directed. Fewer dollars are coming to Solano County, and there is now more pressure from the CTC to spend those dollars that we do receive on the state highway or interstate freeway system.
Federal rules allow STBG funds to be used to expand capacity that addresses current shortfalls, although MTC regulations disallow this. STBG funds can also be used for local streets and roads maintenance. This makes it a valuable and flexible fund source. Unfortunately, it only comes in small amounts allocated every five years.
There is an additional program that can deal with existing capacity issues. The program is the bridge toll program known as RM 2. This funding source is particularly important for roadway projects that directly support Solano CTP Transit and Rideshare Element projects, such as arterial roadways that connect transit centers to the freeway system and the extension of regional express lanes.
Finally, there are Federal grant programs such as the FAST LANE and TIGER programs, and state and federal goods movement grant programs, that can provide funds for new capacity. As has been discussed earlier in this chapter, those are highly competitive – and therefore unreliable – fund sources. What then are reasonable expectations of funding in comparison to the expected demand for funds over the next five years? Construction Funds Projecting roadway construction funding is challenging. There are a variety of sources, and their funding amount is unpredictable. State and federal sources have been subject to legislative action or inaction that makes them difficult to rely upon, although the passage of SB-1 gives hope that this may be changing. Aside from FY 2018-19, there is now the prospect of $9 million per year in STIP funding for Solano County. In the case of OBAG funds, they are further subject to state and local restrictions, amount to only $4.6 million (for CMAQ), and come around only on a 5-year cycle. Regional funds have been useful but are nearing the end of their expenditure plans, and new funds are not guaranteed. Local funds are limited to the RTIF, which can be used only on growth-related facilities.

There are some trends that can reasonably be expected to continue, including the local success with the HSIP and HBP programs. Given these facts and possibilities, the following tables show reasonably-projected construction funds for the next five years:
Table 12: Projected Federal Funds for Road Construction FEDERAL FUNDS
Projected (in 2017 $1,000) SOURCE - Construction 2016-17 2017-18 2018-19 2019-20 2020-21
STBG - - - - - CMAQ - $4,600 - - - TOTAL $0 $4,600 $0 $0 $0
Table 13: Projected State Funds for Road Construction
STATE FUNDS Projected (in 2017 $1,000)
SOURCE - Construction 2016-17 2017-18 2018-19 2019-20 2020-21
Prop 1B - - - - - Gas Tax - - - - - STIP - - $3,300 $9,000 $9,000 HSIP $2,533 $200 $863 $400 $2,160 HBP - - - - - TOTAL $2,533 $200 $4,163 $9,400 $11,160
Table 14: Projected Regional Funds for Road Construction
REGIONAL FUNDS Projected (in 2017 $1,000)
SOURCE - Construction 2016-17 2017-18 2018-19 2019-20 2020-21
RM 2 $0 $0 $0 $0 $0 TOTAL $0 $0 $0 $0 $0
Table 15: Projected RTIF Funds for Road Construction
LOCAL FUNDS Projected (in 2017 $1,000)
SOURCE - Construction 2016-17 2017-18 2018-19 2019-20 2020-21
RTIF $1,678 $2,313 $2,642 $2,427 $2,160 TOTAL $1,678 $2,313 $2,642 $2,427 $2,160

Table 16: Projected Total Funds for New Capacity Road Construction (best case)
TOTAL FUNDS Projected (in 2017 $1,000)
2016-17 2017-18 2018-19 2019-20 2020-21 Federal (CMAQ) $0 $920 $920 $920 $920 State (STIP) $34,627 $203 $3,296 $400 $400 Regional $0 $0 $0 $0 $0 Local $2,068 $2,556 $2,726 $2,127 $2,191 Total $36,695 $3,679 $6,942 $3,447 $3,511
This amount totals almost $43.3 million, and could increase, perhaps substantially, if a new bridge toll and/or a federal infrastructure bill that includes transportation infrastructure is approved. Both of the later pieces of possible legislative sources remain, as of early 2017, exactly that – possible. Possible funds don’t finance projects. They are also actions that can only be taken by others. They might also have limited direct impacts on Solano County transportation needs. For example, a federal infrastructure bill could emphasize ports, or water treatment facilities, or states other than California.
Maintenance Funds The ability to maintain what we already have is also drastically underfunded. Using the past five years of funding to predict the next five years for maintenance, and adding $18 million per year for local funds from SB-1, the following are the predicted available maintenance funds in thousands of 2017 dollars. SHOPP funds will increase state-wide, but there is no indication of how much, if any, of that money will come to Solano County. Table 18: Projected Total Funds for Road Operation and Maintenance
TOTAL FUNDS Projected (in 2017 $1,000)
2017 2018 2019 2020 2021
Gas Tax $17,680 $36,033 $36,394 $36,762 $37,137 SHOPP $26,313 $26,839 $27,376 $27,924 $28,482 OBAG 1 $256 $256 $256 $256 $256 TOTAL $44,249 $53,128 $53,026 $53,941 $55,875
As with construction funds, this does not include local agency sales tax funds that may (but not necessarily that must) be used for roadway maintenance, and it does not include any future funds from legislative actions that have not yet been taken. For roadway maintenance, best we can reliably predict over the next 5 years is $260.2 million. Based on figures provided by MTC and contained in the 2014 Solano Pothole Report, countywide local streets and roads face a funding

shortfall over the next 28 years of $1.7 billion to maintain current conditions and $2.7 billion to reach a state of good repair. The revenues and costs over this 28-year period are shown below:
How much of a demand is there over the next five years for $43.3 million of roadway construction money and $260 million of roadway maintenance funds?
In preparing this Element and submitting projects to MTC for the 2017 update of the RTP, the STA developed the list below of major projects on the RORS, and identified the existing gap between project costs and committed funds:
Table 19: Identified Projects on Routes Of Regional Significance Project Needed funds (in $1,000) I-80/I-680/SR12 Interchange Improvements (Packages 2-7), including new connections, ramps and direct-connect Express Lanes
$ 630,000
Construct 4-lane Jepson Parkway from Route 12 to Leisure Town Road at I-80
$84,700
Improve interchanges and widen roadways serving Solano County Fairgrounds, including Redwood Parkway, in Vallejo
$3,000
Parkway Blvd Overcrossing, in Dixon $10,000 Provide auxiliary lanes on I-80 in eastbound and westbound directions from I-680 to Airbase Parkway
$57,000
Relocate the westbound I-80 Truck Scales $170,000 Widen Columbus Parkway to a consistent 4-lane width for its entire length, and construct Class I or Class II bike facilities where they do not currently exist.
$2,930

Project Needed funds (in $1,000) Reconfigure I-80 Eastbound Off Ramp to West Texas Street and Fairfield Transportation Center. The improvements would provide bus direct access into FTC, eliminate the current free right onto EB West Texas, connect to the Linear Park along the I-80 embankment and provide controlled pedestrian access across West Texas Street
$2,950
Replace the existing SR 12/Beck and SR-12/Pennsylvania at-grade intersections with a new grade-separated interchanges.
$65,000
Improve Fairgrounds Drive and Redwood Parkway, including the Redwood Parkway – I-80 Interchange, from SR 37 to Redwood Parkway.
$121,000
Widen Peabody Road to 2 lanes in each direction, plus a Class 2 bike/ped facility. Project location is from Vacaville City Limits to Fairfield City Limits
$4,500
Intersection and roadway improvements to Midway and Porter roads in unincorporated Solano County in order to improve roadway performance and safety
$600
Widen Vaca Valley Parkway in Vacaville from I-80 to I-505 and improve the Vaca Valley Parkway interchange with I-505.
$22,700
In Rio Vista, improve the SR 12 and Church Road intersection. The project includes shoulder widening and protected turn lanes on SR 12 and dedicated turn lanes on Church Road, and is intended to improve operations rather than increase capacity.
$3,100
Improve major roadways on and connecting to Mare Island in Vallejo, including the Mare Island interchange with SR 37 and the Mare Island causeway bridge.
$15,000
SR-12 Capacity Improvements in Solano County from the SR 12 I-80 to I-5 Corridor Study
$103,000
SR-113 Safety and Capacity Improvements from the SR-113 MIS
$58,000
Additional projects that could largely be funded through tolls/fees associated with the project are:
Table 20: Identified Projects on RORS that may be Self-Funded Project Needed Funds (in $1,000) SR-37 Sea Level Rise and Congestion Improvements $2,000,000 New Rio Vista Bridge $1,500,000 I-80 Express Lane conversion, extension and construction $280,000 I-680 Express Lane construction $150,000

All totaled, these projects, excluding the Rio Vista Bridge replacement, come to $5,283,480 million. Eliminating the $3,930,000 of potentially self-funded projects, the need still remaining is $1,353,480. This is 31 times greater than the identified available revenue. The situation for maintenance funding is equally bad. The Solano County Pothole Report of 2014 reported a 10-year maintenance shortfall of $544 million to reach a PCI of 75. Translating that into a comparable time frame, the County and seven cities have only half of the funds they need just to maintain the currently low PCI average of 60. In order to improve the PCI to a “good condition” rating of 75, available funds would have to double again. Transportation is underfunded across the board. There is not enough money to build or to maintain needed Active Transportation links, Transit and Rideshare facilities, rolling stock and programs and, most dramatically, not enough for the fabric that binds the system together – the Arterial, Highways and Freeways system. That significant disconnect between needs and resources leads to the next chapter of the Arterial, Highways and Freeways Element: policies.

Chapter 7 – Arterials, Highways and Freeways Element Policies, Performance Measures and Milestones
If everything is indeed tied together, then how we make and implement choices is especially important. One choice can impact how we achieve – or fail to achieve – multiple goals. We commit ourselves to
actions by adopting Policies. Policies are specific action statements that implement Goals. Policies contain clear action words such as shall, will, assign or invest. When STA staff make recommendations to committees or the Board, those recommendations will be guided by the policies in this Element.
But making choices – implementing policies – is not enough by itself. There needs to be a way of measuring how one decision impacts all of the goals with which it is associated. Performance Measures and Milestones are the tools used to measure and track impacts. Because the most basic elements of measuring roadway performance are well understood – standards of congestion as measured by Level of Service (Los) and standards of maintenance as measured by Pavement Condition Index (PCI) – it appears to be easy to establish and report on how decisions impact goal achievement.
Unfortunately, the measuring of impacts isn’t so simple, and that is due to one new, and two recently emphasized factors.
• The measurement of greenhouse gas (GHG) emissions is a new factor to the Solano CTP, and is now the most important factor in state and regional transportation planning. GHG emissions from vehicles have the additional complication of not being directly measured, but instead are based upon traffic modeling. In addition, research shows that the traditional steps of roadway improvements that relieve congestion actually add to GHG emissions through the phenomenon of Induced Demand. This is a new issue that has not been addressed in previous STA documents.
• The state and region are now putting greater emphasis on implementing the existing Complete Streets standards, and money is shifting from traditional car-bus-truck only roads into roads that accommodate Active Transportation. A few considerations about the difficulty of implementing Complete Streets is that they tend to be more expensive to build on a per-mile basis, require more right of way, and measuring active transportation participation is not as well developed a process as is measuring auto traffic.
• The third area of expanded emphasis, which is also incorporated into Complete Streets, is accommodation of large vehicles – transit buses and goods movement trucks. As with Active Transportation, measurement of freight vehicles is less sophisticated than is auto
Policies are specific action statements that implement Goals, and contain action words such as shall, will, assign or invest.
Milestones and performance measures are the tools used to measure impacts.

traffic. Bus use is usually measured by factors on-time performance and farebox recovery, not direct roadway use.
The result is that traditional measures of roadway performance – Level of Service and PCI – are not enough. State environmental law requires an analysis of Vehicle Miles Traveled (VMT) as a proxy for GHG emissions, and STA needs policies that reflect the state and regional goals of reducing GHG emissions.
On the following pages, the Arterials, Highways and Freeways Element lays out policies for helping guide STA decisions, performance measures and milestones.
• Policies are specific action statements that implement Goals. Policies contain clear action words such as shall, will, assign or invest.
• Performance measures can be thought of as a unit of measure; for example, in the question “what is the average PCI for Arterial Roads that are Routes of Regional Significance?”, the PCI is the Performance Standard.
• A Milestone is a benchmark showing how much progress has been made; for example, if a policy states “Improve the average PCI for Arterial Roads that are Routes of Regional Significance by 1 point in 5 years,” increasing the funds for maintenance of Arterial Roads that are Routes of Regional Significance would be a Milestone.
Each Policy is set out in bold text, and is followed by an explanatory paragraph. Performance Measures and Milestones are indicated by highlighting and, in most cases, end with a question. Finally, the Goals advanced by this particular policy are listed. Those Policies that advance Goals of other Elements are identified by a black highlighting with white text.
POLICIES
AHF Policy 1 – Focus local discretionary funds on Arterial Routes of Regional Significance that serve Regionally Significant Job Centers.
Discussion - The greatest impact that STA can have on reducing VMT and GHG emissions, on supporting active transportation and on supporting local and intercity transit, is to support the strengthening of the Solano County economy. The major employment and transit centers in the County are all located along Arterial Routes of Regional Significance – in fact, one of the definitions of a Routes of Regional Significance is service to major transit or employment centers.
Arterial Routes of Regional Significance are also streets well suited to a full accommodation of Complete Streets. They have adequate right-of-way to accommodate bicycle and pedestrian facilities, transit turn-outs, and room for heavier trucks.

As noted previously in the Resources chapter, there are few local discretionary fund sources, such as the RTIF, so it is important to program them to projects that have the greatest beneficial impact.
Policy Performance Measures and Milestones – The performance measure for this Policy is money - the allocation of flexible local transportation funds to Arterial Routes of Regional Significance. Is STA focusing local discretionary funds on Routes of Regional Significance that serve Regionally Significant Job Centers? If so, the Policy is being implemented? There is not a milestone for this policy because it is not benchmarked against a specific funding amount or relative proportion of funds being spent on Arterial Routes of Regional Significance.
This Policy helps implement AHF Goals 1, 4, 10 and 11.
This Policy also helps advance Transit and Rideshare Element policies. All Transit Facilities of Regional Significance are located on Routes of Regional Significance, and most local and regional transit routes are on Routes of Regional Significance, so investments in those roadways help support those services.
This Policy also advances Active Transportation policies, which greatly benefit from Complete Streets arterials that provide access to major activity centers.
AHF Policy 2 – Prioritize federal, state and regional funds for the conversion and extension of the I-80 Express Lanes, the I-80/I-680/SR-12 interchange and the I-80 Westbound Truck Scales.
Discussion – These three projects, which are all interrelated, are prioritized for two primary reasons: they have the greatest potential to improve local and regional mobility, and their regional importance makes them the best candidates for large-scale funding sources. The Express Lanes projects also help eliminate the greatest congestion point in the county – the merge on I-80 EB from 5 to 4 lanes at North Texas Street – as well as helping support transit and rideshare users in the central portion of the county. Supporting transit is another method of reducing GHG emissions.
Reducing vehicle hours of delay (VHD) is not the preferred method of GHG emission reductions, but less time spend in traffic with engines at idle is another way to reduce GHG emissions, and all three projects will contribute to fewer VHD in Solano County. Reduced VHD also has the benefit of lowering the level of frustration felt by many Solano residents during their daily drive.
These three projects have been identified as priority projects in a number of different studies, including those prepared by both STA and MTC, and are ready for implementation as soon as funding is received. They are listed as priorities within these studies, and they have gone through most or all of
One concern about projects that add new lanes is the theory of induced demand, where new road capacity not only addresses existing congestion but also motivates people to take trips they otherwise would not have taken. In a growing county such as Solano, which also has significant pass-through traffic on I-80 and SR-12, it is hard to predict how much new traffic would be generated. Research shows that gap fill projects and HOV/Express Lanes do not result in induced demand. Two of these three STA priorities - extension of the I-80 Express Lanes, the I-80/I-680/SR-12 interchange – fit these criteria.
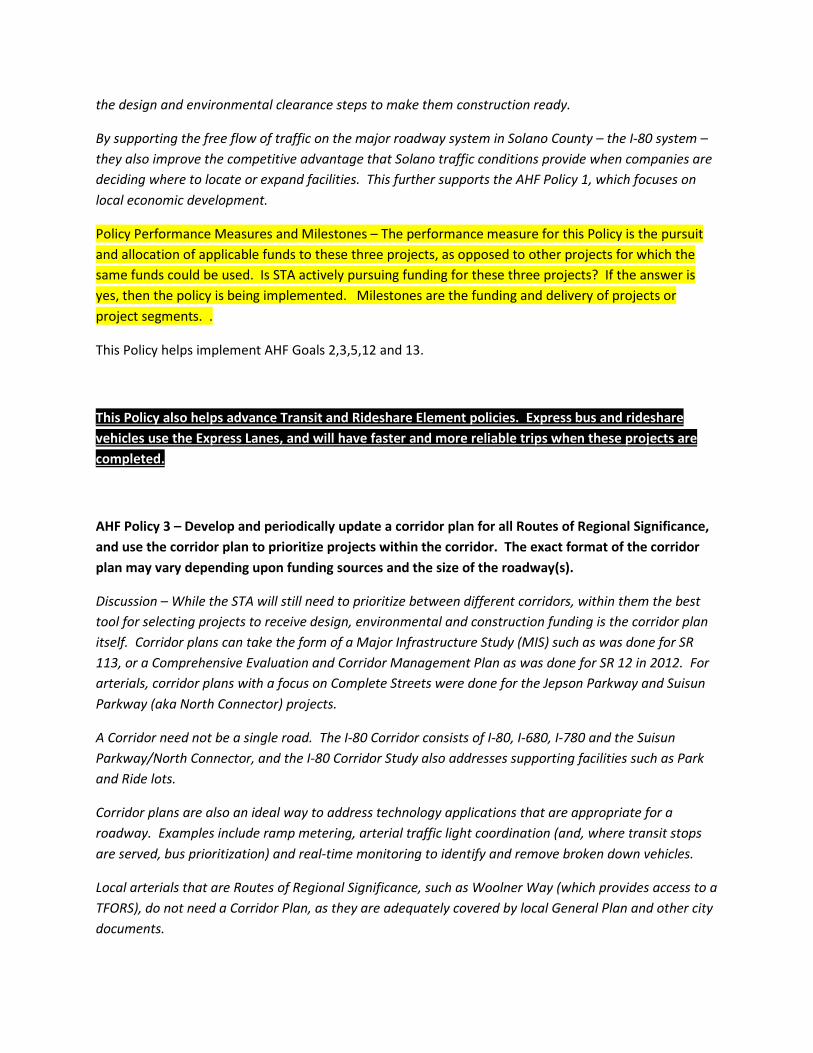
the design and environmental clearance steps to make them construction ready.
By supporting the free flow of traffic on the major roadway system in Solano County – the I-80 system – they also improve the competitive advantage that Solano traffic conditions provide when companies are deciding where to locate or expand facilities. This further supports the AHF Policy 1, which focuses on local economic development.
Policy Performance Measures and Milestones – The performance measure for this Policy is the pursuit and allocation of applicable funds to these three projects, as opposed to other projects for which the same funds could be used. Is STA actively pursuing funding for these three projects? If the answer is yes, then the policy is being implemented. Milestones are the funding and delivery of projects or project segments. .
This Policy helps implement AHF Goals 2,3,5,12 and 13.
This Policy also helps advance Transit and Rideshare Element policies. Express bus and rideshare vehicles use the Express Lanes, and will have faster and more reliable trips when these projects are completed.
AHF Policy 3 – Develop and periodically update a corridor plan for all Routes of Regional Significance, and use the corridor plan to prioritize projects within the corridor. The exact format of the corridor plan may vary depending upon funding sources and the size of the roadway(s).
Discussion – While the STA will still need to prioritize between different corridors, within them the best tool for selecting projects to receive design, environmental and construction funding is the corridor plan itself. Corridor plans can take the form of a Major Infrastructure Study (MIS) such as was done for SR 113, or a Comprehensive Evaluation and Corridor Management Plan as was done for SR 12 in 2012. For arterials, corridor plans with a focus on Complete Streets were done for the Jepson Parkway and Suisun Parkway (aka North Connector) projects.
A Corridor need not be a single road. The I-80 Corridor consists of I-80, I-680, I-780 and the Suisun Parkway/North Connector, and the I-80 Corridor Study also addresses supporting facilities such as Park and Ride lots.
Corridor plans are also an ideal way to address technology applications that are appropriate for a roadway. Examples include ramp metering, arterial traffic light coordination (and, where transit stops are served, bus prioritization) and real-time monitoring to identify and remove broken down vehicles.
Local arterials that are Routes of Regional Significance, such as Woolner Way (which provides access to a TFORS), do not need a Corridor Plan, as they are adequately covered by local General Plan and other city documents.

Policy Performance Measures and Milestones – The performance measures for this Policy are the creation of corridor plans for Routes of Regional Significance, and the use of these plans in prioritizing project funding. A second performance measure is the allocation of funds to prepare and/or update corridor studies on a periodic basis. Does STA create and update corridor plans for Routes of Regional Significance? If the answer is yes, then the policy is being implemented. The milestone is an annual review of Routes of Regional Significance corridors and an identification of whether or not they are covered by a corridor plan, and how recent that plan is.
This Policy also helps advance both Transit and Rideshare Element and Active Transportation Element policies. Corridor plans provide detailed information for how new or updated facilities support transit use and both bicycle and pedestrian accommodations.
AHF Policy 4 – Require roadway plans to have a consistent number of lanes for their length. Only approve lane reductions at logical points such as major interchanges that divert traffic.
During STA’s public outreach efforts in 2015 and 2016, the most commonly-referenced frustration for highway and freeway users were the back-ups that occur where the number of lanes is reduced. This occurs on SR 37 (at Mare Island), SR 12 (Jameson Canyon onto EB I-80) and at several places on I-80 (North Texas Street and Meridian Road EB, Kidwell Road WB). Lane merges are the location of the greatest amount of VHD in Solano County. The volume of traffic on these roads is part of the challenge, but the merger of two lanes of traffic into one, or five lanes into four, is the main culprit.
A merge of traffic lanes has an acceptable impact when traffic volumes are below capacity. In the cases of SR 37 and SR 12, there are no locations where traffic volumes can be reduced, and the solution needs to be more capacity. In the case of I-80 EB, traffic volumes drop off sharply between North Texas Street and I-505, and a reduction in lanes is not expected to result in a simple shift of a back-up queue from Fairfield to Vacaville.
The lane reductions at Pedrick Road (I-80 WB) and Meridian Road (I-80 EB) need separate study, in conjunction with Caltrans District 3. This includes consideration of long-term plans for an HOV/Express network connection from Solano County into Yolo County.
Policy Performance Measures and Milestones – The performance measures for this Policy are project designs that result in consistent lane widths unless detailed traffic modeling shows that a lane reduction, and the resultant merge of traffic, is not expected to lead to significant traffic queueing. Does the SATA adopt plans, and ultimately improve roadways, in such a manner that lane reductions are eliminated? If plans are adopted that do not create, or that eliminate, lane reductions, then this policy is being implemented. The milestone is the construction of improvements that eliminate lane reductions.

AHF Policy 5 – Incorporate safety considerations into all STA documents. Provide a common basis for evaluating safety considerations by adopting a countywide safety program, including the following features:
1. A common format for collecting and reporting data for the seven cities and the County.
2. A county-wide system for prioritizing safety improvement projects. 3. A requirement that all corridor studies and other project documents have an
explicit safety analysis consistent with the countywide safety plan. 4. An application for federal, state or regional for one or more of the top safety
projects during every applicable safety grant cycle.
Discussion – Improving safety is always one of the most important aspects of any roadway project, and the foundation for improving safety is data. Without good data, it is all but impossible to effectively address safety issues. Once location, cause and severity data are in hand, safety planning can move on to mitigation and prioritization. This policy is intended to make this method of addressing safety issues a formalized part of every project or program document that STA prepares.
Policy Performance Measures and Milestones – The performance measures for this Policy are the ongoing incorporation of the identified safety data collection and analysis into STA documents. Does STA collect and publish safety data and adopt plans that address identified safety issues? If the data is being collected and used, then the policy is being implemented. The first milestone is the adoption of a countywide safety program by the end of Calendar Year 2018. Subsequent milestones are the adoption of other STA documents with the proper safety components included.
AHF Policy 6 – Review land use development plans from the seven cities and the County to identify right-of-way needs for STA projects within those developments. Where future right of way is present, work with local jurisdictions to seek dedication of and/or low-value development within those areas.
Discussion – early identification and preservation of future right of way can be an important cost saving tool, and can avoid future land use disruptions if used in the right circumstances. Unfortunately, actual preservation or outright purchase of right of way at the earliest possible point it time is often financially impossible. Right of way acquisition is funded late in the process, and requiring land to be set aside unused is a ‘taking’ that requires compensation.
Policy Performance Measures and Milestones – The performance measure is the identification of future right-of-way needs for STA projects prior to local land use approvals. Are plans being submitted to STA and, if appropriate, is STA providing comments? If so, the policy is being implemented. The milestone for this Policy is the submittal to and review by STA of local land use development projects.
AHF Policy 7 – Support Routes of Regional Significance maintenance by:

1 Include a detailed PCI evaluation on all Routes of Regional Significance in the STA Pothole Report.
2 Requiring recipients of discretionary roadway maintenance funds administered by STA to spend them on Routes of Regional Significance rated as Fair or worse before spending them on other projects
3 Seeking additional roadway maintenance funds
Discussion – Adequate data is the pre requisite to a properly maintained system, and adequate funding is the tool to its implementation. This policy is intended to make progress on fulfilling both of those needs. The Policy creates a regular process for gathering and reporting the data needed to guide maintenance investments, and provides specific guidance on spending in the most dire of maintenance situations.
The Policy includes a recommendation to seek additional funding, and the data and investments required by the policy will help determine how much funding is needed. With the 2017 adoption and 2018 implementation of SB 1, the maintenance backlog is expected to be substantially reduced. STA will wait until 2020 to re-examine maintenance funding needs.
Policy Performance Measures and Milestones – The performance measures for this Policy is the PCI of Routes of Regional Significance and the amount of money spent on Routes of Regional Significance maintenance. Is the Routes of Regional Significance PCI being reported upon annually, and if the PCI is increasing? If so, this policy is being implemented. The Milestones are the submittal of pavement data by local agencies to STA (or another entity from which STA can obtain the data), the publication of the STA Pothole Report, and change in the Routes of Regional Significance PCI.
AHF Policy 8 – Require that projects funded by STA use Solano HCP avoidance and mitigation standards unless the project environmental analysis shows a compelling reason that a different standard provides greater environmental and project delivery benefit.
Discussion – Project analysis, public acceptance and deliverability are all improved when existing standards are used. This can range from standardized lane widths to signage standards and, in this case, environmental policies. Although the Solano HCP has not been formally adopted, it does represent the most generally accepted standards for environmental impact avoidance and mitigation.
Policy Performance Measures and Milestones – The performance measures for this Policy are the use of Solano HCP avoidance and mitigation standards in draft and final environmental documents. The Milestones are the adoption of final environmental documents including such standards.

Chapter 8 – Priorities
If this Element is to be in any way useful, then all of the goals, plans, resources and policies included in the previous chapters must culminate in physical projects. The existing and future roadways are the fabric that bind the communities together and, as noted at the beginning of the Element, what effects one roadway ultimately effects them all. It’s now time to identify the new threads to be woven into the fabric of Solano’s roadway network. Before we take this final step, it’s worth our time to go back and look once again at the overall Plan and Element objectives. The first two principles of the Solano CTP are:
Strengthen the system and reduce stress by developing, operating and maintaining an integrated local and regional transportation system Anchored on the I80 corridor (interstate highways 80, 680 and 780).
An additional important fact about the Solano CTP, and in the overall work of the STA, is the idea that we are our member agencies, and what is important to them is important to us. For that reason, throughout the development of the Solano CTP, including the Arterials, Highways and Freeways Element, STA has made a point of asking Solano residents and the staffs of the seven cities and the county to identify the projects and programs that they think will improve the roadway system. We’ve asked them to provide the broadest possible list of Arterials, Highways and Freeways projects and programs. Since the purpose of the element is ultimately to guide STA in its allocation of resources, it is now time for the element to take that broad list of projects and programs, and set priorities for funding. Because the Element primarily focuses on the physical environment, the priority list will tilt towards projects, which includes construction, operation and maintenance.
Projects and programs in this and the other Elements are categorized into one of three tiers.
Tier 1 – those projects or programs already in place, or are ready for near-term implementation. Tier 1 also includes recently-identified community priorities that need a rapid infusion of resources to allow quick implementation. Projects with dedicated OBAG or STIP funding are classified as Tier 1 projects.
Tier 2 – projects and programs that are important and have been advanced out of the conceptual stage, but are not yet ready for near-term implementation. This may include a project that has an initial investment in design work but is not yet fully designed and that lacks a complete funding strategy.

Tier 3 – ideas and concepts that have had little to no work done to advance their implementation.
STA can make appropriate funding decisions once a project is classified into one of these tiers.
• Tier 1 projects are those where STA has the greatest opportunity to provide financial support. STA can directly allocate some fund sources, and can help influence the allocation of regional, state and federal funds as detailed in the Resources chapter.
• Tier 2 is where STA begins to consider a project for funding. This can be anything from direct funding allocation to assistance in pursuing regional, state and federal grants. The new funding can be, depending on its source and use limits, used for project design, environmental analysis and mitigation, right-of-way acquisition and construction.
• Tier 3 project usually start with local funding that is intended to move them from a concept into an initial design. The use of local funds to initiate a project is particularly important as it indicates a real commitment by the sponsoring community to move the project forward. Local projects usually move into STA’s sphere of attention when they are moved by local effort from Tier 3 to Tier 2.
Funding of programs, although different in some respects due to the lack of physical design documents and project construction, follows the same course. Conceptual program ideas are classified as Tier 3, those being developed are classified as Tier 2, and those ready for implementation funds (including those programs already in operation) are classified as Tier 1.
On the following pages, the projects and programs identified by STA and our member and partner agencies are placed into the three tiers explained above. The work to develop this tiered project list was guided by all of the policies, but the especially by the funding gaps identified in the Resources chapter and by the recent project prioritization done for the 2017 Plan Bay Area, RM 3 legislation and STIP prioritization.
A final reminder – the Arterials, Highways and Freeways system impacts every aspect of the Transit and Rideshare system, and much of the Active Transportation system is located along Routes of Regional Significance. All of these facilities are a part of the interwoven transportation fabric of Solano County and the broader region.

Table 21 - TIER 1 ARTERIALS, HIGHWAYS AND FREEWAYS PROJECTS AND PROGRAMS
Name, Location and Sponsor
Description Cost and Funding
I-80 Express Lane Conversion and Extension – STA and Caltrans
Convert the existing High Occupancy Vehicle (HOV) lane between Red Top Road and North Texas Street to an Express (HOV or tolled SOV) Lane. Extend the Express Lane from North Texas Street to I-505.
$180 million, with funds from local, state and regional sources
I-80/I-680/SR 12 Interchange, including the west end of the North Connector – STA and Caltrans
Construction Packages 2-7, including Express Lane direct connections and the west end of the North Connector.
$630 million, with funds from federal, state and regional sources
I-80 WB Cordelia Truck Scale Relocation - STA and Caltrans
Construct new truck scales approximately ½ mile east of current location on I-80 WB, with braided ramps between SR 12 east.
$202 million, with funds from federal, state and regional sources
Highway 37 Corridor Improvements - STA and Caltrans
Select, design and deliver flood control, ecological and transportation improvements along the SR 37 corridor. This includes improvements to the SR 37/Mare Island interchange.
Costs range from $700 million to $4.5 billion, depending upon the selected project.
Jepson Parkway Complete construction of Jepson Parkway improvements in the City of Fairfield and unincorporated Solano County.
Segment 2B and 2C Segment 3
Fairgrounds Drive Improve Fairgrounds Drive and Redwood Parkway, including the Redwood Parkway – I-80 Interchange, from SR 37 to Redwood Parkway.
$121 million
SR 12/Church Road Intersection
Realign and improve the intersection, including provision of turn lanes on SR-12 and
$3 million. Project funds include SHOPP, HSIP, RTIF and local development impact fees.

Name, Location and Sponsor
Description Cost and Funding
MLIP Implementation – STA and local agencies
Support major intercity bus centers, park-and-ride lots and connected arterial light coordination/prioritization for transit. Eligible projects must be included in an adopted road corridor or transit corridor study.
$115 million in 2016 dollars.
I-505/Vaca Valley Pkwy Interchange
Widen the existing overcrossing to 3 lanes in each direction with protected turn pockets. Modify existing spread diamond to provide partial 3 roundabouts. New bridge to accommodate pedestrian and Class 2 bicycle facilities
$12.4 million. Project funding is a mix of local development impact feed and OBAG Cycle 2 money.

Table 22 - TIER 2 ARTERIALS, HIGHWAYS AND FREEWAYS PROJECTS AND PROGRAMS
Name, Location and Sponsor
Description Cost and Funding
Parkway Blvd Overcrossing – City of Dixon
Construct a new overcrossing of the UPRR tracks, connecting Parkway Boulevard and Pitt School Road, includes 2 travel lanes in each direction plus Class I bike/ped facility.
$16 million. Primarily Dixon development impact fees, but eligible for STA RTIF.
Corridor Plan Development and Updates – STA and Caltrans
Fund the development of appropriate Corridor Plan for SR 29 and update the I-80/I-680/SAR-12 MIS.
Potential mix of PPM and state or regional grant funds.
I-80/West Texas St Ramp Improvement – City of Fairfield
Reconfigure I-80 Eastbound Off Ramp to West Texas Street and Fairfield Transportation Center. Improve transit, pedestrian, and bicycle access to Transit center with direct connection to Linear Park Trail.
$2.9 million.
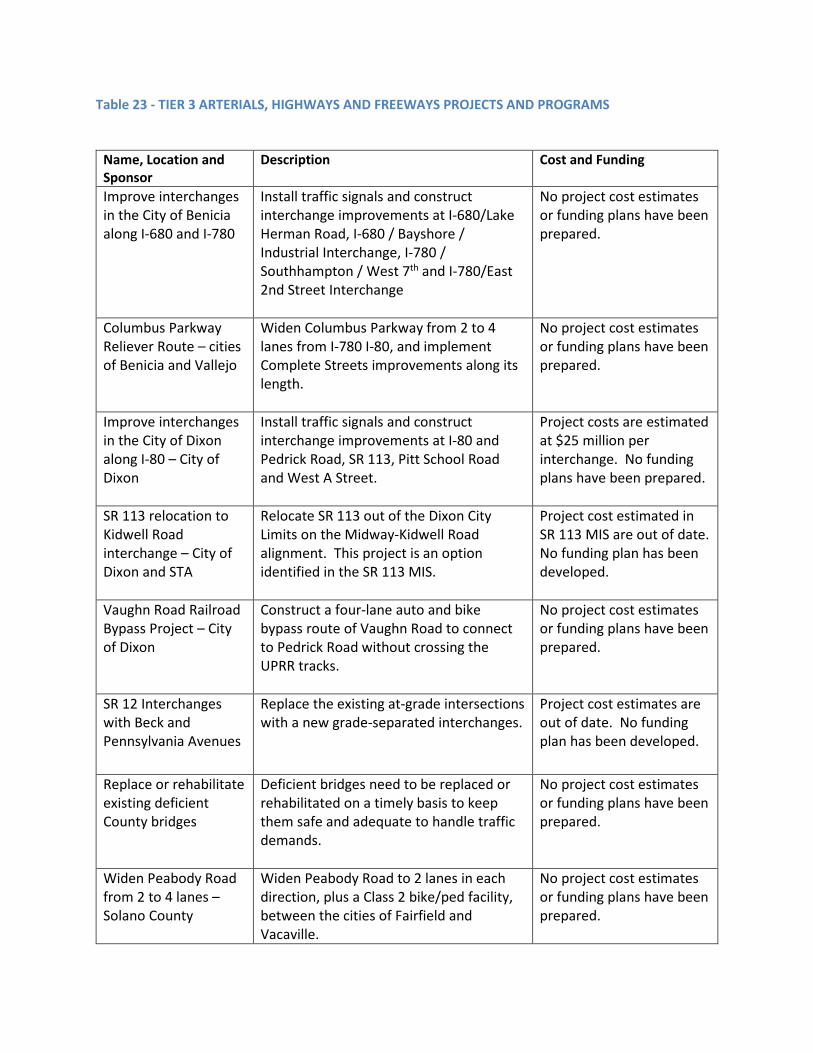
Table 23 - TIER 3 ARTERIALS, HIGHWAYS AND FREEWAYS PROJECTS AND PROGRAMS
Name, Location and Sponsor
Description Cost and Funding
Improve interchanges in the City of Benicia along I-680 and I-780
Install traffic signals and construct interchange improvements at I-680/Lake Herman Road, I-680 / Bayshore / Industrial Interchange, I-780 / Southhampton / West 7th and I-780/East 2nd Street Interchange
No project cost estimates or funding plans have been prepared.
Columbus Parkway Reliever Route – cities of Benicia and Vallejo
Widen Columbus Parkway from 2 to 4 lanes from I-780 I-80, and implement Complete Streets improvements along its length.
No project cost estimates or funding plans have been prepared.
Improve interchanges in the City of Dixon along I-80 – City of Dixon
Install traffic signals and construct interchange improvements at I-80 and Pedrick Road, SR 113, Pitt School Road and West A Street.
Project costs are estimated at $25 million per interchange. No funding plans have been prepared.
SR 113 relocation to Kidwell Road interchange – City of Dixon and STA
Relocate SR 113 out of the Dixon City Limits on the Midway-Kidwell Road alignment. This project is an option identified in the SR 113 MIS.
Project cost estimated in SR 113 MIS are out of date. No funding plan has been developed.
Vaughn Road Railroad Bypass Project – City of Dixon
Construct a four-lane auto and bike bypass route of Vaughn Road to connect to Pedrick Road without crossing the UPRR tracks.
No project cost estimates or funding plans have been prepared.
SR 12 Interchanges with Beck and Pennsylvania Avenues
Replace the existing at-grade intersections with a new grade-separated interchanges.
Project cost estimates are out of date. No funding plan has been developed.
Replace or rehabilitate existing deficient County bridges
Deficient bridges need to be replaced or rehabilitated on a timely basis to keep them safe and adequate to handle traffic demands.
No project cost estimates or funding plans have been prepared.
Widen Peabody Road from 2 to 4 lanes – Solano County
Widen Peabody Road to 2 lanes in each direction, plus a Class 2 bike/ped facility, between the cities of Fairfield and Vacaville.
No project cost estimates or funding plans have been prepared.

Name, Location and Sponsor
Description Cost and Funding
Improve the County Routes of Regional Significance – Solano County
Construct improvements to various County roads, including Lake Herman Road, Lopes Road, Lyon Road, McCormack Road, Midway Road, Pedrick Road, Lewis Road, Fry Road, Meridian Road and McCory Road
No project cost estimates or funding plans have been prepared.
I-80 - Pedrick Road – Tremont Road – Kidwell Road area – Solano County
Construct various transportation improvements to accommodate projected increasing traffic in the north Dixon limited industrial area.
No project cost estimates or funding plans have been prepared.
Midway Road – Porter Road – Pitt School Road connector improvements – Solano County
Intersection and roadway improvements to connect City of Dixon with Midway. Supported by City of Dixon.
No project cost estimates or funding plans have been prepared.
Grade Crossing at UPRR Tracks on Main Street – City of Suisun City and City of Fairfield
Restore an at-grade crossing of the railroad tracks to connect downtown Suisun City with downtown Fairfield.
No project cost estimates or funding plans have been prepared.
Sunset Avenue Widening at UPRR Tracks – City of Suisun City
Widen and improve the roadway, including the pedestrian/bicycle crossing on Sunset Avenue at the UPRR tracks that separate Suisun City from Fairfield.
No project cost estimates or funding plans have been prepared.
Highway 12 Corridor Improvements – City of Suisun City, City of Rio Vista, Solano County and STA
Construct improvements within the Highway 12 Corridor from Pennsylvania Avenue to Walters Road, and make operational improvements from Walters Road to Sacramento County.
Project cost estimates are out of date. No funding plan has been developed.
Railroad Avenue Extension (West Segment) – City of Suisun City
Extend Railroad Avenue from Marina Boulevard to the Main Street/Highway 12 westbound On-Ramp and make a signalized intersection at Main St/Hwy 12 On-Ramp.
No project cost estimates or funding plans have been prepared.

Name, Location and Sponsor
Description Cost and Funding
Highway 12 Flyover to West Street
Construct an off-ramp/flyover from Highway 12 at Pennsylvania Avenue to Old Town Suisun over the UPRR railroad tracks
No project cost estimates or funding plans have been prepared.
Midway Rd. (Putah South Canal to I-80)
Widen Midway Rd. in both directions to provide a 4-lane, un-divided arterial
No project cost estimates or funding plans have been prepared.
Vaca Valley Parkway Widen Vaca Valley Pkwy from I-80 to I-505 to 6 lane divided arterial
No project cost estimates or funding plans have been prepared.

Chapter 9 – Moving Forward; or, Making a Better Garment
How, then, do we make a better garment? As with the other Elements, the Arterials, Highways and Freeways needs to move from planning to implementation in order to be useful. Policies and priorities are the primary tools for this, but there needs to be some identification of the next few steps in order to create momentum towards a broadly-based, long-term, systematic maintenance and improvement of the Solano roadway network.
Oddly enough, the first thing we should do is to keep doing what we already are doing. STA and its member and partner agencies have been planning, designing and delivering new roadway projects and programs for years; and, with the arrival of SB 1 funding and the prospect of new bridge toll money, the work might shift from slowly losing ground to actually making a dent in the backlog of maintenance and construction projects.
To restate the overarching theme of the Solano CTP is to Strengthen the System and Reduce Stress by developing, operating and maintaining an integrated local and regional transportation system anchored on the I-80 corridor (Interstate highways 80, 680 and 780). The existing I-80 Corridor Plan provides a detailed series of steps to do this, and STA has been implementing this Plan for the ___ years since its adoption. Key projects from the Plan are environmentally cleared and have design documents that are complete or nearly so.
STA’s first focus should remain on obtaining funds to complete the design and delivery of the Tier 1 projects on I-80 with both allocated and competitive funds.
The second step – and it’s debatable whether it’s second or first – is to fix what we have by allocating gas tax and SB 1 funds to local agencies for local street and road maintenance.
These two steps address the greatest needs identified by area residents and local governmental officials. They already have the momentum acquired by years of agency work and public demand. Perhaps as importantly, the delivery of these projects will provide highly-visible proof that STA and its member and partner agencies are faithful stewards of public resources. This emphasis on public trust is both the first and the final thread that binds all the rest of the Element – and the Elements – together. Without the warp and weft of public trust, the resources necessary to construct and maintain the local roadway system will be all but impossible to gain.
The next two new activities for STA to undertake are, again, split between freeways/highways and local roads. The freeway/highway task is to implement AHF Policy 3 by updating the I-80 corridor plan, in order to reflect improvements that have been delivered and to ensure that the ancillary projects such as park-and-ride lots are still of the right size and location. The local
roadway task is to implement AHF Policy 1 by selecting the Routes of Regional Significance whose improvements would best support local economic development and making sure their improvements are planned and funded. The planning task includes making sure the roadways fully implement the Complete Streets requirements of providing context-based active transportation, transit and goods movement features.
Four steps – two that are already underway, two that are new. Improve public trust, improve the local economy, improve choice, and improve the quality of daily trips, no matter how those trips are made. Maintain what we have, and make wise additions. This is how we move forward.