does greater public transit access increase employment for
TRANSCRIPT

Mossavar-Rahmani Center for Business & Government
Weil Hall | Harvard Kennedy School | www.hks.harvard.edu/mrcbg
M-RCBG Associate Working Paper Series | No. 95
The views expressed in the M-RCBG Associate Working Paper Series are those of the author(s) and do
not necessarily reflect those of the Mossavar-Rahmani Center for Business & Government or of
Harvard University. The papers in this series have not undergone formal review and approval; they are
presented to elicit feedback and to encourage debate on important public policy challenges. Copyright
belongs to the author(s). Papers may be downloaded for personal use only.
Does greater public transit access increase
employment for the Israel-Arab Population?
A Preliminary Analysis
Diana B. Greenwald
Guy Grossman
Amir Levi
August 2018

Does greater public transit access increase employment
for the Israeli-Arab Population?
A Preliminary Analysis
Diana B. Greenwald∗ Guy Grossman† Amir Levi‡
July 2, 2018
Abstract
In recent years, Israeli policymakers have identified greater economic integration of theIsraeli-Arab population as a pressing priority. The Israeli-Arab population experiencespersistent disparities in access to public services and low rates of formal sector em-ployment, both of which have implications for Israel’s political and economic future.Two recent government resolutions – Resolution 1539 (2010) and the larger Resolution922 (2015) – have offered multi-sectoral approaches to promoting economic developmentin Israeli-Arab localities and, thus, greater opportunities for Israel’s largest minoritycommunity. In this brief, we analyze the effect public transit interventions – an areaof investment prioritized in both pieces of legislation – on employment outcomes forIsraeli-Arab citizens. Using a new dataset of public transit availability and employmentacross 1,322 Israeli localities, we find that an increase in the number of bus lines servic-ing Israeli-Arab towns is associated with a small but significant increase in employmentrates between 2011 and 2015. We do not see similar effects in Jewish-majority towns,and we do not find that alternative measures of public transit access (such as the dailyfrequency of bus line trips or the connectivity of a town to other larger towns and cities)have as much explanatory power. We discuss the implications of these findings for futureresearch and for the ongoing implementation of Resolution 922.
∗Postdoctoral Research Fellow, Middle East Initiative, Belfer Center for Science and International Affairs,Harvard Kennedy School.†Associate Professor, Department of Political Science, University of Pennsylvania‡Mossavar-Rahmani Center for Business and Government Senior Fellow, Harvard Kennedy School. Authorsare listed in alphabetical order. The authors would like to acknowledge the helpful contributions from InnaBranzburg, Ron Gerlitz, and Rawnak Natour (Sikkuy); and Sharon Malki (Ministry of Transportation), HagaiPorges (Ministry of Welfare), Dan Rader (Adalya), and Mark Rozenberg (BTL). We would also like to thankKyla Klein for her translation and research assistance. All errors are the authors’ own.
1
1 Introduction
Despite years of strong economic growth, Israel faces an important and ongoing challenge: re-
ducing inequality between the majority Jewish population and the country’s minority groups,
the largest of which are Arab citizens of Israel.1 The situation of the Arab citizens of Israel is
complex.2 These complications, and related tensions between the Arab and the Jewish popula-
tions, date back to the founding of the state of Israel following the 1948-9 war (Morris, 1987).
While Israeli Arabs have full citizenship rights, their integration into the Jewish-majority
country is hampered due to their unique historical and political situation and ongoing re-
gional conflicts. On the socioeconomic level, as we describe below, the Arab population faces
inequality in access to education, housing, employment, and other public services.
There are many political, cultural and social challenges to full integration of the Israeli-
Arab community. However, despite these challenges, Israeli policymakers from diverse posi-
tions on the political spectrum have recognized the urgency of increasing economic oppor-
tunities for the Israeli-Arab population. The Israeli government has therefore adopted a set
of policies in recent years that prioritize social and economic inclusion of the Arab popula-
tion. These efforts culminated in a program, initially proposed by the Ministry of Finance
and the office of the Prime Ministry, entitled the “Economic Development Plan for the Arab
Sector”. This plan was adopted by the Israeli government as Resolution 922 on December 30,
2015 (Inter-Agency Task Force on Israeli Arab Issues, 2016).3 Resolution 922 offered a multi-
sectoral approach to economic inclusion, assigning 15 billion NIS (approximately 4.2 billion
USD) over the 2016 to 2020 period, especially in the areas of education, public transportation
and infrastructure, housing, employment, personal and community security.4
This brief focuses, in particular, on the specific role of investments in public transportation
in increasing employment outcomes for the Israeli-Arab population. Even before the passage
of Resolution 922, Israeli policymakers recognized that access to public transit in Israeli-Arab
1Israel also faces an important challenge of closing inequality gaps and increasing labor market participationamong ultra-orthodox Jews. The structure of our data does not allow us to isolate the relationship betweenpublic transit access and employment for this sector. We view this as an important and promising avenue forfuture research.
2In this report, we use “Israeli Arabs”, “Israeli-Arab population”, and “Arab citizens of Israel” interchange-ably. This population includes those Arabs who are citizens of the state of Israel – approximately 1.8 millionindividuals in 2016 – but it does not include Palestinian residents of East Jerusalem, most of whom possess adifferent residency status, nor does it include the Palestinian residents of the West Bank and Gaza.
3In 2015, the Authority for the Economic Development of the Arab, Druze and Circassian Sectors wasmoved from the Prime Minister’s office to the Ministry of Social Equality. Since then, this ministry has beenin charge of Resolution 922 and its implementation.
4The total amount allocated over the five-year period will depend on the application of the resolution’sfunding formulas and thresholds to each year’s total budget.
2
localities is a barrier for economic integration. A government resolution in 2010 (Resolution
1539) promoted initial investment in public transit and related infrastructure in thirteen
priority Israeli Arab towns. Subsequently, public transit was an area of continued focus in
Resolution 922. At the time of writing, it is still early to evaluate the impact of investments
associated with Resolution 922. However, in this preliminary analysis, we are able to assess
the effect of expansions in the public transit system on employment in the years prior to
Resolution 922 (i.e., between 2011 and 2015). This analysis has implications for future public
transit investments in Israel and the implementation of Resolution 922 in the years to come.
Our analysis draws on a new dataset of public transit availability and employment across
1,322 Israeli localities. Further, we draw on several correspondences and meetings held with
stakeholders to understand the background and policy landscape. In summary, our statistical
analysis finds that an additional bus line in an Israeli Arab (or other minority) town produces
a small, but significant, increase in female employment rates by approximately 0.17 percent-
age points and in male employment rates by approximately 0.12 percentage points. While the
increases are relatively small, we estimate that investment in public transportation between
2011 and 2015 alone translated into 1,613 additional formal sector jobs in Israel’s 116 Arab
localities. We discuss these results in the final section of this brief and implications for future
implementation and evaluation efforts as the public transportation portion of Resolution 922
proceeds. We suggest that additional research on the actual usage, not just availability, of
public transit in minority towns will assist in refining the causal mechanisms that may be
driving our analysis. Further, our findings provide suggestive (yet admittedly not conclusive)
evidence that investments in foundational infrastructure and road improvement – as a neces-
sary first step prior to the introduction of new buses – is a worthy priority for future policy
in marginalized towns. Finally, we note that there may be many other factors unrelated to
transportation that continue to depress employment outcomes in Israeli-Arab towns. Addi-
tional research is needed to address and isolate the complex factors that are preventing greater
inclusion of Israel’s largest minority community.
2 Existing Research
A robust body of research in labor economics, transportation studies, and urban planning
examines the link between public transit accessibility and economic outcomes, including em-
ployment. The findings from this literature are important in framing our analysis and inter-
pretation of the data from the Israeli case.5
5Access to public transit is commonly operationalized as the availability of modes of transit within sufficientproximity to individuals’ starting location and desired destination at a non-prohibitive cost.
3

In thinking about how public transit might impact employment, some of this literature
has focused on the distinction between spatial versus social mismatch between job-seekers
and employment opportunities. The foundational spatial mismatch studies assume that job-
seekers are not always optimally located in close proximity to available jobs, and transport and
mobility costs underpin this ”mismatch” (Zenou, 2009). Reducing the distance prospective
workers have to travel, or the costs of traveling that distance, may increase employment: for
example, Phillips (2014) finds that subsidizing transit costs increases the job search intensity
of urban poor.
However, other studies have suggested there are additional factors that might drive unequal
outcomes across groups. For example, spatial mismatch may, in turn, create network effects
that drive “social mismatch” (Zenou, 2013). Scholars have attempted to explain depressed
employment rates among minority populations in a range of settings by further refining spatial
and other forms of mismatch between job-seekers and employment. For example, Hellerstein,
Neumark and McInerney (2008) find that it is not simply the lack of available jobs in neighbor-
hoods where black men live in the United States that diminishes their employment prospects,
but also the racial composition of those who hold the available jobs that shapes opportuni-
ties for these men. In still other cases, research suggests that it may not be location-based,
social, or racial mismatch, but ”modal mismatch”, where access to private modes of transit
(i.e. in the form of an automobile) accounts for differences in employment opportunities and
outcomes (Grengs, 2010; Blumenberg and Manville, 2004).
All of the aforementioned work has implications for how we approach public transit in-
terventions in multi-ethnic societies, such as Israel, that may feature some combination of
spatial mismatch, group-based mismatch (based, for example, on histories of inequality in
resource allocation and in employment opportunities), and other observable and unobservable
sources of inequality. In such settings, increasing the provision of public transportation may
be sufficient to overcome some, but not all, barriers to minority group inclusion. In fact,
acknowledgement of the multi-faceted nature of inequality in Israeli society is what motivated
the comprehensive approach adopted in Resolution 922 in 2015.
3 Socioeconomic Situation of Israeli Arabs
While Israeli-Arab citizens have access to the full spectrum of formal rights, many possess a
distinct religious, cultural, and ethnic identity that has higher salience than citizenship-based
forms of identity (Smooha, 2013). Most Israeli-Arabs still express support for coexistence
between Arab and Jewish citizens and a preference for living in Israel rather than elsewhere,
4

yet the challenges to integration and equality remain formidable due to the unique history of
this population.
Israeli Arabs represent about 21% of the country’s population of 8.5 million citizens. Given
the sector’s relatively high birth rate (outpaced only by the ultra-Orthodox Jewish popula-
tion), the share of Arabs is expected to increase to over 23% in the next 30 years. Compared to
the Jewish population, Israeli Arabs are poorer and less educated.6 For example, the poverty
rate in the Arab sector (53%) is significantly higher than the Jewish sector (14%), in part
reflecting large disparities in income: in 2015, the mean income of an Israeli Jew (11, 764 NIS)
was close to 60% higher than that of an Israeli Arab (7, 412). As for education, while 22%
of the Arab population is between the ages of 18 and 29, the share of Arab students of all
college students in Israel is 13, 10, and 5 percent for BA, MA, and PhD degrees, respectively.
Further, the majority of Israeli Arabs lives in localities with urban characteristics: Arab
cities, relatively homogenous neighborhoods in mixed cities (such as Haifa, Acre, and Jerusalem)
and local councils associated to larger urban regional councils. Arab towns, in which about
three-quarters of Israel’s Arab population resides, tend to be poorer and are governed by local
authorities that have fewer resources and lower administrative capacity. A limited number of
sources of income (e.g., commercial and industrial areas) and the low socioeconomic status
of their residents significantly harms the financial stability of Arab municipalities and local
authorities, leaving them with more limited options to support, develop, or improve their
residents’ welfare (Figure 1).
5571
5768
7337
9699
7913
Arab
Jewish (cluster 1−3)
Jewish (cluster 4−5)
Jewish (cluster 6−10)
National avergae
0 2000 4000 6000 8000 10000NIS
Municipal expenses per capita
Figure 1: Municipal expense per capita. Source: Government of Israel (2016).
6As mentioned above, Ultra Orthodox Jews also suffer from low socio-economic conditions. Exploring theeffectiveness of government policies to increase education, skills and labor market participations of this sectoris beyond the scope of this paper.
5

Tellingly, Arab municipalities are in an average socio-economic cluster of 2.3 (on a 1-10
scale), compared with a 6.0 average socio-economic cluster of Jewish municipalities. With
fewer sources of revenue to spend compared to national benchmarks, residents of Arab locali-
ties receive low levels of public services compared to the general sector. For example, in 2015
the average annual expenditure on a high school student in the public system was 31, 956 NIS
for students in Jewish towns, but only 18, 289 in Arab towns (Government of Israel, 2016).
As with other public services, access to public transit in Israel is unequal across Jewish
and Arab communities. According to the Ministry of Transportation, in 2012, the number of
weekly bus trips per resident in the Arab sector was only about 17% of a resident of the Jewish
sector (Figure 2, right-panel). Similarly, the weekly distance traveled by Arab residents was
estimated to be only quarter of their Jewish counterparts (Figure 2, left-panel). While public
transit is only part of the ethnic-based socioeconomic gaps, as suggested in the research above,
inadequate availability of public transit has wide-ranging implications for access to education,
employment, and other forms of economic activity.
0.7
2.7
0
1
2
3
Arabs Jews
Kilo
met
ers
Weekly distance traveled
0.03
0.21
0.0
0.1
0.2
0.3
Arabs Jews
N. r
ides
Number weekly rides
Figure 2: Gaps in public transportation services between Jewish and Arab localities. Source: Gov-ernment of Israel (2016), based on data assembled by the ministry of transportation in 2012.
A highly consequential report published in 2016 by a cross-ministerial task force reaffirmed
the Ministry of Transportation’s 2012 estimates. The task force identified large gaps in the
level of accessibility to public transportation between Jewish and Arab towns, especially with
respect to the range of destinations and the frequency of lines servicing communities (Govern-
ment of Israel, 2016). Some of the Arab communities were found to suffer from a total lack
of access to public transportation, and in other localities, the level and quality of access to
public transportation was very low. 41 percent of Arab localities had no public transportation
6
access in 2009, and an additional 43 percent had only low-level public transportation services.
In addition, the state of transportation infrastructure in Arab communities at the time of the
report’s publication was exceedingly low compared with the state of infrastructure in Jewish
localities. This situation stems, in part, from long years of budgeting mechanisms that did
not use needs-based criteria, and because of the economic situation and low capacity of Arab
municipalities hindered investment in public transport infrastructure.
4 Government Resolutions
4.1 Resolution 1539 (2010)
The Arab citizens of Israel have, compared to the Jewish population, lower human capital
(skills and education), and lower formal labor market participation rates. If these characteris-
tics of the population remain more or less unchanged, Israel’s economy is expected to retract
quite significantly in coming years simply due to demographic trends. A growing recognition
among Israel’s decision makers of this dire projection helps to explain the adoption of several
government resolutions designed to begin closing gaps between Jewish and Arab Israelis.
In 2010, the Israeli government passed Resolution 1539 – a precursor of the larger program
which was to follow in December 2015. In resolution 1539, 13 minority towns were selected
for targeted investment in the areas of economic development, employment, housing, and
public transit.7 The Ministry of Transportation was tasked with implementing the public
transit component of the program, which was allocated a total budget of 101 million NIS:
72.5 million of which was designated directly for the ministry and 28.5 million in supplemental
funds managed by the Economic Development Authority in the Prime Minister’s office. The
legislation outlined focus areas such as: operating public transit lines within minority towns;
connecting these towns to major thoroughfares and traffic arteries; operating intercity bus
terminals; upgrading roads within towns; and establishment of transportation terminals.8
While these areas were identified as priorities for the new program, the ministry retained a
wide amount of discretion in how the funds were to be put to use in the identified localities.
The thirteen towns were selected using a threshold criteria based on, first, towns being
above a certain size and, second, having an elected, local leadership that had exhibited sound
fiscal management. Further, towns were required to possess at least a basic level of infrastruc-
ture. Infrastructure in the towns was an important constraint, as it determined where the bus
7One of these towns, Taybeh, was only added in early 2013.8The legislation is available at: https://www.gov.il/he/Departments/policies/2010 des1539.
7
operators could expand their operations, depending on the quality of roads, the narrowness
of the roads, and the topography.
4.2 Resolution 922 (2015)
In December 2015 the Israeli government approved Resolution 922, a comprehensive multi-
sector landmark plan to increase investment in Arab communities in Israel, emphasizing the
areas of education, public transit and infrastructure, housing, employment, and security (Inter-
Agency Task Force on Israeli Arab Issues, 2016). In each of these sectors, resolution 922
stipulated new rules for allocating portions of the national budget to the Israeli-Arab and
other minority communities. Based on the application of these rules to 2015 budget figures,
the plan would result in an allocation of 15 billion NIS (approximately $4.2 billion) over five
years to Israeli-Arab and other minority communities. The goal of the public transit part of
both resolution 1539 and 922, in particular, was to connect Arab localities that were previously
unconnected, or inadequately connected, to the public transportation infrastructure.
Resolution 922 stipulated that either 40% of the national development budget or 100
million NIS per year (whichever is greater) will be allocated to transportation services in
Israeli-Arab communities, with the goal of closing the gap in access between Israeli-Arab
and Jewish communities entirely by 2022. In addition, the Ministry of Transportation is
tasked with improving accessibility of transport data, such as information regarding schedule,
prices, and so on, both online and on-site, in Arabic. Unlike the earlier 2010 resolution 1539,
Resolution 922 did not restrict its activities to a rigid list of priority towns, but instead its
programs could be extended to all localities that had a non-Jewish (i.e. Arab, Druze, or
Circassian) majority.
In 2016, the first year of implementation, funding was invested in new road construction,
the introduction of Arabic language information on public transit services, and the introduc-
tion of new bus lines and extension and expansion of existing lines (Inter-Agency Task Force
on Israeli Arab Issues, 2017). Below, we look at the earlier period preceding resolution 922
to assess whether increases in access to public transit – measured in the number of bus lines,
the connectedness of a town to other cities, and the frequency of bus trips serving a given
town – is associated with increases in formal sector employment. We analyze these relation-
ships separately for Jewish towns and for non-Jewish minority towns. If public transit policy
measures are having a discernible effect on employment outcomes—especially in non-Jewish
towns—this will be a good signal for the future of resolution 922. In particular, it will suggest
that increasing access to public transit, by itself, can have a tangible effect on the economic
inclusion of the Israeli-Arab population.
8

5 Data and Analysis
To explore the relationship between investment in public transit and employment in Israel,
we compile an original town-year dataset, which includes information on employment, public
transit, and other relevant variables for 1,322 towns across Israel, 116 of which have a non-
Jewish majority of their population (see Table 1). The vast majority of those 116 non-Jewish
towns are majority Arab.
Our employment data comes from individualized social security and tax records from the
Israeli National Insurance Institute (Bituach Leumi), and thus is not subject to the same
biases as self-reported data. It includes variables on the size of the working-age population
and the number of employed people by gender, from which we create measures of the overall
(EMPRATE T ), male (EMPRATE M) and female (EMPRATE F ) employment rates.
The dataset also includes information on the mean and median income by gender for each
town in our dataset. The data covers 2000 to 2015, thus we are able to examine employment
outcomes following Resolution 1539 (2010) but, at least in this initial study, not following
Resolution 922 (2015). Further, it is important to keep in mind that our data reflects employ-
ment rates and median incomes for Jewish residents of Jewish towns and Arab residents of
Arab-majority towns, however it does not include data for Arab residents of Jewish-majority
or mixed towns.
Figure 3 shows the trend in employment rates by gender for Jewish and non-Jewish towns
from 2000 to 2015 (left panel) in addition to the trends in median incomes by gender over
the same period (right panel). A vertical line is drawn at 2011, the first year that the policies
associated with Resolution 1539 would have begun. Starting with male employment, there is
little difference in employment rates; however, male Jewish workers earn significantly higher
incomes that their Arab counterparts. For example, in 2015, the median income for an
employed male in the formal sector residing in a Jewish town was 9, 907 NIS (when averaged
across all Jewish towns), but only 6, 668 for an employed male residing in a non-Jewish town.9
As for female employment (Figure 3, bottom-left panel), in recent years Israel has wit-
nessed a sizable increase in share of women employment in Jewish towns (from 58% in 2000
to 68% in 2015), and a rather dramatic (72% percent) increase in the share of women employ-
ment in non-Jewish towns (from 25% in 2000 to 43% in 2015). Interestingly the income gap
between employed women residing in Jewish towns and those residing in non-Jewish towns
has also increased over this period: while in 2000 the mean income gap for employed women
9Low rates of labor force participation by ultra-Orthodox males likely reduce the average employment ratesfor Jewish towns.
9

in the formal sector was 2, 381 NIS, the gap rose to 3, 254 in 2015 (Figure 3, bottom-right).
This suggests that the increase in female employment in the Arab sector is disproportionally
concentrated among low-skilled workers. Figure 4 shows similar information for the non-
Jewish towns only, distinguishing between those that were prioritized by Resolution 1539 and
those that were not. We can see that the priority towns followed nearly identical trends in
male and female employment and incomes prior to the intervention.
There are a number of reasons why female labor force participation rates are relatively low
in the Israeli-Arab community, including location, fertility rates, religious affiliation, and tra-
ditional gender norms (Lewin-Epstein and Semyonov, 1992; Yashiv and Kasir, 2013). Israeli-
Arab women are often engaged in informal forms of work; marriage and motherhood are
associated with lower participation in the formal labor market, as women take on more house-
hold and family tasks (Miaari, 2012; Khattab, 2002).
60
65
70
75
Empl
oym
ent r
ate
(mal
e)
2000 2005 2010 2015
JewishNon-Jewish
Male formal employment
2000
4000
6000
8000
10000M
edia
n in
com
e (m
ale)
2000 2005 2010 2015
Male median income
20
30
40
50
60
70
Empl
oym
ent r
ate
(fem
ale)
2000 2005 2010 2015
Female formal employment
2000
4000
6000
8000
10000
Med
ian
inco
me
(fem
ale)
2000 2005 2010 2015
Female median income
Figure 3: Figure provides information on male and female employment rate and median income(nominal New Israeli Shekels, NIS) in the formal sector by year, for both Jewish and non-Jewishtowns. Formal employment is weighted by the total size of the workforce in each town, while medianincome is weighted by the number of workers employed in the formal sector.
Our data on public transit comes from Adalya, a consulting firm that worked with the
Ministry of Transportation to implement its spending program in Arab communities. The
transit data includes information on the number of unique bus lines that services a town
10

(LINES), the number of mandated bus trips (DAY TRIPS), and, for a smaller number
of towns, the number of cities greater than 20,000 residents to which that town is directly
connected, without transfer, by public bus (CONNECT ). Note that DAY TRIPS does not
measure actual usage of the public bus system, but instead measures the frequency of bus
service to a town.10 Transit information at the town-year level is available from 2011 to 2016.
60
65
70
75
Empl
oym
ent r
ate
(mal
e)
2000 2005 2010 2015
Non-priorityPriority
Male formal employment
2000
3000
4000
5000
6000
7000
8000
Med
ian
inco
me
(mal
e)
2000 2005 2010 2015
Male median income
25
30
35
40
45
Empl
oym
ent r
ate
(fem
ale)
2000 2005 2010 2015
Female formal employment
2000
3000
4000
5000
Med
ian
inco
me
(fem
ale)
2000 2005 2010 2015
Female median income
Figure 4: Figure provides information on male and female employment rate and median income(nominal New Israeli Shekels, NIS) in the formal sector by year, for non-Jewish “priority” and “non-priority” towns, as defined by Resolution 1539. Formal employment is weighted by the total size ofthe workforce in each town, while median income is weighted by the number of workers employed inthe formal sector.
Figure 5 provides information on the recent trend in the three public transportation vari-
ables. The figure shows that, following government resolution 1539, some (but not all) trans-
portation service gaps between Jewish and non-Jewish towns are closing. First, focusing on
the number of lines servicing Jewish and Arab towns is almost equal (top-left panel). In-
terestingly, while in 2012, on average, non-Jewish towns had 8.05 lines, by 2016 the average
increased to 8.93 – almost one additional line for each town. However, when broken down by
priority status (top-right panel), it is evidenced that this increase is disproportionally concen-
trated in those towns identified as priority towns in resolution 1539, where the average number
10Day trips are measured for a given work week Tuesday.
11
of lines increased from 18.5 to 21.5 (about an 18% increase over the period). In non-priority
Arab towns, the number of lines increased, but at lower rate: from 6.34 lines to 7.01 lines, or
a 12% increase over the 2011-2016 period.
The closing of the transportation gap is even more pronounced for the total number of
mandated daily bus trips (on Tuesdays) servicing each town – a measure of the frequency of
bus service for each town.11 In 2011 Jewish towns, on average, had 119 day trips compared to
101 day trips of lines servicing non-Jewish towns; by 2016 mean total number of day trips in
Arab towns slightly surpassed Jewish towns: 146 to 141 (Figure 5, middle-left panel). Again,
consistent with the focus of Resolution 1539 on a relatively small number of priority towns,
the mean total number of day trips in priority towns increased by 45% from 277 to 402 over
the 2011-2016 period (middle-right panel).
However, it is important to note that even though both the number of unique lines and the
number of total trips increased over the period, Arab towns were not connected necessarily
to many additional towns in 2016, as compared to 2011 (5, bottom panel). Consider, for
example, the Arab priority towns: in 2011 they were connected, on average, to 25.9 other
towns with population greater than 20,000 residents, while in 2016 the figure increased to
26.9 or less that 4% increase. For non-priority Arab towns the connectivity increase is slightly
larger (10% from 11 to 12.3), but still a far cry from Jewish localities that are connected on
average to about 33 large towns.
5.1 Descriptive Results
What is the relationship between changes in public transit provision and employment? The
four panels of figure 6 plot the relationship between change in the number of bus lines between
2011 and 2015 and the change in male (bottom panels) and female (top panels) employment
over that period. While we do have observations on our transportation variables from 2016,
our employment data only covers through 2015, so we focus on change up until that year in
the figures below.12 The left panels show non-Jewish towns, and the right panels show Jewish
towns. We do not see a positive relationships in these subsamples, with the exception of a
very slight positive slope for female employment rate in the non-Jewish towns.
Note that while informative, the plots in Figure 6 pool together towns of all sizes and
are only depicting bivariate relationships. If new bus lines were added in towns that were
more likely to see increases in employment rates over the four-year time period for unrelated
11The day trips is winsorized to adjust for 2% of extreme values.12In these plots, we drop observations in the second percentile and lower and the 98th percentile and higher
in ∆LINES and ∆EMP .
12

6
8
10
Line
s
2011 2012 2013 2014 2015 2016
JewishNon-Jewish
Lines (All)
5
10
15
20
25
Line
s
2011 2012 2013 2014 2015 2016
Non-priorityPriority
Lines (non-Jewish only)
100
110
120
130
140
150
Day
trip
s
2011 2012 2013 2014 2015 2016
Day trips (All)
100
200
300
400
Day
trip
s
2011 2012 2013 2014 2015 2016
Day trips (non-Jewish only)
10
20
30
40
Con
nect
ed to
wns
2011 2012 2013 2014 2015 2016
Connected towns (All)
10
20
30
40
Con
nect
ed to
wns
2011 2012 2013 2014 2015 2016
Connected towns (non-Jewish only)
Figure 5: Figure provides information on the number of lines and number of day trips by year, forboth Jewish and non-Jewish towns (left-panels). In the three right panels, the data is subsetted toonly include non-Jewish town and then broken down by whether or not the town is one of the 13priority Arab towns.
reasons, then these plots could be overestimating the association between change in bus lines
and change in employment. Conversely, if lines were added to towns that were more likely to
see decreases in employment rates over this time period, then these plots may be underesti-
mating the association between change in lines and change in employment. Below, we turn to
multivariate analysis, exploiting town- and year-level variation, to understand how changes in
public transit shape employment outcomes.
5.2 Regression Results
We run a set of two-way fixed effects models regressing employment rate (overall, male,
and female) on each of our independent variables separately (LINES, DAY TRIPS, and
CONNECT ). Note that DAY TRIPS is winsorized to replace extreme outliers. All models
include locality indicators, year indicators, and locality-specific time trends. We interpret
the coefficients on our variables of interest as the effect of a one-unit increase – i.e. an ad-
ditional bus line, an additional connected city, or an additional daily trip – on employment
13

-5
0
5
10
15
Cha
nge
in E
MP_
F
-5 0 5 10Change in LINES
Female employment - Arab towns
-30
-20
-10
0
10
20
Cha
nge
in E
MP_
F
-5 0 5 10 15Change in LINES
Female employment - Jewish towns
-10
0
10
20
Cha
nge
in E
MP_
M
-5 0 5 10Change in LINES
Male employment - Arab towns
-20
-10
0
10
20
Cha
nge
in E
MP_
M-5 0 5 10 15
Change in LINES
Male employment - Jewish towns
Figure 6: Figure plots change in the number of bus lines serving a town between 2011 and 2015 bychange in the male (bottom panels) and female (top panels) employment rates over the same period.The results are broken out by minority/Arab towns (left panels) and Jewish towns (right panels).
rates. These coefficients are purged of any time-invariant factors that are specific to individ-
ual towns, year-specific shocks that affect the whole sample, and time-varying trends within
towns.
In other words, all fixed, time invariant reasons that a particular town is more likely to have
better employment outcomes – for example, being located closer to an urban center – drop out
and do not impact at all the estimated effects of public transit. Further, if some specific shock
affected employment outcomes equally across the sample in a particular year, we are also able
to account for this in our estimation strategy. Finally, the underlying trend of employment
outcomes for each town due to all other factors except the public transit intervention is also
taken into account and thus these town-specific trend will also not impact our coefficients of
interest.
Our study’s main results are presented in Table 2: for change in number of unique lines
servicing a locality (top panel); for change in the number of day trips (middle panel); and for
changes in the number of connected towns (bottom panel).
Starting with changes in the number of unique bus lines (top panel), we find no discernible
14

effect on formal employment in Jewish towns, but we observe a positive, significant effect
on both male and female formal employment in minority (non-Jewish) towns. Similarly,
when exploring the effect of connecting a locality to one additional town of at least 20,000
residents (the bottom panel of Table 2), we only find significant effects for non-Jewish localities.
Note that we have a smaller number of observations for which the connectivity variable was
available, so the results we observe here should only be generalized to the full sample with
caution. Moving to the middle panel of Table 2, which reports the effects of change in the
number of scheduled bus trips per town on a Tuesday, we do not find that an additional daily
trip is associated with greater employment in either Jewish or minority towns.
Given that the three proxy variables for public transit—lines, frequency of bus rides and
connectivity to other towns—produce slightly different results, we turn to compare the relative
effects of these variables in a single framework. In Tables 3–4, we estimate models that include
all of these variables together. In Table 3, the outcome of interest is female employment
(EMPRATE F ), and in Table 4, the outcome is male employment (EMPRATE M). Again,
we run these estimations separately for Jewish and non-Jewish towns and for the combined
sample.
Since two-way fixed effects models only parse out time-invariant town-level factors, in the
last three columns of each table, we add a relevant time-variant control – namely, the number
of children enrolled in state-provided daycare centers per 1,000 people (KIDSPOP W ).13
Starting with female employment (Table 3), we find that when all three transit variables
are included, only the number of lines remains positively correlated with female employment
in non-Jewish towns. Holding constant connectedness of a town and the frequency of bus
trips in that town, we observe that an additional line is associated with an increase of female
employment by 0.20 percentage points. Importantly, this relationship remains positive and
significant also after controlling for daycare availability. While the inclusion of CONNECT
reduces the size of our sample, we are encouraged to see that the estimated effect of LINES
remains significant for female employment in minority towns.
While not shown here, we also explore whether the effect of new bus lines is conditional
on the size of towns and whether or not they are located in the periphery.14 We do not
find evidence that either peripherality nor population size moderate the relationship between
bus lines and employment. In addition, we estimate models of female employment in minority
towns dropping towns that are extreme positive outliers in terms of aggregate change in female
13As with DAY TRIPS, this variable is also winsorized to adjust extreme outliers. The Ministry of Welfareprovided us with information on the number of children enrolled in daycares by town and year.
14Peripheral town are ones that their residents receive tax benefits since the government considers themlocated “in the periphery.”
15

employment from 2011 to 2015 and with a winsorized version of LINES, and the magnitude
and statistical significance of the coefficient on lines does not change. This increases our
confidence that the result linking bus lines to female employment is not driven by outliers.
In other words: neither Arab towns that have a very large number of bus lines compared to
all other towns nor Arab towns that saw very dramatic changes in female employment rates
during this period are not driving our results. Finally, we also estimated a version of our main
regression of employment outcomes on the number of bus lines (top panel of Table 2) where
we use the natural logarithm of the number of lines instead of the raw number of lines as our
main independent variable (log(LINES)). If the effect of an additional bus line was larger for
towns that started out with much fewer lines as compared to towns that already had a large
number of lines – in other words, if there were decreasing marginal returns to the addition of
bus lines on employment – we would expect log(LINES) to be significant. However, we do
not find any significant effect between log(LINES) and employment outcomes.
Moving to male employment (Table 4), the coefficient on LINES remains significant at
a slightly lower level than the results with female employment when all transit variables are
included in the model. In column 4, however, when the daycare variable is included, the effect
of LINES is similar in magnitude as column 1 but no longer statistically significant.
We conclude that, at least in the 2011-2015 period, adding new bus lines seems to be the
most consequential form of public transit expansion for formal employment in Arab localities.
Below, we attempt to capture the size of these effects on employment at the aggregate level.
The subsequent section concludes with some discussion of the implications of these results for
policy and research moving forward.
5.3 Robustness Checks
We report two additional checks to evaluate the robustness of our core results. First, we use
an alternative definition of the working-age population to include only those between 25 and
65 years old. If employment among 18- to 24-year-olds is systematically more likely in the
Arab towns, this could undermine the implications of our comparative analysis across Jewish
and Arab towns. When we restrict our attention to the 25-65 age range, we still see that our
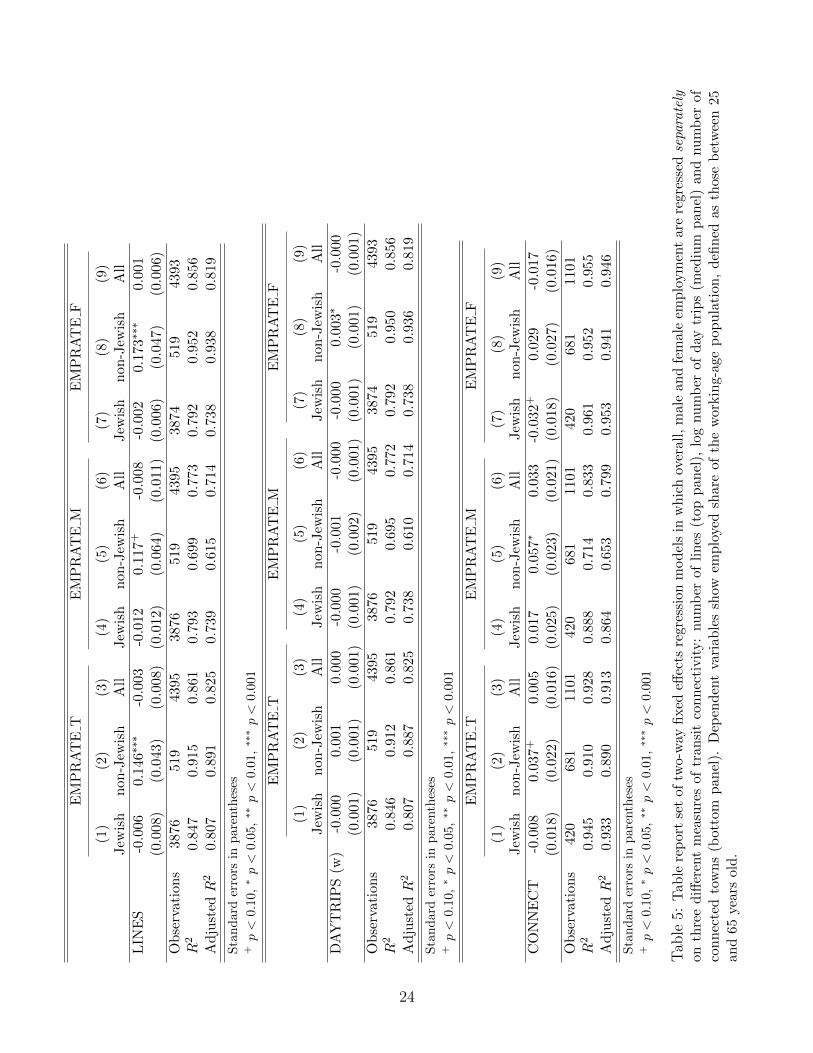
main results hold (see tables 5, 6, and 7).
Second, we incorporate employment data from 2016, the first year of implementation of
Resolution 922. While we do not expect the investments associated with Resolution 922 that
began in 2016 to have an immediate, large-scale impact, extending our analysis to include one
more year of data will allow us to assess whether, for example, the relationship we observe
16

between bus lines and female employment in minority towns still holds. Indeed, our results
(reported in tables 8, 9, 10) do show that the effect of lines on female employment remains
positive and significant, albeit the magnitude of the effect is smaller.
6 Discussion
Given the apparent importance of adding lines, we turn to estimate the substantive impli-
cations of adding lines on formal employment. As shown at the top panel of Table 2, every
additional bus lines in Arab towns increases male employment by 0.12 percentage points and
female employment by 0.17 percentage points. Using data from the Israeli National Insurance
Institute, we estimate the total size of the working age population across all 116 non-Jewish
towns to be 347, 279 and 340, 768 for male and female, respectively. Multiplying the average
change in bus lines in Arab localities over the period (1.62), size of those labor market and the
regression coefficients, we estimate that between 2011 and 2015 investment in public transit
culminated in 675 formal sector jobs for men and 938 jobs for women residing in Arab towns.
Since we saw above that the increase in lines was uneven across Arab towns’ priority
status, we further reestimate our “lines” regression model separately for Arab towns that were
and were not prioritized in Resolution 1539. We find that female employment in Arab towns
responds much more positively to an increase in the number of bus lines in priority towns (point
estimate=0.24, p-value= 0.029) as compared to non-priority towns (point estimate=0.13, p-
value= 0.020). By contrast, male employment seems to have only increased in the thirteen
priority towns (point estimate=0.23, p-value= 0.032), but not elsewhere (point estimate=0.06,
p-value= 0.437).
On one hand, this provides validation that increased investment does have an impact:
our findings suggests that employment gains in Arab towns in 2011-2015 due to public transit
investments took place almost exclusively in areas where most investments were made prior to
government Resolution 922. On the other hand, the fact that we find that the effect of adding
lines on formal employment is concentrated in a small number of towns specifically targeted
by the 2010 resolution also raises some questions. First, these thirteen towns benefited most
from additional targeted investments in that period (as part of resolution 1539), and so there
is a possibility that the gains in employment may be due to investments in these priority
towns over the study period that are unrelated to public transit. Second, the thirteen priority
towns are not similar to other Arab localities: they are bigger, have better infrastructure, and
are far better governed than an “average” Arab town. We cannot say with certainty whether
all Arab-majority towns could reap the same employment benefits as these priority towns
17

following an investment in public transit.
In summary, we find initial evidence that an increase in the number of bus lines serving
non-Jewish (Arab or other minority) towns has a significant positive relationship with formal
employment outcomes.15 This relationship seems to be somewhat stronger and more robust
for Arab women as compared to men. Looking at the reduced sample of towns for which we
have data on a range of variables – including the extent of connectivity by public bus to other
large towns and cities, and the number of children in government-provided daycare – we still
observe a significant association between bus lines and female employment in Arab towns.
We conclude with several disclaimers about the analysis thus far, and point to directions for
future research. First, is worth emphasizing that our analysis of implications of investments in
public transit relies exclusively on data that measures access and availability, but not actual
usage of public bus lines in these towns.16 The natural next step in this research would be
to integrate data on actual usage of public transportation, to ensure that the introduction of
new bus lines, the increased frequency of lines, and the introduction of new connections to
larger towns and cities actually results in increased uptake of public transit services by Israeli
Arab residents.
Second, the dual challenges remain of increasing the number of bus stops within towns
and also upgrading infrastructure so that new bus routes can be introduced in areas that were
previously inaccessible. For many Arab towns, even if they are served by a bus line, the bus
only stops on the main road inside the town or on the road just outside the town, rather than
on the streets inside the town. In future analysis, we might observe larger and more robust
effects if the introduction of new bus lines was accompanied by greater efforts to service the
interior of towns and to upgrade the road systems. Indeed, adequate local infrastructure is a
prerequisite for the introduction of new public buses.
Third, it is important that public transit interventions adopted at the national level – as
part of Resolution 922 and beyond – be driven by local-level demand. In our research for this
report, we learned about the efforts of NGOs such as Sikkuy, that have convened local public
hearings and meetings in a selection of Arab-majority towns to define the locality’s public
transit needs. These efforts led, for example, to an increase in the frequency of bus trips in
the community of Isfiya to a local university based on the students’ needs (Correspondence
15Note that our regression estimates would be downward biased if public transit increased employment inthe informal sector (not captured by official Bituach Leumi data).
16Relatedly, we conduct an auxiliary analysis using an alternative measure of public transit connectivity,developed by Adalya, based on residential coverage. Specifically, Adalya split towns into small residential grids(250× 250 meters), and constructed a coverage measure that is equal to the share of grids that are serviced bya bus line. Unfortunately, Adalaya has this measure for only 2012 and 2017. Regressing change in employmentin that period on the change in this coverage measure did not produce significant findings.
18
with the authors, May 22 2018). While our results suggest that the introduction of new
lines has positive welfare implications beyond connectivity, policies should be tailored to local
contexts and needs.
Forth, we note that the effects of public transit investment on employment outcomes may
be modest so long as other factors unrelated to transportation are simultaneously depressing
employment among the Israeli-Arab community. For women, these factors may include the
traditional importance of women in non-formal employment in the household that are substi-
tuting for, or precluding, entry into the formal labor market. However, as the demographic
trends show, increasing integration of Israeli-Arab women into the labor market could make
sizable contributions to Israel’s long-term economic growth. Public transit could be just one
piece of the puzzle.
Finally, we wish to remind our readers that an effective public transit system is important
for reasons other than employment. Public transit systems improve citizens’ welfare also
by increasing leisure opportunities, improving the ability to visit friends and family, and
improving accessibility to high education institutions. Measuring the effect of public transit
on such outcomes is another important avenue for future research.
References
Blumenberg, Evelyn and Michael Manville. 2004. “Beyond the Spatial Mismatch: WelfareRecipients and Transportation Policy.” Journal of Planning Literature 19(2):182–205.
Government of Israel. 2016. A systemic plan for integration economic development of Arabsociety by correcting distortions in government allocation mechanisms. Technical reportMinistry of Finance.
Grengs, Joe. 2010. “Job accessibility and the modal mismatch in Detroit.” Journal of Trans-port Geography 18:42–54.
Hellerstein, Judith K., David Neumark and Melissa McInerney. 2008. “Spatial mismatch orracial mismatch?” Journal of Urban Economics 64:464–479.
Inter-Agency Task Force on Israeli Arab Issues. 2016. Government Resolution 922: EconomicDevelopment Plan for the Arab Sector. Current Status, Government Workplans and CivilSociety Involvement. Technical report Inter-Agency Task Force on Israeli Arab Issues.
Inter-Agency Task Force on Israeli Arab Issues. 2017. Government Resolution 922 Five YearEconomic Development Plan for Arab Society: Update on First Year Implementation. Tech-nical report Inter-Agency Task Force on Israeli Arab Issues.
19
Khattab, Nabil. 2002. “Ethnicity and Female Labour Market Participation: a New Look atthe Palestinian Enclave in Israel.” Work, Employment and Society 16(1):91–110.
Lewin-Epstein, Noah and Moshe Semyonov. 1992. “Modernization and Subordination: ArabWomen in the Israeli Labour-Force.” European Sociological Review 8:39–51.
Miaari, Sami. 2012. Arab Women in the Labour Market: Empirical Implications and PolicyOrientation. Technical report The Galilee Society - The Arab National Society for HealthResearch and Services.
Morris, Benny. 1987. The birth of the Palestinian refugee problem, 1947-1949. Vol. 15 Cam-bridge [Cambridgeshire]; New York: Cambridge University Press.
Phillips, David C. 2014. “Getting to work: Experimental evidence on job search and trans-portation costs.” Labour Economics 29:72–82.
Smooha, Sammy. 2013. Still Playing by the Rules: Index of Arab-Jewish Relations in Israel2012: Findings and Conclusions. University of Haifa.
Yashiv, Eran and Nitsa Kasir. 2013. “Arab Women in the Israeli Labor Market: Character-istics and Policy Proposals.” Israel Economic Review 10(2):1–41.
Zenou, Yves. 2009. “Urban search models under high-relocation costs. Theory and applicationto spatial mismatch.” Labour Economics 16:534–546.
Zenou, Yves. 2013. “Spatial versus social mismatch.” Journal of Urban Economics 74:113–132.
20

count mean sd min maxLINES 5477 8.7 23.9 0 466DAYTRIPS 5477 191.3 917.1 0 17322CONNECT 1302 20.4 17.5 0 96EMPRATE T 20067 62.9 14.7 2 100EMPRATE M 20008 67.2 14.7 2 100EMPRATE F 19937 59.3 17.6 1 100KIDSPOP w 3012 34.9 31.6 0 144N 21154
count mean sd min maxLINES 4829 8.7 25.2 0 466DAYTRIPS 4829 199.8 973.6 0 17322CONNECT 490 32.0 17.5 4 96EMPRATE T 14250 66.3 12.1 3 100EMPRATE M 14231 68.3 13.7 9 100EMPRATE F 14233 64.4 11.8 8 100KIDSPOP w 2264 37.8 30.5 0 144N 15206
count mean sd min maxLINES 648 8.7 10.6 0 90DAYTRIPS 648 127.8 200.6 2 2431CONNECT 812 13.4 13.3 0 67EMPRATE T 1825 49.7 9.4 7 81EMPRATE M 1825 68.0 8.2 17 100EMPRATE F 1818 32.0 12.0 2 79KIDSPOP w 362 7.4 9.5 0 108N 1956
Table 1: Descriptive statistics of the full sample (top), the Jewish-majority towns (middle)and the non-Jewish towns (bottom).
21

EM
PR
AT
ET
EM
PR
AT
EM
EM
PR
AT
EF
(1)
(2)
(3)
(4)
(5)
(6)
(7)
(8)
(9)
Jew
ish
non
-Jew
ish
All
Jew
ish
non
-Jew
ish
All
Jew
ish
non
-Jew
ish
All
LIN
ES
-0.0
11+
0.1
44∗∗
-0.0
07-0
.016
0.11
6+
-0.0
12-0
.007
0.1
70∗
∗∗-0
.003
(0.0
06)
(0.0
44)
(0.0
06)
(0.0
11)
(0.0
66)
(0.0
10)
(0.0
05)
(0.0
45)
(0.0
05)
Ob
serv
ati
on
s3876
519
4395
3876
519
4395
3875
519
439
4R
20.8
840.9
08
0.88
20.
836
0.68
20.
806
0.81
70.
948
0.8
63
Ad
just
edR
20.8
550.8
82
0.85
10.
793
0.59
30.
756
0.77
00.
933
0.8
28
Sta
nd
ard
erro
rsin
par
enth
eses
+p<
0.1
0,∗p<
0.05
,∗∗
p<
0.0
1,∗∗∗p<
0.00
1
EM
PR
AT
ET
EM
PR
AT
EM
EM
PR
AT
EF
(1)
(2)
(3)
(4)
(5)
(6)
(7)
(8)
(9)
Jew
ish
non
-Jew
ish
All
Jew
ish
non
-Jew
ish
All
Jew
ish
non
-Jew
ish
All
DA
YT
RIP
S(w
)-0
.000
0.00
1-0
.000
-0.0
00-0
.001
-0.0
00-0
.001
∗0.0
02
-0.0
01(0
.001
)(0
.002
)(0
.001
)(0
.001
)(0
.002
)(0
.001
)(0
.000
)(0
.002
)(0
.000)
Ob
serv
ati
on
s38
76
519
4395
3876
519
4395
3875
519
4394
R2
0.88
40.9
050.
881
0.83
50.
678
0.80
50.
817
0.9
46
0.863
Ad
just
edR
20.
854
0.8
780.
851
0.79
20.
589
0.75
50.
770
0.9
31
0.828
Sta
nd
ard
erro
rsin
par
enth
eses
+p<
0.1
0,∗p<
0.05
,∗∗
p<
0.0
1,∗∗∗p<
0.00
1
EM
PR
AT
ET
EM
PR
AT
EM
EM
PR
AT
EF
(1)
(2)
(3)
(4)
(5)
(6)
(7)
(8)
(9)
Jew
ish
non
-Jew
ish
All
Jew
ish
non
-Jew
ish
All
Jew
ish
non
-Jew
ish
All
CO
NN
EC
T-0
.004
0.0
42∗
0.01
30.
013
0.06
9∗∗
0.03
4+-0
.018
0.0
25
-0.0
04
(0.0
15)
(0.0
20)
(0.0
15)
(0.0
22)
(0.0
23)
(0.0
19)
(0.0
13)
(0.0
25)
(0.0
14)
Ob
serv
ati
on
s420
681
110
142
068
111
0142
0681
1101
R2
0.95
90.9
110.9
320.
921
0.72
70.
859
0.96
40.9
48
0.952
Ad
just
edR
20.
950
0.8
930.9
180.
904
0.66
90.
830
0.95
70.9
37
0.942
Sta
nd
ard
erro
rsin
par
enth
eses
+p<
0.1
0,∗p<
0.05
,∗∗
p<
0.0
1,∗∗∗p<
0.00
1
Tab
le2:
Tab
lere
port
set
oftw
o-w
ayfi
xed
effec
tsre
gres
sion
mod
els
inw
hic
hov
eral
l,m
ale
and
fem
ale
emp
loym
ent
are
regre
ssed
separately
on
thre
ed
iffer
ent
mea
sure
sof
tran
sit
con
nec
tivit
y:
nu
mb
erof
lin
es(t
opp
anel
),lo
gnu
mb
erof
day
trip
s(m
ediu
mp
an
el)
and
nu
mb
erof
con
nec
ted
tow
ns
(bott
om
pan
el).
Dep
end
ent
vari
able
ssh
owem
plo
yed
shar
eof
the
wor
kin
g-ag
ep
op
ula
tion
,d
efin
edas
those
bet
wee
n18
an
d67
years
old
.
22

(1) (2) (3) (4) (5) (6)Jewish non-Jewish All Jewish non-Jewish All
LINES -0.006 0.196∗∗∗ -0.002 -0.008 0.177∗∗ -0.006(0.005) (0.049) (0.005) (0.009) (0.065) (0.009)
DAYTRIPS (w) -0.001∗ -0.001 -0.001 -0.001∗ -0.003 -0.001∗
(0.000) (0.002) (0.000) (0.000) (0.003) (0.000)CONNECT -0.006 -0.016 0.001 0.019 0.004 0.025
(0.018) (0.034) (0.018) (0.020) (0.049) (0.018)KIDSPOP w 0.019 0.012 0.016
(0.035) (0.094) (0.035)Observations 350 519 869 280 345 625R2 0.960 0.948 0.948 0.968 0.938 0.953Adjusted R2 0.948 0.933 0.933 0.956 0.914 0.936
Standard errors in parentheses+ p < 0.10, ∗ p < 0.05, ∗∗ p < 0.01, ∗∗∗ p < 0.001
Table 3: Dependent variable: Female employed share of the working-age population (18-67years old).
(1) (2) (3) (4) (5) (6)Jewish non-Jewish All Jewish non-Jewish All
LINES -0.016 0.147+ -0.011 -0.025+ 0.136 -0.021+
(0.011) (0.078) (0.011) (0.013) (0.093) (0.013)DAYTRIPS (w) -0.000 -0.004+ -0.000 0.000 -0.004∗ 0.000
(0.001) (0.002) (0.001) (0.001) (0.002) (0.001)CONNECT 0.016 0.013 0.017 0.017 0.005 0.015
(0.024) (0.042) (0.023) (0.031) (0.048) (0.024)KIDSPOP w -0.151∗ 0.005 -0.109+
(0.073) (0.090) (0.059)Observations 350 519 869 280 345 625R2 0.937 0.684 0.871 0.953 0.742 0.911Adjusted R2 0.919 0.593 0.836 0.936 0.643 0.879
Standard errors in parentheses+ p < 0.10, ∗ p < 0.05, ∗∗ p < 0.01, ∗∗∗ p < 0.001
Table 4: Male employed share of the working-age population (18-67 years old).
23
EM
PR
AT
ET
EM
PR
AT
EM
EM
PR
AT
EF
(1)
(2)
(3)
(4)
(5)
(6)
(7)
(8)
(9)
Jew
ish
non
-Jew
ish
All
Jew
ish
non
-Jew
ish
All
Jew
ish
non
-Jew
ish
All
LIN
ES
-0.0
06
0.1
46∗∗
∗-0
.003
-0.0
120.
117+
-0.0
08-0
.002
0.17
3∗∗∗
0.0
01
(0.0
08)
(0.0
43)
(0.0
08)
(0.0
12)
(0.0
64)
(0.0
11)
(0.0
06)
(0.0
47)
(0.0
06)
Ob
serv
ati
on
s3876
519
439
538
7651
943
9538
74519
4393
R2
0.84
70.9
150.8
610.
793
0.69
90.
773
0.79
20.9
52
0.856
Ad
just
edR
20.
807
0.8
910.8
250.
739
0.61
50.
714
0.73
80.9
38
0.819
Sta
nd
ard
erro
rsin
par
enth
eses
+p<
0.1
0,∗p<
0.05
,∗∗
p<
0.0
1,∗∗∗p<
0.00
1
EM
PR
AT
ET
EM
PR
AT
EM
EM
PR
AT
EF
(1)
(2)
(3)
(4)
(5)
(6)
(7)
(8)
(9)
Jew
ish
non
-Jew
ish
All
Jew
ish
non
-Jew
ish
All
Jew
ish
non
-Jew
ish
All
DA
YT
RIP
S(w
)-0
.000
0.00
10.
000
-0.0
00-0
.001
-0.0
00-0
.000
0.0
03∗
-0.0
00(0
.001
)(0
.001
)(0
.001
)(0
.001
)(0
.002
)(0
.001
)(0
.001
)(0
.001
)(0
.001)
Ob
serv
ati
on
s38
76
519
4395
3876
519
4395
3874
519
4393
R2
0.84
60.9
120.
861
0.79
20.
695
0.77
20.
792
0.9
50
0.856
Ad
just
edR
20.
807
0.8
870.
825
0.73
80.
610
0.71
40.
738
0.9
36
0.819
Sta
nd
ard
erro
rsin
par
enth
eses
+p<
0.1
0,∗p<
0.05
,∗∗
p<
0.0
1,∗∗∗p<
0.00
1
EM
PR
AT
ET
EM
PR
AT
EM
EM
PR
AT
EF
(1)
(2)
(3)
(4)
(5)
(6)
(7)
(8)
(9)
Jew
ish
non
-Jew
ish
All
Jew
ish
non
-Jew
ish
All
Jew
ish
non
-Jew
ish
All
CO
NN
EC
T-0
.008
0.03
7+0.
005
0.01
70.
057∗
0.03
3-0
.032
+0.
029
-0.0
17
(0.0
18)
(0.0
22)
(0.0
16)
(0.0
25)
(0.0
23)
(0.0
21)
(0.0
18)
(0.0
27)
(0.0
16)
Ob
serv
ati
on
s420
681
110
142
068
111
0142
068
1110
1R
20.
945
0.9
100.9
280.
888
0.71
40.
833
0.96
10.
952
0.9
55
Ad
just
edR
20.
933
0.8
900.9
130.
864
0.65
30.
799
0.95
30.
941
0.9
46
Sta
nd
ard
erro
rsin
par
enth
eses
+p<
0.1
0,∗p<
0.05
,∗∗
p<
0.0
1,∗∗∗p<
0.00
1
Tab
le5:
Tab
lere
port
set
oftw
o-w
ayfi
xed
effec
tsre
gres
sion
mod
els
inw
hic
hov
eral
l,m
ale
and
fem
ale
emp
loym
ent
are
regre
ssed
separately
on
thre
ed
iffer
ent
mea
sure
sof
tran
sit
con
nec
tivit
y:
nu
mb
erof
lin
es(t
opp
anel
),lo
gnu
mb
erof
day
trip
s(m
ediu
mp
an
el)
and
nu
mb
erof
con
nec
ted
tow
ns
(bott
om
pan
el).
Dep
end
ent
vari
able
ssh
owem
plo
yed
shar
eof
the
wor
kin
g-ag
ep
op
ula
tion
,d
efin
edas
those
bet
wee
n25
an
d65
years
old
.
24

(1) (2) (3) (4) (5) (6)Jewish non-Jewish All Jewish non-Jewish All
LINES 0.001 0.178∗∗ 0.002 -0.004 0.186∗∗ -0.003(0.006) (0.057) (0.006) (0.008) (0.063) (0.007)
DAYTRIPS (w) -0.000 0.000 -0.000 -0.001 -0.001 -0.000(0.001) (0.001) (0.001) (0.001) (0.002) (0.001)
CONNECT -0.016 -0.010 -0.002 0.018 -0.004 0.026(0.022) (0.034) (0.018) (0.023) (0.048) (0.020)
KIDSPOP w 0.021 0.043 0.021(0.030) (0.093) (0.031)
Observations 350 519 869 280 345 625R2 0.953 0.952 0.951 0.963 0.946 0.953Adjusted R2 0.940 0.938 0.937 0.949 0.925 0.936
Standard errors in parentheses+ p < 0.10, ∗ p < 0.05, ∗∗ p < 0.01, ∗∗∗ p < 0.001
Table 6: Dependent variable: Female employed share of the working-age population (25-65years old).
(1) (2) (3) (4) (5) (6)Jewish non-Jewish All Jewish non-Jewish All
LINES -0.012 0.158∗ -0.007 -0.021 0.127 -0.018(0.013) (0.072) (0.012) (0.015) (0.098) (0.015)
DAYTRIPS (w) 0.000 -0.004+ -0.000 0.001 -0.003 0.001(0.001) (0.002) (0.001) (0.001) (0.002) (0.001)
CONNECT 0.024 0.001 0.020 0.025 -0.013 0.018(0.027) (0.036) (0.023) (0.032) (0.049) (0.025)
KIDSPOP w -0.086 0.006 -0.061(0.055) (0.096) (0.047)
Observations 350 519 869 280 345 625R2 0.914 0.701 0.859 0.936 0.765 0.901Adjusted R2 0.890 0.616 0.821 0.912 0.676 0.865
Standard errors in parentheses+ p < 0.10, ∗ p < 0.05, ∗∗ p < 0.01, ∗∗∗ p < 0.001
Table 7: Dependent variable: Male employed share of the working-age population (25-65 yearsold).
25

EM
PR
AT
ET
EM
PR
AT
EM
EM
PR
AT
EF
(1)
(2)
(3)
(4)
(5)
(6)
(7)
(8)
(9)
Jew
ish
non
-Jew
ish
All
Jew
ish
non
-Jew
ish
All
Jew
ish
non
-Jew
ish
All
LIN
ES
-0.0
05
0.08
2∗
-0.0
04-0
.007
0.07
9+
-0.0
07-0
.004
0.0
84∗
-0.0
04(0
.004)
(0.0
32)
(0.0
04)
(0.0
05)
(0.0
41)
(0.0
05)
(0.0
03)
(0.0
36)
(0.0
04)
Ob
serv
ati
on
s4752
630
538
247
5263
053
8247
51630
5381
R2
0.90
50.9
470.9
100.
864
0.81
50.
846
0.84
50.9
64
0.893
Ad
just
edR
20.
885
0.9
350.8
910.
836
0.77
20.
814
0.81
20.9
55
0.870
Sta
nd
ard
erro
rsin
par
enth
eses
+p<
0.1
0,∗p<
0.05
,∗∗
p<
0.0
1,∗∗∗p<
0.00
1
EM
PR
AT
ET
EM
PR
AT
EM
EM
PR
AT
EF
(1)
(2)
(3)
(4)
(5)
(6)
(7)
(8)
(9)
Jew
ish
non
-Jew
ish
All
Jew
ish
non
-Jew
ish
All
Jew
ish
non
-Jew
ish
All
DA
YT
RIP
S(w
)0.0
000.
001
0.00
00.
000
0.00
00.
000
-0.0
000.
002+
0.0
00
(0.0
00)
(0.0
01)
(0.0
00)
(0.0
00)
(0.0
02)
(0.0
00)
(0.0
00)
(0.0
01)
(0.0
00)
Ob
serv
ati
on
s47
52
630
5382
4752
630
5382
4751
630
5381
R2
0.90
50.9
460.
910
0.86
40.
813
0.84
60.
845
0.9
63
0.893
Ad
just
edR
20.
885
0.9
340.
891
0.83
60.
770
0.81
40.
812
0.9
55
0.870
Sta
nd
ard
erro
rsin
par
enth
eses
+p<
0.1
0,∗p<
0.05
,∗∗
p<
0.0
1,∗∗∗p<
0.00
1
EM
PR
AT
ET
EM
PR
AT
EM
EM
PR
AT
EF
(1)
(2)
(3)
(4)
(5)
(6)
(7)
(8)
(9)
Jew
ish
non
-Jew
ish
All
Jew
ish
non
-Jew
ish
All
Jew
ish
non
-Jew
ish
All
CO
NN
EC
T-0
.010
0.0
41∗
-0.0
000.
001
0.06
4∗∗
0.01
6-0
.021
∗0.
025
-0.0
13
(0.0
13)
(0.0
19)
(0.0
12)
(0.0
18)
(0.0
23)
(0.0
16)
(0.0
11)
(0.0
23)
(0.0
10)
Ob
serv
ati
on
s490
795
128
549
079
512
8549
0795
1285
R2
0.97
20.9
430.9
530.
946
0.82
30.
903
0.97
40.9
63
0.964
Ad
just
edR
20.
967
0.9
330.9
450.
936
0.79
10.
886
0.97
00.9
56
0.958
Sta
nd
ard
erro
rsin
par
enth
eses
+p<
0.1
0,∗p<
0.05
,∗∗
p<
0.0
1,∗∗∗p<
0.00
1
Tab
le8:
Mai
nre
sult
su
pd
ated
wit
h20
16
emp
loym
ent
dat
a.D
epen
den
tva
riab
les
show
emp
loye
dsh
are
of
the
work
ing-a
ge
pop
ula
tion
,d
efin
edas
thos
eb
etw
een
18an
d67
years
old
.
26

(1) (2) (3) (4) (5) (6)Jewish non-Jewish All Jewish non-Jewish All
LINES -0.003 0.082∗ -0.003 -0.002 0.068 -0.004(0.004) (0.040) (0.004) (0.006) (0.051) (0.006)
DAYTRIPS (w) 0.000 0.000 0.000 0.000 0.001 0.000(0.000) (0.001) (0.000) (0.000) (0.001) (0.000)
CONNECT -0.020 -0.004 -0.017 -0.022 0.003 -0.016(0.013) (0.028) (0.013) (0.015) (0.029) (0.015)
KIDSPOP w 0.027 -0.031 -0.007(0.021) (0.063) (0.023)
Observations 420 630 1050 350 433 783R2 0.972 0.964 0.963 0.973 0.960 0.960Adjusted R2 0.966 0.955 0.954 0.965 0.948 0.949
Standard errors in parentheses+ p < 0.10, ∗ p < 0.05, ∗∗ p < 0.01, ∗∗∗ p < 0.001
Table 9: Dependent variable: Female employment (18-67 years old) updated with 2016 data.
(1) (2) (3) (4) (5) (6)Jewish non-Jewish All Jewish non-Jewish All
LINES -0.007 0.098 -0.007 -0.007 0.048 -0.009(0.006) (0.062) (0.006) (0.008) (0.064) (0.009)
DAYTRIPS (w) 0.000 -0.002 0.000 0.000 -0.003+ 0.000(0.001) (0.002) (0.001) (0.001) (0.002) (0.001)
CONNECT -0.002 0.018 -0.000 -0.012 0.058 -0.006(0.019) (0.041) (0.019) (0.024) (0.042) (0.023)
KIDSPOP w -0.056 0.010 -0.065+
(0.053) (0.062) (0.038)Observations 420 630 1050 350 433 783R2 0.957 0.815 0.911 0.961 0.853 0.924Adjusted R2 0.947 0.772 0.891 0.949 0.811 0.904
Standard errors in parentheses+ p < 0.10, ∗ p < 0.05, ∗∗ p < 0.01, ∗∗∗ p < 0.001
Table 10: Dependent variable: Male employment (18-67 years old) updated with 2016 data.
27