djy3b - physical chemistry ii
TRANSCRIPT

MANONMANIAM SUNDARANAR UNIVERSITY
DIRECTORATE OF DISTANCE & CONTINUING EDUCATION
TIRUNELVELI 627012, TAMIL NADU
B.Sc. CHEMISTRY - III YEAR
DJY3B - PHYSICAL CHEMISTRY II
(From the academic year 2016-17)
Most Student friendly University - Strive to Study and Learn to Excel
For more information visit: http://www.msuniv.ac.in
MANONMANIAM SUNDARANAR UNIVERSITY DIRECTORATE OF DISTANCE AND CONTINUING EDUCATION, TIRUNELVELI
Page 1
III Year
Major II- PHYSICAL CHEMISTRY- II
Manonmaniam Sundaranar University (MSU)
Directorate of distance and continuing Education

MANONMANIAM SUNDARANAR UNIVERSITY DIRECTORATE OF DISTANCE AND CONTINUING EDUCATION, TIRUNELVELI
Page 2
III Year
Major II- PHYSICAL CHEMISTRY- II
UNIT-I CHEMICAL KINETICS
Rate of reaction- -expressing reaction rates- factors influencing rate- order and molecularity
of reactions- simple differential equation for first order, second order and zero order
reactions. Effect of temperature on rate constant. The activation energy. -determination of
Arrhenius frequency factor and energy of activation- The theory of Absolute reaction rates.
UNIT-Il ELECTROCHEMISTRY
Metallic and electrolytic conductance —Definitions of specific, equivalent and molar
Conductance —Variation of conductance with dilution. Transport number~ - determination—
Kohlrausch‘s law —applications — conductometric titrations- Theory of strong electrolytes
—Debye — Huckel — Onsager theory
Galvanic cells — Reversible and Irreversible cells — EMF and its measurement —standard
Hydrogen electrode — calomel electrode —standard reduction potentials — electro chemical
series —significance— potentiometric titrations.
Unit - III PHASEEQUILIBRIA
Phase rule - phase, component, degree of freedom
One-component system: Phase diagrams of Water and Sulphur systems.
.Two, component system:
(i) Simple eutectic: Lead-silver system and potassium iodide-water system.
(ii) Formation of compound with congruent melting point- Magnesium — zinc system
Unit -IV SPECTROSCOPY
Introduction - various types of molecular spectra.
UV-visible spectroscopy types of transitions in molecules - applications
IR spectroscopy theory - stretching and bending vibrations - important spectral regions for
the characterization of functional groups – finger print region – vibrational modes of H2O and
CO2
NMR spectroscopy: Theory of NMR, chemical shift - factors affecting chemical shift -
internal standard, - NMR spectrum of ethanol.

MANONMANIAM SUNDARANAR UNIVERSITY DIRECTORATE OF DISTANCE AND CONTINUING EDUCATION, TIRUNELVELI
Page 3
UNIT.V GROUP THEORPY
Symmetry operations and symmetry elements - identity element - groups and their basic
properties —Abelian and cyclic groups - classification of molecules into point groups - the
symmetry operations of a molecule form a group - C2v and C3v, point groups - group
multiplication tables
NANOCHEMISTRY
Definition - size dependent properties: magnetic, electrical and optical properties — quantum
dots.
Synthesis of nanomaterials - bottom-up and top-down approaches - thin film deposition
catalytic assisted growth - chemical vapour deposition - sol gel method - chemical reduction
Fullerenes - carbon nanotubes -single walled and multi walled nano tubes — structures -
carbon nanofibre - nanocomposites

M.S University-D.D.C.E Unit I
Page 1
UNIT I
CHEMICAL KINETICS
Unit –I
1.0 AIMS AND OBJECTIVES
After studying this unit you should be able to
Explain rate of the reaction
Explain the order of the reaction
Explain the factors affecting the rate of the chemical reaction
Explain The Arrhenius equation
Explain Activation energy
Explain Transition state theory
1.1 INTRODUCTION
Chemical kinetics, also known as reaction kinetics, is the study of rates of chemical
processes. Chemical kinetics includes investigations of how different experimental conditions
can influence the speed of a chemical reaction and yield information about the reaction's
mechanism and transition states, as well as the construction of mathematical models that can
describe the characteristics of a chemical reaction.
1.0 AIMS AND OBJECTIVES
1.1 INTRODUCTION
1.2 RATE OF REACTION
1.3 MOLECULARITY
1.4 RATE CONSTANT
2.0 ORDER OF REACTION
2.1 FIRST ORDER REACTIONS
2.2 SECOND ORDER REACTIONS
2.3 THIRD ORDER REACTIONS
2.4 FACTORS AFFECTING RATE OF CHEMICAL REACTION
3.0 THE ARRHENIUS EQUATION
4.0 ACTIVATION ENERGY
5.0 TRANSITION STATE THEORY
M.S University-D.D.C.E Unit I
Page 2
1.2 RATE OF REACTION
Define Rate of Reaction and also give its units.
The rate of reaction can be defined as the change in the concentration of any one of
the reactants or products per unit time. The rate of the reaction depends on the molar
concentrations of the reactants. The rate of the reaction means the speed with which the
reaction takes place. This is expressed either in terms of decrease in the concentration of a
reactant per unit time or increase in the concentration of a product per unit time. The rate of
reaction varies with time.
Rate of reaction = decrease in the concentration of a reactant / Time interval
= increase in the concentration of a product / Time interval
Consider the reaction:
PCl5 ——————-> PCl3 + Cl2
Suppose in a time interval ∆t, decrease in concentration of PCl5 is ∆ [PCl5] and
increase in the concentration of PCl3 and Cl2are ∆ [PCl3] and ∆ [Cl2] respectively, where
square brackets indicate molar concentrations in moles / litre of the substances involved.
Hence,
Rate of reaction = – ∆ [PCl5] / ∆t = + ∆ [PCl3] / ∆t = + ∆ [Cl2] / ∆t
The minus sign along with the first term is used simply to show that the concentration
of the reactant (PCl5) is decreasing while plus sign along with the other two term is used
simply to show that the concentration of the products (PCl3 and Cl2) is increasing.
Units of the Rate of Reaction:
As concentration is usually expressed in moles / litre and the time is taken in seconds
or minutes, the unit of rate of reaction is moles litre-1
sec-1
or moles litre-1
min-1
Order of reaction:
The sum of concentration terms on which the rate of a reaction actually depends as
observed experimentally is called the order of the reaction i.e. the sum of the powers or
exponents to which the concentration or pressure terms are raised in order to determine the
rate of the reaction.
Order of a reaction is an experimental quantity. A reaction is said to be of the zero
order, first order, second order, and third order if some of concentration terms is equal to 0, 1,
2 and 3 respectively. Example:
Photosynthesis of HCl:
H2 (g) + Cl2 (g) + hν —————> 2HCl
Experimentally, it is found that the rate of reaction is independently of the
concentration of H2 and Cl2. Hence it is a reaction of the zero order. Hence for such reactions:
Rate = k
Dissociation of N2O5
2 N2O5 ————> 4 NO2 + O2

M.S University-D.D.C.E Unit I
Page 3
Experimentally, it is found that the rate of reaction is directly proportional to [N2O5]
i.e. it depends only on one concentration term. Hence the reaction is said to be of first order.
1.4 MOLECULARITY
In case of chemical reactions i.e. reactions involving a number of atoms, ions,
molecules of the reactants in the balanced equation, the chances for all the atoms, ions or
molecules of the reactants to come together and collide are very rare. Hence in such cases, the
reactions are supposed to take place in a number of steps. The slowest step is the rate
determining step.
The number of atoms, ions or molecules taking place in te slowest step i.e. the rate
determining step is called the molecularity of the reaction of complex reactions.
Hence, the molecularity of the reaction must always be a whole number whereas the
order of a reaction can be fractional.
Distinguish between order of a reaction and molecularity of a reaction?
The main difference between the order of a reaction and molecularity of a reaction are
given below:
ORDER OF A REACTION MOLECULARITY OF A REACTION
It is sum of the concentration terms on
which the rate of reaction actually depends
or it is the sum of the exponents of the
concentrations in the rate law equation.
It is the number of atoms, ions or molecules
that must collide with one another
simultaneously so as to result into a
chemical reaction.
It need not be a whole number i.e. it can be
fractional as well as zero.
It is always a whole number.
It can be determined experimentally only
and cannot be calculated.
It can be calculated by simply adding the
molecules of the slowest step.
It is for the overall reaction and no separate
steps are written to obtain it.
The overall molecularity of a complex
reaction has no significance. It is only
slowest step whose molecularity has
significance for the overall reaction.
Even the order of a simple reaction may
not be equal to the number of molecules of
the reactants as seen from the unbalance
equation.
For simple reactions, the molecularity can
usually be obtained from the Stoichiometry
of the equation.
1.5 RATE CONSTANT
Define Rate constant and also discuss its characteristics
Rate constant may be defined as the rate of the reaction when the concentration of
each reactant is taken as unity. That is why the rate constant is also known as specific
reaction rate.

M.S University-D.D.C.E Unit I
Page 4
Characteristics of rate constant:
Some important characteristics of the rate constant are as follows:
1. Rate constant is a measure of the rate of reaction. Greater is the value of the rate
constant, faster is the reaction.
2. Each reaction has a definite value of the rate constant at a particular temperature.
3. The value of the rate constant for the same reaction changes with temperature.
4. The value of the rate constant of a reaction does not depend upon the concentrations of
the reactants.
5. The units of the rate constant depend upon the order of reaction.
2.0 ORDER OF REACTION
"The order of reaction is defined as the sum of all the exponents of the reactants
involved in the rate equation."
It should be noted down that all the molecules shown in a chemical equation do not
determine the value of order of reaction but only those molecules whose concentrations are
changed are included in the determination the order of a reaction. In other words:
"The number of reacting molecules whose concentration alters as a
result of chemical reaction is termed as the order of reaction."
For example:
2NO + O2 --2NO2
dx/dt = k[NO]2[O2] , the reaction is of third order as 2 + 1 = 3
For a reaction maximum order is three and the minimum is zero.
2.1 FIRST ORDER REACTIONS
The reaction in which only one molecule undergoes a chemical change is called first
order reactions.
Example:
N2O5 -- 2NO2 + ½ O2
2.2SECOND ORDER REACTIONS
The reaction in which two molecules undergo a chemical change is called second
order reactions. Example:
2CH3CHO --2CH4 + 2 CO
2.3 THIRD ORDER REACTIONS
The reaction in which only three molecules undergo a chemical change is called third
order reactions. Example:
2NO + O2-- 2NO2

M.S University-D.D.C.E Unit I
Page 5
2.3.1Rate and Order of Reactions
The rate of a chemical reaction is the amount of substance reacted or produced per
unit time. The rate law is an expression indicating how the rate depends on the
concentrations of the reactants and catalysts. The power of the concentration in the rate law
expression is called the order with respect to the reactant or catalyst.
2.3.2First-Order Reactions
A first-order reaction is a reaction that proceeds at a rate that depends linearly on
only one reactant concentration.
2.3.2.1The Differential Representation
Differential rate laws are generally used to describe what is occurring on a molecular
level during a reaction, whereas integrated rate laws are used for determining the reaction
order and the value of the rate constant from experimental measurements. The differential
equation describing first-order kinetics is given below:
Rate=−d[A]/dt=k[A]1=k[A](1)
The "rate" is the reaction rate (in units of molar/time) and k is the reaction rate
coefficient (in units of 1/time). However, the units of k vary for non-first-order reactions.
These differential equations are separable, which simplifies the solutions as demonstrated
below.
2.3.3Second-Order Reactions
Many important biological reactions, such as the formation of double-stranded DNA from
two complementary strands, can be described using second order kinetics. In a second-order
reaction, the sum of the exponents in the rate law is equal to two. The two most common
forms of second-order reactions will be discussed in detail in this section.
Reaction Rate
Integration of the second-order rate law
d[A]/dt=−k[A]2
which is easily rearranged into a form of the equation for a straight line and yields plots
similar to the one shown on the left below.
M.S University-D.D.C.E Unit I
Page 6
The half-life is given by
t1/2=1/k[Ao]
Notice that the half-life of a second-order reaction depends on the initial
concentration, in contrast to first-order reactions. For this reason, the concept of half-life for a
second-order reaction is far less useful. Reaction rates are discussed in more
detail here. Reaction orders are defined here. Here are explanations of zero and first order
reactions.
Case 1: Identical Reactants (A + A → P)
Two of the same reactant (A) combine in a single elementary step.
A+A⟶P
2A⟶P
The reaction rate for this step can be written as
Rate=−1/2d[A]dt=+d[P]dt
and the rate of loss of reactant A
dA/dt=−k[A][A]=−k[A]2
where k is a second order rate constant with units of M-1
min-1
or M-1
s-1
. Therefore,
doubling the concentration of reactant A will quadruple the rate of the reaction. In this
particular case, another reactant (B) could be present with A; however, its concentration does
not affect the rate of the reaction, i.e., the reaction order with respect to B is zero, and we can
express the rate law as v=k[A]2[B]
0.
Case 2: Different Reactants (A + B → P)
Two different reactants (A and B) combine in a single elementary step.
A+B⟶P
The reaction rate for this step can be written as
Rate=−d[A]/dt=−d[B]/dt=+d[P]/dt
and the rate of loss of reactant A
d[A]/dt=−k[A][B]
where the reaction order with respect to each reactant is 1. This means that when the
concentration of reactant A is doubled, the rate of the reaction will double, and quadrupling
the concentration of reactant in a separate experiment will quadruple the rate. If we double
the concentration of A and quadruple the concentration of B at the same time, then the
reaction rate is increased by a factor of 8. This relationship holds true for any varying
concentrations of A or B.
2.3.4 Zero-Order Reactions
In some reactions, the rate is apparently independent of the reactant concentration.
The rates of these zero-order reactions do not vary with increasing nor decreasing reactants

M.S University-D.D.C.E Unit I
Page 7
concentrations. This means that the rate of the reaction is equal to the rate constant, k, of that
reaction. This property differs from both first-order reactions and second-order reactions.
Origin of Zero Order Kinetics
Zero-order kinetics is always an artifact of the conditions under which the reaction is
carried out. For this reason, reactions that follow zero-order kinetics are often referred to as
pseudo-zero-order reactions. Clearly, a zero-order process cannot continue after a reactant
has been exhausted. Just before this point is reached, the reaction will revert to another rate
law instead of falling directly to zero as depicted at the upper left.
There are two general conditions that can give rise to zero-order rates:
1. Only a small fraction of the reactant molecules are in a location or state in which they are
able to react, and this fraction is continually replenished from the larger pool.
2. When two or more reactants are involved, the concentrations of some are much greater
than those of others
This situation commonly occurs when a reaction is catalyzed by attachment to a solid
surface (heterogeneous catalysis) or to an enzyme.
Example 1: Decomposition of Nitrous Oxide
Nitrous oxide will decompose exothermically into nitrogen and oxygen, at a temperature of
approximately 575 °C
2N2O−→−−−> 2N2(g)+O2(g)
This reaction in the presence of a hot platinum wire (which acts as a catalyst) is zero-order,
but it follows more conventional second order kinetics when carried out entirely in the gas
phase.
2N2O⟶2N2 (g)+O2(g)
In this case, the N2O molecules that react are limited to those that have attached themselves
to the surface of the solid catalyst. Once all of the sites on the limited surface of the catalyst
have been occupied, additional gas-phase molecules must wait until the decomposition of one
of the adsorbed molecules frees up a surface site.
Enzyme-catalyzed reactions in organisms begin with the attachment of the substrate to the
active site on the enzyme, leading to the formation of an enzyme-substrate complex. If the
number of enzyme molecules is limited in relation to substrate molecules, then the reaction
may appear to be zero-order.
This is most often seen when two or more reactants are involved. Thus if the reaction
A+B→products (1)
is first-order in both reactants so that
rate=k [A][B] (2)
If B is present in great excess, then the reaction will appear to be zero order in B (and first
order overall). This commonly happens when B is also the solvent that the reaction occurs in.

M.S University-D.D.C.E Unit I
Page 8
Differential Form of the Zeroth Order Rate Law
Rate=−d[A]/dt=k[A]0=k=constant (3)
where Rate is the reaction rate and k is the reaction rate coefficient. In this example, the units
of k are M/s. The units can vary with other types of reactions. For zero-order reactions, the
units of the rate constants are always M/s. In higher order reactions, k will have different
units.
Figure: Rate vs. time (A) and Concentration vs. time for a zero order reaction.
2.4 FACTORS AFFECTING RATE OF CHEMICAL REACTION
Following are the main factors that influence the rate of a chemical reaction.
Different reactants have different energies of activation. Reaction between polar or
ionic molecules is very fast. Oxidation-Reduction reactions are slower than ionic reactions
because they involve transfer of electrons and bond rearrangement. The physical state of
reacting substances are important in determining their reactivities. The reaction in which
ionic solutions are involved also take place at high speed.
2.4.1 CONCENTRATION OF REACTANTS
The concentration of reactants plays an important role in chemical kinetics. It is
usually true that by increasing the amount of reactants, the rate of reaction is increased. As
we know that an increase in concentration of reactants increases the number of molecules.
According to collision theory, the greater the number of molecules the higher is the collision
ratio, consequently faster is the rate of reaction.
2.4.2 SURFACE AREA OF REACTANTS
In heterogeneous reactions, the rate of reaction depends upon the surface area of solid
reactant. Greater the surface area, higher is the rate of reaction. For example finely divided
calcium carbonate (marble) reacts more quickly with hydrochloric acid than calcium
carbonate chips. It is due to the fact that powered calcium carbonate offers larger surface area
to the reacting acid. In other words, by increasing the surface area of reactant, rate of reaction
increases due to greater contact between individual particles and also due to the fact that the
surface molecules reacts more quickly.

M.S University-D.D.C.E Unit I
Page 9
2.4.3 TEMPERATURE
The rate of reaction increases with the rise of temperature. It can be explain by the fact that at
higher temperature, a greater fraction of colliding molecules posse the necessary energy of
activation.Generally an increase of every 10oK in temperature doubles the rate.As the
temperature increases the velocity of molecules also increases which results in the increase in
the frequency of collision.The rise in temperature rises the kinetic energy of each molecule. It
has been found that by raising the temperature by 10k, the fraction of molecule possessing
threshold or activation energy becomes double. As a result the no of effective collision is also
double, hence rate is doubled.
2.4.4 PRESENCE OF CATALYST
A catalyst is a substance, which controls the rate of reaction without itself undergoing
a permanent chemical change. Catalysts are of two types
Positive catalyst:
A positive catalyst increases the rate of reaction by lowering the energy of activation.
Thus in the presence of a positive catalyst, the greater fraction of the total molecule will
posses lower energy of activation and collided successfully in a short period of time, there by
increasing the rate of reaction
Negative catalyst or inhibitor:
A negative catalyst retards the rate of reaction. Negative catalyst do not lower the
energy of activation rather they are combined with reactant molecule thus decreasing the
number of colliding reactant molecules. This decreases the effective collisions, hence rate of
reaction.
Role of positive catalyst
A positive catalyst functions by providing an alternate path to the reaction or by the
formation of a transition (intermediate) compound having low energy of activation. The
activation energy of this path is lower. As a result rate of reaction is increased.
Role of negative catalyst
A negative catalyst does not lower the energy of activation rather it combines with the
reactant molecules, thus decreasing the number of colliding reactant molecules. This
decreases the effective collisions, hence rate of reaction.
Not all reactions are affected by light or radiation but few reactions, which are usually
free radicals, or photo chemical reactions are influenced by light. Light activates some of the
reactant molecules producing free radicals. Since free radicals are very exited, therefore, they
react immediately with other molecules to form products. The concentration of reactants does
not influence the rate of such reactions, so they are zero order reaction. We know that that
light consists of photon. When photons strike the reactant molecule, they provide necessary
activation energy to the reactant molecules.
3.0 THE ARRHENIUS EQUATION
The actual dependence of the rate constant on temperature is given by the Arrhenius
equation.
k = Ae-Ea/RT

M.S University-D.D.C.E Unit I
Page 10
Where:
k is the rate constant
A is the Arrhenius factor (different for every reaction)
e is the natural log base
Ea is the minimum energy required for a reaction to take place (known as the activation
energy)
R is the universal gas constant (8.314 J kg-1
ºC-1
)
T is the absolute temperature in Kelvin
Arrhenius' constant, A - the pre-exponential factor
It is possible for colliding particles to possess enough energy for reaction, but still not have a
successful collision (one that results in reaction). This is accounted for by the Arrhenius constant 'A' ,
also called the pre-exponential or frequency factor.
Imagine a collision between two cars; clearly more damage is going to be caused by a head on
collision than a glancing scrape.
The Arrhenius constant (pre-exponential or frequency factor) is a number between 0 and 1, that
reflects the proportion of successful collisions amongst those particles with enough energy for
reaction.
For example, when A is very small, only a small proportion of collisions lead to reaction, regardless
of the energy, When A = 1, all collisions with sufficient energy cause reaction.
Using the Arrhenius equation
In reality, the basic form of the Arrhenius equation is not very convenient for graphing or analysing
date. To analyse experiments at different temperatures we usually use the natural log form of the
equation:
k = Ae-Ea/RT
taking natural logs throughout this gives:
lnk = lnA - Ea/RT
Thus a plot of lnk against 1/RT, 1/T or any variation, will allow us to find the activation energy
of a specific reaction as a function of the gradient, and the Arrhenius constant as a function of the
intercept to the y axis.
A typical plot used to calculate the
activation energy from the Arrhenius
equation.
In this graph the gradient of the line is
equal to -Ea/R
Extrapolation of the line to the y axis gives
an intercept value of lnA
When the temperature is increased the
term Ea/RT gets smaller. This means in
turn, that the term e-Ea/RT
gets bigger.
Alternatively two results may be analysed simultaneously to obtain values for Ea, the activation
energy and the Orientation factor, A. This is not particularly reliable as only two values for the rate

M.S University-D.D.C.E Unit I
Page 11
constant are used at two different temperatures. This can introduce large errors because of too little
data.
Example: Calculate the rate constant when T = 300K (A = 0.3, Ea = 50kJ mol-1
)
k = Ae-Ea/RT
Ea/RT = 50000/(8.314 x 300) = 20.05
e-Ea/RT = 1.97 x 10⁻⁹
k = Ae-Ea/RT
k = 5.90 x 10⁻¹⁰
4.0 ENERGY OF ACTIVATION
When gases or liquids are heated the particles gain kinetic energy and move faster
increasing the chance of collision between reactant molecules and therefore the increased
chance of a fruitful collision (i.e. one resulting in product formation).However! this
is NOT the main reason for the increased reaction speed on increasing the temperature of
reactant molecules because most molecular collisions do not result in chemical change.
Before any change takes place on collision, the colliding molecules must have a minimum
kinetic energy called the activation energy (denoted by Ea)..Its a sort of 'threshold' energy
required before any bonds can be broken i.e. before a reaction can take place.Do not
confuse activation energy with the overall energy change also shown in the energy profile
diagrams below, that is the overall energy absorbed-taken in by the system (endothermic)
or given out to the surroundings (exothermic).It does not matter whether the reaction is an
exothermic or an endothermic energy change (see the pair of reaction profile diagrams
below).Higher temperature molecules in gases and liquids have a greater average kinetic
energy and so a greater proportion of them will then have the required activation energy to
react on collision. The increased chance of higher energy collisions greatly increases the
speed of the reaction because it greatly increases the chance of a fruitful collision forming
the reaction products by bonds being broken in the reactants and new bonds formed in the
reaction products. The activation energy 'hump' can be related to the process of bond
breaking and making .Up the hump is endothermic, representing breaking bonds (energy
absorbed, needed to pull atoms apart),down the other side of the hump is exothermic,
representing bond formation (energy released, as atoms become electronically more
stable).The 'reaction profile' diagrams below illustrate the course or progress of a reaction
in terms of the energy changes taking place. Reaction profiles can be used to show the
relative energies of reactants and products, the activation energy and the overall energy
change of a reaction. Examples of an exothermic reaction profile and an endothermic
reaction profile are shown below, with and without the activation energy - which must be
reached on collision, before a reaction can occur.

M.S University-D.D.C.E Unit I
Page 12
ENERGY PROFILES for chemical reactions Simple energy level diagrams for exothermic and
endothermic reactions NOT showing the activation energy
ENERGY PROFILES for chemical reactions Energy level diagrams for exothermic and endothermic
reactions showing the activation energy (Ea) 'hump' which must be overcome before a chemical
reaction can take place

M.S University-D.D.C.E Unit I
Page 13
Note that the effect of a catalyst is to lower the activation energy Ea, enabling the reaction to
go faster BUT it does NOT affect the overall energy change of the reaction. The catalyst
provides a different pathway for the reaction that needs less energy to initiate it but it does
NOT change the energy transfer value irrespective of whether it is an exothermic or an
endothermic reaction.
4.0.1 Catalysts and activation energy
Catalysts increase the rate of a reaction by helping break chemical bonds in reactant
molecules.
This effectively means the activation energy is reduced (see diagram 'humps'
below).Therefore at the same temperature, more reactant molecules have enough
kinetic energy to react compared to the uncatalysed situation and so the reaction
speeds up with the greater chance of a 'fruitful' collision. Note that a catalyst does
NOT change the energy of the molecules, it reduces the threshold kinetic energy
needed for a molecules to react. The overall energy change for a catalysed
reaction is identical to the energy change for the same uncatalysed reaction.
Although a true catalyst does take part in the reaction, it does not get used up and can
be reused with more reactants, it may change chemically on a temporary basis but
would be reformed as the reaction products also form.
However a solid catalyst might change physically permanently by becoming more
finely divided, especially if the reaction is exothermic.
Also note from the diagram that although the activation energy is reduced, the overall
exothermic or endothermic energy change is the same for both the catalysed or
uncatalysed reaction. The catalyst might help break the bonds BUT it cannot change the
actual bond energies.
ENERGY PROFILES for chemical reactions
4.1 TRANSITION STATE THEORY (TST) OR ABSOLUTE REACTION RATE
THEORY (ARRT) OR ACTIVATED COMPLEX THEORY (ACT):
This theory was developed by H. Eyring, Polanyi and Evans in 1935.

M.S University-D.D.C.E Unit I
Page 14
Postulates:
i) The reactant molecules first excited to form an activated complex. This activated
complex is in equilibrium with the reactants.
Reactants [Activated complex]
ii) Activated complex is having four translational degree of freedom along the
reaction coordinate and one vibrational degree of freedom less than that of the normal
molecule. The extra translational degree of freedom is formed from one viberational degree.
iii) The rate of the reaction is given by the rate of decomposition of products.
[Activate complex] Products
Derivation:
Let us consider a bimolecular reaction,
A+B Products
Rate = k[A][B]
According to ARRT the mechanism is
A+B----------- [AB] Products
Reactants Activated complex
Where K is the equilibrium constant between the reactants and activated complex.
The rate of the reaction will depend upon two factors.
i) The concentration of [AB] (calculated by using statistical mechanics).
ii) The rate at which [AB] breaks upto yield products.
A+B [AB]
On applying the law of mass action,
K = [ 𝐴𝐵 ≠]
𝐴 [𝐵]
Where K is the equilibrium constant between the reactants and activated complex.
From classical mechanics,
Energy of vibration = 𝑅𝑇
𝑁𝐴 = kBT
Where kB is Boltzmann constant, R/N
From quantum mechanics,
Energy of vibration = hv
Where h is Planck‘s constant and v-frequency of the vibration Comparing eqns (3) and (4),
we get.
hv = 𝑅𝑇
𝑁𝐴
v = 𝑅𝑇
ℎ𝑁𝐴
(or) v = 𝑘𝐵𝑇
ℎ
The vibrational frequency v is the rate at which the activated complex molecules move across
the enery barrier. The rate constant ‗k‘ can be identified with v.
rate = v[(AB)]
Substituting the value of [(AB)] from eqn (2), we get
rate = v [A] [B] K
Comparing eqns (1) and (7) we get

M.S University-D.D.C.E Unit I
Page 15
k[A][B] = v [A] [B] K
k = vK
Substituting the value of v from eqn (5) and (5a) we get
k=𝑘𝐵𝑇
ℎ K (or)
𝑅𝑇
ℎ𝑁𝐴K
The equilibrium constant K can be expressed in terms of the standard Gibbs free energy for
the activation process.
(∆G0)
≠ = -RTℓnK
≠
and (∆G0)
≠ = (∆H
0)
≠-T(∆S
0)
≠
From eqn (10) we get, (∆G0)≠
𝑅𝑇 = ℓnK
≠
K≠ = 𝑒(∆G0)≠ / RT
Substituting the value of (G)from eqn (11) we get
K≠ = 𝑒(∆G0)≠ / RT
. 𝑒(∆S0)≠ / R
Eqn (9) becomes
k = 𝑘𝐵𝑇
ℎ𝑒(∆G0)≠ / RT
. 𝑒(∆S0)≠ / R
Equation (14) is known as Eyring equation
When (∆G0)
≠ is standard entropy of activation,
(∆G0)
≠ is standard free energy of activation, and
(∆G0)
≠ is standard enthalpy of activation,
Significance of the equation of APRT:
We know that,
k = 𝑘𝐵𝑇
ℎ𝑒(∆G0)≠ / RT
The equation (1) involves two factors,
ie k = 𝑘𝐵𝑇
ℎ𝑒(∆G0)≠ / RT
i) The first factor 𝑘𝐵𝑇
ℎ is constant at constant temperature.
ii) The second factor 𝑒(∆G0)≠ / RT contains a negative sign. Hence the rate of the reaction
depends on the free energy of activation. i.e. At particular temperature, greater the value of
the 𝑒(∆G0)≠ the slower will be the reaction.
Comparison with Arrhenius equation:
We know that according to ARRT
k = k = 𝑘𝐵𝑇
ℎ𝑒(∆G0)≠ / RT
. 𝑒(∆S0)≠ / R
But according to Arrhenius equation
k = A.𝑒−𝐸𝑎/𝑅𝑇
Taking ℓn on both sides of eqn (1), we get
ℓnk = ℓn [𝑘𝐵𝑇
ℎ𝑒(∆H0)≠ / RT
. 𝑒(∆S0)≠ / R]
= ℓn 𝑘𝐵𝑇
ℎ + ℓn 𝑒(∆H0)≠ / RT
+ ℓn 𝑒(∆S0)≠ / R
ℓnk = ℓn 𝑘𝐵𝑇
ℎ + ℓnT -
(∆H0)≠
𝑅𝑇 +
(∆S0)≠
𝑅
Differentiating both sides w.r.t T.

M.S University-D.D.C.E Unit I
Page 16
- 𝑑
𝑑𝑡 (ℓnk) =
1
𝑇 +
(∆H0)≠
𝑅𝑇2
𝑑
𝑑𝑡 (ℓnk) =
RT + (∆H0)≠
𝑅𝑇2
Both ℓn on both sides of eqn (2) we get,
ℓnk = ℓn (A. 𝑒−𝐸𝑎 /𝑅𝑇
ℓnk = ℓn A - 𝐸𝑎
𝑅𝑇
Differentiating both sides w.r.t.T 𝑑
𝑑𝑡 (ℓnk) =
𝐸𝑎
𝑅𝑇
𝐸𝑎= RT + (∆H0)≠
or (∆H0)≠ = 𝐸𝑎 - RT
Comparison with the collision theory
According to ARRT, k = 𝑘𝐵𝑇
ℎ𝑒(∆G0)≠ / RT
. 𝑒(∆S0)≠ / R
But according to collision theory,
k = p.Z . 𝑒−𝐸𝑎 /𝑅𝑇
Assume 𝑒(∆H0)≠= 𝐸𝑎 in equation (1)
Comparing eqn (1) and eqn (2), we get 𝑘𝐵𝑇
ℎ𝑒−𝐸𝑎 /𝑅𝑇 . 𝑒(∆S0)≠ / R
= p.Z . 𝑒−𝐸𝑎 /𝑅𝑇
pZ = 𝑘𝐵𝑇
ℎ. 𝑒(∆S0)≠ / R
Advantages of transition state theory ARRT over collision theory:
i) Collision theory is based on less accurate classical mechanics and kinetic theory.
While ARRT is based on more accurate statistical mechanics and
thermodynamics.
ii) Collision theory considers effective collision, but ARRT considers the formation
and decomposition of activated molecule [AB] ≠
.
iii) Collision theory considers only translational energy whereas ARRT considers all
degrees of freedom.
iv) The steric factor ‗p‘ is introduced arbitrarily in collision theory. While ∆S≠ is
included in ARRT.
Check your progress
Explain how concentration affects the rate of a reaction.
Explain how temperature affects the rate of a reaction.
Explain how amount of surface area affects the rate of a reaction.
Explain how a catalyst affects the rate of a reaction.
Explain why a match has little effect on lighting a lump of coal, yet a spark can
cause coal dust to ignite with explosive force.
Which of the factors that affect the rate of a reaction affect the collision frequency
(number of collisions per second)?
References
1. Laidler, K.J. Chemical Kinetics (3rd ed., Harper and Row 1987) p.359-360 ISBN 0-06-043862-2
2. Espenson, J.H. Chemical Kinetics and Reaction Mechanisms (2nd ed., McGraw-Hill 2002), p.264-6 ISBN 0-07-288362-6

M.S University-D.D.C.E Unit II
Page 17
UNIT II
ELECTRO CHEMISTRY - I
CONTENTS
2.0 AIMS AND OBJECTIVES
After studying the unit you should be able to
Explain specific conductance, Equivalent conductance
Explain Debye-Huckel Theory of Strong Electrolytes
Describe Kohlrausch‘s law (law of independent migration of ions)
Describe conductometric titration
2.1 INTRODUCTION
Electrochemistry is the study of chemical processes that cause electrons to move. This
movement of electrons is called electricity, which can be generated by movements of electrons
from one element to another in a reaction known as an oxidation-reduction ("redox") reaction.
When a chemical reaction is caused by an externally supplied current, as in electrolysis, or if an
electric current is produced by a spontaneous chemical reaction as in a battery, it is called
an electrochemical reaction. Chemical reactions where electrons are transferred directly
between molecules and/or atoms are called oxidation-reduction or (redox) reactions. In general,
electrochemistry describes the overall reactions when individual redox reactions are separate
but connected by an external electric circuit and an intervening electrolyte
2.2 BASIC CONCEPTS
2.2.1 a) Specific conductance:
The resistance of any conductor varies directly as its length ‗l‘ and inversely
proportional to its cross-sectional area. (a).
ELECTRO CHEMISTRY - I
2.0 AIMS AND OBJECTIVES
2.1 INTRODUCTION
2.2 BASIC CONCEPTS
2.3 DEBYE-HUCKEL THEORY OF STRONG ELECTROLYTES
2.4 DEBYE-HUCKEL ONSAGER EQUATION
2.5 TRANSPORT NUMBER (HITTORF’S NUMBER)
2.6. KOHLRAUSCH’S LAW (LAW OF INDEPENDENT MIGRATION OF IONS)
2.7 CONDUCTOMETRIC TITRATIONS
2.8 QUESTIONS FOR DISCUSSION
2.9 SUGGESTED READING

M.S University-D.D.C.E Unit II
Page 18
i.e., a
Ra
Rll
where ρ is the specific resistance of the material depending upon the nature of the material
and it is defined as the resistance of a specimen 1cm in length and 1cm2 cross-section. i.e
resistance of one cc of the material.
Specific conductance is also defined as the reciprocal of specific resistance.
K (kappa) = a
.Ga
.R
11 ll
(when G is conductance)
[Unit of K is mho cm-1
(or) Sm-1
]
i.e. conductance of one cc of the material.
2.2.2 b) Equivalent conductance ‘ ’
It is defined as the conducting power of all the ions produced by one equivalent of an
electrolyte in a given solution.
Unit of = mho cm2
Relation between K and :
For 1cc of the solution, = K
for 1000 cc of the solution, = 1000 K
2.2.3 c) Molar conductance m :
It is defined as the conducting power of all the ions produced by one mole of an
electrolyte in a given solution.
C
Km Unit = Sm
2 mol
-1 (or) mho cm
2 mol
-1
where C is the concentration of the solution in moles per cc. In this chapter, is used
instead of Am.
2.2.4 d) Strongelectrolyte :
Substances which largely dissociated when dissolved in water are known as strong
electrolytes.
Examples : i) Mineral acids like HCI, HNO3. H2SO4, etc.
ii) Bases like NaOH, KOH, etc.
iii) All salts (eg : KCI)
Strong electrolytes show slight increase in equivalent conductance on dilution.
2.2.5 Weak electorlytes :
Substances which dissociated only to a small extend
when dissolved in water are known as weak electrolytes.
Examples : Acetic acid, HCN, HBO3, NH3, anion etc.
Weak electrolytes shwo a very high increase in
equivalent conductance on dilution.
2.2.6 g) Variation of molar conductance with dilution:
Molar conductance of an electrolyte increases with
increase in dilution. The molar conductance of

M.S University-D.D.C.E Unit II
Page 19
concentration of zero or infinite dilution is called molar conductance at zero concentration or
molar conductance at infinite dilution, 00
m or
2.3 DEBYE-HUCKEL THEORY OF STRONG ELECTROLYTES
(Inter-ionic attraction theory)
According to Arrhenius, the increase in conductance on dilution is due to the increase in
ionisation. This explanation cannot be applied to strong electrolytes.
According to Debye-Huckel theory, the strong electrolytes are completely ionised
(dissociated) at all concentration. But strong electrolytes show slight variation in conductance
with concentration. This can be explained by Debye-Huckel and Onsager.
2.3.1 Debye-Huckel-Onsager theory
Accoridng to this theory, the decrease in equivalent conductance at higher concentration
is due to the decrease in the movement of the ions. The movement of the ions decreases due
to inter ionic attraction which is caused by the following two effects.
i) Asymmetric effect (Relaxation effect)
According to this effect, each ion in solution is surrounded by an atmosphere of
oppositely charged ions.
Symmetrical ionic atmosphere :
ii) Asymmetric ionic atmosphere:
Thus the central ve ion is symmetrically
surrounded by the –ve ions to give symmetrical
ionic atmosphere. When an electric field is
applied, the central ve ion moves towards the
cathode and the –ve ionic atmosphere move
towards the anode. Thus the symmetrical ionic
atmosphere is destroyed.
Thus the symmetrical ionic atmosphere will breakup and a new ionic atmosphere
around the moving central ion will be formed. This process of dispersing and building up of
ionic atmosphere will take some time gap, which is known as relaxation time.
Totally the ion experiences a retarding force and the movement of the ion is slowed
down. This effect is known as assymetric effect or relaxation effect.
iii) Electrophoretic effect
Ions are generally solvated and carry the associated solvent molecules. Due to the
applied electric field, a +ve ion move towards the cathode through the solvent medium, which
carries –ve ions towards the anode. This effect is known as counter current effect. Similar
effect also arises in the movement of the –ve ion. The counter current effect shows down the
movement of the ions. The overall effect is known as electrophoretic effect.
2.4 DEBYE-HUCKEL ONSAGER EQUATION :
A mathematical equation was derived by Debye-Huckel to account for the assymmetric
and electrophoretic effect.
Later this equation was slightly modified by Onsager to account for Brownian
movement. The Onsager equation for uni-univalent electrolytes (Binary strong electrolytes)

M.S University-D.D.C.E Unit II
Page 20
such as KCI, for a given solvent and at a given temperature is
cBA 00c
where A and B are constants
c is the concentration in moles/lit.
c is the equivalent conductance at a given concentration
0 is the equivalent conductance at a zero concentration
The term 0B and A are asymmetric and electropheritic effect respectively.
Verification :
This equation is verified by plotting C and concentration c . A straight line is
obtained with negative slop (A + 0B ) and intercept
0 .
Defects (Limitations) of Debye-Huckel theory:
i) The value of slope obtained from the graph c against c is,
slope = - [A + 0B ]
This is found to be correct only for uni-univalent electrolytes like HCI, KCI,
AgNO3 and NaNO3
Deviations are observed for bi-bivalent electolytes (Example : BaSO4, MgSO4,
etc.,) This is due to the incomplete dissociation. The Onsager equation can be
corrected as follows.
cBA 00c
where - degree of dissociation.
ii) When the solution is dilute or infinite or zero concentration, 0mm , molar
conductance is equal to molar conductance at infinite dilution.
iii) The values of A and B for water at 25ºC are 60.2 and 0.229 respectively. At lower
concentration (upto 0.02M), the equation is correct and at higher concentration
slight derivations are observed.
2.5. TRANSPORT NUMBER (HITTORF’S NUMBER)
The fraction of the total current carried by each ion is called its trasport number.
If u+, u- are the speed or mobility of cations and anions, then,
Transport number of cation,
uu
ut
Transport number of anions,
uu
ut
Note : i) t+ + t- = 1, t+ = 1 – t-
ii) Transport no. for an ions is not constant. It depends upon the second ion
which is present in the salt.
Hittorf’s observations:
i) The no. of the ions discharged at each electrode depends upon the sum of the speeds or
mobilities of the two ions.
ii) Fall in concentration around any electrolyte is proportional to the speed of the ion
moving away from it.
i.e. Fall in concentration around anode speed of the cation, u+
Fall in concentration around cathode speed of the cation, u-

M.S University-D.D.C.E Unit II
Page 21
i.e. cathodearoundionconcentratofFall
anodearoundionconcentratofFall
aniontheofMobility
cationtheofMobility
2.5.1 Determination of transport number:
i) Hittorf’s method:
The method is based on the principle that the fall in concentration around an electrode is
proportional to the speed of the ion moving away from it.
i.e.
cathodearoundionconcentratofFall
anodearoundionconcentratofFall
uaniontheofMobility
ucationtheofMobility
Add +1 on both sides,
electrodestwoaroundionconcentratofFall
anodearoundionconcentratofFallt,Similarly
electrodestwoaroundionconcentratofFall
anodearoundionconcentratofFalltor
anodecathodearoundionconcentratofFall
anodearoundionconcentratofFall
uu
u)or(
cathodearoundionconcentratofFall
anodearoundionconcentratofFall1
u
uu
cathodearoundionconcentratofFall
anodearoundionconcentratofFall1
u
u1
tcompartmenboth fromlost eelectrolyt of sequivalent ofnumber Total
tcompartmen anode fromlost eelectrolyt of equivalentofNumbert
But total no. of g equivalents lost from both the compartments is equal to the no. of g
equivalent deposited on each electrode.
electrodeeach on deposited equivalent of .No
tcompartmen anode thefromlost equivalent g of No.t.,e.i
According to the Faraday‘s second law, the no. of g equivalents deposited on each
electrode must be equal to no. of g equivalents of copper deposited in a copper coulometer by
the same quantity of electricity.
coulomter in the deposited Agor Cu of equivalent of .No
tcompartmen anode thefromlost eelectrolyt toequivalent of No.t
Experiment :

M.S University-D.D.C.E Unit II
Page 22
The apparatus consists of i) transport cell A, which consists of anode compartment,
middle compartment and cathode compartment. ii) Copper coulometer, B.
The transport cell is filled with AgNO3 solution. The electrolytes is carriedout using Pt-
electrodes. A current of about 10 ampere is passed through the solution in the transport cell
and Cu-coulometer for 2 to 3 hours. After electrolysis, the solution is drawn out from the
anodic compartment and the change is concentration is determined.
Calculation :
Before electrolysis:
1g of AgNO3 solution contains ‗a‘ g of AgNO3 = gram170
a equivalent of AgNO3. Let
it be ‗x‘ gram equivalents.
After electrolysis :
1g of AgNO3 solution contains ‗b‘ g of AgNO3 = gram170
b equivalent of AgNO3. Let
it be ‗y‘ gram equivalents.
Fall in concentration in the anode compartment = x – y gram equivalents of AgNO3.
Since copper- coulometer is connected, the wt. of copper deposited in the same time is
‗w‘ g = 8.71
w gram equivalent. Let it be ‗z‘ gram equivalent.
Transport number of cation coulometer in the depositedCu ofAmount
tcompartmen anodein concn.in Fall
z
yx1t
z
yxt
3NO
Ag
where, tAg+ and 3NO
t are the transport number of Ag+ and
3No ions respectively.
2.5.2 Determination of transport number of moving boundary method
Principle:
The principle of this method is to observe directly the mobility of the ions by passing
current.
Experiment:
To determine the transport number of H+ ion, solution of Cl (principle electrolyte) is

M.S University-D.D.C.E Unit II
Page 23
introduced above the solution of CdCl2 (indicator electrolyte) in a tube as shown in the
figures.
The cathode is platinum (top) and the anode is cadmium metal (bottom). Before passing
current, the mobility of Cd2+
ions is equal to that of H+ ions. Thus at the junction of the two
liquids, a sharp boundary is seen (aa1)
By passing current, H+ ions move towards the cathode. The gap formed by the upward
movement of the H+ ions is filled by the Cd
2+ ions. Thus the boundary moves up (bb
1).
Calculation :
Let the concentration of HCI solution be C g.equi/1000
Distance through which the boundary moves = l cm
Area of cross section of the tube = a cm2
Volume of HCI solution moved up, V = 1.a cm3
The concentration of H+ ions moved up = .equig
1000
V.C
.equig1000
a.l.C
Total current carried by the H+ ions = Q Faraday
(measured by using coulometer)
Transport number of H+ ions is
Q1000
CVt
Q1000
la.Ct
carriedcurrentTotal
upmovedionHof.conct
H
H
H
where C is the concentration of the soln in g equi/litre,
V is the volume of the soln moved up
Q is the current in Faraday passed
2.6. KOHLRAUSCH’S LAW (LAW OF INDEPENDENT MIGRATION OF IONS)
At infinite dilution, each ion contributes a definite amount to the total equivalent

M.S University-D.D.C.E Unit II
Page 24
conductance of the electrolyte, irrespective of the nature of the other ion. This idea was given
in the form of the law called Kohlrausch‘s law. The law states that the equivalent
conductance of an electrolyte at infinite dilution is equal to the sum of the ionic conductances
of the cations and anions. 000
m
where 0m - equivalent conductance at infinite dilution
0 - ionic conductance at infinite dilution of cations.
0 - ionic conductance at infinite dilution of anions.
2.6.1Applications of Kohlrausch’s law
i) Calculation of 0m for weak electrollytes :
For weak electrolytes, the ionisation is not complete even at very dilute solution. It is
very difficult to determine its 0m value. But it can be determined indirectly using
Kohlrausch‘s law.
Example : 0m for acetic acid (weak electrolyte) is determined by knowing
0m of strong
electrolytes HCI, NaCI and CH3COONa.
0
HCOOCH
00COOHCH
0
Cl
0
H
0NaCOONaCH
0
0NaCl
0HClCOONaCH
0COOHCH
0
hCOOCH
0COOHCH
33
3
33
33
0
NONH0AgNO
0ClNH
0AgCl
0NaCl
0NaOH
0ClNH
0OHNH
3434
44Similarly
ii) Determination of transport number :
The relation between transport number of ions and their molar conductance is
00
0
0m
00
t
------------------ (1)
We know that
00
Fut ------------------ (2)
Combining eqns (1), (2), we get
00
0
00
00
uu
Fut
Thus if molar conductances of ions and their mobilities at infinite dilution are known,
the transport no. of ions at infinite dilution can be easily.
Problem :
The equivalent conductances at infinite dilution of HCl, NaCl and CH3COONa are
426.16, 26.45 and 91.00 ohm-1
cm2. Calculate the equivalent conductance of acetic acid at
infinite dilution.
Solution :
Given 210
NaCl210
HCl cmohm45.26;cmohm16.426

M.S University-D.D.C.E Unit II
Page 25
21
0NaCl
0HCl
0COONaCH
0COOHCH
210COONaCH
cmohm71.49045.2616.517
cmohm00.91
33
3
iii) Determination of degree of dissociation of weak electrolyte:
Degree of dissociation of a weak electrolyte () is given as
0m
m
where, m - molar conductance of an electrolyte at a given concentration and
m - molar conductance at infinite dilution
Applying Kohlrausch‘s law, m
00
m
can be calculated.
iv) Determination of solubility of a sparingly soluble salts:
The solubility of sparingly soluble salt like AgCl can be determined using Kohlrausch‘s
law as follows.
The molar conductance m of the salt is
C
K1000m ---------- (1)
where K (Kappa) – specific conductance of the salt
Since the solubility of AgCl is very low and also the concentration of the solution ‗C‘ is
nothing but the solubility ‗s‘ (ie) C = S
0AgClm
The equation (1) becomes
S
K10000AgCl ---------- (2)
0AgCl can be determined by using Kohrausch‘s law.
0
Cl
0Ag
0AgCl
Thus by knowing K, we can calculate the solubility of the salt by the following
equations.
0AgCl
K1000S
v) Determination of ionic product of water (Kw)
The ionic product of water Cº25at]OH[]H[Kw
The specific conductance of water (K) at 25ºC is 5.54 × 10⁻⁸
mho cm-1
or 5.54 × 10-
6Sm
-1
The equivalent conductance of water OH2 at 25ºC is
C
K1000A OH2
---------- (1)
where ‗C‘ is the concentration of water, since one mole of water contains one H+ and
one OH- ions [H2O = H
+ + OH
-]
C = [H+] = [OH
-]
At 25ºC, the ionic conductance of H+ and OH
- ions are

M.S University-D.D.C.E Unit II
Page 26
200,350OHH
Using Kohlrausch‘s law
550200350OHH
OH0
2
Equation (1) becomes,
178
8
OH0
litmoles101550
105.51000C
C
105.51000550
C
K10002
[H+] = [OH
-] = 1 × 10
-7 moles lit.
-1
Ionic product of water, Kw = [H+] [OH
-]
= (1× 10⁻⁷
) (1 × 10⁻⁷
)
Kw = 1 × 10-14
mol2dm
-6
Mobilities of Hydrogen and hydroxyl ions
H+ and OH
- ions have unusually high ionic mobilities it hydrolic solvents like water,
alcohol etc.
In water, the H+ ions forms hydrated H3O
+ ion. This H3O ions is able to transfer H
+ ion
to the neighbouring hydrogen bonded water molecules by rearrangement of hydrogen bonds.
Due to this, the H+ ion have high ionic mobility. Its value is 36.25 × 10
-8m
2V
-1s
-1 at 25ºC in
water at infinite dilution. Similarly the high ionic mobility of OH- ion in water is due to H
+
ion transfer between OH- ion and water.
2.7. CONDUCTOMETRIC TITRATIONS
Titration in which the end point is determined by conductance measurement is known
as conductometric titration. The principle involved in this titration is ―conductance depends
upon the number and mobility of the ions in solution‖. The end point of this titration can be
determined graphically by plotting conductance (y-axis) against volume of the titrant added
(x-axis). The point of intersection of the two curves in the end point and the concentration of
the solution can be determined.
The importance conductometric titrations are,
2.7.1 Acid-base titrations :
a) Strong acid against strong base (HCl × NaOH)
The acid is taken in the beaker and the NaOH in the
burette. The conductance of HCl is high due to the presence of
H+ and Cl
- ions.
When alkali is added gradually, the fast moving H+ ions
are replaced by slow moving Na+ ions. Hence conductance
decreases till neutralisation.
(H+ + Cl
-) + (Na
+ + OH
-) (Na
+ + Cl
-) H2O
After the end point, further addition of NaOH will
increase the conductance due to increase in the number of fast
moving OH- ions.
2.7.2 Weak acid against strong base (CH3COOH × NaOH)
The acid is taken in the conductivity cell and the NaOH is taken in the burette. The
conductance of the acid is low due to its poor ionisation.

M.S University-D.D.C.E Unit II
Page 27
When CH3COOH is titrated against sodium hydroxide, the
initial conductance will decrease due to the formation of salt
sodium acetate. The salt suppress the ionisation of acetic acid by
common ion effect. Then the conductance slightly increases due
to the conducting power of the salt exceeds that of the acetic
acid.
CH3COOH + (Na+ + OH
-) (CH3COO
- + Na
+) +
H2O
After the end point, further addition of NaOH will increase the conductance sharply due to
increase in the number of fast moving OH- ions.
2.7.3 Strong acid against weak base (HCl × NH4OH)
When the titrant NH4OH is added to HCl, the conductance decreases sharply due to the
replacement of fast moving H+ ions by slow moving
4NH ions.
OHNHClH 4
OHClNH 24
After the end point, further addition of NH4OH will not produce any change in
conductance and it remains constant.
2.7.4 Weak acid against weak base [CH4COOH × NH4OH]
When NH4OH is added, to CH3COOH, the conductance
increases due to the formation of the salt, ammonium acetate.
CH3COOH + NH4OH CH3COONH4+HOH
amm.acetate
After the neutralisation of the acid, further addition of
NH4OH will not produced any change in conductance due to
poor ionisation.
2.7.5 Precipitation titrations [AgNO3 × KCl]
AgNO3 is taken in the conductivity cell and KCl is taken in
the burette. The conductance of AgNO3 is low due to its poor
ionisation.
When the titrant KCl is added the Ag+ ions are replaced by K
+
ions, AgCl is precipitated.
ClKNOAg 3
3NOKAgCl
But both Ag+ and K
+ ions have same mobility. Thus the
conductance of the solution does not change. After the end point, further addition of AgNO3
increases the conductance due to the excess of fast moving Ag+ ions.
2.7.6 Titration of mixture of a strong acid and a weak acid
against a strong base
Suppose a mixture of HCl (strong acid) and CH3COOH
(weak acid) is to be titrated against NOH. Since HCl is a
strong acid, it will titrated first. After complete neutralisation
of HCl, then CH3COOH will titrated next. The titration curve
is shown in the following figure.
Two end points B and C are obtained. The point B
corresponds to neutralisation of HCl, the point ‗C‘ corresponds
to the neutralisation of CH3COOH.
2.7.7 Advances of conductometric titration
i) Coloured solutions can be successfully titrated by this method, which cannot be
determined by ordinary volumetric methods.

M.S University-D.D.C.E Unit II
Page 28
ii) Titration between weak acid and weak base can be determined.
iii) More accurate results can be obtained. compared to ordinary volumetric method.
iv) No special care is necessary near the end point as it is determined graphically.
2.8 QUESTIONS FOR DISCUSSION
Define Kohlrausch‘s law and its applications ?
Explain conductometric titrations?
SUGGESTED READINGS
1. Atkins, P. de Paula, J. Physical Chemistry for the Life Sciences. pg 209-225. 2006.
Oxford Univeristy Press. New York.
2. Zumdahl, S. Zumdahl, S. Chemistry. Pg 215-220. 2007. Houghton Mifflin Company.
New Jersey.
3. Petrucci, Ralph H. General Chemistry Principles & Modern Applications. Pearson
Prentice Hall. New Jersey

M.S University-D.D.C.E Unit II
Page 29
ELECTRO CHEMISTRY – II
CONTENTS
AIMS AND OBJECTIVES
After study this unit you should able to explain, EMF and electrode potential, cell potential
(or) electrochemical series, cells, potentiometric titrations, etc
2.10 EMF AND ELECTRODE POTENTIAL
The electrode potential, the electrode reaction, the cell reaction and EMF of the cell can
be explained by taking Daniel cell as an example (figure)
It consists of a Zn – electrode dipped in ZnSO4 solution and a Cu-electrode dipped in
CuSO4 solution. Both these solutions are separated by porus vessel.
When both the electrodes are connected by a wire externally, chemical reaction occurs.
Oxidation reaction takes place at the Zn-electrode (i.e) Zn-rod dissolves in the solution
producing Zn2+
ions.
Zn Zn2+
+ 2e- (oxidation half reaction)
Thus Zn-electrode is called –ve electrode and sends electrons with the outer circuit.
Reduction reaction occurs at the Cu-electrode (i.e) Cu2+
ion from the solution undergoes
reduction by taking two electrons to form Cu-metal and deposited on the Cu-electrode.
Cu2+
+ 2e- Cu (Reduction half reaction
ELECTRO CHEMISTRY – II
2.10 EMF AND ELECTRODE POTENTIAL
2.11 CELL POTENTIAL (OR) EMF
2.12 REFERENCE ELECTRODES
2.13 ELECTROCHEMICAL SERIES
2.14 CELLS
2.15 POTENTIOMETRIC TITRATIONS
2.16 QUESTIONS FOR DISCUSSION
2.17 SUGGESTED READINGS

M.S University-D.D.C.E Unit II
Page 30
Metal
2.10 .1 Cell reaction:
The net chemical reaction obtained by adding the two half reactions is called the cell
reaction.
Zn Zn2+
+ 2e (oxidation
Cu2+
+ 2e Cu (reduction)
Zn(s) + Cu2+
(aq) Zn2+
(aq) + Cu(s)
2.10 .2 Cell representation :
The Daniel cell may be represented by writing the anode and left hand side and the
cathode at right hand side.
porus vessel
Zn / Zn2+
// Cu2+
/ Cu
-ve Electrode +ve Electrode
(Oxidation (reduction) 2.11 CELL POTENTIAL (OR) EMF
The electrons are flowing from Zn electrode to the Cu-electrode through the outer
circuit. This causes the flow of current and it is determined by the ―push‖ of electrons at the
anode and attraction of electrons at the cathode. These two forces produced the ―driving
force‖. This driving force is called the Electromotive force (EMF) or the cell potential. It is
expressed in volts.
2.11.1 Cell representation and conventions:
A cell consists of two half cells. Each half cell consists of a metal electrode in contact
with the metal ions in solution.
For writing the cell representation, the following conventions are followed.
i) A single vertical line represents a phase boundary between the metal electrode and the
metal ions in solution.
phase boundary
Zn / Zn2+
; Cu2+
/ Cu
Anode half cell cathode half cell
ii) A double vertical line represents the alt bridge or porous vessel to prevent the
electrolytes from mixing and permits the ions to flow.
iii) The anode half cell is written on the left and the cathode half cell is on the right.
iv) In the complete cell representation, the two half cells are separated by a double vertical
line (salt bridge)
Example : The Zn-Gu cell can be written as
salt bridge
Zn / Zn2+
// Cu2+
/ Cu
Anode half cell cathode half cell
v) The symbol for an inert electrode, like Pt-electrode is enclosed in a brackets.
inert electrode
Example : M / M2+
/ H+ / H2 (Pt)
vi) The value of EMF (E) of a cell is written on the right end of the cell diagram.
Example : Zn / ZnSO4 // CuSO4 / Cu E = +1.1V
2.11.2 Convention regarding Sign of emf value:
The sign of emf value reflects the direction of electrons to flow externally from one
electrode to another.

M.S University-D.D.C.E Unit II
Page 31
Examples : i) Zn/ZnSO4 // CuSO4 / Cu E = +1.1V
Oxidation Reduction
Here the Cu-oxidation is +ve (cathode)
ii) Cu / CuSO4 // ZnSO4 / Zn E = -1.1V
oxidation Reduction
2.11.3 Standard cell:
A cell which has the following characters is known as standard cell.
i) Its potential (emf) must be reproducible.
ii) Its emf remains constant for a long period.
iii) The cell should be reversible
iv) It should not be damaged by the passage of current through it.
v) Its temperature coefficient must be very low.
Example : Western Standard Cell
The commonly used standard cell is Western-Cadmium cell (or) Western cell. The cell
is represented as,
Cd (Hg)x 3CdSO4.8H2O Hg2SO4(s) Hg
12.5% cadmium (saturated soln.)
amalgam
2.11.4 Single electrode potential
Each cell is made up of two electrons. One electrode is called –ve electrode where
oxidation takes place and other electrode +ve electrode where reduction takes place.
Example : Zn / Zn2+
// Cu2+
/ Cu
Half cell Half cell
(-ve electrode) (+ve electrode)
Each electrode which is contact with its own ion in solution is called half cell (or) single
electrode.
The tendency of an electrode to loose or gain electrons (oxidation or reduction) when it
is in contact with its own ions in solution is called single electrode potential or electrode
potential.
The potential of an electrode which undergoes oxidation is called oxidation potential
and the potential of an electrode which undergoes reduction is called reduction potential.
2.11.5 Standard electrode potential:
If the concentration of the ions is unity and temperature is 25ºC, the single electrode
potential obtained is called standard electrode potential (E0) and such electrode is called
standard electrode.
Example : Standard Hydrogen Electrode (SHE) is,
H2(g) (Pt) / H+
(C = 1)
The E0 for SHE is zero volt at 25ºC
(i.e) E0
SHE = 0 volt.
M.S University-D.D.C.E Unit II
Page 32
2.12 REFERENCE ELECTRODES
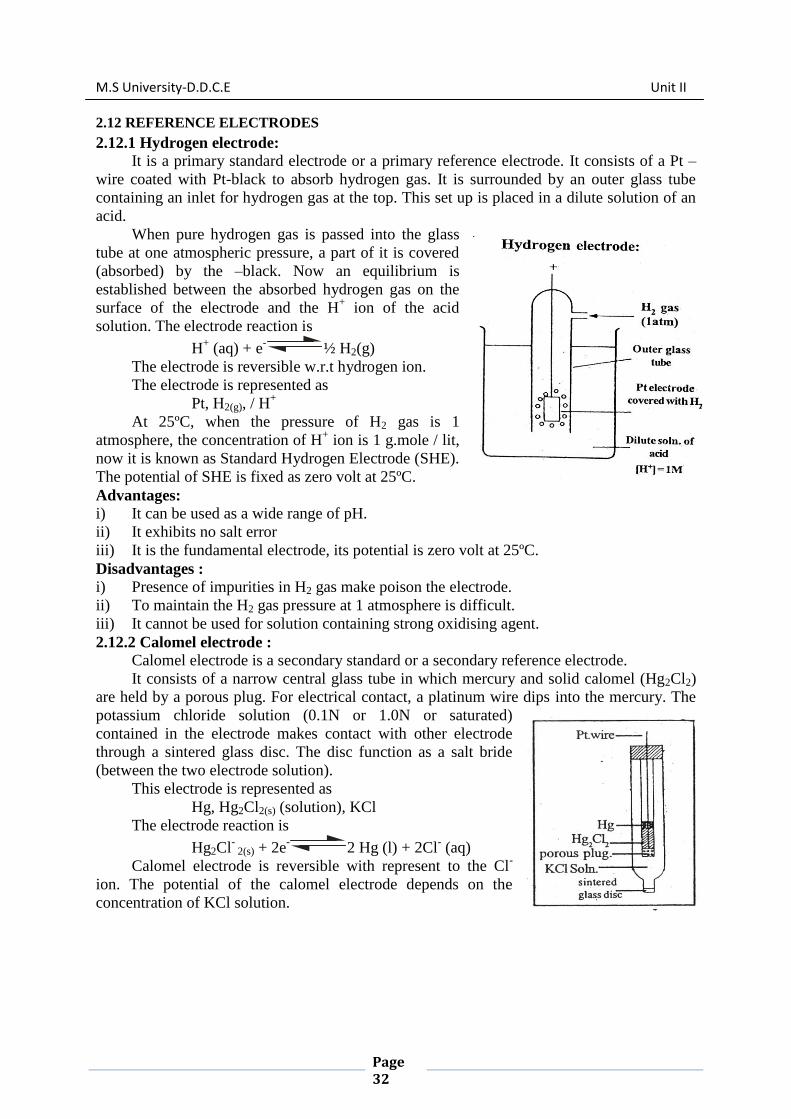
2.12.1 Hydrogen electrode:
It is a primary standard electrode or a primary reference electrode. It consists of a Pt –
wire coated with Pt-black to absorb hydrogen gas. It is surrounded by an outer glass tube
containing an inlet for hydrogen gas at the top. This set up is placed in a dilute solution of an
acid.
When pure hydrogen gas is passed into the glass
tube at one atmospheric pressure, a part of it is covered
(absorbed) by the –black. Now an equilibrium is
established between the absorbed hydrogen gas on the
surface of the electrode and the H+ ion of the acid
solution. The electrode reaction is
H+ (aq) + e
-½ H2(g)
The electrode is reversible w.r.t hydrogen ion.
The electrode is represented as
Pt, H2(g), / H+
At 25ºC, when the pressure of H2 gas is 1
atmosphere, the concentration of H+ ion is 1 g.mole / lit,
now it is known as Standard Hydrogen Electrode (SHE).
The potential of SHE is fixed as zero volt at 25ºC.
Advantages:
i) It can be used as a wide range of pH.
ii) It exhibits no salt error
iii) It is the fundamental electrode, its potential is zero volt at 25ºC.
Disadvantages :
i) Presence of impurities in H2 gas make poison the electrode.
ii) To maintain the H2 gas pressure at 1 atmosphere is difficult.
iii) It cannot be used for solution containing strong oxidising agent.
2.12.2 Calomel electrode :
Calomel electrode is a secondary standard or a secondary reference electrode.
It consists of a narrow central glass tube in which mercury and solid calomel (Hg2Cl2)
are held by a porous plug. For electrical contact, a platinum wire dips into the mercury. The
potassium chloride solution (0.1N or 1.0N or saturated)
contained in the electrode makes contact with other electrode
through a sintered glass disc. The disc function as a salt bride
(between the two electrode solution).
This electrode is represented as
Hg, Hg2Cl2(s) (solution), KCl
The electrode reaction is
Hg2Cl-
2(s) + 2e-
2 Hg (l) + 2Cl- (aq)
Calomel electrode is reversible with represent to the Cl-
ion. The potential of the calomel electrode depends on the
concentration of KCl solution.

M.S University-D.D.C.E Unit II
Page 33
Name of the calomel
electrode [KCl] EMF (in volt)
Decinormal calomel
electrode (DNCE) 0.14N 0.333
Normal Calomel Electrode
(NCE) 1N 0.281
Saturated Calomel Electrode
(SCE) saturated 0.242
2.13 ELECTROCHEMICAL SERIES
With reference to the standard hydrogen electrode, the electrodes are arranged in the
decreasing order of their standard reduction potentials at 25ºC. This is called electro chemical
series.
Electrode E0 volts
Au3+
, Au + 1.50
Hg2+
, Hg22+
, (Pt) + 0.92
Ag+, Ag + 0.80
Fe3+,
Fe2+
, (Pt) + 0.77
Cu2+
, Cu + 0.34
2H+, H2, (Pt) 0.00
Pb2+
, Pb - 0.13
Sn2+
, Sn - 0.15
Fe2+
, Fe - 0.44
Zn2+
, Zn - 0.70
Na2+
, Na - 2.71
Applications or Significance:
i) A high positive value of E0 indicates that the electrode undergoes reduction (by
accepting electrons). A high negative value of E0 indicates that the electrode undergoes
oxidation (by donating electrons).
ii) The emf of the cell reaction can be easily determined with the help of E0 values.
Example : In the Daniel cell
Zn / Zn2 // Cu
2+ / Cu
Zn Zn2
2e- (oxidation) E
0 = -0.75v
Cu2+
+ 2e- Cu (reduction) E
0 = 0.34v
Zn(s) + Cu2+
(aq) caZn2+
(aq) + Cu(s) (cell reaction
Ecell Redn.potential of RHS – Redn. potential of LHS
electrode electrode
E0
R – E0
1 0.34 – (-0.76) = 1.10V
iii) The feasibility of the cell reaction can also be predicted with the help of E0 values.
From E0 values, emf of the cell is calculated.
Ecell – E0
R – E01
If, Ecell is –ve, the reaction will be feasible
If, Ecell –ve, the reaction will not be feasible
Example : Predict the following reaction is feasible (or) not.
2Ag + Zn2 2Ag + Zn
The half cell reactions are

M.S University-D.D.C.E Unit II
Page 34
Anode 2Ag 2Ag+ + 2e
-; E
0 = 0.80V
(oxidation)
Cathode 2Ag 2Ag+ + 2e
-; E
0 = 0.80V
(Reduction)
Cell reaction 2Ag + Zn2 s2Ag + Zn
Ecell E0
R – E0
L
= -0.76 – 0.80 - 1.56
Since, the value of Ecell is –ve. Thus the reaction is not feasible.
vi) The metal will displace another metal from its salt solution or not can be predicted by
electrochemical series. Generally a metal lower down the electrochemical series can
precipitate the one higher up the series.
v) The metal will displace hydrogen from a dilute acid or not can be predicted by
electrochemical series.
(i.e.) Any metal above the hydrogen in the series is a weaker reducing agent and cannot
reduce H- and H2 gas. Any metal lying below the hydrogen in the series is a stronger reducing
agent and can reduce H+ to H2 gas.
Example: Zn can liberate H2 gas from dil.H2SO4. But Cu can not. The reason is Zn is
lying below and Cu is above the hydrogen in the electro chemical series.
Zn + 2H+ Zn
2- + H2
(dil.H2SO4)
Cu + 2H+ Cu
2 + H2
(dil.H2SO4)
2.14 CELLS
2.14,1 REVERSIBLE CELL:
A cell which has the following conditions is known as reversible cell.
i) The external emf equal to that of the cell emf is applied in opposite direction, no
reaction should occur on either of the electrodes.
ii) The external emf is infinitesimally increased, the current will start to flow into the cell
and the cell reaction gets reversed.
Eg : Daniel cell
The normal equation is,
Zn + Cu2-
Zn2+
+ Cu
If an external emf is increased infinitesimally, the cell reaction is reversed.
Cu + Zn2+
Cu2+
+ Zn
Thus the Daniel cell is a reversible cell.
2.14.2 IRREVERSIBLE CELL
A cell which does not satisfy the condition of reversibility is known as irreversible cell
(i.e.) its chemical reaction can not be reversed by the application of external emf.
Example : A cell composed of Zn and Cu electrodes dipped in a solution H2SO4
Zn / H2SO4 / Cu
When these two electrodes are connected, zinc dissolves into the solution and hydrogen
is liberated at the cathode (Cu- electrode)
Zn + 2H
Zn2+
+ H2
When the cell is connected, zinc dissolves into the solution and hydrogen is liberated at
the cathode (Cu- electrode)
Cu + 2H
Cu2+
+ H2
The original state is note reproduced. The cell reaction is also not reversed. Thus it is an
irreversible cell.
M.S University-D.D.C.E Unit II
Page 35
2.15 POTENTIOMETRIC TITRATIONS
Titrations in which the end point is determined by measurement of electrode potential
are known as potentiometric titrations. Three types of potentiometric titration are possible.
a) Acid-base titrations
b) Oxidation-reduction (Redox) titrations
c) Precipitation titrations.
2.15 .1 Acid-base titrations
The acid-base titration involve changes in the concentration of H+ ions or changes in the
pH of the solution.
Hydrogen electrode (or) glass electrode is immersed in the known volume of the acid
solution whose strength is to be determined. The indicator electrode is connected to a
standard calomel electrode (reference) to form a galvanic cell.
It may be represented as
Pt2H2 (1 atm), H+ (unkonwn) || KCl (sat soln), Hg2Cl2 (s), Hg
Hydrogen electrode || SCE
The EMF of the cell is measured potentiometrically. It is given by
E = ER – EL = Ecalomel - Ehydrogen
= 0.2422 + 0.0591 pH
Example : HCl × NaOH
When NaOH is added, the H+ ion concentration goes on decreasing ie pH of the solution
goes on increasing. Hence the emf of the cell (E) rises gradually. Near the end point the emf rises
sharply. After the end point, the emf changes slightly on the addition of excess of alkali.
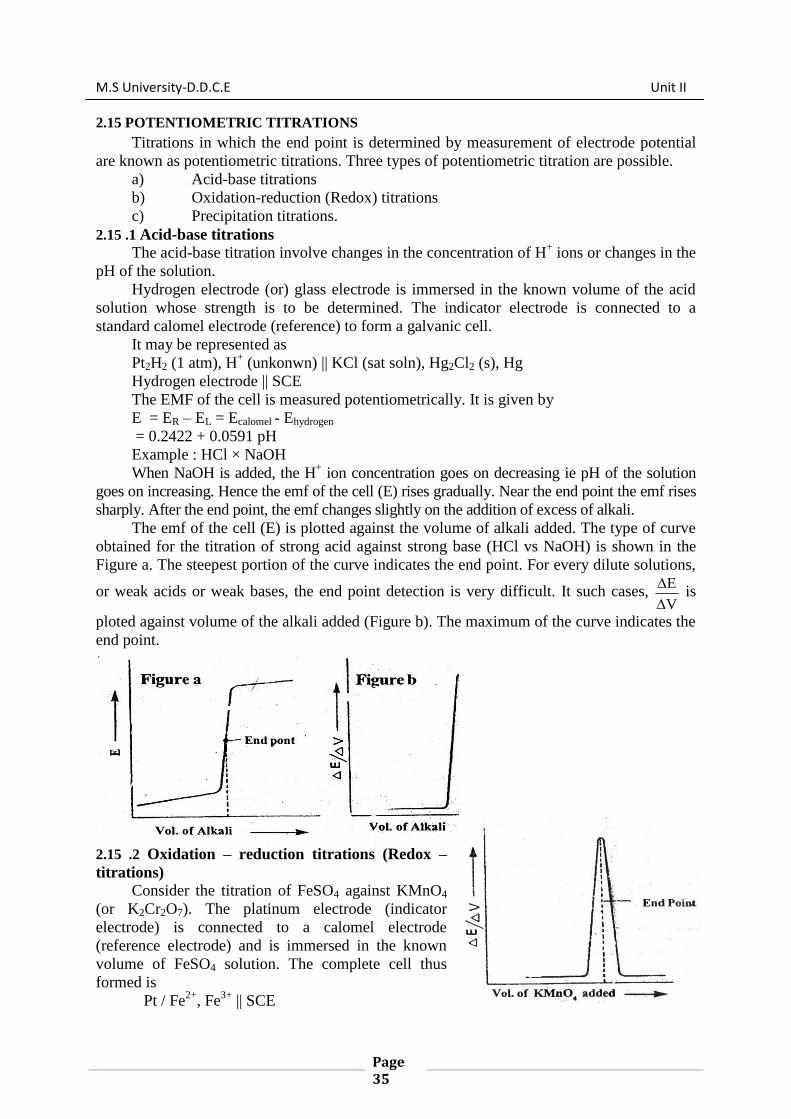
The emf of the cell (E) is plotted against the volume of alkali added. The type of curve
obtained for the titration of strong acid against strong base (HCl vs NaOH) is shown in the
Figure a. The steepest portion of the curve indicates the end point. For every dilute solutions,
or weak acids or weak bases, the end point detection is very difficult. It such cases, V
E
is
ploted against volume of the alkali added (Figure b). The maximum of the curve indicates the
end point.
2.15 .2 Oxidation – reduction titrations (Redox –
titrations)
Consider the titration of FeSO4 against KMnO4
(or K2Cr2O7). The platinum electrode (indicator
electrode) is connected to a calomel electrode
(reference electrode) and is immersed in the known
volume of FeSO4 solution. The complete cell thus
formed is
Pt / Fe2+
, Fe3+
|| SCE

M.S University-D.D.C.E Unit II
Page 36
When KMnO4 is added from the burette, the emf rises. Near the end point the emf rises
sharply. The end point of this titration is determined by plotting V
E
against volume of
KMnO4 added.
2.15 .3 Precipitation titration
Consider the titration AgNO3 with NaCl solution. A silver electrode (indicator
electrode) is dipped in the unknown sodium chloride. It is connected to a calomel electrode
(reference electrode) through a salt bridge as shown in the figure. The emf (E) of the cell
depends upon upon the concentration of Ag+ ions around the silver electrode.
Initially the concentration of Ag
+ ions will be zero. When the AgNO3 solution is added
from the burette, AgCl is precipitated. Now a reversible silver – silver chloride electrode is
setup. As a result, the solution contains a small concentration of Ag+ ions and the emf (E)
will rises gradually. The emf point of this titration is determiend by plotting ∆E / ∆V against
volume of the AgNO3 added.
2.15 .4 Advantages of potentiometric titrations:
i) Used to findout the end point of coloured solutions where no indicator is effective.
ii) In oxidation – reduction titrations, the use of external, indicator is eliminated.
iii) Used in acid – base titrations where no suitable indicator is found to work, Example :
weak acid Vs weak base.
2.16 QUESTIONS FOR DISCUSSION
Define cell reaction?
Discuss conductometric titrations?

M.S University-D.D.C.E Unit II
Page 37
2.17 SUGGESTED READINGS
1. Basic Physical Chemistry, by Wolfgang Schärtl - Bookboon , 2014 (ONLINE)
2. Atkins, P. de Paula, J. Physical Chemistry for the Life Sciences. pg 209-225. 2006.
Oxford Univeristy Press. New York.
3. Zumdahl, S. Zumdahl, S. Chemistry. Pg 215-220. 2007. Houghton Mifflin Company.
New Jersey.
4. Petrucci, Ralph H. General Chemistry Principles & Modern Applications. Pearson
Prentice Hall. New Jersey

M.S University-D.D.C.E Unit III
Page 38
UNIT III
PHASE RULE
CONTENTS
3.0 AIMS AND OBJECTIVES
After study this unit you should able to,
Explain Phase, Phase rule
Draw and explain Phase diagram.
Elucidate one component system ,two component systems two component alloy system (or)
multi component equilibria,Reduced phase rule (or) condensed system
3.1 INTRODUCTION For a system at equilibrium the phase rule relates:
P = number of phases that can coexist, to
C = number of components making up the phases, and
F = degrees of freedom.
Where these three variables are related in the equation
P + F = C + 2 The degrees of freedom represent the environmental conditions which can be independantly
varied without changing the number of phases in the system. Conditions include:
3.0 AIMS AND OBJECTIVES
3.1 INTRODUCTION
3.2 DEFINITIONS
3.2.1 SYSTEM
3.2.2 EQUILIBRIUM
3.2.3 METASTABLE EQUILIBRIUM
3.3 PHASE RULE
3.3.1 PHASE (P):
3.3.2 COMPONENT (C).
3.3.3. DEGREE OF FREEDOM (F)
3.4 PHASE DIAGRAM
3.5 ONE COMPONENT SYSTEM
3.5.1 The Water System
3.5.2 THE SULPHUR SYSTEM
3.6 TWOCOMPONENT ALLOY SYSTEM (or) MULTI COMPONENTEQUILIBRIA
3.6.1 CLASSIFICATION OF TWO COMPONENT SYSTEM
3.6.2 BINARY ALLOY SYSTEM THE LEAD-SILVER SYSTEM
3.6.3 POTASSIUM IODIDE–WATER SYSTEM 3.6.4 THE MAGNESIUM–ZINC SYSTEM
3.7 USES (OR) MERITS AND DEMERITS OF PHASE RULE
3.8 QUESTIONS AND ANSWERS
3.9 SUGGESTED READINGS

M.S University-D.D.C.E Unit III
Page 39
Temperature,
Pressure,
Chemical Composition, Oxygen Fugacity ,etc .
3.2 DEFINITIONS 3.2.1 System: An assemblage of materials that is isolated in some manner from rest of the
universe.
isolated system:one that does not exchange matter or energy with its surroundings.
closed system: one that exchanges only energy with its surroundings.
open system: one that exchanges both matter and energy with its surroundings.
adiabatic system: a system with changes in energy caused only by a change in volume
as pressure changes.
3.2.2 Equilibrium: The lowest energy state of a system in which there is no tendency for a
spontaneous change.
3.2.3 Metastable Equilibrium: state of a system which is not in its lowest energy state at the
imposed conditions, but cannot spontaneously change due to high activation energy for
change.
All chemical reactions are broadly classified into 2 types:
1) Irreversible Reactions : Zn + H2SO4 −−−−−> ZnSO4 + H2↑
2) Reversible reactions:
(a) Homogeneous reversible reactions
Eg: N2(g ) + 3H2(g) 2NH3(g)
(b) Heterogeneous reversible reactions
Eg: CaCO3(s) CaO(s) + CO2(g)
The reversible reactions are represented by 2 arrows in the opposite directions. The
homogeneous reversible reactions can be studied by the law of mass action and the
heterogeneous reversible reactions using the phase rule, given by Willard Gibbs (1874) which
is defined as,
3.3 PHASE RULE: If the equilibrium between any numbers of phases is not influenced by
gravitational/electrical/ magnetic forces but is influenced by pressure, temperature and
concentration, then the number of degrees of freedom (F) is related to the number of
components (C) and the number of phases (P) as: F = C − P + 2
Explanation of terms with examples
3.3.1 PHASE (P): PHASE is defined as, ―any homogeneous physically distinct and mechanically
separable portions of a system which is separated from other parts of the system by definite
boundaries‖.
a) Gaseous phase (g): All gases are completely miscible and have no boundaries between them. Hence all
gases constitute a single phase.
Eg: Air, a mixture of O2, H2, N2, CO2 and water vapor, etc., constitutes a single phase.
M.S University-D.D.C.E Unit III
Page 40
(b) Liquid Phase (l): The number of liquid phases depends on the number of liquids present and their
miscibility‟s.
(i) If two liquids are immiscible, they will form two separate liquid phases. (e.g.)
Benzene – Water system.
(ii) If two liquids are completely miscible, they will form only one liquid phase.
(e.g.) Alcohol - Water system.
(c) Solid Phase (s):
Every solid constitutes a separate single phase. (e.g.) Decomposition of CaCO3
CaCO3(s) CaO (s) + CO2(g) It involves 3 phases namely solid CaCO3, solid CaO and gaseous CO2
Other examples: 1) A water system has 3 phases namely one solid, one liquid and one gaseous phase.
Ice(s) Water(l) Vapour(g)
2) A solution of a substance in a solvent constitutes only one phase. (e.g.) Sugar solution in
water.
3) An emulsion of oil in water forms two phases
4) MgCO3 (s) MgO (s) + CO2 (g) It involves 3 phases, solid MgCO3, solid MgO and gaseous CO2.
5) Rhombic sulphur (s) −−−−> Monoclinic sulphur (s). It forms 2 phases.
6) Consider the following heterogeneous system.
CuSO4(s) + 5H2O (l) CuSO4 . 5H2O (s) It involves 3 phases namely, 2 solids and 1 liquid phase.
3.3.2 COMPONENT (C): Component is defined as, ―the minimum number of independent variable constituents,
by means of which the composition of each phase can be expressed in the form of a chemical
equation‖.
Examples: (a) Consider a water system consisting of three phases.
Ice(s) Water(l) Vapour(g) The chemical composition of all the three phases is H2O. Hence the number of
component is one.
(b) Sulphur exists in 4 phases namely rhombic, monoclinic, liquid and vapour, but the
chemical composition is only sulphur. Hence it is a one component system.
(c) Thermal decomposition of CaCO3
CaCO3s) CaO (s) + CO2(g) The system has 3 phases namely, solid CaCO3, solid CaO and gaseous CO2and 2
components, as the composition of each of the above phases can be expressed as equations
considering any two of the three components present. When CaCO3and CaO are considered
as components, the chemical equations are:

M.S University-D.D.C.E Unit III
Page 41
Phase Components
CaCO3 CaCO3 + 0CaO
CaO 0CaCO3 + CaO
CO2 CaCO3 − CaO
(d) PCl5(s) PCl3(l) + Cl2(g)
This system has 3 phases and 2 components namely, PCl3 and Cl2.
(e) An aqueous solution of NaCl is a two component system. The constituents are NaCl and
H2O.
(f) CuSO4. 5H2O(s) CuSO4 . 3H2O(s) + 2H2O(g) It is also a two component system as components are CuSO4.3H2O and H2O.
(g) In the dissociation of NH4Cl , the following equilibrium occurs.
NH4Cl (s) NH3 (g) + HCl (g) The system consists of 2 phases namely solid NH4Cl and the gaseous mixture
containing NH3 + HCl. When NH3and HCl are present in equivalent quantities the
composition of both the phases can be represented by NH4Cl and hence the system will be a
one component system.
3.3.3. DEGREE OF FREEDOM (F) Degree of freedom is defined as, ―the minimum number of independent variable
factors like temperature, pressure and concentration, which must be fixed in order to define
the system completely‖.
A system having 1, 2, 3 or 0 degrees of freedom are called as univariant, bivariant,
trivariant and non-variant systems respectively.
Examples: (a) Consider the following equilibrium
Ice(s) Water(l) Vapour(g) These 3 phases will be in equilibrium only at a particular temperature and pressure.
Hence, this system does not have any degree of freedom, so it is non-variant (or) zero-variant
(or) in-variant system.
(b) Consider the following equilibrium
Liquid Water(l) Water- vapour(g) Here liquid water is in equilibrium with water vapour. Hence any one of the degrees
of freedom such as temperature (or) pressure has to be fixed to define the system. Therefore
the degree of freedom is one.
(c) For a gaseous mixture of N2 and H2, both the pressure and temperature must be fixed to
define the system. Hence, the system is bivariant.
3.4 PHASE DIAGRAM Phase diagram is a graph obtained by plotting one degree of freedom against theother.
Types of Phase Diagrams
(i) P-T Diagram If the phase diagram is plotted between temperature and pressure, the diagram is
called P -T diagram. P -T diagram is used for one component system.
(ii) T-C Diagram If the phase diagram is plotted between temperature and composition, the diagram is

M.S University-D.D.C.E Unit III
Page 42
called T-C diagram.T- C diagram is used for two component system
Uses of Phase Diagram: It helps in
(i) Predicting whether an eutectic alloy (or) a solid solution is formed on cooling a
homogeneous liquid containing mixture of two metals.
1.12. Understanding the properties of materials in the heterogeneous equilibrium system.
1.13. Studying of low melting eutectic alloys, used in soldering.
3.5 ONE COMPONENT SYSTEM
APPLICATIONS OF PHASE RULE - TO ONE COMPONENT SYSTEM
3.5.1 The Water System Water exists in 3 possible phases, namely solid ice, liquid water and water-vapour.
Hence, there can be three forms of equilibria, each involving two phases such as.
Solid Ice Liquid Water
Liquid Water Water- vapour
Solid Ice Water- vapour The phase diagram for the water system is as follows and it contains curves, areas, and triple
point.
Curve OA The curve OA is called vapourisation curve, it represents the equilibrium between water and
vapour.
At any point on the curve the following equilibrium will exist.
Liquid Water Water- vapour This equilibrium (i.e. line OA) will extend upto the critical temperature (374°C).

M.S University-D.D.C.E Unit III
Page 43
Beyond the critical temperature the equilibrium will disappear and only water vapour
will exist
Curve OB The curve OB is called sublimation curve of ice, it represents the equilibrium between
solid ice and water-vapour.
At any point on the curve the following equilibrium will exist.
Solid Ice Water- vapour This equilibrium (i.e.line OB) will extend up to the absolute zero (− 273°C)
Beyond absolute zero only solid ice will exist and no water-vapour.
Curve OC The curve OC is called melting point curve of ice, it represents the equilibrium between ice
and water.
At any point on the curve the following equilibrium will exist.
Solid Ice Liquid Water The curve OC is slightly inclined towards pressure axis. This shows that melting point of ice
decreases with increase of pressure.
Curve OB′(Metastable Equilibrium) The curve OB′ is called vapour pressure curve of the super-cooled water (or) metastable
equilibrium where the following equilibrium will exist.
Super- cooled water Water- vapour Sometimes water can be cooled below it‟s freezing point (0°C) without the formation of ice,
this water is called super-cooled water.
Super cooled water is unstable and it can be converted into solid ice by ―seeding‖ (or) by
slight disturbance.
Along the curves OA,OB,OC and OB′
The no. of phases(P) is 2 ,component(C) is 1 and the degree of freedom of the system is one
i.e., univariant. This is predicted by the phase rule:
F = C − P + 2; F = 1 − 2 + 2; F = 1 Therefore, either temperature (or) pressure must be fixed to define the system.
Point ‘O’ (Triple point) The three curves OA, OB and OC meet at a point „O‟, where three phases namely solid ice,
liquid water and water-vapour are simultaneously at equilibrium.
This point is called triple point, at this point the following equilibrium will exist
Ice(s) Water(l) Vapour(g) At this point the no. of phases(P) is 3, component(C) is 1 and the degree of freedom of the
system is zero i.e., nonvariant. This is predicted by the phase rule:
F = C − P + 2; F = 1 − 3 + 2; F = 0 This takes place only at a constant temperature (0.0075°C) and pressure (4.58 mm of Hg).
Areas Areas AOC, BOC, AOB represents liquid water, solid ice and water-vapour
respectively where the no. of phases(P) and component(C) are one. Hence the degree of
freedom of the system is two i.e., bivariant. This is predicted by the phase rule:
F = C − P + 2; F = 1 − 1 + 2; F = 2 Therefore, both temperature and pressure must be fixed to define the system at any point in
the areas.
3.5.2 THE SULPHUR SYSTEM It is a one-component, four-phase system. The four phases are :

M.S University-D.D.C.E Unit III
Page 44
(a) Two solid polymorphic forms :
(i) Rhombic Sulphur (SR)
(ii) Monoclinic Sulphur (SM)
(b) Sulphur Liquid (SL)
(c) Sulphur Vapour (SV)
All the four phase can be represented by the only chemical individual ‗sulphur‘ itself and
hence one component of the system.
The two crystalline forms of sulphur SR and SM exhibit enantiotropy with a
transition point at 95.6ºC. Below this temperature SRis stable, while above it SMis the stable
variety. At 95.6ºC eachform can be gradually transformed to the other and the two are in
equilibrium. At 120ºC, SM melts. Thus,
The phase diagram for the sulphur system is shown in Fig. 19.4. The salient features of
thephase diagram are described below.
(i) The six curves AB, BC, CD, BE, CE, EG
(ii) The three Triple points B, C, E
(iii) (iii) The four areas :
ABG marked ‗solid Rhombic‘
BEC marked ‗solid Monoclinic‘
GECD marked ‗liquid Sulphur‘
ABCD marked ‗Sulphur vapour‘
Let us now proceed to discuss the significance of these features :
1. The curves AB, BC, CD, BE, CE, EG
These six curves divide the diagram into four areas.
Curve AB, the Vapour Pressure curve of SR. It shows the vapour pressure of solid
rhombicsulphur (SR) at different temperatures. Along this curve the two phases S R and
sulphur vapour (SV) are in equilibrium. The system SR/SV has one degree of freedom,
F = C – P + 2 = 1 – 2 + 2 = 1

M.S University-D.D.C.E Unit III
Page 45
i.e., it is monovariant.
Curve BC, the Vapour Pressure curve of SM.It shows variation of the vapour pressure
ofmonoclinic sulphur (SM) with temperature. SM and SV coexist in equilibrium along this
curve. The system SM/SV is monovariant.
Curve CD, the Vapour Pressure curve of SL. It depicts the variation of the vapour
pressure ofliquid sulphur (SL) with temperature. SL and SV are in equilibrium along CD. The
two phase system SL/SV is monovariant. One atmosphere line meets this curve at a
temperature (444.6ºC) which is the boiling point of sulphur.
Curve BE, the Transition curve. It shows the effect of pressure on the transition
temperature forSR and SM. As two solid phases are in equilibrium along the curve, the system
SR/SM is monovariant. The transformation of SR and S M is accompanied by increase of
volume (density of SR = 2.04; SM = 1.9) and absorption of heat i.e.,
Thus the increase of pressure will shift the equilibrium to the left (Le Chatelier’s
Principle) and the transition temperature will, therefore, be raised. This is why the line BE
slopes away from the pressure axis showing thereby that the transition temperature is raised
with increase of pressure.
Curve CE, the Fusion curve of SM. It represents the effect of pressure on the melting
point of SM.The two phases in equilibrium along this curve are SM and SL. The system SM/SL
is monovariant. As the melting or fusion of SM is accompanied by a slight increase of
volume, the melting point will rise by increase of pressure (Le Chatelier’s principle). Thus
the curve CE slopes slightly away from the pressure axis. The curve ends at E because SM
ceases to exist beyond this point.
Curve EG, the Fusion curve for SR. Here the two phases in equilibrium are SRand SL.
Thenumber of phases being two, the system SR/SL is monovariant.
2 The Triple points B, C, E
Triple point B. This is the meeting point of the three curvesAB,BCandBE. Three phases,
solid
SR, solid SM and SV are in equilibrium at the point B. There being three phases and one
component, the system SR/SM/S L is nonvariant.
F = C – P + 2 = 1 – 3 + 2 = 0
At B, SR is changed to SM and the process is reversible. Thus the temperature
corresponding to
B is the transition temperature (95.6ºC).
Triple point C. The curvesBC, CD, CE meet at this point. The three phases in
equilibrium are SM,SL and SV. There being three phases and one component, the system SM/S
L/SV is nonvariant. The temperature corresponding to C as indicated on the phase diagram is
120ºC. This is the melting point of SM.
Triple point E. The two linesCEandBE, having different inclinations away from the
pressureaxis, meet at E where a third line EG also joins. The three phases SR, SM and SL are
in equilibrium and the system at the point E is nonvariant. This point gives the conditions of
existence of the system SR/SM/SL at 155ºC and 1290 atmospheres pressure.
(3) The Areas The phase diagram of the sulphur system has four areas or regions. These are labelled as
rhombic sulphur, monoclinic sulphur, liquid sulphur and vapour. These represent single phase
systems which have two degrees of freedom,
F = C – P + 2 = 1 – 1 + 2 = 2That is,
each of the systems SR, SM, SL, and SV are bivariant.

M.S University-D.D.C.E Unit III
Page 46
(4) Metastable Equilibria The change of SR to SM takes place very slowly. If enough time for the change is not
allowed and SR is heated rapidly, it is possible to pass well above the transition point without
getting SM. In that case, there being three phases (SR, S L, SV) only and one component, the
phase diagram, like that of water system, will consist of three curves, one triple point and
three areas.
The dashed curve BF, the Vapour Pressure curve of metastable SR. This is a
continuation ofthe vapour pressure curve AB of stable SR. The metastable phases SR and SV
are in equilibrium along this curve. It is a monovariant system.
The dashed curve CF, the Vapour Pressure curve of supercooled SL. On supercooling
liquidsulphur, the dashed curve CF is obtained. It is, in fact, the back prolongation of DC.
The curve CF represents the metastable equilibrium between supercooled SL and SV. Thus it
may be designated as the vapour pressure curve of supercooled SL. It meets the dashed curve
BF at F.
The dashed curve FE, the Fusion curve of metastable SR. The two metastable phases
SRand SLare in equilibrium along this curve and the system is monovariant. This shows that
the melting point of metastable SR is increased with pressure. Beyond E, this curve depicts
the conditions for the stable equilibrium SR/SL as the metastable SR disappears.
The metastable Triple point F. At this point, three metastable phases SR, SLand SVare
inequilibrium. The system is a metastable triple point with no degree of freedom. The
corresponding temperature is the melting point of metastable SR (114ºC).
3.6 TWOCOMPONENT ALLOY SYSTEM (or) MULTI COMPONENTEQUILIBRIA
Reduced Phase Rule (or) Condensed System The maximum number of degree of freedom for a two component system will be
three, when the system exists as a single phase.
F = C − P + 2; F = 2 − 1 + 2; F = 3 In order to represent the conditions of equilibrium graphically, it requires three co-
ordinates, namely P, T and C. This requires three dimensional graph, which cannot be
conveniently represented on paper. Therefore, any two of the three variables must be chosen
for graphical representation.
A Solid-liquid equilibrium of an alloy has practically no gaseous phase and the effect
of pressure is negligible. Therefore, experiments are conducted under atmospheric pressure.
Thus, the system in which only the solid and liquid phases are considered and the gas
phase is ignored is called a condensed system.
Since the pressure is kept constant, the phase rule becomes
F′ = C − P + 1 This equation is called reduced phase rule (or) condensed phase rule.
3.6.1 Classification of Two Component System Based on the solubility and reactive ability, the two component systems are classified
into three types.
(i) Simple eutectic formation.
(ii) (a) Formation of compound with congruent melting point.
(b) Formation of compound with incongruent melting point.
(i) Simple Eutectic Formation

M.S University-D.D.C.E Unit III
Page 47
A binary system having two substances, which are completely miscible in the liquid state, but
completely immiscible in the solid state, is known as eutectic (easy melt) system. They do not
react chemically. Of the different mixtures of two substances, a mixture having the lowest
melting point is known as the eutectic mixture
(ii) Formation of compound with congruent melting point
The binary alloy systems with two substances form one or more compounds with definite
proportions. Of the compounds, a compound is said to have congruent melting point, if it
melts exactly at a constant temperature into liquid, having the same composition as that of the
solid.
(ii) Formation of compound with incongruent melting point
Of the above compounds, a compound is said to have incongruent melting point, if it
decomposes completely at a temperature below its melting point forming a new solid phase
with a different composition from that of the original.
(iii) Formation of solid solution
A binary system in which two substances, especially metals, are completely miscible in
both solid and liquid states form solid solutions and their mixing takes place in the atomic
levels. This happens only when the atomic radius of the two metals not differ by more than
15%.
3.6.2 BINARY ALLOY SYSTEM (OR) THE SIMPLE EUTECTIC SYSTEM
The Lead-Silver System The Lead-Silver system is studied at constant pressure and the vapour phase is
ignored. Hence the condensed phase rule is used:
F′ = C − P + 1 The phase diagram of lead-silver system is shown as follows. It contains curves, areas
and eutectic point.

M.S University-D.D.C.E Unit III
Page 48
(i) Curve AO
The curve AO is known as freezing point curve of silver. Point A is the melting point
of pure Ag (961°C). The curve AO shows the melting point depression of Ag by the
successive addition of Pb. Along this curve AO, solid Ag and the melt are in equilibrium.
Solid Ag Liquid Melt
(ii) Curve BO The curve BO is known as freezing point curve of lead. Point B is the melting point of
pure lead (327°C). The curve BO shows the melting point depression of Pb by the successive
addition of Ag. Along this curve BO, solid Pb and the melt are in equilibrium.
Solid Pb Liquid Melt
Along the curves AO and BO The degree of freedom according to reduced phase rule is as follows:
F′ = C − P + 1; F′ = 2 − 2 + 1; F′ = 1 The system is univariant which means either temperature (or) composition must be fixed to
define the system.
(iii) Point ‘O’ (Eutectic point) The curves AO and BO meet at point „O‟ at a temperature of 303°C, where three
phases (solid Ag, solid Pb and their liquid melt) are in equilibrium.
Solid Ag + Solid Pb Liquid Melt According to reduced phase rule equation.
F′ = C − P + 1; F′ = 2 − 3 + 1; F′ = 0 The system is non-variant.
The point „O‟ is called eutectic point or eutectic temperature and its corresponding
composition, 97.4%Pb + 2.6%Ag, is called eutectic composition.
Below this point the eutectic compound and the metal solidify.
(iv) Area The area above the line AOB has a single phase (molten Pb+Ag) or liquid melt.
According to reduced phase rule the degree of freedom.
F′ = C − P + 1; F′ = 2 − 1 + 1; F′ = 2 The system is bivariant which means both the temperature and composition have to be fixed
to define the system completely.
The area below the line AO (solid Ag + liquid melt), below the line BO (solid Pb +

M.S University-D.D.C.E Unit III
Page 49
liquid melt) and below the point „O‟ (Eutectic compound + solid Ag or solid Pb) have two
phases and hence the system is univariant
F′ = C − P + 1; F′ = 2 − 2 + 1; F′ = 1.
Application of Pattinson’s process for the desilverisation of Argentiferous lead The argentiferous lead, having a very small amount of silver (say 0.1%), is heated to a
temperature above its melting point, so that the system has only the liquid phase represented
by the point ―p‟ in the phase diagram .
It is then allowed to cool where the temperature decreases along the line ―pq‟. As
soon as the point ―q‟ is reached, Pb is crystallised out and the solution will contain relatively
increasing amounts of ―Ag‟. On further cooling, more and more of ―Pb‟ is separated along
the line ―BO‟. The melt continues to be richer and richer in Ag until the point „O‟ is reached,
where the percentage of Ag rises to 2.6%.
Thus, the process of raising the relative proportions of Ag in the alloy is known as
Pattinson‟s process.
3.6.3 POTASSIUM IODIDE–WATER SYSTEM It has four phases : (i) Solid KI ; (ii) Solution of KI in water ; (iii) Ice; and (iv) Vapour.
Only two chemical constituents KI and H2O being necessary to depict the composition of all
the four phases, it is a two-component system.
Since the conditions for the existence of the various phases are studied at atmospheric
pressure the vapour phase is ignored and the system KI-H2O is regarded as a condensed
system. Pressure being constant, the two variables, temperature and concentration will be
considered. The TC diagram of the system is shown in Fig. 19.8. It consists of :
(a) The Curves AO and OB (b)
The Eutectic Point O
(c) The area above AOB and the areas below the curves OA and BO
The Curve AO; the Freezing point curve of Water. The pointArepresents the freezing
point ofwater or the melting point of ice (0ºC) under normal conditions. The curve AO shows
that the melting point of ice falls by the addition of solid KI. As more and more of KI is
added, the concentration of solution and the melting temperature changes along the curve
AO. The phases in equilibrium along the curve AO are ice and solution. Applying the reduced
phase rule equation to the condensed system ice/solution, we have
F' = 2 – 2 + 1 = 1
Thus the system is monovariant.

M.S University-D.D.C.E Unit III
Page 50
The Eutectic point. The lowest point attainable by the addition of KI along the
curveOAisO.Here the solution becomes saturated with KI and the solid KI appears as the
third phase. This point is termed the Eutectic Point or Cryohydric Point as one of the
components in the system is water. Applying the reduced phase rule equation to the system
ice/solid KI/solution at point O.
F' = 2 – 3 + 1 = 0
Hence the system is nonvariant. That is, both the temperature (– 22ºC) and composition
(52% KI + 48% ice) are fixed.
The Curve BO; the Solubility curve of KI. AtO, the solution is saturated withKI. Thus
the curveBO depicts the effect of temperature on the concentration of saturated solution or the
solubilityof KI. The phases in equilibrium along the curve are solid KI and solution.
Applying the reduced phase rule equation, we have
F = C – P + 1 = 2 – 2 + 1 = 1
That is, the condensed system solid KI/solution is monovariant.
The Area above AOB.It represents the single phase system ‗solution‘. Applying the
phase ruleequation,
F = C – P + 1 = 2 – 1 + 1 =
2Therefore the system is bivariant.
As labelled in the diagram, the area below AO shows the existence of ice and solution,
while the area below BO depicts the presence of solid KI and solution. Below the eutectic
temperature line, there can exist ice and solid KI only.
Cooling Produced by Freezing Mixtures KI-H2O is a typical eutectic system with a salt and water as components. Many other salts
as sodium chloride, sodium nitrate, ammonium chloride and ammonium nitrate constitute
eutectic systems with water and form similar phase diagrams as shown in Fig. 19.8. The facts
contained in this diagram explain the theory of freezing mixtures which are obtained by
mixing salt and ice.
When we add a salt, common salt (NaCl) to melting ice, we follow along the curve AO.
Thus the addition of salt to the system ice/water produces a continued lowering of
temperature until the eutectic point O is reached. Thus the lowest temperature attained in this
way will be the eutectic temperature (– 22.0ºC). Alternatively, we may start with a
concentrated solution of the salt represented by point X on the phase diagram. As we
withdraw heat by adding ice, we travel along the dashed line XY. At Y which lies on the
solubility curve BO, the solution becomes saturated with the salt. Onfurther withdrawing
heat, we go along with the curve BO until the eutectic point is reached. Thus the same
minimum temperature can be attained with a freezing mixture, whether we add salt to ice or
ice to salt solution. The eutectic temperatures of some salt/ice systems are listed below.
System Eutectic Temperature
NH4Cl + ICE – 16.0ºC
NaCl.2H2O + ICE – 22.0ºC
KNO2 + ICE – 2.6ºC
NaNO2 + ICE – 18.1ºC
KCl + ICE – 11.4ºC

M.S University-D.D.C.E Unit III
Page 51
Uses of Eutectic system
1. Suitable alloy composition can be predicted.
Making solders, used for joining two metal pieces together.
Differences between Melting point, Eutectic point and Triple point 1. Melting Point: It is the temperature at which the solid and liquid phases, having
thesame composition, are in equilibrium.
Solid A Liquid A 2. Eutectic Point: It is the temperature at which two solids and a liquid phase are
inequilibrium
Solid A + Solid B Liquid 3.
Triple Point It is the temperature at which three phases are in equilibrium.
Solid Liquid Vapour All the eutectic points are melting points
All the melting points need not be eutectic points.
Similarly all the eutectic points are triple points, but all the triple points need not be
eutectic points.
SYSTEM FORMING COMPOUNDS WITH CONGRUENT MELTING POINT:
When the components of a binary system at a particular stage form a compound which melts at a sharp temp to give a liquid of the same composition as that of solid and the temp at which the compound melt is called congruent melting point. 3.6.4 THE MAGNESIUM–ZINC SYSTEM
It is a typical 2-component system which involves the formation of an intermetallic compound MgZn2. It
has four phases: solid magnesium (Mg), solid zinc (Zn), solid MgZn2 and the liquid solution of Mg and Zn. The complete phase diagram of the system magnesium-zinc is shown in Fig. 19.10. It appears to be made of
two simple eutectic diagrams. The one toward the left represents the eutectic system Mg-MgZn2, while the one
to the right the system Zn-MgZn2.
The curves AC, CDE and BE. AC is the freezing point curve of magnesium; BE is the freezing point curve
of zinc; and CDE is that of the compound MgZn2.

M.S University-D.D.C.E Unit III
Page 52
The curve AC shows that the melting point of magnesium (651ºC) is lowered on the addition of zinc. This
continues until the point C is reached. Here a new phase, solid MgZn2 appears. The curve CD shows the increase of concentration of zinc in the melt with the rise of temperature. At the
maximum point D, the composition of the melt and the solid compound becomes the same i.e., MgZn2. The point D,
therefore, represents the melting point of MgZn2 (575ºC). The curve DE now shows the lowering of the melting
point with the addition of zinc until the lowest point is attained. Here solid zinc appears. The curve BE exhibits that the melting point of zinc (420ºC) falls with the addition of magnesium until the
point E is reached. Along the freezing point curves AC, CDE and BE, there are two phases in equilibrium viz., one solid phase
(Mg, Zn, or MgZn2) and the other liquid phase. Applying the reduced phase rule equation, we have F = C – P + 1 = 2 – 2 + 1 = 1
This shows that the system Mg/liquid, Zn/liquid and MgZn2/liquid are all monovariant. Eutectic points C and E. There are two eutectic points in the phase diagram. The systems at the points C
and E have two components and three phases in equilibrium. Phases Present
C Solid Mg, solid MgZn2, Liquid
E Solid Zn, solid MgZn2, Liquid These systems are, therefore, nonvariant.
F = C – P + 1 = 2 – 3 + 1 = 0 Congruent Melting Point. As already stated, the composition of the compound MgZn2 and the melt at D
is identical. The corresponding temperature is the congruent melting point of the compound. Here the system has two phases viz., the solid compound and the melt. Both these can be represented by one component
(MgZn2). Therefore the system at D is nonvariant, F = C – P + 1 = 1 – 2 + 1 = 0
The Areas. The area above the curves AC, CDE and BE represents the solution of magnesium and zinc (the
melt). The single phase system at any point in this area is bivariant. The phases present in the other regions of the phase diagram are as labelled.
3.7 USES (OR) MERITS AND DEMERITS OF PHASE RULE
1. Applicable to both physical and chemical equilibria.
2. A convenient method to classify the equilibrium systems in terms of phases,
components and degree of freedom.
3. Indicates that different systems having the same degrees of freedom behave similarly.
4. Decides whether the given number of substances remains in equilibrium or not.
5. Applicable to macroscopic systems without considering their molecular structures.
6. Does not consider the nature (or) amount of substances in the system.
DEMERITS
1. Phase rule can be applied only for the heterogeneous systems in equilibrium.
2. Only three variables like P, T & C are considered, but not electrical, magnetic and
gravitational forces.
3. All the phases of the system must be present under the same conditions of pressure and
temperature.
4. Solid and liquid phases must not be in finely divided state, otherwise deviations occur.
3.8 QUESTIONS AND ANSWERS
Define Phase rule
Explain the phase diagram for water molecule

M.S University-D.D.C.E Unit III
Page 53
Explain the process of desilverisation of lead by pattinson's process
3.9 SUGGESTED READINGS
1. Gibbs, J.W., Scientific Papers (Dover, New York, 1961)
2. Atkins, P.W.; de Paula, J. (2006). Physical chemistry (8th ed.). Oxford University
Press. ISBN 0-19-870072-5. Chapter 6.
3. The Theory of Intermolecular Forces, A.J. Stone, Oxford University Press (Oxford),
1996.
4. The Phase Rule and Its Applications, A. Findlay, A.N. Campbell, N.O. Smith, Dover,
(New York), 1951.
5. The Phase Rule, F.D. Ferguson, T.K. Jones, Butter worths (London), 1966.

M.S University-D.D.C.E Unit IV
Page 54
UNIT IV
SPECTROSCOPY
CONTENTS
4.0 AIMS AND OBJECTIVES
After studying this unit you should be able to understand and explain the various
spectroscopic techniques like UV spectroscopy, IR spectroscopy and NMR spectroscopy.
4.1 UV SPECTROSCOPY
4.1.1 Introduction The molecular spectroscopy is the study of the interaction of electromagnetic waves and
matter. The scattering of sun‘s rays by raindrops to produce a rainbow and appearance of a
colorful spectrum when a narrow beam of sunlight is passed through a triangular glass prism
are the simple examples where white light is separated into the visible spectrum of primary
colors. This visible light is merely a part of the whole spectrum of electromagnetic radiation,
extending from the radio waves to cosmic rays. All these apparently different forms of
electromagnetic radiations travel at the same velocity but characteristically differ from each
other in terms of frequencies and wavelength (Table 1).
Table 1: The electromagnetic spectrum
Radiation type Wave length Frequency Applications
λ , (Ǻ)
ν = c / λ,
(Hz)
radio 1014
3 x 10⁴
Nuclear magnetic
resonance 1012
3 x 10⁶
Television 1010
3 x 10⁸ Spin orientation
4.0 AIMS AND OBJECTIVES
4.1 UV SPECTROSCOPY
4.1.1 INTRODUCTION
4.1.2 NATURE OF ELECTRONIC TRANSITIONS
4.1.3 PRINCIPLES OF ABSORPTION SPECTROSCOPY : BEER’S AND
LAMBERT’S LAW
4.1.4 SPECTRAL MEASUREMENTS
4.1.5 SOLVENT EFFECTS
4.1.6 SOME IMPORTANT TERMS AND DEFINITIONS
4.1.7 APPLICATIONS OF ELECTRONIC SPECTROSCOPY
4.1.8COMMERCIAL APPLICATIONS OF UV AND VISIBLE SPECTROSCOPY
4.1.9 QUESTIONS

M.S University-D.D.C.E Unit IV
Page 55
Radar 108 3 x 10
10
Microwave 107 3 x 10
11 Rotational
Far infrared 106 3 x 10
12 Vibrational
Near infrared 104 3 x 10
14
Visible 8 x 10³ - 4 x 10
3 3.7 x 10
14 -
7.5 x 10¹⁴
Ultraviolet 3 x 10³ 1 x 10
15 Electronic
X-rays 1 3 x 10¹⁸
Gamma rays 10-2 3 x 10²⁰
Nuclear transitions
Cosmic rays 10-4
3 x 10²²
The propagation of these radiations involves both electric and magnetic forces which
give rise to their common class name electromagnetic radiation. In spectroscopy, only the
effects associated with electric component of electromagnetic wave are important. Therefore,
the light wave traveling through space is represented by a sinusoidal trace (figure 1). In this
diagram λ is the wavelength and distance A is known as the maximum amplitude of the
wave. Although a wave is frequently characterized in terms of its wavelength λ, often the
terms such as wavenumber ( ν ), frequency (ν), cycles per second (cps) or hertz (Hz) are also
used.
The unit commonly used to describe the wavelength is centimeters (cm), the different
units are used to express the wavelengths in different parts of the electromagnetic spectrum.
For example, in the ultraviolet and visible region, the units use are angstrom (Ǻ) and
nanometer (nm). In the infrared region, the commonly used unit is wavenumber ( ν ), which
gives the number of waves per centimeter. Thus
The four quantities wavelength, wavenumber, frequency and velocity can be
related to each other by following relationships
Absorption of Different Electromagnetic radiations by Organic Molecules In absorption spectroscopy, though the mechanism of absorption of energy is different
in the ultraviolet, infrared and nuclear magnetic resonance regions, the fundamental process

M.S University-D.D.C.E Unit IV
Page 56
is the absorption of a discrete amount of energy. The energy required for the transition from a
state of lower energy (E1) to state of higher energy (E2) is exactly equivalent to the energy of
electromagnetic radiation that causes transition.
E2
E2 - E1 = E = h v
E1
Figure 2: Energy transition for the absorption of any electromagnetic radiation
E1– E2= E = hν= h c /λ Where E is energy of electromagnetic radiation being absorbed, h is the universal
Planck‘s constant, 6.624 x 10⁻²⁷
erg sec and ν is the frequency of incident light in cycles per
second (cps or hertz, Hz), c is velocity of light 2.998 x 10¹⁰
cm s-1
and λ = wavelength (cm)
Therefore, higher is the frequency, higher would be the energy and longer is the
wavelength, lower would be the energy. As we move from cosmic radiations to ultraviolet
region to infrared region and then radio frequencies, we are gradually moving to regions of
lower energies.
A molecule can only absorb a particular frequency, if there exists within the molecule
an energy transition of magnitude E = h ν
Although almost all parts of electromagnetic spectrum are used for understanding the
matter, in organic chemistry we are mainly concerned with energy absorption from only
ultraviolet and visible, infrared, microwave and radiofrequency regions.
Ultraviolet – visible spectroscopy (λ200 - 800 nm) studies the changes in electronic
energylevels within the molecule arising due to transfer of electrons from π- or non-bonding
orbitals. It commonly provides the knowledge about π-electron systems, conjugated
unsaturations, aromatic compounds and conjugated non-bonding electron systems etc.
Infrared spectroscopy (ν400-4000 cm-1
) studies the changes in the vibrational and
rotationmovements of the molecules. It is commonly used to show the presence or absence
of functional groups which have specific vibration frequencies viz. C=O, NH2, OH, CH, C-
O etc.
Nuclear magnetic resonance (radiofrequencyν60-600 MHz) provides the
information aboutchanges in magnetic properties of certain atomic nuclei. 1H and
13C are the
most commonly studied nuclei for their different environments and provide different signals
for magnetically non-equivalent nuclei of the same atom present in the same molecule.
In the present chapter, UV-Vis and Infrared spectroscopy have been discussed.
Ultraviolet and Visible Spectroscopy This absorption spectroscopy uses electromagnetic radiations between 190 nm to 800

M.S University-D.D.C.E Unit IV
Page 57
nm and is divided into the ultraviolet (UV, 190-400 nm) and visible (VIS, 400-800 nm)
regions. Since the absorption of ultraviolet or visible radiation by a molecule leads transition
among electronic energy levels of the molecule, it is also often called as electronic
spectroscopy. The information provided by this spectroscopy when combined with the
information provided by NMR and IR spectral data leads to valuable structural proposals.
4.1.2 Nature of Electronic Transitions The total energy of a molecule is the sum of its electronic, its vibrational energy and
its rotational energy. Energy absorbed in the UV region produces changes in the electronic
energy of the molecule. As a molecule absorbs energy, an electron is promoted from an
occupied molecular orbital (usually a non-bonding n or bonding π orbital) to an unoccupied
molecular orbital (an antibonding π∗ or σ
*orbital) of greater potential energy (figure 3). For
most molecules, the lowest-energy occupied molecular orbitals are σ orbitals, which
correspond to σ bonds. The π orbitals lie at relatively higher energy levels than σ orbitals and
the non-bonding orbitals that hold unshared pairs of electrons lie even at higher energies. The
antibonding orbitals (π* and σ
* ) are orbitals of highest energy. The relative potential
energies of these orbitals and various possible transitions have been depicted in figure 3.
v
Figure 3 : Relative energies of orbitals most commonly involved in electronic spectroscopy of organic
molecules
The saturated aliphatic hydrocarbons (alkanes) exhibit only σσ* transitions but
depending on the functional groups the organic molecules may undergo several possible
transitions which can be placed in the increasing order of their energies viz. n π* < n
σ*<π π*<σ π* <σ σ*. Since all these transitions require fixed amount of energy
(quantized), an ultraviolet or visible spectrum of a compound would consist of one or
more well defined peaks, each corresponding to the transfer of an electron from one
electronic level to another. If the differences between electronic energy levels of two
electronic states are well defined i.e. if the nuclei of the two atoms of a diatomic molecule
are held in fixed position, the peaks accordingly should be sharp. However, vibrations and
rotations of nuclei occur constantly and as a result each electronic state in a molecule is

M.S University-D.D.C.E Unit IV
Page 58
associated with a largenumber of vibrational and rotational states. At room temperature,
the molecules in the ground state will be in the zero vibrational level (Gυo). This is shown
schematically in figure 4. The transition of an electron from one energy level to another is
thus accompanied by simultaneous change in vibrational and rotational states and causes
transitions between various vibrational and rotational levels of lower and higher energy
electronic states. Therefore many radiations of closely placed frequencies are absorbed
and a broad absorption band is obtained. When a molecule absorbs ultraviolet or visible
light of a defined energy, an assumption is made that only one electron is excited form
bonding orbital or non-bonding orbital to an anti-bonding orbital and all other electrons
remain unaffected. The excited state thus produced is formed in a very short time i.e. of
the order of 10-15
seconds. In accordance with Franck-Condon principle, during electronic
excitation the atoms of the molecule do not move.
The most probable transition would appear to involve the promotion of one electron
from the highest occupied molecular orbital (HOMO) to the lowest unoccupied molecular
orbital (LUMO), but in many cases several transitions can be observed, giving several
absorption bands in the spectrum. We can have a general view of the possible transitions
prevailing in organic compounds.
Eυ3
Eυ2
Eυ1
Eυo
Gυ1
Gυo
Figure 4 : Energy level diagram showing excitation between different vibrational and
rotational levels of twoelectronic states
Alkanes can only undergo σσ* transitions. These are high-energy transitions and involve
very short wavelength ultraviolet light (< 150 nm). These transitions usually fall out-side the
generally available measurable range of UV-visible spectrophotometers (200-1000 nm). The
σσ* transitions of methane and ethane are at 122 and 135 nm, respectively. In alkenes
amongstthe available σσ* and ππ* transitions, the ππ* transitions are of lowest
energy and absorb radiations between 170-190 nm.
In saturated aliphatic ketones the lowest energy transition involves the transfer of one
electron of the nonbonding electrons of oxygen to the relatively low-lying π* anti-bonding
orbital. This n π* transition is of lowest energy (~280 nm) but is of low intensity as it is
symmetryforbidden. Two other available transitions are n π* and ππ*. The most

M.S University-D.D.C.E Unit IV
Page 59
intense band for these compounds is always due to ππ* transition.
In conjugated dienes the ππ* orbitals of the two alkene groups combine to form new
orbitals – two bonding orbitals named as π1 and π2 and two antibonding orbitals named as
π3* and π4*. It is apparent that a new ππ* transition of low energy is available as a result
of conjugation. Conjugated dienes as a result absorb at relatively longer wavelength than do
isolated alkenes (see figure 6).
4.1.3 Principles of Absorption Spectroscopy : Beer’s and Lambert’s Law
The greater the number of molecules that absorb light of a given wavelength, the greater the
extent of light absorption and higher the peak intensity in absorption spectrum. If there are
only a few molecules that absorb radiation, the total absorption of energy is less and
consequently lower intensity peak is observed. This makes the basis of Beer-Lambert Law
which states that the fraction of incident radiation absorbed is proportional to the number of
absorbing molecules in its path.
When the radiation passes through a solution, the amount of light absorbed or transmitted is
an exponential function of the molecular concentration of the solute and also a function of
length of the path of radiation through the sample. Therefore,
Log Io / I = ε c l
Where Io = Intensity of the incident light (or the light intensity passing through a reference
cell) I = Intensity of light transmitted through the sample solution
c = concentration of the solute in mol
l-1
l = path length of the sample in cm
ε = molar absorptivity or the molar extinction coefficient of the substance whose light
absorption is under investigation. It is a constant and is a characteristic of a given absorbing
species (molecule or ion) in a particular solvent at a particular wavelength. ε is numerically
equal to the absorbance of a solution of unit molar concentration (c = 1) in a cell of unit
length ( l = 1) and its units are liters.moles-1
. cm-1
. However, it is customary practice among
organic chemists to omit the units.
The ratio I / Io is known as transmittance T and the logarithm of the inverse ratio Io / I is
known as the absorbance A.
Therefore
- Log I / Io = - log T = ε c l
and Log Io / I = A = ε c l
or A = ε c l
For presenting the absorption characteristics of a spectrum, the positions of peaks are
reported as λmax (in nm) values and the absorptivity is expressed in parenthesis.
4.1.4 Spectral Measurements The UV-Vis spectra are usually measured in very dilute solutions and the most
important criterion in the choice of solvent is that the solvent must be transparent within the
wavelength range being examined. Table 2 lists some common solvents with their lower
wavelength cut off limits. Below these limits, the solvents show excessive absorbance and
should not be used to determine UV spectrum of a sample.
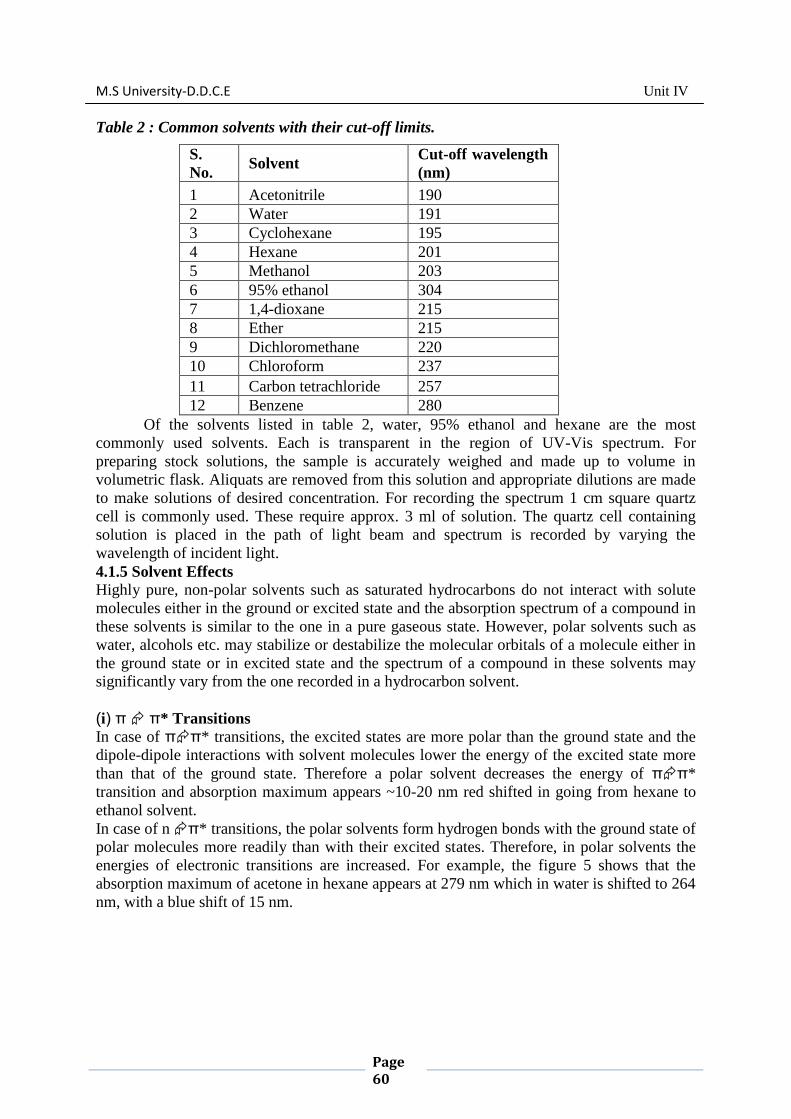
M.S University-D.D.C.E Unit IV
Page 60
Table 2 : Common solvents with their cut-off limits.
S.
No. Solvent
Cut-off wavelength
(nm)
1 Acetonitrile 190
2 Water 191
3 Cyclohexane 195
4 Hexane 201
5 Methanol 203
6 95% ethanol 304
7 1,4-dioxane 215
8 Ether 215
9 Dichloromethane 220
10 Chloroform 237
11 Carbon tetrachloride 257
12 Benzene 280
Of the solvents listed in table 2, water, 95% ethanol and hexane are the most
commonly used solvents. Each is transparent in the region of UV-Vis spectrum. For
preparing stock solutions, the sample is accurately weighed and made up to volume in
volumetric flask. Aliquats are removed from this solution and appropriate dilutions are made
to make solutions of desired concentration. For recording the spectrum 1 cm square quartz
cell is commonly used. These require approx. 3 ml of solution. The quartz cell containing
solution is placed in the path of light beam and spectrum is recorded by varying the
wavelength of incident light.
4.1.5 Solvent Effects Highly pure, non-polar solvents such as saturated hydrocarbons do not interact with solute
molecules either in the ground or excited state and the absorption spectrum of a compound in
these solvents is similar to the one in a pure gaseous state. However, polar solvents such as
water, alcohols etc. may stabilize or destabilize the molecular orbitals of a molecule either in
the ground state or in excited state and the spectrum of a compound in these solvents may
significantly vary from the one recorded in a hydrocarbon solvent.
(i) π π* Transitions
In case of ππ* transitions, the excited states are more polar than the ground state and the
dipole-dipole interactions with solvent molecules lower the energy of the excited state more
than that of the ground state. Therefore a polar solvent decreases the energy of ππ*
transition and absorption maximum appears ~10-20 nm red shifted in going from hexane to
ethanol solvent.
In case of n π* transitions, the polar solvents form hydrogen bonds with the ground state of
polar molecules more readily than with their excited states. Therefore, in polar solvents the
energies of electronic transitions are increased. For example, the figure 5 shows that the
absorption maximum of acetone in hexane appears at 279 nm which in water is shifted to 264
nm, with a blue shift of 15 nm.

M.S University-D.D.C.E Unit IV
Page 61
4.1.6 Some important terms and definitions (i) Chromophore: The energy of radiation being absorbed during excitation of electrons
fromground state to excited state primarily depends on the nuclei that hold the electrons
together in a bond. The group of atoms containing electrons responsible for the absorption is
called chromophore. Most of the simple un-conjugated chromophores give rise to high
energy transitions of little use. Some of these transitions have been listed in table 3.
Table 3: Absorption maxima of simple un-conjugated chromophores
Chromophore Transition εmax λmax(nm)
σ – bonded electrons
(C-C, C-H etc.) σ σ* ~ 150
Lone pair electrons
-O-, -N-, -S- n σ* 100-1000 ~ 190
C=O, C=N n π* 15 ~300
π π* 500 ~190 R-C=N n π* 5 ~ 170
R-COOH, RCONH2, RCOOR n π* 50 ~ 210
π- bonded electrons C=C π π* 14000 ~ 190 C=C π π* 2000 ~ 195 C=O π π* 500 ~ 180
For example, alkanes contain only single bonds with only possible σσ* type electronic
transitions. These transitions absorb radiations shorter than wavelengths that are
experimentally accessible in usually available spectrophotometers. In saturated molecules
with heteroatom bearing non-bonding pairs of electrons, n σ* transitions become available.
These are also high energy transitions. In unsaturated compounds, ππ* transitions become
possible. Alkenes and alkynes absorb ~ 170 nm but the presence of substituents significantly
affects their position. The carbonyl compounds and imines can also undergo n π*
transitions in addition to ππ*. Amongst these, the most studied transitions are n π* as
these absorb at relatively longer wavelength 280-300 nm. These are low intensity (ε 10-100)
transitions.
3) Auxochrome: The substituents that themselves do not absorb ultraviolet radiations but
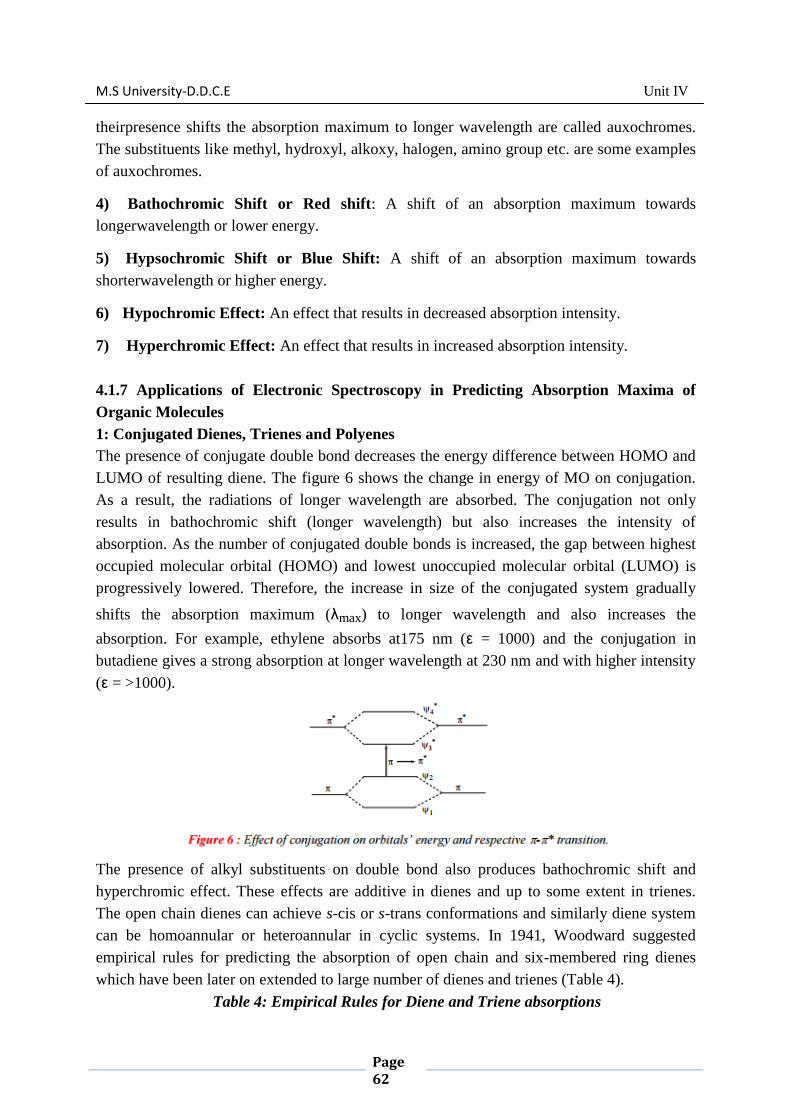
M.S University-D.D.C.E Unit IV
Page 62
theirpresence shifts the absorption maximum to longer wavelength are called auxochromes.
The substituents like methyl, hydroxyl, alkoxy, halogen, amino group etc. are some examples
of auxochromes.
4) Bathochromic Shift or Red shift: A shift of an absorption maximum towards
longerwavelength or lower energy.
5) Hypsochromic Shift or Blue Shift: A shift of an absorption maximum towards
shorterwavelength or higher energy.
6) Hypochromic Effect: An effect that results in decreased absorption intensity.
7) Hyperchromic Effect: An effect that results in increased absorption intensity.
4.1.7 Applications of Electronic Spectroscopy in Predicting Absorption Maxima of
Organic Molecules
1: Conjugated Dienes, Trienes and Polyenes
The presence of conjugate double bond decreases the energy difference between HOMO and
LUMO of resulting diene. The figure 6 shows the change in energy of MO on conjugation.
As a result, the radiations of longer wavelength are absorbed. The conjugation not only
results in bathochromic shift (longer wavelength) but also increases the intensity of
absorption. As the number of conjugated double bonds is increased, the gap between highest
occupied molecular orbital (HOMO) and lowest unoccupied molecular orbital (LUMO) is
progressively lowered. Therefore, the increase in size of the conjugated system gradually
shifts the absorption maximum (λmax) to longer wavelength and also increases the
absorption. For example, ethylene absorbs at175 nm (ε = 1000) and the conjugation in
butadiene gives a strong absorption at longer wavelength at 230 nm and with higher intensity
(ε = >1000).
The presence of alkyl substituents on double bond also produces bathochromic shift and
hyperchromic effect. These effects are additive in dienes and up to some extent in trienes.
The open chain dienes can achieve s-cis or s-trans conformations and similarly diene system
can be homoannular or heteroannular in cyclic systems. In 1941, Woodward suggested
empirical rules for predicting the absorption of open chain and six-membered ring dienes
which have been later on extended to large number of dienes and trienes (Table 4).
Table 4: Empirical Rules for Diene and Triene absorptions
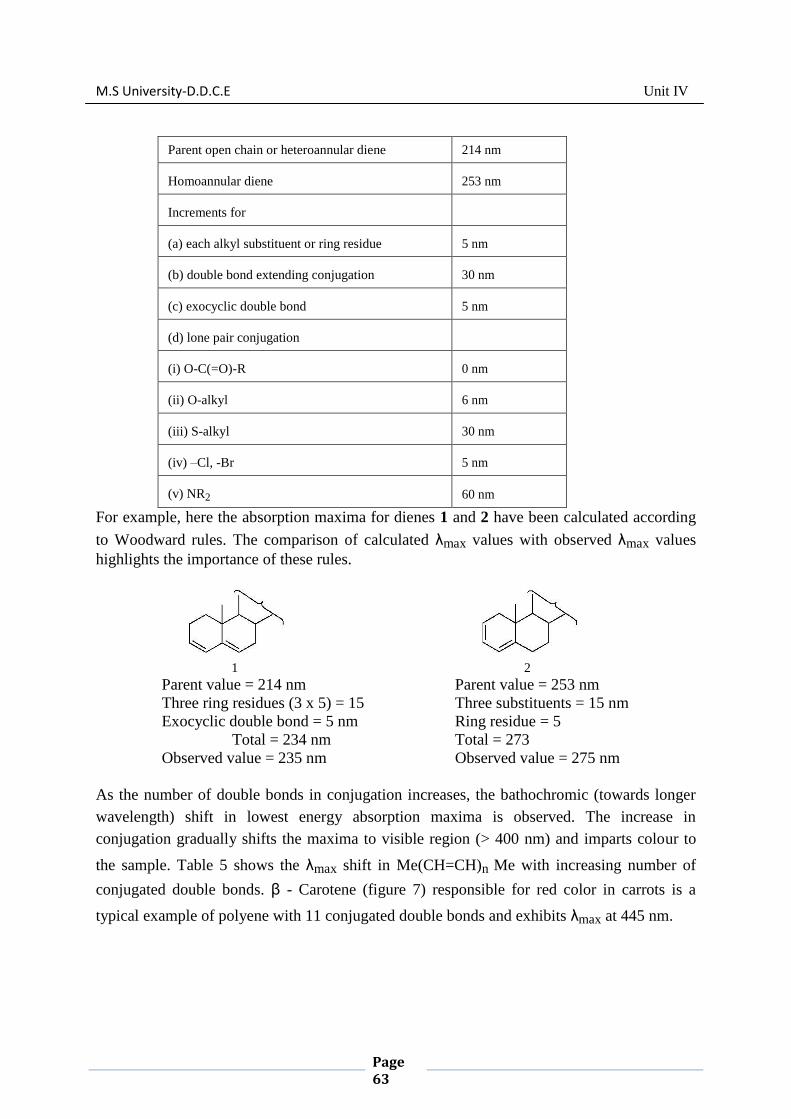
M.S University-D.D.C.E Unit IV
Page 63
Parent open chain or heteroannular diene 214 nm
Homoannular diene 253 nm
Increments for
(a) each alkyl substituent or ring residue 5 nm
(b) double bond extending conjugation 30 nm
(c) exocyclic double bond 5 nm
(d) lone pair conjugation
(i) O-C(=O)-R 0 nm
(ii) O-alkyl 6 nm
(iii) S-alkyl 30 nm
(iv) –Cl, -Br 5 nm
(v) NR2 60 nm
For example, here the absorption maxima for dienes 1 and 2 have been calculated according
to Woodward rules. The comparison of calculated λmax values with observed λmax values
highlights the importance of these rules.
1 2
Parent value = 214 nm Parent value = 253 nm
Three ring residues (3 x 5) = 15 Three substituents = 15 nm
Exocyclic double bond = 5 nm Ring residue = 5
Total = 234 nm Total = 273
Observed value = 235 nm Observed value = 275 nm
As the number of double bonds in conjugation increases, the bathochromic (towards longer
wavelength) shift in lowest energy absorption maxima is observed. The increase in
conjugation gradually shifts the maxima to visible region (> 400 nm) and imparts colour to
the sample. Table 5 shows the λmax shift in Me(CH=CH)n Me with increasing number of
conjugated double bonds. β - Carotene (figure 7) responsible for red color in carrots is a
typical example of polyene with 11 conjugated double bonds and exhibits λmax at 445 nm.

M.S University-D.D.C.E Unit IV
Page 64
2: Carbonyl Compounds
Carbonyl compounds have two principal UV radiations, the allowed ππ* transitions and
the forbidden n π* transitions. In amides, acids, esters or acid halides, the substituents viz.
NR2, OH, OR, or –X on carbonyl group show pronounced hypsochromic effect on the n π*
transitions. The hypsochromic effect is due to inductive effect of nitrogen, oxygen or halogen
atoms. The heteroatom withdraws electrons from carbonyl carbon and makes carbonyl
oxygen lone pair of electrons more stabilized due to its involvement in increasing C=O bond
order. As a result, the n π* transition of these compounds is shifted to 200-215 nm range
relative to 270 nm in aldehydes and ketones. Conjugation of the carbonyl group with double
bond shifts both n π* andππ* transitions to longer wavelengths. The effect
onππ* band is morepronounced. Woodward formulated rules to predict the
position of an absorption maximum in an unknown enone. These rules have been summarized
in table 6.

M.S University-D.D.C.E Unit IV
Page 65
3. Aromatic Compounds
The simplest aromatic compound is benzene. It shows two primary bands at 184 (ε = 47,000)
and 202 (ε = 7400) nm and a secondary fine structure band at 255 nm (ε = 230 in
cyclohexane). Substituents on the benzene ring also cause bathochromic and hypsochromic
shifts of various peaks. Unlike dienes and unsaturated ketones, the effects of various
substituents on the benzene ring are not predictable. However, qualitative understanding of
the effects of substituents on the characteristics of UV-Vis spectrum can be considered by
classifying the substituents into electron-donating and electron-withdrawing groups.
(i) Effect of Substituents with Unshared Electrons: The non-bonding electrons increase
thelength of π-system through resonance and shift the primary and secondary absorption
bands to longer wavelength. More is the availability of these non-bonding electrons, greater
the shift will be. In addition, the presence of non-bonding electrons introduces the possibility
of n π* transitions. If non-bonding electron is excited into the extended π*chromophore,
the atom from which it is removed becomes electron-deficient and the π-system of aromatic
ring becomes electron rich. This situation causes a separation of charge in the molecule and

M.S University-D.D.C.E Unit IV
Page 66
such excited state is called a charge-transfer or an electron-transfer excited state.
In going from benzene to t-butylphenol, the primary absorption band at 203.5 nm shifts to
220 nm and secondary absorption band at 254 nm shifts to 275 nm. Further, the increased
availability of n electrons in negatively charged t-butylphenoxide ion shifts the primary band
from 203.5 to 236 nm (a 32.5 nm shift) and secondary band shifts from 254 nm to 290 nm (a
36 nm shift) (Figure 8). Both bands show hyperchromic effect. On the other hand, in the case
of anilinium cation, there are no n electrons for interaction and absorption properties are quite
close to benzene. But in aniline, the primary band is shifted to 232 nm from 204 nm in
anilinium cation and the secondary band is shifted to 285 nm from 254 nm (Figure 9).
(ii) Effect of π Conjugation: Conjugation of the benzene ring also shifts the primary band
at203.5 nm more effectively to longer wavelength and secondary band at 254 nm is shifted to
longer wavelength to lesser extent. In some cases, the primary band overtakes the secondary
band. For example, benzoic acid shows primary band at 250 nm and secondary band at 273
nm, but cinnamic acid that has longer chromophore exhibits primary band at 273 nm and
secondary band remains merged with it. Similarly, in benzaldehyde, the secondary band

M.S University-D.D.C.E Unit IV
Page 67
appears at 282 nm and primary band at 242 nm but in case of cinnamaldehyde, primary band
appears at 281 nm and remains merged with secondary band (figure 10). The hyperchromic
effect arising due to extended conjugation is also visible.
(iii) Effect of Electron-withdrawing and Electron-releasing Groups:
Electron-withdrawing substituents viz. NH3+, SO2NH2, CN, COOH, COCH3, CHO and
NO2 etc. have no effect on the position of secondary absorption band of benzene ring. But
their conjugation effects with π-electrons of the aromatic ring are observed. Electron-
donating groups such as -CH3, -Cl, -Br, - OH, -OCH3, -NH2 etc increase both λmax and εmax
values of the secondary band.
In case of disubstituted benzene derivatives, it is essential to consider the effect of both the
substituents.
In para-substituted benzenes, two possibilities exist. If both the groups are electron-donating
then the observed spectrum is closer to monosubstituted benzene. The group with stronger
effect determines the extent of shifting of primary band. If one group is electron-releasing
and other is electron-withdrawing, the magnitude of red shift is grater compared to the effect
of single substituent individually. This is attributed to the increased electron drift from
electron-donating group to the electron-withdrawing group through π-bond of benzene ring.
For example, aniline shows secondary band at 285 nm which due to presence of electron-
withdrawing p-nitro substituent is shifted to 367 nm with a significant increase in absorptivit
(figure 11).

M.S University-D.D.C.E Unit IV
Page 68
If two groups of a disubstituted benzene derivative are placed ortho- or meta- to each other,
the combined effect of two substiuents is observed. In case of substituted benzoyl derivatives,
an empirical correction of structure with observed position of the primary absorption band
has been developed. In the absence of steric hindrance to co-planarity, the calculated values
are within + 5 nm of the observed value.
(iv) Polycyclic Aromatic Compounds: In case of polycyclic aromatic hydrocarbons, due
toextended conjugation, both primary and secondary bands are shifted to longer wavelength.
These spectra are usually complicated but are characteristic of parent compound. The primary
band at 184 nm in benzene shifts to 220 nm in case of naphthalene and 260 nm in case of
anthracene.
Similarly, the structured secondary band which appears as broad band around 255 nm in
benzene is shifted to 270 nm and 340 nm respectively in case of naphthalene and anthracene
molecules.
4.1.8 Commercial Applications of UV and Visible Spectroscopy
The UV -Vis spectroscopy has innumerable applications in the drugs and pharmaceutical
industry.
Beer-Lambert law offers a valuable and simple method for quantitative analysis. In practice,
a calibration curve is constructed by plotting absorbance vs. molar concentration and the
concentration of unknown with ‗X‘ absorbance is determined by finding the concentration

M.S University-D.D.C.E Unit IV
Page 69
corresponding to the measured absorbance on the calibration curve. The UV spectroscopy is
used extensively in determining rate constants, equilibrium constants, acid-base dissociation
constants etc for chemical reactions. The use of UV spectrometry in evaluation of enzymatic
assays has become very common e.g. the activity of enzyme dehydrase is assayed by
measuring the formation of ergosterol at 282 nm.

M.S University-D.D.C.E Unit IV
Page 70
4.2 INFRARED ABSORPTION SPECTROSCOPY
Contents
4.2.0 INTRODUCTION
The two atoms joined together by a chemical bond (may be single, double or triple bond),
macroscopically can be composed as two balls joined by a spring. The application of a force
like
(i) stretching of one or both the balls (atoms) away from each other or closer to each other (ii)
bending of one of the atoms either vertically or horizontally and then release of the force
results in the vibrations on the two balls (atoms). These vibrations depend on the strength of
the spring and also the mode (stretching or bending) in which the force is being applied.
Similarly, at ordinary temperatures, organic molecules are in a constant state of vibrations,
each bond having its characteristic stretching and bending frequencies. When infrared light
radiations between 4000-400 cm-1
(the region most concerned to an organic chemist) are
passed through a sample of an organic compound, some of these radiations are absorbed by
the sample and are converted into energy of molecular vibrations. The other radiations which
do not interact with the sample are transmitted through the sample without being absorbed.
The plot of % transmittance against frequency is called the infrared spectrum of the sample or
compound.
This study of vibrations of bonds between different atoms and varied multiplicities which
depending on the elctronegativity, masses of the atom and their geometry vibrate at different
but specified frequencies; is called infrared spectroscopy. The presence of such characteristic
vibrational bands in an infrared spectrum indicates the presence of these bonds in the sample
under investigation.
4.2.0 INTRODUCTION
4.2.1 THEORY OF IR
4.2.2 REGION OF IR
4.2.2.1 NEAR INFRARED SPECTROSCOPY: 4.2.2.2 FAR INFRARED
SPECTROSCOPY:
4.2.3 MOLECULAR ROTATIONS
4.2.3 .1 MOLECULAR VIBRATIONS
4.2.3.2 STRETCHING:
4.2.3.3 BENDING:
4.2.3.4 VIBRATIONAL COUPLING
4.2.3 WHAT IS THE FINGERPRINT REGION
4.2.3.1USING THE FINGERPRINT REGION
4.2.4 DEGREES OF FREEDOM
4.2.4.1VIBRATIONAL MODES 4.3 OUESTIONS
M.S University-D.D.C.E Unit IV
Page 71
4.2.1 THEORY OF IR
IR radiation does not have enough energy to induce electronic transitions as seen with UV.
Absorption of IR is restricted to compounds with small energy differences in the possible
vibrational and rotational states.
For a molecule to absorb IR, the vibrations or rotations within a molecule must cause a net
change in the dipole moment of the molecule. The alternating electrical field of the radiation
(remember that electromagnetic radation consists of an oscillating electrical field and an
oscillating magnetic field, perpendicular to each other) interacts with fluctuations in the
dipole moment of the molecule. If the frequency of the radiation matches the vibrational
frequency of the molecule then radiation will be absorbed, causing a change in the amplitude
of molecular vibration.
Molecular vibrational frequencies lie in the IR region of the electromagnetic spectrum, and
they can be measured using the IR technique. In IR, polychromatic light (light having
different frequencies) is passed through a sample and the intensity of the transmitted light is
measured at each frequency. When molecules absorb IR radiation, transitions occur from a
ground vibrational state to an excited vibrational state (Figure 1).
For a molecule to be IR active there must be a change in dipole moment as a result of the
vibration that occurs when IR radiation is absorbed. Dipole moment is a vector quantity and
depends on the orientation of the molecule and the photon electric vector. The dipole moment
changes as the bond expands and contracts. When all molecules are aligned as in a
crystal and the photon vector points along a molecular axis such as z. Absorption occurs for
the vibrations that displace the dipole along z. Vibrations that are totally x or y polarized
would be absent. Dipole moment in a heteronuclear diatomic molecule can be described as
uneven distribution of electron density between the atoms. One atom is more electronegative
than the other and has a net negative charge.
The dipole moment can be expressed mathematically as
μ=er
μ=er
The relationship between IR intensity and dipole moment is given as
IIR∝(dμ/dQ)2
IIR∝(dμ/dQ)2
relating this to intensity of the IR radiation, we have have the following equation below.
where μμ is the dipole moment and QQ is the vibrational coordinate. The transition moment
integral, that gives information about the probability of a transition occurring, for IR can
also be written as
⟨ψ|M^|ψf⟩
ii and ff represent are initial and final states. ψiψi is the wave function. Relating this to
IR intensity we have
IIR∝⟨ψ|M^|ψf⟩
where M^M^ is the dipole moment and has the Cartesian
coordinates, Mx^Mx^,My^My^, Mz^Mz^. In order for a transition to occur by dipole
selection rules , at least one of the integrals must be non zero.
4.2.2 Region of IR
The IR region of the electromagnetic spectrum ranges in wavelength from 2 -15 µm.
Conventionally the IR region is subdivided into three regions, near IR, mid IR and far IR.
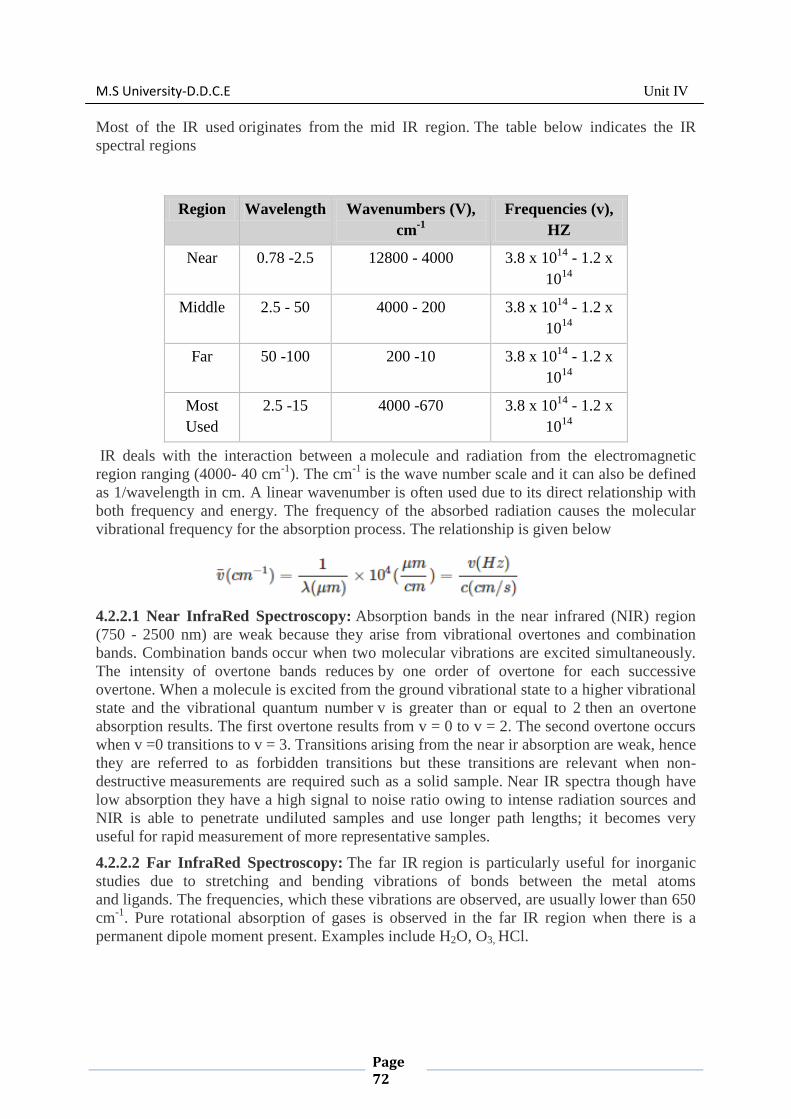
M.S University-D.D.C.E Unit IV
Page 72
Most of the IR used originates from the mid IR region. The table below indicates the IR
spectral regions
Region Wavelength Wavenumbers (V),
cm-1
Frequencies (v),
HZ
Near 0.78 -2.5 12800 - 4000 3.8 x 10¹⁴
- 1.2 x
1014
Middle 2.5 - 50 4000 - 200 3.8 x 10¹⁴
- 1.2 x
1014
Far 50 -100 200 -10 3.8 x 10¹⁴
- 1.2 x
1014
Most
Used
2.5 -15 4000 -670 3.8 x 10¹⁴
- 1.2 x
1014
IR deals with the interaction between a molecule and radiation from the electromagnetic
region ranging (4000- 40 cm-1
). The cm-1
is the wave number scale and it can also be defined
as 1/wavelength in cm. A linear wavenumber is often used due to its direct relationship with
both frequency and energy. The frequency of the absorbed radiation causes the molecular
vibrational frequency for the absorption process. The relationship is given below
4.2.2.1 Near InfraRed Spectroscopy: Absorption bands in the near infrared (NIR) region
(750 - 2500 nm) are weak because they arise from vibrational overtones and combination
bands. Combination bands occur when two molecular vibrations are excited simultaneously.
The intensity of overtone bands reduces by one order of overtone for each successive
overtone. When a molecule is excited from the ground vibrational state to a higher vibrational
state and the vibrational quantum number v is greater than or equal to 2 then an overtone
absorption results. The first overtone results from v = 0 to v = 2. The second overtone occurs
when v =0 transitions to v = 3. Transitions arising from the near ir absorption are weak, hence
they are referred to as forbidden transitions but these transitions are relevant when non-
destructive measurements are required such as a solid sample. Near IR spectra though have
low absorption they have a high signal to noise ratio owing to intense radiation sources and
NIR is able to penetrate undiluted samples and use longer path lengths; it becomes very
useful for rapid measurement of more representative samples.
4.2.2.2 Far InfraRed Spectroscopy: The far IR region is particularly useful for inorganic
studies due to stretching and bending vibrations of bonds between the metal atoms
and ligands. The frequencies, which these vibrations are observed, are usually lower than 650
cm-1
. Pure rotational absorption of gases is observed in the far IR region when there is a
permanent dipole moment present. Examples include H2O, O3, HCl.
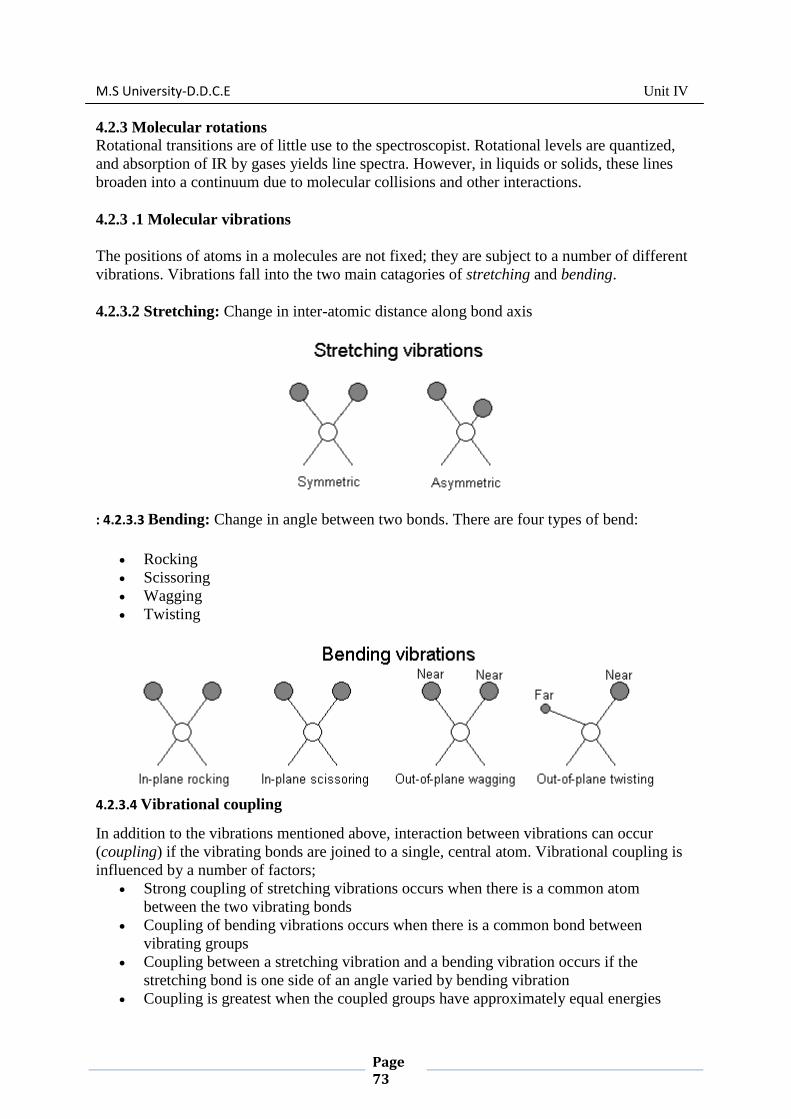
M.S University-D.D.C.E Unit IV
Page 73
4.2.3 Molecular rotations Rotational transitions are of little use to the spectroscopist. Rotational levels are quantized,
and absorption of IR by gases yields line spectra. However, in liquids or solids, these lines
broaden into a continuum due to molecular collisions and other interactions.
4.2.3 .1 Molecular vibrations
The positions of atoms in a molecules are not fixed; they are subject to a number of different
vibrations. Vibrations fall into the two main catagories of stretching and bending.
4.2.3.2 Stretching: Change in inter-atomic distance along bond axis
: 4.2.3.3 Bending: Change in angle between two bonds. There are four types of bend:
Rocking
Scissoring
Wagging
Twisting
4.2.3.4 Vibrational coupling
In addition to the vibrations mentioned above, interaction between vibrations can occur
(coupling) if the vibrating bonds are joined to a single, central atom. Vibrational coupling is
influenced by a number of factors;
Strong coupling of stretching vibrations occurs when there is a common atom
between the two vibrating bonds
Coupling of bending vibrations occurs when there is a common bond between
vibrating groups
Coupling between a stretching vibration and a bending vibration occurs if the
stretching bond is one side of an angle varied by bending vibration
Coupling is greatest when the coupled groups have approximately equal energies

M.S University-D.D.C.E Unit IV
Page 74
No coupling is seen between groups separated by two or more bonds
4.2.3 What is the fingerprint region
This is a typical infra-red spectrum:
Each trough is caused because energy is being absorbed from that particular frequency of
infra-red radiation to excite bonds in the molecule to a higher state of vibration - either
stretching or bending. Some of the troughs are easily used to identify particular bonds in a
molecule. For example, the big trough at the left-hand side of the spectrum is used to identify
the presence of an oxygen-hydrogen bond in an -OH group.
The region to the right-hand side of the diagram (from about 1500 to 500 cm-1) usually
contains a very complicated series of absorptions. These are mainly due to all manner of
bending vibrations within the molecule. This is called the fingerprint region.
It is much more difficult to pick out individual bonds in this region than it is in the "cleaner"
region at higher wavenumbers. The importance of the fingerprint region is that each different
compound produces a different pattern of troughs in this part of the spectrum.
4.2.3.1Using the fingerprint region
Compare the infra-red spectra of propan-1-ol and propan-2-ol. Both compounds contain
exactly the same bonds. Both compounds have very similar troughs in the area around 3000
cm-1 - but compare them in the fingerprint region between 1500 and 500 cm-1.

M.S University-D.D.C.E Unit IV
Page 75
The pattern in the fingerprint region is completely different and could therefore be used to
identify the compound. To positively identify an unknown compound, use its infra-red
spectrum to identify what sort of compound it is by looking for specific bond absorptions.
That might tell you, for example, that you had an alcohol because it contained an -OH group.
You would then compare the fingerprint region of its infra-red spectrum with known spectra
measured under exactly the same conditions to find out which alcohol (or whatever) you had
We are familiar with resolving a translational vector into its three components along the x-, y-
, and z- axes. Similarly a rotational motion can also be resolved into its
components. Likewise the same is true for vibrational motion. The complex vibration that a
molecule is making is really a superposition of a number of much simpler basic vibrations
called ―normal modes‖. Therefore it is necessary to discuss the degrees of freedom.
4.2.4 Degrees of Freedom
Degree of freedom is the number of variables required to describe the motion of a particle
completely. For an atom moving in 3-dimensional space, three coordinates are adequate so
its degree of freedom is three. Its motion is purely translational. If we have a molecule made
of N atoms (or ions), the degree of freedom becomes 3N, because each atom has 3 degrees of
freedom. Furthermore, since these atoms are bonded together, all motions are not
translational; some become rotational, some others vibration. For non-linear molecules, all
rotational motions can be described in terms of rotations around 3 axes, the rotational degree
of freedom is 3 and the remaining 3N-6 degrees of freedom constitute vibrational
motion. For a linear molecule however, rotation around its own axis is no rotation because it

M.S University-D.D.C.E Unit IV
Page 76
leave the molecule unchanged. So there are only 2 rotational degrees of freedom for any
linear molecule leaving 3N-5 degrees of freedom for vibration.
4.2.4.1Vibrational modes
1. A normal mode is a molecular vibration where some or all atoms vibrate together with
the same frequency in a defined manner.
2. Normal modes are basic vibrations in terms of which any other vibration is derived by
superposing suitable modes in the required proportion.
3. On the other hand, no normal mode is expressible in terms of any other normal mode.
Each one is pure and has no component of any other normal mode (i.e. they are
orthogonal to each other). Mathematically, the integral is
∫ψAψBdR=0∫ψAψBdR=0 (integration is done over the entire space)
4. The required number of ―normal modes‖ is equal to the vibrational degree of freedom
available so the number of modes for a nonlinear molecule is 3N−63N−6 and that for a
linear molecule is 3N−53N−5.
5. Each mode has a definite frequency of vibration. Sometimes 2 or 3 modes may have the
same frequency but that does not change the fact that they are distinct modes; these
modes are called degenerate.
6. Sometimes some modes are not IR active but they exist all the same. We shall revert
back to the problem of IR activity and selection rules later.
The number of vibrational normal modes can be determined for any molecule from the
formula given above. For a diatomic molecule, N = 2 so the number of modes
is 3×2−5=13×2−5=1. For a triatomic linear molecule (CO2), it is 3×3−5=43×3−5=4 and
triatomic nonlinear molecule (H2O), it is 3×3−6=33×3−6=3 and so on.
Example 1: Water
1. The Symmetric Stretch (Example shown is an H2O molecule at 3685 cm-1
)
2. The Asymmetric Stretch (Example shown is an H2O molecule at 3506 cm-1
)
3. Bend (Example shown is an H2O molecule at 1885 cm-1
)
A linear molecule will have another bend in a different plane that is degenerate or has the
same energy. This accounts for the extra vibrational mode.

M.S University-D.D.C.E Unit IV
Page 77
Example 2: Carbon Dioxide
Table 8 : Important double and triple bond Stretching vibrations at a glance
Vibration Frequency (cm-1
) Intensity
Double bonds
C=C Alkene 1680-1600 m-w
Aromatic 1600 and 1475 m-w
C=O Aldehyde 1740-1720 s
Table 8 : Important double and triple bond Stretching vibrations at a glance
Vibration Frequency (cm-1
) Intensity
Double
bonds
C=C Alkene 1680-1600 m-w
Aromatic 1600 and 1475 m-w
C=O Aldehyde 1740-1720 s
ketone 1725-1705 s
COOH 1760-1700 s
COOR 1750-1730 s
CONH2 1680-1630 s
Anhydride 1810 and 1760 s
Acid chloride 1800 s
C=N Imines 1690-1640 m-s
C=X
Allenes, ketenes,
isocyanates 2270-1940 m
N=O Nitro 1550 and 1350 s
Triple bonds
C=C Alkyne 2250-2100 m-w
C=N Nitriles 2260-2240 m Thus, the vibrational frequencies provide important structural information about a compound
and since two same type of bonds in two different compounds would vibrate at different
frequencies and so no two compounds can have exactly same infrared spectrum especially in
the finger printing region. This makes IR spectroscopy a simple and versatile tool for

M.S University-D.D.C.E Unit IV
Page 78
identification of samples.
The term "infra red" covers the range of the electromagnetic spectrum between 0.78 and
1000 m. In the context of infra red spectroscopy, wavelength is measured in "wavenumbers",
which have the units cm-1
.
wavenumber = 1 / wavelength in centimeters
It is useful to divide the infra red region into three sections; near, mid and far infra red;
Region Wavelength range (m) Wavenumber range (cm-1
)
Near 0.78 - 2.5 12800 - 4000
Middle 2.5 - 50 4000 - 200
Far 50 -1000 200 - 10
The most useful I.R. region lies between 4000 - 670cm-1
.
Check your progress
You should now understand how certain molecules absorb infra red radiation, and the effects
that this absorption has. You should be familiar with the ways in which molecules can
vibrate, and factors which influence how these vibrations interact with each other.

M.S University-D.D.C.E Unit IV
Page 79
4.3 NMR SPECTROSCOPY
CONTENTS
4.3.1 INTRODUCTION
The interaction between the nuclei and the radiofrequency radiation is called nuclear
magnetic resonance (NMR) spectroscopy. The nuclei of certain atoms or molecules are
considered to be spin. In the absence of external magnetic field, the spin states of the nuclei
are degenerate. (i.e) possess the equal energy levels. In the presence of external magnetic
field, the degeneracy is removed and separate energy levels are possible. The nuclear
transition between these energy levels can occur by the absorption of radio frequency
radiation.Nuclear Magnetic Resonance spectroscopy is a powerful and theoretically complex
analytical tool. On this page, we will cover the basic theory behind the technique. It is
important to remember that, with NMR, we are performing experiments on the nuclei of
atoms, not the electrons. The chemical environment of specific nuclei is deduced from
information obtained about the nuclei.
4.3.2 Nuclear spin and the splitting of energy levels in a magnetic field
Subatomic particles (electrons, protons and neutrons) can be imagined as spinning on their
axes. In many atoms (such as 12
C) these spins are paired against each other, such that the
nucleus of the atom has no overall spin. However, in some atoms (such as 1H and
13C) the
nucleus does possess an overall spin. The rules for determining the net spin of a nucleus are
as follows;
1. If the number of neutrons and the number of protons are both even, then the nucleus
has NO spin.
4.3.0 AIMS AND OBJECTIVES
4.3.1 INTRODUCTION
4.3.2 NUCLEAR SPIN AND THE SPLITTING OF ENERGY LEVELS
IN A MAGNETIC FIELD
4.3.3 CONDITION FOR NMR SPECTRA:
4.3.4 RELAXATION PROCESSES
4.3.4 .1SPIN - LATTICE RELAXATION
4.3.4 .2 SPIN - SPIN RELAXATION
4.3.5 CHEMICAL SHIFT
4.3.6 FACTORS AFFECTING CHEMICAL SHIFT
4.3.7 SPIN - SPIN COUPLING
4.3.8 THEORY: (BLOCH AND PURCELL IN 1946)
4.3.9 SIGNALS
4.3.10 APPLICATIONS OF NMR SPECTROSCOPY:
4.3.11 QUESTIONS

M.S University-D.D.C.E Unit IV
Page 80
2. If the number of neutrons plus the number of protons is odd, then the nucleus has a
half-integer spin (i.e. 1/2, 3/2, 5/2)
3. If the number of neutrons and the number of protons are both odd, then the nucleus
has an integer spin (i.e. 1, 2, 3)
The overall spin, I, is important. Quantum mechanics tells us that a nucleus of spin I will
have 2I + 1 possible orientations. A nucleus with spin 1/2 will have 2 possible orientations. In
the absence of an external magnetic field, these orientations are of equal energy. If a
magnetic field is applied, then the energy levels split. Each level is given a magnetic quantum
number, m.
When the nucleus is in a magnetic field, the initial populations of the energy levels are
determined by thermodynamics, as described by the Boltzmann distribution. This is very
important, and it means thatthe lower energy level will contain slightly more nuclei than
the higher level. It is possible to excite these nuclei into the higher level with
electromagnetic radiation. The frequency of radiation needed is determined by the difference
in energy between the energy levels.
4.3.3 Condition for NMR spectra:
The nuclei with a resultant nuclear spin are magnetically active and produces NMR
spectra. The nuclear spin is described by the spin quantum number, I. The condition for the
nuclei which exhibits NMR spectra have I > 0. The value of I for different nuclei can be
predicted by the following empirical values,
i) Nuclei having even number of protons and neutrons have zero value of I. Example : 4He,
12C,
16O and
32S have I = 0. They are non magnetic and NMR inactive.
ii) Nuclei having odd number of protons and neutrons have integral value of I. Example 2Hand
14N have I = 1. They are magnetic and NMR active.
iii) Nuclei having odd value for the sum of protons and neutrons have half integral value
of I. Example 1H,
13C,
15N,
19F and
31P have I = ½. They are magnetic and NMR
active.
At a time only one type of nucleus is used in NMR spectroscopy. Example : all 1H or
13C or
19F nuclei.
The 1H (proton) nucleus is most commonly studied by NMR spectroscopy because of
its high natural abundance (99.98%). Also proton is invariably present in the majority of
organic compounds. Hence NMR spectroscopy is also known as proton compounds. Hence

M.S University-D.D.C.E Unit IV
Page 81
NMR spectroscopy is also known as proton magnetic resonance (PMR) or 1H NMR
spectroscopy.
Calculating transition energy
The nucleus has a positive charge and is spinning. This generates a small magnetic field. The
nucleus therefore possesses a magnetic moment, , which is proportional to its spin,I.
The constant, , is called the magnetogyric ratio and is a fundamental nuclear constant which
has a different value for every nucleus. h is Planck's constant.
The energy of a particular energy level is given by;
Where B is the strength of the magnetic field at the nucleus.
The difference in energy between levels (the transition energy) can be found from
This means that if the magnetic field, B, is increased, so is E. It also means that if a nucleus
has a relatively large magnetogyric ratio, then E is correspondingly large.
If you had trouble understanding this section, try reading the next bit (The absorption of
radiation by a nucleus in a magnetic field) and then come back.
The absorption of radiation by a nucleus in a magnetic field
In this discussion, we will be taking a "classical" view of the behaviour of the nucleus - that
is, the behaviour of a charged particle in a magnetic field.
Imagine a nucleus (of spin 1/2) in a magnetic field. This nucleus is in the lower energy level
(i.e. its magnetic moment does not oppose the applied field). The nucleus is spinning on its
axis. In the presence of a magnetic field, this axis of rotation will precess around the
magnetic field;Larmor Precession
The phenomenon of nuclear magnetic resonance can also be explained by the scientist
Larmor called larmor precession. When a magnetic nucleus is placed perpendicularly in an
external magnetic field of strength, BZ, it spins on its own axis. This is called Larmor
precession (fig. 3). The angular frequency of the precession is known as Larmor frequency
() and it is directly proportional to the strength of the magnetic field BZ.
BZ
= BZ
where is the gyromagnetic ration of the nucleus. It is defined as the ratio of the
nuclear magnetic moment μ and the nuclear spin angular momentum. I (h/2nπ)
i.e. = μ/I (h/2π) (T-1
s-1
)

M.S University-D.D.C.E Unit IV
Page 82
The frequency of precession is termed the Larmor frequency, which is identical to the
transition frequency.
The potential energy of the precessing nucleus is given by;
E = - B cos
where is the angle between the direction of the applied field and the axis of nuclear
rotation.
If energy is absorbed by the nucleus, then the angle of precession, , will change. For a
nucleus of spin 1/2, absorption of radiation "flips" the magnetic moment so that
it opposes the applied field (the higher energy state).
It is important to realise that only a small proportion of "target" nuclei are in the lower energy
state (and can absorb radiation). There is the possibility that by exciting these nuclei, the
populations of the higher and lower energy levels will become equal. If this occurs, then there
will be no further absorption of radiation. The spin system is saturated. The possibility of
saturation means that we must be aware of the relaxation processes which return nuclei to the
lower energy state.

M.S University-D.D.C.E Unit IV
Page 83
4.3.4 Relaxation processes
How do nuclei in the higher energy state return to the lower state? Emission of radiation is
insignificant because the probability of re-emission of photons varies with the cube of the
frequency. At radio frequencies, re-emission is negligible. We must focus on non-radiative
relaxation processes (thermodynamics!).
Ideally, the NMR spectroscopist would like relaxation rates to be fast - but not too fast. If the
relaxation rate is fast, then saturation is reduced. If the relaxation rate is too fast, line-
broadening in the resultant NMR spectrum is observed.
There are two major relaxation processes;
Spin - lattice (longitudinal) relaxation
Spin - spin (transverse) relaxation
4.3.4 .1Spin - lattice relaxation
Nuclei in an NMR experiment are in a sample. The sample in which the nuclei are held is
called the lattice. Nuclei in the lattice are in vibrational and rotational motion, which creates a
complex magnetic field. The magnetic field caused by motion of nuclei within the lattice is
called the lattice field. This lattice field has many components. Some of these components
will be equal in frequency and phase to the Larmor frequency of the nuclei of interest. These
components of the lattice field can interact with nuclei in the higher energy state, and cause
them to lose energy (returning to the lower state). The energy that a nucleus loses increases
the amount of vibration and rotation within the lattice (resulting in a tiny rise in the
temperature of the sample).
The relaxation time, T1 (the average lifetime of nuclei in the higher energy state) is dependant
on the magnetogyric ratio of the nucleus and the mobility of the lattice. As mobility
increases, the vibrational and rotational frequencies increase, making it more likely for a
component of the lattice field to be able to interact with excited nuclei. However, at
extremely high mobilities, the probability of a component of the lattice field being able to
interact with excited nuclei decreases
4.3.4 .2 Spin - spin relaxation
Spin - spin relaxation describes the interaction between neighbouring nuclei with identical
precessional frequencies but differing magnetic quantum states. In this situation, the nuclei
can exchange quantum states; a nucleus in the lower energy level will be excited, while the
excited nucleus relaxes to the lower energy state. There is no net change in the populations of
the energy states, but the average lifetime of a nucleus in the excited state will decrease. This
can result in line-broadening.
4.3.5 Chemical shift
The magnetic field at the nucleus is not equal to the applied magnetic field; electrons around
the nucleus shield it from the applied field. The difference between the applied magnetic field
and the field at the nucleus is termed the nuclear shielding.
Consider the s-electrons in a molecule. They have spherical symmetry and circulate in the
applied field, producing a magnetic field which opposes the applied field. This means that the
applied field strength must be increased for the nucleus to absorb at its transition frequency.
This upfield shift is also termed diamagnetic shift.
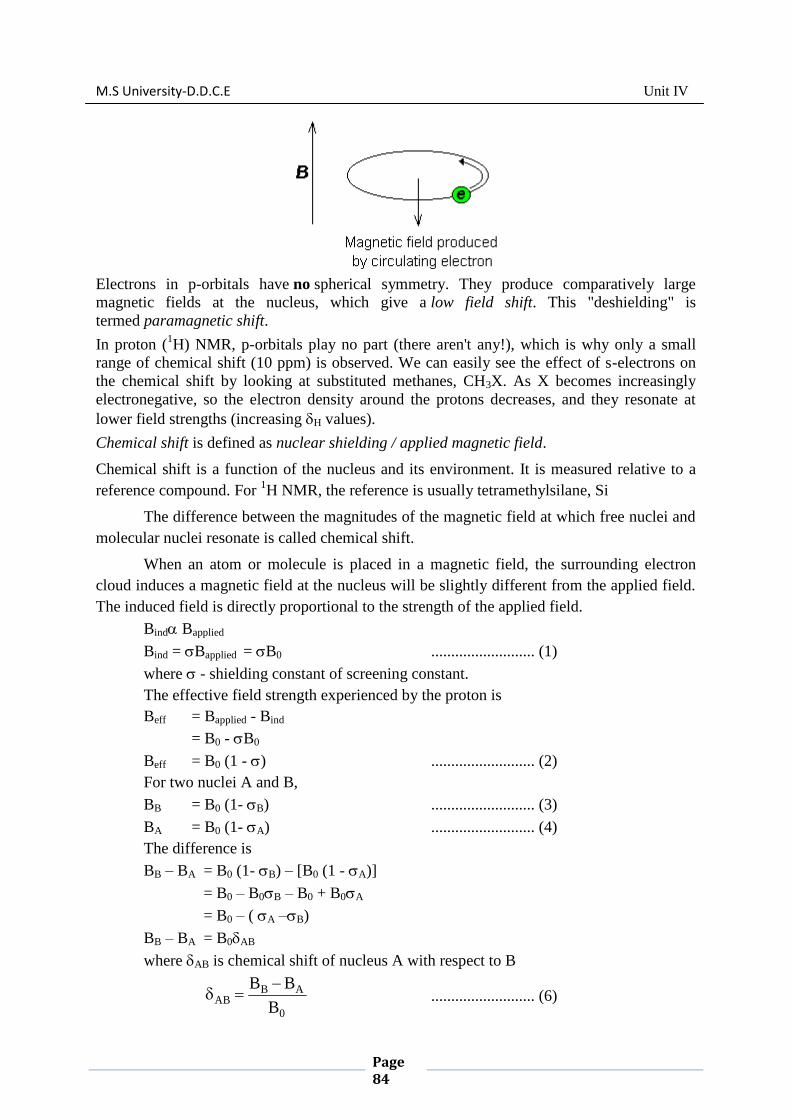
M.S University-D.D.C.E Unit IV
Page 84
Electrons in p-orbitals have no spherical symmetry. They produce comparatively large
magnetic fields at the nucleus, which give a low field shift. This "deshielding" is
termed paramagnetic shift.
In proton (1H) NMR, p-orbitals play no part (there aren't any!), which is why only a small
range of chemical shift (10 ppm) is observed. We can easily see the effect of s-electrons on
the chemical shift by looking at substituted methanes, CH3X. As X becomes increasingly
electronegative, so the electron density around the protons decreases, and they resonate at
lower field strengths (increasing H values).
Chemical shift is defined as nuclear shielding / applied magnetic field.
Chemical shift is a function of the nucleus and its environment. It is measured relative to a
reference compound. For 1H NMR, the reference is usually tetramethylsilane, Si
The difference between the magnitudes of the magnetic field at which free nuclei and
molecular nuclei resonate is called chemical shift.
When an atom or molecule is placed in a magnetic field, the surrounding electron
cloud induces a magnetic field at the nucleus will be slightly different from the applied field.
The induced field is directly proportional to the strength of the applied field.
Bind Bapplied
Bind = Bapplied = B0 .......................... (1)
where - shielding constant of screening constant.
The effective field strength experienced by the proton is
Beff = Bapplied - Bind
= B0 - B0
Beff = B0 (1 - ) .......................... (2)
For two nuclei A and B,
BB = B0 (1- B) .......................... (3)
BA = B0 (1- A) .......................... (4)
The difference is
BB – BA = B0 (1- B) – [B0 (1 - A)]
= B0 – B0B – B0 + B0A
= B0 – ( A –B)
BB – BA = B0AB
where AB is chemical shift of nucleus A with respect to B
0
ABAB
B
BB .......................... (6)

M.S University-D.D.C.E Unit IV
Page 85
The chemical shift can also be expressed in terms of frequency.
ppm106
0
ABAB
Thus, the chemical shift of a sample can be calculated as
ppm106
0
refrenceamples
AB
.......................... (7)
Generally, TMS is used as a reference and chemical shift is measured using ‗‘ scale.
For TMS, = 0 or = 10
= 10 -
Reason for TMS used as a reference :
Tetra methyl silance (TMS) is used as reference dcompound in NMR, because,
i) It has 12 equivalent protons and gives a single sharp peak in its NMR spectrum.
ii) It has low boiling point 27ºC.
iii) It is chemically inert & non volable.
iv) It is soluble in most of the organic solvents.
v) Its signal is appeared at the extreme end of the spectrum
4.3.6. Factors affecting chemical shifts
Important factors influencing chemical shift are electron density, electronegativity of
neighboring groups and anisotropic induced magnetic field effects.
Electron density shields a nucleus from the external field. For example, in proton NMR the
electron-poor tropylium ion has its protons downfield at 9.17 ppm, those of the electron-
rich cyclooctatetraenyl anion move upfield to 6.75 ppm and its dianion even more upfield to
5.56 ppm.
A nucleus in the vicinity of an electronegative atom experiences reduced electron density
and the nucleus is therefore deshielded. In proton NMR of methyl halides (CH3X) the
chemical shift of the methyl protons increase in the order I < Br < Cl < F from 2.16 ppm to
4.26 ppm reflecting this trend. In carbon NMR the chemical shift of the carbon nuclei
increase in the same order from around –10 ppm to 70 ppm. Also when the electronegative
atom is removed further away the effect diminishes until it can be observed no longer.
Anisotropic induced magnetic field effects are the result of a local induced magnetic field
experienced by a nucleus resulting from circulating electrons that can either be paramagnetic
when it is parallel to the applied field or diamagnetic when it is opposed to it. It is observed
in alkenes where the double bond is oriented perpendicular to the external field with pi
electrons likewise circulating at right angles. The induced magnetic field lines are parallel to
the external field at the location of the alkene protons which therefore shift downfield to a 4.5
ppm to 7.5 ppm range. The three-dimensional space where a nucleus experiences diamagnetic
shift is called the shielding zone with a cone-like shape aligned with the external field.

M.S University-D.D.C.E Unit IV
Page 86
The protons in aromatic compounds are shifted downfield even further with a signal
for benzene at 7.73 ppm as a consequence of a diamagnetic ring current.
Alkyne protons by contrast resonate at high field in a 2–3 ppm range. For alkynes the most
effective orientation is the external field in parallel with electrons circulation around the triple
bond. In this way the acetylenic protons are located in the cone-shaped shielding zone hence
the upfield shift.
Screening constant ‘’
It is a dimensionless quantity. The value of depends on the electron density around
the proton (Fig. 4).
Fig 4. Bare and screened, spin ½ nucleus in BZ
Acetaldehyde has two types of protons CHO and CH3protons. The three protons in
CH3are equivalent. Since the oxygen is more electronegative the electron density around the
proton in CHO is less than that around the CH3 proton. Therefore, the screening is more for
the methyl protons.
CHO<CH3
4.3.7 Spin - spin coupling
Consider the structure of ethanol;
The 1H NMR spectrum of ethanol (below) shows the methyl peak has been split into three
peaks (a triplet) and the methylene peak has been split into four peaks (a quartet). This
occurs because there is a small interaction (coupling) between the two groups of protons. The
spacings between the peaks of the methyl triplet are equal to the spacings between the peaks
of the methylene quartet. This spacing is measured in Hertz and is called the coupling
constant, J.

M.S University-D.D.C.E Unit IV
Page 87
To see why the methyl peak is split into a triplet, let's look at the methylene protons. There
are two of them, and each can have one of two possible orientations (aligned with or opposed
against the applied field). This gives a total of four possible states;
In the first possible combination, spins are paired and opposed to the field. This has the effect
of reducing the field experienced by the methyl protons; therefore a slightly higher field is
needed to bring them to resonance, resulting in an upfield shift. Neither combination of spins
opposed to each other has an effect on the methyl peak. The spins paired in the direction of
the field produce a downfield shift. Hence, the methyl peak is split into three, with the ratio of
areas 1:2:1.
Similarly, the effect of the methyl protons on the methylene protons is such that there are
eight possible spin combinations for the three methyl protons;

M.S University-D.D.C.E Unit IV
Page 88
Out of these eight groups, there are two groups of three magnetically equivalent
combinations. The methylene peak is split into a quartet. The areas of the peaks in the quartet
have the ration 1:3:3:1.
In a first-order spectrum (where the chemical shift between interacting groups is much larger
than their coupling constant), interpretation of splitting patterns is quite straightforward;
The multiplicity of a multiplet is given by the number of
equivalent protons in neighbouring atoms plus one, i.e. the n + 1 rule
Equivalent nuclei do not interact with each other. The three methyl protons in ethanol
cause splitting of the neighbouring methylene protons; they do not cause splitting
among themselves
The coupling constant is not dependant on the applied field. Multiplets can be easily
distinguished from closely spaced chemical shift peaks.
4.3.8 Theory : (Bloch and Purcell in 1946)
Atoms consists of nuclei and electrons. The nuclei have positive charges which are
multiples of the protons. The nuclei have also angular momentum known as spin and
characterised by the spin quantum number (I = 0, ½, 1, 1½ ....)
The angular momentum associated with a nuclear spin is given by
2
h.1I.I
½
Since, a nucleus possesses an electric charge, the spinning nucleus gives rise to a
magnetic field whose axis coincides with the axis of spin. Thus the nucleus can be regarded
as a micromagnet with the magnetic moment μ.
I,spin
................... (1)
Ig NN
Where, gN is called the nuclear g factor.
μN is the nuclear magnet on TeslaTJT1005.5m4
eh 127
p
mpis the mass of the proton
e is the electronic charge
When the nucleus is placed in an external magnetic field BZ applied in the z-direction,
the energy of interaction is
ZB.E
................... (2)
Substituting the value of
from eqn (1), we get

M.S University-D.D.C.E Unit IV
Page 89
IB.gE ZNN
Since I is quantized in the presence of the magnetic field and the energy of nuclear
spin is defined only by its components m1 then,
EmI = -gNμN. BZmI ................... (3)
For a bare proton, I = ½, so that mI = ± ½;
i.e. m1 = +½; E½ = ZNN B.g
2
1 ................... (4)
m1 = ZNN½ B.g
2
1E½, ................... (5)
Fig. 1 Splitting of nuclear energy levels of a bare proton in a magnetic field (keeping BZ
constant and frequency is varied)
From eqns (4) and (5) the energy difference is given by
∆E = gNμN.BZ ................... (6)
In order to flip the nucleus from the upward direction to the downward direction
(), oscillating radio frequency perpendicular to the direction of BZ is applied (of energy h)
∆E = gNμN.BZ = h ................... (7)
This is called Bohr frequency condition.
Thus, the NMR frequency of a bare proton is given by
h
Bg
h
E ZNN
or BZ
The NMR spectra can be recorded in two ways.
i) Keeping the magnetic field BZ fixed and varying the frequency (fig. 1)
ii) Keeping fixed and varying the magnetic field BZ (fig. 2)
Fig. 2 Splitting of nuclear energy levels of a bare proton in a magnetic field (keeping
constant and BZ frequency is varied)

M.S University-D.D.C.E Unit IV
Page 90
The later technique is used in modern NMR spectrometer.
4.3.9 Signals
The number of signals explain the number of differently
sets of equivalent protons in a molecule. Each signal corresponds
to a set of equivalent protons.
Example :
viii) 2-chloropropane, CH3 – C(Cl) = CH2
From this structure, one can two sets of equivalent protons (Two signals). But
stereochemical formula shows three sets of protons in it and it gives three NMR signals.
3nmr signals
ix) 1, 2 dichloropropane, CH3 – CH(Cl) – CH2Cl.
From this structure one can expect three sets of protons (Three signals). But
stereochemical formula shows four sets of protons in it and it gives four NMR signals.

M.S University-D.D.C.E Unit IV
Page 91
7. Spin – spin coupling
When the NMR spectrum of a sample in the gaseous or the liquid states is observed
under high resolution, the lines are split into the number of finer lines (multiplet). This
splitting is due to the coupling of the magnetic moment of one set of equivalent protons with
those of another set. This splitting is called spin-spin coupling.
The splitting pattern can usually interpreted by using two rules.
a) (n + 1) rule
b) Binomial coefficient rule (1 + x)n
a) (n+1) rule
If there are ‗n‘ equivalent protons that interact with the proton being studied, the lines
will split into n + 1 lines, where n is the number of neighbouring protons.
b) Binomial coefficient rule :
The intensity of the peaks in the multiplet can be obtained from the coefficients of the
binomial expansion of (1+x)n.
Thecoeffficients can be arranged in Pascal‘s triangle.
No. of
protons n + 1 Relative intensity
0 1 (singlet) 1
1 2 (doublet) 1 1
2 3 (triplet) 1 2 1
3 4 (quartet) 1 3 3 1
4 5 (quintet) 1 4 6 4 1
5 6 (sextet) 1 5 10 10 5 1
i) NMR spectrum of ethanol (Acidified ethanol/Gaseous ethanol
The low resolution NMR spectrum of ethanol CH3 – CH2 – OH is as follows.
Low resolution NMR spectrum of ethanol
The high resolution NMR spectrum of ethanol using (n + 1) rule and the binomial
coefficient rule is

M.S University-D.D.C.E Unit IV
Page 92
The mulplicity of the signal is due to spin-spin coupling.
a) For methyl protons :
There are two neighbouring protons (-CH3) for CH3 group. Hence the peak is split
into three signals (triplet)
The intensity of the three signals are in the ratio of 1 : 2 : 1 (using Pascal‘s triangle).
Since there are two protons, the possible orientation are
b) For methylene protons:
There are three neighbouring protons (-CH3) for – CH group. Hence the peak is split
into four signals (quartet). The intensity of the four signals are in the ratio of 1:3:3:1. Since
there are three protons, the possible orientation are
c) For hydroxyl proton:
The hydroxyl proton is not affected by neigbouring protons. This is due to the fast
chemical exchange of protons between the –OH groups of difference molecules. So, it does
not produce splitting effect. Hence only one signal is produced.
In contrast to acidified ethanol, there is not proton exchange in pure ethanol. Thus due
to spin-spin splitting the CH3 line is split into a triplet, the CH2 line into an octet (8 lines) and
the H line into a triplet.
4.3.10 Applications of NMR spectroscopy :
i) Elecidation of molecular structure :
The most important application of NMR is the elucidation of molecular structure. The
points of interest in this elucidation are.
a) Number of NMR signals, which gives the number of different types of protons such
as methyl proton, methylene proton, hydroxyl proton, aldehydic proton and aromatic
proton.
b) Position of the signal and chemical shifts: This decides the type of proton.

M.S University-D.D.C.E Unit IV
Page 93
c) Intensitites of signals : The intensity depends on the number of protons of a
particular kind. The relative intensities of signals are measured by the areas under the
different peaks obtained in the NMR spectrum.
d) Splitting of signals (under high resolution) : This gives information about the number
of equivalent protons which are near neighbours to the group under study.
The above points can be illustrated with a few examples:
Compound NMR Signals Splitting pattern
CH3a – CH2
b – Cl 2 a – triplet, b - quartet
(CH3a)2 – CH
b – Cl 2 a – doublet, b – spetet
CH3a – CO – CH3
a 1 a – singlet
CH3a – CH
b O 2 a – doublet, b – quartet
C6H6a 1 a - signlet
ii) Hydrogen bonding
The NMR is used to study the nature of hydrogen bonding in compounds. If a proton
in a compound is involved in hydrogen bonding, the resonance absorption peak occurs at a
down field (higher - value). This is due to decreased electron density around the proton by
the hydrogen bond.
Intermolecular H – bonding is affected by concentration and temperature, but
intermolecular H – bonding is unaffected by these factors.
Example : At ordinary concentration, phenols have –OH proton absorption at 6.0 to
7.7 (down field) due to intermolecular H – bonding. At infinite dilution or at higher
temperature their absorption at 4.0 to 5.0 (up field) due to weakening of H – bonding.
O – hydroxy acetophenone has – OH proton absorption at 12.05 due to
intermolecular H – bonding. Its position is unaffected by dilution or temperature.
iii) Tautomerism :
NMR spectra are used in the study of keto-enol tautomerism. Example : Acetyle
acetone exists the following equillibrium.

M.S University-D.D.C.E Unit IV
Page 94
In its NMR spectrum, the areas of –CH2 – (keto form) and = CH – (enol form) peaks
are carefully measured and found that the acetyl acetone contains 18.6± -.6% keto form at
25ºC.
iv) Study of water of crystallisation in solids :
In CuSO4, 2H2O. We would normally expect the two water molecules to be
equivalent and hence only one NMR signal. Actually two signals are observed, each
appearing as a doublet. This shows that the two water molecules have different orientation in
space.
v) Kinetics of certain chemical reaction can be studied through NMR spectroscopy. Rates of
several exchange reactions. (Example : Proton exchange between ethanol and H3O+, acetic
acid and water) have been evaluated from line broadening measurments.
v)Nuclear Magnetic Resonance Imaging (MRI)
Nuclear magnetic resonance imaging is nothing but Magnetic Resonance Imaging
(MRI). It is also known as zeugmatography or tomography. NMR imaging is based on the
principle that it is possible to create two and three – dimensional ―pictures‖ of objects, by
proper adjustment of magnetic field at various depth in the sample, in the same way as a
photograph or x-ray plate.
In a normal NMR experiment the samples (in the mg range) are studied in a uniform
magnetic field with homogencity of none part in 109. But in the MRI experiment, the samples
are large and inhomogeneous such as human bodies, placed in uniform magnetic fields. The
applied fields are inhomogeneous so that different parts of the sample experience different
fields and consequently have different resonance frequencies.
For example, when a narrow tube contains water as the sample is placed in a uniform
magnetic field, the NMR spectrum displays a single sharp line. If the same simple is placed in
a magnetic field a linear field gradient, the MRI spectrum displays ‗n‘ sharp lines at a various
frequencies related directly to the magnetic fields at different parts of the sample.
By taking profiles from different directions achieved by altering the directions of the
magnetic fields and the linear field gradients, the images of the objects from different angles
can be obtained. The profiles are then processed with the help of the image processing
technique in a computer to obtain two or three dimensional images. A typical image with
anotomical details is shown in the figure.
M.S University-D.D.C.E Unit V
Page 95
UNIT V
GROUP THEORY AND NANO CHEMISTRY
CONTENTS
5.1Aims and objectives
The aim is to motivate and enable a comprehensive knowledge on symmetry elements and
symmetry operations to the students.
On successful completion of this unit you should have:
Understand the symmetry elements and symmetry operations.
5.2. INTRODUCTION
Symmetry is a very fascinating phenomenon in nature. It is found in geometrical figures such as
a cube, a sphere, an equilateral triangle, a rectangle, a square, a regular pentagon, a regular
hexagon etc. Its importance was recognized by eminent Greek philosophers Pythagoras and
Plato.
5.2. IDENTICAL CONFIGURATION
An identical configuration is the one which is not only indistinguishable from the original one
but also identical with it.
5.3. EQUIVALENT CONFIGURATION
An equivalent configuration is the one which cannot be distinguished from the original one but
need not be identical with it.
5.4. SYMMETRY OPERATION
A symmetry operation is a movement of the molecule such that the resulting configuration of the
molecule is indistinguishable from the original.
5.5. SYMMETRY ELEMENT
A symmetry element is a geometrical entity such as a line or a space or a point about which an
operation of rotation or reflection or inversion is done.
5.6. ROTATION AXIS OF SYMMETRY (Cn)
It is also called rotational axis, if a rotation around an axis by 360°/n results in a molecule
indistinguishable from the original. Examples are water (C2) and ammonia (C3). A molecule can
have more than one symmetry axis and the one with the highest number of n is called the
principal axis and takes the z-axis in a Cartesian coordinate system.
This axis of symmetry can be explained by taking the example of triangular planar boron
trichloride molecule. In boron trichloride molecule an axis of symmetry is located perpendicular
to the plane containing all the atoms. This is known as the C3 axis of symmetry. In general the

M.S University-D.D.C.E Unit V
Page 96
symbol for proper axis of symmetry is Cn where n is known as the order of the axis. The order of
the axis is given by the number of rotations by , to get the identical configuration. n i s
2
alternatively given by the formula n
, where is the minimum angle of rotation to obtain
the equivalent configuration. n has non- zero positive integral values. Boron trichloride molecule has three C2 axes of symmetry in addition to the C3 axis (Fig.1.1). The C3 axis in this molecule is known as principal axis. In general, if there are Cn axes of different orders in a molecule, the axis with the highest order is referred to as the principle axis.
C2
Cl
B
Cl
C
l
C3
Cl
Cl B
Cl
(b)
Fig.1.1. (a). The C2 axis of symmetry in BCl3 molecule. (b). The C3 principal axis in BCl3 molecule.
5.7. PLANE OF SYMMETRY OR MIRROR PLANE (σ)
If reflection through a plane leaves an identical copy of the original molecule it has a plane of symmetry. Water has two of them: one in the plane of the molecule itself and one perpendicular to it. A symmetry plane parallel with the principal axis is dubbed vertical (ζv) and one per perpendicular to it horizontal (ζh). A third plane exists: if a symmetry plane bisects the angle between two n-fold axes that are perpendicular to the principal axis the plane is dihedral (δd). A

M.S University-D.D.C.E Unit V
Page 97
plane can also be identified by its plane (xz),(yz) in the Cartesian coordination plane.
C2
C2
v
v
O
O
H H
H
H
Fig. 1.2. The reflection planes in water molecule.
5.8. CENTER OF SYMMETRY OR INVERSION CENTER (i)
A molecule has a center of symmetry when for any atom in the molecule an identical atom can
be found when it moves in a straight through this center an equal distance on the other side. An
example is xenon tetrafluoride but not cisplatin even though both molecules are square planar. This is a point such that any line drawn through it meets the same atom at equal distances in
opposite directions. All homo-nuclear diatomic molecules possess the centre of symmetry.
Fig.1.3 lists the molecules with centre of symmetry. This element of symmetry is also called S2 axis. A particular symmetry element generates many symmetry operations. A Cn axis generates a set
of operations Cn1,Cn
2,Cn
3,.....,Cn
n. The Cn
n operation is equivalent to the identity operation.
H H O C O
H H F
C
C N
N

M.S University-D.D.C.E Unit V
Page 98
H H F
Fig.1. 3. Diagram showing molecules with centre of symmetry.
5.9. ROTATION-REFLECTION AXIS N-FOLD (Sn) It is also called improper rotational axis. Molecules with this symmetry element can have a 360°/n rotation around an axis followed by a reflection in a plane perpendicular to it without a net change. An example is tetrahedral silicon tetrafluoride with three S3 axes and the staggered conformation of ethane with S6 symmetry. It is the line about which a rotation by a specific angle followed by reflection in a plane perpendicular to the rotation axis is performed. Fig.1.4 shows the S6 axis in staggered from of ethane.
H H H
H
C
H
C
H H
C
H
H
C6
H H H
C
H H
C C
H
H H
H
Fig.1.4. TheS6axis in staggered form of ethane.
5.10. IDENTITY (E)
This is a default symmetry element and every molecule has one.
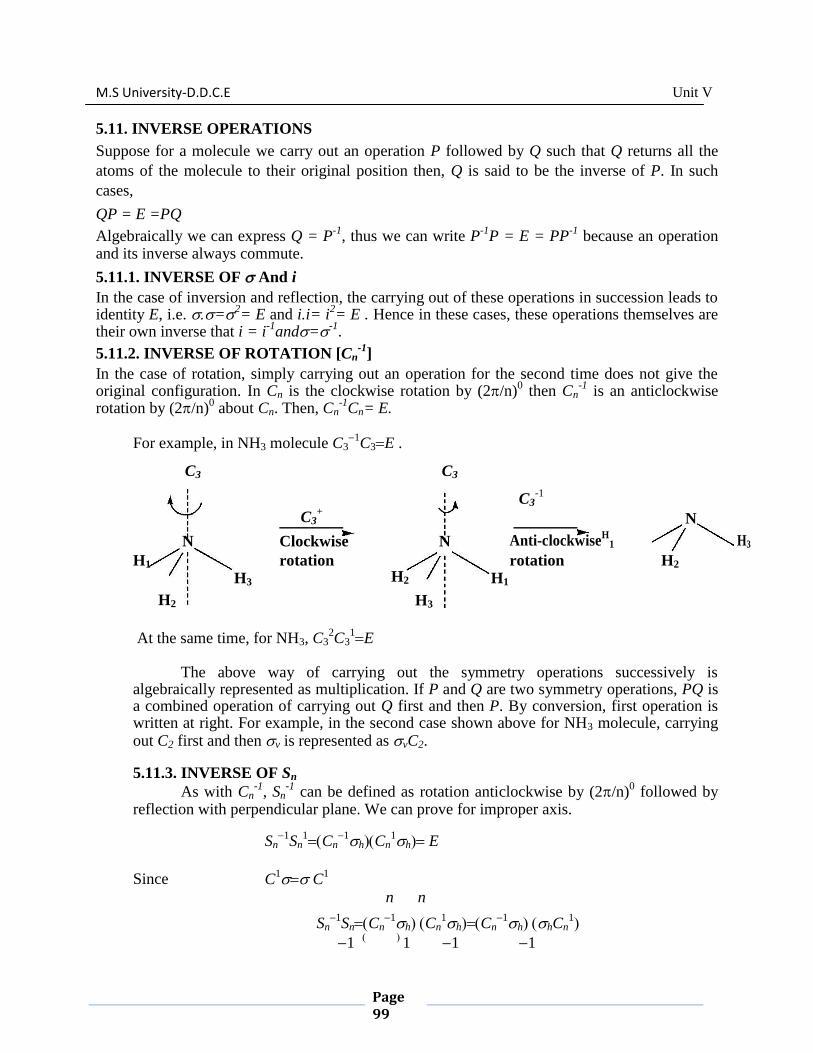
M.S University-D.D.C.E Unit V
Page 99
5.11. INVERSE OPERATIONS
Suppose for a molecule we carry out an operation P followed by Q such that Q returns all the
atoms of the molecule to their original position then, Q is said to be the inverse of P. In such
cases,
QP = E =PQ
Algebraically we can express Q = P-1
, thus we can write P-1
P = E = PP-1
because an operation and its inverse always commute.
5.11.1. INVERSE OF And i
In the case of inversion and reflection, the carrying out of these operations in succession leads to identity E, i.e. =2
= E and i.i= i2= E . Hence in these cases, these operations themselves are
their own inverse that i = i-1
and=-1.
5.11.2. INVERSE OF ROTATION [Cn-1
]
In the case of rotation, simply carrying out an operation for the second time does not give the original configuration. In Cn is the clockwise rotation by (2/n)
0 then Cn
-1 is an anticlockwise
rotation by (2/n)0 about Cn. Then, Cn
-1Cn= E.
For example, in NH3 molecule C31
C3E .
C3 C3
C3
+
C3-1
N
N Clockwise N Anti-clockwiseH
1 H3
H1 rotation H2
rotation H2
H2
H3 H1
H3
At the same time, for NH3, C32C3
1E
The above way of carrying out the symmetry operations successively is
algebraically represented as multiplication. If P and Q are two symmetry operations, PQ is a combined operation of carrying out Q first and then P. By conversion, first operation is written at right. For example, in the second case shown above for NH3 molecule, carrying out C2 first and then v is represented as vC2.
5.11.3. INVERSE OF Sn
As with Cn-1
, Sn-1
can be defined as rotation anticlockwise by (2/n)0 followed by
reflection with perpendicular plane. We can prove for improper axis.
Sn1
Sn1Cn
1hCn1h E
Since C1 C
1
n n
Sn1
SnCn1hCn
1hCn1hhCn
1
1
111

M.S University-D.D.C.E Unit V
Page 100
Cnhh Cn Cn ECn Cn Cn E
However, we can express Sn-1
interms of clockwise rotation about the same axis. We know that Sn
n= E when n is odd. Then
Snn1
Sn1 E (n-even) Thus,Sn
1Sn
n1
Sn2n1
Sn1 E (n-odd) Thus,Sn
1Sn
2n1
5.12. LET US SUM UP
In this unit, we:
Pointed out
Identical configuration
Equivalent configuration Symmetry operation
Symmetry element Rotation axis of symmetry (Cn) Plane of symmetry or mirror plane (ζ) Center of symmetry or inversion center (i) Rotation-reflection axis n-fold (Sn) Identity (E)
Inverse operations
5.13 CHECK YOUR PROGRESS
1. What is n improper axis of rotation? What are the operations generated byS5? How many of these are the distinct operations of S5?
2. Prove the following:

M.S University-D.D.C.E Unit V
Page 101
5.14. LESSON - END ACTIVITIES
1. (a) Distinguish between
(1). Symmetry element and symmetry operations.
(2). Proper and improper rotation.
(b) Show that C2(z) and (xy) commute.
2. What is an inverse operation? Is this equivalent to any other combination of operations? Give
an example.
5.15. SUGGESTED READINGS
1. K.V. Raman, Group Theory and its applications to Chemistry, Tata McGraw-Hill
Publishing Company limited, New Delhi.
2. B.R. Puri, L.R. Sharma and M.S. Pathania, Principles of Physical Chemistry, Millennium
edition, 2006- 2007.

M.S University-D.D.C.E Unit V
Page 102
GROUPS AND THEIR BASIC PROPERTIES
GROUPS AND THEIR BASIC PROPERTIES
The aim is to motivate and enable a comprehensive knowledge on groups and their basic
properties to the students.
On successful completion of this lesson the student should have:
Understand the groups and their basic properties.
6.1. INTRODUCTION
Having defined various symmetry operations in Lesson 1 we may now ask ourselves whether it
is possible to classify the molecules into ‗Groups‘ on the basis of the symmetry elements they
posses. Is it possible to define certain symmetry groups so that all molecules belonging to a
certain group have the same type of symmetry operations? Luckily, the answer is ‗Yes‘. This
means that we can give an accurate description of the symmetry of any molecule by knowing to
which group it belongs.
6.2. GROUP
A group is a complete set of members which are related to each other by certain rules. Each
6.2.1. BASIC PROPERTIES OF A GROUP
Certain rules have to be satisfied by the elements so that they form a group. These rules
are the following:
1. The product of any two elements and the square of any element must be elements of group
(closure property).
2. There must be one element in the group which commutes with everyone of the elements
and leaves it unchanged.
3. The associative law of multiplication should be valid. 4. For every element there must be a reciprocal (inverse) and this reciprocal is also an
element of the group. RULE 1 If A and B are the element of the group and if AB = C,C must be a member of the group. Product
AB means that we perform the operation B first and then operation A i.e., the sequence of
operations is from right to left. It should be noted that the other product BA need not be same as AB. BA means doing A first and then performing the operation B later. Let BA = D. D must be amember of the group by rule 1. Usually AB BA and so C D. However, there may be some special elements A and B each that AB = BA. Then A and B are said to commute with each other or the multiplication of A and B is commutative. Such a group where any two elements commute is called an abelian group. H2O belongs to an abelian group. The four symmetry operations for
H2O are E, C2z,v(xz) and ’v(yz).The inter-relationships between these operations are given in the group multiplication table (Table 2.1).

M.S University-D.D.C.E Unit V
Page 103
Table 2.1. E C2z,
v(xz)
’v(yz)
E E C2z
v(xz) ’
v(yz) C2z
C2z E ’ v(yz) v(xz)
v(xz)
v(xz) ’v(yz)
E C2z
’v(yz) ’
v(yz) v(xz) C
2z E
Note that each member is its own inverse. The product of any two operations is
found among the four members.
E 2 C2
2v
'2 E
vv'v
'v C2; C2vv C2v' etc
RULE 2
Each group must necessarily have an element which commutes with every other element of the
group and leaves it unchanged.
Let A and B be the elements of the group. Let X be the element satisfying rule 2.
i.e. XA = AX = A and also XB = BX = B.
BA = BX2A; BX
2 = B = BE, where we have set X
2 = E (identity)
It is clear BEn= B, n being any integer. This kind of element E which does not effect any change
when multiplied with any element is a unique element and is called an identity operation
E. For water, E, the identity operation satisfies this rule. It is so for all molecules.
RULE 3
Associative law of multiplication must be valid. This means ABCD is the same as (AB)(CD), (A)
(BCD) or (ABC) (D). ABC is the same as A(BC) or (AB)C.
For example, we have for water
C2v Ev'C2vEv
'v
'v' E
C2v' Ev C2v
' E v C2vv
' C2
Multiplication simply means successive application of the symmetry operations in the order right
to left.
RULE 4
Inverse of an element A is denoted by A-1 (this does not mean 1/A). It is simply an element of the
group such that A-1
A=E. In case of symmetry groups, A-1
is that element which undoes or annuls the effect of A. For H2O we have, for example, C2C2 = E. Therefore C2
1C2 i.e., C2 is its own
inverse. This is true of all other elements for H2O. But this is not general. For example, C6
2C3E . Therefore C6
1 is not C6.
6.2.2. ORDER OF GROUP

M.S University-D.D.C.E Unit V
Page 104
The total number of elements present in a group is known as the order of the group. It is denoted
by n.
Example:
1. Water molecule belongs to C2v group of order 4 because it contains 4 elements namely E,C2z, vand’v.
2. Ammonia belongs to C3v group of order 6 as it contains 6 elements namely E, C31, C3
2,
v(1)
,v(2)
andv(3)
.
6.2.3. ABELIAN GROUP
A group is said to be abelian if for all pairs of elements of the group, the binary combination is
commutative. That is AB = BC; BC = CB – and so on.
Example: The elements of C2v point group E, C2z,v and ’v form an abelian group as all the elements of this group commute with each other.
6.2.4. NON-ABELIAN GROUP
A group is said to be non-abelian if the commutative law does not hold for the binary
combinations of the elements of the group, i.e., AB BA.
Example:
The elements of C3v point group E, C31, C3
2,v(1),v(2) and v(3) donot consecutive an abelian
group since the elements donot follow commutative law.
6.2.5. ISOMORPHISM
Two groups are supposed to be isomorphic if they obey the following rules.
1. Both have same order and structure. 2. There is a one-to-one correspondence in all respects between the members of the two
groups. If A1, B 1, C 1, D 1 and A2, B 2, C 2, D2 are the members of the two isomorphic groups, A1 corresponds to A2, B1 corresponds to B2 and so on.
3. The relationship between the any two members of a group is exactly the same as the
relationship between the corresponding members of the other group.
Let us take the three groups listed below:
(i) E, C2
(ii) E, i (iii) E, h
All the three are isomorphic groups.
E C22; C2 E C2
E i 2; iE = i
E h2;hEhetc.
6.3 POINT GROUPS

M.S University-D.D.C.E Unit V
Page 105
IT is only possible for certain combinations of symmetry elements to be present in a
molecule (or any other object). As a result, we may group together molecules that possess the
same symmetry elements and classify molecules according to their symmetry. These groups of
symmetry elements are called point groups (due to the fact that there is at least one point in space
that remains unchanged no matter which symmetry operation from the group is applied).There
are two systems of notation for labeling symmetry groups, called the Schoenflies andHermann-
Mauguin (or International) systems.

M.S University-D.D.C.E Unit V
Page 106
Point Group Decision Tree

M.S University-D.D.C.E Unit V
Page 107
6.4. GROUP MULTIPLICATION TABLE Every group is characterized by a multiplication table. The relationship between the elements of
the binary combinations is reflected in the multiplication table. Consider a water molecule. It has four symmetry elements, viz., E, C2(z), v(xz) and
z v (xz)
C2
O
y
H
H v'(yz)
x
Fig. 2.2. The Four symmetry elements of H2O molecules
We can easily show that the product of any two symmetry elements is one of the four elements of the group. Thus, for instance, C2(z)v(xz) = v‘(yz). Proceeding this way the symmetry operations of H2O can be listed in a group multiplication table (GMT) (Table 2.2).
E C2(z) v(xz) v‘(yz)
E E C2(z) v(xz) v‘(yz)
C2(z) C2(z) E v‘(yz) v(xz)
v(xz) v(xz) v‘(yz) E C2(z)
v‘(yz) v‘(yz) v(xz) C2(z) E
Table 2.2. Group multiplication table of the symmetry operations of H2O molecule
TheAmmoniaMolecule
We shall introduce the concepts of symmetry and group theory by considering a concrete
example–the ammonia molecule NH3. In any symmetry operation on NH3, the nitrogen
atom remains fixed but the hydrogen atoms can be permutedin 3!=6 differentways. The axis
of the molecule is called a C3 axis, since the molecule can be rotated about it into 3
equivalent orientations, 120◦
apart.

M.S University-D.D.C.E Unit V
Page 108
More generally, a Cn axis has n equivalent orientations, separated by 2π/n radians. The
axis of highest symmetry in a molecule is called the principal axis. Three mirror planes,
designated1, ζ2, ζ3, run through the principal axis in ammonia. These are designated as ζv
or vertical planes of symmetry. Ammonia belongs to the symmetry group designated C3v,
characterized by a three-fold axis with three vertical planes of symmetry.
Group multiplication table of symmetry operation of NH3 molecule
Notice that each operation occurs once and only once in each row and each column.
6.4.1. IMPORTANT CHARACTERISTICS OF A GROUP MULTIPLICATION TABLE
1. It consists of h rows and h columns where h is the order of the group. 2. Each column and row is labeled with group element.
3. The entry in the table under a given column and along given row is the product of the
elements which head that column and the row (multiplication rule is strictly followed).
4. At the intersection of the column labeled by Y and the row labeled by X, we found the
element which is the product XY. 5. The following rearrangement theorem holds good for every ‗Group Multiplication Table‘.
―Each row and each column in the table lists each of the group elements once and only once. No

M.S University-D.D.C.E Unit V
Page 109
two rows may be identical nor any two columns be identical. Thus each row and each column is
a rearranged list of the group elements‖.
6.5. SYMMETRY CLASSIFICATION OF MOLECULES INTO POINT GROUPS
Molecules can be classified into point groups depending on the characteristic set of symmetry
elements possessed by them. A molecular group is called a point group since all the elements of
symmetry present in the molecule intersect at a common point and this point remains fixed under
all the symmetry operations of the molecule. The symmetry groups of the molecules
Table 2.3. Some Molecular Point Groups
Point Symmetry Elements Examples
Group
C1 E CHFClBr
C2 E,C2 H2O2
C3 E,C3 C2H6
Cs E,v NOCl
C2v E,C2,2v
H2O,CH2=O,
pyridine C3v E,C3,3v NH3,CHCl3,PH3
Cv E,C,v HCl, NO,CO
C2h E,C2, h, i
trans
CHCl=CHCl
D2h E,3C2, 3, i
CH2=CH2,naphth
alene
D3h E,2C3, 3C2( to C3),3v, h, 2S3
BF3(trigonal
planar)
D4h E,C4, 4C2 ( to C4),2v, 2d, h, C2, S4(coincidence with
[PtCl4]2-
( s q u
a r e
C4), i planar) D6h E,2C6,6C2( to C6),3v, 3d, h, C2,2C3 ,2S6, 2S3,i C6H6
Td E, 4C3,3C2 ,3S4(coincidence with C2),6d CH4
Oh E,3C4,4C3,3S4 and 3C2 (both coincident with the C4 SF6
axes), 6C2 ,4S6, 3h, 6d
6.6. DIFFERENCE BETWEEN POINT GROUP AND SPACE GROUP
Symmetry operations do not alter the energy of the molecule. Further in all the above operations
the centre of the molecule is not altered as none of the operations involve a total translational
movement of the molecule. Whatever happens to the molecule, the centre (point) is not changed.

M.S University-D.D.C.E Unit V
Page 110
At least one point is fixed. Hence these are classified as ‗point group‘ operations. In case of crystals operations such as ‗screw rotations‘ and glide plane reflections can be
additionally specified. Screw rotation involves a rotation with respect to an axis and then a
translation in the direction of the same axis. Glide plane reflection is a reflection in a plane
followed by a translation along a line in that plane. These are particular to crystals and the
classification comes under what is known as space group. Note that here even the centre
changes. Thus in short, in point group, there is at least one point (centre) which is not altered
after all operations while in space group it is not possible to identify such a stationary point. 6.7. LET US SUM UP
In this lesson, we: Pointed out Group
Basic properties of a group
Order of group Abelian group Isomorphism
Similarity transformation and classes Group multiplication table
Symmetry classification of molecules into point groups Difference between point group and space group
6.8 CHECK YOUR PROGRESS
1. Explain why a set of numbers cannot form a group by the process of division.
2. Explain why the set of integers between 0 and do not form a group under the process of
multiplication.
6.9. LESSON - END ACTIVITIES
1. Construct the multiplication table for the C3v point group to which NH3 molecule belongs.
2. Draw the structure of three distinct isomers of C2H2Cl2 and determine their point groups. Which of them is polar?
6.10. REFERENCES
1. K.V. Raman, Group Theory and its applications to Chemistry, Tata McGraw-Hill
Publishing Company limited, New Delhi.

M.S University-D.D.C.E Unit V
Page 111
UNIT V
NANO TECHNOLOGY
CONTENTS
7.1 Introduction
7.2 Fundamental Principles:
7.3 Nanoparticles and Its Properties
7.3 .1Definition
7.3 .2 Size Relationships (Size Effect)
7.3 .3 Nanoparticles of Metals, Semiconductors And Oxides
7.3 .4 Nanoparticles of Metal
7.3 .5 Nanoparticles of Semiconductor
7.3 .6 Nanoparticles of Oxides (Nanocermics)
7.4 Properties Of Nanomaterials
7.4.1 Optical Properties
7.4.2 Electrical Properties
7.4.3. Mechanical Properties7.4.4 Magnetic Properties
7.5 Nanomaterials’ Characteristics
7.6 Approaches Of Nanotechnology (Growth Methods)
7.7 Synthesis Of Nanosized Compounds
7.7.1 Reduction Method
7.7.2 Sol-Gel Method
7.7.3 Chemical Vapour Deposition (CVD) Method
7.8 Quantum Dots
7.9 Nano Clusters
7.10 Fullerenes
7.11 Carbon Nano Tubes (Cnts)
7.12. Nanofiber
7.13 Nanocomposites
7.14 Applications of Nanochemistry in Various Fields:

M.S University-D.D.C.E Unit V
Page 112
7.1 Introduction
Nanotechnology is the science of nanotechnological devices, derived from nanomaterials.
The nanomaterials are may solid materials that have special dimension in the range of the 1-
100nm. Nanochemistry is a branch of nanotechnology which covers the study of nanoscale
synthesis and nanometer scale materials. The prefix nano means one billionth (1 x 10⁻⁹
) and it is
derived from the Latin word ―nanus‖ (means any living thing smaller than its usual size). A
nanometer (nm) is one billionth (1 x 10⁻⁹
) of a meter. For comparison, a single human hair is
about 80,000nm; a red blood cell is approximately 7,000nm; a water molecule is almost 0.3nm
and hydrogen atom is almost 0.04nm sizes respectively.
Nanotechnology is an extensive are which covers all the fields of science and
engineering. It is sure that nanotechnology will change the nature of almost any human-made
object in the next century.
7.2 Fundamental Principles:
The main principles of nanotechnology are as follows:
i) The nanotechnological devices are small in size, light weight and have unexpected
physico-chemical properties that differ from the bulk material. These three characters are
the basis for making new application opportunities in various fields of science and
engineering.
ii) The nanomaterial shows relatively large surface area when compared with that of the
same mass of material produced in the bulk from. This causes the increased chemical
reactivity of the nanomaterials than the bulk from.
iii) The nanomaterial exhibits the increased quantum effect than the bulk form. The quantum
effect means, when the size of the nanomaterial attains the quantum dot (1-10 nm), it has
large surface area, large energy gap and higher number of electrons than the bulk
materials. This quantum effect increases the optical, electrical and magnetic properties of
the nanomaterials.
iv) The nanocrystallite of metals exhibit size dependent properties such as lower melting
points, higher energy gaps and increased ductilities than the bulk form.
7.3 Nanoparticles and its properties
7.3 .1Definition:
Nanoparticles are ultrafine dispersive particles having size on the nanoscale between the
range of 1 to 100 nm (10-9
- 10-7
m).
Nanoparticles are generally considered as the cluster or aggregate or building block of
many atoms to form a solid particle in the nanocrystalline level.
7.3 .2Size relationship (size effect):
The structure of nanomaterials in three dimensional network is called nanoparticles, two
dimensional network is called nanofilms and on dimensional network is called nanowire. A
particle that exhibits a size of 1-10nm in one dimensional network is called quantum dot.
Physical and Chemical properties of nanosized materials are influenced by the size of the

M.S University-D.D.C.E Unit V
Page 113
particles. As the size of the nanoparticle decreases (from 100 nm to lower level), its properties
will be greatly increased. The property like surface effect increases when the size of the
nanoparticle decreases to lower level.
Example: A nanoparticle of 10nm diameter would have approximately 10% of atoms, whereas
1nm diameter nanoparticle would have approximately 100% of atoms on the surface.
The electronic effect like optical and fluorescence properties are greatly increased as the
size nanoparticles are decreased to quantum dots (1-10nm in diameter). This effect is called
quantum size effect. The property like melting point decreases as the size of the nanoparticle
decreases.
Example:
A cluster (aggregation) of 10,000 sodium atoms melts at 303K. When the number of
atoms is reduced to 1000, the cluster attains the nanosized sodium particle. This nanosized
sodium cluster melts at 288K. When the number of sodium atoms in the cluster is still reduced,
its melting point is also reduced.
7.3 .3 Nanoparticles of metals, semiconductors and oxides:
Nanoparticles are generally considered as metals, semiconductors and ceramics (oxides,
carbides, sulphides and nitrides) depending on the nature of aggregation of the particles.
7.3 .4 Nanoparticles of Metal:
Most of the chemical elements are metals. When the metal atoms are combined to form a
metal nanoparticle, it shows unexpected physic-chemical properties than the bulk metals.
The most common metal nanoparticle is gold nanoparticle. Gold nanoparticle is
synthesized by the reduction of chloroauric acid H[AuCl4] by sodium citrate of sodium
borohydride.
Example: Reduction of 50 ml solution of 0.01% H[AuCl4] by 1ml of 0.5% citrate solution gives
gold nanoparticle of 16nm in diameter. Similarly the reduction of 50ml solution of 0.01%
H[AuCl4] by 0.1ml of 0.5% citrate solution gives gold nanoparticle of 147 nm in diameter.
The citrate reducing agent is also used to prepare other metal nanoparticles such as Ag
from AgNO3, PD form H2[PdCl4] and Pt from H2[PtCl6]. Alloyed nanoparticles (mixed
nanopartilces) such as Fe-Co, Fe-Ni, Ti-Al, etc, can also be synthesized by the reduction method.
7.3 .5 Nanoparticles of Semiconductor:
The nanosized semiconductors have been synthesized due to their special optical and
electrical properties. These nanosized semiconductors are used in manufacture of optoelectronic
and electronic device. Generally non-oxide nanosized semiconductors like CdS, CdSe and CdTe
are extensively used. These semiconductors are commonly synthesised by the pyrolysis of
organometallic compounds dissolved in a dry organic solvent at a high temperature in the
presence of a stabilizing (capping) agent.
Example: For the synthesis of nanosized CdSe semiconductor, dimethyl cadmium Cd(CH3) is
used as the source of Cd. Trioctyphosphine selinide (TOPSe) is used as the source of Se. Tri-n-
octyphosphine (TOP) and tri-n-octylphosphine oxide (TOPO) are used as solvent and capping

M.S University-D.D.C.E Unit V
Page 114
agent respectively. The temperature range used in the pyrolysis reaction is gradually raised to
230-2600C. Depending upon the temperature used, CdSe nanoparticles with a series of sizes
ranging from 1.5nm to 11.5 nm in diameters are obtained.
TOPO - TOP
Cd(CH3)2 + (C8H17)3 PSe CdSe
7.3 .6 Nanoparticles of oxides (Nanocermics):
Nanosized oxides have been used as semiconductor and insulator in many devices.
Oxides like ZnO, TiO2, Fe2O3 and Cr2O3 are used as semiconductors whereas oxides like MgO,
CaO, Al2O3 and SiO2 are used as insulators.
Nanoscale metal oxides in the size of 1 to 10nm are commonly synthesized by Laser
ablation (evaporation) physical method. In this method, the hot metal atoms are allowed to react
with the oxygen inside the chamber to form a nanosized metal oxide. Nanosized metal oxides
like, ZnO, SiO2, TiO2, ZrO2, Al2O3 and MgO are synthesized by this method. Ultrapure
nanosized metal oxides are prepared by the Sol-Gel chemical method.
7.4 Properties of Nanomaterials
Nanomaterials have the structural features in between of those of atoms and the bulk
materials. While most microstructured materials have similar properties to the corresponding
bulk materials, the properties of materials with nanometer dimensions are significantly different
from those of atoms and bulks materials. This is mainly due to the nanometer size of the
materials which render them: (i) large fraction of surface atoms; (ii) high surface energy; (iii)
spatial confinement; (iv) reduced imperfections, which do not exist in the corresponding bulk
materials.
Due to their small dimensions, nanomaterials have extremely large surface area to
volume ratio, which makes a large to be the surface or interfacial atoms, resulting in more
―surface‖ dependent material properties. Especially when the sizes of nanomaterials are
comparable to length, the entire material will be affected by the surface properties of
nanomaterials. This in turn may enhance or modify the properties of the bulk materials. For
example, metallic nanoparticles can be used as very active catalysts. Chemical sensors from
nanoparticles and nanowires enhanced the sensitivity and sensor selectivity. The nanometer
feature sizes of nanomaterials also have spatial confinement effect on the materials, which bring
the quantum effects.
The energy band structure and charge carrier density in the materials can be modified
quite differently from their bulk and in turn will modify the electronic and optical properties of
the materials. For example, lasers and light emitting diodes (LED) from both of the quantum dots
and quantum wires are very promising in the future optoelections. High density information
storage using quantum dot devices is also a fast developing area. Reduced imperfections are also
an important factor in determination of the properties of the nanomaterials. Nanosturctures and
Nanomaterials favors of a self-purification process in that the impurities and intrinsic material
defects will move to near the surface upon thermal annealing. This increased materials perfection
affects the properties of nanomaterials. For example, the chemical stability for certain
nanomaterials may be enhanced, the mechanical properties of nanomaterials will be better than
the bulk materials. The superior mechanical properties of carbon nanotubes are well known. Due
to their nanometer size, nanomaterials are already known to have many novel properties. Many

M.S University-D.D.C.E Unit V
Page 115
novel applications of the nanomaterials rose from these novel properties have also been
proposed.
7.4.1 Optical properties
One of the most fascinating and useful aspects of nanomaterials is their optical properties.
Applications based on optical properties of nanomaterials include optical detector, laser, sensor,
imaging, phosphor, display, solar cell, photocatalysis, photoelectrochemistry and biomedicine.
The optical properties of nanomaterials depend on parameters such as feature size, shape,
surface characteristics, and other variables including doping and interaction with the surrounding
environment or other nanostructures. Likewise, shape can have dramatic influence on optical
properties of metal nanostructures. Fig. () exemplifies the differencein the optical properties of
metal and semiconductor nanoparticles. With the CdSe semiconductor nanoparticles, a simple
change in size alters the optical properties of the nanoparticles. When metal nanoparticles are
enlarged, their optical properties change only slightly as observed for the different samples of
gold nanospheres in fig. (). However, when an anisotropy is added to the nanoparticle, such as
growth of nanorods, the optical properties of the nanoparticles change dramatically.
Fig.. Fluorescence emission of (CdSe) ZnS quantum dots of various sizes and absorption spectra
of various sizes and shapes of gold nanoparticles (Chem. Soc. Rev., 2006, 35, 209–217).
7.4.2 Electrical properties Electrical Properties of Nanoparticles‖ discuss about fundamentals of electrical conductivity in
nanotubes and nanorods, carbon nanotubes, photoconductivity of nanorods, electrical
conductivity of nanocomposites. One interesting method which can be used to demonstrate the
steps in conductance is the mechanical thinning of a nanowire and measurement of the electrical
current at a constant applied voltage. The important point here is that, with decreasing diameter
of the wire, the number of electron wave modes contributing to the electrical conductivity is
becoming increasingly smaller by well-defined quantized steps.
In electrically conducting carbon nanotubes, only one electron wave mode is observed

M.S University-D.D.C.E Unit V
Page 116
which transport the electrical current. As the lengths and orientations of the carbon nanotubes are
different, they touch the surface of the mercury at different times, which provides two sets of
information: (i) the influence of carbon nanotube length on the resistance; and (ii) the resistances
of the different nanotubes. As the nanotubes have different lengths, then with increasing
protrusion of the fiber bundle an increasing number of carbon nanotubes will touch the surface of
the mercury droplet and contribute to the electrical current transport.
Fig.. Electrical behavior of naotubes (P. G. Collins and Ph. Avouris, ScientificAmerican,
62, 2000, 283).
7.4.3. Mechanical properties
―Mechanical Properties of Nanoparticles‖ deals with bulk metallic and ceramic materials,
influence of porosity, influence of grain size, superplasticity, filled polymer composites, particle-
filled polymers, polymer-based nanocomposites filled with platelets, carbon nanotube-based
composites. The discussion of mechanical properties of nanomaterials is, in to some extent, only
of quite basic interest, the reason being that it is problematic to produce macroscopic bodies with
a high density and a grain size in the range of less than 100 nm. However, two materials, neither
of which is produced by pressing and sintering, have attracted much greater interest as they will
undoubtedly achieve industrial importance.
These materials are polymers which contain nanoparticles or nanotubes to improve their
mechanical behaviors, and severely plastic-deformed metals, which exhibit astonishing
properties. However, because of their larger grain size, the latter are generally not accepted as
nanomaterials. Experimental studies on the mechanical properties of bulk nanomaterials are
generally impaired by major experimental problems in producing specimens with exactly defined
grain sizes and porosities. Therefore, model calculations
and molecular dynamic studies are of major importance for an understanding of the mechanical
properties of these materials.
Filling polymers with nanoparticles or nanorods and nanotubes, respectively, leads to significant
improvements in their mechanical properties. Such improvements depend heavily on the type of
the filler and the way in which the filling is conducted. The latter point is of special importance,
as any specific advantages of a nanoparticulate filler may be lost if the filler forms aggregates,
thereby mimicking the large particles. Particulate-filled polymer-based nanocomposites exhibit a
broad range of failure strengths and strains. This depends on the shape of the filler, particles or
platelets, and on the degree of agglomeration. In this class of material, polymers filled with
silicate platelets exhibit the best mechanical properties and are of the greatest economic

M.S University-D.D.C.E Unit V
Page 117
relevance. The larger the particles of the filler or agglomerates, the poorer are the properties
obtained. Although, potentially, the best composites are those filled with nanofibers or
nanotubes, experience teaches that sometimes such composites have the least ductility. On the
other hand, by using carbon nanotubes it is possible to produce composite fibers with extremely
high strength and strain at rupture. Among the most exciting nanocomposites are the polymer-
ceramic nanocomposites, where the ceramic phase is platelet-shaped. This type of composite is
preferred in nature, and is found in the structure of bones, where it consists of crystallized
mineral platelets of a few nanometers thickness that are bound together with collagen as the
matrix. Composites consisting of a polymer matrix and defoliated phyllosilicates exhibit
excellent mechanical and thermal properties.
7.4.4 Magnetic properties
Bulk gold and Pt are non-magnetic, but at the nano size they are magnetic. Surface atoms are not
only different to bulk atoms, but they can also be modified by interaction with other chemical
species, that is, by capping the nanoparticles. This phenomenon opens the possibility to modify
the physical properties of the nanoparticles by capping them with appropriate molecules.
Actually, it should be possible that non-ferromagnetic bulk materials exhibit ferromagnetic-like
behavior when prepared in nano range. One can obtain magnetic nanoparticles of Pd, Pt and the
surprising case of Au (that is diamagnetic in bulk) from non-magnetic bulk materials. In the case
of Pt and Pd, the ferromagnetism arises from the structural changes associated with size effects.
Fig.. Magnetic properties of nanostrucutred materials
However, gold nanoparticles become ferromagnetic when they are capped with
appropriate molecules: the charge localized at the particle surface gives rise to ferromagnetic-like
behavior.
Surface and the core of Au nanoparticles with 2 nm in diameter show ferromagnetic and
paramagnetic character, respectively. The large spin-orbit coupling of these noble metals can
yield to a large anisotropy and therefore exhibit high ordering temperatures. More surprisingly,
permanent magnetism was observed up to room temperature for thiol-capped Au nanoparticles.
For nanoparticles with sizes below 2 nm the localized carriers are in the 5d band. Bulk Au has an
extremely low density of states and becomes diamagnetic, as is also the case for bare Au

M.S University-D.D.C.E Unit V
Page 118
nanoparticles. This observation suggested that modification of the d band structure by chemical
bonding can induce ferromagnetic like character in metallic clusters.
7.5 Nanomaterials’ Characteristics
example Category of
nanomaterials
layers, multi-layers, thin films, platelets and surface coatings. They
have been developed and used for decades, particularly in the
electronics industry.
One-dimensional
nanomaterials
nanowires, nanofibres made from a variety of elements
other than carbon, nanotubes and, a subset of this group, carbon
nanotubes.
Two-dimensional
nanomaterials
are known as nanoparticles and include precipitates,
colloids and quantum dots (tiny particles of semiconductor
materials), and Nanocrystalline materials
Three-dimensional
nanomaterials
7.6 Approaches of Nanotechnology (growth methods)
Bottom-up approaches seek to have smaller components built up into more complex
assemblies, while top-down approaches seek to create nanoscale devices by using larger,
externally controlled ones to direct their assembly.
The top-down approach often uses the traditional workshop or microfabrication methods
where externally controlled tools are used to cut, mill, and shape materials into the
desired shape and order.
Micropatterning techniques, such as photolithography and inkjet printing belong to this
category.
Bottom-up approaches, in contrast, use the chemical properties of single molecules to
cause single-molecule components to
(a) self-organize or self-assemble into some useful conformation, or
(b) rely on positional assembly.
Nanomaterial - synthesis and processing
Nanomaterials deal with very fine structures: a nanometer is a billionth of a meter. This
indeed allows us to think in both the ‗bottom up‘ or the ‗top down‘ approaches (Fig. 5) to
synthesize nanomaterials, i.e. either to assemble atoms together or to dis-assemble (break,
or dissociate) bulk solids into finer pieces until they are constituted of only a few atoms.
This domain is a pure example of interdisciplinary work encompassing physics,
chemistry, and engineering upto medicine.
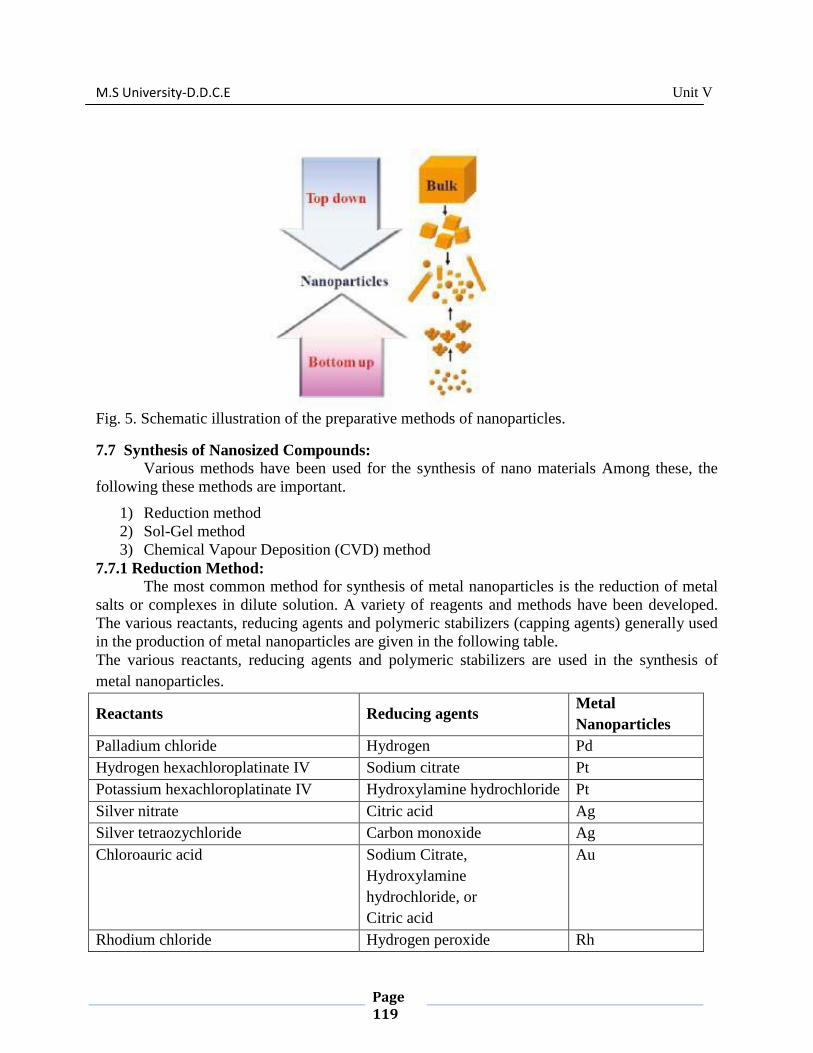
M.S University-D.D.C.E Unit V
Page 119
Fig. 5. Schematic illustration of the preparative methods of nanoparticles.
7.7 Synthesis of Nanosized Compounds:
Various methods have been used for the synthesis of nano materials Among these, the
following these methods are important.
1) Reduction method
2) Sol-Gel method
3) Chemical Vapour Deposition (CVD) method
7.7.1 Reduction Method:
The most common method for synthesis of metal nanoparticles is the reduction of metal
salts or complexes in dilute solution. A variety of reagents and methods have been developed.
The various reactants, reducing agents and polymeric stabilizers (capping agents) generally used
in the production of metal nanoparticles are given in the following table.
The various reactants, reducing agents and polymeric stabilizers are used in the synthesis of
metal nanoparticles.
Reactants Reducing agents Metal
Nanoparticles
Palladium chloride Hydrogen Pd
Hydrogen hexachloroplatinate IV Sodium citrate Pt
Potassium hexachloroplatinate IV Hydroxylamine hydrochloride Pt
Silver nitrate Citric acid Ag
Silver tetraozychloride Carbon monoxide Ag
Chloroauric acid Sodium Citrate,
Hydroxylamine
hydrochloride, or
Citric acid
Au
Rhodium chloride Hydrogen peroxide Rh

M.S University-D.D.C.E Unit V
Page 120
Polymeric stabilizers (Capping agents)
Poly vinylpyrrolidone, PVP; Polyvinyl alcohol, PVA: Polyethyleneimine
Reduction by Sodium citrate:
The variety of methods are now available for the synthesis of gold nanoparticles. Among
these the reduction of cholorauric acid by sodium citrate is the most important method. In this
method, 50ml solution of 0.01% chloroauric acid is mixed with 1ml of 0.5% sodium citrate and
the mixture is kept at 1000C till colour changes. Then add 2ml of PVP (a capping agent). The
overall volume of the solution was maintained by adding water. The colloidal gold (sol) of
uniform particle size of approximately 16nm in diameter is obtained.
The use of different reducing agents has marked effect on the appearance of the gold
nano particles. Reduction by sodium citrate yields spherical particles, whereas faceted gold
particles are formed with hydroxylamine hydrochloride [cubical with (100) facets] and a very
thin layers of gold nano particles are formed with citric acid [trigonal symmetry with (111)
facets].
Borohydride (BH4) Reduction:
Borohydride reduction of metal ions can be useful for the preparation of metallic
nanoparticles. For example, the sodium borohydride (NaBH4) reduction Co2+
ions in aqueous
solution in the presence of argon results in the formation of Co2B nanoparticles.
2Co2+
+ 4BH4 + 9H2O Co2B + 12.5H2 + 3B(OH)3
7.7.2 Sol-Gel Method:
The sol-gel process, involves the evolution of inorganic networks through the formation
of a colloidal suspension (sol) and gelation of the sol to form a network in a continuous liquid
phase (gel). The precursors for synthesizing these colloids consist usually of a metal or metalloid
element surrounded by various reactive ligands. The starting material is processed to form a
dispersible oxide and forms a sol in contact with water or dilute acid. Removal of the liquid from
the sol yields the gel, and the sol/gel transition controls the particle size and shape. Calcination of
the gel produces the oxide.
Sol-gel processing refers to the hydrolysis and condensation of alkoxide-based precursors
such as Si(OEt) 4 (tetraethyl orthosilicate, or TEOS). The reactions involved in the sol-gel
chemistry based on the hydrolysis and condensation of metal alkoxides M(OR)z can be
described as follows:
MOR + H2O → MOH + ROH (hydrolysis)
MOH + ROM → M-O-M + ROH (condensation)
Sol-gel method of synthesizing nanomaterials is very popular amongst chemists and is widely
employed to prepare oxide materials. The sol-gel process can be characterized by a series of
distinct steps.

M.S University-D.D.C.E Unit V
Page 121
Fig. 7. Schematic representation of sol-gel process of synthesis of nanomaterials.
1. Formation of different stable solutions of the alkoxide or solvated metal precursor.
2. Gelation resulting from the formation of an oxide- or alcohol- bridged network
(the gel) by a polycondensation reaction that results in a dramatic increase in the
viscocity of the solution.
3. Aging of the gel (Syneresis), during which the polycondensation reactions continue until
the gel transforms into a solid mass, accompanied by contraction of the gel network and
expulsion of solvent from gel pores. Ostwald ripening (also referred to as coarsening, is
the phenomenon by which smaller particles are consumed by larger particles during the
growth process) and phase transformations may occur concurrently with syneresis. The
aging process of gels can exceed 7 days and is critical to the prevention of cracks in gels
that have been cast.
4. Drying of the gel, when water and other volatile liquids are removed from the gel
network. This process is complicated due to fundamental changes in the structure of the
gel. The drying process has itself been broken into four distinct steps: (i) the constant rate
period, (ii) the critical point, (iii) the falling rate period, (iv) the second falling rate
period. If isolated by thermal evaporation, the resulting monolith is termed a xerogel. If
the solvent (such as water) is extracted under supercritical or near super critical
conditions, the product is an aerogel.
5. Dehydration, during which surface- bound M-OH groups are removed, there by

M.S University-D.D.C.E Unit V
Page 122
stabilizing the gel against rehydration. This is normally achieved by calcining the
monolith at temperatures up to 8000C.
6. Densification and decomposition of the gels at high temperatures (T>8000C). The pores
of the gel network are collapsed, and remaining organic species are volatilized. The
typical steps that are involved in sol-gel processing are shown in the schematic diagram
below.
The interest in this synthesis method arises due to the possibility of synthesizing nonmetallic
inorganic materials like glasses, glass ceramics or ceramic materials at very low temperatures
compared to the high temperature process required by melting glass or firing ceramics.
The major difficulties to overcome in developing a successful bottom-up approach is controlling
the growth of the particles and then stopping the newly formed particles from agglomerating.
Other technical issues are ensuring the reactions are complete so that no unwanted reactant is left
on the product and completely removing any growth aids that may have been used in the process.
Also production rates of nano powders are very low by this process. The main advantage is one
can get monosized nano particles by any bottom up approach.
The main advantages of this method are as follows
i) It needs low-procesing temperature
ii) It produces highly pure and more uniform nanostructured product.
iii) It can be used to synthesize any nanomaterials like ceramics, metals, alloys and composites
in large quantities.
7.7.3 Chemical Vapour Deposition (CVD) Method:
CVD is the most common method to synthesise nanosized metal oxide (ceramics) carbon
nanotubes (CNTs) and nanocomposite crystallites. In this method, a solid is deposited on a
heated surface of the substrate using the chemical reactions occur at the vapour phase.
The chemical reaction which occurs in the vapour phase needs activation energy. This
energy is provided by the any one of the following methods.
i) Thermal CVD method: In this method, the reaction is activated by a high temperature at
above 9000C.
ii) Plasma CVD method: In this method, the reaction is activated by the plasma at the
temperature range of 300-7000C.
iii) Laser CVD method: In this method, the chemical reaction is activated by the high energy
laser beam.
iv) Photo Laser CVD method: In this method, the Chemical reaction is induced by the both
ultraviolet radiation and laser beam.
Example: The synthesis of carbon nanotube (CNT) by this method involves two step process.
Step I : Catalyst preparation
Step II: Synthesis of CNT
Step I : Catalyst preparation

M.S University-D.D.C.E Unit V
Page 123
The catalyst is prepared by coating ht transition metal like Fe, Co or Ni on a substrate like
SiO2, Zeolite or metal oxide. This process of coating needs activation energy. The metal atom
which is coated on the surface of the substrate acts as the catalyst.
Step II: Synthesis of CNT
The gaseous carbon sources commonly used are methane (CH4), carbon monoxide (CO)
and acetylene (C2H2). The activation energy is used to break the carbon source molecule into
reactive atomic carbon. This atomic carbon is then allowed to diffuse through the substrate
containing transition metal coating. Due to catalytic action, the atomic carbon binds on the
substrate and formed as nanosized CNT.
The CNT formed in this method contains lot of impurities like amorphous carbon, metal
catalyst and smaller fullerenes. Hence the CNTs are purified by various methods such as
oxidation, acid treatment, annealing, ultrasonification, magnetic purification, micro filtration,
cutting and chromatography.
7.8 Quantum dots
Quantum dots are tiny particles or nanocrystals of a semiconducting material with diameters in
the range of 2-10 nanometers (10-50 atoms). They were first discovered in 1980.1 Quantum dots
display unique electronic properties, intermediate between those of bulk semiconductors and
discrete molecules, that are partly the result of the unusually high surface-to-volume ratios for
these particles.2-4
The most apparent result of this is fluorescence, wherein the nanocrystals can
produce distinctive colors determined by the size of the particles.
Due to their small size, the electrons in quantum dots are confined in a small space (quantum
box), and when the radii of the semiconductor nanocrystal is smaller than the exciton Bohr
radius (exciton Bohr radius is the average distance between the electron in the conduction band
and the hole it leaves behind in the valence band), there is quantization of the energy levels
according to Pauli‘s exclusion principle (Figure 1). The discrete, quantized energy levels of
quantum dots relate them more closely to atoms than bulk materials and have resulted in
quantum dots being nicknamed 'artificial atoms'. Generally, as the size of the crystal decreases,
the difference in energy between the highest valence band and the lowest conduction band
increases. More energy is then needed to excite the dot, and concurrently, more energy is
released when the crystal returns to its ground state, resulting in a color shift from red to blue in
the emitted light. As a result of this phenomenon, quantum dots can emit any color of light from
the same material simply by changing the dot size. Additionally, because of the high level of
control possible over the size of the nanocrystals produced, quantum dots can be tuned during
manufacturing to emit any color of light.7
Quantum dots can be classified into different types based on their composition and structure.

M.S University-D.D.C.E Unit V
Page 124
Figure 1. Splitting of energy levels in quantum dots due to the quantum confinement effect,
semiconductor band gap increases with decrease in size of the nanocrystal.
Quantum Dots Applications
The unique size and composition tunable electronic property of these very small,
semiconducting quantum dots make them very appealing for a variety of applications and new
technologies.
Quantum dots are particularly significant for optical applications owing to their bright, pure
colors along with their ability to emit rainbow of colors coupled with their high efficiencies,
longer lifetimes and high extinction coefficient. Examples include LEDs and solid state lighting,
displays and photovoltaics.
7.9 Nano clusters:
Clusters are the aggregate or building block of atoms or molecules whose characteristic
dimensions are few nanometers. Due to their small size, the properties of the clusters are differ
from the corresponding material in the bulk form.
Clusters are of four types according to the nature of chemical bonding between the
aggregate atoms.
i) Van der Walls clusters:
Examples: Molecular clusters like (N2)N, (CO2)N etc. In Van der walls clusters, the
binding energy is less about 0.3eV per atom.
ii) Metal clusters:
Examples: Transition metal clusters of Fe, Co, Ni, etc. In metal clusters, the binding
energy is moderate to strong from 0.5 to 3 eV per atom.

M.S University-D.D.C.E Unit V
Page 125
iii) Ionic clusters:
Examples: Ironic cluster like NaCl, CsCl2, etc. In Ironic clusters, the binding energy is
strong about 2.4 eV per atom.
iv) Network clusters:
Examples: Covalent cluster like Si, Ge, C, etc. In network clusters, the binding energy is
more strong about 4 eV per atom.
7.10 Fullerenes
A fullerene is a molecule of carbon in the form of a hollow sphere, ellipsoid, tube, and many
other shapes. Spherical fullerenes are also called Buckminsterfullerene (buckyballs), and they
resemble the balls used in football (soccer). Cylindrical ones are called carbon nanotubes or
buckytubes. Fullerenes are similar instructure to graphite, which is composed of
stacked graphene sheets of linked hexagonal rings; but they may also contain pentagonal (or
sometimes heptagonal) rings.
Buckminsterfullerene is the smallest fullerene molecule containing pentagonal and hexagonal
rings in which no two pentagons share an edge (which can be destabilizing, as in pentalene). It is
also most common in terms of natural occurrence, as it can often be found in soot.
The structure of C60 is a truncated icosahedron, which resembles an association football ball of
the type made of twenty hexagons and twelve pentagons, with a carbon atom at the vertices of
each polygon and a bond along each polygon edge.
The van der Waals diameter of a C60 molecule is about 1.1 nanometers (nm).[26]
The nucleus to
nucleus diameter of a C60 molecule is about 0.71 nm.
The C60 molecule has two bond lengths. The 6:6 ring bonds (between two hexagons) can be
considered "double bonds" and are shorter than the 6:5 bonds (between a hexagon and a
pentagon). Its average bond length is 1.4 angstroms.
Applications
Fullerenes have been extensively used for several biomedical applications including the design
of high-performance MRI contrast agents, X-Ray imaging contrast agents, photodynamic therapy
and drug and gene delivery
7.11 Carbon Nano Tubes (CNTS)
Nanotubes are cylindrical fullerenes. These tubes of carbon are usually only a few nanometres
wide, but they can range from less than a micrometer to several millimeters in length. They often
have closed ends, but can be open-ended as well. There are also cases in which the tube reduces
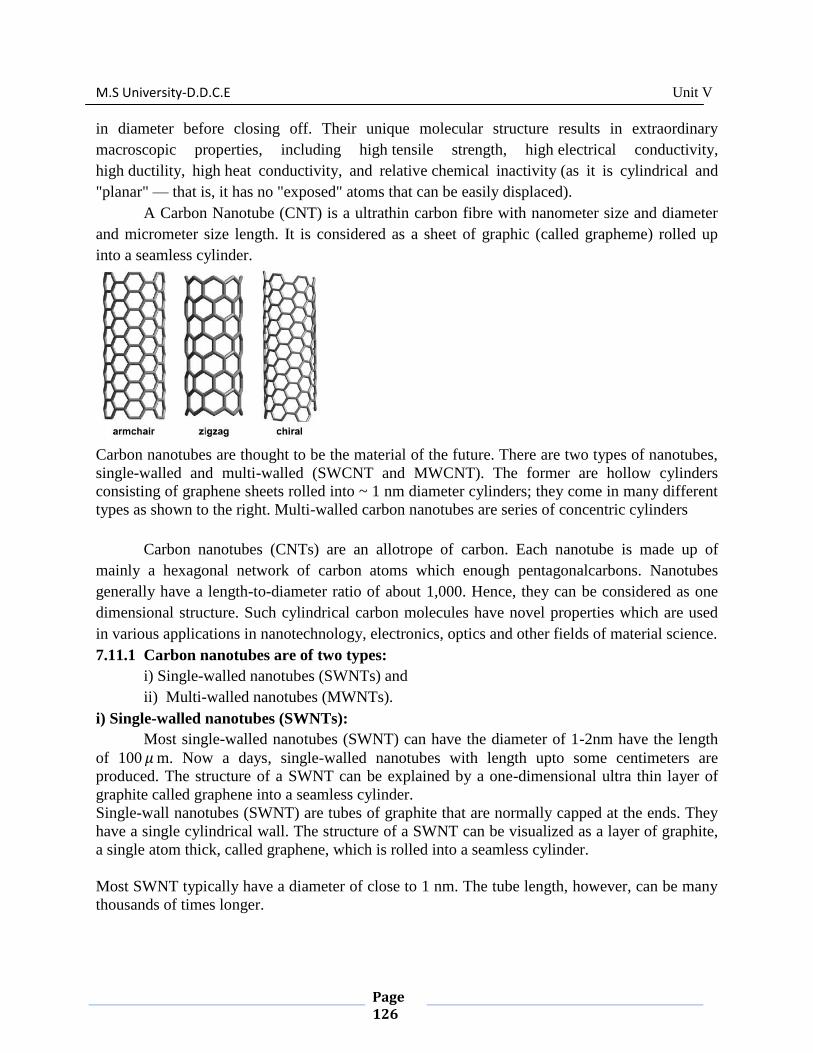
M.S University-D.D.C.E Unit V
Page 126
in diameter before closing off. Their unique molecular structure results in extraordinary
macroscopic properties, including high tensile strength, high electrical conductivity,
high ductility, high heat conductivity, and relative chemical inactivity (as it is cylindrical and
"planar" — that is, it has no "exposed" atoms that can be easily displaced).
A Carbon Nanotube (CNT) is a ultrathin carbon fibre with nanometer size and diameter
and micrometer size length. It is considered as a sheet of graphic (called grapheme) rolled up
into a seamless cylinder.
Carbon nanotubes are thought to be the material of the future. There are two types of nanotubes,
single-walled and multi-walled (SWCNT and MWCNT). The former are hollow cylinders
consisting of graphene sheets rolled into ~ 1 nm diameter cylinders; they come in many different
types as shown to the right. Multi-walled carbon nanotubes are series of concentric cylinders
Carbon nanotubes (CNTs) are an allotrope of carbon. Each nanotube is made up of
mainly a hexagonal network of carbon atoms which enough pentagonalcarbons. Nanotubes
generally have a length-to-diameter ratio of about 1,000. Hence, they can be considered as one
dimensional structure. Such cylindrical carbon molecules have novel properties which are used
in various applications in nanotechnology, electronics, optics and other fields of material science.
7.11.1 Carbon nanotubes are of two types:
i) Single-walled nanotubes (SWNTs) and
ii) Multi-walled nanotubes (MWNTs).
i) Single-walled nanotubes (SWNTs):
Most single-walled nanotubes (SWNT) can have the diameter of 1-2nm have the length
of 100 𝜇 m. Now a days, single-walled nanotubes with length upto some centimeters are
produced. The structure of a SWNT can be explained by a one-dimensional ultra thin layer of
graphite called graphene into a seamless cylinder.
Single-wall nanotubes (SWNT) are tubes of graphite that are normally capped at the ends. They
have a single cylindrical wall. The structure of a SWNT can be visualized as a layer of graphite,
a single atom thick, called graphene, which is rolled into a seamless cylinder.
Most SWNT typically have a diameter of close to 1 nm. The tube length, however, can be many
thousands of times longer.

M.S University-D.D.C.E Unit V
Page 127
SWNT are more pliable yet harder to make than MWNT. They can be twisted, flattened, and
bent into small circles or around sharp bends without breaking.
SWNT have unique electronic and mechanical properties which can be used in numerous
applications, such as field-emission displays, nanocomposite materials, nanosensors, and logic
elements. These materials are on the leading-edge of electronic fabrication, and are expected to
play a major role in the next generation of miniaturized electronics.
ii) Multi-walled nanotubes (MWNTs):
Multi-walled nanotubes (MWNT) is composed of 2 to 30 concentric graphite layers
having the diameter of 10-50nm and have the length of more than 10𝜇m. There are two models
which can be used to describe the structure of MWNT. In the Russian Doll model, sheets of
graphite are arranged in concentric cylinders Figures. In the Parchment model, a single sheet of
graphite is rolled in around itself, resembling a rolled up newspaper.
Multi-wall nanotubes can appear either in the form of a coaxial assembly of SWNT similar to a
coaxial cable, or as a single sheet of graphite rolled into the shape of a scroll.
The diameters of MWNT are typically in the range of 5 nm to 50 nm. The interlayer distance in
MWNT is close to the distance between graphene layers in graphite.
MWNT are easier to produce in high volume quantities than SWNT. However, the structure of
MWNT is less well understood because of its greater complexity and variety. Regions of
structural imperfection may diminish its desirable material properties.
The challenge in producing SWNT on a large scale as compared to MWNT is reflected in the
prices of SWNT, which currently remain higher than MWNT.
7.11.2 Carbon nanotube – Properties:
i) Strength :
Carbon nanotubes are having high tensile strength and stiffness. The tensile strength of
CNT is almost 20 times greater than that of steel. This higher tensile strengths is due to the
formation of covalent sp2 bond between the carbon atoms.
ii) Thermal conductivity:
CNTs are very good thermal conductors along the tube. The thermal conductivity of the
CNT is almost 15 to 20 times greater than that of metallic conductors. For comparison, a SWNT
will be able to transmit up to 6000 Watts per meter per Kelvin (W/m/K) at room temperature
than a good thermal conductor of copper, which conducts only 385 W/m/K.

M.S University-D.D.C.E Unit V
Page 128
iii) Electrical conductivity:
CNTs are also good conductors of electricity. The electrical conductivity of CNT
depends on their nanosized diameter. When the diameter of the CNT decreases. The conductivity
increases. The electrical conductivity of CNT is 1,000 times greater than that of matals like
copper and silver CNTs can have the property of Field Emission or Field Effect (FE) sensors, i.e.
when a small amount of electric field is applied parallel to the axis of CNT, electrons are emitted
at a very high speed.
7.11 .3Application of CNTs:
Some of the applications of CNTs are as follows:
i) Because of Field Effect property of CNTs, they are used for producing switches, transistors
and chips which are used for making flat panel displays in televisions and computers.
ii) CNTs act as a catalyst for some chemical reactions. For example, reduction of NiO to Ni,
AlCl3 to Al, CdS to Cd, etc., have been carried out inside the CNTs. Here CNT acts as a carrier
as well as catalyst.
iii) CNT electrodes are used in storage batteries for longer life. Because of high storage capacity
of H2, CNTs are used in Hydrogen fuel cell.
7.12. Nanofiber
Nanofibers are defined as fibers with diameters less than 100 nanometers.[2]
In the textile
industry, this definition is often extended to include fibers as large as 1000 nm diameter.[3]
They
can be produced by melt processing, interfacial polymerization, electrospinning, antisolvent-
induced polymer precipitation and electrostatic spinning.Carbon nanofibers are graphitized fibers
produced by catalytic synthesis.
Generally, polymeric nanofibers are produced by an electrospinning process . Electrospinning is
a process that spins fibers of diameters ranging from 10nm to several hundred nanometers. This
method has been known since 1934 when the first patent on electrospinning was filed. Fiber
properties depend on field uniformity, polymer viscosity, electric field strength and DCD
(distance between nozzle and collector). Advancements in microscopy such as scanning electron
microscopy has enabled us to better understand the structure and morphology of nanofibers. At
present the production rate of this process is low and measured in grams per hour
7.12 .1 PROPERTIES OF NANOFIBERS
Nanofibers exhibit special properties mainly due to extremely high surface to weight ratio
compared to conventional nonwovens.
Low density, large surface area to mass, high pore volume, and tight pore size make the
nanofiber nonwoven appropriate for a wide range of filtration applications [9].
Figure 3 shows how much smaller nanofibers are compared to a human hair, which is 50-150 µm
and Figure 4 shows the size of a pollen particle compared to nanofibers. The elastic modulus of
polymeric nanofibers of less than 350 nm is found to be 1.0±0.2 Gpa.
7.12 .2Applications
Nanofibers have applications in medicine, including artificial organ components, tissue
engineering, implant material, drug delivery,[6]
wound dressing, and medical textile materials.
M.S University-D.D.C.E Unit V
Page 129
Recently, researchers have found that nanofiber meshes could be used to fight against the HIV-1
virus, and be able to be used as a contraception. In wound healing nanofibers assemble at the
injury site and stay put, drawing the body's own growth factors to the injury site. Protective
materials include sound absorption materials, protective clothings against chemical and
biological warfare agents, and sensor applications for detecting chemical agents. Nanofibers
have also been used in pigments for cosmetics. Applications in the textile industry include sport
apparel, sport shoes, climbing, rainwear, outerwear garments, baby diapers. Napkins with
nanofibers contain antibodies against numerous biohazards and chemicals that signal by
changing color
7.13.1 NANOCOMPOSITES
Nanocomposite is a multiphase solid material where one of the phases has one, two or three
dimensions of less than 100 nanometers (nm), or structures having nano-scale repeat distances
between the different phases that make up the material. In the broadest sense this definition can
include porous media, colloids, gels and copolymers, but is more usually taken to mean the solid
combination of a bulk matrix and nano-dimensional phase(s) differing in properties due to
dissimilarities in structure and chemistry. The mechanical, electrical, thermal, optical,
electrochemical, catalytic properties of the nanocomposite will differ markedly from that of the
component materials. Size limits for these effects have been proposed <5 nm
for catalytic activity, <20 nm for making a hard magnetic material soft, <50 nm for refractive
index changes, and <100 nm for achievingsuperparamagnetism, mechanical strengthening or
restricting matrix dislocation movement.
7.13.1 Ceramic-matrix nanocomposites
n this group of composites the main part of the volume is occupied by a ceramic, i.e. a chemical
compound from the group of oxides, nitrides, borides, silicides etc.. In most cases, ceramic-
matrix nanocomposites encompass a metal as the second component. Ideally both components,
the metallic one and the ceramic one, are finely dispersed in each other in order to elicit the
particular nanoscopic properties. Nanocomposite from these combinations were demonstrated in
improving their optical, electrical and magnetic properties [6]
as well as tribological, corrosion-
resistance and other protective properties.
Metal-matrix nanocomposites
Metal matrix nanocomposites can also be defined as reinforced metal matrix composites. This
type of composites can be classified as continuous and non-continuous reinforced materials. One
of the more important nanocomposites is Carbon nanotube metal matrix composites, which is an
emerging new material that is being developed to take advantage of the high tensile strength and
electrical conductivity of carbon nanotube materials. Critical to the realization of CNT-MMC
possessing optimal properties in these areas are the development of synthetic techniques that are
(a) economically producible, (b) provide for a homogeneous dispersion of nanotubes in the
metallic matrix, and (c) lead to strong interfacial adhesion between the metallic matrix and the
carbon nanotubes. In addition to carbon nanotube metal matrix composites, boron nitride
reinforced metal matrix composites and carbon nitride metal matrix composites are the new
research areas on metal matrix nanocomposites.
7.13.2. Polymer-matrix nanocomposites

M.S University-D.D.C.E Unit V
Page 130
By appropriately adding nanoparticulates to a polymer matrix can enhance its performance,
often dramatically, by simply capitalizing on the nature and properties of the nanoscale
filler (these materials are better described by the term nanofilled polymer composites ). This
strategy is particularly effective in yielding high performance composites, when good dispersion
of the filler is achieved and the properties of the nanoscale filler are substantially different or
better than those of the matrix.
Nanoparticles such as graphene, carbon nanotubes, molybdenum disulfide and tungsten disulfide
are being used as reinforcing agents to fabricate mechanically strong biodegradable polymeric
nanocomposites for bone tissue engineering applications. The addition of these nanoparticles in
the polymer matrix at low concentrations (~0.2 weight %) cause significant improvements in the
compressive and flexural mechanical properties of polymeric nanocomposites
A range of polymeric nanocomposites are used for biomedical applications such as tissue
engineering, drug delivery, cellular therapies. Due to unique interactions between polymer and
nanoparticles, a range of property combinations can be engineered to mimic native tissue
structure and properties. A range of natural and synthetic polymers are used to design polymeric
nanocomposites for biomedical applications including starch, cellulose, alginate, chitosan,
collagen, gelatin, and fibrin, poly(vinyl alcohol) (PVA), poly(ethylene glycol) (PEG),
poly(caprolactone) (PCL), poly(lactic-co-glycolic acid) (PLGA), and poly(glycerol sebacate)
(PGS). A range of nanoparticles including ceramic, polymeric, metal oxide and carbon-based
nanomaterials are incorporated within polymeric network to obtain desired property
combinations.
7.14 APPLICATIONS OF NANOCHEMISTRY IN VARIOUS FIELDS:
If nanochemistry various nanosized materials like quantum dots, nanoparticles,
nanoclusters, nanocrystallites, nanocomposites, carbon nanotubes are used in various fields,
Same of them are given in the table.
Nanomaterial Application
1) Nanocarbon tubes (CNTs) Electronic devices, fuel cells, wear resistant
rubber tyres, water proof cloth fibers, sports
equipments. Etc.
2) Nanowires Magnetic optical and electronic devices
3) Nanophosphors High resolution monitors
4) Nanoalumina and silica Superfine polishing technology
5) Nano iron oxide Disk drives, audio tapes and cosmetics
(lipstick)
6) Nano ZnO and TiO2 Sunscreens
7) Quantum dot of nano Pt Powerful catalyst
8) Aerogels Better insulation materials
14) Nanoreactors like micelles Adhesives and coatings
15) Nanocomposites Medicine (drug delivery system)
11) Nanocrystalline Ni High energy batteries with long life and less
frequent charging.
12) Nano ZrO2 and SiC Bio-compatible, suitable for artificial heart
valves due to low mass, high strength,
extreme harness, wear resistance, inertness

M.S University-D.D.C.E Unit V
Page 131
and corrosion resistance.
13) Semiconductor (ZnSe, ZnS, CdS, PbTe)
nanoparticles
More efficient solar cells, nanoelectronical
devices
SUGGESTED READINGS
Basic Physical Chemistry, by Wolfgang Schärtl - Bookboon , 2014 (ONLINE)
2. Atkins, P. de Paula, J. Physical Chemistry for the Life Sciences. pg 209-225. 2006. Oxford
Univeristy Press. New York.
3. Zumdahl, S. Zumdahl, S. Chemistry. Pg 215-220. 2007. Houghton Mifflin Company. New
Jersey.
4. Petrucci, Ralph H. General Chemistry Principles & Modern Applications. Pearson Prentice
Hall. New Jersey