development of erosion equations for sand entrained · pdf filedevelopment of erosion...
TRANSCRIPT

DEVELOPMENT OF EROSION EQUATIONS FOR SAND ENTRAINED IN LIQUIDS XI
November 2012
I. DEVELOPMENT OF EROSION EQUATIONS FOR SAND ENTRAINED IN LIQUIDS
1. INTRODUCTION
Oil and gas, produced from wells, usually contain impurities such as sand particles. Sand particles, transported by fluid flow through pipelines, impinge on the pipe walls and fittings and this action removes material from the wall and causes erosion damage. In order to prevent leakage and failure in pipelines, bends, tees and loss of production time, it is extremely crucial to be able to predict the erosion rates. The Erosion/Corrosion Research Center (E/CRC) at the University of Tulsa has conducted many studies developing models to predict erosion rates. The models developed by E/CRC are utilized in software called Sand Production Pipe saver (SPPS) in order to predict erosion rates for different operating conditions and flow geometries. This software is a very useful tool to predict erosion rates and the threshold velocity for the oil and gas industry. Threshold velocity is a flow velocity required to minimize erosion damage. Researchers at the E/CRC conducted a series of erosion experiments for different operating conditions and compared erosion measurements with Computational fluid Dynamics (CFD) results in order to show that erosion equations can be utilized in CFD codes to predict the erosion damage. A series of direct impingement erosion tests in gas were conducted to obtain an erosion ratio equation. Then this erosion ratio equation was implemented into CFD codes to obtain the erosion rates in either gas or liquid. Erosion equations developed based on experiments in gas flows predict the erosion rate in gas flows accurately. However, the erosion ratios in liquids or viscous fluids are under predicted. The goal of this research is to examine the validity of this assumption and to improve the under estimation of erosion rates caused by the current erosion equations in liquid dominated flows. Because erosion damages could occur in oil pipelines with viscosities higher than those of air, more research on the effects of viscosity on erosion rate is required. Erosion rates depend on many factors including particle impact speed and angle, properties of target material, particle size and shape, fluid properties and flow dynamics. Increasing the fluid viscosity can affect the flow dynamics and interaction between the carrier fluid/solid particles. Therefore, varying the viscosity results in different particle impact speeds and impact angles, which are significantly important in erosion behavior. Investigating these effects will result in developing erosion equations which can predict the erosion rates more accurately in liquids and viscous fluids. As previously mentioned, due to the lack of an accurate model for predicting erosion damage associated with viscous fluids and the need for a better understanding of the effect

2
November 2012
of viscosity on erosion, more research in this area is needed. Finally, the results and models extracted from this research will be used within SPPS1 to improve the accuracy of the software.
2. BACKGROUND
Erosion is a very complex phenomenon, since so many factors affect the erosion process. Meng and Ludema (1985) after studying all the existing erosion models in literature concluded, there is no universal model which utilizes for all the materials and operating conditions. In the erosion process, the target material which is imposed to particle impacts can be categorized as being either ductile or brittle. Finnie (1972) proposed that erosion mechanism for ductile materials is micro-cutting. In this process, at low impacting angles a particle impacts the surface of target material and forms the crater, then the crater removes by subsequent particle impacts. However, material loss during erosion in brittle materials is as a result of lateral and radial cracks. As mentioned earlier, there are so many factors which influence the erosion. It is widely accepted that the particle impact velocity is the most important factor. In many publications the relationship between the erosion rate and impact velocity proposed by an empirical power law as shown in Equation 2-1.
𝐸𝑅 ∝ 𝑉𝑛 (2-1) Although all important parameters that may contribute to erosion mechanism are still not well understood, most experimental data suggest that the velocity exponent lies in the range of 2.0 to 3.0. Particle impact angle is another important factor influencing the erosion rate. In many publications erosion rate has been presented as a function of particle impacting angle. This function depends on the properties of the eroded material. Therefore, many functions of particle impact angle have been published depend on whether the eroded material is either ductile or brittle. It should be noted that there is no single function which works for all the situations, so these functions should be applied carefully to predict erosion under various conditions.
1 Sand production pipe saver

DEVELOPMENT OF EROSION EQUATIONS FOR SAND ENTRAINED IN LIQUIDS XI
November 2012
Particle properties also have a great role in erosion rate. For instance, increasing the particle size may lead to higher erosion rate for particle sizes that are larger than a certain size. Erosion equation mentioned in Oka et al. (2005a, 2005b) included a term accounted for particle size which increases the erosion rate to a power of 0.19. But other data gathered in the literature may suggest that particle size does not affect erosion ratio (mass loss of specimen/mass of impacting particles) for particle sizes that are approximately larger than 100 microns. Although there is not a good correlation established between particle shape and erosion rate, in E/CRC erosion models, a particle shape factor exists which is 1.0 for sharp or angular particles, 0.5 for semi-rounded particles and 0.2 for rounded particles.
Carrier fluid properties are other important factors affecting erosion rate. Investigating the viscosity effect, one of the fluid properties, is the subject of the present work. Solid particles entrained in flowing fluids continuously interact with the surrounding fluid. Increasing the viscosity of the carrier fluid will tend to increase the drag force acting on a particle and the momentum exchange between particle and carrier fluid will be more efficient. Therefore, particles entrained in liquids are more likely to adjust to local changes and follow the streamlines while those in gas can easily cross fluid streamlines. This will cause significant change in erosion patterns according to the fluid properties.
In addition to experimental results, Computational Fluid Dynamics (CFD) is a powerful tool to predict the erosion rates in industrial applications. Previously, Zhang, et al. (2007) at the E/CRC utilized an erosion ratio equation extracted from erosion tests in gas, into a commercially available code to predict erosion rates in gas and water. Zhang et al. observed a relatively good agreement between experimental measurements and CFD results for air and water over a wide range of particle impacting velocities. But Zhang's work was limited to only one sand particle size, one velocity and direct impingement geometry for gas and water. Miska (2008) measured particle and liquid velocities for various viscosities in direct impinging jet geometry utilizing Laser Doppler Velocimetry (LDV). Miska's work verified the liquid and particle velocities calculated by CFD. Okita, et al. (2010) extended the work done by Zhang for different sand sizes and for various viscous liquids. Okita observed that CFD calculations deviate from experimental measurements as viscosity increases. Nidasanametla (2012) continued investigating the effect of viscosity and particle size on erosion ratio utilizing glass beads instead of sand particles. In CFD, particles are assumed to have rounded shape, and drag forces acting on particles are calculated for rounded shape particles. Because of this assumption in CFD simulations, Nidasanametla repeated the experiments with glass beads. Glass beads are round and produce less damage

4
November 2012
compared to sand particles, which has an angular shape. Similar to Okita, Nidasanametla's experiments showed that CFD results tend to underpredict the erosion ratio as compared with experimental data. Based on the aforementioned works from various researchers, there is a growing difference between CFD results and experiments as the viscosity increases. The objective of this work is to investigate effects of viscosity on erosion damage and to develop a model which can predict the erosion ratio in viscous liquids more accurately.
3. E/CRC Erosion Model Background
As already mentioned, there is no universal erosion equation for all materials to predict erosion rate as erosion is dependent on many factors. At E/CRC Zhang et al. proposed a new model for several materials. Equations 3-1 and 3-2 are called the E/CRC equation. Even though this equation developed for a particular material (carbon steels), it can be used for other materials if the constants C, n and angle function are adjusted.
𝐸𝑅 �𝑘𝑔𝑘𝑔� = 𝐹𝑠 .𝐶 . (𝐵𝐻)−0.59.𝑉𝑛 .𝐹(𝜃) (3-1)
𝐵𝐻 = (𝐻𝑣+0.1023)0.0108
(3-2)
where ER is the erosion ratio which is the ratio of mass loss of material to mass of impacting particles, C and n are empirical constants, V is the particle velocity, Fs is the particle shape factor (sharpness factor). Fs is 0.2 for spherical particles, 0.5 for semi-rounded particles and 1 for sharp particles. BH is the Brinnel hardness of the target material that is calculated on the basis of Vicker’s hardness, Hv of that material. F(θ) is the angle function. It should be noted that E/CRC investigators removed BH factor from Equation (3-2) when dealing with other materials than carbon steels. McLaury (1996) proposed F(θ) for carbon steel and aluminum as shown in Equation 3-3.
𝐹(𝜃) = 𝑎𝜃2 + 𝑏𝜃 (𝜃 ≤ 𝜃0) (3-3)
𝐹(𝜃) = 𝑥 cos2 sin(𝑤𝜃) + 𝑦 sin 2𝜃 + 𝑧 (𝜃 ≥ 𝜃0)
Zhang et al. (2006) obtained angle function for Inconel 625 as shown in Equation (3-4).
𝐹(𝜃) = 1.4234𝜃5 − 6.3283𝜃4 + 10.9327𝜃2 + 5.3983𝜃 (3-4)

DEVELOPMENT OF EROSION EQUATIONS FOR SAND ENTRAINED IN LIQUIDS XI
November 2012
Equation 3-4 is a polynomial equation and each coefficient is deduced based on erosion experiments conducted on Inconel 625. θ is the impact angle in radians. Okita, et al. (2011) developed another angle function (Equation 3-5) for aluminum and stainless steel based on experiments.
𝐹(𝜃) = 1𝑓
(sin𝜃)𝑛1 . [1 + 𝐻𝑣𝑛3 (1 − sin𝜃)]𝑛2 (3-5)
As earlier mentioned based on direct impinging jet experiments in air, (Okita, 2010) and (Nidasanametla, 2012) developed erosion ratio equations for sand and glass beads respectively. In order to develop erosion ratio equation, at first the slip between the gas and particle velocity was determined. Figure 3-1 shows particle velocity measured by LDV versus gas velocity measured by Pitot tube. This graph will determine the gas velocity necessary to produce the desired particle velocities during the measurements.
Figure 1: Particle Velocity vs. Gas Velocity (Okita, 2010)
Next, erosion ratios were measured with respect to different impact angles, then F(θ) extracted from the data. Figure 3-2 shows normalized erosion ratio Vs. impact angle for three different velocities (13, 24 and 42 m/s). It should be mentioned that the erosion ratios measured for all of these three different velocities have similar trend respect to impact angle.

6
November 2012
Due to this interesting property erosion ratio equations are applicable for a wide range of velocities. After measuring the erosion ratio in direct impinging jet geometry using air as carrier fluid, the coefficients of erosion ratio equations for Sand and glass beads were determined. Tables (3-1) and (3-2) shows coefficient of erosion ratio equations (3-2, 3-3 and 3-5) for sand and glass beads respectively.
Figure 3-2: Normalized Erosion Ratio vs. Impact Angle (Okita, 2010)

DEVELOPMENT OF EROSION EQUATIONS FOR SAND ENTRAINED IN LIQUIDS XI
November 2012
Table 3-1: Erosion Ratio Coefficient for Al 6061, SS 316 and Inconel, Particle Size= 150 µm (Okita, 2010)
Equation
Component Al 6061 SS 316 Inconel 625
Hv (GPa) 1.12 1.5 3.43 N 2.41 2.41 2.41 F 5.27 1.716 N/A n1 0.59 1.4 N/A n𝟐 3.6 1.64 N/A n3 2.5 2.6 N/A C 1.5E-07 1.42E-07 2.17E-07
Table 3-2: Erosion Ratio Coefficients for Al 6061 and Glass Beads in Three Different Size (50, 150 and 350 µm), (Nidasanametla, 2012)
Constants Particle Size
50 (µm) 150 (µm) 350 (µm)
A 0.3070 0.2722 0.2747 n1 1.9 0.85 1.38 n2 0.96 0.6 0.68 n3 35 44 44 C 2.55E-07 4.65E-07 2.80E-07
BH 110.3 110.3 110.3 Fs 0.2 0.2 0.2
Hv (GPa) 1.089 1.089 1.089 K 1.59009E-08 2.89957E-08 1.74598E-08
4. Experimental Measurement of Erosion for Sand Entrained in Liquids
In order to examine the effect of viscosity and particle size on erosion damage, the experiments were performed in a submerged direct impinging jet facility. Figure 4-1 shows the schematic of experimental facility used by Okita (2010) and Nidasanametla (2012) to measure the erosion ratio in submerged jet impact testing. The viscous liquid is prepared in a reservoir tank prior to experiments by mixing CMC (Carboxymethyl Cellulose) and water, but the CMC does not change the density significantly. Viscosities of the carrier fluid tested were measured by a viscometer. S a n d p a r t i c l e s a r e m i x e d
8
November 2012
w i t h l i q u i d i n t h e r e s e r v o i r t a n k . T h e v o l u m e r a t i o o f s a n d a n d l i q u i d i s 0 . 5 % f o r 1 5 0 a n d 3 0 0 μ m p a r t i c l e s f o r a l u m i n u m 6 0 6 1 . F o r 2 0 μ m p a r t i c l e s , v o l u m e r a t i o 1 % i s u s e d f o r a l u m i n u m 6 0 6 1 i n o r d e r t o o b t a i n m e a s u r a b l e e r o s i o n r a t e s . T h e s l u r r y m i x e r i s t u r n e d o n d u r i n g t h e m e a s u r e m e n t s i n o r d e r t o m a i n t a i n t h e h o m o g e n e i t y o f t h e m i x t u r e s . T h e m i x t u r e s o f s a n d a n d l i q u i d f l o w f r o m t h e r e s e r v o i r t a n k t o t h e p u m p a n d f r o m t h e p u m p t o t h e s t r a i g h t n o z z l e . T h e b y p a s s v a l v e i s u s e d t o c o n t r o l t h e f l o w r a t e s i n t h e s y s t e m d u r i n g t h e m e a s u r e m e n t s . T h e m i x t u r e e x i t s t h e n o z z l e a n d i m p i n g e s t h e t a r g e t w a l l a n d c a u s e s t h e e r o s i o n o n t h e c o u p o n , t h e m i x t u r e c i r c u l a t e s i n t h e s y s t e m . T h e n o z z l e a n d t a r g e t w a l l a r e c o m p l e t e l y s u b m e r g e d i n t h e m i x t u r e . T h e n o z z l e d i a m e t e r i s 8 m m . T h e d i s t a n c e f r o m t h e n o z z l e e x i t t o t h e t a r g e t w a l l i s 1 2 . 7 m m .

DEVELOPMENT OF EROSION EQUATIONS FOR SAND ENTRAINED IN LIQUIDS XI
November 2012
Figure 4-1: Schematic of Experimental Facility Used for Submerged Testing
I n t h e c u r r e n t s t u d y a s e r i e s o f e x p e r i m e n t s h a v e b e e n c o n d u c t e d w i t h 1 6 m / s a s a v e r a g e v e l o c i t y a t n o z z l e e x i t . A s e a r l i e r m e n t i o n e d , i n t h e p r e v i o u s e x p e r i m e n t s t h e f l u i d v e l o c i t y a t t h e n o z z l e e x i t w a s 1 0 m / s . T h i s i n c r e a s e i n v e l o c i t y h a s b e e n a c h i e v e d i n o r d e r t o s t u d y t h e e f f e c t s o f R e y n o l d s n u m b e r a n d v e l o c i t y p r o f i l e a t t h e n o z z l e e x i t . B e c a u s e i n h i g h e r v i s c o s i t i e s R e y n o l d s n u m b e r d e c r e a s e s a n d f l o w r e g i m e m a y c h a n g e f r o m t u r b u l e n t i n t o l a m i n a r a n d t h i s c a n a f f e c t t h e v e l o c i t y p r o f i l e a t n o z z l e e x i t . B u t c o m p a r e d t o p r e v i o u s r e s u l t s w i t h
Target
Nozzle
Reservoir tank
Pump
Slurry mixer
Valve
Coupo

10
November 2012
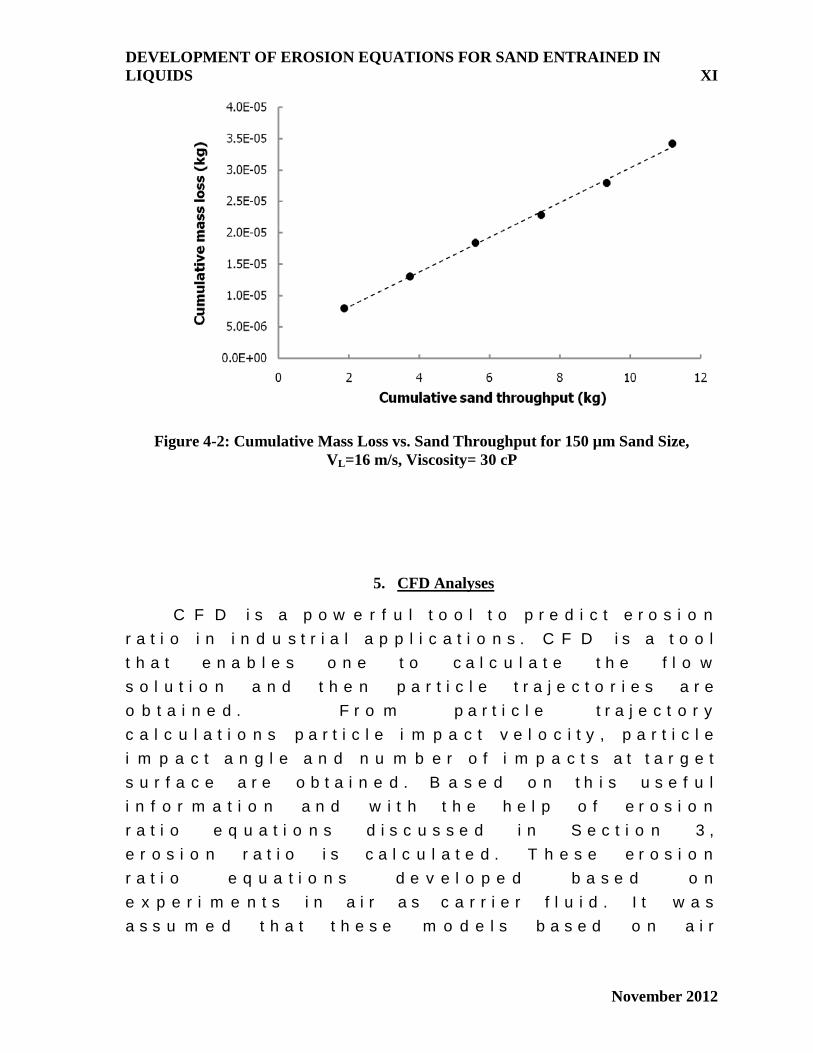
v e l o c i t y o f 1 0 m / s a t n o z z l e e x i t , t h e r e i s n o c o n s i d e r a b l e e f f e c t d u e t o t h i s v e l o c i t y p r o f i l e c h a n g e a t n o z z l e e x i t . T a b l e 4 - 1 s h o w s t h e e r o s i o n r a t i o m e a s u r e d f o r A l u m i n u m 6 0 6 1 , 1 6 m / s a t n o z z l e e x i t . A s a m p l e c u m u l a t i v e m a s s l o s s o f m a t e r i a l i s s h o w n w i t h s a n d w e i g h t i n F i g u r e 4 - 2 . T h i s g r a p h i s f o r V L = 1 6 m / s , O K # 1 ( s a n d s i z e = 1 5 0 µ m ) a n d v i s c o s i t y = 3 0 c P . A s s h o w n i n t h i s g r a p h , t h e m a s s l o s s o f m a t e r i a l h a s a l i n e a r r e l a t i o n s h i p w i t h t h e w e i g h t o f s a n d i n j e c t e d . A l l o f t h e t e s t s b e h a v e i n t h i s m a n n e r . D e t a i l s o f e x p e r i m e n t a l d a t a a r e p r e s e n t e d i n A p p e n d i x A .
Table 4-1: Measured Erosion Ratio (kg/kg) for Aluminum 6061 at Different Viscosities (1, 10 and 30 cP)
Measured erosion ratio (kg/kg)
Viscosity (cP) P a r t i c l e s i z e 1 5 0 µ m 3 0 0 µ m
1 3 . 9 6 2 7 E - 0 6 1 . 1 6 6 2 E - 0 5 10 3 . 3 2 4 1 E - 0 6 8 . 9 3 5 3 E - 0 6 30 2 . 8 2 0 7 E - 0 6 9 . 0 1 7 3 E - 6
DEVELOPMENT OF EROSION EQUATIONS FOR SAND ENTRAINED IN LIQUIDS XI
November 2012
Figure 4-2: Cumulative Mass Loss vs. Sand Throughput for 150 µm Sand Size, VL=16 m/s, Viscosity= 30 cP
5. CFD Analyses
C F D i s a p o w e r f u l t o o l t o p r e d i c t e r o s i o n r a t i o i n i n d u s t r i a l a p p l i c a t i o n s . C F D i s a t o o l t h a t e n a b l e s o n e t o c a l c u l a t e t h e f l o w s o l u t i o n a n d t h e n p a r t i c l e t r a j e c t o r i e s a r e o b t a i n e d . F r o m p a r t i c l e t r a j e c t o r y c a l c u l a t i o n s p a r t i c l e i m p a c t v e l o c i t y , p a r t i c l e i m p a c t a n g l e a n d n u m b e r o f i m p a c t s a t t a r g e t s u r f a c e a r e o b t a i n e d . B a s e d o n t h i s u s e f u l i n f o r m a t i o n a n d w i t h t h e h e l p o f e r o s i o n r a t i o e q u a t i o n s d i s c u s s e d i n S e c t i o n 3 , e r o s i o n r a t i o i s c a l c u l a t e d . T h e s e e r o s i o n r a t i o e q u a t i o n s d e v e l o p e d b a s e d o n e x p e r i m e n t s i n a i r a s c a r r i e r f l u i d . I t w a s a s s u m e d t h a t t h e s e m o d e l s b a s e d o n a i r
12
November 2012
t e s t i n g a r e s u i t a b l e t o p r e d i c t e r o s i o n r a t i o i n v i s c o u s l i q u i d s . B u t , a s w a s d i s c u s s e d e a r l i e r , p a s t s t u d i e s s h o w e d t h a t t h e r e i s a s i g n i f i c a n t d e v i a t i o n b e t w e e n e r o s i o n r a t i o p r e d i c t e d b y C F D ( e r o s i o n m o d e l s b a s e d o n a i r t e s t i n g ) a n d m e a s u r e d o n e f o r l i q u i d s w i t h h i g h e r v i s c o s i t i e s . F i g u r e s 5 - 1 a n d 5 - 2 r e p r e s e n t t h e d i f f e r e n c e b e t w e e n t h e p r e v i o u s l y m e a s u r e d a n d p r e d i c t e d e r o s i o n r a t i o a s v i s c o s i t y i n c r e a s e s . C F D s i m u l a t i o n s a r e p e r f o r m e d f o r d i r e c t i m p i n g i n g j e t g e o m e t r y a n d t h e s a m e f l o w s i t u a t i o n m e n t i o n e d i n S e c t i o n 4 f o r e x p e r i m e n t s . F i g u r e 5 - 3 s h o w s t h e c o m p a r i s o n o f m e a s u r e d a n d p r e d i c t e d e r o s i o n r a t i o b y C F D a t h i g h e r v e l o c i t y a t n o z z l e e x i t ( 1 6 m / s ) . T h e r e s u l t s s h o w t h a t t h e r e i s c o n s i d e r a b l e d i f f e r e n c e b e t w e e n e x p e r i m e n t a l r e s u l t s a n d c o m p u t a t i o n a l o n e e s p e c i a l l y w i t h i n c r e a s e i n t h e l i q u i d v i s c o s i t y .
F i g u r e 5 - 4 s h o w s t h e g r i d a n d b o u n d a r y c o n d i t i o n s u s e d f o r t h e C F D s i m u l a t i o n s . I n o r d e r t o e v a l u a t e C F D c a l c u l a t i o n s , t h e e f f e c t o f g r i d s i z e i n r a d i a l a n d a x i a l d i r e c t i o n i s i n v e s t i g a t e d . T h e d i r e c t i m p i n g i n g j e t g e o m e t r y i s d i v i d e d i n t o 4 r e g i o n s a n d t h e g r i d s i z e i n e a c h z o n e i s c h a n g e d t o s e e t h e e f f e c t o f g r i d s i z e o n p r e d i c t e d e r o s i o n d a m a g e . I n F i g u r e 5 - 5 e a c h z o n e i s s h o w n .

DEVELOPMENT OF EROSION EQUATIONS FOR SAND ENTRAINED IN LIQUIDS XI
November 2012
Figure 5-1: Comparison of Measured and Predicted Erosion Ratio by CFD (Sand Size= 150 µm, VL=10 m/s) – Okita 2010
Figure 5-2: Comparison of Measured and Predicted Erosion Ratio by CFD (Glass Bead, Size= 150 µm, VL=10 m/s) – Nidasanametla 2012

14
November 2012
Figure 5-3: Comparison of Measured and Predicted Erosion Ratio by CFD (Sand Size= 150 µm, VL=16 m/s)

DEVELOPMENT OF EROSION EQUATIONS FOR SAND ENTRAINED IN LIQUIDS XI
November 2012
Figure 5-4: Grid and Boundary Conditions in CFD Simulation of Impinging Jet
Nozzle exit
Axis of symmetry
Target wall
Pressure-Outlet
Nozzle - Wall

16
November 2012
Figure 5-5: Computational Domain
S i m u l a t i o n s h a v e b e e n o b t a i n e d f o r 3
d i f f e r e n t c a s e s . I n e a c h c a s e t h e g r i d c o u n t i s c h a n g e d i n r e g i o n 1 a n d 2 ( r a d i a l d i r e c t i o n ) . T a b l e 5 - 1 r e p r e s e n t s t h e g r i d c o u n t s f o r e a c h c a s e . F i g u r e 5 - 6 s h o w s t h a t t h e r e i s n o t m u c h d i f f e r e n c e i n e r o s i o n r a t i o p r e d i c t e d w i t h d i f f e r e n t g r i d c o u n t s i n t h e r a d i a l d i r e c t i o n .
Table 5-1: Grid Counts for Each Case (Radial Direction)
Region Case
Grid count
1 2 3 4
1 30 60 50 30 2 40 75 50 30 3 55 90 50 30
1
2
3
4
Radial
Axial

DEVELOPMENT OF EROSION EQUATIONS FOR SAND ENTRAINED IN LIQUIDS XI
November 2012
Figure 5-6: Predicted Erosion Ratio Calculated with Different Grid Counts in Radial Direction (Sand Size 150 µm, VL=16 m/s)
S i m i l a r l y T a b l e 5 - 2 a n d F i g u r e 5 - 7 r e p r e s e n t t h e r e s u l t s f o r d i f f e r e n t g r i d c o u n t s i n t h e a x i a l d i r e c t i o n . A g a i n , t h e s i m u l a t e d C F D r e s u l t s d i d n o t c h a n g e s i g n i f i c a n t l y .
Table 5-2: Grid Counts for Each Case (Axial Direction)
Region Case
Grid count
1 2 3 4
1 30 60 35 20 2 30 60 50 30 3 30 60 65 40

18
November 2012
Figure 5-7: Predicted erosion ratio calculated with different grid counts in axial direction (Sand size 150 µm, VL=16 m/s)
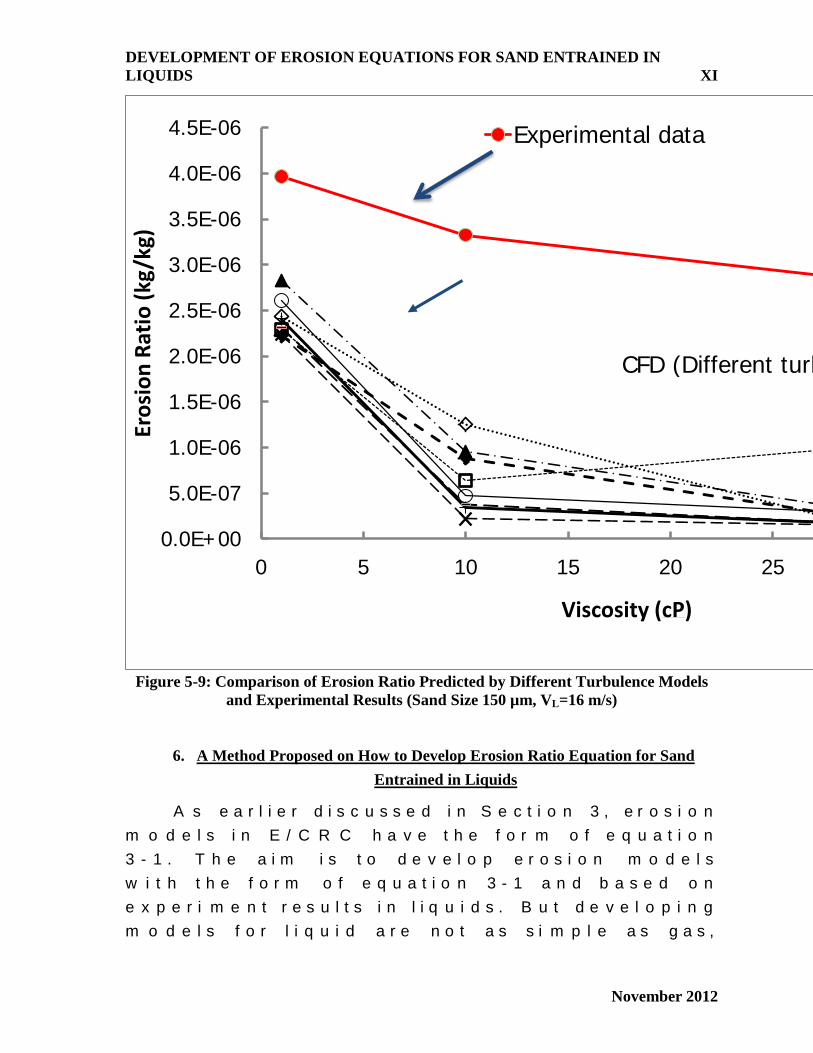
I n c u r r e n t s t u d y , t h e e f f e c t s o f d i f f e r e n t t u r b u l e n c e m o d e l s t h a t a r e u s e d i n f l o w c a l c u l a t i o n s o n e r o s i o n r a t i o c a l c u l a t e d b y C F D i s a l s o i n v e s t i g a t e d . E r o s i o n r a t i o c a l c u l a t e d b y d i f f e r e n t t u r b u l e n c e m o d e l s ( S t a n d a r d K - ε , K - ω , R N G K - ε N o n -E q u i l i b r i u m w a l l f u n c t i o n , R N G K - ε e n h a n c e d w a l l t r e a t m e n t , L o w R e n u m b e r K -ε , R e y n o l d s s t r e s s m o d e l ( R S M ) a n d K - ε r e a l i z a b l e a r e c o m p a r e d i n F i g u r e 5 - 8 . T h e r e i s s o m e d i f f e r e n c e b e t w e e n e r o s i o n r a t i o c a l c u l a t e d b y d i f f e r e n t t u r b u l e n c e m o d e l s , b u t c o m p a r e d t o e x p e r i m e n t a l r e s u l t s , t u r b u l e n c e m o d e l s d o n o t h a v e c o n s i d e r a b l e e f f e c t o n p r e d i c t e d e r o s i o n r a t i o . F i g u r e 5 - 9 r e p r e s e n t s t h i s f a c t .
P r e v i o u s l y s i g n i f i c a n t w o r k h a s b e e n p e r f o r m e d i n o r d e r t o p r e d i c t e r o s i o n r a t i o i n v i s c o u s l i q u i d s a n d s e e t h e e f f e c t o f v i s c o s i t y

DEVELOPMENT OF EROSION EQUATIONS FOR SAND ENTRAINED IN LIQUIDS XI
November 2012
o n e r o s i o n d a m a g e . C a r e f u l e r o s i o n r e s t i n g c o n d u c t e d i n g a s a s c a r r i e r f l u i d a n d t h e n e r o s i o n m o d e l s d e v e l o p e d b a s e d o n t h e s e t e s t s . A f t e r t h a t e r o s i o n m o d e l s i m p l e m e n t e d i n C F D c o d e s w i t h l i q u i d s a s c a r r i e r f l u i d . C F D r e s u l t s o b t a i n e d f o r l i q u i d s c o m p a r e d w i t h e x p e r i m e n t a l r e s u l t s o b t a i n e d f o r l i q u i d a s w e l l . I t w a s o b s e r v e d t h a t C F D r e s u l t s u n d e r e s t i m a t e t h e e x p e r i m e n t a l d a t a , e s p e c i a l l y a s v i s c o s i t y i n c r e a s e s . S e v e r a l p a r a m e t e r s w e r e c h a n g e d i n e x p e r i m e n t a n d C F D c a l c u l a t i o n s , b u t t h e r e i s s t i l l d e v i a t i o n b e t w e e n t h e p r e d i c t e d e r o s i o n r a t i o b y C F D a n d e x p e r i m e n t a l r e s u l t s . A s m e n t i o n e d e a r l i e r , i t w a s a s s u m e d t h a t t h e e r o s i o n m o d e l s d e v e l o p e d f r o m g a s t e s t i n g i s a l s o s u i t a b l e f o r p r e d i c t i n g e r o s i o n r a t i o i n l i q u i d s . B u t t h e d i f f e r e n c e b e t w e e n C F D a n d e x p e r i m e n t a l r e s u l t s i n d i c a t e s t h a t a p p l y i n g t h e s a m e e r o s i o n m o d e l f o r a i r a n d l i q u i d m a y n o t b e a n a c c u r a t e a s s u m p t i o n a n d e r o s i o n m o d e l s f o r l i q u i d s s h o u l d b e d e v e l o p e d i n d e p e n d e n t l y .

20
November 2012
Figure 5-8: Effect of Different Turbulence Models on Erosion Predicted by CFD (Sand
Size 150 µm, VL=16 m/s)
DEVELOPMENT OF EROSION EQUATIONS FOR SAND ENTRAINED IN LIQUIDS XI
November 2012
Figure 5-9: Comparison of Erosion Ratio Predicted by Different Turbulence Models
and Experimental Results (Sand Size 150 µm, VL=16 m/s)
6. A Method Proposed on How to Develop Erosion Ratio Equation for Sand
Entrained in Liquids
A s e a r l i e r d i s c u s s e d i n S e c t i o n 3 , e r o s i o n m o d e l s i n E / C R C h a v e t h e f o r m o f e q u a t i o n 3 - 1 . T h e a i m i s t o d e v e l o p e r o s i o n m o d e l s w i t h t h e f o r m o f e q u a t i o n 3 - 1 a n d b a s e d o n e x p e r i m e n t r e s u l t s i n l i q u i d s . B u t d e v e l o p i n g m o d e l s f o r l i q u i d a r e n o t a s s i m p l e a s g a s ,
0.0E+00
5.0E-07
1.0E-06
1.5E-06
2.0E-06
2.5E-06
3.0E-06
3.5E-06
4.0E-06
4.5E-06
0 5 10 15 20 25
Eros
ion
Ratio
(kg/
kg)
Viscosity (cP)
Experimental data
CFD (Different turb

22
November 2012
b e c a u s e o f t h e i n t e r a c t i o n b e t w e e n t h e p a r t i c l e s a n d c a r r i e r f l u i d t h a t a f f e c t p a r t i c l e v e l o c i t y a n d p a r t i c l e i m p a c t a n g l e a s t h e p a r t i c l e s a r e i m p a c t i n g t h e s p e c i m e n s . T h e r e f o r e i t i s n e c e s s a r y t o u s e t h e C F D r e s u l t s a s w e l l a s e x p e r i m e n t a l d a t a . T h e p a r t i c l e i m p a c t v e l o c i t y , p a r t i c l e i m p a c t a n g l e a n d e r o s i o n d e p t h i n d i f f e r e n t l o c a t i o n s o f t a r g e t s u r f a c e i s t h e i n f o r m a t i o n r e q u i r e d t o d e v e l o p a m o d e l w i t h t h e f o r m o f e q u a t i o n 3 - 1 f o r l i q u i d s . T h e a v e r a g e p a r t i c l e i m p a c t v e l o c i t y a n d a n g l e i n d i f f e r e n t l o c a t i o n s o f t a r g e t s u r f a c e c o u l d b e o b t a i n e d f r o m C F D c a l c u l a t i o n s . F u r t h e r m o r e , t h e e r o s i o n d e p t h i n f o r m a t i o n i n d i f f e r e n t l o c a t i o n c o u l d b e k n o w n f r o m 3 D p r o f i l o m e t e r y s c a n o f c o u p o n s p e c i m e n . F i g u r e 6 - 1 s h o w s t h e 3 D p r o f i l o m e t e r y s c a n o f a s a m p l e c o u p o n a f t e r e r o s i o n . I t i s k n o w n t h a t p a r t i c l e s w i t h a c a l c u l a t e d θ d e g r e e a n d s p e e d V i m p a c t a t a c e r t a i n d i s t a n c e X ( m m ) f r o m t h e s t a g n a t i o n p o i n t c a n c a u s e a n e r o s i o n d e p t h ( µ m ) a t t h e t a r g e t s u r f a c e . B a s e d o n t h i s i n f o r m a t i o n t h e e r o s i o n m o d e l f o r l i q u i d s c o u l d b e d e v e l o p e d .
Nozzle

DEVELOPMENT OF EROSION EQUATIONS FOR SAND ENTRAINED IN LIQUIDS XI
November 2012
7. Conclusions and future work
A s m e n t i o n e d e a r l i e r e r o s i o n c a l c u l a t i o n s u s i n g C F D c o d e s b a s e d o n e r o s i o n e q u a t i o n d e v e l o p e d i n a i r t e s t i n g a p p e a r s t o d e v i a t e f r o m e x p e r i m e n t a l m e a s u r e m e n t s a s v i s c o s i t y o f l i q u i d i n c r e a s e s . T h e r e f o r e i t m a y b e m o r e a p p r o p r i a t e t o a l s o d e v e l o p m o d e l s f o r l i q u i d s i n d e p e n d e n t l y . I n l a s t s e c t i o n i t w a s d i s c u s s e d t h a t h o w t o d e v e l o p m o d e l s e s p e c i a l l y f o r l i q u i d s .
F o r f u t u r e w o r k t h e m o d e l f o r l i q u i d s w i l l b e d e v e l o p e d b a s e d o n a c o m b i n a t i o n o f C F D a n d e x p e r i m e n t a l d a t a . T o v a l i d a t e t h i s m o d e l , i t w i l l b e u t i l i z e d i n d i f f e r e n t g e o m e t r i e s a n d v i s c o s i t i e s a n d r e s u l t s w i l l b e c o m p a r e d w i t h m e a s u r e d d a t a .
REFRENCES
Finnie, I., "Some observations on the erosion of ductile materials", Wear, 19, 1972.
McLaury, B., 1996, Predicting Solid Particle Erosion Resulting from Turbulent Fluctuations in Oilfield Geometries, PhD. Thesis, The University of Tulsa, 1996.
Erosion depth
Target surface Figure 6-1: Particle Impact Velocity, Particle Impact Angle and
Erosion Depth on a Target Surface
24
November 2012
Meng, H.S., Ludema, K.C., "Wear models and predictive equations: their form and content", Wear 181-183 (1995) 443-457.
Miska, S., "Particle and Fluid Velocity Measurements for Viscous Liquids in a Direct Impingement Flow Resulting in Material Erosion", Masters of Science Thesis, The University of Tulsa, 2008.
Nidasanametla, A. S., "Effects of viscosity, particle size and shape on erosion measurements and predictions", Masters of Science Thesis, The University of Tulsa, 2012.
Oka, Y.I., Okamura, K., and Yoshida, T., “Practical Estimation of Erosion Damage caused by Solid Particle Impact, Part 1: Effects of Impact Parameters on a Predictive Equation”, Wear, 259, 2005.
Oka, Y.I., and Yoshida, T., “Practical Estimation of Erosion Damage caused by Solid Particle Impact, Part 2: Mechanical Properties of Materials directly associated with Erosion Damage", Wear, 259, 2005.
Okita, R., "Effect of Viscosity and Particle Size on Erosion Measurements and Predictions", Masters of Science Thesis, The University of Tulsa, 2010.
Okita, R., "Experimental and Computational Investigations to Evaluate the Effects of Fluid Viscosity and Particle Size on Erosion Damage", Journal of Fluid Engineering, 134, 2012
Zhang, Y., Reuterfors, E.P., McLaury, B.S., Shirazi, S.A., Rybicki, E.F., "Comparison of Computed and Measured Particle Velocities and Erosion in Water and Air Flows", Wear, 263, 2007.
Appendix A
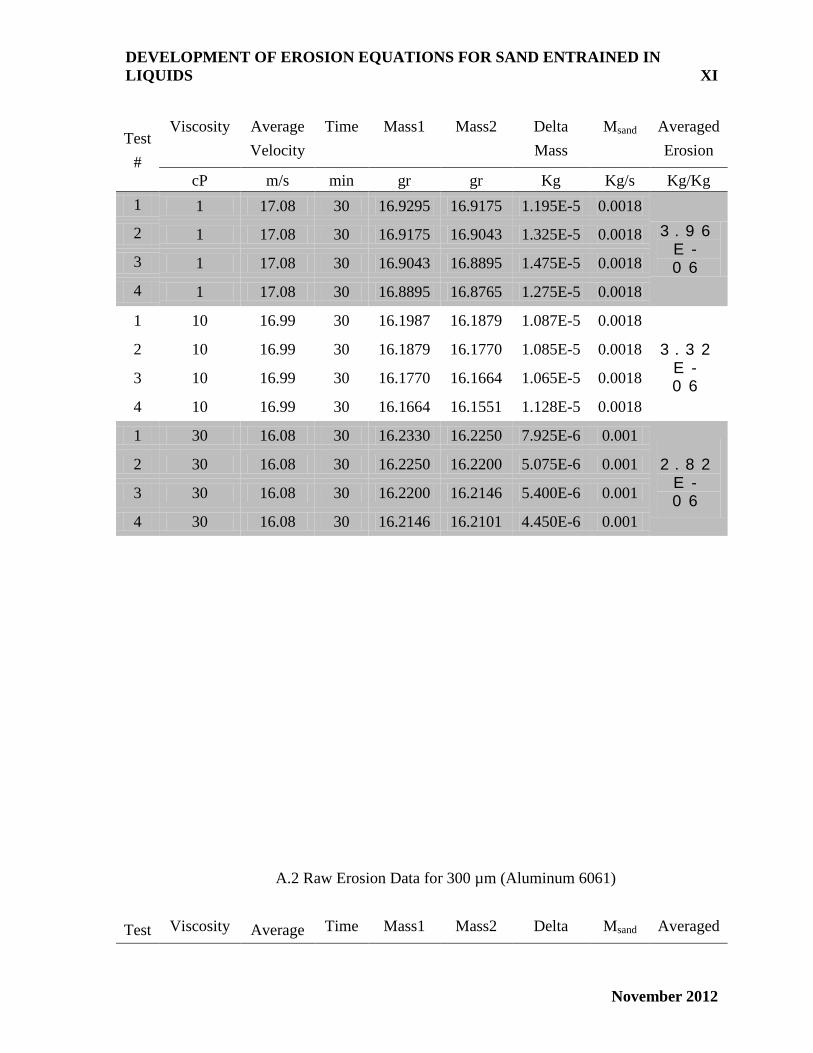
A.1 Raw Erosion Data for 150 µm (Aluminum 6061)
DEVELOPMENT OF EROSION EQUATIONS FOR SAND ENTRAINED IN LIQUIDS XI
November 2012
Test#
Viscosity Average Velocity
Time Mass1 Mass2 Delta Mass
Msand Averaged Erosion
cP m/s min gr gr Kg Kg/s Kg/Kg 1 1 17.08 30 16.9295 16.9175 1.195E-5 0.0018
3 . 9 6E -0 6
2 1 17.08 30 16.9175 16.9043 1.325E-5 0.0018
3 1 17.08 30 16.9043 16.8895 1.475E-5 0.0018
4 1 17.08 30 16.8895 16.8765 1.275E-5 0.0018
1 10 16.99 30 16.1987 16.1879 1.087E-5 0.0018
3 . 3 2E -0 6
2 10 16.99 30 16.1879 16.1770 1.085E-5 0.0018
3 10 16.99 30 16.1770 16.1664 1.065E-5 0.0018
4 10 16.99 30 16.1664 16.1551 1.128E-5 0.0018
1 30 16.08 30 16.2330 16.2250 7.925E-6 0.001
2 . 8 2E -0 6
2 30 16.08 30 16.2250 16.2200 5.075E-6 0.001
3 30 16.08 30 16.2200 16.2146 5.400E-6 0.001
4 30 16.08 30 16.2146 16.2101 4.450E-6 0.001
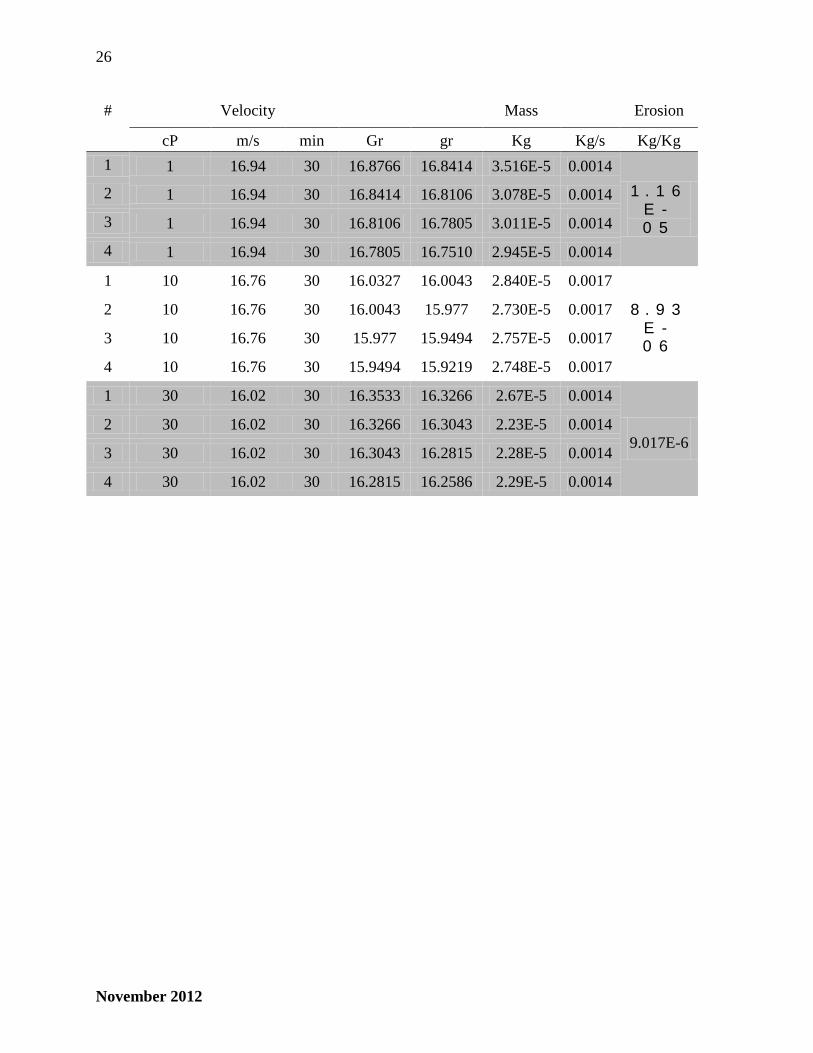
A.2 Raw Erosion Data for 300 µm (Aluminum 6061)
Test Viscosity Average Time Mass1 Mass2 Delta Msand Averaged
26
November 2012
# Velocity Mass Erosion
cP m/s min Gr gr Kg Kg/s Kg/Kg 1 1 16.94 30 16.8766 16.8414 3.516E-5 0.0014
1 . 1 6E -0 5
2 1 16.94 30 16.8414 16.8106 3.078E-5 0.0014
3 1 16.94 30 16.8106 16.7805 3.011E-5 0.0014
4 1 16.94 30 16.7805 16.7510 2.945E-5 0.0014
1 10 16.76 30 16.0327 16.0043 2.840E-5 0.0017
8 . 9 3E -0 6
2 10 16.76 30 16.0043 15.977 2.730E-5 0.0017
3 10 16.76 30 15.977 15.9494 2.757E-5 0.0017
4 10 16.76 30 15.9494 15.9219 2.748E-5 0.0017
1 30 16.02 30 16.3533 16.3266 2.67E-5 0.0014
9.017E-6 2 30 16.02 30 16.3266 16.3043 2.23E-5 0.0014
3 30 16.02 30 16.3043 16.2815 2.28E-5 0.0014
4 30 16.02 30 16.2815 16.2586 2.29E-5 0.0014