air-entrained concrete: relationship between thermal ... · air-entrained concrete: relationship...
TRANSCRIPT
Journal of Civil Engineering and Architecture 12 (2018) 507-517 doi: 10.17265/1934-7359/2018.07.005
Air-entrained Concrete: Relationship between Thermal
Conductivity and Pore Distribution Analyzed by X-Ray
Tomography
A. P. Peruzzi1, J. A. Rossignolo2 and H. Kahn3
1. Faculty of Civil Engineering, Universidade Federal de Uberlandia, Minas Gerais 38400-902, Brazil
2. Faculty of Science and Food Engineering of Pirassununga, USP, São Paulo 13635-900, Brazil
3. Department of Mining and Petroleum Engineering, Polytechnic School, USP, São Paulo 05508-010, Brazil
Abstract: The thermal conductivity values of ordinary concrete can be adjusted to those prescribed in constructions by entraining air bubbles to reduce the density of concrete in order to achieve good thermal insulation. This paper concerns the analysis of air bubble distribution in concrete obtained by micro X-ray µCT (computed tomography) and correlates it with its thermal conductivity (k). The samples were prepared of ordinary concrete varying the density by air-entraining additives, ranging between 2,277 kg/m3 and 1,779 kg/m3, aiming to correlate the mechanical properties and k with the characteristics of the bubble distribution. The results show that air-entrainment leads to viable use of this material as sealer to achieve good thermal insulation, and it can be adjusted, but there seems to be a limit to air entraining. By analysis of the µCT images, it was possible to correlate the more quantity of bubbles of smaller diameter with the minor k, in dry or wet state, and to prove that there is a limit in the entrapped air content, and if it is exceeded, the coalescence occurs. Key words: Concrete, pore size distribution, thermal analysis, microstructure, image analysis.
1. Introduction
Many factors have to be taken into account during
the project design of a building, parameters such as the
sun orientation and wind predominance, position and
size of the doors and windows, shading, etc., but the
thermal characteristics of the building envelope largely
influence the thermal and energy performance of
buildings [1]. Thus, in addition to the mechanical
parameters (compressive strength, Young’s modulus,
density, etc.), one should also consider the water vapor
absorption, transmission and Thermal conductivity (k),
etc.
The use of “cast-in-situ reinforced concrete walls” as
exterior sealer represents an economical and quick
alternative to masonry or panel systems due to its
versatility. However, ordinary concrete has high k,
Corresponding author: A. P. Peruzzi, PhD, associate professor; research fields: construction materials, and construction systems.
value that represents disadvantage if compared to
materials considered as of good thermal performance.
On average, the k on conventional concrete (at room
temperature) ranges between 1.4 W/m.K and 3.6
W/m.K [2, 3], in that case the use of concrete in walls
requires adjusting its thermal performance to the one
required in buildings and is possible to make the
properties of concrete meet the construction
requirement by varying material parameters such as
cement past composition, foam size and volume
friction [4]. A k about 0.8 W/m.K can be considered
appropriate to use on concrete utilized in walls as
sealing.
In concrete, as it occurs with the other porous
construction materials, heat transfer is dominated by
thermal conduction [4] and it happens by two ways: by
conduction through the solid phase of concrete, usually
called “skeleton”, composed of aggregate and cement
paste, or by flow (water or air) through the voids of
D DAVID PUBLISHING
Air-entrained Concrete: Relationship between Thermal Conductivity and Pore Distribution Analyzed by X-Ray Tomography
508
concretes [5]. Thus, the density of concrete can be
decreased by using light aggregates or air-entrained
concrete (as in this work) in which air-bubbles are
entrapped in the mortar matrix by means of a suitable
aerating agent. Air-entrained concrete can be classified
as NAAC (non-autoclaved aerated concrete) or AAC
(autoclaved aerated concrete) based on the curing
method. While the AAC is fabricated from the
aluminum powder and cement (or lime) reaction
(forming H2 bubble), with added sand and water by
autoclave process of curing, NAAC is made from an
ordinary concrete to which bubbles of air are entrained
by adding air-entraining additive (Eair) [6].
The good thermal insulation is more evident in the
AAC that has a density ranging between 500 kg/m3 and
1,000 kg/m3, but it is difficult to fulfill the structural
function for this material due to the limitations imposed
by the its low mechanical resistance. Using
air-entraining methods in ordinary concrete (NAAC),
as was the object of this work, it is possible to obtain
density values ranging between 1,800 kg/m3 and 2,200
kg/m3 and, consequently, lower k values and, in
addition, get a structural concrete produced cast-in-situ
because the appropriate relationship between
“air-entrained” and “mechanical parameters required”
can be controlled during concrete manufacturing [6].
Regarding compressive strength (fc) and the bulk
density (γ) of concrete the EF (efficiency factor) has
been used to classify a structural lightweight concrete,
as Eq. (1):
EF = fc / γ (MPa.dm3/kg) (1)
In this paper, mechanical properties and thermal
performance are correlated through the value EF and k.
Concerning the empty spaces in ordinary concrete,
some air is always introduced during its mixing and
transport, and normally taken out at the vibration. The
“capillary pores” are those originated from the
evaporation of water and, it represents risks to the
durability of the reinforced concrete due to their
connectivity. A higher empty space volume leads to
lower density and k, but this can put the durability of
structural concrete at risk if the bubbles are large or
connected. On the other hand, purposely entrained air
bubbles (as in NAAC) are spherical, stable, elastic and
have a typical distribution with diameters ranging from
10 μm to 500 μm [7], and supposedly are not connected.
Regarding the concrete used in cast-in-situ reinforced
walls, it has greater fluidity and the air bubbles can
move more freely, enabling their coalescence and/or
rupturing [8] making their connection possible and
denoting risks to the durability. Foamed concrete with
higher air content tends to result in larger and
connected air bubbles because there is not enough mass
to prevent the air voids from coalescing [4]. Therefore,
a greater number of small bubbles, unconnected,
represent an effective way to decrease concrete density
and k without compromising durability. Smaller pores
have substantial influence in governing k, for example,
the increase of bubbles with diameter around 50 µm
leads to a reduction in Thermal conductivity. Also the
correlation between thermal performance [9] and
diameter creates better results when the later is 50 µm
instead of 90 µm. This paper aims to quantify the
number of bubbles, their diameter and volume (bubbles
smaller than 500 μm are considered “purposely
entrapped air” while the bigger ones are considered
“occasionally entrapped air” or “from coalescence” of
smaller bubbles), seeking the correlation how a greater
amount of small bubbles influences the decrease of the
k value of concrete under different moisture
conditions.
To determine the quantity and the characteristics of
the entrained air bubbles in hardened concrete, the
literature mentions several methods: SEM (scanning
electron microscopy), MIP (mercury intrusion
porosimetry), automatic image analysis (by special
video camera system and computing/digitizing
techniques) and gas permeability [6]; stereoscopic
microscope (EN 480-11) and CT (computed
tomography) [9]. Hilal, Thom and Dowson [10] made
an interesting study on pore size distribution of foamed
concrete by optical microscope treating the foam with
Air-entrained Concrete: Relationship between Thermal Conductivity and Pore Distribution Analyzed by X-Ray Tomography
509
bitumen emulsion and could see by clear image the
bubbles merged and its shape and distribution.
In this research, for the microstructural analysis,
micro X-ray computed tomography (µCT) was the
chosen method because it provides a reconstruction of
the exact three-dimensional (3D) position of all objects
of interest, and derive air bubbles parameters not
available to traditional 2D test methods [11] with a
quality close to real. This method has an advantage
over conventional microstructural analysis methods
(e.g. optical microscope, SEM) which normally require
fracturing or polishing of samples, changing the
internal structure. We highlight that, in this study, the
samples were prepared specially for the analysis by
µCT instead of extracted by cutting them from a larger
sample, and thus there was no change in the original
structure of the bubbles. We have studied images
obtained by µCT to establish how the diameter
distribution and quantity of the air bubbles influence
the value of the thermal conductivity in concretes with
different bulk density (γ) obtained by the use of air
entraining additives (Eair) and under different moisture
contents.
The moisture content was important to study
because, in addition to temperature, the thermal
conductivity is influenced by the percentage of
moisture present in the pores of the material, increasing
as moisture content increases [12]. The concrete
samples were obtained by varying the mixing time to
control the amount of entrained air, and this procedure
was performed because the mixing characteristics have
a dominant influence on the density, distribution, shape
and size of the air bubbles created [13].
2. Experimental Procedure
2.1 Materials and Methods
An ordinary concrete mix, called REF (reference),
was prepared with OPC (ordinary Portland cement)
conforming to the Type III (ASTM C150), sand
(maximum diameter 2.4 mm and fineness modulus
2.15), crushed stone (12.7 mm or ½ in.), water to w/ c
= 0.43 and 1.0% (by cement weight) of plasticizing
additive (Table 1).
The placement of the material that forms REF
concrete was: 1st—80% of the amount of water;
2nd—crushed stone; 3rd—OPC; 4th—plasticizing
additive; 5th—20% of the water remaining; and finally
the sand content.
From the “Reference” concrete it was made the
NAAC by the addition of air-entraining additive (Eair)
with 0.25% of cement weight and mixed in the mixer
for 1, 3 and 4 minutes, resulting in the concrete samples
“NAAC1”, “NAAC3” and “NAAC4”, respectively.
For each type of sample cylindrical specimens
(diameter = 50 mm and height = 100 mm) were
prepared as recommended by ASTM C34-13 [14].
Next, they were kept in a wet room for seven days
before determining their compressive strength, density,
absorption (%), and structural empty spaces (%) as
recommended by ASTM C642-13 [15].
For microstructural analysis in micro X-ray
computed tomography cylindrical specimens
(diameter = 19 mm and height = 40 mm) were molded
from each type of concrete, but taking off the particles
Table 1 Summary of the mixture proportions of concrete REF.
Constituents Mass (kg/m3)
OPC 492
Sand 739
Crushed stone 985
Plasticizing additive 4.9
Air-entraining additive (Eair) 0
Water 206.7
Air-entrained Concrete: Relationship between Thermal Conductivity and Pore Distribution Analyzed by X-Ray Tomography
510
bigger than 4.8 mm, they were casted and conserved in
a wet room for seven days. When these cylindrical
specimens were prepared, the larger stones of the
concrete were discarded to be compatible with the
diameter of the mold (19 mm). Next, the samples were
dried at 105 °C until reaching constant weight.
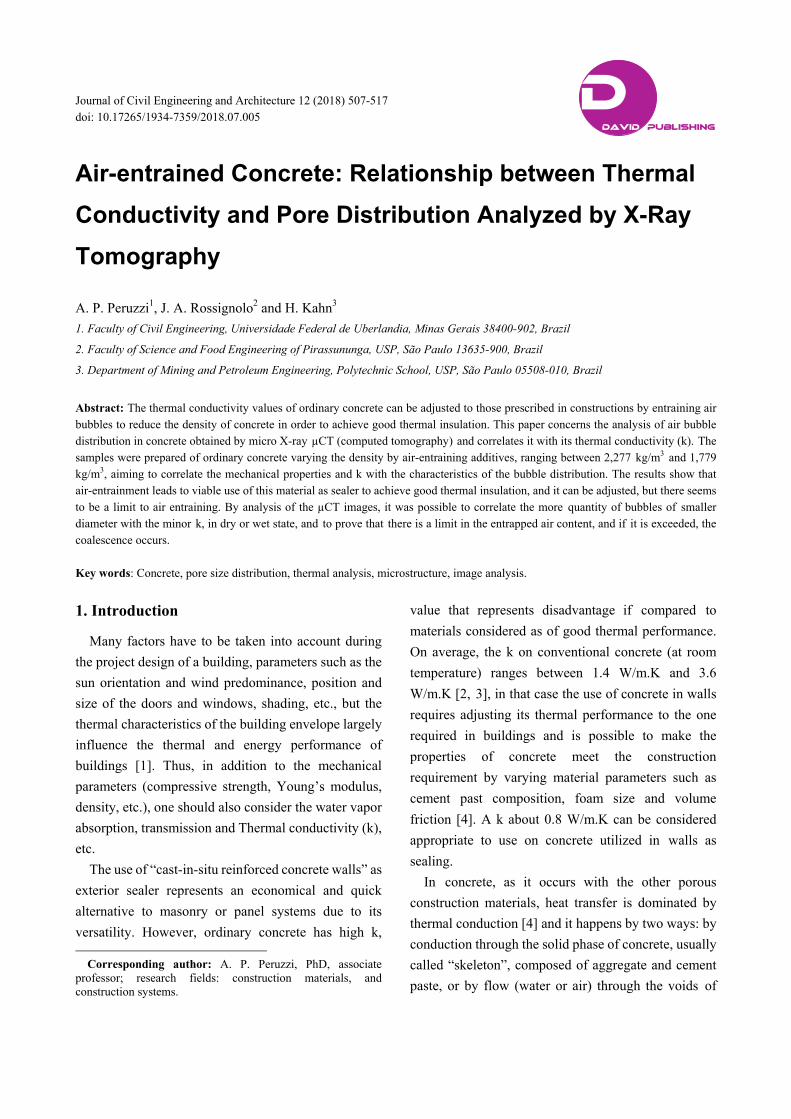
From the 3D images obtained by µCT the bubbles
distribution was quantified in the following diameter
groups 0-50 µm; 50-100 µm; 100-150 µm; 150-200 µm;
200-250 µm; 250-300 µm; 300-350 µm; 350-400 µm;
400-450 µm; 450-500 µm and >500 µm. Fig. 1 shows
the 3D image from µCT Xradia 510 Versa (sample
REF), to exemplify, segmenting the bubbles in
different colors according to their diameters using the
AVIZO 8.0 software.
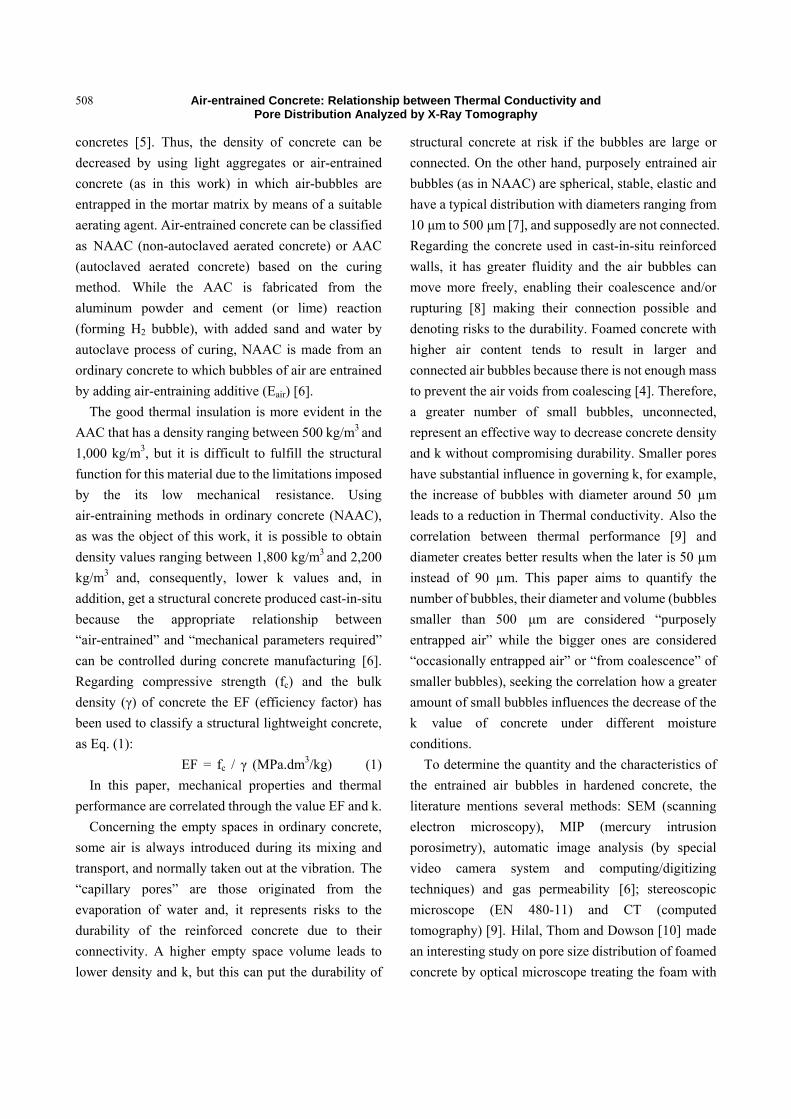
The thermal conductivity k was determined by
ASTM E1530-11 using cylindrical specimens with
diameter (D) = 50 mm and height (h) = 25 mm (Fig. 2),
obtained from the cutting of cylindrical samples with D
= 50 mm and h = 100 mm, and the temperature in the
steady state was 30 °C [16].
In this work, the k values of the samples were tested
in the “moist state” after being exposed in a wet room
for three different times (24 h, 48 h and 96 h) and
determined by Eq. (2), with moisture ranging between
0% and 6% and in the “dry state”.
Moisture contents = [(mm - md) / md] × 100 (2)
Where, mm is mass of surface-dry sample in air after
exposed in wet room and md is mass of oven-dried
sample at 100 °C in drying oven.
The temperature of the sample material affects the k
value [17], so to eliminate this influence k was
determined on samples at ambient temperature
(≈ 25 °C). To correlate the thermal conductivity of the
Fig. 1 Example of 3D image captured by the µCT and distribution of false color bubbles according to their diameters.
Fig. 2 Samples 50 mm diameter and 25 mm of height obtained from the cylindrical samples (D = 50 mm and h = 25 mm) for the Thermal conductivity analyses.
Air-entrained Concrete: Relationship between Thermal Conductivity and Pore Distribution Analyzed by X-Ray Tomography
511
samples and their microstructural view, samples REF,
NAAC3 and NAAC4 were used.
2.2 Statistical Analysis
To analyze the statistical validity of the results the
Chauvenet criterion was used.
3. Results and Discussion
3.1 Mechanical Proprieties of Hardened Concrete
Table 2 shows the mechanical properties of the
specimens and verifies that compressive strength and
EF decrease while the density decreases, as expect, but
regarding the properties “absorption after immersion”
and “% of voids” for NAAC4 samples, it shows a
different trend, and both of these are smaller than for
NAAC3, while the compressive strength and γ follow
the logic in the series.
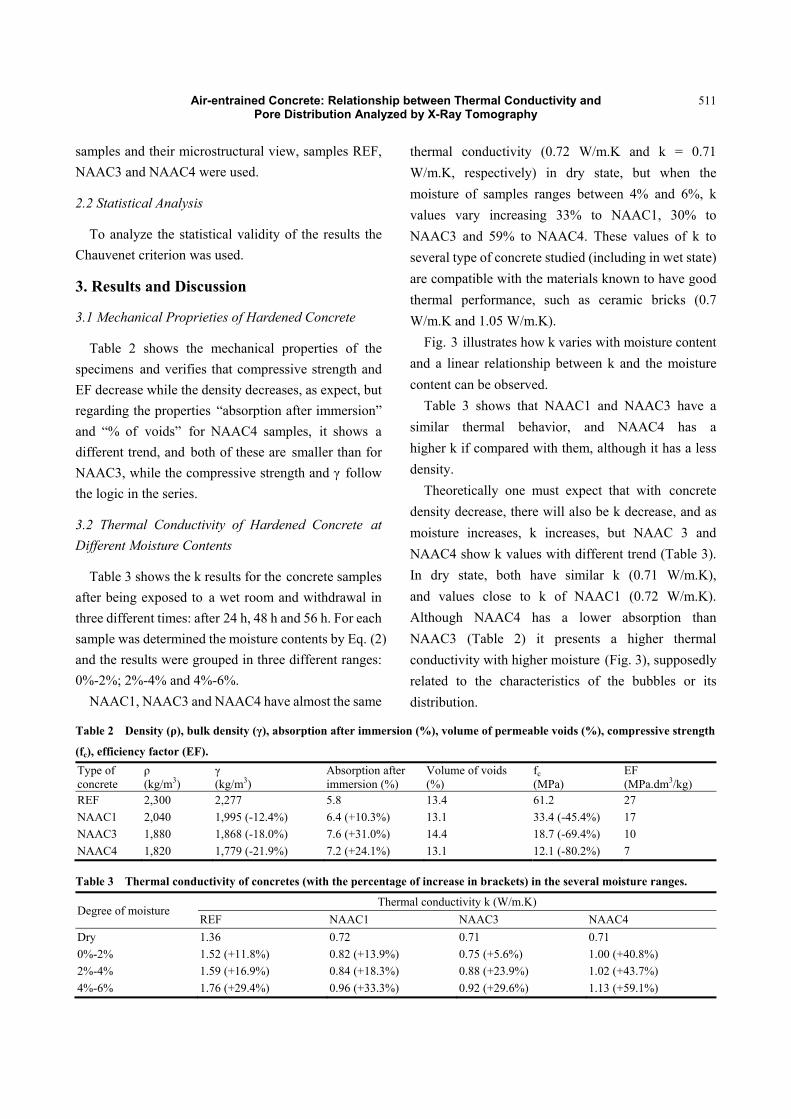
3.2 Thermal Conductivity of Hardened Concrete at Different Moisture Contents
Table 3 shows the k results for the concrete samples
after being exposed to a wet room and withdrawal in
three different times: after 24 h, 48 h and 56 h. For each
sample was determined the moisture contents by Eq. (2)
and the results were grouped in three different ranges:
0%-2%; 2%-4% and 4%-6%.
NAAC1, NAAC3 and NAAC4 have almost the same
thermal conductivity (0.72 W/m.K and k = 0.71
W/m.K, respectively) in dry state, but when the
moisture of samples ranges between 4% and 6%, k
values vary increasing 33% to NAAC1, 30% to
NAAC3 and 59% to NAAC4. These values of k to
several type of concrete studied (including in wet state)
are compatible with the materials known to have good
thermal performance, such as ceramic bricks (0.7
W/m.K and 1.05 W/m.K).
Fig. 3 illustrates how k varies with moisture content
and a linear relationship between k and the moisture
content can be observed.
Table 3 shows that NAAC1 and NAAC3 have a
similar thermal behavior, and NAAC4 has a
higher k if compared with them, although it has a less
density.
Theoretically one must expect that with concrete
density decrease, there will also be k decrease, and as
moisture increases, k increases, but NAAC 3 and
NAAC4 show k values with different trend (Table 3).
In dry state, both have similar k (0.71 W/m.K),
and values close to k of NAAC1 (0.72 W/m.K).
Although NAAC4 has a lower absorption than
NAAC3 (Table 2) it presents a higher thermal
conductivity with higher moisture (Fig. 3), supposedly
related to the characteristics of the bubbles or its
distribution.
Table 2 Density (ρ), bulk density (γ), absorption after immersion (%), volume of permeable voids (%), compressive strength
(fc), efficiency factor (EF).
Type of concrete
ρ (kg/m3)
γ
(kg/m3) Absorption after immersion (%)
Volume of voids (%)
fc (MPa)
EF (MPa.dm3/kg)
REF 2,300 2,277 5.8 13.4 61.2 27
NAAC1 2,040 1,995 (-12.4%) 6.4 (+10.3%) 13.1 33.4 (-45.4%) 17
NAAC3 1,880 1,868 (-18.0%) 7.6 (+31.0%) 14.4 18.7 (-69.4%) 10
NAAC4 1,820 1,779 (-21.9%) 7.2 (+24.1%) 13.1 12.1 (-80.2%) 7
Table 3 Thermal conductivity of concretes (with the percentage of increase in brackets) in the several moisture ranges.
Degree of moisture Thermal conductivity k (W/m.K)
REF NAAC1 NAAC3 NAAC4
Dry 1.36 0.72 0.71 0.71
0%-2% 1.52 (+11.8%) 0.82 (+13.9%) 0.75 (+5.6%) 1.00 (+40.8%)
2%-4% 1.59 (+16.9%) 0.84 (+18.3%) 0.88 (+23.9%) 1.02 (+43.7%)
4%-6% 1.76 (+29.4%) 0.96 (+33.3%) 0.92 (+29.6%) 1.13 (+59.1%)
Air-entrained Concrete: Relationship between Thermal Conductivity and Pore Distribution Analyzed by X-Ray Tomography
512
Fig. 3 Thermal conductivity (k) and moisture content (%) of samples.
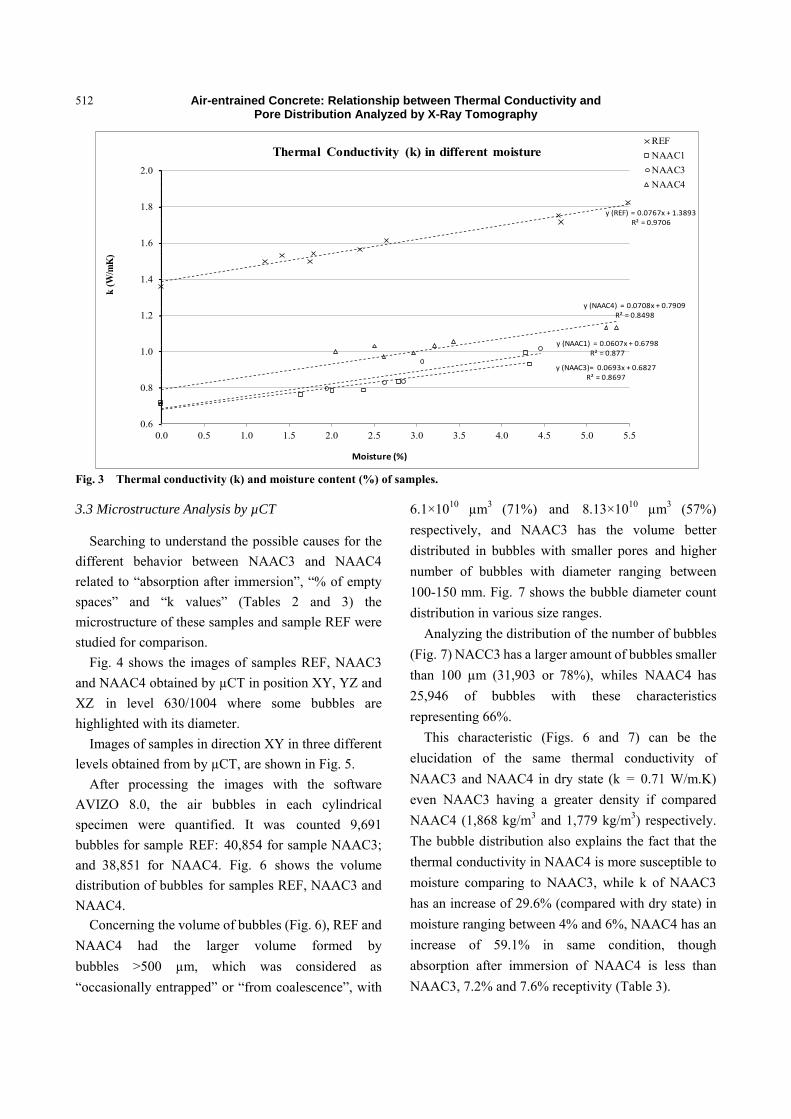
3.3 Microstructure Analysis by µCT
Searching to understand the possible causes for the
different behavior between NAAC3 and NAAC4
related to “absorption after immersion”, “% of empty
spaces” and “k values” (Tables 2 and 3) the
microstructure of these samples and sample REF were
studied for comparison.
Fig. 4 shows the images of samples REF, NAAC3
and NAAC4 obtained by µCT in position XY, YZ and
XZ in level 630/1004 where some bubbles are
highlighted with its diameter.
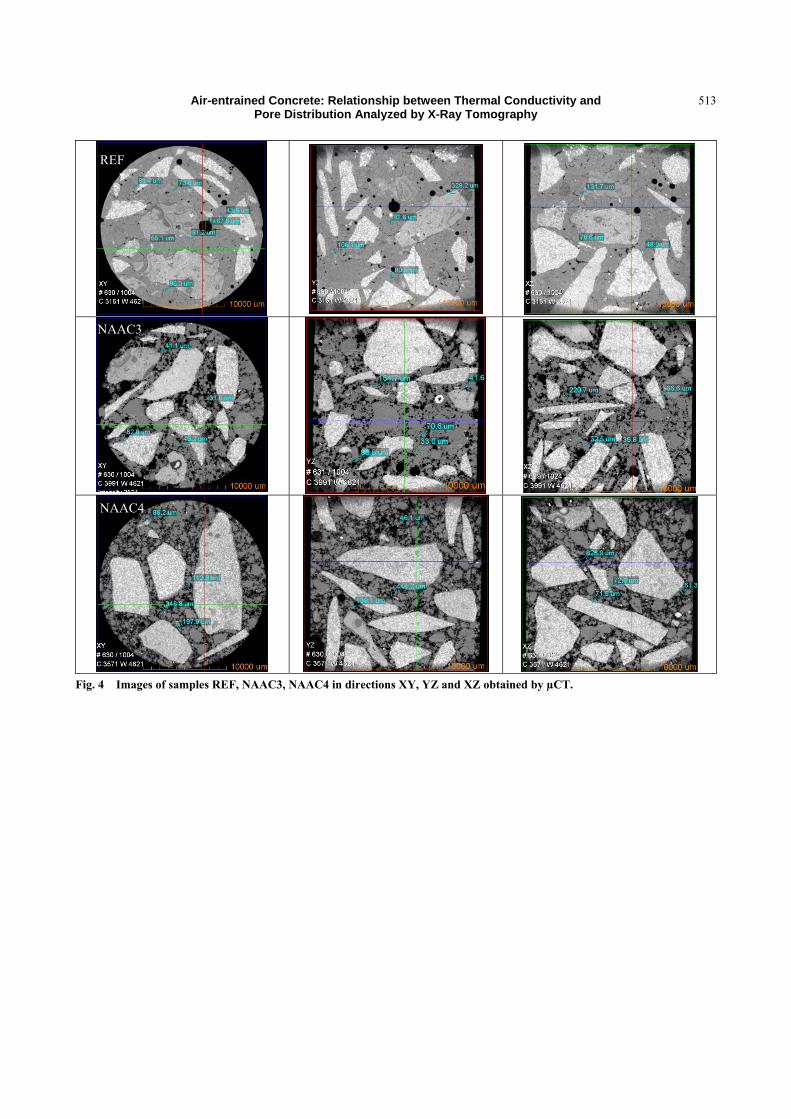
Images of samples in direction XY in three different
levels obtained from by µCT, are shown in Fig. 5.
After processing the images with the software
AVIZO 8.0, the air bubbles in each cylindrical
specimen were quantified. It was counted 9,691
bubbles for sample REF: 40,854 for sample NAAC3;
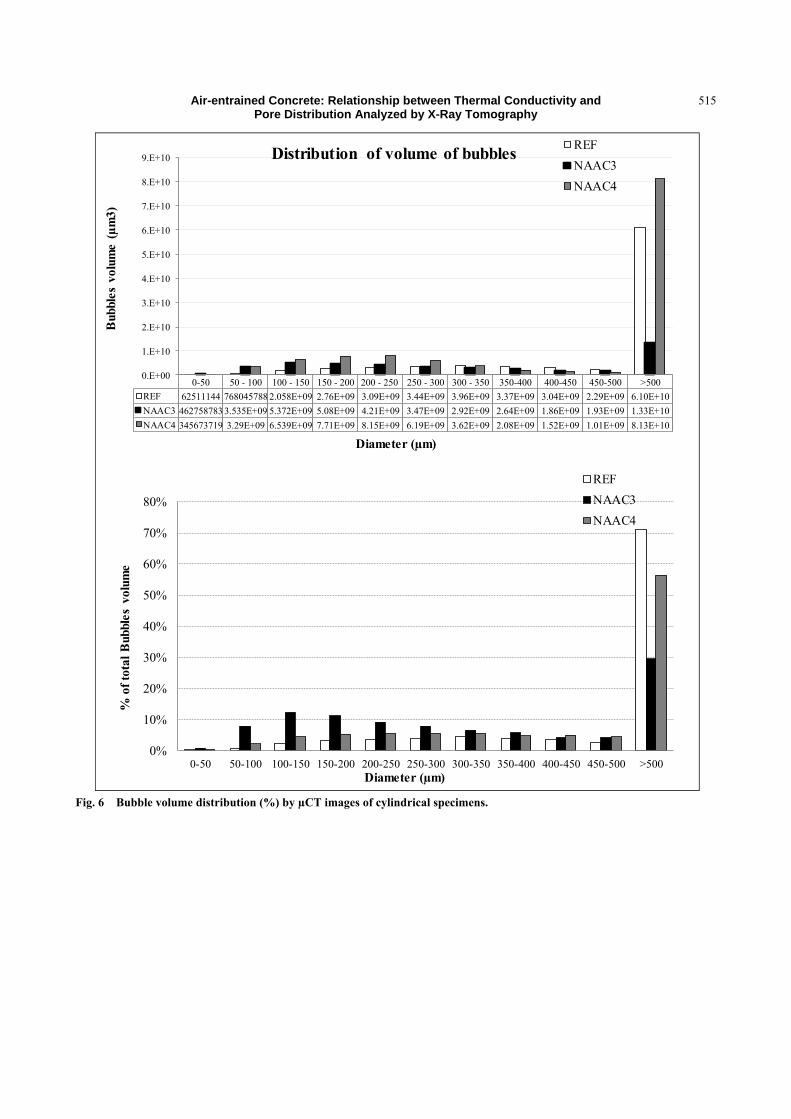
and 38,851 for NAAC4. Fig. 6 shows the volume
distribution of bubbles for samples REF, NAAC3 and
NAAC4. Concerning the volume of bubbles (Fig. 6), REF and
NAAC4 had the larger volume formed by
bubbles >500 µm, which was considered as
“occasionally entrapped” or “from coalescence”, with
6.1×1010 µm3 (71%) and 8.13×1010 µm3 (57%)
respectively, and NAAC3 has the volume better
distributed in bubbles with smaller pores and higher
number of bubbles with diameter ranging between
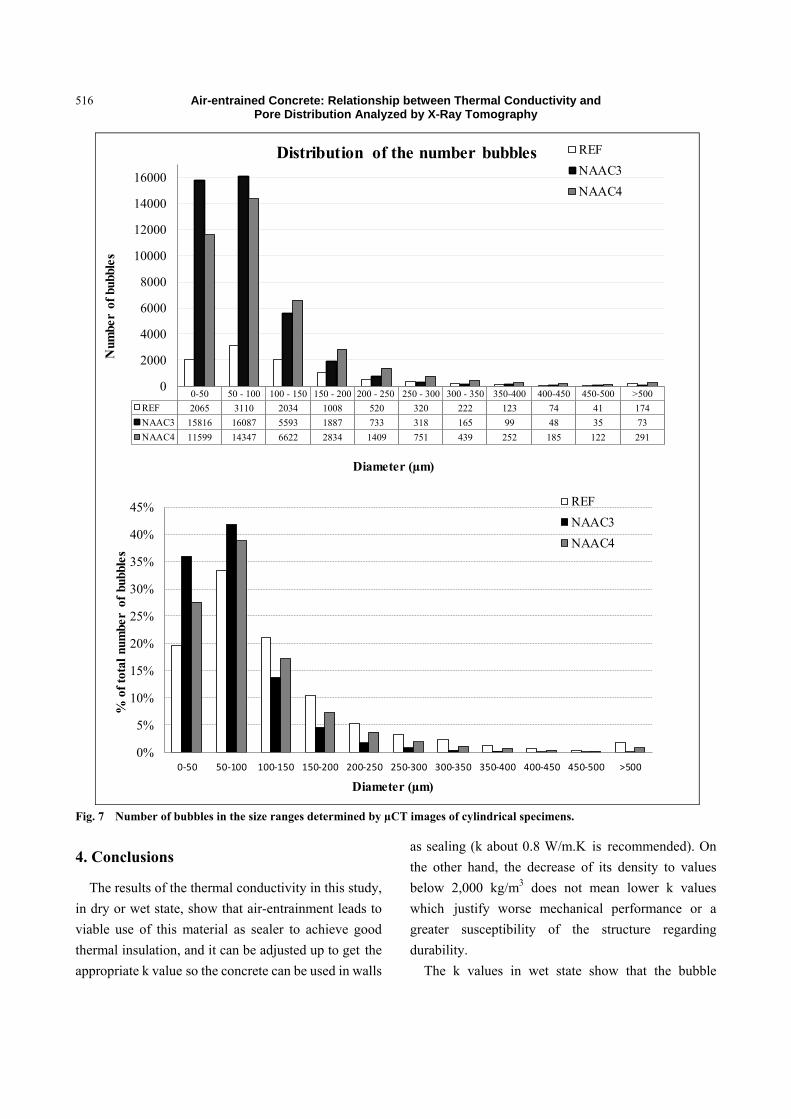
100-150 mm. Fig. 7 shows the bubble diameter count
distribution in various size ranges.
Analyzing the distribution of the number of bubbles
(Fig. 7) NACC3 has a larger amount of bubbles smaller
than 100 µm (31,903 or 78%), whiles NAAC4 has
25,946 of bubbles with these characteristics
representing 66%.
This characteristic (Figs. 6 and 7) can be the
elucidation of the same thermal conductivity of
NAAC3 and NAAC4 in dry state (k = 0.71 W/m.K)
even NAAC3 having a greater density if compared
NAAC4 (1,868 kg/m3 and 1,779 kg/m3) respectively.
The bubble distribution also explains the fact that the
thermal conductivity in NAAC4 is more susceptible to
moisture comparing to NAAC3, while k of NAAC3
has an increase of 29.6% (compared with dry state) in
moisture ranging between 4% and 6%, NAAC4 has an
increase of 59.1% in same condition, though
absorption after immersion of NAAC4 is less than
NAAC3, 7.2% and 7.6% receptivity (Table 3).
y (REF) = 0.0767x + 1.3893R² = 0.9706
y (NAAC1) = 0.0607x + 0.6798R² = 0.877
y (NAAC3)= 0.0693x + 0.6827R² = 0.8697
y (NAAC4) = 0.0708x + 0.7909R² = 0.8498
0.6
0.8
1.0
1.2
1.4
1.6
1.8
2.0
0.0 0.5 1.0 1.5 2.0 2.5 3.0 3.5 4.0 4.5 5.0 5.5
k (W
/mK
)
Moisture (%)
Thermal Conductivity (k) in different moistureREF
NAAC1
NAAC3
NAAC4
Air-entrained Concrete: Relationship between Thermal Conductivity and Pore Distribution Analyzed by X-Ray Tomography
513
Fig. 4 Images of samples REF, NAAC3, NAAC4 in directions XY, YZ and XZ obtained by µCT.
NAAC3
NAAC4
REF
Air-entrained Concrete: Relationship between Thermal Conductivity and Pore Distribution Analyzed by X-Ray Tomography
514
REF (1)
REF (2) REF (3) REF (4)
NAAC3 (1)
NAAC3 (2) NAAC3 (3) NAAC3 (4)
NAAC4 (1)
NAAC4 (2) NAAC4 (3) NAAC4 (4)
Fig. 5 Images of samples REF, NAAC3, NAAC4 in the direction of XY in three additional levels obtained by µCT.
Air-entrained Concrete: Relationship between Thermal Conductivity and Pore Distribution Analyzed by X-Ray Tomography
515
Fig. 6 Bubble volume distribution (%) by µCT images of cylindrical specimens.
0-50 50 - 100 100 - 150 150 - 200 200 - 250 250 - 300 300 - 350 350-400 400-450 450-500 >500
REF 62511144 768045788 2.058E+09 2.76E+09 3.09E+09 3.44E+09 3.96E+09 3.37E+09 3.04E+09 2.29E+09 6.10E+10
NAAC3 462758783 3.535E+09 5.372E+09 5.08E+09 4.21E+09 3.47E+09 2.92E+09 2.64E+09 1.86E+09 1.93E+09 1.33E+10
NAAC4 345673719 3.29E+09 6.539E+09 7.71E+09 8.15E+09 6.19E+09 3.62E+09 2.08E+09 1.52E+09 1.01E+09 8.13E+10
0.E+00
1.E+10
2.E+10
3.E+10
4.E+10
5.E+10
6.E+10
7.E+10
8.E+10
9.E+10
Bub
bles
vol
ume
(µm
3)
Diameter (µm)
Distribution of volume of bubblesREF
NAAC3
NAAC4
0%
10%
20%
30%
40%
50%
60%
70%
80%
0-50 50-100 100-150 150-200 200-250 250-300 300-350 350-400 400-450 450-500 >500
% o
f to
tal
Bub
bles
vol
ume
Diameter (µm)
REF
NAAC3
NAAC4
Air-entrained Concrete: Relationship between Thermal Conductivity and Pore Distribution Analyzed by X-Ray Tomography
516
Fig. 7 Number of bubbles in the size ranges determined by µCT images of cylindrical specimens.
4. Conclusions
The results of the thermal conductivity in this study,
in dry or wet state, show that air-entrainment leads to
viable use of this material as sealer to achieve good
thermal insulation, and it can be adjusted up to get the
appropriate k value so the concrete can be used in walls
as sealing (k about 0.8 W/m.K is recommended). On
the other hand, the decrease of its density to values
below 2,000 kg/m3 does not mean lower k values
which justify worse mechanical performance or a
greater susceptibility of the structure regarding
durability.
The k values in wet state show that the bubble
0-50 50 - 100 100 - 150 150 - 200 200 - 250 250 - 300 300 - 350 350-400 400-450 450-500 >500
REF 2065 3110 2034 1008 520 320 222 123 74 41 174
NAAC3 15816 16087 5593 1887 733 318 165 99 48 35 73
NAAC4 11599 14347 6622 2834 1409 751 439 252 185 122 291
0
2000
4000
6000
8000
10000
12000
14000
16000
Num
ber
of b
ubbl
es
Diameter (µm)
Distribution of the number bubbles REF
NAAC3
NAAC4
0%
5%
10%
15%
20%
25%
30%
35%
40%
45%
0‐50 50‐100 100‐150 150‐200 200‐250 250‐300 300‐350 350‐400 400‐450 450‐500 >500
% o
f to
tal
num
ber
of b
ubbl
es
Diameter (µm)
REF
NAAC3
NAAC4
Air-entrained Concrete: Relationship between Thermal Conductivity and Pore Distribution Analyzed by X-Ray Tomography
517
distribution has meaningful influence in the
susceptibility of the concrete k related to moisture: a
larger amount of bubbles with smaller diameter
represents minor thermal conductivity. In addition,
there seems to be a limit to air entraining and, if it is
exceeded the bubbles starts to coalesce (such as
NAAC4), leading to bigger thermal conductivity,
lower density and worse mechanical performance.
The analysis of images obtained by µCT has been
shown to be a valuable resource for the correct
understanding of the influence of the bubble
distribution on the performance of air-entrained
concrete. However further studies are required to verify
the bubbles connectivity, mainly by simulating the
flow of a fluid (e.g. air) through the concrete.
Acknowledgement
This work was carried out with the collaboration of
the FECIV-UFU, Construction Laboratory of
IAUSC-USP, Geotechnical Department of the
EESC-USP; LCT-EPUSP fellow researchers Daniel
Uliana and Fabrizzio Costa; and FZEA-USP mainly
Prof. Dr. Holmer Savastano Junior. We would like to
express our gratitude to them.
References
[1] Budaiwi, I., Abdou, A., and Al-Hormoud. 2002. “Variations of Thermal Conductivity of Insulation Materials under Different Operating Temperatures: Impact on Envelope-Induce Cooling Load.” J. Archit. Eng. 10 (1061): 125-32.
[2] Bazant, Z. P., and Kaplan, M. F. 1996. Concrete at Temperatures, Material Properties and Mathematical Models. Essex, UK: Logman.
[3] Holm, T. A., and Bremner, T. W. 2000. State-of-Art Report on High-Strength, High-Durability Structural Low-Density Concrete for Applications in Severe Marine Environments. Washington, DC, USA: US Army Engineer Research and Development Center.
[4] Wei, S., Yunsheng, Z., and Jones, M. R. 2014 “Three-Dimensional Numerical Modeling and Simulation of the Thermal Properties of Foamed Concrete.”
Construction and Building Materials 50: 421-31. [5] Bhattacharjee, B., and Krishnamoorthy, S. 2004.
“Permeable Porosity and Thermal Conductivity of Construction Materials.” J. Mat. Civil. Eng. 10 (1061): 322-30.
[6] Narayanan, N., and Ramamurthy, K. 2000. “Structure and Properties of Aerated Concrete: A Review.” Cement & Concrete Composites 22: 321-9.
[7] Nevile, A. M. 2016. Propriedades do concreto. Porto Alegre, Brazil: Bookman.
[8] Piekarczyk, B. L. 2013. “The Type of Air-Entraining and Viscosity Modifying Admixtures and Porosity and Frost Durability of High Performance Self-compacting Concrete.” Construction and Building Materials 40: 659-71.
[9] Moravcová, B., Possl, P., Misák, P., and Michal Blazek, M. 2016. “Possibilities of Determining the Air-Pore Content in Cement Composites Using Computed Tomography and Other Methods.” Materials and Technology 50 (4): 491-8.
[10] Hilal, A. A., Thom, N. H., and Dawson, A. R. 2015. “On Entrained Pore Size Distribution of Foamed Concrete.” Construction and Building Materials 75: 227-33.
[11] Lu, H., Alymov, E., Shah, S., and Peterson, K. 2017. “Measurement of Air Void System in Lightweight Concrete by X-Ray Computed Tomography.” Construction and Building Materials 152: 467-83.
[12] ACI 122R-02. 2002. “Guide to Thermal Properties of Concrete and Masonry Systems.” In ACI Manual of Concrete Practise, Chapter 122R-02. American Concrete Institute, Detroit.
[13] Goual, M. S., Bali, A., and Quéneudec, M. 1999. “Effective Thermal Conductivity of Clayey Aerated Concrete in the Dry State: Experimental Results and Modeling.” J. Phys. 32 (23): 3041-6.
[14] ASTM C34-13. 2013. “Standard Specification for Structural Clay Load-Bearing Wall Tile.” https://doi.org/10.1520/C0034.
[15] ASTM C642-13. 2013. “Standard Test Method for Density, Absorption, and Voids in Hardened Concrete.” https://doi.org/10.1520/C0642-13.
[16] ASTM E1530-11. 2011. “Standard Test Method for Evaluating the Resistance to Thermal Transmission of Materials by the Guarded Heat Flow Meter Technique.” https://doi.org/10.1520/E1530-11.
[17] Kodur, V., and Khaliq, W. 2011. “Effect of Temperature on Thermal Properties of Different Types of High-Strength Concrete.” J. Mat. Civil. Eng. 10 (1061): 793-801.