development and empirical evaluation of an …
TRANSCRIPT

DEVELOPMENT AND EMPIRICAL EVALUATION OF AN EXPLANATORY
PSYCHOLOGICAL OWNERSHIP STRUCTURAL MODEL
Angela Lee
Thesis presented in partial fulfilment of the requirements for the degree of Master
of Commerce (Industrial Psychology) in the Faculty of Economic and Management
Sciences at Stellenbosch University
SUPERVISOR: PROFESSOR C.C. THERON
CO-SUPERVISOR: MR T MARIRI
December 2017

i
DECLARATION
By submitting this thesis electronically, I declare that the entirety of the work contained
therein is my own, original work, that I am the sole author thereof (save to the extent
explicitly otherwise stated), that reproduction and publication thereof by Stellenbosch
University will not infringe any third party rights and that I have not previously in its entirety
or in part submitted it for obtaining any qualification.
Signed: A. Lee Date: August 2017
Copyright © 2017 Stellenbosch University
All rights reserved
Stellenbosch University https://scholar.sun.ac.za

ii
ABSTRACT
A key competitive business advantage, in today’s globalised world, lies not in technology
and products but in its people. Numerous psychological mechanisms have been identified
within applied and academic research in an attempt to understand and influence the
behaviour of these people within the working world. This network of latent variables
underpinning behaviour offers numerous opportunities to explicate the mechanisms
behind behaviour of man and specifically working man. A recently introduced construct in
this nomological network of latent variables, suggested to underpin behaviour, is
psychological ownership. Psychological ownership is posited to have both psychological
and behavioural effects. Within the organisational context, benefits of psychological
ownership include increased tenure, job satisfaction, organisational commitment and
organisational citizenship behaviours, as well as enhanced performance. For human
resources to utilise interventions to influence levels of psychological ownership, to benefit
both the employee and the organisation, a valid understanding of the psychological
mechanism that underpin levels of psychological ownership is required. The current
research study examined variance in levels of psychological ownership within employees,
within different organisational contexts, with the objective of developing and empirically
testing an explanatory psychological ownership structural model in order to answer this
question.
Theorising, in this research study, culminated in a proposed explanatory psychological
ownership structural model. This model, together with a narrow focused structural model
investigating the subsequent impact of an interaction between salient individual
psychological ownership needs and the ability of the job characteristics to satisfy these
needs on the motivation to pursue the routes towards psychological ownership, was
empirically evaluated using structural equation modelling (SEM) and polynomial
regression.
A convenience sample of 329 employees from various organisations and industries
participated in the study. The initial psychological ownership model failed to converge.
However, a reduced psychological ownership measurement model obtained very good fit
and a modified psychological ownership structural model obtained reasonable fit.
Statistical support was found for all of the hypothesised paths except for the path
suggested between psychological ownership and motivation to pursue the routes towards
psychological ownership and the suggest path between the psychological safety
Stellenbosch University https://scholar.sun.ac.za

iii
motivation interaction and self investment. Results show that the characteristics of the job
as well as an individuals’ need for a sense of belonging, self-identity and efficacy and
effectance influence levels of motivation to pursue the routes towards psychological
ownership. The results additionally indicated that feelings of ownership are impacted by
self-investment, intimate knowledge and control afforded to employees within their jobs.
This led to certain suggestions pertaining to interventions that can be applied within the
work place as well as thoughts pertaining to future research endeavours.
Stellenbosch University https://scholar.sun.ac.za

iv
OPSOMMING
In vandag se globale wêreld lê die belangrikste en mededingenstebesigheidsvoordeel, nie
in tegnologie en produkte nie, maar in mense. Toegepaste en akademiese navorsing het
verskeie sielkundige meganismes identifiseer in ‘n poging om die gedrag van mense in
die werksplek beter te verstaan, asook te beïnvloed. Hierdie netwerk van latente
veranderlikes wat menslike gedrag ondersteun, bied talle geleenthede om die menslike
gedrag, spesifiek die gedrag van werkende individuee, te verduidelik. 'n Onlangse
geskepte konstruk in dié nomologiese netwerk van latente veranderlikes,voorgestel om
gedrag te verklaar, is dié van sielkundige eienaarskap. Daar word suggereer dat
sielkundige eienaarskap beide sielkundige asook gedragseienskappe insluit. Verskeie
voordele rakende sielkundige eienaarskap in die besigheidskonteks bestaan en sluit van
die volgende in: verhoogde ampstermyn, werksbevrediging, toewyding aan die
organisasie, organisatoriese burgerskap gedrag en verbeterde prestasie. Vir menslike
hulpbronne om van intervensies gebruik te maak om die vlakke van sielkundige
eienaarskap te beïnvloed wat beide die werknemer asook die organisasie bevoordeel,
word 'n geldige begrip van die sielkundige meganisme wat die vlakke van sielkundige
eienaarskap reguleer, vereis. Die huidige navorsingstudie ondersoek die verskille in die
vlakke van sielkundige eienaarskap van werknemers in verskillende kontekste in die
organisasie, met die doel om 'n strukturele model vir sielkundige eienskap te ontwikkel,
asook empiries te toets.
Hierdie navorsingstudie stel 'n verklarende sielkundige eienaarskap-strukturele model
voor. Dié model, tesame met 'n enger, meer gefokusde strukturele model, ondersoek die
interaksie tussen die vernaamste individuele sielkundige eienaarskapbehoeftes en die
vermoë van die werkseienskappe om hierdie behoeftes te bevredig deur die empiriese
toetsing van die voorgestelde strukturele model met behulp van strukturele vergelyking-
modellering (SEM) en polinomiese regressie-ontleding.
‘n Geriefsteekproef van 329 werknemers van verskeie organisasies en nywerhede het
aan die studie deelgeneem. Die aanvanklike sielkundige eienaarskapmodel het suksesvol
konvergeer maar van die waardes van die parameterskattings in die volledig
gestandaardiseerde oplossing was ontoelaatbaar. 'n Gereduseerde sielkundige
eienaarskap-metingmodel het goeie pasgehalte getoon terwyl die gereduseerde
sielkundige eienaarskap strukturele model redelike pasgehalte getoon het. Statistiese
ondersteuning is verkry vir alle hipoteses, behalwe die voorgestelde baan tussen
Stellenbosch University https://scholar.sun.ac.za

v
sielkundige eienaarskap en motivering om die roetes na sielkundige eienaarskap te volg
en die voorgestelde baan tussen die interaksie tussen sielkundige veiligheid en motivering
om die roetes na sielkundige eienaarskap te volg op self-investering. Die studie se
resultate toon dat die eienskappe van werk sowel as die individu se behoefte om te
behoort, selfidentiteit, effektiwiteit en vermoë te toon, die vlakke van motivering om die
roetes na sielkundige eienaarskap na te streef, beïnvloed. Verder dui die resultate dat
eienaarskapgevoelens beïnvloed word deur self-investering, intieme kennis en beheer
wat aan werknemers in hul werk gebied word. Hierdie resultate lewer verskeie voorstelle
wat in die werksplek toegepas kan word, sowel as voorstelle rakende toekomstige
navorsing.
Stellenbosch University https://scholar.sun.ac.za

vi
ACKNOWLEDGEMENTS
Research can at times feel like a very solitary journey comprising many challenges,
surprises, hurdles, unexpected turns and moments of sheer bliss (the ah ha’s). However,
there are several people who were instrumental in the completion of this research study
and who contributed to this journey coming to its completion. For their constant guidance,
love, care, mentorship and motivation I will be eternally grateful.
To my family and friends, firstly, my husband, Anton. Thank you for standing by me during
the challenges that I faced and rejoicing with me during the ‘ah ha’ moments, no matter
how big or how small. You were there, solid as a rock, by my side, through the tears and
frustrations as well as the celebrations, providing much needed strength and patience –
thank you! Secondly, my mom and dad, thank you for your continued support and for being
my biggest cheer leaders throughout the years. I know I didn’t always make that job an
easy one. Thirdly, my friends, for your encouragement and support and for providing a
much needed platform for venting frustrations when needed and for having the insight to,
at times, not ask how the writing was going. Thank you.
To everyone who assisted me throughout the journey from an academic point of view,
from the participants who completed the survey, to all of the members of staff at the
Industrial Psychology Department at Stellenbosch and our wonderful librarians, Ms
Strydom and Ms Tymbios, who were always willing to lend an ear, provide a supportive
smile, and hunt down that illusive article or book. Additionally, to the international and local
researchers who provided comments and insights at strategic points throughout the
journey - thank you.
Last, but certainly not least, to my supervisors, Professor C.C. Theron and Mr Mariri, thank
you for your guidance and insights. I would like to take this opportunity to extend a special
thank you to Professor C.C Theron – thank you for teaching me how to think. Thank you
for teaching me that striving for excellence is not a bad quality and that the question isn’t
answered until a certain level of comfort has been reached. Thank you for igniting an
inquisitive questioning fire within my mind that I feel will play a big part in my career in
future. Your mentorship has allowed my research confidence to grow and flourish and I
hope to apply the lessons I have learnt, throughout this journey, to future journeys in the
world of research. Without you this thesis would not be possible. I am very blessed by and
will be eternally grateful for your guidance, patience and mentorship.
Stellenbosch University https://scholar.sun.ac.za

vii
TABLE OF CONTENTS
DECLARATION ................................................................................................................................. I
ABSTRACT ...................................................................................................................................... II
OPSOMMING ................................................................................................................................. IV
ACKNOWLEDGEMENTS ............................................................................................................... VI
LIST OF FIGURES......................................................................................................................... XII
LIST OF TABLES ......................................................................................................................... XIV
CHAPTER 1 INTRODUCTION AND OBJECTIVES OF THE STUDY ............................................ 1
1.1 INTRODUCTION .............................................................................................................. 1
Organisations and their role in society ............................................................................. 2
The external environment and its impact on organisations ............................................. 3
The construct of performance within an organisational context ...................................... 4
HR’s role in the management of work performance ........................................................ 7
Psychological ownership as part of the nomological network underpinning behaviour 10
Unique South African considerations justifying the development of psychological
ownership ....................................................................................................................... 16
Concluding remarks ....................................................................................................... 17
1.2 RESEARCH INITIATING QUESTION............................................................................ 18
1.3 RESEARCH OBJECTIVE .............................................................................................. 19
1.4 OUTLINE OF THE STRUCTURE OF THE THESIS ...................................................... 20
CHAPTER 2 LITERATURE STUDY............................................................................................ 21
2.1 INTRODUCTION ............................................................................................................ 21
2.2 CONCEPTUALISING THE CONSTRUCT OF PSYCHOLOGICAL OWNERSHIP ... …21
Psychological ownership as a proposed multidimensional state ................................... 26
Promotion- versus prevention-orientated psychological ownership .............................. 29
Concluding remarks on the conceptualisation of psychological ownership ............... …30
2.3 THE QUESTION OF DISTINCTIVENESS ..................................................................... 33
2.4 DEVELOPING A HYPOTHESIS ON THE NATURE OF THE PSYCHOLOGICAL
MECHANISM REGULATING THE LEVELS OF PSYCHOLOGICAL OWNERSHIP .... 35
Roots of psychological ownership – intrapersonal antecedents .................................... 39
The interplay between the target and the owner ........................................................... 42
2.4.2.1 Target attributes ............................................................................................................. 44
Expectancy theory and the routes to psychological ownership ..................................... 51
The role of fit in the development of psychological ownership ...................................... 56
Routes to feelings of ownership ..................................................................................... 67
Motivational effects of psychological ownership ............................................................ 75
2.5 THE PROPOSED PSYCHOLOGICAL OWNERSHIP STRUCTURAL MODEL ............ 76
Stellenbosch University https://scholar.sun.ac.za

viii
CHAPTER 3 RESEARCH METHODOLOGY .............................................................................. 79
3.1 INTRODUCTION ............................................................................................................ 79
3.2 SUBSTANTIVE RESEARCH HYPOTHESES ............................................................... 80
3.3 RESEARCH DESIGN ..................................................................................................... 84
Assessing the research design for the proposed psychological ownership structural
model .............................................................................................................................. 88
3.4 STATISTICAL HYPOTHESES ....................................................................................... 92
3.5 SAMPLING ..................................................................................................................... 97
Target population, sampling procedure and the sample group ..................................... 98
Sampling procedure ....................................................................................................... 98
Sample size .................................................................................................................. 102
3.6 MEASUREMENT INSTRUMENTS/OPERATIONALISATION ..................................... 106
Psychological ownership .............................................................................................. 109
Routes to psychological ownership .............................................................................. 109
Roots of psychological ownership ................................................................................ 110
Job characteristics ........................................................................................................ 111
Motivation to pursue the routes towards psychological ownership.............................. 113
Psychological safety ..................................................................................................... 114
Latent interaction effects within the structural model ................................................... 115
3.7 STATISTICAL ANALYSIS ............................................................................................ 117
Missing values .............................................................................................................. 117
Item analysis and evaluation ........................................................................................ 119
Dimensionality analysis using exploratory factor analysis ........................................... 121
Structural equation modelling and response surface methodology ............................. 122
3.7.4.1 Variable type ................................................................................................................. 123
3.7.4.2 Multivariate normality ................................................................................................... 123
3.7.4.3 Confirmatory factor analysis ......................................................................................... 124
3.7.4.4 Interpreting the measurement model fit and parameter estimates .............................. 126
3.7.4.5 Fitting the psychological ownership structural model .................................................. 126
3.7.4.6 Interpreting the psychological ownership structural model and parameter estimates . 127
3.7.4.7 Calculating the response surface test values, drawing and interpreting the response
surface graph ................................................................................................................ 128
CHAPTER 4 ETHICAL CONSIDERATIONS AND RISK EVALUATION .................................. 130
4.1 INTRODUCTION .......................................................................................................... 130
4.2 GUIDING PRINCIPLES AND LEGISLATIVE COMPLIANCE ..................................... 130
4.3 POTENTIAL ETHICAL RISK FACTORS ..................................................................... 132
4.4 RISK-BENEFIT ANALYSIS .......................................................................................... 137
CHAPTER 5 RESEARCH RESULTS ....................................................................................... 138
Stellenbosch University https://scholar.sun.ac.za

ix
5.1 INTRODUCTION .......................................................................................................... 138
5.2 MISSING VALUES ....................................................................................................... 138
5.3 ITEM ANALYSIS APPROACH ..................................................................................... 139
5.4 ITEM ANALYSIS RESULTS......................................................................................... 141
Job characteristics ........................................................................................................ 142
5.4.1.1 Autonomy ..................................................................................................................... 142
5.4.1.2 Task identity ................................................................................................................. 144
5.4.1.3 Skill variety ................................................................................................................... 145
5.4.1.4 Task significance .......................................................................................................... 146
5.4.1.5 Feedback ...................................................................................................................... 147
Individual needs ............................................................................................................ 148
Psychological safety ..................................................................................................... 151
Motivation to pursue the routes to psychological ownership ....................................... 153
5.4.4.1 Motivation to pursue the routes to psychological ownership – Valence subscale… ... 153
5.4.4.2 Motivation to pursue the routes to psychological ownership – Expectancy
subscale……...…………………………………………………………….………………...155
Routes to psychological ownership – gaining intimate knowledge, self-investment, and
ability to take control ..................................................................................................... 156
Psychological ownership .............................................................................................. 160
5.5 DIMENSIONALITY ANALYSIS VIA EXPLORATORY FACTOR ANALYSIS (EFA) AND
CONFIRMATORY FACTOR ANALYSIS (CFA) ........................................................... 160
Job characteristics ........................................................................................................ 164
5.5.1.1 Autonomy ..................................................................................................................... 164
5.5.1.2 Task identity ................................................................................................................. 164
5.5.1.3 Skills variety .................................................................................................................. 165
5.5.1.4 Task significance .......................................................................................................... 166
5.5.1.5 Feedback ...................................................................................................................... 167
Individual needs ............................................................................................................ 168
5.5.2.1 The psychological ownership need for self-identity ..................................................... 168
5.5.2.2 The psychological ownership need for a sense of belonging ...................................... 169
5.5.2.3 Psychological ownership need for a sense of self-efficacy and effectance …………..170
Psychological safety ..................................................................................................... 171
The three routes to psychological ownership ............................................................... 172
5.5.4.1 Self-investment ............................................................................................................. 172
5.5.4.2 Intimate knowledge ...................................................................................................... 174
5.5.4.3 Control .......................................................................................................................... 175
Psychological ownership .............................................................................................. 177
Motivation to pursue the routes to psychological ownership subscales ...................... 178
Stellenbosch University https://scholar.sun.ac.za

x
5.6 CONFIRMATORY FACTOR ANALYSIS ON MULTI-DIMENSIONAL MEASUREMENT
SCALES........................................................................................................................ 183
Measurement model fit for the job characteristics scale .............................................. 183
Individual psychological ownership needs (roots) ....................................................... 201
Psychological ownership routes ................................................................................... 210
Motivation to pursue psychological ownership routes ................................................. 222
5.7 ITEM PARCELS ........................................................................................................... 239
5.8 FITTING THE PSYCHOLOGICAL OWNERSHIP MEASUREMENT MODEL ............ 239
Data screening prior to fitting the measurement model and structural model. ............ 239
Evaluating the fit of the psychological ownership measurement model ...................... 243
Reduced psychological ownership measurement model fit indices ............................ 250
Reduced psychological ownership measurement model standardised residuals ….253
Reduced psychological ownership measurement model modification indices ............ 256
Reduced psychological ownership measurement model parameter estimates and
squared multiple correlations ....................................................................................... 258
Overall conclusions regarding the fit of the reduced psychological ownership
measurement model ..................................................................................................... 267
5.9 EVALUATING THE FIT OF THE PSYCHOLOGICAL OWNERSHIP STRUCTURAL
MODEL ......................................................................................................................... 268
Evaluating the goodness of fit of the reduced psychological ownership structural model
(Model A) ...................................................................................................................... 268
Modified psychological ownership structural model (Model B) standardised residuals
...................................................................................................................................... 275
Modified psychological ownership structural model parameter estimates and squared
multiple correlations ..................................................................................................... 278
Modified psychological ownership structural model modification indices....................285
5.10 POWER ASSESSMENT .............................................................................................. 286
5.11 OBSERVED SCORE POLYNOMIAL REGRESSION ANALYSIS WITH RESPONSE
SURFACE ANALYSIS .................................................................................................. 288
Describing the incidence of congruence and incongruence ........................................ 290
Fitting the polynomial regression model ...................................................................... 293
5.11.2.1 Preventatively dealing with the problem of multicollinearity ........................................ 293
5.11.2.2 Calculating the squared and product terms ................................................................. 294
Interpreting the fit by specifying the model and inspecting significance .. ……………..295
Creating and interpreting the response surface test values and graph………………..296
5.12 SUMMARY ................................................................................................................... 300
CHAPTER 6 CONCLUSIONS, RECOMMENDATIONS, IMPLICATIONS AND SUGGESTIONS
FOR FUTURE RESEARCH ......................................................................................................... 301
Stellenbosch University https://scholar.sun.ac.za
xi
6.1 INTRODUCTION .......................................................................................................... 301
6.2 RESULTS ..................................................................................................................... 302
Evaluation of the psychological ownership measurement model ................................ 302
Evaluation of the psychological ownership structural model ....................................... 303
Evaluation of the response surface analyses .............................................................. 307
6.3 LIMITATIONS TO THE STUDY ................................................................................... 309
6.4 RECOMMENDATIONS FOR FUTURE RESEARCH .................................................. 310
Suggested additional paths - data driven perspective ................................................. 311
Additional paths – theoretical perspectives .................................................................. 320
6.5 PRACTICAL IMPLICATIONS ....................................................................................... 323
6.6 CONCLUDING THOUGHT .......................................................................................... 326
REFERENCES ............................................................................................................................. 328
APPENDIX 1 ................................................................................................................................ 348
APPENDIX 2 ................................................................................................................................ 358
APPENDIX 3 ................................................................................................................................ 363
APPENDIX 4 ............................................................................................................................... 367
Stellenbosch University https://scholar.sun.ac.za

xii
LIST OF FIGURES
Figure 2.1. The Hackman-Oldham Job Characteristics Model of Work Motivation .............. 45
Figure 2.2. A Psychological Ownership-Based Revision of the Job Characteristics
Model.............................................................................................................. 47
Figure 2.3. The Revised Porter-Lawler Model ..................................................................... 55
Figure 3.1. Ex Post Facto Correlation Design of the Proposed Psychological Ownership
Structural Model ............................................................................................... 91
Figure 5.1. Visual Representation of the Job Characteristics Measurement Model ........... 187
Figure 5.2. Visual Representation of the Job Characteristics Modification Indices ............ 190
Figure 5.3. Visual Representation of the Job Characteristics Bi-factor Measurement Model
(completely standardised solution) ................................................................. 193
Figure 5.4. Representation of the fitted individual psychological ownership needs
measurement model (completely standardised solution) ................................ 204
Figure 5.5. Visual Representation of the Psychological Ownership Routes (Completely
Standardised Solution) ................................................................................... 212
Figure 5.6. Visual Representation of the Statistically Significant (p<.01) Modification Indices
Calculated for the Fitted Psychological Ownership Routes Measurement Model
....................................................................................................................... 214
Figure 5.7. Visual Representation of the Psychological Ownership Routes Bi-factor
Measurement Model (Completely Standardised Solution) .............................. 216
Figure 5.8. Visual Representation of the Six Bi-factor Motivation to Pursue the Routes
towards Psychological Ownership Measurement Model ................................. 229
Figure 5.9. Visual Representation of the Reduced Psychological Ownership Measurement
Model (Completely Standardised Solution) ..................................................... 249
Figure 5.10. Stem-and-leaf plot of the reduced psychological ownership measurement model
standardised residuals .................................................................................. 254
Figure 5.11. Q- Plot of the Reduced Psychological Ownership Measurement Model 255
Figure 5.12. Visual Representation of the Reduced Psychological Ownership Structural
Model (Model A) (Completely Standardised Solution) ................................... 269
Figure 5.13. Visual Representation of the Modified Psychological Ownership Structural
Model (Model B) (Completely Standardised Solution)…………………………272
Figure 5.14. Stem-And-Leaf Plot for the Modified Psychological Ownership Structural Model
(Model B) .................................................................................................... 275
Figure 5.15. Q-Plot of the Modified Psychological Ownership Structural Model (Model B)
Standardised Residuals ................................................................................ 277
Stellenbosch University https://scholar.sun.ac.za

xiii
Figure 5.16. Narrow Focused Motivation to Pursue the Routes towards Psychological
Ownership Structural Model .......................................................................... 289
Figure 5.17. Bar Chart Representing Incidence of Congruence and Incongruence ........... 291
Figure 5.18. Scatterplot Representing Incidents of Congruence and Incongruence .......... 292
Figure 5.19. Response Surface Graph .............................................................................. 299
Figure 6.1. The Final Modified Psychological Ownership Structural Model ........................ 304
Stellenbosch University https://scholar.sun.ac.za

xiv
LIST OF TABLES
Table 2.1 Proposed Dimensions of Psychological Ownership Defined.............................. 28
Table 2.2 Distinctiveness of Psychological Ownership from other Conceptually Related
Organisational Behaviour constructs ................................................................ 34
Table 3.1 Summary Profile of the Sample Group ............................................................ 101
Table 3.2 Summary of Proposed Sample Sizes .............................................................. 104
Table 3.3 Boonzaier’s (2001) Tabulated Reliability Coefficients of the Job Characteristics
....................................................................................................................... 112
Table 3.4 Summary of the Representation of Latent Variables via Indicator Variables .... 116
Table 4.1 Ethical Principles and How They are to be Upheld .......................................... 136
Table 5.1 Guidelines for the Interpretation of Correlation Coefficients ............................ 141
Table 5.2 Summary of Reliability Results for the Composite Job-based Psychological
Ownership Survey Scales .............................................................................. 142
Table 5.3 Item Analysis Results for the Autonomy Subscale .......................................... 143
Table 5.4 Inter-item Correlation Matrix: Autonomy .......................................................... 144
Table 5.5 Item Analysis Results for the Task Identity Subscale ...................................... 144
Table 5.6 Inter-item Correlation Matrix: Task Identity ...................................................... 144
Table 5.7 Item Analysis Results for the Skill Variety Subscale ........................................ 145
Table 5.8 Inter-item Correlation Matrix: Skill Variety ....................................................... 146
Table 5.9 Item Analysis Results for the Task Significance Subscale ............................... 146
Table 5.10 Inter-item Correlations Matrix: Task Significance .......................................... 147
Table 5.11 Item Analysis Results for the Feedback Subscale ......................................... 147
Table 5.12 Inter-item Correlations Matrix: Feedback ....................................................... 148
Table 5.13 Item Analysis Results for the Individual Psychological Ownership Need for Self-
Identity Subscale .......................................................................................... 149
Table 5.14 Inter-item Correlation Matrix: Self-Identity ..................................................... 149
Table 5.15 Item Analysis Results for the Individual Psychological Ownership Need for a
Sense of Belonging Subscale ....................................................................... 150
Table 5.16 Inter-item Correlation Matrix: Sense of Belonging ......................................... 150
Table 5.17 Item Analysis Results for the Individual Psychological Ownership Need for a
Self-Efficacy or Effectance Subscale ............................................................ 151
Table 5.18 Inter-item Correlation Matrix: Need for Self-Efficacy or Effectance ................ 151
Table 5.19 Item Analysis Results for the Psychological Safety Subscale ........................ 152
Table 5.20 Inter-item Correlation Matrix: Psychological Safety ....................................... 153
Table 5.21 Item Analysis Results for the Motivation to Pursue the Routes to Psychological
Ownership Valence Subscale ....................................................................... 154
Stellenbosch University https://scholar.sun.ac.za

xv
Table 5.22 Inter-item Correlation Matrix: Motivation to Pursue the Routes to Psychological
Ownership Valence Subscale ....................................................................... 154
Table 5.23 Item Analysis Results for the Motivation to Pursue the Routes to Psychological
Ownership Expectancy Subscale .................................................................. 155
Table 5.24 Inter-item Correlation Matrix: Motivation to Pursue the Routes to Psychological
Ownership Expectancy Subscale .................................................................. 156
Table 5.25 Item Analysis Results for the Route of Intimate Knowledge Subscale ........... 157
Table 5.26 Inter-item Correlation Matrix: Intimate Knowledge ......................................... 157
Table 5.27 Item Analysis Results for the Route of Self Investment Subscale .................. 158
Table 5.28 Inter-item Correlation Matrix: Self-Investment ............................................... 158
Table 5.29 Item Analysis Results for the Route of Control Subscale ............................... 159
Table 5.30 Inter-item Correlation Matrix: Control of the Job ............................................ 159
Table 5.31 Item Analysis Results for the Psychological Ownership Subscale ................. 160
Table 5.32 Inter-item Correlation Matrix: Psychological Ownership ................................ 160
Table 5.33 Multi-dimensional Constructs ........................................................................ 162
Table 5.34 Summary Factor Analyses Results for the Composite Job-Based Psychological
Ownership Survey (CJBPOS) Scales/Subscales before Deletion of Items .... 163
Table 5.35 Factor Structure for the Autonomy Subscale ................................................. 164
Table 5.36 Factor Structure for the Task Identity Subscale ............................................. 165
Table 5.37 Factor Structure for the Skill Variety Subscale .............................................. 166
Table 5.38 Factor Structure for the Task Significance Subscale ..................................... 167
Table 5.39 Factor Structure for the Feedback Subscale ................................................. 167
Table 5.40 Factor Structure for the Need for a Sense of Self-identity Subscale .............. 168
Table 5.41 Rotated Factor Structure (Pattern Matrix) for the Need for a Sense of Self-
identity Subscale ........................................................................................... 169
Table 5.42 Factor Structure for the Need for a Sense of Belonging Subscale ................. 170
Table 5.43 Factor Structure for the Need for a Sense of Self-efficacy and Effectance
Subscale ....................................................................................................... 170
Table 5.44 Factor Structure for the Psychological Safety Subscale ................................ 171
Table 5.45 Rotated Factor Structure (Pattern Matrix) for the Psychological Safety Subscale
..................................................................................................................... 171
Table 5.46 Factor Structure for the Self-investment Subscale ........................................ 173
Table 5.47 Rotated Factor Structure (Pattern Matrix) for the Self-investment Subscale .. 173
Table 5.48 Factor Structure for the Intimate Knowledge Subscale .................................. 174
Table 5.49 Rotated Factor Structure (Pattern Matrix) for the Intimate Knowledge Subscale
.................................................................................................................... 175
Table 5.50 Factor Structure for the Control Subscale ..................................................... 176
Stellenbosch University https://scholar.sun.ac.za

xvi
Table 5.51 Rotated Factor Structure (Pattern Matrix) for the Control Subscale ............... 176
Table 5.52 Factor Structure for the Psychological Ownership Subscale ......................... 177
Table 5.53 Rotated Factor Structure (Pattern Matrix) for the Motivation to Pursue the
Routes to Psychological Ownership Valence Subscale ................................. 178
Table 5.54 Rotated 3-Factor Factor Structure (Pattern Matrix) for the Motivation to Pursue
the Routes to Psychological Ownership Valence Subscale ........................... 179
Table 5.55 Factor Structure (Forced One Factor) for the Motivation to Pursue the Routes to
Psychological Ownership Valence Subscale ................................................. 180
Table 5.56 Factor Structure for the Motivation to Pursue the Routes to Psychological
Ownership Expectancy Subscale .................................................................. 181
Table 5.57 Pattern Matrix for the Motivation to Pursue the Routes to Psychological
Ownership Expectancy Subscale .................................................................. 181
Table 5.58 Factor Structure (Forced One Factor) for the Motivation to Pursue the Routes to
Psychological Ownership Expectancy Subscale ........................................... 182
Table 5.59 Test of Univariate Normality for Job Characteristics before Normalisation .... 184
Table 5.60 Test of Multivariate Normality for Job Characteristics before Normalisation .. 185
Table 5.61 Test of Univariate Normality for Job Characteristics after Normalisation ....... 185
Table 5.62 Test of Multivariate Normality for Job Characteristics after Normalisation ..... 185
Table 5.63 Goodness of Fit Statistics for the Job Characteristics Measurement Model .. 188
Table 5.64 Theta-delta Modification Indices for the Job Characteristics Measurement
Model ............................................................................................................ 191
Table 5.65 Job Characteristics Bi-factor Measurement Model Goodness of Fit Statistics 194
Table 5.66 Job Characteristics Measurement Model Unstandardised Lambda-X Matrix . 195
Table 5.67 Job Characteristics Measurement Model Completely Standardised Lambda-X
Matrix ............................................................................................................ 197
Table 5.68 Job Characteristics Measurement Model Unstandardised Theta-delta Matrix 197
Table 5.69 Job Characteristics Measurement Model Completely Standardised Theta-delta
Matrix ............................................................................................................ 198
Table 5.70 Job Characteristics Measurement Model Phi Matrix ...................................... 199
Table 5.71 Job Characteristics Measurement Model Squared Multiple Correlations ....... 199
Table 5.72 Test of Univariate Normality for the Roots before Normalisation ................... 201
Table 5.73 Test of Multivariate Normality for the Roots before Normalisation ................. 201
Table 5.74 Test of Univariate Normality for the Roots after Normalisation ...................... 202
Table 5.75 Test of Multivariate Normality for the Roots after Normalisation .................... 202
Table 5.76 Individual Psychological Ownership Needs Measurement Model Goodness of
Fit Statistics .................................................................................................... 205
Stellenbosch University https://scholar.sun.ac.za

xvii
Table 5.77 Individual Psychological Ownership Needs Measurement Model
Unstandardised Lambda-X Matrix ................................................................. 206
Table 5.78 Individual Psychological Ownership Needs Measurement Model Completely
Standardised Lambda-X Matrix ..................................................................... 207
Table 5.79 Individual Psychological Ownership Needs Measurement Model
Unstandardised Theta-delta Estimates ......................................................... 208
Table 5.80 Individual Psychological Ownership Needs Measurement Model Completely
Standardised Theta-delta Estimates ............................................................. 208
Table 5.81 Individual Psychological Ownership Needs Measurement Model Phi Matrices
Unstandardised and Completely Standardised ............................................. 209
Table 5.82 Individual Psychological Ownership Needs Measurement Model Squared
Multiple Correlations for X-Variables ............................................................. 209
Table 5.83 Test of Univariate Normality for the Routes before Normalisation ................. 210
Table 5.84 Test of Multivariate Normality for the Routes before Normalisation ............... 210
Table 5.85 Test of Univariate Normality for the Routes after Normalisation .................... 211
Table 5.86 Test of Multivariate Normality for the Routes after Normalisation .................. 211
Table 5.87 Psychological Ownership Routes Measurement Model Goodness of Fit
Statistics ....................................................................................................... 213
Table 5.88 Psychological Ownership Routes Bi-factor Measurement Model Goodness of Fit
Statistics ....................................................................................................... 217
Table 5.89 Psychological Ownership Routes Bi-factor Measurement Model Unstandardised
Lambda-X Matrix .......................................................................................... 218
Table 5.90 Psychological Ownership Routes Bi-Factor Measurement Model Completely
Standardised Lambda-X Matrix ..................................................................... 219
Table 5.91 Psychological Ownership Routes Bi-factor Measurement Model Unstandardised
Theta-Delta Matrix ........................................................................................ 220
Table 5.92 Psychological Ownership Routes Bi-factor Measurement Model Completely
Standardised Theta-Delta Matrix .................................................................. 221
Table 5.93 Psychological Ownership Routes Bi-factor Measurement Model Unstandardised
Phi Matrix ...................................................................................................... 221
Table 5.94 Psychological Ownership Routes Bi-factor Measurement Model Squared
Multiple Correlations ..................................................................................... 222
Table 5.95 Test of Univariate Normality for Motivation to Pursue the Routes before
Normalisation ................................................................................................ 223
Table 5.96 Test of Multivariate Normality for Motivation to Pursue the Routes before
Normalisation ................................................................................................ 223
Stellenbosch University https://scholar.sun.ac.za

xviii
Table 5.97 Test of univariate Normality for Motivation to Pursue the Routes after
Normalisation ................................................................................................ 224
Table 5.98 Test of Multivariate Normality for Motivation to Pursue the Routes after
Normalisation ................................................................................................ 224
Table 5.99 Two Factor Motivation to Pursue the Routes towards Psychological Ownership
Measurement Model Goodness of Fit Statistics ............................................ 226
Table 5.100 Two Bi- factor Motivation to Pursue the Routes towards Psychological
Ownership Measurement Model Goodness of Fit Statistics ......................... 227
Table 5.101 Six Factor Motivation to Pursue the Routes Measurement Model Goodness of
Fit Statistics ................................................................................................. 228
Table 5.102 Six Bi-factor Motivation to Pursue the Routes towards Psychological
Ownership Measurement Model Goodness of Fit Statistics ......................... 230
Table 5.103 Motivation to Pursue the Routes towards Psychological Ownership Six, Bi-
Factor Unstandardised Lambda-X Matrix .................................................... 231
Table 5.104 Motivation to Pursue the Routes towards Psychological Ownership Six, Bi-
Factor Completely Standardised Lambda-X Matrix ...................................... 233
Table 5.105 Motivation to Pursue the Routes towards Psychological Ownership Six, Bi-
Factor Unstandardised Theta-Delta Matrix .................................................. 234
Table 5.106 Motivation to Pursue the Routes towards Psychological Ownership Six, Bi-
Factor Completely Standardised Theta-Delta .............................................. 235
Table 5.107 Motivation to Pursue the Routes towards Psychological Ownership Six, Bi-
Factor Squared Multiple Correlations .......................................................... 236
Table 5.108 Summary Item Analysis Statistics for the Motivation to Pursue the Routes
towards Psychological Ownership Six Factor .............................................. 237
Table 5.109 Summary Statistics for the Motivation to Pursue the Routes Six Factor – if
Items Deleted .............................................................................................. 238
Table 5.110 Test of Univariate Normality for the Psychological Ownership Measurement
Model before Normalisation ......................................................................... 241
Table 5.111 Test of Multivariate Normality for the Psychological Ownership Measurement
Model before Normalisation ......................................................................... 241
Table 5.112 Test of Univariate Normality for the Psychological Ownership Measurement
Model after Normalisation ............................................................................ 242
Table 5.113 Test of Multivariate Normality for the Psychological Ownership Measurement
Model after Normalisation ............................................................................ 242
Table 5.114 Psychological Ownership Measurement Model Goodness of Fit Statistics .. 245
Table 5.115 Psychological Ownership Measurement Model Completely Standardised
Lambda-X Matrix ......................................................................................... 246
Stellenbosch University https://scholar.sun.ac.za

xix
Table 5.116 Psychological Ownership Measurement Model Squared Multiple Correlations
for X-Variables ............................................................................................ 247
Table 5.117 Reduced Psychological Ownership Measurement Model Goodness of Fit
Statistics ...................................................................................................... 250
Table 5.118 Summary Statistics for the Psychological Ownership Measurement Model
Standardised Residuals ............................................................................... 254
Table 5.119 Modification Indices Calculated for the Lambda-X Matrix ............................ 256
Table 5.120 Modification Indices Calculated for the Theta-Delta Matrix .......................... 257
Table 5.121 Reduced Psychological Ownership Measurement Model Unstandardised
Lambda-X Matrix ......................................................................................... 259
Table 5.122 Reduced Psychological Ownership Measurement Model Completely
Standardised Lambda-X Matrix ................................................................... 262
Table 5.123 Reduced Psychological Ownership Measurement Model Squared Multiple
Correlations for X-Variables ........................................................................ 263
Table 5.124 Reduced Psychological Ownership Measurement Model Unstandardised
Theta-Delta Matrix ....................................................................................... 263
Table 5.125 Reduced Psychological Ownership Measurement Model Completely
Standardised Theta-Delta Matrix ................................................................. 265
Table 5.126 Unstandardised Phi Matrix .......................................................................... 267
Table 5.127 Reduced Psychological Ownership Structural Model (Model A) Goodness of
Fit Statistics ................................................................................................. 271
Table 5.128 Modified Psychological Ownership Structural Model (Model B) Goodness of Fit
Statistics ...................................................................................................... 273
Table 5.129 Summary Statistics for the Modified Psychological Ownership Structural Model
(Model B) Standardised Residuals .............................................................. 276
Table 5.130 Modified Psychological Ownership Structural Model (Model B) Unstandardised
Gamma Matrix ............................................................................................. 279
Table 5.131 Modified Psychological Ownership Structural Model Unstandardised Beta
Matrix (Model B) .......................................................................................... 280
Table 5.132 Modified Psychological Ownership Structural Model Completely Standardised
Gamma Matrix (Model B) ............................................................................ 281
Table 5.133 Modified Psychological Ownership Structural Model Completely Standardised
Beta Matrix (Model B) .................................................................................. 282
Table 5.134 Modified Psychological Ownership Structural Model Unstandardised Psi Matrix
(Model B)..................................................................................................... 283
Table 5.135 Modified Psychological Ownership Structural Model Completely Standardised
Psi Matrix (Model B) .................................................................................... 283
Stellenbosch University https://scholar.sun.ac.za

xx
Table 5.136 Squared Multiple Correlations for the Endogenous Variables of the Modified
Psychological Ownership Structural Model (Model B).................................. 284
Table 5.137 Modified Psychological Ownership Structural Model Modification Indices for
Beta (Model B) ............................................................................................ 285
Table 5.138 Modified Psychological Ownership Structural Model Modification Indices for
Gamma (Model B) ....................................................................................... 286
Table 5.139 Incidence of Congruence and Incongruence ............................................... 290
Table 5.140 Descriptive Statistics ................................................................................... 293
Table 5.141 Polynomial regression analysis ................................................................... 294
Table 5.142 Regression Output: Model Summary .......................................................... 295
Table 5.143 Regression Output: Anovaa ......................................................................... 296
Table 5.144 Statistical Significance of the Calculated Response Surface Test Values ... 297
Stellenbosch University https://scholar.sun.ac.za

1
CHAPTER 1
INTRODUCTION AND OBJECTIVES OF THE STUDY
1.1 INTRODUCTION
Mouton (2012) recognises the importance of putting research into perspective. He
proposed a “three world’s framework” (Mouton, 2012, p. 137) to aid in the understanding
of the interplay between the world of scientific research and everyday real world problems
and opportunities. This framework suggests that the research process begins by
identifying a real-life problem or opportunity in World one. Finding an effective way of
solving the World one problem or harvesting the opportunity is prevented by a lack of
insight into the manner in which World two operates. This real-life problem or opportunity
is then translated into a research initiating question that can then undergo the systematic
and rigorous enquiry of World two, the world of theory and nomological networks. Valid
understanding of the manner in which World two operates offers the possibility of deriving
effective ways of altering World one to the benefit of man. World three, in turn, is the world
of meta-theory that makes meta-theoretical assumptions about the nature of Worlds one
and two and that thereby regulates the manner in which the researcher interacts with
World two and World one.
The argument presented below will provide insight into a broad World one opportunity.
The emphasis will initially fall on aspects, or complex variables in an even more complex
web, which can potentially make the world work better. Moving the argument, in World
one narrower, by zooming in on the single variable, within the complex nomological
network of latent variables, of psychological ownership, brings about a number of
questions: Why do people experience differing levels of psychological ownership within
the work context? Why do certain individuals make their work space ‘their own’ while
others do not? What psychological, as well as environmental, mechanisms are at play that
influence an individual’s experience of feelings of ownership towards their job? By looking
at these questions and empirically testing a model that suggests interrelationships
between variables that influence psychological ownership we hope to aid in the
development of answers to World one problems and opportunities. The valid description
of the psychological mechanism that regulates differences in the level of psychological
ownership in turn offers the possibility of deriving practical measures aimed at enhancing
psychological ownership.
Stellenbosch University https://scholar.sun.ac.za

2
This introductory argument therefore defends the need for explanatory research aimed at
explaining variance in the endogenous latent variable psychological ownership (Pierce,
Kostova, & Dirks, 2001). This chapter will justify the research objective of developing and
empirically testing a comprehensive explanatory psychological ownership structural
model. Essentially, it is argued that organisations play a pivotal role in society, that
employee work performance plays a pivotal role in organisational success; that human
resource management plays a pivotal role in the management of employee work
performance, and that psychological ownership can play a pivotal role in the management
of employee work performance. It is moreover argued that the level of psychological
ownership that any specific employee achieves is complexly determined and that
purposeful and rational human resource management interventions are consequently only
possible to the extent to which the nomological network of latent variables underpinning
this latent variable is validly understood.
Organisations and their role in society
Organisations, originally referred to as corporations, derived from the Latin word corpus,
meaning ‘body of people’ (Berman, 1983, p. 5), exist for a purpose (Hunter, 2012). They
are constructed to serve a particular end or set of objectives (Bartram, Callinan, &
Robertson, 2002). As early as the 1930’s Coase (1937) postulated that this purpose can
be found in the division of labour. Hitt, Miller, and Collela (2009) concur with Coase (1937)
and suggest that organisations are primarily social arrangements, or collections of
individuals working together in a division of labour, to achieve a common goal. This
division of labour, and striving towards a common purpose, is justified by the fact that
organisations, or groups of people working together towards a common goal, can achieve
more than the sum of the individual achievements should the individuals working within
the organisation attempt to produce these working separately.
The cooperative benefit, resulting from the division of labour in organisations, therefore
enables organisations to provide goods and services to society more effectively and
efficiently than individual members of society can produce these goods and services for
themselves (C.C. Theron, personal communication, January 28, 2015). Organisations
strive to convert scarce factors of production into products and/or services1 that have
economic utility (De Goede & Theron, 2010) for society. This cooperative benefit, rooted
1 Products and/or services will be referred to as products from this point in the research study.
Stellenbosch University https://scholar.sun.ac.za

3
in the principle of economic utility, rests in a tacit agreement that exists between society
and organisations that demands the responsible utilisation of societal resources. In terms
of this tacit agreement, society will supply its most precious commodity, labour, and will
allow organisations access to other scarce resources like materials, under the proviso that
organisations will utilise this labour and transform these raw materials into products that
meet societal needs, that they will do so in a rational manner and that they will do so
without abusing man, as the carrier of the production factor labour, as well as the natural
environment.
In recent years much attention has been devoted to the concept of “systems” and the use
of “systems thinking” to frame and solve complex scientific and technological problems
(Cascio & Aguinis, 2011). When applied to organisations, this systems approach firstly
describes the dynamic relationship between the organisation as a system, and its sub-
systems, such as departments, that create this system. It secondly also describes the
dynamic relationship between the system and the supra-system within which they operate,
namely the external environment (Grobler, Warnich, Carrell, Elbert, & Hatfield, 2011).
Organisations are seen as components, or a collection of interrelated parts, created to
attain certain objectives in meeting the needs of society. These components include
inputs, throughputs, outputs and sub-systems, which make up the system as a whole, that
operate within an ever-changing larger environment that interacts with the system. Inputs
within this organisational context include all resources made available by society, imported
into the organisation, such as raw materials, energy, information, money, people,
machinery and equipment (Hunter, 2012) which are then transformed via a conversion
process (throughput) into market-satisfying products (outputs).
The external environment and its impact on organisations
As open systems, Cascio and Aguinis (2011) note that organisations are faced with
dynamic environmental conditions that have an impact on organisational effectiveness,
and subsequent profitability. These include, but are not limited to, aspects such as market
expectations, labour legislation, environmental legislation, a country’s political climate and
governmental regulation, as well as, globalisation, information technology, union strength
and influence, and diversity, for example.
South Africa faces unique human resource (HR) challenges fuelled in part by the country’s
turbulent political history, increasing the plight for HR to uphold the aforementioned tacit
Stellenbosch University https://scholar.sun.ac.za

4
agreement. These issues include, but are not limited to, aspects such as skills shortages,
unemployment rates as well as skill-migration, human capital flight or “brain drain”
(Nadeem, Kim, & Kim, 1995) and dispossession experiences of the past.
In order to attain this main objective of sustainably producing market-satisfying products,
organisations must produce products and supply them at the required quality, quantity,
price, time (Hunter, 2012) and at a profit. Profitability not only acts as a measure of
financial success, but acts as a marker for the successful utilisation of the scarce
resources society supplies, under the above mentioned provisos. Profitability can
therefore be seen as a measure of whether organisations are in fact making the best use
of the scarce resources provided by society, through creating products with minimum
wastage and by not combining and transforming resources into products that society does
not value. As mentioned, organisations attend to the needs of society by efficiently and
sustainably combining and transforming scarce inputs into products or services. Failing to
make a profit implies a failure on the part of organisations to attain “the highest possible
output of need-satisfying products and/or services with the lowest possible input of
production factors” (De Goede & Theron, 2010, p. 30) and subsequent wastage of
resources. Profit, on the other hand, points to efficient use of scarce societal resources.2
When the organisation transgresses the tacit agreement that exists between society and
organisations, that demands the responsible utilisation of societal resources, the supra
system reacts, in its own long-term interest, with punitive measures that threatens the
continued existence of the system.
The construct of performance within an organisational context
According to Theron and Spangenberg (2005) levels of organisational performance
achieved, or the success with which organisations meet societal needs, are not chance
events. Performance is “systematically determined by an intricate nomological network of
latent variables” (Theron & Spangenberg, 2005, p. 15). It can therefore be suggested that
improving organisational performance depends on the extent to which the “identity of the
latent variables comprising this nomological network are known, as well as the manner in
which they combine to affect the various organisational performance dimensions” (Theron
& Spangenberg, 2005, p. 35).
2 This line of reasoning does assume a fastidious, knowledgeable, sophisticated consumer.
Stellenbosch University https://scholar.sun.ac.za

5
Although organisations differ, groups of people, as members and resources of
organisations, remain the basic building blocks or ingredients of all organisations (Cascio
& Aguinis, 2011; Gibson, Ivancevich, Donnelly, & Konopaske, 2009). Aguinis, (2009)
states that the key competitive advantage in today’s globalised world lies, not in
technology and products, but in its people. De Goede and Theron (2010, p. 15) echo these
sentiments and describe labour as the “life giving production factor through which the other
factors of production are mobilised”. Therefore, labour represents the element that
determines the effectiveness and efficiency with which the other factors of production are
utilised and therefore ultimately determines organisational performance (De Goede &
Theron, 2010; Gibson, Ivancevich, & Donnelly, 1997). The effectiveness and efficiency
with which organisational units convert scarce factors of production into products that
satisfy societal needs, therefore depends, to a significant degree, on the performance of
their employees, as human behaviour is weaved throughout organisational performance
dimensions.
Individual employee performance, as an abstract latent variable or construct, is made up
of multiple components or dimensions (Koopmans et al. 2011) and is a phenomenon unto
itself (Kane, 1986). Two perspectives on individual employee performance are prevalent
throughout literature (Binning & Barrett, 1989), differing in terms of their emphasis. Some
scholars place relative emphasis on performance as a collection of overt job behaviours
(Aguinis, 2009; Campbell, 1990; Motowidlo, Borman, & Schmidt 1997; Weick, 1979)
aimed at achieving outcomes for which the job exists, whereas others place relative
emphasis on outcomes or results (Ainsworth & Smith, 1993; Bernadin, Kane, Ross, Spina,
& Johnson, 1995; Kane, 1986) that are achieved by performing certain actions. According
to Koopmans et al. (2011) the former is motivated by concern for developing psychological
theories that capture behavioural regularities important to organisational functioning. The
latter recognises the importance of goal attainment to organisational functioning.
In 1979, Weick proposed that the performance of any job in any organisation is a cluster
of interlocked and covariant behaviours, and this cluster consists of a subset of all possible
behaviours necessary for the organisation to accomplish its broader goals and objectives.
Campbell (1990) and Murphy (1989) similarly define performance from this micro-
definition perspective as actions or sets of behaviours that are relevant to organisational
goals. More specifically, Campbell (1990, p. 704) states that: “Performance is behavior. It
is something that people do and is reflected in the actions that people take...performance
is not the consequence(s) or result(s) of action; it is the action itself.” Moreover, he states
Stellenbosch University https://scholar.sun.ac.za

6
that performance consists of goal-relevant actions that are under the control of the
individual, regardless of whether they are cognitive, motor, psychomotor, or interpersonal.
This widely endorsed definition of work performance assumes that work performance
should be defined in terms of behaviour, rather than results or outcomes, and that work
performance includes only those behaviours that are relevant to the organisation’s goals.
Motowidlo, Borman, and Schmidt (1997) and Aguinis (2009) concur with Campbell’s
definition and the exclusion of results or outputs in the definition of performance.
Motowidlo et al. (1997, p. 72) state that performance is the “aggregated value to the
organization of the discrete behavioural episodes that an individual performs over a
standard interval of time.” According to this perspective performance is not about the
results of employee behaviours but only the behaviours themselves. Here performance is
judged by the actions undertaken by an employee in pursuit of organisational goals and
would include both productive and counterproductive behaviours. However, performance
defined using this narrow perspective only includes things that people actually do and
aspects that can be observed. This perspective ignores outcomes or results as part of the
performance construct.
Kane (1986) and others, (Ainsworth & Smith, 1993; Bernadin, Kane, Ross, Spina, &
Johnson, 1995) in both academic and practitioner-orientated literature on performance
management, conversely emphasise results or outcomes when defining performance.
From an outcomes-based perspective performance is seen as “the outcomes achieved in
carrying out the job function during a specified period,” (Kane, 1986, p. 237). However,
this similarly narrow, and not as well recognised, perspective on performance does not
capture the complexity and intricacy of performance and ignores how an employee brings
about these outcomes which are of value to the organisation, as well as other procedural
and interpersonal factors that influence performance (Williams & Fletcher, 2002).
In contrast to these, equally narrow, perspectives contemporary literature focuses on a
more wide-ranging definition of performance where performance consists of a performer
engaging in behaviour in a situation to achieve results or outcomes relevant to the
organisation. Viswesvaran and Ones (2000, p. 216) adopt this more inclusive perspective
regarding performance and define it as “scalable actions, behaviour and outcomes that
employees engage in or bring about that are linked with and contribute to organisational
goals.” Similarly, Bartram et al. (2002) and Bartram’s (2005) more general macro-
definition shares the emphasis between both results and behaviours to bring about these
results. They (Bartram et al. 2002, p. 7) refer to performance as “sets of behaviours that
Stellenbosch University https://scholar.sun.ac.za

7
are instrumental in the delivery of desired results or outcomes”. These theorists
emphasise the importance of focusing on performance as a behaviour-outcome latent
variable. Here performance is synonymous with results or outcomes that are favourable
to organisational goal attainment and the behaviours brought about by employees within
organisations to attain these outcomes. From this perspective, performance not only
entails collections of overt job related behaviours required to perform a job effectively, or
outcomes of job related behaviours, but rather an integrated combination of behaviour and
results that are vital to effective organisational functioning. It can therefore be argued that
there is an inextricable relationship between job behaviours and outcomes and that the
two are structurally interlinked. Therefore, for the purpose of this study performance is
seen as a richly interconnected model in which behavioural dimensions potentially affect
each other as well as multiple outcomes. These outcomes in turn affect performance
making these outcomes valuable to the organisation, and behaviours are the means to
these valued ends (Binning & Barrett, 1989).
HR’s role in the management of work performance
To bring about desired objectives, and optimum levels of organisational performance,
organisations, as systems of interrelated functions such as finance, design and
production, purchasing, sales and marketing, administration and human resources (HR)
management must be structured and organised (Bartram et al. 2002). Each sub-system
plays an important role in the delivery of market satisfying products. However, since
employee performance is such a vital component of organisational performance,
organisations wishing to remain competitive in their endeavour to satisfy societal needs
must address the issue of achieving productivity through their employees. HR
management, as a function within the organisational system, plays a vital role in
actualising the primary objective of providing products to society with economic utility. The
HR function does so by proactively and reactively enhancing the work performance of the
bodies of people that make up organisations through advice, diagnosis, structuring and
interventions in a manner that will benefit the quality of the product an organisation
provides to the market (Myburgh, 2013).
Research (Warnich, Carrell, Elbert, & Hatfield, 2015) indicates a strong relationship
between HR practises and bottom-line profits, and that the more successful companies
engage in more targeted HR practises than the less successful companies do. However,
the task of managing and developing an organisation’s human resources is a fluid and
Stellenbosch University https://scholar.sun.ac.za

8
challenging one (Cascio & Aguinis, 2011). The beginning of the 21st century heralded a
new phase in the management of people within organisations (Bronkhorst, 2011).
According to Grobler et al. (2011), modern HR management is radically different from
decades ago. With the decline of both the scientific management approach and the human
relations approach and the emergence of the human resources perspective, Grobler et al.
(2011) recognise that rather than addressing organisational and employee needs as
exclusive and separate, the human resource approach holds that they are mutual and
compatible. One can therefore not be gained at the expense of, or instead of, the other.
This approach highlights the need for interventions employed by HR, in an attempt to
improve performance, to be conducted not only to benefit the organisation, but also out of
a moral and ethical obligation, to afford employees an opportunity to flourish in their
organisational environment. The human resources perspective (Grobler et al. 2011)
thereby formally acknowledges the tacit agreement, existing between the organisation and
society, that organisations will have access to labour and natural resources with the
proviso that they will utilise and sustainably transform these into products that meet
societal needs, and that they will do so, not only without abusing man, but in a manner
that acknowledges man as an abstract-thinking, self-conscious, self-actualising being.
This approach to HR management encompasses the striving of the positive psychology
movement to focus on flourishing as opposed to repairing, moving away from a
preoccupation with repairing the worst things in life to building upon the positive qualities
of individuals and communities (Seligman & Csikszentmihalyi, 2000). This approach
focuses on strengths and positive features of individuals where the emphasis, specifically
within organisations, is promoting factors that allow individuals, groups and whole
organisations to thrive and function optimally (Luthans, 2011). There is a wide-ranging
consensus that the world in general, and our workplaces in particular, are in need of a
more balanced approach that takes into consideration both the positive and the negative,
both building on strengths and trying to correct weaknesses. The strategic HR
management perspective aligns well with the call of positive psychologists in their study
of the strengths that enable individuals and communities to thrive. With a belief that people
want to lead meaningful and fulfilling lives, to cultivate what is best within themselves, and
to enhance their experiences of work, organisations can become partners in their
employees’ striving for fulfilment, and self-actualisation, for their mutual benefit.
The effectiveness and efficiency with which employees bring life to the other factors of
production, in other words the level of performance delivered by an employee, as well as
Stellenbosch University https://scholar.sun.ac.za

9
the level of psychological well-being experienced by the employee, are not random
events. Rather, these are the expression of the lawful working of a complex nomological
network of latent variables characterising employees, as individuals, and their work
environment (Myburgh, 2013). The strategic approach to managing HR emphasises that
leveraging people’s capabilities is critical to achieving sustainable competitive advantage
(Warnich et al. 2015). Research into the complex psychological constructs, that underpin
the behaviour of working man, is therefore necessary in order to understand the complex
network of latent variables that underpin employee behaviour and to inform interventions
geared towards the effective and efficient use of society’s most precious resource –
human capital. Moreover, it emphasises the complexity of the psychological relationship
between working man and the world of work. It points to an even more intricate and
complex nomological network combining both employee constructs underpinning
individual behaviours and organisational constructs underpinning organisational
performance, moving away from a focus on one or the other. This highlights the need for
sound valid theoretical explanations for the different facets of working mans’ behaviour as
a fundamental and indispensable, though not adequate, prerequisite for efficient HR
Management (De Goede & Theron, 2010). Behavioural management advocate Daniels
(2000, p. 16) echoes these sentiments and states that:
Behavior Performance Management is not a good idea to be tried for a while and then
cast aside for some other good idea. It is a science that explains how people behave.
It cannot go away any more than gravity can go away. In a changing world, the science
of behaviour must remain the bedrock, the starting place for every decision we make,
every new technology we apply, and every initiative we employ in our efforts to bring
out the best in people.
Rational and purposeful HR interventions to improve employee work performance are
therefore only possible to the extent that the nomological network of latent variables
underpinning behaviour is validly understood.
Stellenbosch University https://scholar.sun.ac.za

10
Psychological ownership as part of the nomological network underpinning
behaviour
Psychological ownership, or the sense of ownership without any formal or legal claims of
ownership (Mayhew, Ashkanasy, Bramble, & Gardner, 2007), is one such construct3
within the complex network of variables underlying individual behaviour at work that holds
important implications for both employee work-performance and employee wellbeing.
According to Olckers (2014) organisations need employees that are psychologically
connected with their work, or organisation, in order to survive these dynamic unpredictable
times in business. Brown (1989) additionally states that it is psychological ownership that
makes the competitive difference and goes so far to state that the key to competitive
effectiveness in the 1990’s will be management’s knowledge of how to instill psychological
ownership.
Feelings of ownership have important psychological and behavioural effects (Pierce &
Jussila, 2011). A sense of ownership within the workplace is a “transforming sentiment”
(Druskat & Kubzansky, 1995, p. 5) that can potentially be harvested from current
approaches used to foster positive psychological and behavioural effects, such as work
reorganisation, job redesign and enrichment and programs used to achieve employee
commitment and empowerment. Druskat and Kubzansky (1995) argue that the decisive
motivational dimension of psychological ownership enhances commitment levels and
systematically guides employee activities toward organisational improvement and
efficiency. “When ownership sentiments arise, the worker's relationship to the employing
organization is transformed, and participation in, commitment to, empowerment by, and
responsibility for that organization may be seen as increasingly probable outcomes”
(Druskat & Kubzansky, 1995, p. 5). Furthermore, they argue that psychological ownership
is at the core of organisational efforts to enhance performance and employee
empowerment.
It can be argued that it is the concept of self-extension that forms the basis for the
importance of the construct of psychological ownership in employee and performance
enhancement. Psychological ownership has been linked to an individual’s sense of self or
3 This paper focuses on psychological ownership as a single construct in the complex nomological network of latent variables that underpin working man’s behaviour. This should not be interpreted as an argument that it is the most or only important variable in the network. But rather, that it is a latent variable that requires more attention as it seems to be a neglected area, specifically within the South African working environment.
Stellenbosch University https://scholar.sun.ac.za
11
an extension of the self (Pierce & Jussila, 2011; Pierce, et al. 2001; 2003). It has
additionally been postulated that when an employee’s sense of self is closely linked to the
job he/she holds within an organisation, a desire to maintain, protect or enhance that
identity results in an enhanced sense of responsibility for work outputs. Van Dyne and
Pierce (2004), in their three field studies on predicting employee attitudes and
organisational citizenship behaviour, found that psychological ownership added
significantly to the prediction of organisation-based self-esteem.
Researchers have additionally found that psychological ownership may predict effects
currently unaccounted for by other theoretical models and criterion variance that is
unaccounted for by other psychological constructs (Pierce et al. 2001). Therefore, feelings
of psychological ownership may be an integral part of the employee’s relationship with the
organisation and therefore the key to organisational competitiveness (Brown, 1989).
Psychological ownership has also been postulated as the most important ingredient in
transitioning teams from the traditional manager-led teams to self-managed teams.
Researchers (Avey et al. 2009; Baer & Brown, 2012; Mayhew et al. 2007; O'Driscoll,
Pierce, & Coghlan, 2006; Peng & Pierce, 2015; Pierce & Jussila, 2011; Pierce et al. 2001;
2003) additionally provide empirical evidence of the positive effects of psychological
ownership within the workplace. These include positive aspects from not only a
behavioural perspective but also a motivational and attitudinal perspective (Pierce &
Jussila, 2011). The limited research available provides some evidence of the link between
psychological ownership and employee performance both directly and indirectly via a
number of mediator variables.
Fiorito, Bozeman, Young, and Meurs (2007) state that psychological ownership may be
one of the variables that can serve as a predictor of organisational commitment, based on
their study of HR practices and other organisational characteristics that affect
organisational commitment. Avey et al. (2009) concur and view psychological ownership
as a positive resource for impacting human performance in organisations. In their
exploratory study on the components of an expanded view of psychological ownership
they found that there was a significant relationship between (promotive) psychological
ownership and several individual level outcomes. They found a positive relationship
between psychological ownership and desirable employee attitudes such as employee
commitment, job satisfaction and intentions to stay with an organisation.
Stellenbosch University https://scholar.sun.ac.za

12
Peng and Pierce (2015) recently found evidence that organisation-based psychological
ownership was positively related to job satisfaction and negatively related to knowledge
withholding. Furthermore, they found that job-based psychological ownership
(psychological connection to a role or job) was similarly positively related to job satisfaction
and additionally organisation citizenship behaviours. They additionally found that it was
negatively related to turnover intentions. These findings are supported by Van Dyne and
Pierce (2004) who similarly found positive relationships between job satisfaction,
organisational commitment and psychological ownership. O'Driscoll, Pierce and Coghlan
(2006) found a significantly positive relationship between psychological ownership and
employee affective organisational commitment (r=.45 for job psychological ownership and
r=.72 for organisation-based psychological ownership) in their study on the mediating role
of psychological ownership in the relationship between levels of work environment
structure and employee responses. Van Dyne and Pierce (2004) found that psychological
ownership for the organisation explained variance in organisational citizenship behaviour
over and above demographic characteristics, organisational commitment and job
satisfaction. They state that organisation-based psychological ownership increases the
ability of HR management to predict and understand employee attitudes and behaviours
over and above the two most commonly researched concepts namely organisational
commitment and job satisfaction.
Avey et al. (2009) research results provide support that having employees who feel like
owners is beneficial in terms of their work attitudes such as commitment, intentions to stay
with the organisation, and job satisfaction.
Olckers and Du Plessis (2012b) after an extensive thematic analysis of literature,
pertaining to the topic of psychological ownership and its role in retaining employees,
postulate that psychological ownership can benefit organisations because it leads
employees to feel a sense of responsibility towards organisations. They further suggest
that these feelings of responsibility subsequently lead to stewardship behaviours.
Furthermore, they propose that psychological ownership can help organisations to retain
talent and influence the intentions of skilled employees to remain with their organisations.
Wagner, Parker, and Christianson (2003) found that ownership behaviours are positively
linked to the financial performance of work groups. Researchers (Baer & Brown, 2012;
Pierce & Jussila, 2011) postulate that psychological ownership helps organisations remain
competitive in these constantly changing turbulent times. Baer and Brown (2012) found
that it may lead to positive orientations towards change, contingent upon the type of
Stellenbosch University https://scholar.sun.ac.za

13
change involved. It is therefore imperative to have an understanding of psychological
ownership and its relationship to change4 in order to encourage or evoke the positive
aspects of psychological ownership in the dynamic world of work, as opposed to the
negative outcomes.
Hou (2010) found that a positive link exists between users’ psychological ownership of
technology and their efforts to familiarise themselves with and learn the application or
software knowledge. This has implications in the world of work where technology is
continually changing and in order to remain competitive organisations have to remain
abreast of these changes. Therefore, enhancing levels of psychological ownership
experienced by individuals in the work place could allow for quicker adaptation to new
technological changes that provide organisations with a competitive edge.
Pierce and Jussila (2011), make several propositions surrounding the consequences of
feelings of ownership in organisations in their book Psychological ownership and the
organizational context: Theory, research evidence and application. They state that
feelings of ownership lead to positive motivational effects in terms of ownership motivation,
intrinsic motivation, and attitudinal effects in terms of satisfaction, organisational
comitment, affective commitment, normative commitment, continuance commitment,
organsational identification and internalisation, experienced responsibility and a self-
concept based on organisation-based self-esteem. They propose that, from a motivational
perspective5 for example, individuals that experience psychological ownership at work will
spend time and energy mentally and physically exploring the organisation and additionally
use the organisation as an expression of their self identity “through the personalisation of
space in and around the target; by integrating symbols and meaning of the organization
into one’s personal life” (p. 88). Common sense in conjunction with informal observation
suggest that if employees view their organisation as an extension of themselves, or their
job as an expression of who they are, that they will tend to the needs of the organisation
or job better.
In addition, Bernhard and O'Driscoll (2011) point out that several studies have empirically
demonstrated the importance of feelings of ownership in the absence of formal or legal
4 This statement assumes that the organisation monitors their external environment well and is well informed regarding change and the different types of change. 5 The topics of motivational, attitudinal and behavioural consequences will be discussed in more detail in Chapter 2. This is merely a high-level overview to provide evidence of the positive outcomes of psychological ownership.
Stellenbosch University https://scholar.sun.ac.za

14
ownership rights, within organisations (Mayhew et al. 2007; O’Driscoll, Pierce, & Coghlan,
2006).
In contrast to these positive attitudinal and behavioural effects of psychological ownership,
Brown, Lawrence, and Robinson (2005) caution that feelings of ownership can, however,
have a dark side. Pierce and Jussila (2011) similarly caution against focusing exclusively
on the bright side of psychological ownership and acknowledge that the construct can
have negative effects and potentially lead to counterproductive behaviours in the
workplace. They see psychological ownership as one of those forces at work, within an
individual employee, that may be related to counterproductive organisational behaviours,
such as resisting organisational change in a bid to maintain stability in the sense of self
when it is too deeply intertwined with that of the organisation, or with that of the current
job.
Other potential negative effects include hoarding information and not sharing resources
and tools required for the job due to overwhelming feelings of ownership and resistence
to relinquishing control over objects, due to feelings of strong self-identification with them.
In extreme cases this strong self-identification can lead to theft, or in cases where the
object of identification is lost employees may enlist in reactionary behaviours such as
destruction,vandalism or sabotage in order to prevent others from attaching to the target.
Furthermore, Guha (2009) states that very strong feelings of psychological ownership can
lead to escalation of commitment where individuals continue to be commited to a chosen
course of action even in the face of warning signs suggesting that it is a poor course of
action.
Pierce and Jussila (2011) however explain that fruition of these negative consequences
depends upon the routes to, and roots of, the feelings of ownership experienced. It is
therefore evident from the above that generally the enhancement of levels of
psychological ownership experienced by employees within an organisation serves positive
ends and is therefore valuable if HR management can employ interventions to enhance
these. However, interventions aimed at enhancing psychological ownership are not all
together without danger. It is therefore imperative that psychological ownership, as a latent
variable within the complex nomological network of latent variables that influence
employee behaviour, be properly understood before inventions are used to influence
levels of psychological ownership experienced by employees within organisations.
Stellenbosch University https://scholar.sun.ac.za

15
In understanding individuals at work and specifically the role of interventions employed to
enhance employee wellness through enhanced levels of psychological ownership, it is
important not to lose sight of the tacit agreement between organisations and society. HR
managements’ concern for the ‘what and how’ of managing people effectively, for higher
performance, in today’s organisations must still be conducted in a manner that not only
does not abuse man, as the carrier of the production factor labour, but utilises man in a
manner that offers the possibility of realising his full potential.
The aforementioned strategic HR approach stresses that managing employees as
complex, almost enigmatic, abstract-thinking, interpretive, self-conscious, self-actualising
people rather than psychologically primitive, physiologically motivated people that can be
treated as mere factors of production, could result in real benefits to both the employee
and the organisation. Here the premise is that employees are investments that can, if
properly managed and developed, provide long-term rewards to organisations and
benefits for themselves.
It is not enough to state that people are an organisations greatest asset. This asset must
be understood and managed properly if it is to contribute to the company’s bottom line
and therefore satisfy the needs of society while remaining viable in terms of economic,
social and environmental performance. HR management must understand the science of
behaviour properly in order to predict, develop and control it, to enhance not only individual
performance but additionally employee wellness. It can therefore be argued that HR
management is a custodian of certain provisos of the aforementioned tacit agreement. It
is a custodian in the sense that as a strategic business unit or partner, HR management
has the responsibility to care for, protect and enhance the scarce human resources
provided by society, while maintaining a certain level of organisational performance.
Sherry, Mainiero, and Mainiero (2007) propose that managing people effectively is the
most essential ingredient for organisations striving for economic power and improving the
quality of life for all citizens. However, it must be conducted in a manner that serves the
interests of all parties, from the organisation to the individual employee. Therefore, by
developing interventions that facilitate the growth of feelings of ownership of working man,
organisations offer mechanisms which satisfy this need for continual personal
improvement. Therefore, it can be suggested that the goal of HR management is to
enhance the human strengths and virtues, and allow individuals, organisations and in turn
society to flourish.
Stellenbosch University https://scholar.sun.ac.za

16
Therefore, by concentrating on the life-giving production factor, labour, and by
implementing an integrated set of HR interventions, to enhance employee work
performance, as well as employee wellness, through enhanced levels of psychological
ownership, in a manner that adds value to the organisation, HR management attempts to
contribute to the rationality with which the organisation serves the needs of society and in
a manner that honours the tacit agreement between the organisation and society.
Unique South African considerations justifying the development of
psychological ownership
It could be argued that there rests a moral responsibility on South African HR management
to enhance psychological ownership, especially in previously disadvantaged employees.
The previous political dispensation of Apartheid purposefully dispossessed Black South
Africans of ownership in so-called White geographical areas, prohibited access to specific
so-called Whites-only areas, separated husbands from their families in so-called
homeland areas, prohibited them from having citizenship and the right to vote (thereby
effectively disowning their country), prohibited them from entry into skilled, meaningful
jobs and restricted them to lower-level, menial jobs.
A person’s identity is inextricably linked to possessions or objects owned (Pierce et al.
2001; 2003). To a large degree an individual’s family, job, car and home plays a role in
defining the self or personal identity. To this end, eviction from land or a home, separation
from family, and being prevented from holding specific jobs, and subsequently being
forced to view the self as an unwanted alien, in so-called White South Africa, strips away
a significant part of an individual’s personal identity. Moreover, that which Black South
Africans were allowed to do and the areas where, and conditions under which, they were
forced to live continuously communicated an extremely negative message pertaining to
their self-worth.
Most importantly, however, Apartheid significantly restrained personal development and
prevented many Black South Africans from developing to their full potential. In the post-
democratic South Africa these restrictions formally no longer exist although their legacy
still does. As part of this legacy valid personnel selection procedures, used without
predictive bias tend to create adverse impact against Black South Africans (De Goede &
Theron, 2010). In the interest of complying with the provision in the tacit agreement
between organisations and society to utilise the human resources of society responsibly,
the problem of adverse impact needs to be treated. The identification of learning potential
Stellenbosch University https://scholar.sun.ac.za

17
combined with aggressive affirmative development has been suggested as an
intellectually honest way of alleviating the adverse impact problem without compromising
the rationality with which organisations serve society (De Goede & Theron, 2010; Van
Heerden & Theron, 2014).
To the extent that such affirmative development interventions will succeed the
demographic profile of South African organisations will gradually start to reflect the
demographic profile of the country. At least in the initial phase of transformation additional
HR challenges related to the appreciation of diversity and the retention of newly developed
talent will dominate. Along with these, the challenge of facilitating a sense of organisational
psychological ownership and enhancing job-based psychological ownership will present
itself. Both of these can be motivated in terms of the previously discussed organisational
outcomes and beneficial psychological states associated with these two forms of
psychological ownership as well as the positive impact it would have on the retention of
Black talent.
Over and above these considerations, however, there exists a moral imperative to
facilitate a state of organisational and job-based psychological ownership in Black
employees as an important, but not sufficiently recognised, component of an intellectually
honest interpretation of affirmative action. An intellectually honest interpretation of
affirmative action has to admit and apologise for the historical wrongs committed under
Apartheid, but then also has to affirm that apology, with tangible actions that attest to the
sincerity of the apology. Affirmative action, when interpreted in an intellectually honest
manner, should not only develop Black South Africans with potential to gain access to
jobs, that they should have occupied all along, but also to feel at home in the organisation,
and the job, and to authentically express who they are through the organisation they work
for, and the job that they do.
Concluding remarks
As can been seen from the above discussion, it it clear that developing HR interventions
in general, and interventions aimed at enhancing psychological ownership in particular, is
a complex task, but one that promises to produce mostly positive organisational outcomes.
It seems reasonable to argue then that any motivation for research surrounding the
behaviour of working man in general, and the influence of psychological ownership on
employees in particular, resides in the premise that the level of psychological ownership
Stellenbosch University https://scholar.sun.ac.za

18
experienced by employees is determined by a complex nomological network of latent
variables characterising the employee and the work environment.
Characterising this nomological network of latent variables as complex holds important
theoretical (but also methodological and practical) implications. It is therefore important to
explicate in what sense psychological ownership is assumed to be complexly determined.
The nomological network of latent variables characterising the employee, and the work
environment, can be considered to be complex in the sense that a large number of latent
variables are simultaneously at work. These latent variables are richly structurally inter-
connected, feedback loops exist through which downstream latent variables again affect
latent variables located further upstream in a causal chain, and latent interaction effects
exist through which the effect of one latent variable on another is potentiated. The
consequence of the combined effect of these characteristics is that the explanation of
variance in psychological ownership is not located in any specific structural relationship
but rather spread across the whole of the network (Cilliers, 1998).
In order to successfully develop and manage the levels of psychological ownership
experienced by employees within organisations, to aid in individual flourishing and ensure
optimal organisational performance, a valid understanding of the manner in which the
construct of psychological ownership is embedded in this complex nomological network
of latent variables is critical. Only to the extent that the identity of the determinants, that
directly and indirectly affect the level of psychological ownership that employees
experience, and the manner in which they structurally combine in the nomological network,
is validly understood would it allow HR management to rationally and purposefully affect
the well-being and work behaviour of employees and to develop appropriate interventions
to harness this psychological construct within the workplace. Research surrounding the
concept of psychological ownership therefore needs to address some unanswered
questions pertaining to the processes by which psychological ownership develops
(Dawkins, Tian, Newman, & Martin, 2017), within an individual, and how a target becomes
an inherent part of an individuals identity. This, in turn, could improve organisational
performance as well as employee wellbeing to better meet the needs of society.
1.2 RESEARCH INITIATING QUESTION
The research initiating question is consequently the open-ended question why variance in
psychological ownership exists across employees, jobs and organisations? The research
initiating question is purposefully formulated as an open-ended question to allow the
Stellenbosch University https://scholar.sun.ac.za

19
theorising in the literature study, presented in Chapter 2, to determine the research
problem and research hypotheses. It is only through prolonged, authentic, unbridled
intellectual wrestling with the research initiating question that research truly stands a
chance of gaining a valid understanding of the manner in which the construct of
psychological ownership is embedded in this nomological network of latent variables.
Ring-fencing a set of latent variables for inclusion in the study at the outset of the study
increases the risk that latent variables will be artificially forced into the research hypothesis
while crucial latent variables may be omitted. Latent variables have to earn their inclusion
in the overarching substantive hypothesis that is offered as an answer to the research
initiating question by being indispensable in the construction of a logically persuasive
explanation for variance in psychological ownership.
1.3 RESEARCH OBJECTIVE
The objective of the research is therefore to develop, in response to the research initiating
question, an explanatory psychological ownership structural model that provides a
description of the psychological mechanism that regulates the level of psychological
ownership that employees experience and to empirically test the validity of the model.
The manner in which the research objective is formulated and motivated creates the risk
of misperceptions. In general, the research objective is rooted in the positivistic paradigm
of the nature and development of knowledge. The research objective is however more
specifically rooted in the constructive alternativism principle proposed by George Kelly
(Pervin, Cervone, & John, 2005). Constructs (or latent variables) are abstract ideas, or
thought objects, created by the fluid intelligence of researchers to allow them to develop
explanatory structural models. The latent variables do not physically exist. The construct
psychological ownership as such does not exist6. No actual psychological mechanism that
regulates the level of psychological ownership exists.
The intention is to construct an explanatory psychological ownership structural model from
constructed latent variables to offer the possibility of gaining empirical control over the
behavioural denotations of the construct psychological ownership through an array of HR
interventions. The explanatory psychological ownership structural model will be regarded
as valid to the extent that it can successfully account for empirical observations made (e.g.
the observed covariances between denotations of the latent variables comprising the
6 The behavioural denotations of the construct psychological ownership do, however, exist.
Stellenbosch University https://scholar.sun.ac.za

20
model). A finding of close model fit means that it is permissible to regard the structural
model as a plausible description of a psychological mechanism that regulates the levels
of psychological ownership. A finding of close model fit therefore does not mean that the
model is correct. Alternative, equally plausible, constructions from different latent variables
are always possible. The question should therefore not be which one of the models is
correct. Rather, the question should be what useful practical suggestions each model
makes to influence the level of the construct of psychological ownership (more specifically
to influence the behavioural denotations that constitute the construct).
1.4 OUTLINE OF THE STRUCTURE OF THE THESIS
The aim of chapter one was to provide contextual background and evidence as to the
importance of further studies surrounding the topic of psychological ownership in the world
of work. Chapter two firstly provides a detailed conceptualisation of psychological
ownership in a literature study. This includes aspects such as how it compares to and
differs from other similar constructs in the field of positive psychology and organisational
behaviour and the different types of psychological ownership experienced. Chapter 2
moreover derives an array of path specific substantive research hypotheses on the identity
of person-centred and contextual latent variables that shape the level of psychological
ownership that employees experience, and the manner in which they structurally combine,
via a reasoned argument rooted in previous research on psychological ownership. These
path-specific substantive research hypotheses are at the end of the literature study
combined in a proposed psychological ownership structural model as an overarching
substantive research hypothesis on the nature of the psychological mechanism that
regulates the levels of psychological ownership experienced by employees. Chapter three
describes and motivates the research methodology chosen to empirically test this
proposed structural model and Chapter 4 explains the ethical considerations that
influenced the empirical part of the study. Chapter five reports and interprets the empirical
results. Chapter 6 discusses the findings on the validity of the overarching and path-
specific hypotheses derived in Chapter 2, acknowledges limitations, derives managerial
implications for HR practice and proposes recommendations for future research.
Stellenbosch University https://scholar.sun.ac.za

21
CHAPTER 2
LITERATURE STUDY
2.1 INTRODUCTION
“Science tries to free itself from ideas which, though commonly accepted, tend to
confusion when badly defined,” (Litwinski, 1942, p. 28). Litwinskis’ words highlight the
need to properly define and conceptualise the focal construct of interest, in a bid to uphold
the quality of scientific theorising. With regards to the construct of psychological ownership
Pierce et al. (2001) note that researchers have recognised that the construct may be an
important organisational variable related to performance. However, literature surrounding
the topic is nonetheless relatively sparse, especially from a South African perspective, and
lacks a general agreed upon taxonomy.
Psychological ownership research has, however, to some degree, been reignited in the
past decade and efforts are being made to empirically test theories surrounding the
antecedents and consequences of psychological ownership within the work place
(Asatyran & Oh, 2008; Baer & Brown, 2012; Bernhard & O'Driscoll, 2011; Hou, 2010;
Mayhew et al. 2007; O'Driscoll, Pierce, & Coghlan, 2006; Olckers & Du Plessis, 2012a;
2012b; Ozler, Yilmaz, & Ozler, 2008; Van Dyne & Pierce, 2004; Wagner, et al. 2003).
Despite this increase, the literature surrounding psychological ownership still pales in
comparison to more longstanding psychological constructs, such as motivation and
satisfaction. Additionally, several definitions of the psychological ownership construct
seem to exist within the literature and it seems that not all organisational scholars working
with the construct employ the same conceptualisation (Pierce & Jussila, 2011).
In order to uphold the call of academic rigour and precision, and to guide the development
of a structural model, the following section will formally conceptualise the construct of
psychology ownership as it will be employed throughout this research study. Once a
constitutive definition has been established this section will outline the reflective thinking
of the researcher and provide insights into the propositions surrounding the development
of psychological ownership, gained through theorising, and culminate in the development
of a proposed psychological ownership structural model.
2.2 CONCEPTUALISING THE CONSTRUCT OF PSYCHOLOGICAL OWNERSHIP
Constructs are abstract, “in the head”, thought objects (Kerlinger & Lee, 2000) created by
the abstract thinking capacity of man. It is this reflective reasoning that allows man to think
Stellenbosch University https://scholar.sun.ac.za
22
about, explain, communicate and create meaning through “heuristic hunches” (Kerlinger
& Lee, 2000, p. 9) about “objects of inquiry” (Mouton, 2012, p. 138) in World two (Babbie
& Mouton, 2001; Mouton, 2012). Hypotheses, models and theories, about specific World
one occurrences, are created that mobilise a different grade of thinking and that aspire to
explain phenomena and find meaning and truth to improve World one.
Kerlinger and Lee (2000) distinguish two dimensions of meaning, namely the connotative
and denotative dimensions of meaning. The connotative dimension of meaning represents
that which an individual has “in mind” when using the construct. The connotative meaning
of a construct is explicated through a process of conceptualisation and captured in a
constitutive definition (Kerlinger & Lee, 2000). The constitutive definition allows one to
obtain an intellectual grasp of the construct. The connotative meaning of a construct lies
in the internal structure of the construct and in the manner in which the construct is
embedded in a larger nomological network of constructs. In the latter sense the explication
of the connotative meaning of a construct is a continuously evolving process. The
conceptualisation of a construct can be considered to be valid if the constitutive definition
acknowledges all of the facets of the construct, that are implied by the manner in which
the construct is used in theorising, and if the dimensions constituting the internal structure
are mutually exclusive (Kerlinger & Lee, 2000).
The denotative dimension of meaning refers to the observable behaviours and
experiences in which the construct expresses itself and the situations that bring about
changes in the level of the construct. The denotations of the construct are utilised in the
operational definition of the construct. The operational definition provides an empirical
grasp of the construct and how it shall be measured or be experimentally manipulated.
Psychological ownership is a relatively new construct inspired by extensive literature on
the psychology of me and mine, possession and ownership (Belk, 1988; Dittmar, 1992;
Etzioni, 1991; Furby, 1976; 1991; Heider, 1958; James, 1890; Prelinger, 1959). Building
upon the conventional notion that ownership, accompanied by its rights and
responsibilities as stipulated by the legal system, leads to a caring and nurturing motive
by the owner, Pierce and his colleagues (2001) pioneered work surrounding psychological
ownership within organisations in the 21st century. They formally introduced the theory of
psychological ownership. Stimulated by the work of Etzioni (1991, p. 466) who stated that
ownership is a “dual creation, part attitude, part object, part in the mind, part ‘real”, they
defined psychological ownership as a state of mind in “which individuals feel as though
Stellenbosch University https://scholar.sun.ac.za
23
the target of ownership (material or immaterial in nature), or a piece of it, is "theirs" (i.e.,
"It is MINE!")” (Pierce et al. 2001, p. 299).
Although Pierce and his colleagues (Pierce et al. 2001; 2003) are prominent advocates of
psychological ownership, and their work is most often cited, when defining the construct
to date, this construct received attention in literature in the 1900’s (Beaglehole, 1932;
Brown, 1989; Duncan, 1981; Furby, 1976; 1980; 1991; Litwinski, 1942). Several
constitutive definitions for this construct have therefore been presented. Some capture the
essence of psychological ownership through possessive pronouns, such as Pierce et al.’s
(2001) definition above, while others define psychological ownership in terms of
sentiments, a felt concern or obligation (Brown, 1989) or an amalgamation of the above
mentioned approaches (Druskat & Kubzansky, 1995; Olckers & Du Plessis, 2012a). The
sections that follow describe the extant literature on psychological ownership to date, in
an attempt to solidify a constitutive definition of psychological ownership for this study.
Economic psychologist Leon Litwinski (1942, p. 30) stated that “to possess means the
power of becoming tied to an object”. Furby (1991) operationalised the ownership
construct with the word ‘mine’ and similarlly proposed that a sense of ownership or the
psychological state of ownership is based on feelings of being tied to an object. Pierce et
al. (2003, p. 86), stimulated by the work of Furby (1976; 1991), similarly view psychological
ownership from this possessive pronoun perspective. They argue that the complexity of
this construct is contained within the notion that it is a feeling. The word "feel" as employed
by Pierce et al. (2001, 2003) points to a complex affective and cognitive state experienced
by the individual. “It represents a condition of which one is aware through intellectual
perception. It reflects an individual’s awareness, thoughts, and beliefs regarding the target
of ownership. The cognitive state, however, is coupled with an emotional or affective
sensation” (Pierce et al. 2003, p. 86). At the core of psychological ownership, according
to Pierce et al. (2001, 2003, 2011), is a level of awareness and feelings of possessiveness
or of being emotionally attached to an object.
According to Van Dyne and Pierce (2004, p. 86) (organisational) psychological ownership
asks the question, “How much do I feel this organisation is mine?” They define
psychological ownership as “the psychologically experienced phenomenon in which an
employee develops possessive feelings for the target,” (Van Dyne & Pierce, 2004, p. 439).
This definition takes into account the inner workings of this phenomenon at an
intrapersonal level and similarly emphasises feelings of possession highlighted in Pierce’s
conceptualisation of psychological ownership as a cognitive-affective state.
Stellenbosch University https://scholar.sun.ac.za

24
Recent work on the topic of psychological ownership tends to adopt definitions developed
by Pierce (2001; 2003) and his colleagues. Olckers and Schaap (2013), two of the few
South African researchers interested in this construct, concur with the possessive pronoun
and feelings approach to conceptualising this construct (Pierce et al. 2001; Van Dyne &
Pierce, 2004). Olckers and Schaap (2013, p. 570) describe psychological ownership as a
phenomenon and define it as “a psychological experience of an employee when that
employee develops possessive feelings for the target of ownership.”
Bernhard and O'Driscoll (2011) cite Pierce’s definition and supplement it with the notion
that psychological ownership as a possessive feeling, or psychological attachment to an
object, leads to object protection, care and nourishment as an outcome of psychological
ownership. This definition points to psychological ownership as not only a cognitive-
affective state but also a conative state where the possessive feelings and emotions
attached to the target influence an individuals motivation to behave protectively towards
that target. Druskat and Kubzansky (1995), building on earlier conceptualisations (Furby,
1976; Litwinski, 1942), similarly view the psychological sense of ownership as a sentiment
with behavioural inclinations. Ownership sentiments are referred to as expressions of a
claim toward a target about which one uses the pronoun “my” or “mine” with greater or
lesser intensity. Here psychological ownership is “conceptualized as a cluster of
behaviours, cognitions and feelings often embodying intense affective and motivational
components,” (Druskat & Kubzansky, 1995, p.4).
Ozler, Yilmaz, and Ozler (2008) similarly conceptualise feelings of possessiveness as
cognitive and emotive attachment with a conative element. They define psychological
ownership as a cognitive and emotive attachment between the individual and the object,
which in turn influences an individual’s conduct. Asatyran and Oh (2008) likewise point
out that this psychological state has an influence on behaviours from a relational
perspective. They argue that these feelings of ownership can become the foundation of a
continuous relationship with an object, such as a job or organisation. These definitions
again highlight both an emotional and behavioural or outcomes perspective of
psychological ownership.
Brown, (1989, p. 15) emphasised that psychological ownership is about “people working
as if they own the place.” At first glance this definition seems to highlight a behavioural
perspective based on outcomes brought about by an employee which would normally be
enacted by an owner. However, Brown additionally postulates that the motivation to
behave like, or the action of working as if an employee is, an owner, is accompanied by a
Stellenbosch University https://scholar.sun.ac.za

25
shared sense of responsibility, with subsequent feelings of accountability. Researchers
(Avital & Vandenbosch, 2000; O'Reilly, 2002; Parker, Wall & Jackson, 1997) concur with
Brown’s emphasise on responsibility and similarly focus on a felt concern and a sense of
responsibility in their definitions of the construct of psychological ownership.
Both Parker et al. (1997) and Avital and Vandenbosch (2000) for example, define
psychological ownership in terms of a concern for, or a felt responsibility for, a specific
target. Parker et al. (1997, p. 904) employ different terminology referring rather to
production ownership that entails the “work problems or goals that someone owns or feels
responsible for.” O’Reilly (2002), in contrast, looks at responsibility for long-term decision
making. O’Reilly (2002, p. 9) states that (organisational) psychological ownership is “a
feeling on the part of employees that they have a responsibility to make decisions that are
in the long-term interest of the company”.
Pierce and Jussila’s (2011) assertions regarding psychological ownership differ from the
thoughts of the above scholars who theorise that psychological ownership involves
responsibility. Pierce and Jussila argue that psychological ownership and responsibility
are two distinct states. Furthermore, they suggest that responsibility is an outcome of a
sense of ownership and that the two constructs have a reciprocal relationship but that
responsibility is not a dimension of, nor does it define, psychological ownership.
Avey, Avolio, Mhatre and Crossley (as cited in Pierce and Jussila, 2011, p. 17) see
psychological ownership as emerging from a “set of corresponding states”. They believe
that psychological ownership develops when an employee simultaneously experiences
feelings of belongingness, accountability, self-identity and self-efficacy within their job or
workplace. In more recent studies Avey et al. (2009) however cite O’Reilly (2002) and
Pierce et al. (2001, 2003) definitions, as provided above, and classify psychological
ownership as a latent variable that should be considered, together with the psychological
capital latent variables (Luthans & Youssef, 2004), as a positive psychological resource
that fosters positive organisational behaviour.
Druskat and Pescosolido (2002, p. 291) define psychological ownership as “a state of
mind that changes one’s relationship to work by strengthening feelings of responsibility
and influence over how it gets done,” thereby categorising psychological ownership as a
cognitive-affective-conative state. Asatyran and Oh (2008) concur and state that people
develop attitudes that are highly possessive in nature towards items that they own. These
attitudes in turn become the underpinning of a continuous relationship with the object.
Stellenbosch University https://scholar.sun.ac.za

26
Bernhard and O'Driscoll (2011) state that these strong possessive feelings and a high
degree of psychological attachment to a target are key characteristics of psychological
ownership. These definitions highlight the integrated cognitive, affective and conative
nature of psychological ownership and the behavioural outcomes as a result of this sense
of ownership.
Psychological ownership as a proposed multidimensional state
The dimensionality of the construct of psychological ownership, as presented in the
literature (Avey, et al. 2009; Olckers & Du Plessis, 2012a; 2012b; Olckers & Schaap,
2013), generates a sense of uneasiness and therefore requires further elaboration before
a constitutive definition can be developed.
The literature on psychological ownership (Avey et al. 2009; Olckers & Du Plessis, 2012a;
2012b; Olckers & Schaap, 2013) suggests that it is a complex multidimensional construct.
Dimensions of psychological ownership would refer to qualitatively distinct aspects or
characteristics of the construct that vary in magnitude across individuals and that
collectively constitute the level of psychological ownership experienced by an individual.
Upon initial investigation there seem to be two approaches to the dimensionality of
psychological ownership. Earlier work by Druskat and Kubzansky (1995) presents the
dimensions of ownership as pride and identity, empowerment influence, voice, information
and insider status, and responsibility and burden-sharing. More recent work by Avey et al.
(2009), Olckers and Du Plessis (2012a; 2012b) and Olckers and Schaap, (2013), building
on earlier research, presents a slightly adjusted taxonomy using the types of psychological
ownership, namely preventative and promotative, as a classification system. These
different approaches will be briefly discussed.
Pride and identity as a dimension proposed by Druskat and Kubzansky (1995) is seen as
an aspect of psychological ownership whereby an indivdual identifies with the target and
by taking ownership communicates to others, and to themselves, a certain expression of
identity. This proposed dimension has evolved in the literature and is now seen as self-
identity (Olckers & Du Plessis, 2012a).
Empowerment influence and information and insider status are two dimensions linked by
the individuals need for power and a sense of entitlement to preferential status. As
dimensions of psychological ownership Druskat and Kubzansky (1995) posit that they
encompass an individuals right to authority over the target or object.
Stellenbosch University https://scholar.sun.ac.za

27
Responsibility and burden sharing are encapsulated in an individual’s sense of possessive
caring or nurturing of the target. This is seen as the defensive function of territorial claiming
(Druskat & Kubzansky, 1995) whereby an individual seeks to protect the target and
maintain the rights and responsibilities that accompany a sense of ownership.
Drawing on Brown’s conceptual review of territoriality and Furby’s (1991)
operationalisation of ownership, Druskat and Kubzansky (1995) identified the
aforementioned analytic dimensions as central to psychological ownership. In more recent
literature these dimensions have however been renamed or set aside, as seen in studies
by Avey et al. (2009) and more recently Olckers and Du Plessis (2012a; 2012b).
A simple framework developed by Avey et al. (2009) and further expanded upon by
Olckers and Du Plessis, (2012a) at first glance seems to provide a satisfactory taxonomy
of the dimensions of psychological ownership. Building on Pierce et al.’s (2001) roots of
psychological ownership, Avey et al. put forward territoriality and accountability, as well
as belonging, self-efficacy and self-identity as dimensions of psychological ownership.
Olckers and Du Plessis then proposed that the dimensions of psychological ownership
should be classified in terms of the two different types of this psychological state. Here the
dimensions are dividied in terms of preventative and promotative ownership7. Olckers and
Du Plessis therefore similarly propose territoriality and accountability as well as belonging,
self-efficacy and self-identity as dimensions and additionaly posited autonomy and
responsibility as dimensions defining psychological ownership. Table 1 below briefly
provides an outline of these dimensions as defined by Avey et al. and Olckers and Du
Plessis.
In their more recent research Olckers and Du Plessis, (2015) seem to adopt the taxonomic
framework of Pierce et al.’s (2001) original research and do away with the reference to
dimensions.
Upon deeper investigation, and much introspection, it therefore seems as though this
framework and the proposed dimensionality of the construct of psychological ownership
should be challenged. Revisiting the origins of the theory of psychological ownership
suggests that psychological ownership should rather be conceptualised as a
unidimensional, but nonetheless complex, construct.
7 The distinction between preventative and promotative psychological ownership will be explained and discussed in paragraph 2.2.4 below.
Stellenbosch University https://scholar.sun.ac.za

28
Table 2.1
Proposed Dimensions of Psychological Ownership Defined
Type of
psychological
ownership
Dimensions of
psychological
owenrship
Summary definition (adapted from Olckers and Du
Plessis, 2012a & Avey et al. 2009)
Promotative
psychological
ownership
Self-efficacy The ability to interact and control’s one’s environment or
target successfully. Believe in oneself, that a task is possible
due to the individuals own ability, leads the individual to feel a
sense of ownership toward the task. Feelings of control
therefore lead to feelings of self-efficacy. ‘‘I need to do this
task, I can do it, and I therefore own the responsibility for
achieving success’’ (Avey et al. 2009, p. 177).
Self-identity Possessions act as symbolic expressions of the self.
Belongingness The interaction between an individual and the environement
and the subsequent personalisation of the environment which
in turn results in the expression of the self.
Accountability Accountability as a dimension of psychological ownership is
seen through (1) the expected right to hold others accountable
and (2) the expectation for one’s self to be held accountable
for an object.
Autonomy Actng in accordance with ones genuine interests, values and
desires.
Responsibility The act of controling and protecting tangible and intangible
objects or possessions.
Preventative
Psychological
ownership
Territorality An individuals expresssion of ownership for tangible and
intangible objects, a form of marking.
Pierce et al. (2001) and especially Van Dyne and Pierce (2004) and Pierce and Jussila
(2011) seem to interpret psychological ownership as a complex unidimensional
psychological state in which the integrated cognitive, affective and conative nature of
psychological possession is experienced. Grasping the connotative meaning of this
unidimensional construct really requires lengthy reflection that includes some
introspective inspection of one’s own experiences of psychological ownership. Although
psychological ownership, and what this construct represents to an individual, initially
seems to be instinctively understandable, capturing this understanding in a clear and
concise constitutive definition remains challenging. In search of a clear constitutive
definition the risk of confounding antecedents and consequences of the construct with the
Stellenbosch University https://scholar.sun.ac.za

29
construct itself becomes very real. The current study would contend that perhaps Avey et
al. (2009) and Olckers and Du Plessis (2012a; 2012b) fell prey to this error.
The core connotative meaning of psychological ownership as a construct is integrated in
the cognitive, affective and conative experience of owning or possessing a (material or
immaterial) target object. Intellectual awareness/realisation/insight that the target of
ownership is mine is inseparably intertwined with some degree of, protective affection for
the target object, intertwined with the realisation that the target of ownership has to some
degree become part of my understanding of who I am. The target object is mine, not yours,
an extension of me. More subtle than the cognitive and affective texts, is a conative
subtext that points to an inclination/willingness to act in the best interest of the target
object. A construct is the abstract theme [or themes] shared by the bundles of observable
behaviours and experiences that the construct represents. In the experiences associated
with psychologically possessing a material or immaterial target object cognitive, affective
and conative strains of meaning exist inseparably intertwined.
Earlier foundational work by Pierce et al. (2001) and more recent publications (e.g. Pierce
& Jussila, 2011) seem to argue that what is sometimes referred to as dimensions of
psychological ownership should rather be treated as latent variables required to describe
the psychological mechanism through which psychological ownership develops and the
consequences that flow from this psychological state. This will be discussed under Section
2.4 below.
Promotion- versus prevention-orientated psychological ownership
Avey et al. (2009) propose two types of psychological ownership based on regulatory
focus theory (Higgins, 1997) and goal appraisal. When applying Higgins’ theory to
psychological ownership Avey et al. suggest that individuals who are more promotion
oriented (pursue goals that reflect their hopes and aspirations) will approach the target
differently to those that are prevention oriented (avoid punishment by following certain
rules). These two self-regulatory mechanisms are seen to influence an individual’s
feelings towards a target. An individual with a prevention-oriented focus would, when it
comes to sharing of information that could lead to change, withhold information, whereas
an individual with a promotion-oriented focus would share any information which would
assist in the change process. Promotion-oriented psychological ownership can therefore
be seen as the extent to which the psychological ownership towards a target (an idea,
information and the like) may be used for the good of the job (or organisation). Prevention-
Stellenbosch University https://scholar.sun.ac.za

30
oriented psychological ownership is therefore seen as the extent to which an individual
who feels psychological ownership towards a target may withhold the target in order to
maintain stability (Avey et al. 2009; Olckers & Du Plessis, 2015) and not risk losing control
over the possession.
Concluding remarks on the conceptualisation of psychological ownership
The definitions and comparisons above provide a detailed picture of the construct of
psychological ownership and its complexity. Although differing in emphases the definitions
of psychological ownership share a common thread. The commonality resides in the
development of psychological ownership as a latent variable that evolves through an
intrapersonal process toward an external target (material or immaterial). Some definitions
emphasise merely the cognitive processes, and the subsequent feelings (affective)
towards an object, while others extend the notion of awareness and feelings to their
influence on motivational processes (conative) to behave in a certain way toward the
target.
Certain scholars argue that the construct of psychological ownership can be better
understood by comparing and contrasting it to that of attitudes (Wagner et al., 2003). In
terms of the similaritites psychological ownership and attitudes are both made up of
multiple components including cognitive, affective and conative components, can be
directed at individual or group levels and at a variety of objects, material and immaterial.
Although attitudes and the psychological sense of ownership share some similarities these
two constructs are, however, conceptually distinct. Psychological ownership, is seen as
non-evaluatory in nature, as opposed to attitudes. Attitudes are seen as an evaluative
tendency towards a target, whereas psyhological ownership is seen as a sense of
possession for a target that is seen as an extension of the self.
When examining Litwinski’s definition it can be argued that the use of the word “power”
points to Pierce et al.’s (2003) notion of the psychological interactions working within each
and every individual in terms of the ability and desire to have feelings toward a target.
When unpacking the concept, as defined by Furby as ‘mine’, earlier writings by Dittmar
(1992) provide much insight. Dittmar describes possessions that are labelled as ‘mine’ as
being part of ‘me’. In this way it is then difficult to separate what is mine from me. According
to Pierce and Jussila (2011) our possessions define us and are therefore an important
expression of who we are both to ourselves and to others. This lends itself toward a
conclusion that there is a connection between the self and possessions, both material and
Stellenbosch University https://scholar.sun.ac.za

31
immaterial in nature. Possessions are therefore seen as an extension of, or expression
of, oneself. It can therefore be argued that individuals will not merely become tied to any
object since the target or object should reflect a certain element of the “owner”. This line
of reasoning aligns well with Etzionis’ (1991) assumption that part of the dual creation or
processes involved in psychological ownership are ‘part object’.
Before settling on a single constitutive definition of psychological ownership it is important
to differentiate it from ownership that is legally quantifiable. Pierce et al. (2003, p. 87)
states:
Although possibly related, legal and psychological ownership differ in
some significant ways. For example, legal ownership is recognized
foremost by society, and hence the rights that come with ownership are
specified and protected by the legal system. In contrast, psychological
ownership is recognized foremost by the individual who holds this
feeling. Consequently, it is the individual who manifests the felt rights
associated with psychological ownership.
Formal or legal ownership therefore pertains to ownership that is quantifiable in the eyes
of the law (Dawkins et al. 2017). This relates to items such as the home one owns and the
car one drives, for example. Once an individual has purchased this object they receive “a
bill of rights” or deed of ownership that, from a legal perspective, grants certain rights and
responsibilities to the owner. Formal ownership, or ownership that is legally quantifiable,
is a multidimensional phenomenon. It constitutes the above mentioned rights (or legal
aspect of ownership) and responsibilities that are defined by the legal system (Pierce et
al. 2003) and are the “real” aspects of ownership (Pierce & Jussila, 2011, p. 12) as well
as the psychological sense of ownership and feelings toward this purchased target.
Scholars (e.g. Avey et al. 2009; Furby, 1976) suggest that individuals may still experience
a sense of ownership despite not satisfying the criteria of formal ownership, or having the
legal connection to the target. Psychological ownership therefore does not necessarily
presuppose the legally quantifiable component of formal ownership and can operate
without legal ties toward an object or target. An individual can therefore feel a connection
or attachment towards an object, and a sense that it is ‘theirs’ or ‘mine’, without legally
owning it.
Although certain above mentioned scholars suggest that psychological ownership is a
multidimensional state, when revisiting the initial theory of psychological ownership, while
bearing the definition of dimensionality in mind, as mentioned, it seems reasonable to
Stellenbosch University https://scholar.sun.ac.za

32
argue against this train of thought. The suggested dimensions of psychological ownership
such as self-efficacy, self-identity, belonging, autonomy, territoriality and the like could
rather be considered as causes of psychological ownership (in terms of individual needs)
that reside within the individual and not characteristics of the construct that could vary in
magnitude and therefore influence levels of psychological ownership experienced by the
individual. Additionally, some of these posited dimensions could be thought of as
consequences, more specifically responsibility and territoriality.
Therefore, it seems reasonable to suggest that psychological ownership can be seen as
a unidimensional intrapersonal state brought about by individual characteristics (individual
needs, for example) that align with the characteristics of the target (job autonomy, for
example), which are seen as an extension of the self. Therefore, the way in which an
individual, views him/herself in relation to the target of ownership, feels they, as opposed
to others, have a degree of control over the target and/or experiences a sense of belonging
and/or stimulation, will influence the development of psychological ownership experienced
through subsequent behaviour towards the target. These roots and routes (Pierce, et al.
2001) are, however, in the current study not regarded as dimensions of psychological
ownership but rather as antecedents through which psychological ownership develops.
The notion that psychological ownership is a psychological state furthermore implies that
this construct is an emotion “partly determined by the provocative power of specific
situations” (Pervin et al. 2005, p. 245). This line of reasoning emphasises the temporal
nature of feelings of ownership and subsequently the fact that this construct can be
moulded or changed. Psychological ownership as a state, as opposed to a trait which
refers to “consistent patterns in the way individuals behave, feel and think” (Pervin, et al.
2005, p. 223), is therefore seen as a temporal construct, caused by external
circumstances, likely the target and the context (together with individual characteristics).
Job-based psychological ownership for example, which refers to feelings of ownership
within a specific job, implies a psychological state that reflects an individual’s current
position or feelings with regards to an existing job (Mayhew et al. 2007). Should the
employee change jobs these feelings of ownership would in turn change. This line of
reasoning seems reasonable in that since the target has changed, different attributes
within this new target could be activating and satisfying different needs within the
individual. This then in turn would lead to the activation of different routes and
subsequently different levels of psychological ownership.
Stellenbosch University https://scholar.sun.ac.za

33
It therefore seems reasonable to argue that psychological ownership is a psychological
state, in terms of which a bond, relationship or feeling, that encompasses
conceptual/intellectual (cognitive), emotional (affective) and motivational (conative)
processes and directs these processes at an object, in this case the job, that is seen as
an extension or expression of one’s self. This unidimensional state is characterised by not
only cognitive and affective properties but additionally by conative elements. These
cognitive, affective and conative aspects should, however, not be seen as distinguishable
dimensions of psychological ownership but rather as inseparably entwined properties of a
unitary state of psychological ownership. For the purposes of the current study (promotive,
individual, job) psychological ownership will therefore be defined as:
a unidimensional integrated psychological (cognitive, conative and affective) state where an
individual experiences a protective, affectionate, possessive self-defining bond or connection
with a target object, in this case an employee’s job, which is seen as a needs satisfying
expression of the self.
2.3 THE QUESTION OF DISTINCTIVENESS
Within the field of organisational research there lies the real probability of concept
redundancy. Responding to Morrow’s (1983) plea for further research in the domain of
organisational commitment to provide evidence of distinctiveness this section, drawing
predominantly from the work of Pierce and Jussila (2011), outlines the characteristics of
psychological ownership that make it distinct from other psychological constructs that find
their place within the nomological network of latent variables which underpin behaviour in
the workplace. Scholars (e.g. Pierce et al. 2001; 2003; Mayhew et al. 2007; Van Dyne &
Pierce, 2004) posit that psychological ownership, as a construct, is fundamentally different
from related constructs like commitment, identification, internalisation, psychological
empowerment and job involvement and that it adds incremental explanatory power to
these constructs to explain variance in several attitudes and behaviours relevant within
the working context. These differences are suggested to revolve around the conceptual
core (i.e., possession), motivational bases, development and consequences of
psychological ownership. Pierce et al. (2001; 2003) compare psychological ownership to
other work-related attitudes such as affective organisational commitment, identification
and internalisation. Table 2.2 below outlines the summary provided by Pierce and Jussila
(2011) and extends it to include attachment and job satisfaction and job involvement.
Stellenbosch University https://scholar.sun.ac.za

34
Table 2.2
Distinctiveness of Psychological Ownership from other Conceptually Related Organisational Behaviour constructs
Dimensions of distinctiveness
Psychological ownership Commitment Identification Internalization Psychological empowerment
Job involvement
1. Conceptualcore
Possessiveness Desire to remain affiliated
Use of element of organizations identity to define oneself
Shared goals or values
Achieving orientation to work role
Identification with one’s job
2. Questionsanswered forthe individual
What do I feel is mine? Should I maintain membership?
Who am I? What do I believe? Can I shape my work role?
How important is my job to me?
3. Motivationalbases
Efficiency/effectance Self-identity Need for place
Security Belongingness Beliefs, values
Attraction Affiliation, holism Self-enhancement
Need to be right Belief and values
Self-efficacy Self-esteem Access to info, rewards
Importance of work Satisfying self-esteem
4. Development Active imposition of self on organization
Desire to maintain membership
Categories of self with organization Affiliation, Emulation
Adoption of organization’s goals or values
Believe in competence Autonomy Impact on outcomes
Psychological importance at work
5. Type of state Affective/cognitive Affective Cognitive/perceptual Cognitive/objective Affective/perceptual cognitive
Affective/attitude
6. Selectconsequences
Rights and responsibilities Promotion of/resistance to change. Frustration, stress, refusal to share Worker integration Alienation Stewardship and OCB
OCB Intent to leave Attendance
Support for organization and participation in activities Intent to remain Frustration/stress Alienation Anomie
OCB Intent to leave In-role behaviours
Effective role performance Concentration Resilience Innovation
Intrinsic motivation Intent to remain Low level of absence
7. Rights Right to information Right to voice
None None None Meaningful work Access to information Rewards
Meaningful work Adequate supervision
8. Responsibilities Burden sharingActive and responsible voice Becoming informed Protecting Caring for and nurturing Growing/enhancing
None Maintaining the status of the desire attribute
Goal and value protection
Capacity to perform activities with skill
Source: Adapted from Olckers and Du Plessis (2012b); Pierce, et al. (2001)
Stellenbosch University https://scholar.sun.ac.za
Stellenbosch University https://scholar.sun.ac.za

35
2.4 DEVELOPING A HYPOTHESIS ON THE NATURE OF THE PSYCHOLOGICAL
MECHANISM REGULATING THE LEVELS OF PSYCHOLOGICAL OWNERSHIP
In an attempt to build a theory of psychological ownership it is important to go beyond the
definition of psychological ownership and draw the full structure and complexity of the
richly interconnected psychological mechanism that regulates the levels of psychological
ownership that individual’s experience (Swedberg, 2012). The emphasis of this section
will turn to the determinants or causes of psychological ownership, classified by Pierce et
al. (2001, 2003) as the roots of, and routes to, psychological ownership. Some, more
indirect antecedents of psychological ownership will additionally be investigated in an
attempt to develop detailed hypotheses of the psychological mechanism regulating
feelings of ownership.
The development of these detailed hypotheses, and subsequent explanatory
psychological ownership structural model, is however not a simple undertaking. The
complexity is fuelled by the fact that the levels of psychological ownership that are
experienced by employees are influenced by several latent variables that share
interconnected relationships within the nomological network of latent variables
underpinning psychological ownership. Furthermore, the explanation of psychological
ownership (or the understanding of the psychological mechanism) cannot be isolated to
any one specific latent variable within this model or to any single structural relationship
between any two latent variables, underpinning psychological ownership, but is rather
spread across the entire model.
This presents a challenge in that it is difficult to distil a specific starting point for the
argument as to what constitutes the initial variable or point of departure within the
development of feelings of ownership, experience by an individual, within the work place.
It must be noted here that should the full complexity of this explanatory structural model
wish to be realised it would take an immense amount of effort and time to fully capture it.
Therefore, due to the constraints of conducting research within an academic timeline the
intention is to capture an explanatory model that at least closely approximates reality, with
the hope to expand the research in future.
Before venturing into World two, in an attempt to uncover the cunning logic and elegant
design (Ehrenreich, 1991) characterising the psychological mechanism proposed to
influence levels of psychological ownership, it is important to obtain clarity with regards to
the current study’s meta-theoretical position on the existence of a psychological state such
Stellenbosch University https://scholar.sun.ac.za

36
as psychological ownership. Therefore, a discussion on the proposed determinants or
causes of psychological ownership would be incomplete without an examination of the
role of biological, psychological or social influences that explain the existence of this
psychological state. In order to understand why individuals experience varying levels of
psychological ownership we must first grapple with why psychological ownership
(denotatively) exists in the first place.
Several standpoints are present within the literature surrounding the emergence of
psychological states in general, and feelings of ownership specifically. Some suggest that
the origins of possessive feelings lie within an individual’s innate genetic structure (Burk,
1900; Dittmar, 1992; Litwinski, 1942; Porteous, 1976; Weil, 1971) while others (Furby,
1976; 1980; Kline & France, 1899; Mead, 1934) postulate that this psychological human
condition is brought about by socialisation practices within society.
From an inherent genetic perspective these scholars (Burk, 1900; Dittmar, 1992; Litwinski,
1942; Porteous, 1976; Weil, 1971) believe that the need to possess is genetic, hereditary
and evolutionary and is therefore a product of an innate instinct (or need) within each and
every one of us to have, possess and amass, what we feel is ours, which develops through
the survival value of feeling attached to objects. Dittmar (1992) explains that advocates
for this instinctual approach focus on the biological basis for social phenomenon, such as
acquiring and retaining possessions. An individual’s relationship with a material
possession is seen as “the consequence of an acquisitive disposition which has biological
survival value” (Dittmar, 1992, p. 23). Examples given as evidence of this innate tendency
of meum and tuum8 (mine and thine) include childhood possession or hoarding of toys
(‘my toy’, ‘mine’), nursery rhymes (‘Read me my nursery rhyme’), (‘It’s time for my bed
time story’) and parents (‘my mommy’) at a very young age, as well as the universal
impulse of all of mankind, and various animal species, to collect and hoard various objects
(Furby, 1978). Heider (1958) observes that attitudes of ownership are common among
people, pointing to genetic origins and according to McDougall (as cited in Dittmar, 1992,
p. 24) this impulse “ripens naturally and comes into play independently of all training.” As
an instinct psychological ownership would therefore be seen as an unlearned tendency to
respond in a possessive, protective, caring manner to objects, that emerges under certain
8 Meum and tuum refers to the acknowledgement of ‘what is mine’ and ‘what is yours’. Baldwin (as cited in Litwinski, 1942) asserts that even animals display behaviour which recognises ‘what is mine’ (meum) and ‘what is yours’ (tuum). Some birds for example claim a nest and in so doing the whole tree becomes ‘theirs’. While they ignore another birds nest and subsequently their tree. For the purposes of this study the focus is on meum therefore all examples refer to behaviour suggesting ‘what is mine’.
Stellenbosch University https://scholar.sun.ac.za

37
stimulus situations, and functions as a motivational force behind complex human
behaviours, found universally within a species (human kind) (Reber, 1985). Beaglehole
(1932), however, argued that there is little evidence to support propositions of an innate
possessive instinct.
Others (Furby, 1976; 1980; Kline & France, 1899; Mead, 1934) believe it to be a product
of socialisation, in terms of social and cultural factors, carried out in society. While Furby
(1980) agrees that the origins of possession are universal (Reber, 1985) she additionally
states that it is the “interaction with environmental restriction which occasions the
development of a notion of possession” (Furby, 1980, p. 36). Mead (1934) likewise asserts
that when an individual claims that something is his (or hers), he (or she) is “appealing to
his rights because he is able to take the attitude which everybody else in the group has
with reference to property, thus arousing in himself the attitude of others”9 (Mead, 1934,
p. 162). Mead therefore suggests that the relationship between a person and his or her
possessions is one that occurs within the context of other people or society. Furby (1980)
moreover states that the complexity of possessive behaviour increases with age. She
attributes this to the fact that the developmental process of possessive behaviour depends
so heavily upon the social system. Ozler et al. (2008) concur and suggest that the meaning
of possessions is created through social interaction and therefore possessions have no
meaning when seen in insolation. Here, an individual’s feelings towards an object begins
via interactions with the target as well as society or the community.
Litwinski (1942), although describing feelings of possession as innate instincts, alludes to
the fact that the developmental process plays a role, suggesting a sociobiological
perspective. According to Litwinski the impulse to possess “must be considered as an
innate tendency though, in spite of the fact that doubtless it owes much of its strength, as
well as the direction which its development takes, to example and social education”
(Litwinski, 1942, p. 36). This begins to highlight a combined approach where genetics as
well as social aspects play a role in the development of psychological phenomena.
After highlighting the different aspects of both the nature and nurture approaches Dittmar
(1992) asserts that neither of these approaches in isolation captures the essence of the
origin of a psychological state such as psychological ownership. Rather, it can be argued
that a combination of the two is necessary. She suggests that biology potentially
9 The author notes the potentially sexists use of language in this citation. It has been included unedited for its overall contribution to the research project.
Stellenbosch University https://scholar.sun.ac.za

38
influences possessive feelings however she argues that “social and cultural factors
significantly influence how people relate to their material possessions,” (Dittmar, 1992, p.
36). Pierce et al. (2001) in their attempt to theoretically answer the question, why
psychological ownership exists, concur with Dittmar and argue that not only genetic factors
play a role but that social experiences that an individual is exposed to, and surrounded
by, will inevitably influence this psychological phenomenon. Psychological ownership from
this sociobiological perspective therefore “emerges because it satisfies certain human
motives, some of them genetic and others social in nature,” (Pierce et al. 2001, p. 300).
Pierce et al. (2001) highlight that an individuals’ relationship with their possessions is
complex and motivated by several factors. They suggest that individual differences such
as individualism versus collectivism, as well as factors such as job involvement and
organisation-based self-esteem influence individual need satisfaction within the
workplace, and subsequently act as evidence of the complexity of the path to
psychological ownership and the relationship between an owner and a target. Etzionis’
(1991) proposition that possession is a dual creation points to the influence of a process
facilitated by several factors, constructed through attitude, the mind, and the
characteristics of the target.
In brief, Pierce et al. (2001) in their theory of psychological ownership, initially argue that
psychological ownership serves the individual needs or motives of efficacy and effectance,
self-identity and having a place. More recently, they have added a fourth motive,
stimulation (Pierce & Jussila, 2011). These motives, or roots, facilitate the development
of, but do not directly cause, the state of psychological ownership. Furthermore, they
suggest that three basic experiences or routes namely, the ability to control the target, the
opportunity to procure information about the target and the opportunity to invest one’s
energy and self into a target, facilitate the emergence of feelings of ownership (Ozler et
al. 2008; Pierce et al. 2001). These routes to psychological ownership are seen as the
paths through which individuals, and therefore employees within organisations, begin to
experience psychological ownership. Pierce et al. (2001) suggest that these routes
answer the question “How do organisational members come to feel psychological
ownership?”
These roots and routes will now be discussed in more detail as components of the
psychological mechanism believed to influence the level of psychological ownership
experienced.
Stellenbosch University https://scholar.sun.ac.za

39
Roots of psychological ownership – intrapersonal antecedents
In response to the question, what is the motivation or function served for the individual by
this psychological state, Pierce et al. (2001) suggest four roots of psychological ownership.
These roots are the motive of efficacy and effectance, the need for self-identity, the need
to have a place (Pierce et al. 2001) and most recently the need for stimulation (Pierce &
Jussila, 2011). These roots “are latent conditions that become activated at different times
and to varying degrees as people interact with a variety of potential targets of ownership,”
(Pierce & Jussila, 2011, p. 48).
Firstly, Pierce et al. (2001; 2003), stimulated by Furby’s (1978) control model10, propose
that efficacy and effectance motivation is an individual’s desire to be in control of
possessions and changes within that individual’s environment. According to White (1959)
an individual’s desire to effectively interact with their environment is reflected by this need.
This motive is satisfied by a sequence of simultaneous effects. An individual initially has
the ability to influence the target and therefore influence the environment (Bandura, 1997;
Pierce et al. 2001; 2003). In turn, the individual experiences pleasure producing feelings
and an increased sense of efficacy at ‘being the cause’ of an altered environment (Pierce
& Jussila, 2011) and as such “the desire to experience causal efficacy in altering the
environment leads to attempts to take possession and to the emergence of ownership
feelings” (Pierce et al. 2001, p. 300).
Furby links feelings of control to that of self-expression and believes that “possessions
constitute extensions of the self primarily because they express a person’s ability to exert
direct control over her or his social and physical environment” (Dittmar 1992, p. 58). This
points to the second motive proposed by Pierce et al. the need for self-identity. Pierce et
al. (2001; 2003) believe that feelings of ownership are grounded in an individuals need for
self-identity. It is suggested that individuals, in an attempt to understand themselves,
express themselves to others and maintain a sense of continuity of self-identity, will attach
themselves, and create a relationship, with an object or several objects. Several scholars
(Dittmar, 1992; Ferraro, Escalas & Bettman, 2011; Furby, 1978; James 1890) suggest that
there is a close relationship between a person’s identity and their possessions. According
to Ferraro et al. (2011) the value of possessing and possessions runs deeper than
ownership and an object’s functional value (Furby, 1978). Dittmar explains that
10 Furby suggests that an individual’s relationship with possessions lies predominantly in the effectance motivation whereby an individual is driven by the desire to influence outcomes within their environment.
Stellenbosch University https://scholar.sun.ac.za

40
“possessions fulfil both instrumental and symbolic functions as self-extensions” (Dittmar,
1992, p. 57). Possessions are suggested to help an individual to ‘create themselves’ and
therefore become a representation of the self (Ferraro et al. 2011). Possessions therefore
act as an extension of one’s self, communicating to the world ‘this is mine, this is me’
(Hillenbrand & Money, 2015).
James (1890, pp. 279-280) points to the psychological link between possessions and the
self:
a man's Self is the sum total of all that he CAN call his, not only his
body and his psychic powers, but his clothes and his house, his wife
and children, his ancestors and friends, his reputation and works, his
lands, and yacht and bank-account. All these things give him the same
emotions.
James (1890) highlights that possessions, as extensions or a part of the self, bring about
certain feelings within individuals. Ferraro et al. (2011, p.170) state that “possession–self
linkages develop as a consequence of a possession's ability to represent the important
domains upon which a person bases self-worth”. From a biopsychosocial perspective it
seems reasonable to argue that this self-worth is constructed by the interplay of meanings,
created by the individual themselves, as well as society, surrounding targets/objects. In
this way an individual may attach the meaning ascribed to an object by society to their
own self-identity, and in turn communicate this meaning as a form of self-expression
through ownership.
The third motive that acts as an underlying reason for feelings of ownership relates to the
need to belong or have a place (Pierce et al. 2001, Pierce & Jussila, 2011). This refers to
an individuals need to feel ‘within’ and ‘a part of’ a place. ‘Home’ provides an element of
safety as well as a mechanism for self-expression, through self-invest11 in terms of
decorating and maintaining, for example. From a psychological perspective, objects that
are considered ‘home’ are those objects that an individual has invested themselves into
emotionally and physically (Pierce & Jussila, 2011). Therefore, the concept of home is not
limited to a dwelling per say, but rather it can be argued that “it is an outgrowth of the need
for and the location of the self in time and space” (Pierce & Jussila, 2011, p. 46). It could
therefore be argued that this could extend to an employee’s job within the organisational
context. The need to find one’s ‘place’ and invest one’s energy into a job that allows for
11 This route will be discussed in more detail in Section 2.4.3 and 2.4.5.
Stellenbosch University https://scholar.sun.ac.za

41
personalisation and development of the self as well as a safe place for self-expression
within the job.
Lastly, a more recent addition to Pierce et al. (2001) motives for psychological ownership
is the need for stimulation (Pierce & Jussila, 2011). Pierce and Jussila (2011) believe that
it is the need for stimulation that attracts specific objects into a person’s realm as they
seek to remain stimulated by possessions. Here, an individual’s psychological relationship
with an object is said to be stimulated by action and arousal. This motive, according to
Pierce and Jussila, is the reason behind seeking new possessions and creating bonds
with, and searching for, new objects that offer stimulation.
It is the opinion of the author that this need for stimulation could possibly be interpreted
as an individual’s changing self-identity. It seems reasonable to argue that as individuals
interact with their environment, within different contexts, and at different life stages, they
might build upon their own self-identity. These “changes” in self-identity would therefore
lead to connections to, or feelings of ownership for, new objects, as expressions of the
self. It is suggested here that the stimulation produced by an object or target is not
satisfying a need for arousal/stimulation but rather the satisfaction of the individual need
for self-identity. For example, the case of a female employee in her 30s. In the prime of
her career she is focused and career-driven, spending her time engaged in activities that
involve personal and company development and enhancement. She finds her work to be
a good expression of who she is – a career driven women of the 21st century. However,
as she begins to focus on a new role or identity, that of a care-giver and mother, her self-
identity or self-concept begins to transform. Shifting her self-identity away from being
career-driven towards being a mother. She takes maternity leave and ‘owns’ her
motherhood experience. Returning to work she finds herself seeking a new form of identity
as a working mother and her sense of ownership now adjusts once again.
According to Pierce and Jussila (2011) an individual cannot experience psychological
ownership for immaterial and material objects or targets that do not allow these, above
discussed, intra-individual forces (Pierce & Jussila, 2011) to activate and be fulfilled,
(Olckers & Van Zyl, 2015) should the individual experience these needs or any one of
these needs as salient. Pierce and Jussila additionally suggest that only one (or any
combination) of these motives needs to be aroused for subsequent feelings of ownership
to develop. They, therefore, suggest that it is not necessary for all four, in the researchers
opinion all three, of the motives to be activated for this psychological state to develop.
They, furthermore, suggest that these motives for psychological ownership are not seen
Stellenbosch University https://scholar.sun.ac.za

42
as an end-in-and-of themselves, as independent variables or drivers. Rather they serve
an instrumental or utilitarian function. It is through the satisfaction of these needs that the
routes are engaged and subsequently psychological ownership develops.
From the preceding discussion it seems evident that the relationship between objects,
such as an employee’s job, and the self is not a simple one. Dittmar (1992) states that an
owner’s relationship with his or her possessions is complex and more than dyadic. It
entails the meaning placed upon the object by not only the owner but also society. This
meaning additionally changes through an interaction between the individual, the object
and society. This implies a triadic, interactive, cyclical relationship consisting of the object,
and the meaning ascribed to the object by the individual as well as the meaning ascribed
to the object by society.
Additionally, throughout the literature there seems to be a dynamic interaction between
these motives, hinging on the need for self-identity. It is the researchers’ opinion that this
self-identity motive could potentially be the strongest of the three motives served by
feelings of psychological ownership. However, the link between effectance motivation and
a need to belong, as discussed above, and self-identity is noted. Here the act of
controlling, or the ability to control, brings that object into the “realm of the extended self”
(Pierce & Jussila, 2011, p. 41) and one’s ‘place’ is found in the objects “in which an
individual finds a strong sense of ‘identification’” (Pierce & Jussila, 2011, p. 46). This
seems to signify an interactive relationship between the motive of efficacy and the need
for belonging, grounded in the need for self-identity.12 However, for the purposes of this
study the motives described above will be treated collectively as needs13.
The interplay between the target and the owner
The needs, discussed above in Section 2.4.1, are viewed by Pierce and Jussila (2011) as
the conative engines that motivate an individual to act upon, or engage with, a target. As
alluded to earlier, ownership in general, and psychological ownership specifically, is a
“relationship”, albeit purely (or not, as the case may be with physical [material]
possessions legally purchased) a psychological one, between a target (material or
12 The interplay between the motives of effectance, need for self-identity and belonging is an area that has not received much empirical attention to date and therefore remains murky. 13 This is noted as a potential weakness of this study. By treating the needs collectively the model could potentially loose the essence of the strength of each of the needs and their individual influence on the development of feelings of ownership.
Stellenbosch University https://scholar.sun.ac.za

43
immaterial) and an owner. This relationship therefore consists of an owner and a target,
each with their own attributes. Within the work environment, and for the purposes of this
study, this relationship involves an employee, as the owner, and a job, as the target.
Pierce and Jussila (2011), as well as Furby (1978) and Dittmar (1992) suggest that target
attributes play an important role in influencing the levels of ownership feelings experienced
by an individual. Firstly, target attributes impact the need-satisfying potential of the target,
which act as the initial stimulus for feelings of ownership. Pierce et al. (2003, p. 98) suggest
that a targets attributes allow for these individual needs or motives to “operate and to be
satisfied”. It is therefore reasoned here, that the above mentioned, routes to feelings of
ownership will not be activated unless the routes are seen to be instrumental in the
satisfaction of the individual needs. More specifically, employees will not invest the self in
the job, unless doing so is perceived to likely result in outcomes that will satisfy salient
needs. Therefore, should a target’s attributes or characteristics not be perceived to satisfy
at least one of the roots, as an initiating mechanism, then it is reasonable to assume that
the routes will not be activated and feelings of ownership will not develop. Likewise, it
could be argued that if the strength/salience of the roots, as the initiating mechanisms, are
low the routes to psychological ownership will not be activated even when the job
possesses attributes that could be instrumental in satisfying the psychological ownership
need. A roots by target attributes interaction effect is therefore implied by this line of
reasoning.
Secondly, Pierce and Jussila (2011) argue that the target, or specifically certain
characteristics of the target, could additionally either hinder or facilitate these routes to
psychological ownership. Revisiting Etzionis conceptualisation of ownership as a dual
creation encompassing individual emotions as well as target characteristics and elements
of an individual’s psyche, this seems not an altogether unreasonable stance to hold.
However, it seems more plausible to suggest that this aiding and hindering of the levels
of psychological ownership by the characteristics of the job, is captured within the job
characteristics ability to satisfy the individuals need for belonging, need for self-identity
and need for efficacy which in turn could move the employee to engage in self-investment.
It therefore seems reasonable to argue that the characteristics of the job do play a vital
role in the development of psychological ownership through the interaction between the
individual’s needs and the characteristics of the job.
Given that the attributes of the target play an important role in influencing the levels of
psychological ownership that the owner experiences towards the target, the question
Stellenbosch University https://scholar.sun.ac.za

44
arises as to what the identity of these attributes are? The paragraphs that follow therefore
attempt to clarify this potential relationship within the complex nomological network of
latent variables, which could potentially influence levels of psychological ownership, in
greater detail.
2.4.2.1 Target attributes
Hackman-Oldham (1976) presented the Job Characteristics Model as a potential
taxonomy or framework for positive work outcomes and motivated behaviour via critical
psychological states. This framework is presented below in Figure 2.1. The hypothesis
that the subsequent section will attempt to develop is that the Hackman-Oldham job
characteristics constitute relevant job attributes which make investing the self in a job, that
scores high on the job characteristics, instrumental in satisfying the root need through the
experience of psychological ownership. This model will therefore be used to provide a
potential framework that “specifies the conditions under which individuals will become
internally motivated” (Hackman & Oldham, 1976, p. 250) to attach to and invest the self in
the job.
The Hackman-Oldham Job Characteristics Model recognises that certain job
characteristics play a role in contributing to certain psychological states experienced by
employees which in turn influence work motivation and job outcomes. Hackman and
Oldham (1976) suggest that certain core job characteristics such as autonomy, feedback,
skill variety, task significance and task identity lead to critical psychological states. They
propose that skill variety, task identity and task significance lead to experienced
meaningfulness, autonomy leads to feelings of responsibility and feedback from job
activities leads to knowledge of results.
Stellenbosch University https://scholar.sun.ac.za

45
Core job characteristics Critical psychological
states
Personal and work
outcomes
Variety of skill Experienced
meaningfulness
of the work
High internal work
motivation
Identity of the task High quality work
performance
Significance of the task High satisfaction
with the work
Autonomy Experienced responsibility
for outcomes of the work
Low turnover and
absenteeism
Feedback Knowledge of actual
results of the work
activities
Employee growth
need strength
Figure 2.1. The Hackman-Oldham Job Characteristics Model of Work Motivation
(Hackman & Oldham, 1976, p. 256)
The section that follows briefly outlines the definition of these Job Characteristics and
Psychological States as per the Hackman and Oldham model:
Skill variety - “The degree to which a job requires a variety of different activities in carrying
out the work, which involve the use of a number of different skills and talents of the
person,” (Hackman & Oldham, 1976, p. 257).
Task identity – “The degree to which the job requires completion of a "whole" and
identifiable piece of work; that is, doing a job from beginning to end with a visible outcome,”
(Hackman & Oldham, 1976, p. 257).
Stellenbosch University https://scholar.sun.ac.za
46
Task significance – “The degree to which the job has a substantial impact on the lives or
work of other people, whether in the immediate organization or in the external
environment,” (Hackman & Oldham, 1976, p. 257).
Autonomy – “The degree to which the job provides substantial freedom, independence,
and discretion to the individual in scheduling the work and in determining the procedures
to be used in carrying it out,” (Hackman & Oldham, 1976, p. 258).
Feedback - “The degree to which carrying out the work activities required by the job results
in the individual obtaining direct and clear information about the effectiveness of his or her
performance,” (Hackman & Oldham, 1976, p. 258).
The three critical psychological states are defined by Hackman and Oldham (1976, pp.
256-257) as follows:
Experienced meaningfulness of the work - The degree to which the individual experiences
the job as one which is generally meaningful, valuable, and worthwhile.
Experienced responsibility for work outcomes - The degree to which the individual feels
personally accountable and responsible for the results of the work he or she does.
Knowledge of results - The degree to which the individual knows and understands, on a
continuous basis, how effectively he or she is performing the job.
Research (e.g. Luthans, 2011) suggests that there is strong validity in certain claims put
forward by the Job Characteristics Model. Ayandele and Nnamseh (2014) conclude that
the model is valid in both European and African settings and in manufacturing and service-
oriented organisations. Boonzaier (2001) found strong supporting evidence for links
between job characteristics and personal outcomes however weaker evidence was
attained for links between job characteristics and work outcomes. He did however confirm
the five-factor nature of the Job Characteristics Model. According to Ramlall (2004) this
model is one of the key employee motivation theories for organisations. Vorster, Olckers,
Buys, and Schaap (2005, p. 31) concur and state that the Job Characteristics Model “is
one of the most influential theories ever presented in the field of organisational
psychology.”
However, the Job Characteristics Model is not without its critics. Fried and Ferris (1987)
examined the extent to which Hackman and Oldham's original findings are replicable
Stellenbosch University https://scholar.sun.ac.za

47
within a relatively homogeneous group and found mixed supporting evidence. Arnold and
House (1980) found little support for the hypothesis that all three psychological states
were necessary for the development of specifically internal work motivation. A “flaw”
initially pointed out by Hackman and Oldham’s original research (Boonzaier, Ficker, &
Rust, 2001) pertains to the predictive validity which increased when only two critical
psychological states were paired. Humphrey, Nahrgang and Morgeson (2007), likewise
critise the Job Characteristics Model for the inclusion of to many critical psychological
processes linking work design and positive outcomes. Revisions of the Job Characteristics
Model have subsequently been offered (Boonzaier, 2001; Pierce et al. 2009). Stimulated
by the criticisms, specifically surrounding the incusion of too many psychological states,
Pierce et al. (2009) offer a theoretical modification to the Hackman-Oldham Model. Pierce
at al. present psychological ownership as a plausible substitute for the three critical
psychological states in the relationship between an employee and the five job
characteristics.
Figure 2.2. A Psychological Ownership-Based Revision of the Job Characteristics
Model
Although an empirical study by Mayhew, et al. (2007) does suggest that autonomy is
significantly related to job-based feelings of ownership and the taxonomy presented by
Pierce et al. (2009) seems to explain certain mechanisms underpinning feelings of
ownership, there seems to be a lack of further empirical research supporting this model.
Skill variety Control
Intimate knowing
Investment of self
Psychological
ownership of the
job
Internal & intrinsic motivation
Job satisfaction
Organizational commitment
Organization-based self-esteem
Sense of responsibility
Burden of responsibility
Attendance
In-role performance
Extra-role behaviors
Personal risk and sacrifice
Promotion of change
Resistance to change
Territorial behaviors
Task identity
Task significance
Autonomy
Feedback
(Pierce, Jussila, & Cummings, 2009, p. 485)
Stellenbosch University https://scholar.sun.ac.za
48
The model additionally feels14 as though it is an oversimplification of the development of
psychological ownership. It seems to lack the full complexity of the development of this
psychological state and perhaps lacks detail surrounding the interaction between the
individual’s needs (roots) and the target, as well as the processes behind psychologically
“purchasing the job”, jumping straight from the job characteristics and their influence on
the routes15.
From the introductory discussion of this section it seems reasonable to suggest that the
mere presence of certain job characteristics alone are not enough to fully stimulate the
routes. As stated by Pierce et al. (2003) the roots of psychological ownership help us to
understand why feelings of ownership exist. It therefore seems permissible to posit that
the individual need(s) or motive(s) that is/are satisfied through certain job characteristic(s)
have to be experienced to a sufficient degree which then, in turn, motivate the routes to
psychological ownership. Taking from Hackman and Oldham’s model, coupled with the
conclusions of psychological ownership theory (Pierce et al. 2001), it seems reasonable
to suggest then that investing the self in a job (as a target) that is characterised by certain
job characteristics will satisfy certain individual needs, in terms of providing a sense of
belonging, a sense of efficacy, and an opportunity for self-expression. The preceding
argument suggests that the Hackman-Oldham (1976) job characteristics are the pertinent
attributes of the job that bring about the satisfaction of these needs and in turn motivate
the routes.
Pierce et al. (2009) provide theoretical justification for the argument that an enriched
complex job is more likely to satisfy these specific individual needs. According to Pierce
et al. (2003) and Pierce and Jussila (2011) at the very least the target, in this case the job,
needs to be visible and attractive to stimulate interest. Additionally, the job should be
malleable, accessible and open in order to satisfy the individual’s needs. The sections that
follow will cover each need separately, although it is recognised that there could be
14 It can be argued that the practise of inserting researcher opinions or feelings could be criticized as unscientific.
However, it can also be argued that it is the authentic expression of feelings, within a research context, that leads to the generation of new knowledge. By following a gut feeling, in search of answers, researchers attempt to answer theoretically complex questions, bearing current theoretical knowledge in mind. If the feelings of researchers were ignored, due to their non-scientific nature, the richness of research could be lost. 15 The researcher does however realise that perhaps Pierce et al. (2009) isolated this aspect to highlight the relationship between the job characteristics and the routes and have subsequently left the “missing detail” out consciously.
Stellenbosch University https://scholar.sun.ac.za

49
relationships among the needs themselves, as highlighted above in the introductory
section.
In terms of the effectance and efficacy motive they reason that complex jobs16 (those jobs
high in autonomy, feedback, task significance, task identity and skill variety) allow for more
stimulation, exploration and the ability to produce difference in the work environment. For
example, the challenging role of a project manager necessitates the use of a wide variety
of skills, high motivation levels, persistence and determination in the face of obstacles
(negative feedback for the job tasks), to accomplish set outcomes – therefore success on
this complex job is seen as a direct result of the employee’s efforts. It therefore seems
reasonable to suggest that an increased skill variety, autonomy and to a certain degree
feedback from the job, will allow for the satisfaction of an individuals need for efficacy and
effectance, should that need exist. A counter argument may provide more clarity here. For
example, a less complex job, a production line worker, for example, could perhaps find it
more difficult to feel a sense of control over a job in that the tasks are simple and success
on the task is rather attributed to the routines of the task and not the individual’s own
accomplishment through their ability and skills.
Pierce et al. (2009) further suggest that complex jobs, being generally more accessible,
malleable, and requiring more of the employees ‘self’ to accomplish job tasks, therefore
allow for the expression of the self within the work tasks and environment. “Work that
stems from complex jobs is more likely to reflect the individual who is performing the work,
thereby contributing to self-identity through its self-revealing qualities,” (Pierce et al. 2009,
p. 483). It could therefore be argued that an enriched complex job that allows for high skill
variety, autonomy and task identity could allow an individual to see the job as an extension
of the self or a part of “who and what” the individual is. For example, an individual who is
afforded the luxury of manipulating an important work flow process (task significance and
autonomy) and designing different work tasks (skill variety), within a greater job role (task
identity) around aspects of the self, turning the job into an element of self-expression will
have their individual need for self-identity and efficacy satisfied by the job.
Similarly, the need to have a home or finding a sense of understanding of oneself in the
work environment is posited as being influenced by job characteristics. According to
Pierce et al. (2009), inspired by Porteous (1976), a sense of belonging is more likely to be
16 It should be stated here that an individual’s level of skill or competence could also play a moderating role in this interaction.
Stellenbosch University https://scholar.sun.ac.za

50
satisfied in a demanding, challenging job in which the employee gains feedback, knows
the impact of the task within the greater job scope and is afforded more control over how
aspects of the job are conducted. According to Pierce et al. (2009) an increased level of
autonomy allows an individual to leave their mark or to personalise a job or environment
therefore allowing for the job to become intertwined with the individuals sense of self,
personalising the job and its context – to make it home.
However, a question remains: Is the perceived probability that investing the self in the job
will satisfy these needs enough to initiate the routes to feelings of ownership? It seems
there is still something missing. It seems somewhat of an oversimplification to argue that
the mere possibility that investing the self in the job will satisfy these needs will be sufficient
to elicit the routes to psychological ownership. What is required in order for the individual
to move from seeing the target as an element of self-expression through the satisfaction
of the need for self-identity, for example, to subsequently investing themselves into said
target?
Although Pierce and his colleagues (Pierce et al. 2001;2003; Pierce & Jussila, 2011)
provide a framework within which the development of psychological ownership takes
place, the above explanation does not seem to provide a fully satisfactory explication of
the mechanism through which psychological ownership takes hold between a target and
an individual. From the preceding discussion it is evident that certain personal as well as
target characteristics act as antecedents to the experience of psychological ownership.
Some of these antecedents do not all directly affect psychological ownership. It is argued
here that the influence of more distal main effects is mediated by more proximal main
effects and interaction effects reflect effects that moderate the influence of main effects.
This makes the discussion and subsequent conclusions surrounding the psychological
mechanism which underpins feelings of ownership a complex one to distil in a researchers
mind.
Furby (1978) discusses the instrumental convenience of making something possible for
enjoyment as a motivation for possession. She suggests that “possessions have an
instrumental function – they make possible certain activities and pleasures...they enable
one to effect desired outcomes in one’s environment,” (Furby, 1978, p. 60). Here the key
to ownership seems to stem from the desire for a certain outcome. It therefore seems
reasonable to posit that an explanation of the mechanism by which psychological
ownership develops within an individual could be founded within expectancy theory. The
expectancy theory was also implicit in the preceding theorising. The following section of
Stellenbosch University https://scholar.sun.ac.za

51
the literature study attempts to more explicitly describe the role of the motivation to invest
the self in a job as a pivotal part of the psychological mechanism that regulates the level
of psychological ownership that employees experience. The following section of the
literature study therefore attempts to suggest an answer to the question: What stimulates
an individual to psychologically attach themselves to a target, in this case the job? In a
sense we are looking to determine what moves an individual to ‘purchase’ their job
psychologically. What underpins the ‘handing over of cash’ in a psychological sense?
Expectancy theory and the routes to psychological ownership
Vroom’s (1964) Expectancy Theory is possibly one of the most accepted theories of work
place motivation and behaviour and provides a plausible theoretical background to this
question, when coupled with job characteristics theory as well as the roots of and routes
to psychological ownership. Vroom (1964) posits that most human behaviour is voluntary
and motivated. It can therefore be argued that an individual’s behaviour within the
workplace would subsequently also be motivated17. According to Vroom “choices made
by a person among alternative courses of action are lawfully related to psychological
events occurring contemporaneously with the behaviour,” (Vroom, 1964, pp. 14-15).
Three core mental components, namely valence, expectancy and instrumentality interact
psychologically to create a motivational force and subsequent behaviour. These core
mental components will now be discussed.
According to Vroom (1964) each and every individual holds their own preferences for
certain outcomes. This preference refers to the valence an individual places on a certain
outcome, according to his or her own perceived value for that outcome. The value
attached to an outcome is determined by the perceived extent to which the outcome will
satisfy specific salient needs. Vroom’s conceptualisation of the term valence relates this
aspect to the affective orientations that an individual could hold for a certain outcome, or
the emotions an individual feels for a particular outcome. Valence does, however, not refer
to the actual value of an outcome. Rather, valence refers to the anticipated satisfaction,
or expected pleasurable emotion, produced via an outcome. Whereas the value refers to
the actual satisfaction experienced by an individual from a specific outcome (Vroom,
17 This only refers to behaviour that is within the individuals control and therefore voluntary in nature. It does not include any behavior that could be classified as involuntary.
Stellenbosch University https://scholar.sun.ac.za
52
1969). “Means acquire valence as a consequence of their expected relationship to the
ends” (Vroom, 1964, p. 16).
Outcomes are said to be either positively or negatively valent. An outcome that is positively
valent is an outcome that an individual would prefer to have, rather than not to have, as
opposed to a negatively valent outcome which an individual would prefer to avoid. When
relating this to psychological ownership one could argue that psychological ownership of
a specific job would be positively valenced if the job characteristics are perceived to satisfy
salient psychological ownership roots (that is if the job characteristics are perceived to be
high in features that satisfy psychological ownership needs and the individual possesses
salient psychological ownership needs). It could further be argued that one need could be
more salient than another to different individuals depending on their preferences. For
example, one employee may have a preference for the satisfaction of the need for self-
identity where as another may prefer to satisfy the need to belong and have a place
thereby motivating different routes18. Additionally, the expected pleasure producing
‘reward’ of feelings of ownership would in turn motivate behaviour or the routes, namely
self-investment, control and gaining intimate knowledge.
Expectancy Theory (VIE Theory) states that behaviour is influenced by not only the
valence of an outcome, but additionally by the degree to which an individual believes that
outcome is attainable or probable. This is referred to as expectancy and is defined as a
“momentary belief concerning the likelihood that a particular act will be followed by a
particular outcome” (Vroom, 1964, p. 17). Expectancies are seen as action-outcome
associations. If an employee feels, perceives or thinks he or she can achieve an outcome,
via his or her actions, he or she will be more motivated to aim for it. These expectancies
range in certainty from maximal strength (certainty that the preferred outcome will occur)
or minimal strength (subjective certainty it will not). In relation to psychological ownership
the actions could be seen as the routes, and specifically investing the self in the target,
and the outcome could be posited as psychological ownership. It could therefore be
argued that an employee will be motivated to invest him-/herself in a job if doing so is
perceived to result in the experience of psychological ownership, which is positively
valenced, because this psychological state satisfies the individuals need for self-identity,
to belong and/or to experience efficacy. The employee therefore feels motivated to invest
18 The essence of this relationship will however not be captured within this study as the needs will be treated collectively. This is suggested for future research.
Stellenbosch University https://scholar.sun.ac.za

53
the self, take control and gain intimate knowledge if he or she believes this could lead to
attachment to that specific target and the subsequent message to others of “this is mine,
this is me”.
Vroom (1964) further posits that in order to explain what determines the valence of certain
outcomes, to certain employees, instrumentality should be examined. This refers to the
probability belief linking one outcome to other outcomes. For example, an individual may
attach themselves to an object through self-investment or gaining intimate knowledge and
taking control (route “performance” that is achieved as a first level outcome) and in turn
experience feelings of ownership as a second-order outcome and communicate a
message of “this is me” to others within the organisation.
Vroom states that “the force on a person to perform an act is a monotonically increasing
function of the algebraic sum of the products of the valences of all outcomes and the
strength of his experiences that the act will be followed by the attainment of these
outcomes” (Vroom, 1969, p. 18). It is therefore evident that motivation is not a single
construct, but rather refers to a psychological mechanism comprising several interacting
components.
Vrooms (1964) theory is not without its critics and it has undergone some refinement.
Porter and Lawler (1968), through the use of empirical testing, propose a slightly different
perspective, although heavily inspired by the work of Vroom. According to Porter and
Lawler (1968) effort is jointly determined by the value that an individual places on a certain
performance outcomes as well as an individual’s belief that this performance outcome will
lead to reward (positively valenced second-level outcome). They suggest that individuals
must positively value outcomes and perceive that it was due to their efforts (efficacy) that
the outcomes were attained, for there to be additional effort. Effort may or may not lead to
performance in this model. Porter and Lawler argue that the effect of effort on performance
and satisfaction are moderated by an individual’s level of ability and clarity surrounding
the role. Employees therefore need to have the skills to, do their job/ task/ attain a desired
outcome, as well as an accurate understanding of how to attain the outcome/do the job in
order to ‘perform’.
Although this research and theory focuses on remuneration and the role of remuneration
in employee motivation, it could be argued that there are links to the development of
psychological ownership, if one examines the Porter and Lawler model diagrammatically
(lending from notions presented by Vroom above) it seems reasonable to argue that the
Stellenbosch University https://scholar.sun.ac.za

54
ultimate reward is psychological ownership. Therefore, in order to engage in behaviour
(self-investment) that could facilitate the development of these psychological feelings, an
employee must value the reward (feelings of ownership), expect that any effort of investing
the self into the job will lead to this reward, and by successfully engaging in the routes to
psychological ownership (performance) will experience the reward of feeling
psychologically tied to the job.
It could therefore be suggested that in order for an individual to exert effort to tie him-
/herself to an object he/she must:
1. Experience a positive valence towards the (second-level) outcome which refers to
psychological ownership because it satisfies the need for self-identity, self-efficacy,
having a place or sense of belonging (valence) via the job characteristics.
2. Have the perception or belief that exerting effort to attach one’s self to an object
will result in successful route19 performances (expectancy).
3. Have the perception or belief that successful route performance will be
instrumental in achieving psychological ownership (due to the nature of the job).
4. Have the skills or ability to self-invest, take control and gain intimate knowledge of
the target job.
5. Have the opportunity to self-invest, take control and gain intimate knowledge of the
target job (the target should be accessible and malleable).
6. Attain intrinsic rewards in terms of the satisfaction of the roots of psychological
ownership as well as the extrinsic rewards in terms of public self-expression and
in turn potential for societal acceptance.
The dynamic characteristics of this model seen in the feedback loops point to the ongoing
nature of motivation in general and when applied to psychological ownership this thinking
points to the process by which individuals seek out new objects of self-expression. It could
therefore be argued that the psychological mechanism of “handing over the cash” is
therefore more of a continued investment rather than a once off purchase, which the
individual continues to invest the self in the target due to the perceived valence,
expectancies and instrumentality of attaching to an object (the reward).
19 The routes to feelings of ownership will be elaborated upon in Section 2.4.4 and 2.4.5 below.
Stellenbosch University https://scholar.sun.ac.za

55
Figure 2.3. The Revised Porter-Lawler Model
(Luthans, 2011, p. 168)
Kemp and Cook (1983) report that the job characteristics strongly correlate with motivation
within the work place, therefore, an example within the organisational context could
provide further clarity here. It seems reasonable to argue that a grade nine teacher, with
a high need for self-identity, who experiences autonomy and skill variety, within her job
role, by being afforded the luxury of changing the environment (painting the classroom,
putting up posters) and deciding upon the format in which the teaching material for a
subject (stipulated by the education department) is presented to students, could
experience satisfaction of the need for self-identity.
This in turn could lead to feeling motivated through the expectation of positive outcomes
(especially after receiving positive feedback via her job/the students) and he or she could
subsequently engage in the routes to psychological ownership namely investment of the
self, taking control of the work tasks (perhaps suggesting revision to the department when
weak areas are identified for example) and gaining an intimate knowledge of not only the
work but also perhaps the students – perhaps tailoring aspects of the teaching aids to
students with specific needs.
It is suggested that a teacher, in a teaching position that is characterised by a lack of
autonomy (who possesses a high need for efficacy and self-identity), who is merely
presenting study material as handed down by a department head, may for example not
Value of
reward
Perceived
Effort – Reward
Probability
Effort
Abilities
and traits
Role
perceptions
Performance
(Accomplishment)
Extrinsic
reward
Intrinsic
reward
Perceived
equitable
reward
Satisfaction
Stellenbosch University https://scholar.sun.ac.za
56
feel a sense of self within the material (needs not satisfied) and therefore not be motivated
to follow the routes to ultimately develop feelings of ownership.
For the purposes of the current study the individual elements that influence levels of
motivation, and subsequent behaviour, will be represented collectively within the model
as motivation. It is recognised that the different motives could interact differently with the
elements of motivation. The fact that this dynamic interplay is not captured by the model
is recognised as a limitation of this study.
From the above discussion it seems reasonable to present the following hypothesis:
Hypothesis 220: In the proposed psychological ownership structural model21 it is
hypothesised that job characteristics (more specifically the perceived ability of
the job to satisfy salient psychological ownership needs) have a positive influence
on motivation to engage in the routes towards psychological ownership.
The role of fit in the development of psychological ownership
As discussed above, a critical element in the nomological network of latent variables that
underpin feelings of ownership is the anticipated satisfaction of the motives namely, the
efficacy and effectance motive, the need for self-identity and the need to find a place or
experience a sense of belonging conditional on investment in the ownership routes. In
addition, it has been argued that satisfaction of the three needs that form the roots of
psychological ownership will not be anticipated unless the job is characterised by the
Hackman-Oldham job characteristics. A positive relationship between psychological
ownership and these two main effects seems reasonable. In addition to this, however, it
seemed reasonable to argue that the effect of the job characteristics on psychological
ownership will be more aggressive when the needs that form the roots of psychological
ownership are highly salient. This line of reasoning is somewhat supported by interactional
psychology in that “interaction theory asserts that neither personal characteristics nor
20 Hypothesis 1 refers to the overarching substantive hypothesis, namely, that the psychological ownership structural model provides a valid account of the psychological mechanism underpinning levels of psychological ownership. This overarching research hypothesis can be dissected into more detailed, direct-effect substantive research hypotheses. Therefore, the first path specific substantive research hypothesis therefore represents the second substantive research hypothesis formulated thus far. 21 The phrase “in the proposed psychological ownership structural model” is used on purpose in the formulation of each of the path-specific substantive hypotheses as an acknowledgement that the hypothesis strictly speaking hypothesises that the latent effect explains unique variance in the endogenous latent variable that is not explained by the other latent effects that are structurally linked to the endogenous latent variable in question.
Stellenbosch University https://scholar.sun.ac.za

57
situational constraints determine the lion’s share of variance in behavioral and attitudinal
variables,” (Muchinsky & Monahan, 1987, p. 268) but rather it is the interaction between
the individual and the environment that leads to certain outcomes. Since the relationship
and subsequent needs satisfaction, is posited between the individual and their job, it
seems reasonable to investigate the role of person-job fit22, as a category of person-
environment fit, as an influence in the psychological process towards needs satisfaction
and the subsequent development of feelings of ownership for that job.
Person-environment fit (PE fit) has been the focus of several studies within organisational
research. These studies highlight the psychological, physical and performance benefits of
congruence between the organisation and its employees on several levels. Broadly
speaking, fit refers to congruence, compatibility or a match. PE fit therefore refers to a
compatibility between an employee and the work environment. More specifically, this fit
can be studied from several elements, for example, the degree of fit between an
employee’s abilities and job demands, personal interests and vocational characteristics,
individual preferences and organisational systems and individual values and
organisational culture.
Harrison (as cited in Kristof-Brown & Guay, 2011, p. 3) offers the following definition:
Fit is a state of compatibility of joint values of one or more attributes, a,
b, c, . . . j, of a focal entity (P), and a commensurate set of attribute
values, a, b, c, . . . j, of the entity’s environment (E). In algebraic terms,
fit is about [(Pa, Pb, Pc, ... Pj) ∩ (Ea, Eb, Ec, . . . Ej).
According to Kristof-Brown and Guay (2011) this definition allows for there to be fit
between a variety of personal attributes (needs, traits, skills and values) and
organisational or environmental aspects (job characteristics, job demands, working
conditions, climate etc). PE fit, according to Kristof (1996, pp.4-5), refers to “. . . the
compatibility between people and organizations that occurs when: (a) at least one entity
provides what the other needs, or (b) they share similar fundamental characteristics, or
(c) both”. This implies a ‘relationship’ between and individual’s characteristics or attributes
and the environments characteristics or attributes. Kristoff-Brown and Guay (2011) state
22 This aspect has been added to the study as it strengthens the claims made surrounding the relationship between the employee and the job and the subsequent needs satisfaction experienced, which in turn engages the routes. It is believed that this relationship between the individual and the job therefore requires further attention in light of new technologies available to researchers to investigate fit. It is hoped that this investigation will provide more clarity regarding the influence of fit (individual needs satisfied by the job) on levels of motivation to follow the routes – a vital component in the model.
Stellenbosch University https://scholar.sun.ac.za

58
that job satisfaction is merely one affective response of many that may arise from this form
of congruence. Fit has been postulated to produce various additional vocational
outcomes, from psychological benefits to physical health improvements including
increased creativity, motivation, performance, occupational success, commitment, tenure,
job satisfaction, and work morale (Kristof-Brown & Guay, 2011).
Determining the exact interactions to include as PE fit subsets poses a challenge to fit
researchers (Kristof-Brown & Guay, 2011). However, after an extensive literature review
Kristof-Brown and Guay compiled several conditions for PE fit. They postulate that a
universally agreed upon condition is that a constellation of personal and environmental
attributes influence outcomes. An additional condition for PE fit is that the personal and
environmental dimensions should be commensurate. However, there seems to be much
debate among the fit scholars (Edwards, Caplan, Harrison, 1998; Kristoff-Brown & Guay,
2011; Schneider, 2001) surrounding the benefits or necessity of commensurate attributes
in measuring fit.
We can, therefore, ask the question: would the relationship between the target and the
owner, when considered in an organisation context, be classifed as PE fit? From the
above, it seems reasonable to suggest that the relationship between the employee and
the job could pose a fit or misfit scenario. More specifically, the extent to which the
perceived ability of the job to satisfy the psychological ownership root needs and the
perceived salience of the psychological ownership root needs are congruent or
incongruent could be argued to affect the motivation to pursue the psychological
ownership routes. Motivation to pursue the psychological ownership routes is therefore
seen to be dependent on the degree of fit between the extent to which the employee
experiences the roots as salient and the degree to which the job offers the opportunity to
satisfy the needs. The challenge is to understand the manner in which motivation to
pursue the psychological ownership routes changes as the degree of person-job fit
changes.
Different aspects of fit, as well as types of fit, are outlined in the literature and to answer
this question they require further explanation. Therefore, the following section will briefly
discuss the two traditions of fit namely supplementary, or complementary fit, as well as
one specific category of fit namely that of Person-Job fit (PJ fit). It seems reasonable to
limit the literature study to PJ fit as the relationship under investigation pertains to the
satisfaction of individual needs by the job characteristics. Four types of fit in terms of
needs-supplies, demands-abilities and objective and subjective fit will also be outlined.
Stellenbosch University https://scholar.sun.ac.za

59
Supplementary, sometimes termed similarity-based fit, and complementary fit refers to
two distinct psychological mechanisms that underlie the effect of PE fit on a response
variable. In terms of supplementary fit the response variable is positively influenced when
the individual and the environment or job are congruent because the individual
“supplements, embellishes, or possesses characteristics which are similar to other
individuals in this environement” (Muchinsky & Monahan, 1987, p. 269). Individuals are
said to match their environment if they see themselves as being similar to the individuals
already in that environment.
Complementary congruence on the other hand refers to a deficiency within the
environment, or organisation, that is filled by certain characteristics within the individual,
when viewed from an environmental perspective. According to Muchinsky and Monahan
(1987) and Kristof-Brown and Guay (2011) this form of compatibility occurs when the
environment lacks something and that deficiency is ‘made whole’ by the individual. Arthur,
Bell, Villado, and Doverspike (2006, p. 787) however state that “…when there is fit, the
environment affords individuals the opportunity to fulfil their needs... Need fulfilment
results in favorable attitudes, such as job satisfaction and organizational commitment”.
Kristof-Brown and Guay (2011) concur and suggest that when viewed from a individual
perspective complementary fit also reflects the role of the environment in making an
“individual whole” and therefore how the environment meets the individuals needs. Fit
from this perspective branches out into two broad streams of research namely needs-
supplies and demands-abilities fit (Caplan, 1987)
As their titles imply these two distinct types of fit refer to the individual needs an employee
possesses and degree to which the job or environment supply’s aspects that will satisfy
these needs. As well as the behaviours certain jobs demand in order to complete tasks
effectively, and whether the employee has the relevant abilities, skills and knowledge to
complete the job. According to Caplan these two types of fit pose different questions within
the exchange process. “…needs-supplies fit may represent the perspective of the
employee asking ‘what can I get out of this job?’ and of the employer asking ‘ what do I
have to provide…? On the other hand, demands-abilities fit represents the perspective of
the employee asking ‘what am I expected to provide…” and the employer asking ‘ what
do I want of the employee?” (Caplan, 1987, p. 250).
Need-supplies fit concerns the relation of employee desires to job supplies. This type of
fit has been the emphasis of various theories of adjustment, well-being, and satisfaction
(Caplan, 1987; French, Caplan, & Harrison, 1982; Harrison, 1978; Locke, 1960; Porter,
Stellenbosch University https://scholar.sun.ac.za
60
1961; 1962). Employee desires are variously characterised as “needs,” “goals,” “values,”
and “interests”. Cable and Edwards (2004) in their investigation of complimentary versus
supplementary fit, integrated literature surrounding need fulfilment and value congruence.
They noted what the researcher has noticed here, that there is some conceptual overlap
and potential for confusion surrounding the terminology.
Needs-supplies fit, which seems to make logical sense here, would imply a position of
incongruency attached to higher levels of psychological ownership. Here the employee
would experience deficiency in the satisfaction of a specific need, perhaps for example,
the need to belong, and the job would satisfy this need by, for example, offering the
autonomy for self-expression and finding a home within the role. This implies a -+ situation.
However, it should rather be argued that an employee would find it more pleasurable
(experience higher levels of motivation to pursue the routes to psychological ownership)
to work in an organisation where the things that are most important to that employee
(Cable & Edwards, 2004) (the need to belong, the need for self-identity and the need for
efficacy and effectance) are also important and captured within the job. Positive attitudes
and behaviours result from the congruence between attributes of the person and the
environment. According to Cable and Edwards an individual’s needs are centred on an
individual’s self-image. Therefore, if congruency between the individual’s needs (an
attribute of the employee) and the job characteristics (attributes of the job) is perceived
then the individual could experience a job as an element of self- expression and therefore
be more motivated to pursue the routes towards feelings of ownership. Here, the
behaviours necessary or valued by the job, are valued and needed by the employee, and
congruent with the employee’s self-identity. This implies a “have”, “have” or ++ scenario
and not a deficit, credit scenario as implied by needs-supplies fit. Therefore, the current
research study focus is on supplementary fit between the employee needs and the job
characteristics. More specifically, the employee endorses certain needs in terms of a need
to belong, a need for self-identity and a need for efficacy and effectance, the job in turn is
characterised by features that additionally “endorse” these same needs.
In the proposed psychological ownership structural model, if conventional logic is applied,
the above discussion could imply a positive relationship between fit (congruence between
the needs and job characteristics) and the outcome of motivation to engage in the routes
to psychological ownership. However, this does not seem to grasp the full complexity of
the relationship between the job characteristics, the individual psychological ownership
needs and the motivation to pursue the routes.
Stellenbosch University https://scholar.sun.ac.za

61
As argued above, fit within the context of this research study refers to an employees’
salient psychological ownership needs and the perceived ability of the job characteristics
to satisify the employees salient need for efficacy and effectance, need to belong and/or
need for a sense of identity23. The above argument presented thus far implies that
motivation is influenced by two separate predictor latent variables namely the level of
salient individual needs and the ability of the job characteristics to satisfy these salient
needs, rather than a single latent variable, namely, congruence. As such, it can be argued
that the manner in which motivation to pursue the routes changes, to changes in job
characteristics and to need strength, is captured by a response surface or regression
plane that describes the expected motivation to pursue the routes given specific job
characteristics and need strength. In addition, it could be argued that the manner in which
motivation to pursue the routes responds to changes in job characteristics and to need
strength need not necessary be linear, but could rather be curvilinear so as to allow for
the interaction between job characteristics and need strength to have a more complex
effect on the motivation to pursue the routes. The discussion, as yet, does not fully capture
this complexity and consequently the danger therefore exists that subsequent hypotheses
would fail to adequately reflect this complexity.
The question therefore must be asked: How can the full complexity of this relationship be
analysed or even captured? Put differently, how do we evaluate the influence of fit
between two predictors (X1 and X2) on the endogenous outcome variable (Y)? Recent
developments in the field of data analysis, specifically surrounding PE fit, have led to the
introduction of polynomial regression and response surface analysis (Edwards, 1993;
1994; 1996 as cited in Edwards, 2008). This was in response to the disadvantages
experienced when using alternatives, such as difference scores, when analysing how an
endogenous latent variable, such as motivation, responds to changes in the relationship
between two additional latent variables, i.e. the influence described above.
The advantages and disadvantages of these different approaches will be highlighted in
Chapter 3, however, in order to formulate relevant hypotheses, one particular advantage
of polynomial regression and response surface analysis needs to be considered and
23 The researcher acknowledges the semantic confusion that this argument could imply, specifically due to the use of the words needs and satisfies. It could be interpreted from two perspectives 1) that this implies that the employee’s needs are deficient and the job satisfies these needs 2) that an employee endorses certain needs and the characteristics of the job also endorse certain needs. The argument in this case is for the latter. An employee values having a sense of belonging, having efficacy and effectance and having a sense of self-identity within the work role and the work role is characterised by features that endorse the employee’s value or importance of these needs.
Stellenbosch University https://scholar.sun.ac.za

62
discussed here, namely the possibility of describing more intricate relationships and
therefore response surfaces using polynomial regression.
As reasoned above, the manner in which these two predictor latent variables affect
motivation to pursue the routes ought to be described in a manner that allows the response
surface to be non-linear. In order to create a non-linear model, of the influence of the two
predictor variables upon motivation to pursue the routes, three additional terms have to
be created. This constitutes the second-order polynomial regression equation.
This equation is depicted below as Equation 1.
E[η2 | ξ1, ξ2] = b0 + b1ξ1 + b2ξ2 + b3ξ12 + b4ξ1*ξ2 + b5ξ2
2…………………………Equation 1
where:
• η2 represents the motivation to pursue the routes to psychological ownership;
• ξ1 represents the perceived ability of the job characteristics to satisfy the salient
individual needs; and
• ξ2 represents the level of salient individual psychological ownership needs (roots
to psychological ownership).
Equation 1 above mathematically represents the hypothesis that the level of motivation to
engage in the routes to psychological ownership is influence by five effects. Each of these
five effects explains unique variance in motivation to engage in the routes to psychological
ownership that is not explained by the other four latent effects. Therefore, each effect must
be represented as an individual latent variable within the proposed psychological
ownership structural model. These five effects will therefore been introduced into the
model as phantom variables. According to Bentler and Raykov (2000) phantom constructs
are artificial latent variables that have no measured indicators. These phantom variables
are “introduced into a model solely to achieve a specialized purpose” (Bentler & Raykov,
2000, p. 128). They have been added here to investigate the influence of congruence
within the full complexity of the comprehensive structural model. The following hypotheses
can therefore be formulated:
Hypothesis 3: In the proposed psychological ownership structural model it is
hypothesised that the strength/salience of an individuals’ psychological
Stellenbosch University https://scholar.sun.ac.za

63
ownership root needs24 positively influences motivation to engage in the routes
towards psychological ownership.
Hypothesis 4: In the proposed psychological ownership structural model it is
hypothesised that squared salient individual needs positively influences
motivation to engage in the routes towards psychological ownership.
Hypothesis 5: In the proposed psychological ownership structural model it is
hypothesised that salient individual needs * perceived ability of the job
characteristics to satisfy salient needs positively influences motivation to engage
in the routes towards psychological ownership.
Hypothesis 6: In the proposed psychological ownership structural model it is
hypothesised that squared perceived ability of the job characteristics to satisfy
salient needs positively influences motivation to engage in the routes towards
psychological ownership.
Theron (2014) states that polynomial regression offers the possibility of describing more
intricate response surfaces and thereby the possibility of more accurately describing the
behaviour of a response variable to changes in two predictor variables. Shanock et al.
(2010) concur and explain that this technique can provide a nuanced view of relationships
between combinations of two predictor variables and an outcome variable. Therefore, this
technique has more explanatory potential than difference scores or traditional moderated
regression analyses. This technique allows for theorising in terms of a three-dimensional
space and not a single congruence latent variable. In this three-dimensional space
congruence and incongruence can vary in nature. On the one hand, the employee
experiences a root need as salient and the job characteristics are such that they provide
satisfaction of these needs [+ +]. On the other hand, the employee does not experience a
root need as salient and the job characteristics are such that they cannot satisfy the need
[- -] and either the employee experiences a root need as salient but the job characteristics
cannot satisfy the need [+ -] or the employee does not experience a root need as salient
but the job characteristics can satisfy the need [- +]. Moreover in this three-dimensional
space congruence and incongruence can also vary in magnitude (Theron, 2014b).
Therefore, the position in the congruence/incongruence space (- -, + +, - +, + -) is
hypothesised to affect the response variable (motivation to pursue the routes to
24 Sometimes referred to as individual needs/needs for the purpose of improving reading quality.
Stellenbosch University https://scholar.sun.ac.za

64
psychological ownership). Stated differently, movement along the line of congruence (from
- - to + +) and movement along the line of incongruence (from - + to + -, or alternatively
from 0 0 outward to - + and to + -) is hypothesised to affect the value of the response
variable (motivation to pursue the routes) in a specific manner. This affect is captured by
the response surface. The response surface along the lines of congruence and
incongruence is characterised by a specific (positive or negative) slope and by a specific
(convex or concave) curvature (Shanock et al. 2010).
For the current study, the essential questions that arise are consequently what the slope
and curvature of the response surface describing the level of the motivation to pursue the
routes of psychological ownership is when moving along the lines of congruence and
incongruence? In terms of earlier theorising, motivation to pursue the routes of
psychological ownership is hypothesised to be higher when the job is characterised by
certain features that will allow the needs to be satisfied, when psychologically occupying
or taking ownership of the job. However, according to psychological ownership theory
(Pierce et al. 2001) certain psychological needs or motives must be elicited in order to
instigate the process of psychological ownership development. It therefore seems
reasonable to suggest that should an employee possess these motives or needs and the
job possesses certain features or characteristics that fuel these motives (+ +) motivation
to pursue the routes to psychological ownership would be high. When considering the
“opposite scenario”, a situation where the employee does not possess the root needs and
the job is not characterised by features that fuel the motives, this is still a congruent
scenario but it is a - - scenario. This situation, according to psychological ownership theory
should result in a really low motivation to pursue the routes to psychological ownership.
The temptation is to erroneously argue, under the conventional thinking about
congruence, that a linear relationship exists between congruence and the response
variable and that similarity, congruence or common understanding, therefore should,
irrespective of the nature of the congruence, always result in high (or low) response
variable values. In terms of the more nuanced thinking, the manner in which congruence,
and the lack of it, affects a response variable, both the magnitude of the congruence and
incongruence (i.e. how far out on the lines of congruence and incongruence one has
moved from the 0 0 position) and the nature of the congruence (whether one moves
towards - - or towards + + or whether one moves towards - + or towards + -) are accounted
for.
Stellenbosch University https://scholar.sun.ac.za
65
Therefore, it is hypothesised here that in a situation where the employees psychological
ownership needs are non-salient (the employees does not endorse psychological
ownership needs) and the job is not perceived to satisfy non-salient needs, this will lead
to a low level of motivation to pursue the routes to psychological ownership.
Therefore, when applied to the three dimensional surface it seems reasonable to suggest
that motivation to pursue the routes to psychological ownership will increase as
congruence moves along the line of congruence to non-salient needs (low needs levels)
and low perceived ability of the job characteristics to meet these salient needs (- -) to high
salient needs and high perceived ability of job characteristics to meet salient needs (+ +).
The slope of the response surface along the line of congruence is therefore positive. The
question regarding the curvature of the response surface along the line of congruence still
has not been answered by the preceding argument. It does not seem altogether
unreasonable to hypothesise a linear response surface. A somewhat more compelling
argument would, however, be that initial increases in employee need salience and the
perceived ability of the job characteristics to satisfy these needs would result in only
modest increases in the motivation to pursue the routes towards psychological ownership.
As further increases in need salience and the perceived ability of the job characteristics to
satisfy these needs occur, it seems plausible that the increase in the motivation to pursue
the routes to psychological ownership will gradually accelerate. Motivation to engage in
the routes could therefore be said to change in a curvilinear fashion (convexly) along the
line of congruence moving from - - (low employee needs and low perceived ability of the
job characteristics to satisfy need) to + + (high salient employee need levels and high
perceived ability of the job characteristics to satisfy high salient needs). The foregoing line
of reasoning therefore suggests that along the line of congruence the response surface
will display a skateboard ramp-like structure with motivation to pursue the routes towards
psychological ownership at its highest when salient needs are experienced and the job is
perceived to be able to satisfy these needs due to its job characteristics [+ +].
The discussion above pertains to a situation of agreement or congruency. What occurs
when there is in fact disagreement or incongruence? It seems reasonable to suggest that
a scenario reflecting incongruency, namely a situation where the employee possesses
certain salient needs and the job is not characterised by features that satisfy these salient
needs (+ -), will lead to low levels of motivation to pursue the routes to psychological
ownership. Additionally, it seems reasonable to suggest that should the job be
characterised by features that are perceived to satisfy psychological ownership needs but
Stellenbosch University https://scholar.sun.ac.za
66
these needs are not salient for the employee because of low root need strength, (- +), then
motivation to pursue the routes towards psychological ownership will also be low.
However, they will be somewhat higher in the former scenario, where the needs are salient
and the job is not perceived to be characterised by features that satisfy these salient
needs.
It seems reasonable to argue that high root need strength might still move an employee
to commit the self to the job even though doing so would be frustrating in that it would not
satisfy the root needs. By way of analogy; a hungry man might still be moved to nibble at
an unappetising plate of food. Therefore, it seems reasonable to hypothesise that
motivation to pursue the routes towards psychological ownership could increase as
incongruence moves along the line of incongruence from low employee needs and high
perceived ability of the job characteristics to satisfy needs (- +) to high employee salient
needs and low perceived ability of the job characteristics to satisfy salient needs (+ -). The
slope of the response surface along the line of incongruence is therefore positive. Despite
the convex, ramp-like response surface that was hypothesised along the line of
congruence, motivation to pursue the routes towards psychological ownership is
hypothesised to change in a linear fashion along the line of incongruence moving outward
from 0 0, decreasing towards low employee salient needs and high perceived ability of
the job characteristics to satisfy salient needs (- +) and increasing towards high employee
salient needs and low perceived ability of the job characteristics to satisfy salient needs
(+ -). From the above discussion the following hypothesis can therefore be suggested:
Hypothesis 7: In the proposed psychological ownership structural model it is
hypothesised that a) Motivation to engage in the routes to psychological
ownership changes positively as congruence moves from the perception that the
job does not allow the satisfaction of the salient needs combined with low
salience of the employee’s needs (- -) to the perception that the job does allow the
satisfaction of the salient needs combined with high salience of the needs (+ +); b)
Motivation to engage in the routes to psychological ownership changes convexly
(along the line of congruence ) as congruence moves from the perception that the
job does not allow the satisfaction of the needs combined with low salience of the
needs to the perception that the job does allow the satisfaction of the needs
combined with high salience of the needs.
Hypothesis 8: In the proposed psychological ownership structural model it is
hypothesised that a) Motivation to engage in the routes to psychological
Stellenbosch University https://scholar.sun.ac.za

67
ownership changes positively as incongruence changes from the perception that
the job does allow the satisfaction of the needs combined with low salience of the
needs (- +) to the perception that the job does not allow the satisfaction of the
needs combined with high salience of the needs; b) Motivation to engage in the
routes to psychological ownership changes linearly as incongruence changes
from the perception that the job does allow the satisfaction of the needs combined
with low salience of the needs to the perception that the job does not allow the
satisfaction of the needs combined with high salience of the needs.
The above discussion has highlighted the influence of the target characteristics and the
owner’s needs within the nomological network of latent variables which influence the
motivation to pursue the routes to psychological ownership which in turn influence the
levels of psychological ownership experienced within the work place.
The proceeding discussion will investigate the routes to psychological ownership,
borrowing heavily from the work of Pierce et al. (2001, 2003).
Routes to feelings of ownership
Pierce et al. (2001; 2003) state that psychological ownership is seen as the product of
certain routes, paths or experiences. To answer the question why psychological
ownership comes into existence Pierce et al. (2001) propose that the opportunity to have
control over a target, the opportunity to gain knowledge about the target and the
opportunity to immerse one’s self into the target, through self-investment, leads to feelings
of ownership. The preceding argument raises the question whether the motivation to
pursue the routes manifests in the pursuit of a single specific route that then in turn incurs
investment in the other routes or whether the motivation to pursue the routes manifests
directly in the pursuit of all three routes.
As previously argued, certain contextual factors and target characteristics, through these
paths, initiate the feelings of ownership. The routes can therefore be seen as the transport
system or the behavioural components that, after an initial introduction to a target (and
subsequent needs satisfaction), ‘carry’ the feelings of ownership within the self (Pierce &
Jussila, 2011). In terms of the Porter-Lawler (Steers & Porter, 1983) interpretation of the
expectancy theory of motivation these three routes to psychological ownership could be
seen as behavioural performance dimensions. Before discussing the link between the
Stellenbosch University https://scholar.sun.ac.za

68
motivation to pursue the routes and psychological ownership it is necessary to discuss
and describe the individual routes.
The first path to psychological ownership posited by Pierce et al. (2001) is that of
investment of the self into the target. According to Pierce et al. (2001) investment of the
self is demonstrated in various forms “including investment of one's time, ideas, skills’ and
physical, psychological and intellectual energies” (Pierce et al. 2001, p. 302). Over time,
as a result of this investment the target begins to feel as if it flows from the self. According
to Pierce et al.’s theory of psychological ownership, the more an individual invests the self
into a target the more he or she will experience feelings of ownership towards that target.
Inspired by the works of Locke (1960), Sartre (1943/1969), Csikszentmihalyi and
Rochberg-Halton (1981), who provide much insight surrounding psychological ownership
and the world of work, Pierce et al. (2001, 2003) and Pierce and Jussila (2011) emhasise
the fact that work, as a target of ownership, should flow from the self in order for an
employee to experience feelings of ownership for the job.
Csikszentmihalyi and Rochberg-Halton (1981) concur with this line of reasoning and
suggest that self-investment involves spending time, energy, effort and attention on a
target. This in turn leads to a feeling or a sense of oneness with the target (a relationship
between the self and the target). This oneness emerges due to the fact that the target has
emerged from the self. This is in line with reasoning provided by Kahn (1990). Kahn states
that the more engrossed an employee becomes with his or her job the more they draw on
their selves and therefore the more “stirring are their performances” (Kahn, 1990, p. 692).
Beaglehole, (1932) and Mayhew et al. (2007) concur with Csikszentmihalyi and Rochberg-
Halton (1981) and state that within the organisational context feelings of ownership can
develop between the employees and their machinery, their tasks, ideas, work space and
additionally their work. This path to feelings of ownership is therefore characterised by
work being the fruit of an employee’s own labour and therefore ‘theirs’ or flowing from the
self-region (Sartre, 1943/1969).
Locke (1960) posits that once someone has “inserted” themselves (their energy – both
physically and psychologically as well as expended time and effort), or become one with
an element provided by the earth, that it then belongs to that individual and he or she is
therefore the only person who may lay claim to this object. Locke writes that:
Stellenbosch University https://scholar.sun.ac.za

69
Though the earth and all inferior creatures be common to all men, yet
every man has a “property” in his own “person”. This nobody has any
right to but himself. The “labour” of his body and the “work” of his hands,
we may say, are properly his. Whatsoever, then, he removes out of the
state that Nature hath provided and left it in, he hath mixed his labour
with it, and joined to it something that is his own, and thereby makes it
his property. It being by him removed from the common state Nature
placed it in, it hath by this labour something annexed to it that excludes
the common right of other men. For this “labour” being the
unquestionable property of the labourer, no man but he can have a
right to what that is once joined to, at least where there is enough, and
as good left in common for others (Locke, 1960, p. 116).
Kahn (1990) discusses this “removal from the common state nature place(d) it in” as the
self-in-role behaviours and states that employees bring-in and leave-out aspects of
themselves throughout the work day. Kahn additionally states that employees become
involved in their roles (jobs) “in ways that display what they think and feel, their creativity,
their beliefs and values…” (Kahn, 1990, p. 700). This self-investment or “putting the self
out-there” elicits a certain degree of vulnerability within an employee. By, for example,
using creativity, suggesting ideas, sharing opinions (investing the self) within a work role
or job, an employee is risking aspects of the self, by exposing the self to others (through
the work role or job) and revealing the self within the job. This risk could potentially have
negative consequences should, for example, another employee not agree with opinions
shared, or perhaps a project fails that an employee has invested in. According to Kahn,
employee engagement (which includes aspects of self-investment25) is positively
influenced by felt levels of psychological safety. Kahn defines psychological safety as the
employees’ "sense of being able to show and employ one's self without fear of negative
consequences to self-image, status, or career" (p. 708).
Brown and Leigh (1996) posit that should employees feel that management is supportive
and provides the flexibility for them to have control over their work and how it is
accomplished, and the freedom to express their true feelings, and core aspects of their
self-concepts in their work roles, employees will experience increased psychological
safety.
25 Kahn (1990) interprets (personal) engagement as a psychological act of investing the self in a task in contrast to the more popular view that engagement is “a positive, fulfilling, work-related state of mind that is characterized by vigour, dedication, and absorption” (Schaufeli, Salanova, Gonzalez-Roma, & Bakker, 2002, p. 74).
Stellenbosch University https://scholar.sun.ac.za
70
Employees who experience a sense of safety, in that they feel they will not experience
negative consequences, such as to the above mentioned self-image, status and career,
would therefore be more willing to take the risk of self-expressing within their job. It
therefore seems reasonable to argue that an employee would be more willing to act upon
a high motivation to pursue the route of self-investment should that employee experience
a sense of psychological safety within the job. It therefore seems reasonable to put forward
that perceived psychological safety could moderate the effect of motivation to pursue the
routes, on the extent to which the employee invests the self in the job.
Control of a target is additionally posited as a vital component in the psychological
mechanism that constitutes the phenomenon of ownership (Pierce et al. 2001) and
regulates the strength of the feelings of ownership that develops (Csikszentmihalyi &
Rochberg-Halton, 1981; Dixon & Street, 1957; Isaacs, 1933; Sartre, 1943/1969; White,
1959). Isaacs (1933), in a study of child development, stated that young children felt that
nursery rhymes belonged to them if they had heard or used them first. They would
subsequently exercise control over ‘their’ nursery rhymes by not allowing others to sing
them or listen to them without their permission, thereby further controlling the target, in
this case a nursery rhyme, and stating that it is “mine”. In so doing, they would bring the
target into the self-realm. McClelland (1951) developed the idea that much like body parts,
which individuals have control over, other targets that have the potential to be controlled
come to be regarded as part of the self.
The ability to use, and to control the use of, a target (or object) by others is said to define
ownership (Ellwood, 1927). Control over an object allows an individual to feel the rights
and responsibilities associated with an ownership relationship between the individual and
the target object (Furby, 1991; Pierce et al. 2001). According to Ellwood (1927) use of a
target may be key to feelings of ownership. It is suggested that it is those objects which
are habitually used by an individual which become “assimilated into the domain of the self
of the user,” (Pierce & Jussila, 2011, p. 79).
Furby (1976) proposed that the relationship between the amount of control over a target
and the experience of that target being a part of the self is highly positive. Therefore, the
more control an individual has over a target, the more they experience that target as an
extension of the self, and subsequently experience feelings of ownership. Researchers
(Ellwood, 1927; Furby, 1991) agree and posit that aspects within an individual’s
environment that can be controlled by an individual are more likely to be experienced as
“mine”. Additionally, it is posited that through the exercising of control objects become
Stellenbosch University https://scholar.sun.ac.za

71
more associated with an individual’s self-concept and targets that are not within an
individual’s control are therefore not regarded as part of the individuals sense of self
(Seligman, 1975).
The argument above points to a link between control and a sense of ownership. It however
does not explicitly describe the psychological mechanism at play that brings about the
behaviours of taking control. The examples above provided by Isaacs (1933) and Ellwood
(1927) could provide some clarity here. Isaacs stated that young children took ownership
of nursery rhymes that they had heard first. This action of investing the time to listen to
the nursery rhyme, learn it and use it, can be seen as an investment of the self by the
young child. Through this self-investment the child begins to take control of the nursery
rhyme. Similarly, habitual use, as per the example showcased above by Ellwood, requires
an element of investment such as decisions surrounding why to use the object,
maintaining the object so that it can be used, for example, which require physical and
psychological time and energy.
As mentioned above, in Section 2.4.1, Furby suggests that the effectance motivation is
what predominantly drives the relationship between an individual and his or her
possessions. An individual is driven by the desire to influence outcomes within their
environment through investing the self and in turn being the “cause” of the outcome. It
was also noted in the same discussion, surrounding the roots of psychological ownership,
that Furby associates feelings of control to that of self-expression. A job constitutes an
extension of the employee’s self, by investing the self (as a form of self-expression) and
taking control of the job. The job therefore constitutes an extension of the self primarily
because it acts as an expression of the employee’s ability to exert direct control over it.
This implies that motivation to pursue the routes will not directly manifest itself in the action
of taking control. Rather, an individual may take the risky psychological step to invest the
self in the target, if the employee experiences feelings of psychological safety, to commit
to give the self to the target. This in turn may lead the individual to take control (through
further self-investment). Only once the employee has surrendered the self to the job can
he/she start taking control of what they have given themselves to. It therefore seems
reasonable to hypothesise that self-investment mediates the effect of motivation to pursue
the routes on control of the job.
The third and final route to psychological ownership is coming to know the target intimately
(Pierce et al. 2001). Furby (1978) and Satre (1943) suggest that a target can feel as
though it belongs to an individual purely by association and familiarity. Pierce et al. (2001)
Stellenbosch University https://scholar.sun.ac.za

72
cite the example by Weil of the gardener who after working with his tools26 in a garden
comes to feel as if the garden is his. The gardener learns to respond to the gardens’ needs
after becoming familiar with it intimately. It seems reasonable to suggest then, from the
preceding example, that mere association is not enough. It is the act of working, and
becoming intimately familiar with, the garden that entices feelings of ownership to develop,
within the gardener. Weil refers to this as active association. It is through this process of
active association that an individual is said to gain knowledge about the target and
subsequently begins to develop feelings of ownership. James calls this phenomenon the
“law of mental association by contiguity,” (James, 1890, p. 561).
Pierce et al. (2001) refer to this as active participation and engagement with a target. The
more involved an individual is with a target (through the expenditure of time, energy, and
effort), the more an individual knows about a target, and therefore the more information
there is available to facilitate the building of a connection with said target. James (1980)
and Beaglehole (1932) posit that feelings of ownership emerge through a living
relationship with a target. Through knowing the target intimately it is suggested that it then
becomes a part of the self. The attractiveness of the target, and the targets’ ability to act
as an extension of the self, could therefore be said to motivate an individual to invest time
and energy getting to know the target intimately in order to experience a sense of
ownership. It is therefore suggested here that self-investment as a route to psychological
ownership additionally acts as a mediator between the motivation to pursue the routes
towards psychological ownership and gaining intimate knowledge.
When applied to the world of work it seems reasonable to suggest that after investing time,
energy, thought and one’s self into the job, an employee may experience the job as an
extension of the self, and feel a sense of ownership towards the job. For example, a project
manager who is tasked with managing the production of a product. This project manager
will be involved in the entire project (high task identity) from conceptualisation with product
developers, to marketing the final product (potentially high task significance depending on
the product). This will require the use of a variety of skills and abilities (skill variety) and a
level of autonomy, as suggested above, that motivate the employee to invest time, energy
and psychological resources into the project. “The individual who has created objects
owns them in much the same way as he/she owns him/herself” (Pierce & Jussila, 2011,
26 These tools could refer to the gardener’s expertise and knowledge, his time and effort, his energy and psychological efforts and skills, not merely the actual gardening tools such as rakes, lawnmowers and water.
Stellenbosch University https://scholar.sun.ac.za

73
p. 82). This project manager could therefore potentially feel a sense of psychological
ownership towards this product, upon completion of the project, due to the time and energy
and skills invested into it.
Furthermore, it seems reasonable to suggest that the exercising of control over the job,
would therefore lead to feelings of ownership of the job. It therefore seems reasonable to
argue that a production worker, for example, who is not afforded the luxury of controlling
aspects of the job (limited autonomy), may not be motivated to (as the characteristics of
the environment do not allow for the necessary satisfaction of the need for effectance)
take control, thereby limiting the rights and responsibilities attached to “owning” the target
and therefore not experience feelings of ownership. Based on the above discussion it
seems reasonable to suggest that there is a positive relationship between the amount of
control that an individual has over the job, and is afforded within the job, and feelings of
ownership for that job. Additionally, it seems reasonable to argue that should an employee
experience higher levels of control within the job he/she could gain more intimate
knowledge surrounding aspects of the job. By being afforded the luxury of controlling all
aspects of an advertising campaign, for example, an advertising executive will have
knowledge about every aspect of the campaign from costing to deadlines. It therefore
seems reasonable to suggest that an employee’s level of control could have a positive
influence on gaining intimate knowledge as a route to psychological ownership.
Within the work context, or even the writing of a thesis, for example, the more time you
spend researching, discovering all of the intricacies of the topic, and getting to know the
topic under investigation intimately, the more you feel a sense of ownership towards that
topic in terms of “My thesis is about…”, “My topic is…”. Therefore, by spending the time
and energy gathering information, and subsequently having intimate knowledge about a
job, the job then becomes an extension of the self, and an employee may feel a sense of
ownership towards the job. In light of the above description of the routes to psychological
ownership and subsequent application to the world of work, it seems reasonable to
suggest the following hypotheses:
Hypothesis 9: In the proposed psychological ownership structural model it is
hypothesised that motivation to invest in the psychological ownership routes has
a positive influence on the extent to which an investment is made in self-
investment as a route to psychological ownership.
Stellenbosch University https://scholar.sun.ac.za

74
Hypothesis 10: In the proposed psychological ownership structural model it is
hypothesised that the extent to which an employee feels psychologically safe
within their work environment will moderate the effect of motivation to pursue the
routes towards psychological ownership on the extent to which an investment is
made in self-investment as a route to psychological ownership.
Hypothesis 11: In the proposed psychological ownership structural model it is
hypothesised that self-investment positively affects investment in control of the
job.
Hypothesis 12: In the proposed psychological ownership structural model it is
hypothesised that the extent to which an investment is made in gaining intimate
knowledge, as a route to psychological ownership, is positively influence by
control of the job.
Hypothesis 13: In the proposed psychological ownership structural model it is
hypothesised that the extent to which an investment is made in self-investment,
as a route to psychological ownership, has a positive influence on psychological
ownership.
Hypothesis 14: In the proposed psychological ownership structural model it is
hypothesised that the extent to which an investment is made in control of the job
has a positive influence on psychological ownership.
Hypothesis 15: In the proposed psychological ownership structural model it is
hypothesised that the extent to which an investment is made in gaining intimate
knowledge has a positive influence on psychological ownership.
Returning to Weill’s example of the gardener it additionally seems reasonable to suggest
that should the flowers flourish under his care and the grass remain green and lush that
the gardener will take great pride in the results, inserting further energy and effort into
maintaining this state, and feel a further sense of ownership towards the success of the
garden. The feedback from the garden (I need more water as it’s a hot day, my flowers
are wilting in the heat of the sun) provides information to the gardener, who in turn reacts
to this information by investing more effort, time and energy into the garden, deepening
understanding surrounding the garden’s needs. Therefore by gaining intimate knowledge
and investing oneself into the target thereby gaining even deeper knowledge about the
target one becomes more deeply engrained into the target. It seems reasonable then to
Stellenbosch University https://scholar.sun.ac.za

75
suggest that there is a positive reciprocal relationship (reciprocal causation) between self-
investment and intimate knowledge.
Hypothesis 16: In the proposed psychological ownership structural model it is
hypothesised that self-investment affects the extent to which an employee invests
in gaining intimate knowledge.
Hypothesis 17: In the proposed psychological ownership structural model it is
hypothesised that the extent to which an investment is made in gaining intimate
knowledge has a positive influence on the extent to which an investment is made
in self-investment.
Motivational effects of psychological ownership
Pierce and Jussila (2011) and several others (Avey et al. 2009; Baer & Brown, 2012;
Brown, 1989; Druskat & Kubzansky, 1995; Fiorito et al. 2007; Mayhew et al. 2007;
O'Driscoll et al. 2006; Olckers, 2014; Peng & Pierce, 2015; Pierce & Jussila, 2011; Pierce
et al. 2001; 2003), suggest various positive work outcomes associated with feelings of
ownership within the workplace. A number of these have been highlighted within the
introductory section of this research study. One important effect of psychological
ownership hypothesised by Pierce and Jussila seems important to discuss here as a latent
variable that could potentially play a role in the long term attachment to a target, namely
motivation.
Pierce and Jussila (2011, p.87-88) make three27 propositions surrounding the role of
psychological ownership within motivational effects, in their recent book on the topic of
psychological ownership. They propose that:
• For those individuals for whom the ownership (possessive) motive of ‘effectance’ is operative,
the individual who feels a strong sense of psychological ownership for the organisation, for
example, will spend time and energy mentally and physically exploring the organisation.
• For those individuals for whom the ownership (possessive) motive of ‘self-identity’ is operative,
the individual who feels a strong sense of psychological ownership for the organisation, for
example, will spend time and energy using the target of ownership as an expression of their
self-identity
27 The researcher acknowledges that they in fact make four propositions surrounding the motivational effects of psychological ownership in their book. However, since the fourth proposition relates to the motive of stimulation, which the researcher has argued relates to a changing sense of self-identity, rather than an additional motive in its own right, it has been excluded.
Stellenbosch University https://scholar.sun.ac.za

76
• For those individuals for whom the ownership (possessive) motive of ‘having a home-my place’
is operative, the individual who feels a strong sense of psychological ownership for the
organisation, for example, will direct a great deal of activity/energy (mental and/or physical) and
time immersing themselves into the target of ownership.
Although their focus rests within the realm of organisational psychological ownership it
seems reasonable to argue here that these assumptions can also be applied within the
job context. It, therefore, seems reasonable to argue that should an employee experience
a sense of need/motive satisfaction within the job and thereby experience feelings of
ownership for the job that employee will additionally be motivated (or will be motivated
afresh) to spend time and energy mentally and physically exploring the job, using the
target as an expression of their self-identity and immersing themselves into the target.
More specifically, should an employee experience satisfaction of the need for self-identity,
the need to belong or have a home and/or the need to control the job, and in turn after
being motivated to follow the routes to psychological ownership therefore experience
feelings of ownership, or an attachment to the job, it is hypothesised that the employee
could then in turn be motivated to expend more time and energy (physically and
psychologically) on the job. The following feedback hypothesis can be suggested from the
above discussion:
Hypothesis 18: In the proposed psychological ownership structural model it is
hypothesised that the extent to which feelings of psychological ownership are felt
will have a positive influence on levels of the motivation to pursue the routes
towards psychological ownership.
The above theorising has highlighted several possibly relationships within the network of
latent variables that possibly underpin levels of psychological ownership. The following
section will attempt to present these hypotheses diagrammatically in a proposed
psychological ownership structural model.
2.5 THE PROPOSED PSYCHOLOGICAL OWNERSHIP STRUCTURAL MODEL
The sense of ownership in general, and in the workplace specifically, is a psychologically
complex phenomenon, or state, within an individual. The proposed explanatory structural
model below represents an overarching substantive research hypothesis on the manner
in which the latent variables identified in the preceding theorising, are causally related to
each other (Theron, 2015) and to psychological ownership. The path diagram in Figure
2.4 below represents the researchers’ design of a psychological mechanism that could
Stellenbosch University https://scholar.sun.ac.za

77
provide a conceivable account for differences in the level of psychological ownership
experienced by employees. This, in turn, can be translated into structural equations
needed for further analysis. It must be acknowledged that this proposed structural model
posits one particular explanation for differing levels of psychological ownership within
individuals. It does not claim that this is the only explanation, as more than one structural
explanation of the same covariance matrix is possible (Theron, 2015). The proposed
psychological ownership structural model presented in Figure 2.4 below is an attempt to
present a plausible account of the latent variables, and the structural linkages between
them, that are involved in the process of developing feelings of ownership, while bearing
the complexity of this phenomenon in mind.
Stellenbosch University https://scholar.sun.ac.za

78
Figure 2.4. The Proposed Psychological Ownership Structural Model
Psychological
ownership
η1
Job
characteristics
ξ1*2
Motivation
to pursue
η2
Intimate
knowledge
η4
β53
Control of
the job
η5
Intimate
knowledge
η4
Self-
investment
η3
Psychological
safety *
Motivation
ξ6
Squared Salient
needs
ξ3
Salient needs
ξ2
β13
β15
β14
β34 β43
β45
β32
γ25
γ21
γ22
γ23
γ24
γ26
γ36
β53
β53
β21
ζ1
ζ3
ζ5*1
ζ4
ζ2
Salient needs *
Job characteristics
ξ5
Squared Job
characteristics
ξ4
*1 Psi is a diagonal matrix.
*2 All off-diagonal elements in phi are freed to be estimated but for 23, 15, 14, 25 that are set to zero
Stellenbosch University https://scholar.sun.ac.za
Stellenbosch University https://scholar.sun.ac.za

79
CHAPTER 3
RESEARCH METHODOLOGY
3.1 INTRODUCTION
Researchers and scientists, in their quest to generate a truthful, valid or plausible
understanding of the world, seek to discover unambiguous evidence to support (or to
refute) claims or representations of specific phenomenon (Babbie & Mouton, 2014). In
order to be deemed valid or plausible these descriptions and/or explanations of
phenomena have to withstand rigorous testing. As such, researchers, and the research
process in general, attempt to uphold a commitment to true and valid knowledge as an
epistemic imperative (Babbie & Mouton, 2014). This is accomplished by subjecting all
hypotheses to an attempt at disconfirmation. The purpose of this chapter is to outline, and
justify, the methods that were used to uphold the intrinsic contract of the epistemic
imperative throughout this research process in so far as it outlines the practical details of
the research undertaken.
The theorising in Chapter two culminated in the development of a comprehensive
structural model describing the hypothesised psychological mechanism underpinning
feelings of ownership. A distinctive feature of this model is the manner in which it
incorporated the fit or congruence between the target (the perceived ability of the job
characteristics to satisfy salient employee needs) and the self (the salient psychological
ownership needs), as a vital component of the psychological mechanism regulating the
development of psychological ownership.
This explanatory model of psychological ownership therefore acts as a tentative answer
to the research initiating question “Why variance in psychological ownership exists
amongst different employees working in different organisational contexts?” This model
depicts the overarching substantive research hypothesis and the path-specific substantive
research hypotheses. In order to provide convincing empirical evidence to support the
claims outlined in Chapter two, this tentative structural model of psychological ownership
must endure rigorous empirical testing in an objective, rational, manner that reduces error
so as to optimise the probability of coming to a valid verdict on the validity of the research
hypotheses. This error reduction facilitated an increase in the likelihood that the eventual
verdict on the validity of these substantive claims will be valid. The probability of coming
to a valid verdict on the validity of the research hypotheses firstly lies in the objectivity of
the method used to empirically test the research hypotheses (Babbie & Mouton, 2014).
Stellenbosch University https://scholar.sun.ac.za

80
The subsequent outline of the method used to test the overarching and path-specific
substantive research hypotheses begins with the presentation of the substantive research
hypotheses, a decision with regards to the research design chosen, development of
statistical hypotheses to allow for empirical testing, a description of the sampling
methodology and concludes with a description of the statistical produces used to test the
statistical hypotheses. Emphasis was placed on those phases in the quantitative
explanatory research process where the epistemic ideal had a higher risk of derailing.
The probability of coming to a valid verdict on the validity of the research hypotheses
secondly lies in the rationality of the method used to empirically test the research
hypotheses (Babbie & Mouton, 2014). Scientific rationality requires the research
methodology to be opened up for critical inspection by knowledgeable peers. A necessary
prerequisite for scientific rationality to operate is a sufficiently detailed description of the
methodological choices that were made and the motivation underpinning them so as to
provide knowledgeable peers sufficient clarity as to the methodology that was used.
This chapter therefore comprehensively describes the methodological choices that were
made to test the psychological ownership structural model, which resulted from the
theorising conducted in the literature review in Chapter 2, and argue why the particular
choices were made.
3.2 SUBSTANTIVE RESEARCH HYPOTHESES
Hypotheses are the “working instruments of theory” (Kerlinger & Lee, 2000, p. 27) and are
vital to the process of scientific research. They act as the link between existing literature
and theory, researcher beliefs and empirical testing. The intention of the hypothesis is to
clearly articulate the researchers’ belief, in terms of the hypothesised relationship between
latent variables, in such a manner as to clarify the nature of the relationship. This relational
assumption allows for hypothesis testing in order to determine whether these ‘educated
guesses’ or assumptions are valid.
The facts are allowed a chance to speak to the validity of the presented relations. These
hypotheses therefore aid in “taking man out of himself, so to speak…because although
formulated by man, they can be tested and shown to be correct or incorrect apart from
man’s values and beliefs” (Kerlinger, 1979, p. 35). It is this purpose that allows for the
advancement of knowledge as each hypothesis represents an explanation of the
dependent variable that affords researchers the luxury of testing it against empirical
Stellenbosch University https://scholar.sun.ac.za

81
evidence. A satisfactory explanatory hypothesis should contain at least two variables,
express a causal or cause-effect relationship between these variables, be expressed as
an expected future outcome, logically flow from or be linked to the research question and
be falsifiable (Neuman, 1997).
Substantive research hypotheses are an imperative part of positivist research (Kerlinger
& Lee, 2000). They are, however, not directly testable per se via research designs that
utilise conventional statistical analysis techniques like correlation analysis, regression
analysis and analysis of variance to test the statistical hypotheses associated with the
design. When utilising conventional statistical analysis techniques substantive research
hypotheses have to be translated to operational hypotheses to allow their indirect
empirical testing. The overarching substantive research hypothesis in the current study
and the path-specific substantive hypotheses into which it dissects are, however, testable.
This can be done via an ex post facto correlational research design, via structural equation
modelling, without formulating operational hypotheses in as far as estimates of the freed
structural model parameters are obtained that describe the strength of the hypothesised
relationships between the latent variables themselves rather than between operational
indicators of the latent variables28.
The literature review in Chapter 2 culminated in a psychological ownership structural
model or schematic representation of hypotheses. The hypotheses provided below
therefore act as declarative statements of the direction of the relationship or relations
between the variables contained within this psychological ownership structural model.
These in turn allowed for statistical hypothesis to be generated and empirical tested
(Kerlinger & Lee, 2000).
28 The conventional approach deduces an empirically testable operational hypothesis via a deductive argument from the substantive hypothesis. The structural equation modelling approach also deduces testable implications from the overarching substantive hypothesis via a deductive argument. In the latter case, however, the conclusion is of a statistical nature and on the discrepancy between an observed and an estimated covariance matrix rather than on the relationship between two (or more) observed variables. Substantive research hypothesis: The structural model provides a valid account of the psychological mechanism
that regulates the levels of j comprising the to-be-explained phenomena.
Premise 1: Yi provide valid, reliable and unbiased empirical measures of i.
Premise 2: Xi provide valid, reliable and unbiased measures of i. Conclusion: The comprehensive model provides a valid account of the process that brought about the observed correlation matrix and therefore estimates of the freed comprehensive model parameters can be obtained that will allow the estimation of the observed sample variance-covariance matrix S^ that reproduces the observed sample variance-covariance matrix S with a degree of accuracy that can be explained in terms of sampling error only under H0. It therefore needs to be conceded that in both instances the substantive hypotheses are tested indirectly via empirically testable inferences that are derived via a deductive argument from the substantive hypothesis.
Stellenbosch University https://scholar.sun.ac.za
82
The overarching substantive research hypothesis, namely, that the psychological
ownership structural model provides a valid account of the psychological mechanism
underpinning the levels of psychological ownership (Hypothesis 1), were dissected into
the following more detailed, path-specific substantive research hypotheses:
Hypothesis 2: In the proposed psychological ownership structural model it is
hypothesised that job characteristics (1) (more specifically the perceived ability of the job
characteristics to satisfy salient psychological ownership needs) have a positive influence
on motivation to engage in the routes towards psychological ownership (2).
Hypothesis 3: In the proposed psychological ownership structural model it is
hypothesised that the strength/salience of an employee’s root needs (2) positively
influences motivation to engage in the routes to psychological ownership (2).
Hypothesis 4: In the proposed psychological ownership structural model it is
hypothesised that squared salient individual needs (3) positively influences the motivation
to engage in the routes towards psychological ownership (2).
Hypothesis 5: In the proposed psychological ownership structural model it is
hypothesised that salient individual needs * perceived ability of the job characteristics to
satisfy salient needs (5) positively influences motivation to pursue the routes towards
psychological ownership (2).
Hypothesis 6: In the proposed psychological ownership structural model it is
hypothesised that squared perceived ability of the job characteristics to satisfy salient
needs (4) positively influences motivation to pursue the routes towards psychological
ownership (2).
Hypothesis 929: In the proposed psychological ownership structural model it is
hypothesised that motivation to invest in the psychological ownership routes (2) has a
positive influence on the extent to which an investment is made in self-investment as a
route to psychological ownership (3).
29 Hypothesis 7 and hypothesis 8 refer to assumptions surrounding the response surface analyses with regards to the influence of congruence between two latent variables (salience of employee root needs and the perceived ability of the job to satisfy these salient root needs) and a single dependent variable (motivation to pursue the routes to psychological ownership). These hypotheses have therefore been presented separately, after the 16 path-specific hypotheses.
Stellenbosch University https://scholar.sun.ac.za

83
Hypothesis 10: In the proposed psychological ownership structural model it is
hypothesised that the extent to which an employee feels psychologically safe within their
work environment will moderate the effect of motivation to pursue the routes towards
psychological ownership (6) on the extent to which an investment is made in self-
investment as a route to psychological ownership (3).
Hypothesis 11: In the proposed psychological ownership structural model it is
hypothesised that self-investment (3) positively affects investment in control of the job
(5).
Hypothesis 12: In the proposed psychological ownership structural model it is
hypothesised that the extent to which an investment is made in gaining intimate
knowledge, (4) as a route to psychological ownership, is positively influenced by control
of the job (5).
Hypothesis 13: In the proposed psychological ownership structural model it is
hypothesised that the extent to which an investment is made in self-investment (3), as a
route towards psychological ownership, has a positive influence on psychological
ownership (1).
Hypothesis 14: In the proposed psychological ownership structural model it is
hypothesised that the extent to which an investment is made in control of the job (5) has
a positive influence on psychological ownership (1).
Hypothesis 15: In the proposed psychological ownership structural model it is
hypothesised that the extent to which an investment is made in gaining intimate knowledge
(4) has a positive influence on psychological ownership (1).
Hypothesis 16: In the proposed psychological ownership structural model it is
hypothesised that self-investment (3) affects the extent to which an employee invests in
gaining intimate knowledge (4)
Hypothesis 17: In the proposed psychological ownership structural model it is
hypothesised that the extent to which an investment is made in gaining intimate knowledge
(4) has a positive influence on the extent to which an investment is made in self-
investment (3).
Stellenbosch University https://scholar.sun.ac.za

84
Hypothesis 18: In the proposed psychological ownership structural model it is
hypothesised that the extent to which feelings of psychological ownership (1) are felt will
have a positive influence on levels of motivation to pursue the routes towards
psychological ownership (2).
Additional hypotheses were developed through theorising in Chapter 2. These relate to
the response surface analysis outlining the aspect of congruence and its influence on
motivation to pursue the routes towards psychological ownership.
These are presented as follows:
Hypothesis 7: In the proposed psychological ownership structural model it is
hypothesised that a) Motivation to engage in the routes to psychological ownership
changes positively as congruence moves from the perception that the job does not allow
the satisfaction of the salient needs combined with low salience of the employees needs
to the perception that the job does allow the satisfaction of the salient needs combined
with high salience of the needs; b) Motivation to pursue the routes towards psychological
ownership changes convexly (along the line of congruence) as congruence moves from
the perception that the job does not allow the satisfaction of the needs combined with low
salience of the needs to the perception that the job does allow the satisfaction of the needs
combined with high salience of the needs.
Hypothesis 8: In the proposed psychological ownership structural model it is
hypothesised that a) Motivation to pursue the routes towards psychological ownership
changes negatively as incongruence changes from the perception that the job does allow
the satisfaction of the needs combined with low salience of the needs to the perception
that the job does not allow the satisfaction of the needs combined with high salience of
the needs; b) Motivation to pursue the routes towards psychological ownership changes
linearly as incongruence changes from the perception that the job does allow the
satisfaction of the needs combined with low salience of the needs to the perception that
the job does not allow the satisfaction of the needs combined with high salience of the
needs.
Latent polynomial regression with response surface analysis should therefore be
conducted to analyse these hypotheses.
3.3 RESEARCH DESIGN
Stellenbosch University https://scholar.sun.ac.za

85
In order to provide clarity on the manner in which the hypothesised relationships, identified
above in Section 3.2, were tested, and to additionally improve the quality of the outcomes
of the research, it is important to follow a strategic plan or framework. This plan, namely
the research design, addresses certain aspects of the scientific inquiry (Babbie & Mouton,
2014) and “suggests the direction of observation making and analysis” (Kerlinger & Lee,
2000, p. 451).
The research design should therefore enable the research to be conducted in a valid,
objective and accurate manner. According to Kerlinger and Lee (2000) a research
design’s main technical function is to assist in the controlling of (dependent variable)
variance, such as experimental/systematic, extraneous and error variance, in a study. The
aim of constructing an efficient research design that controls independent variable
variance is threefold. Firstly, it should attempt to maximise the variance in the dependent
variables that are due to the independent variables that according to the substantive
research hypotheses affect the dependent variables. This refers to maximising the
systematic variance in the dependent variable. This is important because there is little
chance of separating the variance due to the independent variables of interest from the
total variance in the dependent variable should the independent variables not differ
considerably. Secondly, it should also attempt to minimise error variance due to non-
relevant sources of systematic and random error variance. This can be attained through
the reduction of errors through the use of controlled conditions, an increased reliability in
the measures used to operationalise the latent variables within the nomological network
and controlling for systematic variance brought about by non-relevant variables through
matching or the use of covariates. Lastly, the research design should aim to control for
variance caused by extraneous or unwanted variables that could potentially be
confounded with the systematic variance (Kerlinger & Lee, 2000). This is achieved through
randomisation, eliminating the variable as a variable or by building it into the design as an
independent variable. Randomisation is the best way to control extraneous variable
nuisances according to Kerlinger and Lee (2000).
Following an appropriate research design increases the likelihood that the manner in
which the hypotheses are empirically tested brings about unambiguous results (Theron,
2014a). Behavioural and social sciences however pose a challenge to researchers
specifically in terms of the selection of this appropriate research design. Some argue that
studying human behaviour requires a certain degree of flexibility, while others advocate
the use of fixed, technical blueprints, specifically from a control point of view. There has
Stellenbosch University https://scholar.sun.ac.za

86
been much debate surrounding the best type of research design for the social sciences
(Durrheim, 2011). However, there are certain rules of thumb that can be followed when
considering the different design options available. What remains important is that the
researcher be guided at all times by the research initiating question.
The research design chosen must therefore be fit for purpose. The kind of research
conducted must, as mentioned, meet the needs of the research initiating question as well
as maximise the probability of arriving at a valid verdict on the validity of the hypothesis
(Theron, 2014a). In this way, the research design chosen will aid in upholding the
epistemic imperative of research. It is essential to understand the intricacies of research
design options and how each design can influence the outcome of research and the logical
errors that could arise when developing explanations for phenomenon (Neuman, 1997).
This section will outline, the purpose of the current study, potential design options suitable
for this purpose, as well as rules of thumb that aid in the research design dilemma.
Furthermore, the rules of thumb will be applied to the current study to justify the chosen
research design. This will be done in order to allow the research approach to withstand
professional scrutiny from peers or replication of research efforts within other contexts.
According to De Vaus (2001) researchers ask two types of question: ‘What is going on?’
And ‘Why it is happening?’ These questions point to the three most common research
purposes, which influence research designs: exploration, description (to answer questions
pertaining to the current situation) and explanation (to gain insights as to why a certain
situation occurs).
Exploratory research aims to explore a relatively new area, topic or construct on which
there is currently no well-developed body of literature or knowledge. According to Babbie
and Mouton (2014) exploratory studies are undertaken for six reasons. These are to:
1) Satisfy the researchers curiosity and desire for understanding
2) Test the feasibility of undertaking a more extensive study
3) Develop the methods to be employed in any subsequent study
4) Explicate the central concepts and constructs of a study
5) Determine priorities for future research
6) Develop new hypotheses about an existing phenomenon
Descriptive research, as its name suggests, provides an accurate description or profile of
events, situations, phenomenon and the like. This type of research is used when the aim
Stellenbosch University https://scholar.sun.ac.za

87
of research is to define. Descriptive research is often extended and goes on to examine
why the observed (average) levels of the variables that constitute the described
phenomenon exist. This results in diagnostic research that aims to explain the levels of
the variables that constitute the described phenomenon in terms of the level of one or
more of the variables that act as determinants of those variables. Descriptive research is
also often extended to examine why variance in the observed levels of the variables that
constitute the described phenomenon exist (Babbie & Mouton, 2014), namely explanatory
research. This type of research is used to answer “why” questions with the aim of
indicating causality between constructs or variables.
In order to decide upon a design appropriate to explain the variance in the levels of
psychological ownership experienced by different employees in different organisational
contexts, the following questions must be answered:
• Can the exogenous latent variable within the structural model be manipulated by
the researcher?
• How many exogenous and endogenous latent variables are captured or
investigated within the structural model?
• Are there proposed causal linkages hypothesised between the endogenous latent
variables within the structural model, if the model contains two or more
endogenous latent variables?
As mentioned, the research problem and purpose suggests or points to a specific research
design (Kerlinger & Lee, 2000). Identifying the variables that explain why certain
individuals within certain organisational contexts experience differing levels of
psychological ownership, involves explanation. Therefore, since the underlying purpose
of the current research study is to answer a “Why” question, the purpose of the research
is therefore explanatory in nature, i.e. designed to identify causality (Durrheim, 2011;
Saunders, Lewis, & Thornhill, 2009) or stated otherwise to understand the relationships
between the identified latent variables job characteristics, motivation to pursue the routes,
psychological ownership needs and routes, as well as psychological safety and
psychological ownership.
Since the purpose of this study is to explain the relationships or causal influences between
variables within the psychological ownership structural model two approaches could be
applicable: experimental and non-experimental. Experimental research and non-
experimental research share the same purpose, namely to study relations between latent
Stellenbosch University https://scholar.sun.ac.za
88
variables. Furthermore “their scientific logic is also the same: to bring empirical evidence
to bear on the conditional statements of the form If p, then q,” (Kerlinger & Lee, 2000, p.
559). An important distinction between these two approaches, however, lies within the
element of manipulation or control. Experimental research on the one hand, affords the
researcher the luxury of control in that the independent variable can be manipulated in
order to determine the effect of this change on the dependent variable. Non-experimental
research, on the other hand, does not allow for this element of control or manipulation.
Furthermore, non-experimental research does not allow for the random assignment of
subjects “because the nature of the variables is such as to preclude manipulation”
(Kerlinger, 1986, p. 293).
Kerlinger (1986, p.348) describes non-experimental research as:
Systematic empirical inquiry in which the scientist does not have direct
control of independent variables because their manifestations have
already occurred or because they are inherently not manipulable.
Inferences about relations among variables are made, without direct
intervention, from concomitant variation of independent and dependent
variables.
Since this study involves investigating an overarching psychological ownership structural
model, as presented in Figure 2.1, it is important to look at the most appropriate design.
The factors discussed above will now be investigated as they pertain to the proposed
psychological ownership structural model.
Assessing the research design for the proposed psychological ownership
structural model
The research ideal is a controlled experiment, if this type of design is fit for purpose.
However, many research questions do not lend themselves towards this type of research
design, thereby necessitating the use of a non-experimental design. Taking the above
psychological ownership structural model, as well as the stipulated questions into account,
the following can be deduced:
Firstly, considering the fact that the six exogenous latent variables (job characteristics,
salient needs, squared salient needs, perceived ability of the job to satisfy salient needs,
squared perceived ability of the job to satisfy salient needs, salient needs*perceived ability
of the job to satisfy salient needs as well as psychological safety*motivation), contained
Stellenbosch University https://scholar.sun.ac.za

89
within the model, cannot be experimentally manipulated30, the use of a non-experimental
design seems appropriate. More specifically, in cases where the researcher does not use
manipulation of variables, nor the random assignment of the sample, an ex post facto non-
experimental design is suggested. This is due to the fact that the researcher wishes to
(after the fact) seek the underlying psychological mechanisms that influenced or
determined the levels of a psychological state, namely psychological ownership, after
these feelings of ownership have (or have not) developed in an individual.
Two design options are available for ex post facto research studies namely, a type II quasi
experimental design or a correlational design. The purpose of this research study is to
empirically test the overarching substantive hypothesis, as it is described in the structural
model depicted in Figure 2.1, which contains hypothesised causal paths between the
endogenous latent variables. The psychological ownership structural model a) contains
five endogenous latent variables31, namely, motivation to pursue the routes towards
psychological ownership, the three routes to psychological ownership namely; self-
investment, control of the job, intimate knowledge; and psychological ownership that b)
are affected by six exogenous latent variables. Additionally, causal relations do exist
between the endogenous latent variables32, self-investment, intimate knowledge, control,
motivation to pursue the routes and psychological ownership. It is therefore suggested
that since this study is looking at cause and effect of phenomena, namely the latent
variables that influence levels of psychological ownership, after the fact, at a single point
in time, without manipulation of the independent variables, as mentioned, the use of a
non-experimental ex post facto cross sectional correlational design is applicable.
The only way to test an explanatory structural model, in which causal paths are
hypothesised between the endogenous latent variables, as an integrated whole, is through
structural equation modelling (SEM) (Diamantopoulos & Siguaw, 2000). The use of SEM
implies an ex post facto correlational design with two or more indicators per latent variable.
An ex post facto research design is useful here as it is impractical to make use of an
experimental design, the factors necessary to analyse cause-and-effect directly cannot be
controlled, and the independent variable is outside the researcher’s control. This approach
is however not without its limitations. As mentioned above, this type of research design
30 This provides an answer to question 1 in Section 3.3. 31 This provides an answer to question 2 in Section 3.3. 32 This provides an answer to question 3 in Section 3.3.
Stellenbosch University https://scholar.sun.ac.za

90
does not permit manipulation or control of the independent variable, due to that fact that
the cause-effect phenomenon has already occurred. Additionally, it makes randomisation
illogical, due to the fact that it is impossible to produce systematic difference in levels of j
through experimental manipulation after participants have been randomly assigned to
groups. Furthermore, it does not allow for proper interpretations, or more specifically the
research runs the risk of making improper interpretations, due to the lack of control
(Kerlinger & Lee, 2000). When using an ex post facto design it is therefore potentially
difficult to determine the direction of causality, the post hoc lack of control means it is
difficult to isolate variables and the fact that there is a correlation between variables does
not necessarily point to cause (Theron, 2015). The lack of control points to the lack of
internal validity experienced by ex post facto design. Of the several threats to internal
validity such as history, selection, maturation, testing and mortality, this design type can
potentially suffer from selection (Giuffre, 1997).
However, the use of a non-experimental design is often unavoidable (and sometimes
valuable) in behavioural sciences due to the fact that manipulation of, or control of, the
variables (a prerequisite for an experimental design) is not possible (Kerlinger & Lee,
2000) and sometimes not wanted. The manipulation of variables within a research study
is sometimes seen as a negative aspect of experimental research. It is viewed as being
less real, therefore a non-experimental design could be said to provide a truer sense of
reality, where situations are more real and not contrived. Here it can be argued that there
is value in looking at the “variable of interest in situ” (Giuffre, 1997, p. 193). According to
Theron (2015) this type of design can also still maximise systematic error variance,
minimise error variance and control for extraneous variance, through the researcher’s
attempts to select diverse samples, the use of reliable indicator variables and the use of
control variables. These limitations will be kept in mind throughout the research process
and specifically when making inferences or conclusions surrounding causality.
As is seen in the theorising in Chapter 2 the relationship between the variables
underpinning levels of psychological ownership is not simple. In terms of the method of
analysis it therefore seems reasonable to argue that a valid understanding of the latent
variables within the model and how they interact, to in turn influence the behaviour of
working man, is only possible if the method of inquiry used acknowledges this complexity
(Theron, 2015). Therefore, it seems reasonable to suggest that this complex explanatory
structural model, in which causal-linkages are hypothesised between endogenous and
exogenous latent variables, and phantom variables have been added to provide an
Stellenbosch University https://scholar.sun.ac.za

91
enriched interpretation, should be tested as an integrated whole via SEM with response
surface methodology (Shanock, Baran, Gentry, Pattison, & Heggestad, 2010). The ex post
facto correlational design as it applied to the current study is depicted in Figure3.133.
[X11] … [X1j] … [X1,18] Y11 … Y1j … Y1,10
[X21] … [X2j] … [X2,18] Y21 … Y2j … Y2,10
: … : … : : … : … :
[Xi1] … [Xij] … [Xi,18] Yi1 … YIj … Yi,10
: … : … : : … : … :
[Xn1] … [Xnj] … [Xn,18] Yn1 … Ynj … Yn,10
Figure 3.1. Ex Post Facto Correlation Design of the Proposed Psychological
Ownership Structural Model
According to Theron (2014a) the ex post facto correlation design sheds light on the validity
of the overarching and path specific substantive research hypotheses by determining if
the proposed structural model offers an acceptable explanation for the observed
covariance matrix. The observed covariance matrix is developed by obtaining at least two
measures on each of the observed variables. Estimates for the freed structural and
measurement model parameters are then acquired in an iterative fashion. The objective
is to reproduce the observed covariance matrix as closely as possible (Theron, 2014a).
The assumption is that the observed covariances among the measured variables arose
because of the relationship between the variables, identified in the comprehensive
LISREL model34 (Tabachnick & Fidell, 2014). It can be concluded that the proposed
structural model does not provide an acceptable explanation for the observed covariance
matrix should the fitted model fail to accurately reproduce it. Should this be the case, it is
then assumed that the observed covariances among the measured variables did not occur
because of the relationships between the variables, identified in the proposed
comprehensive LISREL model. One would assume that the opposite would be true – that
if the fitted comprehensive LISREL model accurately reproduced the observed covariance
matrix that the comprehensive model would provide a true account for the observed
33 The manner in which the latent variables have been operationalised when fitting the structural model, and therefore the number of exogenous and endogenous indicator variables, are indicated in paragraph 3.6. Table 3.4 that summarises the manner in which the latent variables comprising the structural model were operationalised, indicates a total of 28 indicator variables. 34 The comprehensive LISREL model refers to the structural model, describing the nature of the structural relations that are hypothesised to exist between the latent variables, combined with the measurement model, describing the hypothesised relationships between the latent variables and the observed/indicator variables.
Stellenbosch University https://scholar.sun.ac.za

92
covariance matrix. However, this is not the case. According to Van Deventer (2015) a well-
fitted model that accurately depicts the covariance matrix merely means that the model
provides one plausible explanation for the phenomenon under study. It is important to bear
this in mind when making conclusions and inferences based on the proposed
psychological ownership model.
3.4 STATISTICAL HYPOTHESES
The overarching substantive hypothesis (Hypothesis 1), states that the psychological
ownership structural model provides a valid account of the psychological mechanism
underpinning levels of psychological ownership. Should this hypothesis be believed to
provide a perfect account of this psychological mechanism then the following exact fit null
hypothesis can be presented:
H01a: RMSEA=0
Ha1a: RMSEA>0
It is, however, acknowledged that this is a very rare scenario. Rather, structural models
are developed to closely represent reality as far as possible. Therefore, perfect
representation, in all likelihood is impossible. In this case, this structural model depicting
the psychological mechanism underpinning levels of psychological ownership could then
rather be interpreted as a close approximation. The overarching substantive hypothesis
that the structural model provides a valid account of the psychological mechanism
underpinning levels of psychological ownership should then be presented as the following
close fit null hypothesis:
Ho1b: RMSEA<.05
Ha1b: RMSEA>.05
In addition to the overall fit of the psychological ownership structural model, the following,
more detailed, path-specific hypotheses were tested:
Stellenbosch University https://scholar.sun.ac.za

93
Hypothesis 2: In the proposed psychological ownership structural model it is
hypothesised that job characteristics (1) (more specifically the perceived ability of the job
characteristics to satisfy salient psychological ownership needs) have a positive influence
on motivation to engage in the routes towards psychological ownership (2).
H02: γ21=0
Ha2: γ21>0
Hypothesis 3: In the proposed psychological ownership structural model it is
hypothesised that the strength/salience of an employee’s root needs (2) positively
influences motivation to engage in the routes towards psychological ownership (2).
H03: γ22=0
Ha3: γ22>0
Hypothesis 4: In the proposed psychological ownership structural model it is
hypothesised that squared salience of the individual needs (3) positively influences the
motivation to engage in the routes towards psychological ownership (2).
H04: γ23=0
Ha4: γ23>0
Hypothesis 5: In the proposed psychological ownership structural model it is
hypothesised that salient individual needs * perceived ability of the job characteristics to
satisfy salient needs (5) positively influences motivation to pursue the routes towards
psychological ownership (2).
H05: γ25=0
Ha5: γ25>0
Hypothesis 6: In the proposed psychological ownership structural model it is
hypothesised that squared perceived ability of the job characteristics to satisfy salient
needs (4) positively influences motivation to pursue the routes towards psychological
ownership (2).
H06: γ24=0
Ha6: γ24>0
Stellenbosch University https://scholar.sun.ac.za

94
Hypothesis 9: In the proposed psychological ownership structural model it is
hypothesised that motivation to invest in the psychological ownership routes (2) has a
positive influence on the extent to which an investment is made in self-investment, as a
route to psychological ownership (3).
H09: β 32=0
Ha9: β 32>0
Hypothesis 10: In the proposed psychological ownership structural model it is
hypothesised that the extent to which an employee feels psychologically safe within their
work environment will moderate the effect of motivation to pursue the routes towards
psychological ownership (6) on the extent to which an investment is made in self-
investment, as a route to psychological ownership (3).
H010: γ36=0
Ha10: γ36>0
Hypothesis 11: In the proposed psychological ownership structural model it is
hypothesised that self-investment (3) positively affects investment in control of the job
(5).
H011: β53=0
Ha11: β53>0
Hypothesis 12: In the proposed psychological ownership structural model it is
hypothesised that the extent to which an investment is made in gaining intimate knowledge
(4), as a route to psychological ownership, is positively influenced by control of the job
(5).
H012: β45=0
Ha12: β45>0
Hypothesis 13: In the proposed psychological ownership structural model it is
hypothesised that the extent to which an investment is made in self-investment (3), as a
route towards psychological ownership, has a positive influence on psychological
ownership (1).
H013: β13=0
Ha13: β13>0
Stellenbosch University https://scholar.sun.ac.za

95
Hypothesis 14: In the proposed psychological ownership structural model it is
hypothesised that the extent to which an investment is made in control of the job (5) has
a positive influence on psychological ownership (1).
H014: β15=0
Ha14: β15>0
Hypothesis 15: In the proposed psychological ownership structural model it is
hypothesised that the extent to which an investment is made in gaining intimate knowledge
(4) has a positive influence on psychological ownership (1).
H015: β14=0
Ha15: β14>0
Hypothesis 16: In the proposed psychological ownership structural model it is
hypothesised that self-investment (3) affects the extent to which an employee invests in
gaining intimate knowledge (4)
H016: β43=0
Ha16: β43>0
Hypothesis 17: In the proposed psychological ownership structural model it is
hypothesised that the extent to which an investment is made in gaining intimate knowledge
(4) has a positive influence on the extent to which an investment is made in self-
investment (3).
H017: β34=0
Ha17: β34>0
Hypothesis 18: In the proposed psychological ownership structural model it is
hypothesised that the extent to which feelings of psychological ownership (1) are felt will
have a positive influence on levels of motivation to pursue the routes towards
psychological ownership (2).
H018: β21=0
Ha18: β21>0
The following two statistical hypotheses represent the assumptions surrounding
congruence as theorised as an essential element within the complex model. They have
Stellenbosch University https://scholar.sun.ac.za

96
therefore been dealt with separately as they do not represent path-specific hypotheses
per se.
Hypothesis 7: In the proposed psychological ownership structural model it is
hypothesised that a) Motivation to pursue the routes towards psychological ownership
changes positively as congruence moves from the perception that the job does not allow
the satisfaction of the salient needs combined with low salience of the employees needs
to the perception that the job does allow the satisfaction of the salient needs combined
with high salience of the needs; b) Motivation to pursue the routes towards psychological
ownership changes convexly (along the line of congruence) as congruence moves from
the perception that the job does not allow the satisfaction of the needs combined with low
salience of the needs to the perception that the job does allow the satisfaction of the needs
combined with high salience of the needs.
H07a: a1=0
Ha7a: a1>0
H07b: a2=0
Ha7b: a2>0
Hypothesis 8: In the proposed psychological ownership structural model it is
hypothesised that a) Motivation to pursue the routes towards psychological ownership
changes negatively as incongruence changes from the perception that the job does allow
the satisfaction of the needs combined with low salience of the needs to the perception
that the job does not allow the satisfaction of the needs combined with high salience of
the needs; b) Motivation to pursue the routes towards psychological ownership changes
linearly as incongruence changes from the perception that the job does allow the
satisfaction of the needs combined with low salience of the needs to the perception that
the job does not allow the satisfaction of the needs combined with high salience of the
needs.
H08a: a3=0
Ha8a: a3<0
H08b: a4=0
Ha8b: a40
Stellenbosch University https://scholar.sun.ac.za

97
The specific response surface hypotheses formulated above (H08a – H09b) were tested via
latent score polynomial regression with response surface analysis. This will be discussed
in more detail in Section 3.7.4.
The psychological ownership structural model depicted in Figure 2.5 above defined the
psychological mechanism regulating the levels of psychological ownership such that the
structural error terms are uncorrelated. Psi was therefore defined as a 5 x 5 diagonal
matrix. Only the structural error variances were freed to be estimated.
H0p: jj=0; p= 19, 20, 21, 22, 23; j=1, 2, 3, 4, 5
Ha19: jj>0; p= 19, 20, 21, 22, 23; j=1, 2, 3, 4, 5
Moreover, the psychological ownership structural model depicted in Figure 2.5 defined the
psychological mechanism regulating the levels of psychological ownership such that the
exogenous latent variables are correlated but for the correlation between 1 and the
squared and product latent variables in which it was involved and the correlation between
2 and the squared and product latent variables in which it was involved, Phi was therefore
defined as a full 6 x 6 matrix in which all off-diagonal elements were estimated but for 32
41, 51, 52 , 53 and 54 which were fixed to zero in acknowledgement of the
orthogonalising procedure used to operationalise the latent squared and product terms.
The main diagonal of was fixed to unity.
H0p: ij=0; p=24, 25, …, 32; i=1, 2, …, 6; j=1, 2, …, 6; ij
Hap: ij=0; p=24, 25, …, 32; i=1, 2, …, 6; j=1, 2, …, 6; ij
3.5 SAMPLING
Prior to engaging in theory testing it is important to determine if the sample arises from a
population that is relevant to the theoretical ideas being evaluated (Bentler & Chou, 1987).
Therefore, in an attempt to answer the research question: “Why variance on levels of
psychological ownership exists among employees in different organisational contexts?” it
is important to clarify the specific population under study, by defining the target population
and sampling population, the sampling procedures that will be used and the appropriate
sample size.
Stellenbosch University https://scholar.sun.ac.za
98
Target population, sampling procedure and the sample group
In the current study the phrases “employees” and “different organisational contexts” can
be interpreted very broadly. However, it implies that the target population is limited to
people who are currently employed, full-time. The target population therefore includes all
full-time employees, from different cultural backgrounds, with various demographic
characteristics, at different managerial levels (skilled and semi-skilled), who work for any
type of organisation on a full-time basis.
The phrase “within different organisational contexts” implies the inclusion of various types
of organisations, such as for-profit organisations and not-for-profit organisations. This
would include organisations ranging from large-scale public and private entities to
government agencies and smaller corporate organisations. Of particular interest to this
study is psychological ownership from a South African perspective, necessitated by the
countries previous political history and the fact that South Africa seems to be a neglected
area in the domain of psychological ownership research in general. Therefore, the target
population or units of analysis was defined as employees, of differing skill levels, working
in profit and non-profit organisations, in both the public and the private sectors, within the
borders of South Africa.
Lacking the ability to observe the whole population within the South African organisational
landscape necessitates the question: Who/what to observe and who/what not to observe?
(Babbie & Mouton, 2014) This refers to the process of sampling.
The aim of sampling is to select a small sub-group from the target population that the
researcher will then consider to be representative of the target population (Durrheim,
2011; Kerlinger, 1986). This representativeness allows for conclusions to be generalised
to the target population. The principle here is that it is possible to make inferences about
the target population without the need to collect data from each member of the population.
This enables a reduction in collected data, which should allow for cost and time-saving
benefits, without reducing the accuracy of the findings. Drawing a representative sample
from this target population clearly presents arduous logistical challenges.
Sampling procedure
There are several sampling techniques available, each with their own benefits and
challenges. It is important to be guided by certain principles when deciding on the specific
technique to use. Here it is important to bear the research purpose, the research question
Stellenbosch University https://scholar.sun.ac.za

99
and the type of data that would answer this question as well as sampling error, and the
availability of resources, in mind. The research design should therefore enable the
research to be conducted in a valid, objective and accurate manner. It is important that
the chosen technique minimises sampling error, in terms of the difference between sample
and population characteristics (Miller & Salkind, 2002) so that the sample best represents
the population of interest, and generalisability is possible.
Two types of sampling methods can be used in research, namely probability and
nonprobability sampling techniques (Babbie & Mouton, 2014). The former involves
techniques used to select a random sample where there is a known chance or probability
of each population element (or final sampling unit) being chosen, and it is not zero. The
latter involves situations where probability sampling would be inappropriate or even
impossible, and the chance or probability is not known (Saunders et al. 2009). Here,
members of the population or sub-group do not have known probabilities of being chosen
for the sample. Olsen (2012) argues that strictly speaking this method of sampling should
not be called sampling, but rather selection of participants.
Non-probability sampling, or selection of participants, will be used for the purposes of this
research study. More specifically, a technique of nonprobability sampling called
convenience sampling was used. As suggested by its name, this technique involves
selecting participants based on their convenient accessibility and proximity to the
researcher (Babbie & Mouton, 2014). This technique, although popular in the social
sciences, is not without its drawbacks and authors caution against its haphazard use
(Durrheim, 2011; Kerlinger, 1986; Kerlinger & Lee, 2000) and some say it should be
avoided where possible. This form of sampling is risky and does not share the virtues of
probability sampling due to the involvement of the discretion of the researcher in the
sampling process. Furthermore, since the sample is not chosen at random some factor(s)
unknown to the researcher may predispose the researcher to select a biased sample.
These weaknesses can to some extent be mitigated by research knowledge, expertise,
the care taken in selecting samples and statistical techniques.
These limitations have been acknowledged and inferences during analysis and
interpretation were therefore made with caution and circumspection.
Stellenbosch University https://scholar.sun.ac.za

100
LinkedIn35 was used as an online platform36 for the dissemination of the Composite Job-
based Psychological Ownership Survey. This platform allowed a variety of individuals to
be sampled from a variety of organisations and industries. It is however acknowledged
that this technique poses some additional challenges, and possible limitations in terms of
the diversity of the sample (this is limited to individuals within the researchers contact
group/network), and could therefore be less representative than one would like.
Upon completion of the research study a summary profile of the sample group, presented
in Table 3.1 below, was compiled.
It is evident from the summary profile that the sample of 329 participants was somewhat
diverse, spread across several industries and age groups, but also somewhat biased37 .
This can be seen in both the gender and race summary profiles in that a large percentage
64.5% were female and 75.7 % of the sample group was White. The representativeness
of the sample group therefore comes into question, specifically in terms of age and race.
However, in terms of tenure, industry, job level and age there seems to be an even spread
across the different demographics.
35 This online platform was used post several attempts to gain access to a sample population via large South African corporates. Unfortunately, these attempts where not fruitful, even after gaining consent. Reasons cited were, trying economic times, changes in organisational structuring and organisational uncertainty. 36 This online platform allows researchers to gain access to employed individuals from a wide variety of industries, with varying demographics. Yuan, Bare, Johnson and Saberi, (2014, p.1) found that “online recruitment is a feasible and efficient tool” to attract survey participants. Casler, Bickel, and Hackett, (2013, p. 2156) concur and state that for “some behavioral tests, online recruitment and testing can be a valid—and sometimes even superior—partner
to in-person data collection”.
37 It is acknowledged here that this could be due to the researchers own demographic and, as mentioned, the fact
that the convenience sample was a collection of LinkedIn contacts – which would undoubtedly share some common aspects with the researcher. This limitations is acknowledged and conclusions were there made with caution and circumspection as a generalisability of the results is in question.
Stellenbosch University https://scholar.sun.ac.za

101
Table 3.1
Summary Profile of the Sample Group
Frequency Percentage
Gender
Male 117 35.6% Female 212 64.5%
Race
Black 26 7.9 Coloured 30 9.1 Indian 20 6.1 White 249 75.7 Other 4 1.2
Industry
Communications: Marketing 24 7.3% Construction 5 1.5% Education 31 9.4% Engineering 28 8.5% Finance 57 17.3% Government 14 4.3% Health and fitness 10 3.0% I work across industries 25 7.6% Mining and manufacturing 5 1.5% Retail 7 2.1% Telecommunications 4 1.2% Tourism 2 .6% Transport 7 2.1% Sales 10 3.0% Other 100 30.4%
Age
71+ 2 .6% 61-70 11 3.3% 51-60 35 10.6% 40-50 61 18.5% 35-39 76 23.1% 30-34 68 20.7% 25-29 62 18.8% 20-24 14 4.3%
Job level
Entry level 44 13.4% Junior management 53 16.1% Middle management 85 25.8% Senior management 63 19.1% Specialist 84 25.5%
Tenure
Less than one year 48 14.6% 1-2 years 73 22.2% 3-5 years 75 22.8% 6-10 years 58 17.6% 11-15 years 35 10.6% 16-25 years 26 7.9% More than 25 years 14 4.3%
Stellenbosch University https://scholar.sun.ac.za

102
Sample size
Another important consideration, relevant to the selection of a sample, is the appropriate
sample size. A priori determination of appropriate sample size can avoid wastage of
resources, as well as the conducting of low powered studies. Furthermore, it can improve
the quality of generalisations from the sample to the population. The ideal sample size is
influenced by several factors pertaining to aspects such as the type of study, statistical
criteria and practical constraints (Durrheim, 2011; Kerlinger & Lee, 2000). According to
Saunders et al. (2009) three factors govern the choice of sample size. Firstly, the level of
confidence the researcher needs to have in the data, secondly, the margin of error that
can be tolerated and lastly, the type of analyses that will be conducted and to a lesser
degree the size of the target population.
When dealing with structural models, the use of particular analysis procedures and certain
model characteristics, such as the number of latent variables within the model and the
number of freed model parameters, additionally influence minimum sample sizes. The
flexibility afforded to the researcher when using SEM, which allows for complex
association analysis, the use of different types of data and comparison of various
alternative models, makes it difficult to follow more general guidelines regarding sample
size calculations (MacCallum, Widaman, Zhang, & Hong, 1999). According to Hair, Black,
Babin, and Anderson (2010) there are several factors that can influence sample size,
when using SEM specifically, like the complexity of the model, availability of resources
and practical constraints (a priori), the multivariate normality of data, the amount of missing
data, and the average error variance among the reflective indicators (post priori), as well
as the estimation techniques used.
When assuming that the multivariate normality assumption made by SEM has been
satisfied, a generally accepted, albeit somewhat demanding, ratio is 15 respondents for
each parameter estimated in the model (Saunders et al. 2009). Using this guideline a
sample size of 120038 was indicated to be appropriate for this study. Statistical estimation
procedures can also be used to deal with non-normal data however. Therefore, estimation
techniques must also be kept in mind when deciding on an appropriate sample size.
Maximum likelihood estimation, a popular estimation procedure in SEM can provide valid
results with a sample size as small as 50. Aspects such as missing data and sampling
38 80 x 15 = 1200
Stellenbosch University https://scholar.sun.ac.za

103
error necessitate the use of larger samples and between 200 and 400 observations have
been suggested (Hair et al. 2010). This number, however, varies depending on the model
complexity.
Stutley (as cited in Saunders, Lewis, & Thornhill, 2009) proposes that a sample of at least
30 observations is sufficient. However, Hair et al. (2010) contend that this is only suitable
if dealing with analysis by simple regression, with a single independent variable. Complex
models require far larger samples. The increased number of indicator variables calls for a
larger sample. Moreover, a model containing more constructs means more parameters to
be estimated. Bentler and Chou (1987) provide, what they in their own words term, an
oversimplified guideline, or rule of thumb, regarding the trustworthiness of solutions and
parameter estimates. They suggest that a ratio of sample size to freed parameters of 10:1
is appropriate, but a ratio as low as 5:1 can be used. Therefore, ratios between 5:1 and
10:1 could be considered appropriate, depending on the model. The more complex the
model, the larger the required sample size. From this guideline, it could be suggested that
a sample size of between 400 and 800 (8039 freed parameters in the proposed structural
model) would be appropriate for this study.
Additional scholars40 provide further rules of thumb for deciding on a suitable sample size.
However, Hair et al (2010) cautions against using any rules of thumb when it comes to
sample sizes in SEM as they should not follow a “one size fits all” approach. Hair et al.
(2010, p. 662) does however provide the following suggestions for minimum samples
sizes, bearing model complexity and measurement characteristic in mind, when
conducting SEM:
- Minimum sample size-100: Models containing five or fewer constructs, each with more than three items (observed variables), and with high item communalities (.6 or higher41).
- Minimum sample size-150: Models with seven or fewer constructs, modest communalities (.5), and no under identified constructs.
- Minimum sample size-300: Models with seven or fewer constructs, lower communalities (below.45), and/or multiple under identified (fewer than three items) constructs.
39 The comprehensive LISREL model comprises of the following number of freed parameters: 6 , 9 , 5 , 18 X,
5 Y, 18 , 10 and 9 . Six elements of the matrix were fixed to zero due to the orthogonalising procedure used to calculate the indicators for the latent interaction terms and the latent squared terms. 40 A detailed discussion pertaining to the different rules of thumb is beyond the scope of this research project. However, some rules of thumb have been used to provide evidence of the difficulty in using these guidelines when conducting analysis via SEM. 41 Communalities here refer to the squared factor loading (²ij) of indicator variables on the latent variables they were tasked to reflect. High communalities therefore mean that large proportions of the variance in the indicators can be explained in terms of the latent variable they were tasked to reflect.
Stellenbosch University https://scholar.sun.ac.za

104
- Minimum sample size-500: Models with large numbers of constructs, some with lower communalities, and/or having fewer than three measured items.
Additionally, Hair et al. (2010) state that the sample size should increase if data deviates
from multivariate normality or missing data exceeds 10 percent.
Table 3.2 below outlines a summary of the proposed appropriate sample sizes per
scholar/approach according to the above and below mentioned rules of thumb.
Table 3.2
Summary of Proposed Sample Sizes
Scholar or approach42 Sample size guideline summary Proposed sample size
Bentler and Chou (1987) Suggested guideline using number of freed model parameters in the model
400 - 800
Hair et al. (2010) Suggested guidelines using model complexity and measurement characteristics
500+
Stutley Suggested guideline/rule of thumb 30 Preacher and Coffman (2006)
Software packaged used to compute sample size 21
The effects of sample size are seen most directly in the statistical power of the significance
testing and the generalisability of results, necessitating further consideration.
Statistical power in the context of SEM refers to the probability of rejecting the null
hypothesis of close fit (H0: RMSEA ≤ .05) when in fact it should be rejected (i.e., the model
fit actually is mediocre, Ha: RMSEA > .05.). The probability of rejecting the null hypothesis
in favour of the alternate hypothesis, should that hypothesis be true, is heavily influenced
by sample size. On the one hand, attempts to empirically verify the validity of the model
with excessively high statistical power are pointless, as small deviations from close fit
would result in a rejection of the close fit null hypothesis. On the other hand, models with
excessively low power lead to a situation where the close fit null hypothesis would still not
be rejected even if the model really fits poorly in the parameter. Thereby not providing
very convincing evidence surrounding the validity of the model. To come to valid
conclusions on the validity of the model a sufficiently large sample that provides adequate
statistical power is required.
42 These have been provided in alphabetical order. The chosen order of presentation show no corresponding level of importance of the approach.
Stellenbosch University https://scholar.sun.ac.za

105
Stated differently, sample size influences the exceedance probability associated with a
test statistic (Saunders et al. 2009). A larger sample can make weaker relationships and
smaller differences already significant. Almost any relationship is significant in an
extremely large sample that is very close to the size of the population (Hair et al. 2010;
Saunders et al. 2009). In contrast, a smaller sample makes it more difficult to obtain a
significant test statistic. The critical question to ask is: How large a sample is needed to
obtain trustworthy results? In general, SEM requires bigger sample sizes in comparison
to more conventional statistical analysis techniques.
Preacher and Coffman (2006) compiled software in R that was used in the current study
to aid in estimating an appropriate sample size for the test of close fit. According to
Preacher and Coffman’s (2006) software a sample size of 20.94727 would be necessary
to allow for a statistical power of .80 when testing the psychological ownership structural
model null hypothesis of close fit. This is given a RMSEA of .05 assumed under H0 and
an RMSEA value of .08 assumed under Ha, a significance level (α) of .05, a power level
of .80 and degrees of freedom of 2390.43
Additional, practical or logistical, considerations include aspects such as the availability of
resources as well as participants and the willingness of the organisation to afford
participants the time to fill in questionnaires. Bearing the above in mind, the ideal sample
size is therefore a matter of judgement as well as calculation. It is therefore suggested
that a sample size of 350 could be sufficient to obtain valid results for this study.
The risk of low response rates is a challenge when eliciting voluntary responses from
employees within organisational contexts. In a bid to increase the number of employees
who accepted the invitation to become involved in this research study, and thereby
increase the sample size, participants were invited to provide their cellphone numbers in
order for them to participate in a lucky draw. This participation was purely voluntary and it
was not a prerequisite for completing the questionnaire. Participants who did not wish to
be entered into the lucky could still complete the survey. The option to be entered into the
lucky draw, by supplying a cellphone number, was included at the end of the survey as
part of a second survey which was in no way linked to the participants’ Composite Job-
43 (½[(p+q)(p+q+1)]-t) = (1/2 [(71)(72)]-166 = (1/2[5112]-166) | 2556 – 166= 2390 Where p is the number of exogenous indicator variables, q is the number of endogenous indicator variables and t is the number of parameters in the comprehensive LISREL model that were freed to be estimated.
Stellenbosch University https://scholar.sun.ac.za

106
based Psychological Ownership Survey results. Additionally, an opt-out option was
included for those who do not wish to proceed to the second survey and provide their
cellphone number. A randomly selected participant was then be awarded a Samsung
Tablet44 and the remaining cellphone numbers were all deleted. The anonymity of the
participants has been taken into consideration and is still being respected throughout this
process and no other participants were contacted other than the winner.
3.6 MEASUREMENT INSTRUMENTS/OPERATIONALISATION
In order to test the statistical hypothesis, the latent variables comprising the overarching
substantive research hypothesis had to be quantifiable. However, psychological
ownership, as well as the other related variables within the proposed structural model, are
abstract phenomenon that rest within the mind of the researcher. Therefore, in order to
test the validity of the claims outlined in the substantive hypothesis, and subsequent
statistical hypotheses, the construct of psychological ownership, and the latent variables
which were proposed to influence its levels, had to be operationalised. This involved
determining the level of employees’ standing on the constructs comprising the model or
in other words measurement of the latent variable. Measurement involves “the assigning
of numbers to observations in order to quantify phenomena” (Kimberlin & Winterstein,
2008, p. 2276). This involves operationalisation of the latent variables via effect/reflective
indicator variables or put differently the use of “proxies for variables that we cannot directly
observe,” (DeVellis, 2012, p. 17). This in turn involves the development or use of existing
instruments or tests to quantify these variables.
It was vital, however, that the decision surrounding which instruments to use in order to
operationalise, or quantify, constructs was made carefully. The possible indicator
variables had to be evaluated in terms of their reliability, validity and applicability to the
latent variables under question. Existing literature showcases evidence of key indicators
of the quality of different measuring instruments, in terms of their reliability and validity. In
light of this evidence several instruments were chosen or modified to operationalise the
constructs presented in the proposed psychological ownership structural model.
For certain latent variables within the model, however, academic literature had as yet not
identified any suitable measures available. This was due to the fact that either the
44 The value of this prize is between R1000.00 and R3000.00. It is the opinion of the researcher that this is a suitable prize of an appropriate value. It affords the participants an incentive to participate without feeling as though it is a bribe or unethical means of coercion to participate.
Stellenbosch University https://scholar.sun.ac.za

107
conceptualisation of the constructs that they were developed to measured differed from
that in this current study, or simply because no measure currently exists. This therefore
necessitated the development of several scales specifically for the current study. The
latent variables for which new scales had to be developed were the three roots of
psychological ownership namely, the need for self-identity, the need for a sense of
belonging and the need for self-effectance, as well as the motivation to pursue the routes
towards psychological ownership. The Delphi technique was subsequently used to assess
the applicability of suggested items proposed for inclusion in the Composite Job-based
Psychological Ownership Survey.
The Delphi technique refers to a flexible research method used to turn opinion into group
consensus (Hsu & Sandford, 2007; Landeta, 2006). According to Hsu and Sandford
(2007, p. 1.) “The Delphi technique is a widely used and accepted method for gathering
data from respondents within their domain of expertise”. This technique is valuable in the
use of gathering opinions from a group of subject matter experts in order to guide decision
making. A questionnaire (or questionnaires, depending on the depth of the study) is used
to collect data (expert opinion) from a panel of experts or selected subjects. The Delphi
technique additionally employs a multistage or iterative process in order to gain
consensus. This process typically consists of three stages, namely round one which
consists of an open-ended questionnaire, round two which consists of a structured
questionnaire where the subject matter experts are required to rate or rank-order items,
and round three where a list of items as well as their rankings are supplied with certain
information pertaining to minority opinion, and items achieving consensus. This final stage
allows participants to review their judgements.
In terms of selecting the subject matter experts certain criteria do exist within the literature,
however consensus surrounding explicit criterion for inclusion are ambiguous.
Hsu and Sandford (2007) suggest that for inclusion individuals should have related
backgrounds and experience, be able to contribute valuable insights and knowledge and
be willing to reconsider initial judgements in order to reach consensus. A list of the subject
matter experts has not been included within this study as certain members of the group
wished to remain anonymous.
A modified version of the Delphi technique was used for the purposes of the research
study, specifically as the development of a new measuring instrument was not the pivitol
focal point of this study. However, the researcher acknowledges that in order to ensure
Stellenbosch University https://scholar.sun.ac.za

108
that the items measure what they are meant to measure, consensus with regards to their
applicablity, rather than merely researcher opinion alone, is extremely valuable. This
modified version entailed an invitation to participate in this Delphi process, followed by a
combination of a closed-ended and an open-ended questionnaire. Participants were
invited to rank each item in terms of applicability as well as provide further comments or
recommendations. This information was collated. Findings were not re-sent to the
participants for final comment. The Delphi Questionnaire is shown in Appendix 1.
An additional consideration, when operationalising the latent variables comprising the
proposed psychological ownership structural model, is whether the individual items of the
multi-indicator instruments used to measure the various latent variables should be used
to represent the latent variables or whether two or more composites of the individual items
should be formed to represent the latent variables. According the Theron (2014a) there
are four options with regards to determining indictor variables for latent variables within
the model via the instrument used. These are firstly, using the individual items themselves
to represent the latent variables. Secondly, calculating the mean of the even and uneven
items for each subscale/latent variable and creating item parcels to form composite
indicator variables. Thirdly, total (or mean) scores could be used where applicable to
represent each sub-dimension comprising the latent variable, and lastly, calculating a
single score to represent the latent variable. Holt (2004) highlights certain considerations
that must be made surrounding the use of item parcels. These will briefly be discussed
before operationalisation of the latent variables is covered.
According to Holt (2004) the factor structure is important. It is imperative that the
researcher consider the dimensionality of the latent variable – is it unidimensional or
multidimensional? If it is unidimensional then random methods for combining items may
be used (determining the mean of the even and uneven items, for example). However, if
the variable under investigation is multidimensional, isolated parcelling strategies should
be used to determine the appropriate item parcels. These techniques must enable the
different facets to be combined within the same item parcel. Holt suggests that when
dealing with a unidimensional variable having more items per parcel, rather than more
parcels, is better, as long as the unidimensionality is preserved. If the underlying structure
is not known, do not parcel.
The measurement instruments used in this research study, evidence of their statistical
quality, as well as the manner in which the items of the multi-indicator scales were used
Stellenbosch University https://scholar.sun.ac.za

109
to represent the latent variables comprising the model, are presented in the sections that
follow.
Psychological ownership
Although psychological ownership is a relatively new construct within the social sciences
a number of scales have been developed to measure it. Pierce, Van Dyne and Cummings
(1992) developed the first psychological ownership scale using an exploratory study.
Since their initial development, several additional scales have been put forward (Avey et
al. 2009; Avital & Vandenbosch, 2000; Brown, Pierce, & Crossley, 2011; Druskat &
Kubzansky, 1995; Pierce et al. 1992; Van Dyne & Pierce, 2004). However, the
conceptualisation of psychological ownership varies, with certain scholars advocating its
unidimensionality and others arguing multidimensionality. Therefore, the use of the scales
that conceptualise psychological ownership as a multidimensional construct came into
question in the current study. The current study conceptualised psychological ownership
as a uni-dimensional construct. Several of the measures of psychological ownership
additionally focus on organisational psychological ownership as opposed to job-based
psychological ownership, as is the emphasis of this research study.
Therefore, for the purposes of the current research study a measure of job-based
psychological ownership developed by Brown et al. (2011), based on the measure of
organisational-based psychological ownership developed by Van Dyne and Pierce (2004)
was used. Brown et al.’s (2011) job-based psychological ownership scale is a six-item
instrument, which uses a 7-point Likert response scale ranging from strongly disagree to
strongly agree. Cronbach alpha values of .96 and .93 are reported for this instrument
(Pierce & Jussila, 2011).
Two item parcels were used as an aggregate level indicator (Little, Cunningham, Shahar,
& Widaman, 2002) of psychological ownership. This was done by taking the mean of the
even and uneven items to create two indicator variables.
Routes to psychological ownership
The routes to psychological ownership were measured using items developed and
adapted by Brown et al. (2014). Brown et al. combined six control items from a study by
Tetrik and LaRocco, (1987) (Cronbach alpha .83) as well as self-developed items
pertaining to intimate knowledge (four items) and self-investment (five items; endorsed on
Stellenbosch University https://scholar.sun.ac.za

110
a seven point Likert-scale where 1=strongly agree and 7=strongly disagree). Example
items for the control subscale include “To what extent do you influence job-related
decisions that will affect you” and “To what extent do you set your own work deadlines?”
(Brown et al. 2014, p. 331). The control subscale items are endorsed on a seven-point
Likert scale, with 1 = Not at all and 7=To an extremely great extent.
Brown et al. (2014) tested the psychometric properties of this composite Routes to
Psychological Ownership Scale and the items showed good reliability. They reported a
.86 coefficient for the six control items, originally developed by Tetrick and LaRocco
(1987), and further coefficients for intimate knowledge .83 and investment of the self .86.
Item parcels were calculated for each of these three routes to psychological ownership.
This was done by calculating the mean of the even and uneven numbered items to form
two composite indicator variables per each route.
Roots of psychological ownership
The roots of psychological ownership posed a challenge in terms of their measurement.
Previous literature surrounding the development of psychological ownership, through the
routes, has been mostly theoretical, with little empirical data available. When empirical
testing was in fact carried out it was on the roots of psychological ownership
conceptualised as dimensions of this construct rather than psychological mechanisms
within an individual that ignite the process towards feelings of ownership.
It was initially proposed that the roots of psychological ownership would best be measured
using a variety of scales, borrowing from work by Avey et al. (2009) and Olckers et al.
(2013). However, Olckers (2011) identifies certain limitations of the scale developed by
Avey et al. (2009). According to Olckers, this scale uses only three items each per
dimension for four out of their five dimensions within the scale. Olckers points out that this
can influence the accuracy with which the subscales reflect the underlying latent structure
of the psychological ownership roots construct. Idaszak, Bottom, and Drasgow (1988)
provide support for Olckers concerns and point out that four or more indicators are needed
per variable as alpha coefficients will tend to be lower with fewer items in the scale.
Another important consideration, affecting this decision, was the conceptualisation of
psychological ownership, and specifically the conceptualisation of the needs or roots as
dimensions of psychological ownership. Both Avey et al. (2009) and Olckers et al (2013)
define the roots as dimensions of the construct of psychological ownership and not
Stellenbosch University https://scholar.sun.ac.za

111
antecedents. Therefore, it was decided that new items which align with the proposed
unidimensional definition of psychological ownership were needed. A pool of items was
generated, and subject matter experts were tasked with determining the appropriateness
of each item depending on the supplied definition of the dimension. Appendix 1 contains
a copy of the item analysis sheet. Items which according to the subject matter experts
were relevant, were maintained. Several were re-worded and certain suggestions were
incorporated.
The psychometric quality of these items was assessed as part of the current research
study. Since the latent variable psychological ownership needs/roots refers to three
separate individual needs (making this construct multi-dimensional) the ideal would have
been to use the mean scores of each subscale to represent each sub-dimension, namely
the need for self-identity, the need for self-efficacy and the need to belong, comprising this
latent variable. The current study, however, choose to rather calculate two item parcels
from the items of the three subscales. This was done to keep the number of indicator
variables as low as possible, especially for latent variables involved in the latent interaction
effects and/or the squared latent effects. This is since an increased number of indicator
variables would lead to an increased number of freed measurement model parameters
which in turn would create the need for a larger sample. Psychological ownership roots or
salient psychological ownership needs45 was therefore also represented by two indicator
variables.
Job characteristics
Hackman and Oldham (1975), based on their Job Characteristics Model, developed the
Job Diagnostic survey (JDS). This survey measures the five core job characteristics,
namely, skill variety, task identity, task significance, feedback and autonomy, the three
psychological states, as well as the core personal and work outcomes. The Job
Characteristics Model has undergone some revisions in recent years and therefore so has
the JDS. Specifically, a revision to the original JDS has been developed by Idaszak and
Drasgow (1987), the JDS-R, where certain reverse ordered items were rewritten. The
JSD-R is a 30-item scale that elicits responses on a seven-point Likert scale response
system, ranging from disagree strongly (1) to agree strongly (7). Buys, Olckers, and
45 These terms will be used interchangeably throughout the remainder of this research study.
Stellenbosch University https://scholar.sun.ac.za

112
Schaap (2007) recently conducted a study to assess the construct validity of the JDS-R
and found acceptable results. They report alpha coefficients ranging between .67 and .79
for the various subscales confirming that the measure is reasonably reliable46. Van
Loggerenberg (2012) similarly found evidence of acceptable fit and reliability within the
South African context after testing the construct validity of the revised job diagnostic
survey within the diverse South African context.
The revised version has furthermore been proven to be more psychometrically sound with
regards to the Job Characteristics items (Boonzaier, 2001). Boonzaier (2001) tabulated
reliability coefficients of the Job Characteristics subscales of different studies which
utilised the JDS and JDS-R, see Table 3.3 below.
Table 3.3
Boonzaier’s (2001) Tabulated Reliability Coefficients of the Job Characteristics
Researchers Skill Variety
Task Identity
Task Significance
Autonomy Feedback
Bhagat & Chassie (1980) .68 .78 .72 .66 .73 Birnbaum, Farh & Wong (1986) .79 .72 .81 .84 .71 Brief & Aldag (1976) .47 .47 .6 .55 .30 Champoux (1992) .78 .67 .54 .70 .64 Cordery & Savastos (1993) .72 .65 .69 .72 .73 Cordery & Savastos (1993)* .80 .77 .75 .79 .78 Dunham (1976) .76 .72 .72 .73 .75 Dunham, Aldag & Brief (1977) .68 .70 .68 .69 .69 Evans, Kiggundu & House (1979) .53 .52 .50 .53 .38 Forshaw (1985) .64 .6 .58 .6 .48 Fried & Ferris (1987) .69 .69 .67 .69 .70 Hackman & Oldham (1975) .71 .59 .66 .66 .71 Hogan & Martell (1987) .68 .66 .64 .61 .81 Johns, Xie & Fang (1992) .64 .77 .61 .67 .74 Kiggundu (1980) .78 .62 .59 .63 .70 Kim & Schuler (1979) .8 .69 .73 .67 .73 Munz, Huelsman, Konold & McKinney (1996)
.77 .74 .72 .77 .81
Oldham, Hackman & Stepina (1979) .68 .61 .58 .64 .68 Renn & Vandenberg (1995)* .76 .76 .77 .79 .74 Spector & Jex (1991)* .70 .81 .74 .87 .83 Xie & Johns (1995) .76 .67 .64 .74 .73 Yeh (1996) .68 .64 .63 .66 .74 Mean JDS .69 .65 .64 .67 .67 Mean JDS-R .75 .78 .75 .81 .78
*Used the JDS-R (Boonzaier, 2001)
Since it is the job characteristics items that are of particular importance in this study and
46 “These results are important to construct validation, as an instrument cannot be deemed valid if it is not reliable,” (Buys, et al. 2007, p. 37)
Stellenbosch University https://scholar.sun.ac.za

113
the psychometric quality of the JDS-R is superior, the subscales pertaining to the five core
job characteristics namely, sections one and two of the JDS-R, were therefore used to
measure job characteristics for the purposes of this study. These sections include 15
items, measuring the five subscales. Again, the ideal would have been to use mean scores
to represent each sub-dimension, namely skill variety, task identity, autonomy, task
significance and feedback. The current study, however, choose to rather calculate two
item parcels for these subscales. This was again done to constrain the overall number of
indicator variables. The use of the five dimension scores would have meant that the
squared perceived job characteristics latent variable would have been represented by ten
indicators and the salient needs*perceived job characteristics interaction effect by fifteen
indicators. Job characteristics was therefore similarly represented by two indicator
variables.
Motivation to pursue the routes towards psychological ownership
The psychological construct of motivation is a well-studied phenomenon within social and
psychological research. However, the measurement thereof seems somewhat complex.
Several scales exist to measure aspects of the concept of motivation, such as goal
achievement drive, as well as different types of motivation specifically learning motivation.
Since the construct of motivation in this specific research study refers to the motivation to
pursue the routes towards psychological ownership finding an existing scale was a
challenge. Therefore, new items were developed to operationalise the construct of
motivation to pursue the routes towards psychological ownership for the purposes of the
current research study. The operationalisation of the motivation to pursue the routes
towards psychological ownership latent variable was grounded in the expectancy theory
of motivation (Vroom, 1964). In terms of the expectancy theory of motivation, motivational
effort is determined by the multiplicative combination of the expectancy that some action
will result in outcome j and the valence of outcome j summed over the set of salient
outcomes (Vroom, 1964).
Seven items were initially suggested and presented to subject matter experts, as can be
seen from Appendix 1. Relevant suggested changes were implemented according to the
subject matter expert analysis. These suggestions lead to the drafting of several new items
and the final compilation of 18 items within this subscale. Nine of the items were designed
to measure the expectancies associated with routes towards psychological ownership and
nine were designed to measure the valence associated with the same outcomes. The
Stellenbosch University https://scholar.sun.ac.za

114
psychometric quality of the items were evaluated in the current research study. Two item
parcels were calculated for motivation to pursue the routes towards psychological
ownership, using the mean of the sum of the even and uneven numbered valence and
expectancy items of the motivation subscale. This lead to two indicator variables for this
construct.
Psychological safety
There seem to be several mechanisms for measuring psychological safety within the
workplace. However, these scales measure several different variations of psychological
safety ranging from team psychological safety to climate psychological safety. Therefore,
it is important to identify a scale that purports to measure the type of psychological safety
defined in this research study. The definition employed here as borrowed from Kahn
(1990, p. 708) is that psychological safety refers to “feeling able to show and employ one’s
self without fear of negative consequences to self-image, status, or career.” This points to
an individual’s perceived safety, whereby he or she feels that self-expression will not
negatively affect the job or the self. Van Deventer (2014) utilised and adapted nine items
from three psychological safety scales (Brown & Leigh, 1996; Liang, Farh, & Farh, 2012;
May et al. 2004) already in use.
Psychometric analysis of the items, by Van Deventer (2014), showed good results.
However, Van Deventer’s dimensionality analysis did suggest the extraction of two
factors, instead of a single factor. After examining the nature of the items she points out
that six of the items represent a ‘free to be authentic’ factor and the further three represent
‘supervisory support’ as elements of psychological safety. Since the focus of this study is
a perceived feeling of safety to be oneself, and how this influences motivation to then
engage in self-investment and ultimately influences levels of psychological ownership,
only the six items that represent Van Deventer’s “free to be authentic” factor were used
as a measure of psychological safety in this study. These items are endorsed on a five-
point Likert scale, anchored at extreme values of 1 and 5. The psychometric quality of
these items was empirically examined in this study. Two item parcels were calculated for
psychological safety using the mean of the even and uneven items of the psychological
safety subscale. This lead to two indicator variables for this construct.
Stellenbosch University https://scholar.sun.ac.za

115
Latent interaction effects within the structural model
In the past, there was a subtle reluctance or resistance to allow theorising to introduce
interaction effects into an overarching hypothesis because of the anticipated problem it
would bring when testing the model via SEM. Statistical approaches have been suggested
to mitigate these drawbacks. Subsequently, the proposed psychological ownership
structural model not only contained main effects but additionally hypothesised certain
interaction effects, namely two latent interaction effects as well as two latent squared
effects.
The first latent interaction effect and two latent squared effects have been included in the
proposed psychological ownership model in an attempt to attain more meaningful results
surrounding the effect of congruence between two independent variables and its
subsequent influence on a third dependent variable. This increase in meaningfulness
within the model was attained by making provision for curvilinearity in the response
surface depicting the reaction of motivation to pursue the routes towards psychological
ownership to the congruence between an employee’s salient root needs and the perceived
ability of the job to satisfy an employee’s salient root needs.
In contrast to the inclusion of these phantom variables, to allow for latent score polynomial
regression, a theoretical argument constructed through theorising in Chapter 2 lead to the
inclusion of the second latent interaction effect within the model. It was assumed, and
therefore hypothesised, that the extent to which an employee feels psychologically safe
within their work environment will moderate the effect of motivation to pursue the routes
on the extent to which an investment is made in self-investment (i.e. the perceived
psychological safety*motivation to pursue the routes to psychological ownership
influences self-investment by the employee).
Several approaches for addressing latent variable interactions have been proposed
(Mahembe, 2013) including the Kenny and Judd (1984) technique, the constrained
approach, mean centering (Algina & Moulder, 2001) and the unconstrained approach
(Marsh, Wen, & Hau, 2004). More recently, a technique called orthogonalising, or residual
centering, suggested by Little, Bovaird, and Widaman (2006) has been adopted for
dealing with latent interaction and latent squared effects. This technique provides a way
for researchers to include latent interaction, and powered effects, in models and according
to Little et al. (2006, p. 500) is a “comparable alternative to mean centering that also serves
to eliminate nonessential multicollinearity in regression analyses.” Specifically,
Stellenbosch University https://scholar.sun.ac.za
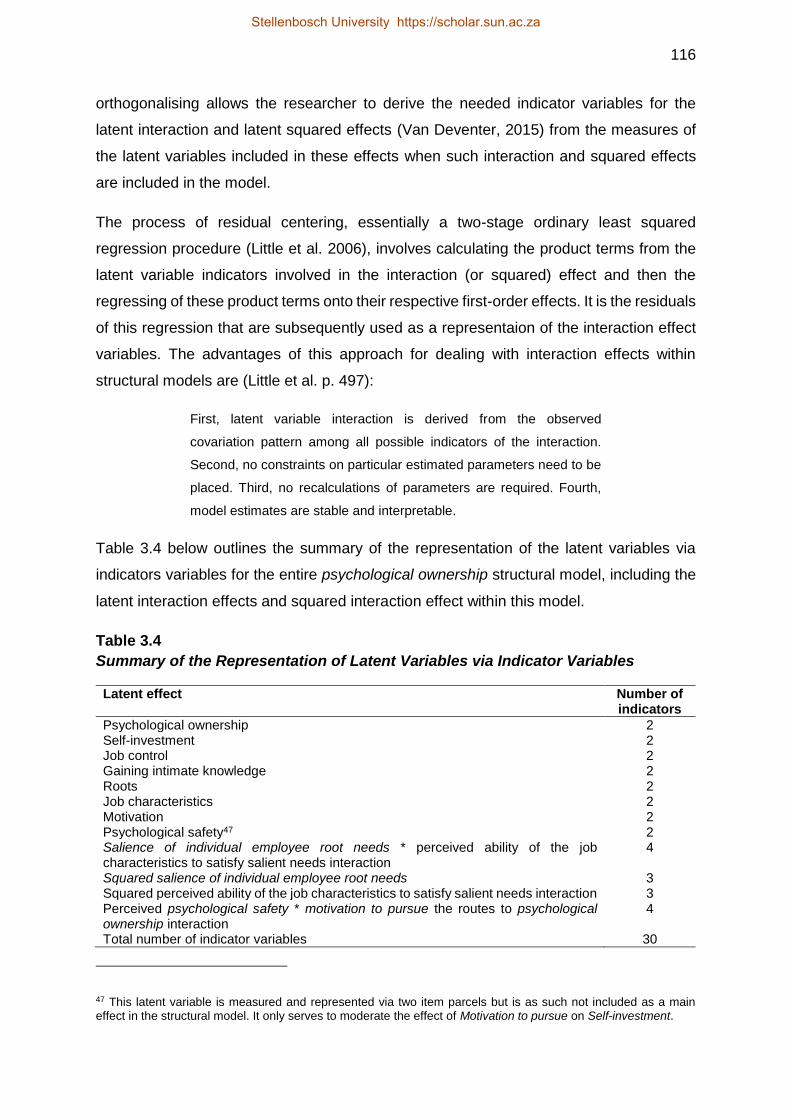
116
orthogonalising allows the researcher to derive the needed indicator variables for the
latent interaction and latent squared effects (Van Deventer, 2015) from the measures of
the latent variables included in these effects when such interaction and squared effects
are included in the model.
The process of residual centering, essentially a two-stage ordinary least squared
regression procedure (Little et al. 2006), involves calculating the product terms from the
latent variable indicators involved in the interaction (or squared) effect and then the
regressing of these product terms onto their respective first-order effects. It is the residuals
of this regression that are subsequently used as a representaion of the interaction effect
variables. The advantages of this approach for dealing with interaction effects within
structural models are (Little et al. p. 497):
First, latent variable interaction is derived from the observed
covariation pattern among all possible indicators of the interaction.
Second, no constraints on particular estimated parameters need to be
placed. Third, no recalculations of parameters are required. Fourth,
model estimates are stable and interpretable.
Table 3.4 below outlines the summary of the representation of the latent variables via
indicators variables for the entire psychological ownership structural model, including the
latent interaction effects and squared interaction effect within this model.
Table 3.4
Summary of the Representation of Latent Variables via Indicator Variables
Latent effect Number of indicators
Psychological ownership 2 Self-investment 2 Job control 2 Gaining intimate knowledge 2 Roots 2 Job characteristics 2 Motivation 2 Psychological safety47 2 Salience of individual employee root needs * perceived ability of the job characteristics to satisfy salient needs interaction
4
Squared salience of individual employee root needs 3 Squared perceived ability of the job characteristics to satisfy salient needs interaction 3 Perceived psychological safety * motivation to pursue the routes to psychological ownership interaction
4
Total number of indicator variables 30
47 This latent variable is measured and represented via two item parcels but is as such not included as a main effect in the structural model. It only serves to moderate the effect of Motivation to pursue on Self-investment.
Stellenbosch University https://scholar.sun.ac.za

117
3.7 STATISTICAL ANALYSIS
Various statistical analysis techniques are available in order to analyse data. As previously
highlighted, in the research design and methodology introductory section, the statistical or
data analysis techniques are similarly guided by the research initiating question. To
answer the question whether the hypothesised psychological mechanism described in
Figure 2.4 provides a valid explanation for the variance in levels of psychological
ownership across different employees and different organisations, a combination of
analysis techniques were applicable. These included, but at this stage were not limited to
item analysis, to identify any poor items within the scales used to operationalise the latent
variables comprising the model, and dimensionality analysis, using exploratory factor
analysis to assess the unidimensionality assumptions underpinning the scales or
subscales used to operationalise the latent variables comprising the model. Structural
equation modelling, with response surface analysis, was appropriate in order to assess
measurement and structural model fit and polynomial regression with response surface
analysis to describe how the levels of congruence and the nature of congruence between
an individuals need for self-expression, belonging and self-efficacy and the job’s (in terms
of the job characteristics) ability to satisfy these needs affect the motivation to pursue the
routes to psychological ownership.
Missing values
Before moving on to the statistical analysis it is important to deal with a problem that often
plagues research – the problem of missing data or values. The seriousness of this
challenge depends upon the pattern and quantity of the missing data, and the reason
behind the missing data (Tabachnick & Fidell, 2014). Missing values in and of themselves,
as well as the patterns which they form, can communicate a message to the researcher.
As such, missing data can be classified as either missing completely at random (MCAR),
missing at random (MAR) or missing not at random (MNAR; Allison, 2001; Osborne, 2013;
Schafer & Graham, 2002; Tabachnick & Fidell, 2014). An important first step in dealing
with missing data is to determine the “mechanism of missingness” (Osborne, 2013, p. 109)
or the characteristics of the missing data pointing to the hypothesised reasons for the
missing data. If missing data is random (MAR or MCAR) it is ignorable (it has power
implications in terms of sample size but will not bias results). However, missing data
classified as MNAR can have a biasing influence on results and is therefore not ignorable.
Stellenbosch University https://scholar.sun.ac.za

118
There are, as yet, no specific guidelines for the tolerance levels of missing data per given
sample size (Tabachnick & Fidell, 2014). It is however vital to deal with missing data
before the above mentioned statistical analysis can be undertaken. Technology and
statistical packages, although opening up a world of opportunities to the social sciences,
occasionally perpetuates the problem of missing values. Statistical packages generally
presume complete data in their analysis. The general way in which these packages deal
with missing variables is to exclude any cases where data is missing (Allison, 2001). This
has sample size and inferences implications. There are several methods or techniques by
which missing data can be treated (Osborne, 2013). These techniques or methods can be
categorised as deletion techniques, namely, pairwise or listwise deletion, single imputation
methods such as mean/mode substitution and model-based methods such as maximum
likelihood and multiple imputation (Allison, 2001; Du Toit & Du Toit, 2001). These will
briefly be discussed before highlighting and justifying the chosen method.
Deletion methods, as mentioned, are frequently the default method used by modern
statistical packages. It is therefore important to be mindful of this when progressing
through a statistical analysis. Listwise deletion, sometimes referred to as complete case
analysis, refers to the analysis of cases with available data on each variable. This would
therefore involve the systematic exclusion of cases (or respondents) that do not fulfil the
criteria of full data sets. In other words, if a survey is incomplete that specific participant’s
survey or results are excluded from the statistical analysis in their entirety. This method is
attractive due to its simplicity and comparability across analyses. It can however lead to
the exclusion of a large portion of the sample and subsequently significantly reduce the
study’s statistical power. Pairwise deletion, sometimes referred to as available case
analysis, is a special type of listwise deletion method. Here, only cases relating to each
pair of variables with missing data involved in an analysis are deleted. This allows for the
inclusion of as many cases as possible, however comparison is complicated as the sample
could be different each time.
Mean or mode substitution, as a single imputation method, involves using the average of
the observed values as a replacement for each missing value. Available data is used to
determine the means and then replace missing values prior to further analysis
(Tabachnick & Fidell, 2014). This method unfortunately distorts correlations and reduces
variability. Although mean substitution does not change the mean for the distribution as
a whole, the variance of the variable is compromised. Furthermore, correlation of the
Stellenbosch University https://scholar.sun.ac.za
119
variable towards other variables is subsequently reduced as relationships between
variables are ignored.
Model-based methods, such as maximum-likelihood estimation and multiple imputation
have become more popular of late. Using an expectation maximisation algorithm,
maximum likelihood estimation “treats the missing data as random variables to be
removed from (i.e., integrated out of) the likelihood function as if they were never sampled”
(Schafer & Graham, 2002, p. 148). Multiple imputation involves replacing each missing
value with m>1 simulated values prior to analysis (Schafer & Graham, 2002; Tabachnick
& Fidell, 2014). This is a complex process involving several steps to estimate missing data
but has the advantage of maintaining sampling variability. Although model-based methods
can at times demand a substantial investment of time they have computational practicality
in that both maximum likelihood and multiple imputation “have statistical properties that
are about as good as we can reasonably hope to achieve” (Allison, 2001, p. 4). According
to Theron (2014a) imputation by matching normally appears to be the most conservative,
safe procedure for the treatment of missing values.
Schafer and Graham (2002) state that deciding on a method for the treatment of missing
values cannot be considered in isolation, but must be evaluated in terms of the modelling,
estimation or testing procedure in which it is embedded. Allison (2001) on the other hand
argues that the only really good way of dealing with missing data is to not have any.
Therefore, for the purposes of this study an online assessment was used which only
allowed a respondent to continue once the preceding questions have been answered.
This to some degree negated the need for the treatment of missing values. Participants
were free to close the browser to leave the questionnaire at any time should they not wish
to continue. The ideal would have been to make provision for the response option “unable
to respond”. In fact, the question should be asked whether scales administered
electronically should not routinely include this response option so as to prevent forced,
artificial responses in circumstances where respondents are really unable to respond
meaningfully.
Item analysis and evaluation
The purpose of a measuring instrument is to inform the research of a respondents
standing on the specific latent variable of interest. Items comprising the measurement tool
should therefore function as stimuli to which respondents respond with behaviour that is
by and large an expression of a specific underlying latent variable (Theron, 2014a). The
Stellenbosch University https://scholar.sun.ac.za

120
operationalisation of the latent variables via items of the scale, discussed under Section
3.6, therefore must be evaluated to determine whether the items comprising the
measurement instrument do in fact properly represent the latent variable, as defined by
the constitutive definition. Therefore, the psychometric integrity of the scale must be
evaluated to determine if the items within the measurement tool are indeed working
correctly.
What is meant by working correctly? According to Theron (2014a, p. 111) this refers to
the extent to which these “premeditated operational designs succeed in providing a
comprehensive and uncontaminated empirical grasp on the constructs they intend to
reflect”. This implies that the items within the scale do in fact capture and measure (an
individuals’ standing on) the latent variables they are suggested to represent, as provided
in the constitutive definitions in Chapter 2. To be working correctly an item must possess
a high correlation with the true score of the latent variable (DeVellis, 2012), assessed
through inferences derived from the correlations among items (as we cannot assess true
scores themselves).
By examining the extent to which scale items reflect the latent variables they were tasked
to reflect it is possible to identify and treat or eliminate poor items. Poor items are items
that are insensitive or are not aligned to the observed results of the majority of the scale
items (Theron, 2014a). Additionally, poor items, by their very nature, will not reflect the
same underlying factor and will not share a reasonable proportion of variance, (Theron,
2014a) with the other items comprising the scale.
A variety of classical measurement theory item statistics were calculated to provide the
basket of evidence needed to determine if the items comprising each subscale sufficiently
sensitively describe the underlying latent variables, defined in Chapter 2. Additionally, this
analysis determined if the items elicited consistent responses and identified differences
across people with differing levels of the identified attributes that underpin levels of
psychological ownership. These item statistics include the item-total correlations, the
squared multiple correlation, the change in subscale reliability and subscale variance
when the item is deleted, the inter-item correlations and the item mean and standard
deviation. No single statistic was allowed to influence the decision surrounding inclusion
or exclusion of an item; rather an integration of the statistical evidence informed the
treatment of poor items.
Stellenbosch University https://scholar.sun.ac.za

121
Dimensionality analysis using exploratory factor analysis
The variables contained in the current study are latent variables, which cannot be
measured directly. Therefore, in order to enable measurement a researcher uses research
participants’ observable behavioural responses to multiple measurable variables (items
within a measurement tool/scale or subscales) to determine an individual’s levels or
standing on latent variables. This was presented under Section 3.6 where the latent
variables were operationalised using multi-indicator measures of each construct.
Reliability and validity evidence has been presented for the chosen measures, where
available. However, a further consideration is that of dimensionality. An assumption of
classical measurement theory is that these items, within a scale or subscales, as is the
case here, which represent the latent variables under study, are unidimensional. This
means that the subscales would tap only a single underlying construct or latent variable.
Therefore, it is important to ask: Do the items comprising each subscale designed to reflect
a unidimensional latent variable all reflect a single underlying (indivisible) latent variable,
and do they all provide relatively uncontaminated measures of this single underlying latent
variable?
A statistical technique, called exploratory factor analysis (EFA), is generally used to
evaluate whether the unidimensionality assumption associated with the subscales within
a scale is in fact satisfied48. This analysis determines how many latent variables underlie
a subscale to thereby allow the researcher to decide whether the items comprising each
subscale do in fact reflect the single latent variable they are presumed to reflect (DeVellis,
2012). According to Hair et al. (2010) factor analysis plays a vital role in making an
empirical assessment of the dimensionality of a set of items by determining the number of
factors and the loading of each variable on the factors. In other words, factor analysis
enables a researcher to identify whether each subscale consists of items loading highly
on a single latent variable (or factor) and therefore is an indication of the success with
which the indicator variables represent the latent variables within the psychological
ownership structural model (DeVellis, 2012; Hair et al. 2010; Tabachnick & Fidell, 2014).
48 The current study concedes that a hypothesis-testing, confirmatory factor-analytic approach in which single-factor measurement models are fitted would have aligned better with the objective of the unidimensionality analysis than the exploratory factor-analytic approach that had been used. The decision to use EFA, on all of the subscales that purported to measure a unidimensional latent variable, rather than CFA was based on the practical challenges that the relative large number of CFA analyses would present.
Stellenbosch University https://scholar.sun.ac.za

122
EFA therefore makes it possible to identify and bring inter-correlated variables together
under more general, underlying variables. Hair et al. (2010) state that common factor
analysis is an appropriate factor analytical technique to use when the primary objective is
to identify latent variable representation. Advantages of this approach include more
restrictive assumptions and the use of only shared variance. Principal axis factor analysis
(with oblique rotation) was used as an extraction method. Here the objective was to
remove items with inadequate factor loadings (and rerun the item analysis) and/or split
heterogeneous sub-scales into two or more homogenous subsets of items where
necessary (Theron, 2015).
Structural equation modelling and response surface methodology
Structural equation modelling (SEM), as a combination of several statistical techniques,
allows researchers to examine sets of relationships between several latent independent
variables and several inter-related latent dependent variables (Hair et al. 2010;
Tabachnick & Fidell, 2014). According to Hair et al. (2010) the distinguishing
characteristics of SEM are that it allows for the estimation of multiple and interrelated
dependence relationships, it enables the representation of unobserved concepts in these
relationships (and accounts for measurement error within the estimation process) and
allows for the defining of a model to explain the entire set of relationships. SEM is the only
analysis technique which allows for the complete and simultaneous testing of all
relationships within a model (Tabachnick & Fidell, 2014). This is an important advantage
of SEM, specifically as phenomena of interest within Industrial Psychology research are
complex and multifaceted and isolating a relationship49 could dilute the interpretation and
meaning of the complexity captured within a model. Hence the researcher’s decision to
include the five polynomial terms (the two main effects, namely the psychological
ownership salient needs and the ability of the job characteristics to satisfy these needs,
the product terms and the two squared terms) as latent variables within the full structural
model rather than isolating the congruence relationship and then performing observed
score polynomial regression with response surface methodology. Essentially, the same
polynomial regression process has been undertaken but instead of isolating the analysis
of congruence we have included the polynomial terms into the existing model.
49 It is however acknowledged by the researcher that this ‘isolation’ is sometimes necessary and also sometimes the topic under study – this would depend upon the research initiating question.
Stellenbosch University https://scholar.sun.ac.za

123
The family of statistical analysis techniques which comprise SEM, and have been
undertaken in this study, will now be discussed.
3.7.4.1 Variable type
The use of continuous variables, measured on an interval level, as opposed to discrete
variables, will be used for the purposes of this research study. This is due to the fact that
composite indicator variables were used to represent the latent variables within the
proposed psychological ownership structural model (Burger, 2012). The use of continuous
variables implies a possible infinite number of values attached to each of the composite
indicators. Millsap and Maydeu-Olivares (2009, p. 78) suggest that “when all variables are
continuous, it is typical to assume a multivariate-normal model”. This assumption must
however first be tested. The proceeding section will therefore discuss multivariate normal
distribution as a critical assumption when using SEM.
3.7.4.2 Multivariate normality
Multivariate statistics in general, and SEM50 specifically, hinge on certain critical statistical
assumptions. One such assumption is that the (continuous) indicator variables used to
operationalise the latent variables follow a multivariate normal distribution. Prior to
proceeding with further analyses, it was crucial to assess the extent to which the data
complied with these statistical assumptions. It was vital to not only examine univariate
values of skewness and kurtosis but also to assess multivariate normality (before and after
normalisation). The test for univariate normality evaluated each indicator individually with
regards to the standardised coefficients of skewness and kurtosis, and whether these
were significantly different from zero. Departures from normality were indicated by
significant skewness and/or kurtosis values. Should the analysis continue with non-normal
data, and the default parameter estimation technique (maximum likelihood estimation),
this could lead to incorrect chi-square estimates and incorrect standard errors. The
univariate and multivariate normality of the composite indicator variables were therefore
assessed using PRELIS (Jöreskog & Sörbom, 1996; Theron, 2014a). Decisions
surrounding the most appropriate estimation technique to use were made subsequent to
testing normality. Possible approaches that were considered included weighted least
50 Multivariate normality is assumed due to the use of maximum likelihood as the default method of estimation when fitting both measurement and structural models to continuous data.
Stellenbosch University https://scholar.sun.ac.za

124
squares (WLS), diagonally weighted least squares (DWLS) and robust maximum
likelihood (RML) should the data be found to be non-normal data.
3.7.4.3 Confirmatory factor analysis
Confirmatory factor analysis (CFA) was used to test the overarching substantive
measurement hypothesis that the composite indicator variables earmarked to represent
specific latent variables (but not any other latent variables) provide valid and reliable
measures of the designated latent variables. According to Hair et al. (2010, p. 693) the
measurement model “specifies a series of relationships that suggest how measured
variables represent a latent construct that is not measured directly.” In order to fully specify
and test the psychological ownership structural model it is imperative that it be determined
whether or not the conceptual constructs within the measurement model have been
operationalised successfully and are therefore validly represented by the indicator
variables.
In other words, CFA examines whether the psychological ownership structural model is
validly operationalised by the measurement model (Diamantopoulos & Siguaw, 2009) by
assessing measurement model fit and the statistical significance and magnitude of the
(completely standardised) measurement model parameter estimates. Successful
operationalisation can therefore be concluded if the measurement model fits closely, all of
the estimated factor loadings are statistically significant (p<.05), the completely
standardised factor loadings are large and the measurement error variances are
statistically significant (p<.05) but small (Burger, 2012). Kline (1998) states that when
using SEM it is imperative that researchers first test the measurement model, underlying
the full structural equation model. If model fit is found to be acceptable only then can an
SEM researcher proceed to the next step, namely testing the structural model. The
measurement model was fitted by testing the exact and close fit null hypotheses indicated
below.
H039a: RMSEA=0
Ha39a: RMSEA>0
Ho39b: RMSEA<.05
Ha39b: RMSEA>.05
If the exact or close fit would be found (i.e. H019a or H019b would not be rejected), or
alternatively if the measurement model would at least demonstrate reasonable model fit
Stellenbosch University https://scholar.sun.ac.za
125
(as indicated by the basket of fit indices produced by LISREL), the following 28 null
hypotheses on the slope of the regression of item parcel j on latent variable k will be tested:
H0i: jk=0; i=40, 41, …, 67; j=1, 2, …, 28; k=1, 2, …, 11
Hai: jk=0; i=40, 41, …. 67; j=1, 2, …, 28; k=1, 2, …, 11
If the exact or close fit would be found (i.e. H039a or H039b would not be rejected), or
alternatively if the measurement model would at least demonstrate reasonable model fit,
the following 4251 null hypotheses would be tested with regards to the freed elements in
the variance-co-variance matrix . It must be noted here that the measurement model
was fitted with specific measurement error terms that were allowed to be correlated. The
measurement error terms associated with each corresponding indicator variable of the
latent interaction and the latent squared effects that contain the same first-order indicator
were allowed to correlate (Theron, 2014b).
H0i: ij =0; i =68, 69, ..., 1109i=1, 2, …, 28; j=1, 2..... 28
Hai: ij > 0; i =68, 69, ..., 109; i=1, 2, …, 28; j=1, 2..... 28
If the exact or close fit would be found (i.e. H039a or H039 would not be rejected), or
alternatively if the measurement model would at least demonstrate reasonable model fit,
the following 49 null hypotheses would be tested with regards to the freed elements in the
variance-co-variance matrix . The psychological ownership measurement model allowed
the exogenous latent variables to be correlated but for the correlation between 1 and the
squared and product latent variables in which it was involved and the correlation between
2 and the squared and product latent variables in which it was involved, Phi was therefore
defined as a full 11 x 11 matrix in which all off-diagonal elements were estimated but for
32, 41, 51, 52, 53 and 54 which were fixed to zero, in acknowledgement of the
orthogonalising procedure used to operationalise the latent squared and product terms.
The main diagonal of was fixed to unity
H0i: jk =0; i =110, 113 .....158; j=1, 2.....11; k=1, 2.....11; jk
Hai: jk > 0; i =110, 113 .....158; j=1, 2.....11; k=1, 2.....11; jk
51 The 28 variances in the main diagonal of were estimates as well as 14 covariances between measurement error terms of the latent squared and latent product terms.
Stellenbosch University https://scholar.sun.ac.za

126
3.7.4.4 Interpreting the measurement model fit and parameter estimates
The measurement model acts as a representation of the structural linkages that were
hypothesised to exist between the indicator variables and the latent variables, captured
within the psychological ownership structural model. In terms of measurement model fit
the focus is on the relationships between the latent variables and their indicators, or
manifest variables, with the aim of determining the validity and reliability of the measures
used to represent the construct of interest. Measurement model fit refers to whether the
model successfully reproduces the observed covariance matrix.
The model is considered to fit well if the reproduced covariance matrix approximates the
observed covariance matrix (Theron, 2014a). If there is doubt about the quality of the
measurement model (therefore the models ability to produce an estimated covariance
matrix that approximates the observed covariance matrix is questionable, or the
parameter estimates are statistically insignificant or have inappropriate magnitudes) any
assessment of the substantive relations of interest (Diamantopoulos & Siguaw, 2009) will
be problematic. It is therefore imperative to assess the fit of the measurement model and
the statistical significance and magnitude of the parameter estimates (assuming that at
least close fit has been attained) before a detailed evaluation of the structural model is
undertaken. A broad spectrum of goodness of fit statistics were used to assess the fit of
the measurement model. Goodness of fit statistics refer to the degree to which the
variance and covariance values in the observed variance and covariance matrix, predicted
by the model, agree with the empirically observed variances and covariances. The verdict
on measurement model fit is more credible if it is derived from a combination of a variety
of fit indices. Additionally, the quality of the model fit will be assessed using the magnitude
and distribution of the standardised residuals and the magnitude of model modification
indices calculated for ΛX and Θδ.
After these analyses, it was concluded whether the designed instrument displays the
degree of validity desired and if the model fits.
3.7.4.5 Fitting the psychological ownership structural model
Fitting of the structural model, as mentioned above, is only possible if the measurement
model fits closely or reasonably well and the quality of the model is found to be satisfactory
(the magnitude of the completely standardised factor loading estimates are therefore
Stellenbosch University https://scholar.sun.ac.za

127
equal to, or greater than .71, Hair et al. 2010). Subsequent to this finding, the fitting of the
structural model was undertaken.
According to MacCallum and Austin (2000) every structural model is incorrect to a certain
degree. “The best one can hope for is to identify a parsimonious, substantively meaningful
model that fits observed data adequately well,” (MacCallum & Austin, 2000, p. 218). They
additionally proceed to state that researchers may find models that fit similarly well. This
therefore implies that a good fitting model only offers one possible plausible answer to the
research initiating question but it cannot be concluded that the model, and therefore the
hypotheses, are correct or true. The fact that a hypothesised model fitted adequately and
thus presents a valid (i.e. permissible) explanation for the observed covariance matrix
does not mean that there are no other models that fit equally well or even better. This must
be kept in mind when drawing conclusions surrounding model fit.
With this in mind, fitting of the proposed psychological ownership structural model entails
assessing the validity of the overarching statistical hypothesis, and subsequent path-
specific hypotheses by examining how the estimated covariance matrix corresponds to
the observed sample covariance matrix (Hair et al. 2010). It is good practice to also assess
the structural model fit using a variety of goodness-of-fit statistics (Diamantopoulos &
Siguaw, 2009). According to MacCallum and Austin (2000) this is due to the fact that the
numerous fit measures or indices available to assess model fit capture different elements
of the fit of a model. The quality of the model fit is in addition assessed by also examining
the magnitude and distribution of the standardised variance-covariance residuals and
model modification indices (for covariances among the endogenous disturbances [Ψ], for
the entire set of causal relationships between two endogenous constructs [Β] and for the
entire set of relationships between the exogenous and endogenous constructs with the
model [Γ]). The aim of this process is to determine whether the theoretical relationships
specified in the research are supported by the data.
3.7.4.6 Interpreting the psychological ownership structural model and
parameter estimates
In terms of assessing the statistical significance of the parameter estimates, and the
decision whether to reject the path-specific null hypotheses, it is crucial to assess whether
the signs of the parameters representing the paths between the latent variables are in
agreement with the nature of the causal effects hypothesised to exist between the latent
variables (positive or negative) under Ha. Additionally, it is important to assess whether
Stellenbosch University https://scholar.sun.ac.za

128
the parameter estimates are statistically significant (p<.05). When parameter estimates
have been found to be statistically significant, it is vital to evaluate the magnitude of the
parameter estimates showing the strength of the hypothesised relationships. This was
subsequently done within the current research study
Furthermore, it was important to assess the squared multiple correlation (R2) for each of
the endogenous latent variables in the model, which provided an indication of the amount
of variance in each endogenous latent variable that was accounted for by the latent
variables that are structurally linked to it in the model. The higher the squared multiple
correlation, the greater the joint explanatory power of the hypothesised antecedents,
therefore larger R2 values were considered desirable.
Since the psychological ownership structural model includes two latent interaction effects
and two squared interaction effects additional response surface analysis was undertaken
(see paragraph 3.7.4.7) to test these moderating variables.
3.7.4.7 Calculating the response surface test values, drawing and
interpreting the response surface graph
In order to determine the influence of congruence and incongruence between the salient
needs of an employee and the perceived ability of the job characteristics to satisfy the
salient needs of the employee on the outcome or endogenous variable (motivation to
pursue the routes), the response surface had to be estimated, drawn and examined. To
examine the response surface, the response surface test values (a1 – a4) had to be
calculated. The bi coefficients were extracted from the structural model output file in order
to calculate the four response surface test values. This was done by transferring the partial
regression coefficients (bi), the standard errors, the sample size and the covariances
between the partial regression coefficients52 from the structural model output file53 into the
Cunningham Excel Macro (if R2 is found to be significant)54. In order to investigate and
analyse the relationship a three-dimensional response surface graph is then plotted,
defined by Y, X1, X2, and interpolation, via the Cunningham Excel macro (Theron, 2014b).
52 The LISREL output can provide estimates of the covariance between the partial regression coefficients via the EC=filename.TXT command on the LISREL OUTPUT line. 53 A special LISREL syntax file hade to be compiled to read the covariance estimates for the partial regression coefficients from the text file that was created via the EC command. 54 The constant/intercept will be zero due to the fact that the latent intercepts have not been estimated
Stellenbosch University https://scholar.sun.ac.za

129
The effect of the degree and the nature of the congruence on the
response variable is then described by the nature of the response
surface in a three-dimensional space as one alters the X1; X2
coordinates/moves around on the floor of the three-dimensional
space/along the lines of congruence and incongruence specifically
(C.C. Theron, personal communication, January 26, 2016).
Once created, there were four characteristics of the response surface that were of
particular importance namely, the slope (positive or negative) = a1 [b1 + b2], and curvature
(either concave or convex) = a2 [b3 + b4 + b5], of the line of congruence as well as the
slope (positive or negative) = a3 [b1 – b2] and curvature (either concave or convex) = a4
[b3 – b4 + b5] along the line of incongruence (Shanock, Baran, Gentry, Pattison, &
Heggestad, 2010; Theron, 2014b). These characteristics allowed for the examination of
how the outcome variable will respond as the two exogenous variables (the salient needs
of an employee and the perceived ability of the job characteristics to satisfy the salient
needs) move along both the line of congruence and incongruence. This therefore allowed
for an explanation of how motivation to pursue the routes to psychological ownership will
respond as employee salient root needs and perceived ability of the job characteristics to
meet these salient root needs move along the line of incongruence, as well as the line of
congruence. Several important factors were interpreted when analysing the response
surface plot. This included:
- How agreement relates to the outcome, namely how congruence between the
employees’ salient root needs and the perceived ability of the job
characteristics to satisfy salient needs influences motivation to pursue the
routes to psychological ownership.
- How the degree of discrepancy relates to the outcome, namely what occurs to
motivation to pursue the routes to psychological ownership if the employee
displays salient root needs and the job characteristics are not perceived to
satisfy these salient needs
- How the direction of discrepancy relates to the outcome, namely how the
direction of the discrepancy between employee salient root needs and
perceived ability of the job characteristics to satisfy these salient root needs
affect motivation to pursue the routes to psychological ownership.
These aspects were examined by formally testing H07a, H07b, H08a and H080b.
Stellenbosch University https://scholar.sun.ac.za
130
CHAPTER 4
ETHICAL CONSIDERATIONS AND RISK EVALUATION
4.1 INTRODUCTION
Scientific considerations, and upholding the epistemic imperative, outlined in Chapter 3,
are not the only important considerations when conducting research, and specifically
research involving individuals. Ethical issues arise from a researcher’s interaction with
participants in the research process (Babbie & Mouton, 2014) and therefore due thought
had to be given, prior to conducting research, to any potential ethical pitfalls that could
arise. These included, but were not limited to, aspects such as informed consent,
anonymity, confidentiality, voluntary participation, accountability, harm, responsiveness
and responsibility, plagiarism and ethical reporting. Sound ethical practises in research,
specifically within the social sciences, are important. These principles protect the research
participants, lay the foundation for better quality research and ensure compliance with
relevant legislation. They additionally ensure the preservation of honour within and of the
industry. These potential ethical issues, and the benefits of ethically conducted research,
highlight the importance of reflecting upon the potential ethical risk factors that could be
associated with the specific research study, throughout the process. Additionally, this
ensures that the research adheres to rigorous ethical and moral requirements.
By swopping seats and putting yourself in the shoes of the research participant and
reflecting on potential ethical pitfalls, a researcher, armed with ethical guidelines, can
uphold ethical standards and ensure an ethical sound research process (Kerlinger & Lee,
2000). The aim of upholding ethical standards while conducting research is to protect
participants. It is vital that all aspects of the research process protect the participant’s
rights, interests, dignity, privacy, safety and wellbeing. The purpose of this chapter is
therefore to outline and investigate any ethical risk factors that might have given cause for
concern throughout the current research study. Moreover, this chapter outlines ethical
standards, defined in various codes of conduct, to ensure adherence throughout the
research process.
4.2 GUIDING PRINCIPLES AND LEGISLATIVE COMPLIANCE
To date there seems to be no specific legislation pertaining directly to research involving
human participants within the South African governmental framework (Horn, Graham,
Prozesky, & Theron, 2015). There are however several pieces/sections, within different
legislative documents, pertaining to ethical research, which vary depending on the nature
Stellenbosch University https://scholar.sun.ac.za

131
of the research. Of particular interest to this research study is the National Health Act,
2003 (Act no 61 of 2003) and regulations relating to research involving human participants.
This legislation (Department of Health, 2013) outlines certain obligations of researchers
conducting research involving people namely, that ethical approval must be obtained, any
funding, and the source there of, must be declared, the safety of participants must be
monitored and any risk of harm minimised and that research results be timeously
disseminated to all relevant parties or stakeholders.
An important mandatory aspect, outlined in this legislation, is informed consent. The
following rights of participants involved in social science research55 are outlined in section
six (Department of Health, 2013, p. 9):
6. Persons with whom research is to be conducted, or their legally
authorised representative, have the right to be informed of:
(a) The purpose of the research;
(c) Methods and procedures to be followed or used during research;
(d) Alternatives apart from participating in the research;
(e) Potential harms and risks involved in participation;
(f) Expected benefits to the participant and other persons in the research;
(g) Extent to which confidentiality and privacy will be maintained;
(i) Details of the contact person in the event of a query or research related
injury;
(j) Reimbursement and/or incentives given for participation;
(m) Their freedom to decline or withdraw from the research without prejudice;
and
(n) Proof of ethics committee approval or MCC approval, where relevant.
The importance of informed consent is also stressed in the Ethical Rules of Conduct for
Practitioners Registered under the Health Professions Act (Act no. 56 of 1974) which,
under Annexure 12, states that:
89.
(1) A psychologist shall use language that is reasonably understandable to the
research participant concerned in obtaining his or her informed consent.
55 Only relevant rights have been outlined here. Additional rights, such as those rights attached to individuals involved in a study that involves treatment, have not been included as they are not applicable here. However, the researcher acknowledges that she is aware of the rights attached to different research studies, depending upon the purpose of the research.
Stellenbosch University https://scholar.sun.ac.za

132
(2) Informed consent referred to in subrule (1) shall be appropriately
documented, and in obtaining such consent the psychologist shall –
(a) Inform the participant of the nature of the research;
(b) Inform the participant that he or she is free to participate or decline to
participate in or to withdraw from the research;
(c) Explain the foreseeable consequences of declining or withdrawing;
(d) Inform the participant of significant factors that may be expected to
influence his or her willingness to participate (such as risks, discomfort,
adverse effects or exceptions to the requirement of confidentiality);
(e) Explain any other matters about which the participant enquires;
(f) When conducting research with a research participant such as a student
or subordinate, take special care to protect such participant from the adverse
consequences of declining or withdrawing from participation;
(g) When research participation is a course requirement or opportunity for
extra credit, give a participant the choice of equitable alternative activities;
and;
(h) In the case of a person who is legally incapable of giving informed consent,
nevertheless –
(i) Provide an appropriate explanation;
(ii) Obtain the participants assent; and
(iii) Obtain appropriate permission from a person legally authorized to
give such permission.
4.3 POTENTIAL ETHICAL RISK FACTORS
This section focuses on aspects such as voluntary participation, informed consent,
anonymity and confidentiality, harm and deceitfulness as areas that could potentially be
cause for concern. Additionally, a risk-benefit analysis was conducted to ascertain the
level of risk associated with participation in the study.
The research process and the products of research are identified as two broad areas that
could be cause for concern surrounding research ethics (Shrader-Frechette, 1994). The
process, according to Shrader-Frechette (1994), is harmful if participants are not provided
relevant information to allow them to provide truly informed consent, and additionally if the
participants are deceived in any way56 throughout the entire research process, from
sample selection to results. If the end result of the research study leads to a harmful
56 It is acknowledged that deception is sometime an unavoidable methodological necessity. In such cases, however, thorough debriefing of participants after completion of the data collection is mandatory.
Stellenbosch University https://scholar.sun.ac.za

133
environment for anyone in contact with it, then proceeding with the research study, and
the product of the research is said to be problematic, and therefore unethical in nature.
It is vital that, prior to the commencement of research, all participants are aware that their
participation is on a voluntary basis, free from any form of coercion and that they are free
to withdraw at any stage throughout the research process, without penalty or negative
repercussions. Additionally, their decision to become involved in the research study
should be taken from a fully informed standpoint. This refers to informed consent. It is
important to note here that informed consent is not merely a formality, in terms of filling in
a mandatory informed consent form. But rather, it is a process that must be undertaken
by each and every researcher in a manner that authentically offers the invited participants
with sufficiently comprehensive information to allow them to make a truly informed
decision. Horn et al. (2015) outline this process, as well as important aspects of it, as
follows:
• Participants must be competent to give both their legal and mental consent.
• Participants must give their consent voluntarily, i.e. without any undue influence or
incentive.
• The researcher must fully disclose information about the research.
• Participants must sufficiently understand all the information provided in order to
make an informed decision.
According to Kerlinger and Lee (2000) it is important that, prior to engaging in research,
participants and the researcher should be in agreement as to their obligations, and rights
and responsibilities. Therefore, prior to the commencement of data collection the
researcher should endeavour to provide details surrounding the credentials of the
researchers, the purpose and objectives of the research study, who will have access to
the results of the research study, how their anonymity will be protected and what measures
will be put in place to protect confidentiality of results. Specifically, within an organisational
context, participants should be aware of aspects such as who will receive results and in
what format. This is particularly important when conducting research within organisational
contexts as participants could see a potential for a conflict of interest between the
researcher, the organisation and the employee. An employee could also fear persecution
should the study be of a sensitive nature.
Stellenbosch University https://scholar.sun.ac.za
134
These aspects were formally considered in the informed consent formulation that was
developed for the current study. A copy of the informed consent formulation used in the
current study is available in Appendix 2
Another important consideration, outlined in legislation, when conducting research within
organisational contexts is institutional approval. According to (Department of Health, 2013,
p. 93) the following rules apply:
87. A psychologist shall –
(a) Obtain written approval from the host institution or organisation concerned
prior to conducting research;
(b) Provide the host institution or organisation with accurate information about
his or her research proposal; and
(c) Conduct research in accordance with the research protocol approved by
the institution or organisation concerned.
A copy of the institutional consent form57, compiled for use should any organisations have
shown interest in involvement in the current research study, is available in Appendix 3.
Participation in any form of research can produce a certain level of stress within
participants and the researcher is obligated to protect the participant from any harm.
Therefore, the researcher should consider and attempt to remove any “undesirable
consequences of participation” (Kerlinger & Lee, 2000, p. 445).
Should a researcher wish to offer a possible incentive or reward for participation the
following stipulation in the Ethical Rules of Conduct for Practitioners Registered under the
Health Professions Act (Act no. 56 of 1974) should be adhered to:
92. In offering professional psychological services as an inducement to obtain
the participation of a person in research, a psychologist shall –
(a) Explain the nature of such services, as well as the risks, obligations and
limitations involved; and
(b) Not offer excessive or inappropriate financial or other inducements to
obtain the person’s participation, particularly when such inducement might
tend to exert undue influence on that person to participate.
57 This consent form was compiled when the initial intention was to gain access to a sample population through a
large South African organisation. Several failed attempts, to partner with at least three South African organisations, resulted in the use of online media in survey distribution.
Stellenbosch University https://scholar.sun.ac.za

135
For the purposes of this research study interested participants were entered into a lucky
draw for a chance to win a mobile tablet device. It is acknowledged here that this is not an
offering of psychological services in lieu of participation but rather a reward, incentive or
inducement. It is furthermore argued here that the cost of this device was not excessive
and should not be seen to constitute a bribe for participation but rather as a benefit to the
participants.
Protection extends to the area of confidentiality. All attempts must be made to safeguard
the personal information of all participants as well as the host institution, if so requested.
Here it is vital that the information collected not be disclosed to outside parties in any way
that could leave the participants vulnerable to detection i.e. participants should not be
identifiable from any data collected. Steps that were taken, throughout this research study,
to uphold the above-mentioned principles of ethical research are outlined below and in
Table 4.1.
In a bid to uphold the fundamental principles of equity, participation, transparency, service,
tolerance and mutual respect, dedication, scholarship, responsibility and academic
freedom (Stellenbosch University, Division for Research Development, 2013, pp. 3-4) and
for the promotion of responsible conduct the researcher strove to maintain the four core
principles outlined in section six: of Stellenbosch University’s policy for responsible
research conduct at Stellenbosch University:
6.2 Justice
The principle of justice ensures the fair distribution of both the burdens and
benefits of research and is of particular relevance when research involves
human participants.
6.3 Academic freedom and dissemination of research results
Stellenbosch University supports the principle of academic and intellectual
freedom. Researchers have an obligation to report research results
accurately and transparently in the public domain (also where appropriate to
the target group of the study) and should not allow funders or other
stakeholders to influence research publications. Any specific or explicit
decision to withhold or delay the publication of research results e.g. because
the publication of results could produce some harm or because of issues
regarding patents or intellectual property and/or certain corporate claims,
should be reviewed and accepted by the ethics review committee or research
committee that originally approved the research or InnovUS, whichever is
most appropriate. This ethics committee (in the case of sensitive or harmful
results) or InnovUS (in the case of patents or intellectual property and/or
Stellenbosch University https://scholar.sun.ac.za

136
corporate claims) must place a balance on the dissemination of results and
the placement of moratoriums on the dissemination of certain data.
6.4 Ethics approval of research
It is the responsibility of all researchers (including students) to ensure that
they obtain ethics approval for their research when required to do so by this
policy, or by generally accepted norms and standards for ethical research.
Stellenbosch University has established various research ethics committees
to review, provide ethics approval and monitor research.
Moreover, since the research study involves interaction with human participants, the
following seven additional principles, stipulated in the Stellenbosch’s Research Ethics
Policy and outlined below in Table 4.1 describing how they will be adhered to additionally
apply.
Table 4.1
Ethical Principles and How They are to be Upheld
Ethical principle Application method
Be relevant to the needs and interests of the broader community
The relevance of this study to the needs and interests of organisations and employee’s, as well as the greater society, was outlined in detail in the introductory section of Chapter 1.
Have a valid scientific methodology The methodology was identified, described and justified in Chapter 3. Validity and reliability of measures used were outlined and the choice of sampling and research design options was highlighted.
Ensure research participants are well informed about the purpose of the research and how the research results will be disseminated and have consented to participate, where applicable
Please see Appendix 2 for a detailed informed consent form that will precede the online questionnaire. This will require the participant to acknowledge understanding of their rights and responsibilities, as well as important aspects of the process (such as voluntary participation and withdrawal), and require agreement before the participant can continue with the online survey.
Ensure research participants’ rights to privacy and confidentiality are protected
Participant names will not be requested in the biographical data section. Summary information supplied for publication or to any interested relevant parties, will be aggregated and therefore individual participants will be unidentifiable.
Ensure the fair selection of research participants The selection of participants was outlined in Chapter 3.
Be preceded by a thorough risk-benefit analysis See risk-benefit analysis below in Section 4.4 Thorough care must be taken to ensure that research in communities is effectively coordinated and does not place an unwarranted burden on such communities
This research was conducted within an organisational context. However, measures were still taken to relieve the burden to filling in a time-consuming questionnaire. This was done by using an online survey with the minimum number of items that would still provide good psychometric quality.
Stellenbosch University https://scholar.sun.ac.za

137
4.4 RISK-BENEFIT ANALYSIS
The empirical execution of the behavioural research methodology outlined above required
the involvement of people. Although every possible step was taken to protect participants
involved in any form of research there still remained a possibility that participation may
“result in the dignity, rights, safety and well-being of the research participants being
compromised to some degree” (Du Toit, 2014). It was therefore vital for the researcher to
investigate whether the end justified the means. In this case, this entailed determining
whether the purpose of the research study justified the compromise. Although no formula
exists to examine the cost-benefit relationship of behavioural science research,
researchers must still be sensitive to possible consequences of participation and
safeguard against any predictable ill effects.
The critical question was therefore whether the costs that research participants had to
incur were balanced by the benefits that potentially could accrue to society (Stellenbosch
University, 2012). It seems reasonable to argue that an individual’s time and energy to fill
in a questionnaire should not induce any unnecessary harm upon the participants. Saying
this, the researcher still endeavoured to make certain that participants did not experience
any unnecessary risk. This was done through the above mentioned precautionary
measures (specifically surrounding confidentiality and anonymity aspects of the research
study). As is highlighted in Chapter 1, this research study wishes to contribute to the
wellbeing of the ‘society of working man’. It is envisaged that this research study will afford
the researcher the luxury of determining how levels of psychological ownership are
influenced and in turn leverage the benefits of feelings of ownership within the workplace,
for the benefit of both organisations and employees. It was therefore argued that this
research study possesses an element of social value due to the fact that it contributes to
the body of knowledge available in the academic, and applied fields, and it is hoped that
this contribution will aid in improving understanding surrounding the social processes
(Horn et al. 2015) underpinning working man.
Stellenbosch University https://scholar.sun.ac.za

138
CHAPTER 5
RESEARCH RESULTS
5.1 INTRODUCTION
In order to answer the research initiating question, a psychological ownership structural
model was developed. From the theorising, outlined in Chapter 2, path-specific
substantive and statistical hypotheses were developed and presented in Chapter 3.
Chapter 3 outlined the operationalisation of the latent variables comprising the
overarching substantive research hypothesis. Chapter 3 also developed statistical
hypotheses relating to the reliability and validity of the operationalisation. Moreover,
Chapter 3 outlined and justified the specific statistical analyses that were performed in
order to test the validity of the suggested hypotheses. The aim of this chapter is to present
the research results obtained subsequent to following the steps outlined in Chapter 3. This
chapter therefore outlines the treatment of missing values, the results of the item analysis,
factor analysis and the analysis of the measurement model conducted in order to
determine the psychometric quality of the indicator variables, as well as the evaluation of
the fit of the structural model and the significance of the model parameter estimates. This
chapter will conclude with a report on the findings of the analysis of the response surface
post polynomial regression analyses.
5.2 MISSING VALUES
Missing values often plague research studies. Prior to conducting statistical analysis it is
therefore important to deal with any of the missing data. Technological advances have
opened up a world of opportunities in terms of the mechanisms available to eliminate the
necessity for the treatment of missing variables. In line with Allison’s (2001) rational, with
regards to dealing with missing variables, this research study introduced ‘required fields’
to each and every item within the electronic online questionnaire. The online survey
therefore only allowed participants to continue through the survey if they had completed
all of the preceding questions58. This therefore negated the necessity for dealing with any
missing data.
58 The researcher recognises that the forced nature of questioning could also have an undesirable side-effect in that it could have resulted in artificial, fabricated responses in cases where respondents were truly unable to respond. However, it is suggested here that if a participant did not want to continue completing the question he or she could merely close the browser and not continue – this approach comes with its own pro’s and con’s which is beyond the scope of this research study, however they are acknowledged.
Stellenbosch University https://scholar.sun.ac.za

139
5.3 ITEM ANALYSIS APPROACH
In order to determine whether the indicator variables that make up the Composite Job-
based Psychological Ownership Scale (CJBPOS) do indeed capture the essence of the
latent variables that they were developed to represent, classical measurement theory item
analysis was conducted. According to Theron (2014a, p. 109) “item analysis…allows one
to identify and eliminate items not contributing to an internally consistent description of the
various latent dimensions comprising the construct in question”.
Descriptive item statistics were used to identify and eliminate any poor items. Poor items
refer to those items that are insensitive to relatively small differences on the latent variable
they were tasked to reflect and/or do not reflect the same underlying latent variable. They
will additionally not share a reasonable portion of variance when compared across the
remaining items within the scale (Theron, 2014a).
Several statistcs were used to inform conclusions on the quality of each individual item
within the CJBPOS, namely the item mean, the item standard deviation, the change in the
scale Cronbach’s alpha if the item would be deleted, the change in the scale variance if
an item would be deleted, the inter-item correlations, the item-total correlations and the
squared multiple correlations. According to Theron (2014) it is imperative that decisions
surrounding the integrity of items and scales should be based on a collection of statistics
forming a basket of evidence. These will briefly be described prior to presenting the
analysis results and interpretation.
In terms of item mean statistics and item standard deviation, Theron (2014a) states that
the absence of extreme item means and small item standard deviations provides evidence
of the absence of questionable, insensitive items. The mean refers to the typical response
of respondents. An extreme high or extreme low mean would indicate a potentially
problematic item in that the item score distribution would be truncated at the upper or
lower end and thus curtails the dispersion of the distribution. An extreme high or extreme
low item mean would therefore result in a reduced item standard deviation. A low item
standard deviation need, however, not necessarily result from extreme item means. It
could also result from the slope of the regression of the item on the latent variable being
small. Relatively small differences on the latent variable then would translate to almost no
difference on the item response. A low standard deviation is therefore problematic
because it provides evidence that an item lacks sensitivity and does not discriminate
between relatively small differences on the latent variable that it is meant to reflect.
Stellenbosch University https://scholar.sun.ac.za

140
Cronbach’s alpha is a “measure of the average strength of association between all
possible pairs of items contained within a set of items” (Zedeck, 2014, p. 71) or the
homogeneity of a scale (or subscales). A level of .8 for internal consistency, in terms of
Cronbach alpha, was considered satisfactory (Theron, 2014a) in the current study.
Cronbach alpha if deleted, refers to the increase or decrease in internal consistency of the
scale should a single item be deleted. When an increase in Cronbach alpha occurs upon
deletion of an item this suggests that the item is not aligned to the rest of the items within
the specific scale, or subscale of the CJBPOS to which it belongs, and therefore does not
reflect the same latent variable.
The pattern of inter-item correlations reflects the internal consistency of the scale or
subscale. To the degree that the items in the scale or subscale are all at least moderately
correlated it would suggest that they all, to a reasonable degree, share a common source
of variance and therefore by implication all reflect the same underlying latent variable (or
latent variables) (Theron, 2014a). It should be noted that moderate to high inter-item
correlations do not necessarily mean that the items only measure a single underlying
latent variable nor that the common source of variance is necessarily the latent variable
of interest. This same caveat applies to a high Cronbach alpha. An item that consistently
returns low inter-item correlations with the remaining items in the scale/subscale would
indicate that an item does not measure the same underlying construct as the remaining
items (or that it does but that it fails to discriminate between small differences on the focal
latent variable). There is however some debate surrounding what constitutes a low inter-
item correlation and some propose that the inter-item correlation range should depend
upon the specificity of the construct under investigation (Netemeyer, Bearden, & Sharma,
2003). For the purposes of this study an inter-item correlation of higher than .3 was
considered as acceptable.
Item-total correlations refer to the “extent to which any one item is correlated with the
remaining items in a set of items under consideration” (Netemeyer, et al. 2003, p. 144) or
the degree to which scores of a single item relate to the total score. Low item-total
correlations could indicate that that item does not in fact measure the same construct as
the remaining items (or that it does but that it fails to discriminate between small
differences on the focal latent variable). Closely aligned to this statistic is the squared
multiple correlation when regressing each item on a weighted linear composite of the
remaining items. The squared multiple correlation indicates the proportion of variance in
the item that is explained by the weighted composite. A small R² for any specific item
Stellenbosch University https://scholar.sun.ac.za

141
would therefore indicate that that item does not measure the same latent variable as the
remaining items.
The classical measurement theory item statistics are influenced by the characteristics of
the sample from which the data has been obtained. Scale length, in terms of the number
of items in the rating scale, also affects some of the item statistics like the item-total
correlation and the squared multiple correlation when regressing the item on the remaining
items and the internal consistency reliability coefficient (Netemeyer et al. 2003).
The above statistics provided the basket of evidence needed to determine if the items
comprising each subscale described behavioural denotations of the various latent
variables comprising the proposed psychological ownership structural model, if the items
of each scale or subscale elicited consistent responses and whether they succeeded in
identifying differences across people with differing levels of the identified attributes. No
single item statistic alone influenced the decision to delete or retain any individual item.
Item statistics were rather combined to form a basket of statistical evidence that informed
this decision. These statistical procedures were conducted using the reliability procedure
of SPSS version 23 (http://www.ibm.com/za/en/).
To ensure consistency in the manner in which correlation coefficients were interpreted the
convention proposed by Guilford (Tredoux & Durrheim, 2002, p. 184) was adopted. This
convention is described in Table 5.1 below.
Table 5.1
Guidelines for the Interpretation of Correlation Coefficients
Absolute value of r
Interpretation
< .19 Slight; almost no relationship
.20 – .39 Low correlation; definite but small relationship
.40 – .69 Moderate correlation; substantial relationship
.70 – .89 High correlation; strong relationship
.90 – 1.00 Very high correlation; very dependable relationship
5.4 ITEM ANALYSIS RESULTS
Stellenbosch University https://scholar.sun.ac.za

142
The above mentioned statistical analyses were performed for each of the scales and
subscales in the CJBPOS. Table 5.2 below outlines the results of these statistical
evaluations before the deletion of any items within the scale or subscale.
Table 5.2
Summary of Reliability Results for the Composite Job-based Psychological
Ownership Survey Scales
Scale Sample size
Number of items
Mean Variance Standard deviation
Cronbach’s alpha
JC_A 329 3 16.69 13.088 3.618 .854 JC_TI 329 3 16.34 13.702 3.702 .775 JC_SV 329 3 16.77 11.869 3.445 .770 JC_TS 329 3 17.10 11.611 3.408 .781 JC_FB 329 3 15.79 13.306 3.648 .814 IK 329 4 24.72 9.207 3.034 .868 SI 329 4 23.94 16.000 4.000 .867 C 329 6 30.47 52.226 7.227 .909 PS 329 5 18.33 17.809 4.220 .888 PO 329 6 35.11 55.496 7.450 .942 PO Need_SI 329 4 22.19 19.314 4.395 .835 PO Need_SOB 329 4 23.15 15.627 3.953 .813 PO Need_SE 329 4 24.55 9.657 3.108 .828 MOT_EXP 329 9 51.37 72.947 8.541 .900 MOT_VAL 329 9 53.29 53.665 7.326 .871
JC=Job Characteristics, JC_A=Autonomy, JC_TI=Task Identity, JC_SV=Skills Variety, JC_TS=Task Significance, JC_FB=Feedback, IK=Intimate Knowledge, SI=Self Investment, C=Control, PS=Psychological Safety, PO=Psychological Ownership, PO_Needs=Psychological Ownership Individual Needs, PO_Need_SI=Self Identity, PO_Need_SOB=Sense of Belonging, PO_Need_SE=Self efficacy/effectance, MOT_EXP=Motivation Expectancy, MOT_VAL=Motivation Valency
The results for each individual subscale are presented in the sections that follow.
Job characteristics
The 15-item job characteristics scale is divided into five subscales, each containing three
items, measuring autonomy, task identity, skill variety, task significance and feedback
respectively.
One could expect that there would be some degree of correlation between these
subscales, however the intention is that they measure qualitatively distinct latent variables.
Therefore, an individual can be expected to score high on autonomy, for example, and
lower on task significance. It was therefore decided to evaluate each of these subscales
individually in terms of their psychometric quality.
5.4.1.1 Autonomy
The autonomy subscale is made up of three items. These items were analysed, as
discussed above, and the results are displayed in Table 5.3 and Table 5.4 respectively.
Stellenbosch University https://scholar.sun.ac.za

143
Table 5.3
Item Analysis Results for the Autonomy Subscale
Cronbach's Alpha Cronbach's Alpha Based on Standardised Items N of Items .854 .855 3
Mean Std. Deviation N
JC_A1 5.36 1.357 329 JC_A2 5.81 1.296 329 JC_A3 5.52 1.455 329
Scale Mean if Item Deleted
Scale Variance if
Item Deleted
Corrected Item-Total Correlation
Squared Multiple
Correlation
Cronbach's Alpha if Item
Deleted
JC_A1 11.33 6.496 .687 .472 .831 JC_A2 10.88 6.510 .741 .558 .784 JC_A3 11.17 5.719 .755 .578 .769
JC_A=Autonomy
Table 5.3 indicates a Cronbach’s alpha of .854. The Cronbach’s alpha value fell above
the critical cut-off value of .80. Therefore, approximately 86% of the variance in the items
can be classified as true score variance. The absence of extreme means (means range
from 5.36 to 5.81 on a 7-point Likert scale) and the absence of small standard deviations
(1.296 to 1.455) additionally suggested an absence of poor, insensitive items for the
autonomy subscale.
The squared multiple correlations were all above .45 and no outliers were evident towards
the lower end of the distribution of values. It is evident from Table 5.3 that the Cronbach’s
alpha would not increase (it would actually decrease) should any of the items be deleted
from the subscale. Furthermore, the corrected item-total correlations were all above .50
and no outliers were evident towards the lower end of the distribution of values.
Table 5.4 indicates the inter-item correlations and corroborates the findings above in that
all items display similar moderate to high correlations (all above .50). Therefore, it was
decided that all items should be retained for the autonomy subscale and none were
deleted.
Stellenbosch University https://scholar.sun.ac.za

144
Table 5.4
Inter-item Correlation Matrix: Autonomy
JC_A1 JC_A2 JC_A3
JC_A1 1.000 .625 .647 JC_A2 .625 1.000 .716 JC_A3 .647 .716 1.000
JC_A=Autonomy
5.4.1.2 Task identity
The task identity subscale of job characteristics similarly consists of three items. The
results of the detailed item analysis are depicted below in Table 5.5 and Table 5.6
respectively.
Table 5.5
Item Analysis Results for the Task Identity Subscale
Cronbach's Alpha Cronbach's Alpha Based on Standardised Items N of Items .775 .775 3
Mean Std. Deviation N
JC_TI1 5.46 1.377 329 JC_TI2 5.22 1.664 329 JC_TI3 5.67 1.398 329
Scale Mean if Item Deleted
Scale Variance if
Item Deleted
Corrected Item-Total Correlation
Squared Multiple
Correlation Cronbach's Alpha
if Item Deleted
JC_TI1 10.88 7.907 .504 .261 .805 JC_TI2 11.12 5.457 .704 .524 .589 JC_TI3 10.68 6.957 .649 .476 .659
JC_TI=Task Identity
From Table 5.5 it is evident that this subscale’s Cronbach’s alpha was .775. This fell just
below the stipulated critical cut-off of .80. At first glance this initially raised concern. Upon
further inspection of additional statistics it was clear that there were no extreme means
(means range from 5.22 to 5.76 on a 7-point Likert scale) nor were there small standard
deviations (1.377 to 1.664).
Table 5.6
Inter-item Correlation Matrix: Task Identity
JC_TI1 JC_TI2 JC_TI3
JC_TI1 1.000 .500 .417 JC_TI2 .500 1.000 .684 JC_TI3 .417 .684 1.000
JC_TI=Task Identity
From Table 5.6 above it is evident that JC_TI1 correlated marginally lower with the other
items, with a correlation of .417 between JC_TI3 and JC_TI1. This raised a red flag.
Moreover, the fact that the Cronbach’s alpha would increase if JC_TI1 was deleted also
Stellenbosch University https://scholar.sun.ac.za

145
pointed to the fact that responses to JC_TI1 were somewhat out of step with responses
to the other two items. The subscale is, however, quite short and the evidence against
JC_TI1 was not overwhelmingly negative. It therefore seemed prudent to retain all three
of these items representing task identity. Therefore, none of the items within the task
identity subscale were deleted.
5.4.1.3 Skill variety
Three items comprise the skill variety subscale. The results of the item analysis are
depicted below in Table 5.7 and 5.8 respectively.
Table 5.7
Item Analysis Results for the Skill Variety Subscale
Cronbach's Alpha Cronbach's Alpha Based on Standardised Items N of Items .770 .788 3
Mean Std. Deviation N
JC_SV1 5.41 1.563 329 JC_SV2 5.71 1.222 329 JC_SV3 5.64 1.356 329
Scale Mean if Item Deleted
Scale Variance if
Item Deleted
Corrected Item-Total Correlation
Squared Multiple
Correlation
Cronbach's Alpha if Item
Deleted
JC_SV1 11.36 6.144 .423 .185 .915 JC_SV2 11.05 6.101 .708 .721 .596 JC_SV3 11.12 5.400 .734 .733 .542 JC_SV=Skills Variety
As can be seen in Table 5.7, a Cronbach’s alpha of .770 was reported for the skills variety
subscale. This fell below the .80 critical cut-off point suggested for this research study and
raised initial concerns. This means that merely 77% of the variance in the items is
systematic variance and 23% is random error variance. When taking this into
consideration with the overall view of the remaining statistics, namely the lack of extreme
means (5.41 to 5.71 on a 7-point Likert scale), absence of small standard deviations
(1.222 to 1.563) and the inter-item correlations represented in Table 5.8, the initial
inclination was to delete JC_SV1. This was further fuelled by the substantial increase in
Cronbach’s alpha, if this item is deleted (from .770 to .915) and the fact that JC_SV1’s
correlated item-total correlation was lower than .50 (.423) and the squared multiple
correlation was substantially below .30 (.185).
Stellenbosch University https://scholar.sun.ac.za

146
Table 5.8
Inter-item Correlation Matrix: Skill Variety
JC_SV1 JC_SV2 JC_SV3
JC_SV1 1.000 .383 .428 JC_SV2 .383 1.000 .849 JC_SV3 .428 .849 1.000
JC_SV=Skills Variety
It is evident from Table 5.8 that JC_SV1 additionally correlated relatively poorly with
JC_SV2 and, albeit to a slightly lesser degree, also JC_SV3. It therefore seemed fair to
consider the deletion of JC_SV1 to improve the homogeneity of the subscale. However,
deletion is only conducted after the basket of all available evidence has been duly
considered, and it was the researcher’s opinion that EFA should be conducted before
items are deleted. This cautious approach has been taken due to factors such as scale
length (the CJBPOS contains only 79 items) and a concern that this subscale is only
operationalised by three items. This approach was likewise followed by Van Deventer
(2015), however the offending item was subsequently deleted in her research study
surrounding work engagement.
5.4.1.4 Task significance
Three items comprise the task significance subscale. The results of the item analysis are
depicted below in Table 5.9 and 5.10 respectively.
Table 5.9
Item Analysis Results for the Task Significance Subscale
Cronbach's Alpha Cronbach's Alpha Based on Standardised Items N of Items .781 .781 3
Mean Std. Deviation N
JC_TS1 5.61 1.381 329 JC_TS2 5.83 1.300 329 JC_TS3 5.66 1.401 329
Scale Mean if Item
Deleted
Scale Variance if
Item Deleted
Corrected Item-Total Correlation
Squared Multiple
Correlation
Cronbach's Alpha if Item
Deleted
JC_TS1 11.49 5.873 .572 .341 .756 JC_TS2 11.27 6.065 .602 .389 .723 JC_TS3 11.44 5.235 .688 .477 .625
JC_TS=Task Significance
Table 5.9 displays a Cronbach’s alpha of .781. This fell just below the .80 critical cut-off
value, which could again be cause for concern. However, there was no evidence of
extreme means (5.61 to 5.66 on a 7-point Likert scale) nor small standard deviations
(1.300 to 1.401) which would indicate problematic items. Moreover, the Cronbach’s alpha
Stellenbosch University https://scholar.sun.ac.za
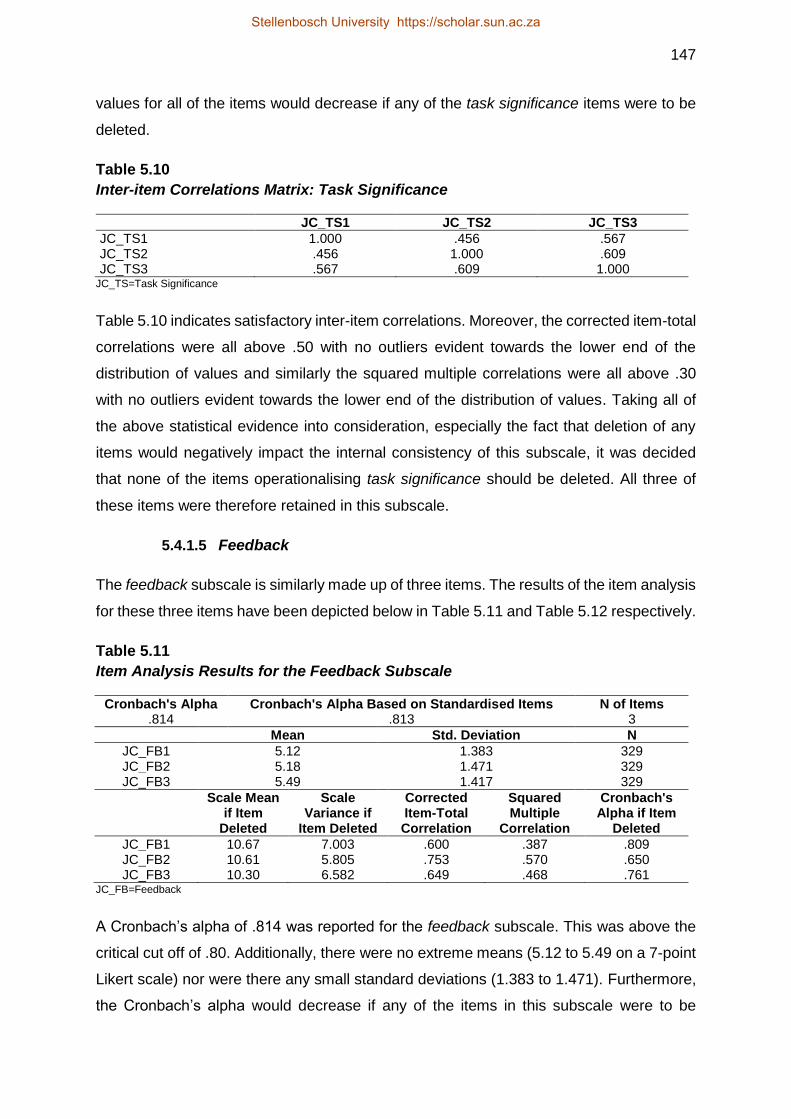
147
values for all of the items would decrease if any of the task significance items were to be
deleted.
Table 5.10
Inter-item Correlations Matrix: Task Significance
JC_TS1 JC_TS2 JC_TS3
JC_TS1 1.000 .456 .567 JC_TS2 .456 1.000 .609 JC_TS3 .567 .609 1.000
JC_TS=Task Significance
Table 5.10 indicates satisfactory inter-item correlations. Moreover, the corrected item-total
correlations were all above .50 with no outliers evident towards the lower end of the
distribution of values and similarly the squared multiple correlations were all above .30
with no outliers evident towards the lower end of the distribution of values. Taking all of
the above statistical evidence into consideration, especially the fact that deletion of any
items would negatively impact the internal consistency of this subscale, it was decided
that none of the items operationalising task significance should be deleted. All three of
these items were therefore retained in this subscale.
5.4.1.5 Feedback
The feedback subscale is similarly made up of three items. The results of the item analysis
for these three items have been depicted below in Table 5.11 and Table 5.12 respectively.
Table 5.11
Item Analysis Results for the Feedback Subscale
Cronbach's Alpha Cronbach's Alpha Based on Standardised Items N of Items .814 .813 3
Mean Std. Deviation N
JC_FB1 5.12 1.383 329 JC_FB2 5.18 1.471 329 JC_FB3 5.49 1.417 329
Scale Mean if Item
Deleted
Scale Variance if
Item Deleted
Corrected Item-Total Correlation
Squared Multiple
Correlation
Cronbach's Alpha if Item
Deleted
JC_FB1 10.67 7.003 .600 .387 .809 JC_FB2 10.61 5.805 .753 .570 .650 JC_FB3 10.30 6.582 .649 .468 .761
JC_FB=Feedback
A Cronbach’s alpha of .814 was reported for the feedback subscale. This was above the
critical cut off of .80. Additionally, there were no extreme means (5.12 to 5.49 on a 7-point
Likert scale) nor were there any small standard deviations (1.383 to 1.471). Furthermore,
the Cronbach’s alpha would decrease if any of the items in this subscale were to be
Stellenbosch University https://scholar.sun.ac.za

148
deleted. All of the squared multiple correlations were above .30 and similarly all of the
corrected item-total correlations were above .50, providing supporting evidence that there
may be no poor items within the feedback subscale. With regards to the standard
deviations, item-total correlations and squared multiple correlations no outliers were
evident towards the lower end of the distribution of values.
Table 5.12
Inter-item Correlations Matrix: Feedback
JC_FB1 JC_FB2 JC_FB3
JC_FB1 1.000 .616 .481 JC_FB2 .616 1.000 .679 JC_FB3 .481 .679 1.000
JC_FB=Feedback
Table 5.12 provides supporting evidence for this initial evaluation. Although the correlation
between JC_FB1 and JC_FB3 was slightly lower than would be expected (<.50) the
respondents generally tended to respond in unison to the three items. They therefore do
tend to reflect the same underlying (although not necessarily unidimensional) factor. Given
the basket of available statistical evidence, it was concluded that no items should be
deleted from this subscale.
Individual needs
The construct of psychological ownership individual needs (roots) is considered to be a
multi-dimensional construct within the proposed psychological ownership structural
model. It is therefore defined as a high-order latent variable consisting of three lower-order
variables (need for self-identity, a sense of belonging and self-efficacy or effectance) each
operationalised by four items within the survey questionnaire.
Table 5.13 and Table 5.14 outlines the item analysis of the first psychological ownership
individual need namely the need for self-identity.
Stellenbosch University https://scholar.sun.ac.za

149
Table 5.13
Item Analysis Results for the Individual Psychological Ownership Need for Self-
Identity Subscale
Cronbach's Alpha Cronbach's Alpha Based on Standardised Items N of Items .835 .834 4
Mean Std. Deviation N
PO_Need_SI_1 5.55 1.301 329 PO_Need_SI_2 5.67 1.306 329 PO_Need_SI_3 5.49 1.386 329 PO_Need_SI_4 5.48 1.379 329
Scale Mean if Item
Deleted
Scale Variance if
Item Deleted
Corrected Item-Total Correlation
Squared Multiple
Correlation
Cronbach's Alpha if Item
Deleted
PO_Need_SI_1 16.64 12.012 .622 .427 .810 PO_Need_SI_2 16.53 12.079 .609 .376 .815 PO_Need_SI_3 16.70 10.394 .783 .635 .735 PO_Need_SI_4 16.71 11.365 .650 .509 .798
PO_Need_SI=Self Identity
From Table 5.13 it is evident that there were no extreme means (5.48 to 5.67 on a 7-point
Likert scale) nor small standard deviations (1.301 to 1.386). Furthermore, a Cronbach’s
alpha of .835 was reported, which was above the critical cut-off suggested for this research
study. The Cronbach’s alpha additionally would not increase if any of the items were to be
deleted from this subscale. This means that the internal consistency of the sub-scale
would not improve (on the contrary it would actually worsen) should any of these four
items be removed. The corrected item-total correlations were all above .50 and the
squared multiple correlations were additionally all above .30. With regards to the standard
deviations, item-total correlations and squared multiple correlations no outliers were
evident towards the lower end of the distribution of values. This suggests that there are
no problematic items in the subscale. This conclusion was corroborated by Table 5.14
which outlines the inter-item correlations.
Table 5.14
Inter-item Correlation Matrix: Self-Identity
PO_Need_SI_1 PO_Need_SI_2 PO_Need_SI_3 PO_Need_SI_4
PO_Need_SI_1 1.000 .515 .623 .449 PO_Need_SI_2 .515 1.000 .566 .480 PO_Need_SI_3 .623 .566 1.000 .707 PO_Need_SI_4 .449 .480 .707 1.000
PO_Need_SI=Self Identity
All of the correlations were above .50 except for the correlation between PO_Need_SI_1
and PO_Need_SI_4. Nonetheless the inter-item correlation matrix suggests that
respondents did tend to respond in unison to the four items in the subscale. It was
Stellenbosch University https://scholar.sun.ac.za

150
therefore decided that none of the items presented enough evidence to warrant deletion.
Therefore, all four items were retained.
Table 5.15 outlines the item analysis statistics for the second psychological ownership
individual need, namely that of a sense of belonging. This subscale similarly consists of
four items. The Cronbach’s alpha value reported was .813, which was above the critical
cut-off of .80. There were additionally no extreme means (5.55 to 5.93 on a 7-point Likert
scale), nor small standard deviations (1.151 to 1.183) indicating an absence of insensitive
items.
Table 5.15
Item Analysis Results for the Individual Psychological Ownership Need for a
Sense of Belonging Subscale
Cronbach's Alpha Cronbach's Alpha Based on Standardised Items N of Items .813 .818 4
Mean Std. Deviation N
PO_Need_SOB_1 5.55 1.414 329 PO_Need_SOB_2 5.83 1.183 329 PO_Need_SOB_3 5.84 1.174 329 PO_Need_SOB_4 5.93 1.151 329
Scale Mean if Item
Deleted
Scale Variance if
Item Deleted
Corrected Item-Total Correlation
Squared Multiple
Correlation
Cronbach's Alpha if
Item Deleted
PO_Need_SOB_1 17.60 8.734 .586 .371 .796 PO_Need_SOB_2 17.32 9.164 .707 .501 .731 PO_Need_SOB_3 17.31 9.591 .641 .435 .761 PO_Need_SOB_4 17.22 9.865 .614 .398 .774
PO_Need_SOB=Sense of Belonging
Table 5.16 below outlines the inter-item correlations and it was evident that the four items
correlated moderately. This indicates that they did reflect the same underlying (but not
necessarily unidimensional) factor.
Table 5.16
Inter-item Correlation Matrix: Sense of Belonging
PO_Need_SOB_1 PO_Need_SOB_2 PO_Need_SOB_3 PO_Need_SOB_4
PO_Need_SOB_1 1.000 .584 .457 .439
PO_Need_SOB_2 .584 1.000 .584 .547
PO_Need_SOB_3 .457 .584 1.000 .563
PO_Need_SOB_4 .439 .547 .563 1.000
PO_Need_SOB=Sense of Belonging
Therefore, it was decided that none of the sense of belonging items provided cause for
concern and therefore all of the items were retained.
Stellenbosch University https://scholar.sun.ac.za

151
Table 5.17 outlines the last psychological ownership individual need, namely the need for
a sense of self-efficacy. This subscale consists of four items and a Cronbach’s alpha of
.828 was reported, according to Table 5.17, which was above the critical cut-off value
suggested for this research study.
Table 5.17
Item Analysis Results for the Individual Psychological Ownership Need for a Self-
Efficacy or Effectance Subscale
Cronbach's Alpha Cronbach's Alpha Based on Standardised Items N of Items .828 .830 4
Mean Std. Deviation N
PO_Need_SE_1 6.07 1.003 329 PO_Need_SE_2 6.04 1.029 329 PO_Need_SE_3 6.05 .971 329 PO_Need_SE_4 6.39 .808 329
Scale Mean if
Item Deleted
Scale Variance if
Item Deleted
Corrected Item-Total Correlation
Squared Multiple
Correlation
Cronbach's Alpha if Item
Deleted
PO_Need_SE_1 18.47 5.640 .632 .406 .794 PO_Need_SE_2 18.51 5.488 .645 .460 .789 PO_Need_SE_3 18.50 5.391 .737 .558 .743 PO_Need_SE_4 18.16 6.457 .620 .410 .801
PO_Need_SE=Self efficacy/effectance
No extreme means (6.04 to 6.39 on a 7-Likert scale) were evident, nor were there any
small standard deviations (.808 to .1029), suggesting that there were no insensitive items
in this subscale. This finding is corroborated by the Cronbach’s alpha values that would
decrease if any items were deleted from the subscale, indicating that internal consistency
would be negatively affected if items were to be deleted. Table 5.18 outlines the inter-item
correlation matrix and it is evident that all four items correlated moderately. Respondents’
responses to the four items therefore tended to be reasonably in unison. Taken in
conjunction with the rest of the item statistics it was therefore decided to retain all items in
this subscale.
Table 5.18
Inter-item Correlation Matrix: Need for Self-Efficacy or Effectance
PO_Need_SE_1 PO_Need_SE_2 PO_Need_SE_3 PO_Need_SE_4
PO_Need_SE_1 1.000 .505 .560 .540 PO_Need_SE_2 .505 1.000 .657 .452 PO_Need_SE_3 .560 .657 1.000 .586 PO_Need_SE_4 .540 .452 .586 1.000
PO_Need_SE=Self efficacy/effectance
Stellenbosch University https://scholar.sun.ac.za

152
Psychological safety
The Psychological safety subscale consists of five items. The item analysis is depicted
below in Table 5.19 and Table 5.20 respectively.
Table 5.19
Item Analysis Results for the Psychological Safety Subscale
Cronbach's Alpha Cronbach's Alpha Based on Standardised Items N of Items .888 .891 5
Mean Std. Deviation N
PS_1 3.87 .914 329 PS_2 3.53 1.021 329 PS_3 3.65 .945 329 PS_4 3.62 1.136 329 PS_5 3.67 1.046 329
Scale Mean if Item Deleted
Scale Variance if
Item Deleted
Corrected Item-Total Correlation
Squared Multiple
Correlation
Cronbach's Alpha if Item
Deleted
PS_1 14.47 12.378 .714 .569 .868 PS_2 14.81 11.383 .781 .644 .851 PS_3 14.68 12.205 .714 .552 .868 PS_4 14.71 11.680 .623 .511 .892 PS_5 14.67 10.937 .835 .711 .838 PS=Psychological Safety
Table 5.19 indicates a Cronbach’s alpha of .888 therefore almost 90% (88%) of the
variance in the items is true variance and only 10% is random error variance. When
looking at the item statistics is seems evident that there were no extreme means (3.53 to
3.87 on a 5-point Likert scale) and additionally no small standard deviations (.914 to 1.136)
therefore providing no evidence that any of the items could potentially be insensitive items.
Corrected item-total correlations were all above .50 and the squared multiple correlations
were all above .30 providing further corroboration for the reliability of these items.
Table 5.19 does however suggest that PS_4 could be cause for concern due to the
corrected item-total correlation that tends to fall somewhat away from the typical value
returned for the other items, and the increase in Cronbach’s Alpha (.888 to .892) if this
item were to be deleted. However, this increase is somewhat marginal and further
investigation was necessary to determine if this item should in fact be deleted.
Table 5.20 below presents the inter-item correlations matrix which presents moderate to
high correlations between all five items. This therefore suggests that these items reflect to
a reasonable degree the same source of variance. Whether the common source of
variance is a single factor and whether it is the underlying factor that the scale intended
Stellenbosch University https://scholar.sun.ac.za

153
to measure – psychological safety – cannot be inferred from the available item analysis
results.
Table 5.20
Inter-item Correlation Matrix: Psychological Safety
PS_1 PS_2 PS_3 PS_4 PS_5
PS_1 1.000 .710 .627 .447 .658 PS_2 .710 1.000 .685 .528 .707 PS_3 .627 .685 1.000 .461 .666 PS_4 .447 .528 .461 1.000 .712 PS_5 .658 .707 .666 .712 1.000
PS=Psychological Safety
In light of the above basket of evidence it was decided that none of the items would be
deleted, including PS_4, as the internal consistency met the cut-off value even when this
item was included. Therefore, all of the items in this subscale were retained. However, the
potentially problematic item was flagged for inspection during the factor analysis.
Motivation to pursue the routes to psychological ownership
Motivation to pursue the routes to psychological ownership consists of two subscales
containing nine items each. These subscales will be analysed separately below.
5.4.4.1 Motivation to pursue the routes to psychological ownership –
Valence subscale
This subscale consists of nine items and the item analysis is depicted below in Table 5.21
and 5.22 respectively. Table 5.21 indicates a Cronbach’s Alpha of .871. This is above the
critical cut-off value suggested for this study and means that more than 87% of variance
is due to true or systematic variance and just more than 10% is due to random error
variance. It is additionally evident that no extreme means (4.81 to 6.35 on a 7-point scale)
or small standard deviations were present, indicating that no insensitive items exist in this
subscale.
Stellenbosch University https://scholar.sun.ac.za

154
Table 5.21
Item Analysis Results for the Motivation to Pursue the Routes to Psychological
Ownership Valence Subscale
Cronbach's Alpha Cronbach's Alpha Based on Standardised Items N of Items .871 .888 9
Mean Std. Deviation N
Mot_1 6.12 .960 329 Mot_2 5.56 1.365 329 Mot_3 5.98 1.066 329 Mot_4 6.35 .828 329 Mot_5 4.81 1.684 329 Mot_6 5.85 1.198 329 Mot_7 6.33 .874 329 Mot_8 6.34 1.042 329 Mot_9 5.94 1.175 329
Scale Mean if Item Deleted
Scale Variance if Item Deleted
Corrected Item-Total Correlation
Squared Multiple
Correlation
Cronbach's Alpha if Item
Deleted
Mot_1 47.17 45.034 .598 .474 .859 Mot_2 47.73 40.576 .646 .528 .854 Mot_3 47.31 42.094 .754 .644 .845 Mot_4 46.94 46.667 .558 .484 .863 Mot_5 48.48 42.031 .403 .411 .891 Mot_6 47.44 41.540 .692 .610 .849 Mot_7 46.96 45.200 .655 .611 .856 Mot_8 46.95 43.616 .651 .496 .854 Mot_9 47.35 41.003 .750 .666 .844 Mot=Motivation to pursue the routes towards psychological ownership
The inter-item correlation matrix, presented below in Table 5.22, indicated several items
that correlated below .50.
Table 5.22
Inter-item Correlation Matrix: Motivation to Pursue the Routes to Psychological
Ownership Valence Subscale
Mot_1 Mot_2 Mot_3 Mot_4 Mot_5 Mot_6 Mot_7 Mot_8
Mot_1 1.000 .372 .530 .557 .232 .426 .633 .477 Mot_2 .372 1.000 .515 .336 .612 .440 .397 .432 Mot_3 .530 .515 1.000 .526 .283 .687 .580 .580 Mot_4 .557 .336 .526 1.000 .154 .371 .652 .449 Mot_5 .232 .612 .283 .154 1.000 .316 .147 .214 Mot_6 .426 .440 .687 .371 .316 1.000 .497 .553 Mot_7 .633 .397 .580 .652 .147 .497 1.000 .579 Mot_8 .477 .432 .580 .449 .214 .553 .579 1.000 Mot_9 .450 .487 .710 .436 .336 .739 .554 .625
Mot=Motivation to pursue the routes towards psychological ownership
However, as per Table 5.21, only the deletion of Mot_5 would have a positive impact on
the internal consistency (increase in Cronbach’s alpha from .871 to .891). This influence
was however negligible and the internal consistency was already acceptable. Therefore,
Stellenbosch University https://scholar.sun.ac.za

155
it was decided that the item should be retained. Further analysis in terms of EFA was
additionally used to provide corroboratory evidence for this decision.
5.4.4.2 Motivation to pursue the routes to psychological ownership –
Expectancy subscale
This subscale similarly consists of nine items and the item analysis is depicted below in
Table 5.23 and 5.24. Table 5.23 indicates a Cronbach’s alpha of .900. This was above the
critical cut-off value suggested for this study and meant that more than 90% of variance is
due to true or systematic variance and just more than 10% is due to random error variance.
It is additionally evident that no extreme means (4.96 to 6.17 on a 7-point scale) or small
standard deviations were present, indicating that similarly there were no insensitive items
in this subscale.
Table 5.23
Item Analysis Results for the Motivation to Pursue the Routes to Psychological
Ownership Expectancy Subscale
Cronbach's Alpha Cronbach's Alpha Based on Standardised Items N of Items .900 .906 9
Mean Std. Deviation N
Mot_10 6.04 1.076 329 Mot_11 5.33 1.453 329 Mot_12 5.60 1.296 329 Mot_13 6.07 1.020 329 Mot_14 4.96 1.622 329 Mot_15 5.53 1.343 329 Mot_16 6.17 .967 329 Mot_17 6.02 1.167 329 Mot_18 5.66 1.375 329
Scale Mean if Item Deleted
Scale Variance if Item Deleted
Corrected Item-Total Correlation
Squared Multiple
Correlation
Cronbach's Alpha if Item
Deleted
Mot_10 45.33 61.216 .628 .612 .892 Mot_11 46.04 57.136 .624 .659 .893 Mot_12 45.77 55.981 .788 .742 .879 Mot_13 45.30 61.521 .649 .686 .891 Mot_14 46.41 56.224 .580 .617 .899 Mot_15 45.84 56.219 .741 .769 .883 Mot_16 45.20 61.811 .671 .662 .890 Mot_17 45.35 59.044 .699 .544 .886 Mot_18 45.71 56.085 .727 .753 .884 Mot=Motivation to pursue the routes towards psychological ownership
The inter-item correlation matrix, however, did not provide corroboratory evidence for an
unproblematic subscale. It is evident from Table 5.24 below that several items correlated
poorly as they did not meet the .50 criteria, as highlighted below.
Stellenbosch University https://scholar.sun.ac.za
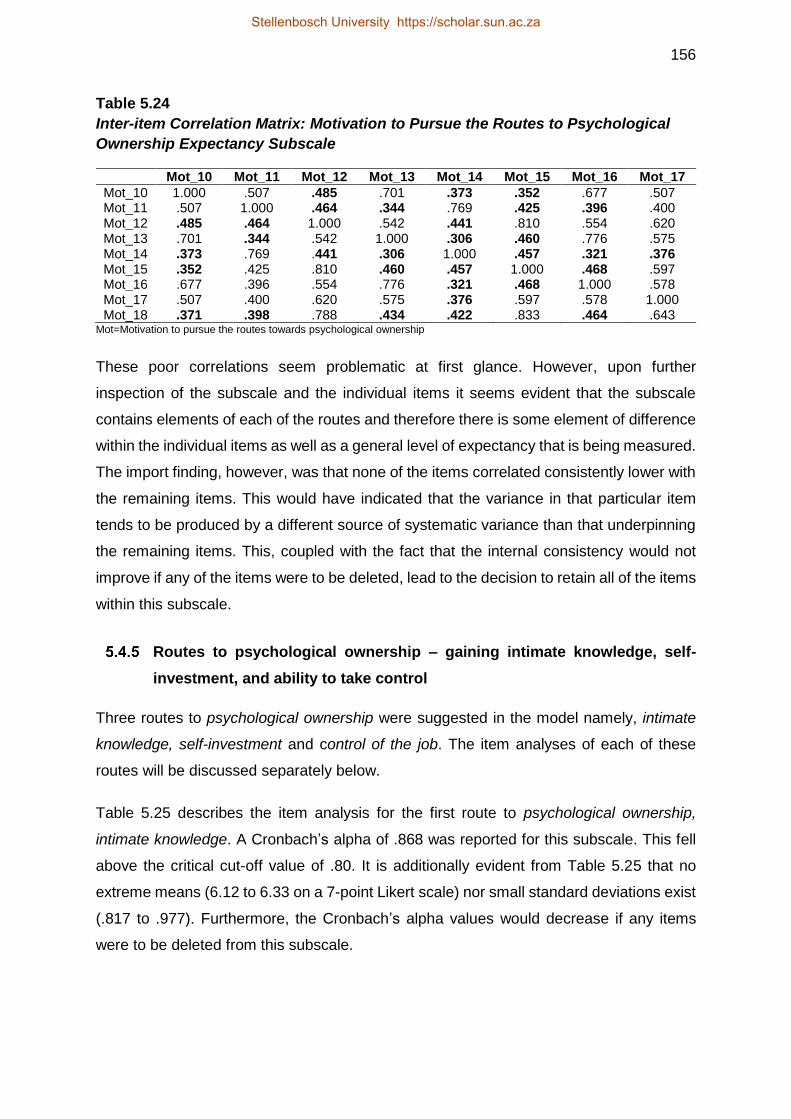
156
Table 5.24
Inter-item Correlation Matrix: Motivation to Pursue the Routes to Psychological
Ownership Expectancy Subscale
Mot_10 Mot_11 Mot_12 Mot_13 Mot_14 Mot_15 Mot_16 Mot_17
Mot_10 1.000 .507 .485 .701 .373 .352 .677 .507 Mot_11 .507 1.000 .464 .344 .769 .425 .396 .400 Mot_12 .485 .464 1.000 .542 .441 .810 .554 .620 Mot_13 .701 .344 .542 1.000 .306 .460 .776 .575 Mot_14 .373 .769 .441 .306 1.000 .457 .321 .376 Mot_15 .352 .425 .810 .460 .457 1.000 .468 .597 Mot_16 .677 .396 .554 .776 .321 .468 1.000 .578 Mot_17 .507 .400 .620 .575 .376 .597 .578 1.000 Mot_18 .371 .398 .788 .434 .422 .833 .464 .643
Mot=Motivation to pursue the routes towards psychological ownership
These poor correlations seem problematic at first glance. However, upon further
inspection of the subscale and the individual items it seems evident that the subscale
contains elements of each of the routes and therefore there is some element of difference
within the individual items as well as a general level of expectancy that is being measured.
The import finding, however, was that none of the items correlated consistently lower with
the remaining items. This would have indicated that the variance in that particular item
tends to be produced by a different source of systematic variance than that underpinning
the remaining items. This, coupled with the fact that the internal consistency would not
improve if any of the items were to be deleted, lead to the decision to retain all of the items
within this subscale.
Routes to psychological ownership – gaining intimate knowledge, self-
investment, and ability to take control
Three routes to psychological ownership were suggested in the model namely, intimate
knowledge, self-investment and control of the job. The item analyses of each of these
routes will be discussed separately below.
Table 5.25 describes the item analysis for the first route to psychological ownership,
intimate knowledge. A Cronbach’s alpha of .868 was reported for this subscale. This fell
above the critical cut-off value of .80. It is additionally evident from Table 5.25 that no
extreme means (6.12 to 6.33 on a 7-point Likert scale) nor small standard deviations exist
(.817 to .977). Furthermore, the Cronbach’s alpha values would decrease if any items
were to be deleted from this subscale.
Stellenbosch University https://scholar.sun.ac.za

157
Table 5.25
Item Analysis Results for the Route of Intimate Knowledge Subscale
Cronbach's Alpha Cronbach's Alpha Based on Standardised Items N of Items .868 .870 4
Mean Std. Deviation N
IK_1 6.12 .977 329 IK_2 6.12 .883 329 IK_3 6.15 .899 329 IK_4 6.33 .817 329
Scale Mean if Item Deleted
Scale Variance if
Item Deleted
Corrected Item-Total Correlation
Squared Multiple
Correlation
Cronbach's Alpha if Item
Deleted
IK_1 18.60 5.125 .707 .541 .840 IK_2 18.60 5.430 .728 .587 .829 IK_3 18.58 5.318 .743 .611 .822 IK_4 18.39 5.751 .712 .552 .837 IK=Intimate Knowledge
The reliability of this subscale was further corroborated by evidence from Table 5.26
below, which outlines the inter-item correlations. All of the inter-item correlation values
were above .50 which indicated that the items, to a sufficient degree, reflect a common
source of variance. The common source of variance is, however not necessarily the latent
variable of interest nor necessarily a unidimensional underlying factor. However, there
seemed to be no evidence to suggest any problematic items and all six items were
therefore retained.
Table 5.26
Inter-item Correlation Matrix: Intimate Knowledge
IK_1 IK_2 IK_3 IK_4
IK_1 1.000 .629 .563 .660 IK_2 .629 1.000 .714 .538 IK_3 .563 .714 1.000 .652 IK_4 .660 .538 .652 1.000
IK=Intimate Knowledge
The second route to psychological ownership is self-investment. This subscale consists
of four items and details pertaining to the items’ psychometric qualities are outlined in
Table 5.27 and 5.28 respectively.
Stellenbosch University https://scholar.sun.ac.za

158
Table 5.27
Item Analysis Results for the Route of Self Investment Subscale
Cronbach's Alpha Cronbach's Alpha Based on Standardised Items N of Items .867 .869 4
Mean Std. Deviation N
SI_1 6.14 1.080 329 SI_2 5.82 1.243 329 SI_3 6.03 1.139 329 SI_4 5.95 1.262 329
Scale Mean if Item Deleted
Scale Variance if Item Deleted
Corrected Item-Total Correlation
Squared Multiple
Correlation
Cronbach's Alpha if Item
Deleted
SI_1 17.81 9.773 .749 .585 .819 SI_2 18.12 9.034 .726 .582 .826 SI_3 17.91 9.520 .737 .604 .822 SI_4 17.99 9.274 .668 .504 .852 SI=Self Investment
The results indicate a Cronbach’s alpha of .867 for this subscale. This fell above the critical
cut-off of .80 suggested for this research study. This suggests that there might not be any
problematic items within the subscale. Upon further investigation of the item statistics, this
was substantiated. When considering the standard deviations and means there were no
small standard deviations (1.080 to 1.262) evident nor were there any extreme means
(5.82 to 6.14 on a 7-point Likert scale), according to Table 5.27. Furthermore, the
correlated item-total and squared multiple correlation values were above .50 and .30
respectively. Cronbach’s alpha values would additionally decrease if any of the six items
were to be deleted from the subscale. The inter-item correlation matrix outlined in Table
5.28 below additionally shows that the items correlate well with the other items within this
subscale (all above .50).
Table 5.28
Inter-item Correlation Matrix: Self-Investment
SI_1 SI_2 SI_3 SI_4
SI_1 1.000 .597 .643 .687 SI_2 .597 1.000 .734 .555 SI_3 .643 .734 1.000 .529 SI_4 .687 .555 .529 1.000
SI=Self Investment
There was therefore no evidence of poor items within this subscale and all items were
subsequently retained.
Table 5.29 below details the item analysis for the six items which constitute the third, and
final, route to psychological ownership namely, control of the job.
Stellenbosch University https://scholar.sun.ac.za

159
Table 5.29
Item Analysis Results for the Route of Control Subscale
Cronbach's Alpha Cronbach's Alpha Based on Standardised Items N of Items .909 .909 6
Mean Std. Deviation N
C_1 4.94 1.288 329 C_2 5.01 1.467 329 C_3 5.05 1.439 329 C_4 4.84 1.637 329 C_5 5.40 1.363 329 C_6 5.22 1.505 329
Scale Mean if Item Deleted
Scale Variance if Item Deleted
Corrected Item-Total Correlation
Squared Multiple
Correlation
Cronbach's Alpha if Item
Deleted
C_1 25.53 39.488 .685 .506 .901 C_2 25.47 36.622 .758 .647 .891 C_3 25.42 36.799 .765 .641 .889 C_4 25.63 34.423 .787 .711 .887 C_5 25.07 37.391 .779 .608 .888 C_6 25.25 36.865 .716 .657 .897 C=Control
A Cronbach alpha of .909 was reported which falls above the critical cut-off of .80. It is
also evident that there are no extreme means (4.84 to 5.40 on a 7-point scale) and nor
are there any small standard deviations (1.288 to 1.637). The corrected item-total
correlations and squared multiple correlation values were all above the relevant thresholds
of .50 and .30 respectively. Furthermore, Cronbach’s alpha would decrease if any of the
six items were to be deleted. This therefore alludes to a group of psychometrically soundly
operating items.
Table 5.30
Inter-item Correlation Matrix: Control of the Job
C_1 C_2 C_3 C_4 C_5 C_6
C_1 1.000 .641 .634 .544 .616 .479 C_2 .641 1.000 .755 .617 .650 .516 C_3 .634 .755 1.000 .612 .647 .555 C_4 .544 .617 .612 1.000 .684 .797 C_5 .616 .650 .647 .684 1.000 .641 C_6 .479 .516 .555 .797 .641 1.000
C=Control
Table 5.30 corroborates this and indicates that all of the items satisfactorily reflected the
same underlying latent variable (or variables). In light of the combination of item statistics
it was decided that all of the six control items should be retained as deletion of any of the
items would have had a negative impact on the internal consistency.
Stellenbosch University https://scholar.sun.ac.za

160
Psychological ownership
Psychological ownership is measured by a six-item subscale in the CJBPOS. Table 5.31
and Table 5.32 below outline the detailed item analysis.
Table 5.31 Item Analysis Results for the Psychological Ownership Subscale
Cronbach's Alpha Cronbach's Alpha Based on Standardised Items N of Items .942 .943 6
Mean Std. Deviation N
PO_1 5.83 1.453 329 PO_2 5.97 1.353 329 PO_3 5.74 1.537 329 PO_4 5.85 1.351 329 PO_5 6.10 1.305 329 PO_6 5.61 1.446 329
Scale Mean if Item Deleted
Scale Variance if
Item Deleted
Corrected Item-Total Correlation
Squared Multiple
Correlation
Cronbach's Alpha if Item
Deleted
PO_1 29.28 38.508 .825 .773 .931 PO_2 29.15 39.405 .839 .733 .930 PO_3 29.37 36.861 .872 .811 .926 PO_4 29.26 39.009 .869 .774 .926 PO_5 29.01 40.454 .804 .714 .934 PO_6 29.50 39.671 .754 .602 .940 PO=Psychological Ownership
A Cronbach’s alpha value of .942 was reported for this subscale. This means that almost
95% of the variance is true/systematic variance and only 5% is random error variance.
When examining the means and standard deviations it is evident that there were no
extreme means (5.61 to 6.10 on a 7-point scale) nor small standard deviations (1.305 to
1.537). Furthermore, the corrected item-total correlations were all above .50 and the
squared multiple correlations were well above .30. Additionally, the Cronbach alpha would
decrease if any of the items were to be deleted. Table 5.32 provides further corroboratory
evidence of the psychometric quality of this subscale in that all of the inter-item
correlations are above .50. Therefore, none of the items within the psychological
ownership subscale seem to be problematic and all of the items were retained.
Table 5.32
Inter-item Correlation Matrix: Psychological Ownership
PO_1 PO_2 PO_3 PO_4 PO_5 PO_6
PO_1 1.000 .775 .857 .742 .628 .643 PO_2 .775 1.000 .793 .739 .756 .648 PO_3 .857 .793 1.000 .800 .717 .663 PO_4 .742 .739 .800 1.000 .792 .750 PO_5 .628 .756 .717 .792 1.000 .693 PO_6 .643 .648 .663 .750 .693 1.000
PO=Psychological Ownership
Stellenbosch University https://scholar.sun.ac.za

161
5.5 DIMENSIONALITY ANALYSIS VIA EXPLORATORY FACTOR ANALYSIS (EFA)
AND CONFIRMATORY FACTOR ANALYSIS (CFA)
According to Barendse, Oort, and Timmerman (2015) dimensionality analysis is critical in
the evaluation of surveys used within behavioral and social sciences. This is because
dimensionality aids in determining the structure that underlies the research participant’s
responses to the manifest variables. The CJBPOS operationalised each latent variable in
the proposed psychological ownership structural model via multiple effect indicators. The
expectation was that each indicator would provide a relatively uncontaminated reflection
of each research participants standing on the latent variables of interest and that each
scale or subscale would measure a unidimensional latent variable. Factor analysis was
the statistical technique used to evaluate the validity of the operationalisation of latent
variables. Both exploratory and confirmatory factor analysis was used for this purpose.
EFA is a multivariate statistical technique used to model the covariance structure of the
manifest variables by three parameters namely factor loadings of latent variables, residual
or unique variances and factor correlations (Hayasbi & Yuan, 2010) with the aim of
determining the number of factors required to explain correlations among observed
variables (Reio & Shuck, 2015) or more precisely the factor structure of the various
indictors.
EFA was performed on all subscales that purported to measure a unidimensional latent
variable, or a unidimensional dimension of a multi-dimensional latent variable. If the
unidimensional assumption held a single extracted factor would provide a satisfactory
explanation for the observed inter-item correlation matrix in as far as the residual
correlations would generally be small (Hair et al. 2010). Moreover, if each indicator did
provide a relatively uncontaminated reflection of each research participants standing on
the unidimensional latent variable, or a unidimensional dimension of a multi-dimensional
latent variable of interest, the factor loadings on the single extracted factor should be
generally high (j1.50).
Confirmatory factor analysis, used to test priori hypotheses on the covariance structure
(Hayasbi & Yuan, 2010), was used to further examine the validity of the operationalisation
of the multi-dimensional latent variables. In the case of the multi-dimensional latent
variables the constitutive definition of each latent variable afforded a specific internal
structure to the latent variable. A number of effect indicators were developed for each
dimension of the latent variable that the constitutive definition made provision for. In
Stellenbosch University https://scholar.sun.ac.za

162
combination the constitutive definition and the creation of the effect indicators for each
latent dimension implied a measurement model. The scale provided a valid measure of a
multi-dimensional latent variable if the measurement model reflecting the constitutive
definition and the design intention of the scale fitted data, the factor loadings were
statistically significant and the completely standardised factor loadings were large
(ij.50).
The scales in the CJBPOS were predominately used to measure unidimensional
constructs, namely psychological ownership, intimate knowledge, control of the job and
self-investment. However, there are three multi-dimensional constructs within the
proposed structural model resulting in three multidimensional scales in the CJBPOS,
namely, job characteristics, motivation to pursue the routes to psychological ownership59
and psychological ownership individual needs. The assumption of unidimensionality
stands true for the subscales which make up these scales, but not the scales themselves.
These multi-dimensional scales of the CJBPOS are depicted below in Table 5.33.
Table 5.33
Multi-dimensional Constructs
Scale First order dimension
Job Characteristics scale 1. Autonomy 2. Task Identity 3. Task Significance 4. Skill Variety 5. Feedback Motivation to pursue the routes 1. Expectancy 2. Valence Psychological Ownership Needs Scale 1. Need for a sense of belonging 2. Need for a sense of self-efficacy/
effectance 3. Need for self-identity
In order to evaluate the unidimensionality assumptions unrestricted principal axis factor
analysis, with oblique rotation, was performed on each scale as well as each of the
subscales. The Kaiser, Meyer, Olkin measure of sampling adequacy (KMO) and Bartlett’s
Test of Sphericity were used from a statistical perspective to determine factor
59 It must be acknowledged here that the motivation to pursue the routes construct was operationalised as a two-dimensional construct in the CJBPOS. The operationalisation of the construct was grounded in the expectancy theory of motivation. The eighteen items comprising the scale were designed to measure the expectancies and valences associated with the three routes to psychological ownership. The two subscales of this scale can nonetheless strictly speaking not be regarded as unidimensional subscales because it cannot be assumed that the expectancies associated with the outcomes of each route would necessarily correlate and neither could the assumption be made with regards to the valences. The two sets of expectancy and valence items were nonetheless treated as if it could be expected that they approximate two unidimensional subscales.
Stellenbosch University https://scholar.sun.ac.za

163
analysability. A KMO that approaches unity (>.60) and the rejection of the Bartlett null
hypothesis that the inter-item correlation matrix is an identity matrix in the parameter were
the criteria used in determining factoranalisability of the observed correlation matrix. The
determination of the number of factors to extract was based on Kaiser-Guttman criterion
(Wang, Watts, Anderson, & Little, 2013), the scree-test as well as the percentage of large
residual correlations (>.05). The Kaiser-Guttman criterion stipulates that factors with an
eigenvalue greater than one should be retained. Therefore, the number of factors equals
the number of eigenvalues of the sample correlation matrix that are greater than one
(Hayasbi & Yuan, 2010). The scree-plot is a visual plot “with the ordered eigenvalues (from
large to small) of the sample correlation matrix in the vertical axis and the ordinal number
in the horizontal axis” (Salkind, 2010, p. 461). Here the location of the elbow (position on
the plot where the eigenvalues taper off into a more linear format) is used as a guide for
factor retention (Tabachnick & Fidell, 2014).
Factor loadings were considered to be satisfactory if they exceeded .71 and acceptable if
a factor loading value on an individual item fell above .50 (Hair et al. 2010). Table 5.34
below provides a summary of the factor analysis results before moving on to each
construct separately.
Table 5.34
Summary Factor Analyses Results for the Composite Job-Based Psychological
Ownership Survey (CJBPOS) Scales/Subscales before Deletion of Items
Scale/subscale KMO Bartlett’s Test Maximum loading
Minimum loading
Number of factors extracted
JC_A .725 442.892 (p<.05) .860 .752 1 JC_TI .648 304.460 (p<.05) .903 .553 1 JC_SV .594 482.029 (p<.05) .970 .440 1 JC_TS .670 286.995 (p<.05) .868 .652 1 JC_FB .673 361.493 (p<.05) .930 .661 1 IK .747 673.035 (p<.05) .825 .772 2 SI .770 674.132 (p<.05) .819 .728 2 C .868 1310.209 (p<.05) .829 .725 2 PS .839 981.141 (p<.05) .891 .659 1 PO .889 1842.500 (p<.05) .906 .779 1 PO Need_SI .759 538.894 (p<.05) .913 .665 1 PO Need_SOB .787 447.364 (p<.05) .816 .659 1 PO Need_SE .780 494.623 (p<.05) .851 .692 1 MOT_VAL .876 1591.422 (p<.05) .821 .024 2 MOT_EXP .875 2170.589 (p<.05) .834 .010 3
JC_A=Autonomy, JC_TI= Task Identity, JC_SV=Skills Variety, JC_TS= Task Significance, JC_FB=Feedback, IK=Intimate Knowledge, SI=Self Investment, C=Control, PS= Psychological Safety, PO=Psychological Ownership, PO_Need_SI=Self Identity, PO_Need_SOB=Sense of Belonging, PO_Need_SE=Self efficacy/effectance, MOT_VAL=Motivation to pursue the routes to psychological ownership Valence, MOT_EXP=Motivation to pursue the routes to psychological ownership Expectancy
Stellenbosch University https://scholar.sun.ac.za

164
Job characteristics
As previously stated, dimensionality analysis was conducted on each of the job
characteristics separately namely autonomy, task identity, skill variety, task significance
and feedback. The results of this analysis are presented below.
5.5.1.1 Autonomy
Dimensionality analysis was conducted via EFA on the three items in the autonomy
subscale of the job characteristics scale. The .30 cut-off value within the correlation matrix
was obtained for all three of the inter-item correlations and they were additionally all
statistically significant (p<.05). A KMO of .725 was obtained which pointed to the factor
analysabilty of the subscale. This is further corroborated by the Bartlett Test of Sphericity
(442.892; p=.00) which indicated that the null hypothesis that the correlation matrix is an
identity matrix in the population could be rejected (p<.05) (Hair et al. 2010). The
eigenvalue greater than one rule (2.326) and scree-plot both indicated the extraction of
one factor only, substantiating the unidimensionality assumption. The factor matrix is
presented below in Table 5.35.
Table 5.35
Factor Structure for the Autonomy Subscale
Factor 1
JC_A1 .860 JC_A2 .832 JC_A3 .752
JC_A=Autonomy
The factor matrix, shown in Table 5.35, indicates that the items loaded satisfactory on a
single factor (>.50). There were additionally no nonredundant residual correlations with
absolute values greater than .05. The evidence lead in support of unidimensionality was
therefore regarded as credible. Similar findings were presented by Van Deventer in her
2015 study of work engagement.
5.5.1.2 Task identity
Dimensionality analysis was conducted on the three items in the task identity subscale of
the job characteristics scale. Similar to the findings for the autonomy subscale the .30 cut-
off value in the correlation matrix was obtained for all three of the inter-item correlations
and they were additionally all statistically significant (p<.05). A KMO of .648 was obtained
which indicated the factor analysability of the subscale inter-item correlation matrix. This
Stellenbosch University https://scholar.sun.ac.za

165
is corroborated by the Bartlett Test of Sphericity (304.460; p=.00) which indicated that the
null hypothesis that the correlation matrix is an identity matrix in the population could be
rejected (p<.05) (Hair et al. 2010).
The eigenvalue greater than one rule (2.076) and the scree-plot both indicated the
extraction of one factor only, substantiating the unidimensionality assumption. The
extracted factor solution is presented below in Table 5.36
Table 5.36
Factor Structure for the Task Identity Subscale
Factor 1
JC_TI1 .903 JC_TI2 .757 JC_TI3 .553 JC_TI=Task Identity
The factor matrix, shown in Table 5.36, moreover indicated that the items loaded
satisfactory on the single factor (>.50). There were additionally no nonredundant residuals
with absolute values greater than .05. The evidence lead in support of unidimensionality
was therefore regarded as credible. Similar findings were presented by van Deventer in
her 2015 study of work engagement. The item analysis identified JC_TI1 as a potentially
problematic item. However, this is not corroborated by the factor analysis results shown
within Table 5.36 therefore all items were retained for this subscale.
5.5.1.3 Skills variety
Dimensionality analysis was conducted on the three items in the skills variety subscale of
the job characteristics scale. Similar to the findings for the autonomy and task identity
subscales the .30 cut-off value within the correlation matrix was obtained for all three of
the inter-item correlations60 and they were additionally all statistically significant (p<.05).
A KMO of .594, only marginally smaller than the set cut-off value of .60, was obtained and
pointed to a situation where this subscale may not be factor analysable due to a lack of
(or very little) common variance. This is however not corroborated by the Bartlett Test of
Sphericity (482.029; p=.00) which indicated that the null hypothesis that the correlation
matrix is an identity matrix in the population could be rejected (p<.05) (Hair et al. 2010).
60 The researcher acknowledges that the correlation between JC_SV_2 and JC_SV_1 narrowly met this criterion however this inter-item correlation still did meet the cut-off >.30.
Stellenbosch University https://scholar.sun.ac.za
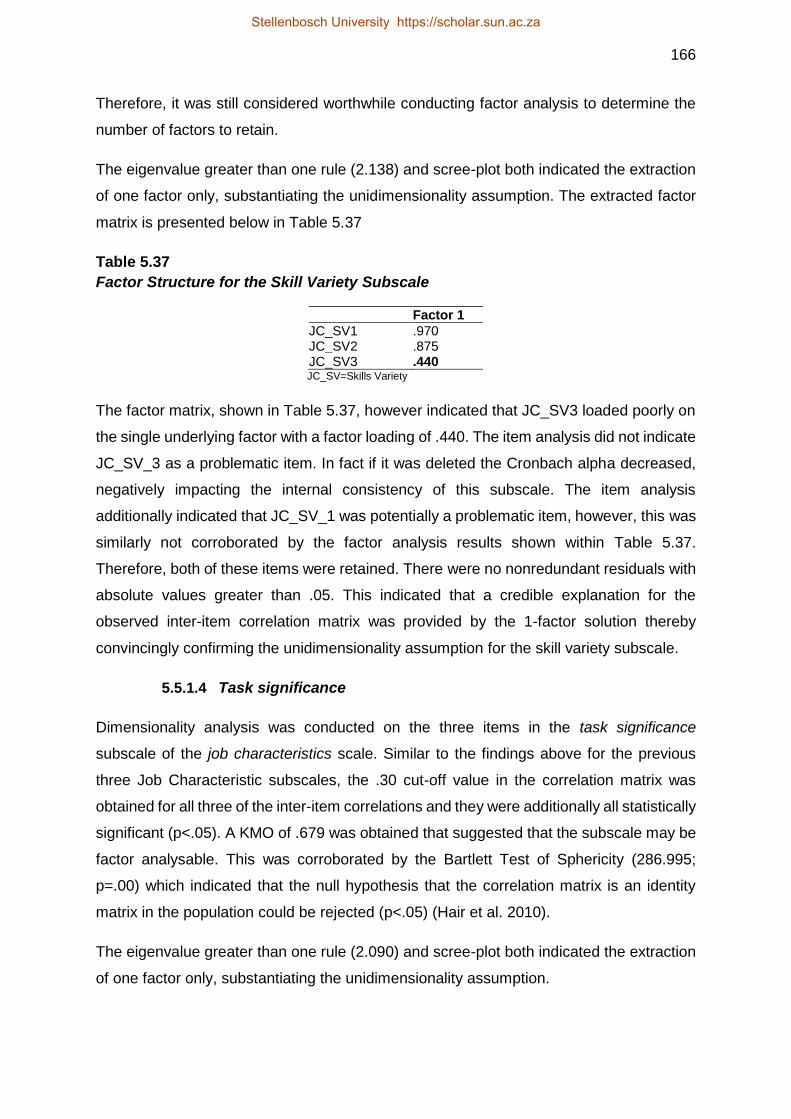
166
Therefore, it was still considered worthwhile conducting factor analysis to determine the
number of factors to retain.
The eigenvalue greater than one rule (2.138) and scree-plot both indicated the extraction
of one factor only, substantiating the unidimensionality assumption. The extracted factor
matrix is presented below in Table 5.37
Table 5.37
Factor Structure for the Skill Variety Subscale
Factor 1
JC_SV1 .970 JC_SV2 .875 JC_SV3 .440 JC_SV=Skills Variety
The factor matrix, shown in Table 5.37, however indicated that JC_SV3 loaded poorly on
the single underlying factor with a factor loading of .440. The item analysis did not indicate
JC_SV_3 as a problematic item. In fact if it was deleted the Cronbach alpha decreased,
negatively impacting the internal consistency of this subscale. The item analysis
additionally indicated that JC_SV_1 was potentially a problematic item, however, this was
similarly not corroborated by the factor analysis results shown within Table 5.37.
Therefore, both of these items were retained. There were no nonredundant residuals with
absolute values greater than .05. This indicated that a credible explanation for the
observed inter-item correlation matrix was provided by the 1-factor solution thereby
convincingly confirming the unidimensionality assumption for the skill variety subscale.
5.5.1.4 Task significance
Dimensionality analysis was conducted on the three items in the task significance
subscale of the job characteristics scale. Similar to the findings above for the previous
three Job Characteristic subscales, the .30 cut-off value in the correlation matrix was
obtained for all three of the inter-item correlations and they were additionally all statistically
significant (p<.05). A KMO of .679 was obtained that suggested that the subscale may be
factor analysable. This was corroborated by the Bartlett Test of Sphericity (286.995;
p=.00) which indicated that the null hypothesis that the correlation matrix is an identity
matrix in the population could be rejected (p<.05) (Hair et al. 2010).
The eigenvalue greater than one rule (2.090) and scree-plot both indicated the extraction
of one factor only, substantiating the unidimensionality assumption.
Stellenbosch University https://scholar.sun.ac.za
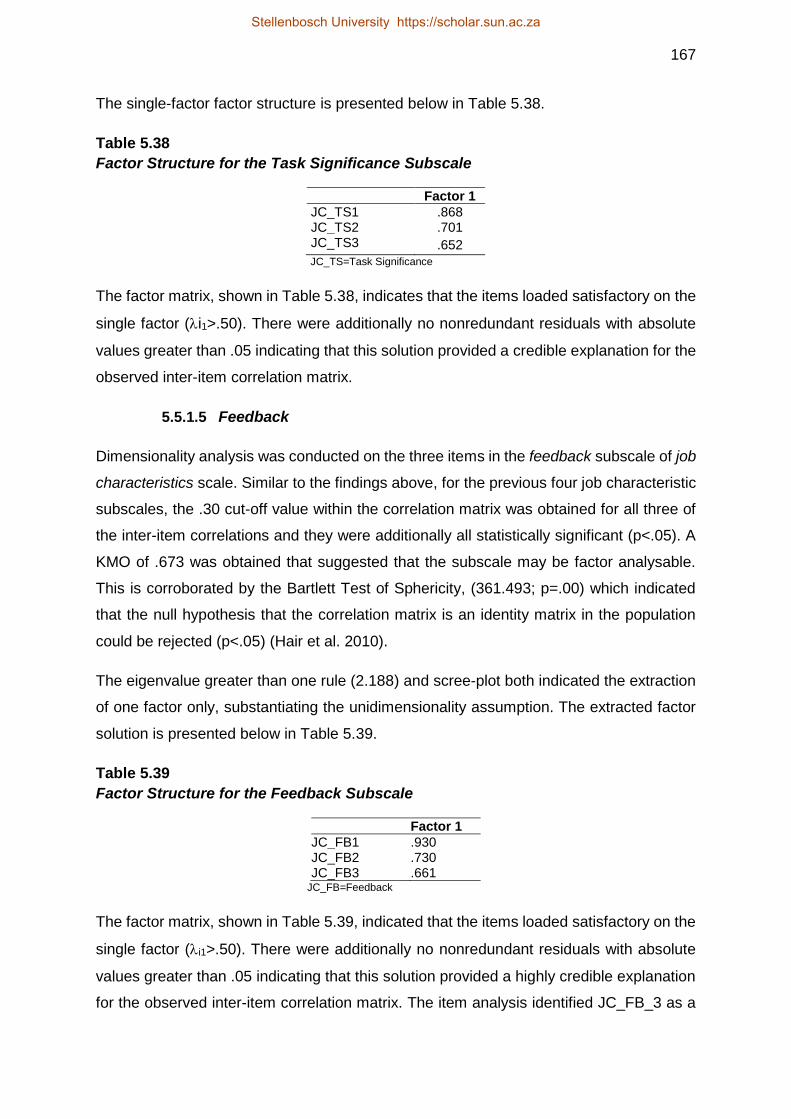
167
The single-factor factor structure is presented below in Table 5.38.
Table 5.38
Factor Structure for the Task Significance Subscale
Factor 1
JC_TS1 .868 JC_TS2 .701 JC_TS3 .652
JC_TS=Task Significance
The factor matrix, shown in Table 5.38, indicates that the items loaded satisfactory on the
single factor (i1>.50). There were additionally no nonredundant residuals with absolute
values greater than .05 indicating that this solution provided a credible explanation for the
observed inter-item correlation matrix.
5.5.1.5 Feedback
Dimensionality analysis was conducted on the three items in the feedback subscale of job
characteristics scale. Similar to the findings above, for the previous four job characteristic
subscales, the .30 cut-off value within the correlation matrix was obtained for all three of
the inter-item correlations and they were additionally all statistically significant (p<.05). A
KMO of .673 was obtained that suggested that the subscale may be factor analysable.
This is corroborated by the Bartlett Test of Sphericity, (361.493; p=.00) which indicated
that the null hypothesis that the correlation matrix is an identity matrix in the population
could be rejected (p<.05) (Hair et al. 2010).
The eigenvalue greater than one rule (2.188) and scree-plot both indicated the extraction
of one factor only, substantiating the unidimensionality assumption. The extracted factor
solution is presented below in Table 5.39.
Table 5.39
Factor Structure for the Feedback Subscale
Factor 1
JC_FB1 .930 JC_FB2 .730 JC_FB3 .661
JC_FB=Feedback
The factor matrix, shown in Table 5.39, indicated that the items loaded satisfactory on the
single factor (i1>.50). There were additionally no nonredundant residuals with absolute
values greater than .05 indicating that this solution provided a highly credible explanation
for the observed inter-item correlation matrix. The item analysis identified JC_FB_3 as a
Stellenbosch University https://scholar.sun.ac.za

168
potentially problematic item, however, it loaded satisfactorily on the single factor and it
would negatively affect the Cronbach alpha if it were to be deleted. Therefore, this item
was retained and no items were deleted from this subscale.
Individual needs
All of the items that operationalise the latent variable individual needs were retained after
the item analysis, even though certain items showed signs of being problematic61. The
dimensionality analysis was therefore conducted on all of the items in the scale. However,
the items were similarly treated as effect indicators of individual psychological ownership
need dimensions, as above with the job characteristics. Therefore, the need for a sense
of belonging, the need for a sense of self efficacy and the need for self-identity subscales
were each analysed separately.
5.5.2.1 The psychological ownership need for self-identity
Dimensionality analysis was conducted on the four items in the need for a sense of self-
identity subscale. All of the item pairs in the correlation matrix obtain correlations larger
than .30. They were all additionally statistically significant (p<.05). A KMO of .759 was
obtained and suggested that this subscale may be factor analysable. This is corroborated
by the Bartlett Test of Sphericity (538.894; p=.00) which indicated that the null hypothesis
that the correlation matrix is an identity matrix in the population could be rejected (p<.05)
(Hair et al. 2010). The correlation matrix was subsequently considered to be factor
analysable.
The eigenvalue greater than one rule (2.678) and scree-plot both indicated the extraction
of only one factor, substantiating the unidimensionality assumption. The single-factor
factor matrix is presented below in Table 5.40.
Table 5.40
Factor Structure for the Need for a Sense of Self-identity Subscale
Factor 1
PO_Need_SI_3 .913 PO_Need_SI_4 .729 PO_Need_SI_1 .685 PO_Need_SI_2 .665
PO_Need_SI=Self Identity
61 These items were PO_NeedSI_1 and PO_NeedsSI_4
Stellenbosch University https://scholar.sun.ac.za

169
The factor matrix, shown in Table 5.40, indicates that all of the items satisfactorily loaded
on a single factor (i1>.50). There were however 2 (33%) nonredundant residuals with
absolute values greater than .05. This indicated that the 1-factor structure provided a
plausible, but somewhat questionable, explanation for the observed inter-item correlation
matrix. The extraction of a second factor was therefore forced. The pattern matrix is
presented below in Table 5.41.
Table 5.41
Rotated Factor Structure (Pattern Matrix) for the Need for a Sense of Self-identity
Subscale
Factor 1 2
PO_Need_SI_3 .882 -.090 PO_Need_SI_4 .774 -.338 PO_Need_SI_1 .732 .342 PO_Need_SI_2 .655 .079
PO_Need_SI=Self Identity
It is evident from the pattern matrix that although the single factor presented some possible
problems the items all loaded significantly higher on the first factor. This provided
supporting evidence of the unidimensionality of this subscale.
The item analysis for the need for a sense of self-identity did however allude to two
problematic items, namely PO_Need_SI_2 and PO_Need_SI_4, which could be a
contributor to the potential problems with this subscales dimensionality. However, given
the fact that the deletion of these items negatively impacted the internal consistency of the
scale, (Cronbach alpha would decrease if either of these items were to be deleted) and
that all four items load satisfactorily on the single factor, all of the items were retained.
5.5.2.2 The psychological ownership need for a sense of belonging
Dimensionality analysis was conducted on the four items in the need for a sense of
belonging subscale. All of the item pairs in the correlation matrix obtained correlations
larger than .30. The inter-item correlations were all additionally statistically significant
(p<.05). A KMO of .787 was obtained that suggested that this subscale may be factor
analysable. This was corroborated by the Bartlett Test of Sphericity (447.364; p=.00)
which indicated that the null hypothesis that the correlation matrix is an identity matrix in
the population could be rejected (p<.05) (Hair et al. 2010). The correlation matrix was
subsequently considered to be factor analysable.
Stellenbosch University https://scholar.sun.ac.za

170
The eigenvalue greater than one rule (2.590) and scree-plot both indicated the extraction
of only one factor, substantiating the unidimensionality assumption. The extracted factor
structure is presented below in Table 5.42.
Table 5.42
Factor Structure for the Need for a Sense of Belonging Subscale
Factor 1
PO_Need_SOB_2 .816 PO_Need_SOB_3 .737 PO_Need_SOB_4 .700 PO_Need_SOB_1 .659 PO_Need_SOB=Sense of Belonging
Table 5.42 indicates that all of the items loaded satisfactorily on the single factor (i1>.50).
There were no (0%) nonredundant residuals with absolute values greater than .05
indicating that the single-factor solution provided a highly credible explanation for the
observed inter-item correlation matrix.
5.5.2.3 Psychological ownership need for a sense of self-efficacy and
effectance
Dimensionality analysis was conducted on the four items in the need for self-efficacy and
effectance subscale. Similar to the findings above, all of the item pairs in the correlation
matrix obtain correlations larger than .30. All inter-item correlations were additionally
statistically significant (p<.05). A KMO of .780 was obtained that suggested that the
subscale may be factor analysable. This was corroborated by the Bartlett Test of
Sphericity (494.623; p=.00) which indicated that the null hypothesis that the correlation
matrix is an identity matrix in the population could be rejected (p<.05) (Hair et al. 2010).
The eigenvalue greater than one rule (2.653) and scree-plot both indicated the extraction
of one factor only, substantiating the unidimensionality assumption. The extracted factor
structure is presented below in Table 5.43.
Table 5.43
Factor Structure for the Need for a Sense of Self-efficacy and Effectance Subscale
Factor 1
PO_Need_SE_3 .851 PO_Need_SE_2 .723 PO_Need_SE_1 .704 PO_Need_SE_4 .692
PO_Need_SE=Self efficacy/effectance
Stellenbosch University https://scholar.sun.ac.za

171
Table 5.43 indicates that all of the items satisfactorily loaded on the single factor (>.50).
There was only 1 (16%) nonredundant residual with an absolute value greater than .05
indicating that this solution provides a plausible explanation for the observed inter-item
correlation matrix.
Psychological safety
Dimensionality analysis was conducted on all five of the psychological safety items.
Correlations larger than .30 were obtained for all of the items pairs and all correlations
were statistically significant (p<.05). The psychological safety subscale obtained a KMO
of .839 indicating that the subscale could be factor analysable (>.60). This assumption
is corroborated by the Bartlett Test of Sphericity (981.141; p=.00) which indicated that
the null hypothesis that the correlation matrix is an identity matrix in the population could
be rejected (p<.05). The eigenvalue greater than one rule (3.493) and scree-plot both
indicated the extraction of one factor only, substantiating the unidimensionality
assumption. The factor matrix presented in Table 5.44 below indicated that all the items
satisfactorily load onto the single extracted factor (i1>.50).
Table 5.44
Factor Structure for the Psychological Safety Subscale
Factor 1
PS_5 .891 PS_2 .849 PS_1 .773 PS_3 .771 PS_4 .659
PS=Psychological Safety
There were however 3 (30%) nonredundant residuals with an absolute value greater than
.05 indicating that this 1-factor solution is a satisfactorily plausible, but somewhat
questionable solution. The extraction of a second factor was therefore forced. The rotated
factor structure is presented below in Table 5.45.
Table 5.45
Rotated Factor Structure (Pattern Matrix) for the Psychological Safety Subscale
Factor 1 2
PS_1 .847 -.047 PS_2 .843 .036 PS_3 .743 .052 PS_4 -.051 .825 PS_5 .293 .690 PS=Psychological Safety
Stellenbosch University https://scholar.sun.ac.za

172
There were no (0%) nonredundant residuals with absolute values greater than .05
indicating that the solution provided a highly credible explanation for the observed inter-
item correlation matrix. The pattern matrix highlighted that items PS_1, PS_2 and PS_3
loaded on the first factor and PS_4 and PS_5 loaded on a second factor. This did not align
with the original unidimensional conceptualisation of this latent variable in Chapter 2.
However, upon deeper investigation of the wording of the individual items it was deduced
that the first factor resembled aspects of an individual’s ability to express true feelings
within the workplace and the second factor spoke to the expression of thoughts and
opinions without ridicule. It was therefore decided that these factors perhaps relate to
nuanced aspects of psychological safety and since the items do still load satisfactorily on
a single factor it can be deduced that these items successfully measure psychological
safety as a second order factor62.
The item analysis indicated that PS_4 could potentially be a problematic item. However,
as can be seen from Table 5.44 it loads satisfactorily on the single factor63 (>.50) and was
therefore retained. PS_4 could possibly have come to the fore as a potentially problematic
item in the item analysis because it quite strongly reflects the second, less dominant, factor
and only to a very limited degree the first factor.
The three routes to psychological ownership
Dimensionality analysis was similarly conducted on each of the three routes to
psychological ownership separately namely self-investment, intimate knowledge and
control. The results of this analysis are presented below.
5.5.4.1 Self-investment
Dimensionality analysis was conducted on the four-item self-investment sub-scale.
Correlations larger than .30 were obtained for all of the items pairs and they were
additionally all statistically significant (p<.05). A KMO of .770 (>.60) (Tabachnick & Fidell,
2014) confirmed that the correlations in the correlation matrix were suitable for factor
analysis. The factor analysability assumption was further corroborated by the Bartlett Test
of Sphericity (674.132; p=.00) which indicated that the null hypothesis that the correlation
matrix is an identity matrix in the population could be rejected (p<.05). The eigenvalue
62 The ideal would have been to explicitly fit a second-order measurement model via LISREL and to test the
significance of the first-order (ij) and second-order factor loadings (j1). 63 The researcher does acknowledge that it is the lowest loading.
Stellenbosch University https://scholar.sun.ac.za
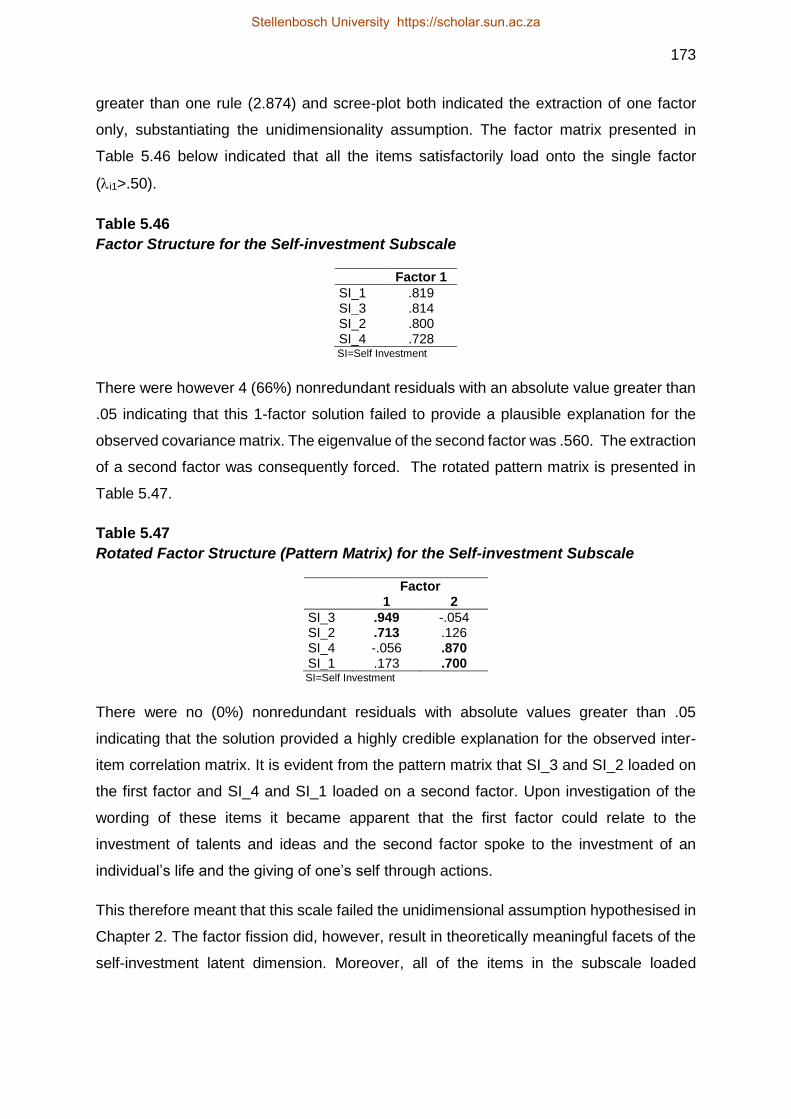
173
greater than one rule (2.874) and scree-plot both indicated the extraction of one factor
only, substantiating the unidimensionality assumption. The factor matrix presented in
Table 5.46 below indicated that all the items satisfactorily load onto the single factor
(i1>.50).
Table 5.46
Factor Structure for the Self-investment Subscale
Factor 1
SI_1 .819 SI_3 .814 SI_2 .800 SI_4 .728 SI=Self Investment
There were however 4 (66%) nonredundant residuals with an absolute value greater than
.05 indicating that this 1-factor solution failed to provide a plausible explanation for the
observed covariance matrix. The eigenvalue of the second factor was .560. The extraction
of a second factor was consequently forced. The rotated pattern matrix is presented in
Table 5.47.
Table 5.47
Rotated Factor Structure (Pattern Matrix) for the Self-investment Subscale
Factor 1 2
SI_3 .949 -.054 SI_2 .713 .126 SI_4 -.056 .870 SI_1 .173 .700 SI=Self Investment
There were no (0%) nonredundant residuals with absolute values greater than .05
indicating that the solution provided a highly credible explanation for the observed inter-
item correlation matrix. It is evident from the pattern matrix that SI_3 and SI_2 loaded on
the first factor and SI_4 and SI_1 loaded on a second factor. Upon investigation of the
wording of these items it became apparent that the first factor could relate to the
investment of talents and ideas and the second factor spoke to the investment of an
individual’s life and the giving of one’s self through actions.
This therefore meant that this scale failed the unidimensional assumption hypothesised in
Chapter 2. The factor fission did, however, result in theoretically meaningful facets of the
self-investment latent dimension. Moreover, all of the items in the subscale loaded
Stellenbosch University https://scholar.sun.ac.za

174
satisfactorily onto the single factor. It is suggested that the subscale items could be
interpreted as successfully reflecting self-investment seen as a second-order factor64
5.5.4.2 Intimate knowledge
Dimensionality analysis was conducted on the four-item intimate knowledge sub-scale.
Correlations larger than .30 were obtained for all of the items pairs and all of the inter-item
correlations were additionally statistically significant (p<.05). A KMO of .747 (Tabachnick
& Fidell, 2014) confirmed that the correlation matrix was suitable for factor analysis (>.60).
The factor analysability assumption was further corroborated by the Bartlett Test of
Sphericity (673.035; p=.00) which indicated that the null hypothesis that the correlation
matrix is an identity matrix in the population could be rejected (p<.05).
The eigenvalue greater than one rule (2.879) and scree-plot both indicated the extraction
of one factor only, substantiating the unidimensionality assumption. The factor matrix,
presented in Table 5.48 below, indicates that all the items satisfactorily loaded onto a
single factor (>.50).
Table 5.48
Factor Structure for the Intimate Knowledge Subscale
Factor 1
IK_3 .825 IK_2 .796 IK_4 .773 IK_1 .772 IK=Intimate Knowledge
There were however 4 (66%) nonredundant residuals with an absolute value greater than
0.05 indicating that this 1-factor solution failed to provide a plausible explanation for the
observed covariance matrix. The eigenvalue of the second factor was .497. The extraction
of a second factor was therefore forced. The rotated pattern matrix is presented in Table
5.49.
64 The ideal would have been to explicitly fit a second-order measurement model via LISREL and to test the
significance of the first-order (ij) and second-order factor loadings (j1).
Stellenbosch University https://scholar.sun.ac.za

175
Table 5.49
Rotated Factor Structure (Pattern Matrix) for the Intimate Knowledge Subscale
Factor 1 2
IK_2 1.014 -.063 IK_3 .511 .354 IK_4 -.049 .991 IK_1 .355 .461
IK=Intimate Knowledge
There were no (0%) nonredundant residuals with absolute values greater than .05
indicating that the solution provided a highly credible explanation for the observed inter-
item correlation matrix. It was evident from the pattern matrix that IK_2 and IK_3 loaded
satisfactorily on the first factor while IK_4 and IK_1 loaded on the second (with IK_1
loading somewhat poorly). Upon deeper investigation of the wording of these items it can
be deduced that the first factor relates to aspects of broader understanding of a job while
the second factors speaks to a depth of knowledge and deep understanding of the work
that is required. This therefore meant that this scale failed to corroborate the
unidimensional assumption hypothesised in Chapter 2.
The factor fission did, however, result in theoretically meaningful facets of the intimate
knowledge latent dimension. Moreover, all of the items in the subscale load satisfactorily
onto the single factor. This similarly suggested that the subscale items could still be
interpreted as successfully reflecting intimate knowledge seen as a second-order factor65
5.5.4.3 Control
Dimensionality analysis was conducted on the six-item control sub-scale. Correlations
larger than .30 were obtained for all of the items pairs and all of the inter-item correlations
were additionally statistically significant (p<.05). A KMO of .747 (>.60) (Tabachnick &
Fidell, 2014) confirmed that the correlations in the correlation matrix were suitable for
factor analysis (>.60). The factor analysability assumption was further corroborated by the
Bartlett Test of Sphericity (1310.209; p=.00) which indicated that the null hypothesis that
the correlation matrix is an identity matrix in the population could be rejected (p<.05).
The eigenvalue greater than one rule (4.133) and scree-plot both indicated the extraction
of one factor only, substantiating the unidimensionality assumption. The factor matrix
65 The ideal would have been to explicitly fit a second-order measurement model via LISREL and to
test the significance of the first-order (ij) and second-order factor loadings (j1).
Stellenbosch University https://scholar.sun.ac.za

176
presented in Table 5.50 below indicated that all the items loaded satisfactorily onto the
single factor (i1>.50).
Table 5.50
Factor Structure for the Control Subscale
Factor 1
C_4 .829 C_5 .824 C_3 .813 C_2 .807 C_6 .750 C_1 .725
C=Control
There were however 9 (60%) nonredundant residuals with an absolute value greater than
.05. indicating that this 1-factor solution failed to provide a plausible explanation for the
observed covariance matrix. The eigenvalue of the second factor was .702. The extraction
of a second factor was therefore forced. The rotated pattern matrix is presented in Table
5.51.
Table 5.51
Rotated Factor Structure (Pattern Matrix) for the Control Subscale
Factor 1 2
C_2 .915 .062 C_3 .843 -.013 C_1 .731 -.027 C_5 .514 -.354 C_6 -.063 -.946 C_4 .147 -.782
C=Control
There were no (0%) nonredundant residuals with absolute values greater than .05
indicating that the solution provided a highly credible explanation for the observed inter-
item correlation matrix. It is evident from the pattern matrix, in Table 5.51 above, that C_2,
C_3, C_1 and C_5 load on the first factor and C_6 and C_4 load on the second factor.
Upon deeper inspection of the individual items it became clear that the differences
pertained to ‘what’ and ‘how’ versus ‘when’, in terms of an individual’s control of the job or
work. Items C_2, C_3, C_1 and C_5 pertain to an element of control in terms of how tasks
were done and an individual’s sense that they could provide input into decisions pertaining
to how the job should be done. C_6 and C_4 on the other hand refer to aspects of
scheduling and pace and therefore relate more to controlling the timing of tasks as
opposed to controlling of tasks themselves.
Stellenbosch University https://scholar.sun.ac.za

177
This therefore meant that this scale failed to corroborate a unidimensional assumption
hypothesised in Chapter 2. However, since all the items loaded satisfactorily onto the
single factor, this similarly suggested that the subscale items could be interpreted as
successful indicators of control seen as a second-order factor66
Psychological ownership
Dimensionality analysis was conducted on the six-item psychological ownership subscale.
Correlations larger than .30 were obtained for all of the items pairs and all of the inter-item
correlations were additionally statistically significant (p<.05). A KMO of .889 (>.60)
(Tabachnick & Fidell, 2014) confirmed that the correlation matrix was suitable for factor
analysis. The factor analysability assumption was further corroborated by the Bartlett Test
of Sphericity (1842.500; p=.00) which indicated that the null hypothesis that the correlation
matrix is an identity matrix in the population could be rejected (p<.05).
The eigenvalue greater than one rule (4.671) and scree-plot both indicated the extraction
of one factor only, substantiating the unidimensionality assumption. The factor matrix
presented in Table 5. 52 below indicates that all the items satisfactorily load onto the single
extracted factor (>.50).
Table 5.52
Factor Structure for the Psychological Ownership Subscale
Factor 1
PO_3 .906 PO_4 .900 PO_2 .869 PO_1 .853 PO_5 .832 PO_6 .779 PO=Psychological Ownership
There were additionally only 2 (13%) nonredundant residuals with an absolute value
greater than .05 indicating that the 1-factor solution provided a satisfactorily plausible
explanation for the observed inter-item correlation matrix.
66The ideal would have been to explicitly fit a second-order measurement model via LISREL and to test the
significance of the first-order (ij) and second-order factor loadings (j1).
Stellenbosch University https://scholar.sun.ac.za
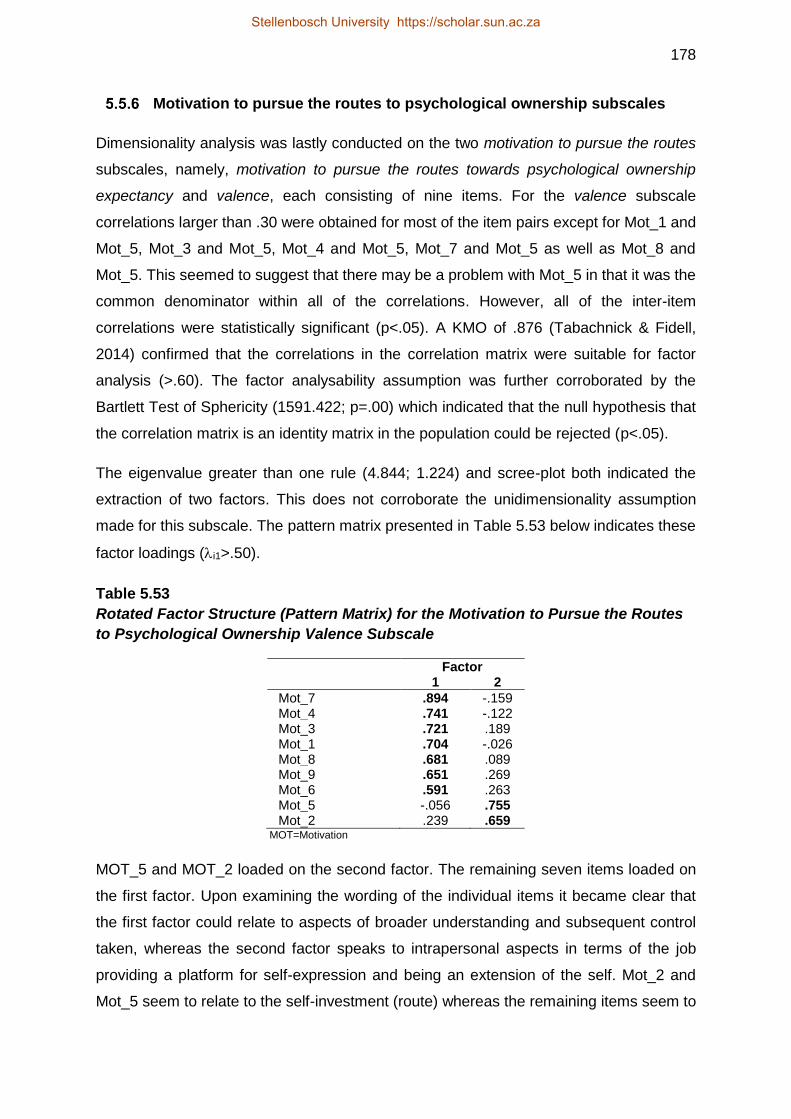
178
Motivation to pursue the routes to psychological ownership subscales
Dimensionality analysis was lastly conducted on the two motivation to pursue the routes
subscales, namely, motivation to pursue the routes towards psychological ownership
expectancy and valence, each consisting of nine items. For the valence subscale
correlations larger than .30 were obtained for most of the item pairs except for Mot_1 and
Mot_5, Mot_3 and Mot_5, Mot_4 and Mot_5, Mot_7 and Mot_5 as well as Mot_8 and
Mot_5. This seemed to suggest that there may be a problem with Mot_5 in that it was the
common denominator within all of the correlations. However, all of the inter-item
correlations were statistically significant (p<.05). A KMO of .876 (Tabachnick & Fidell,
2014) confirmed that the correlations in the correlation matrix were suitable for factor
analysis (>.60). The factor analysability assumption was further corroborated by the
Bartlett Test of Sphericity (1591.422; p=.00) which indicated that the null hypothesis that
the correlation matrix is an identity matrix in the population could be rejected (p<.05).
The eigenvalue greater than one rule (4.844; 1.224) and scree-plot both indicated the
extraction of two factors. This does not corroborate the unidimensionality assumption
made for this subscale. The pattern matrix presented in Table 5.53 below indicates these
factor loadings (i1>.50).
Table 5.53
Rotated Factor Structure (Pattern Matrix) for the Motivation to Pursue the Routes
to Psychological Ownership Valence Subscale
Factor 1 2
Mot_7 .894 -.159 Mot_4 .741 -.122 Mot_3 .721 .189 Mot_1 .704 -.026 Mot_8 .681 .089 Mot_9 .651 .269 Mot_6 .591 .263 Mot_5 -.056 .755 Mot_2 .239 .659
MOT=Motivation
MOT_5 and MOT_2 loaded on the second factor. The remaining seven items loaded on
the first factor. Upon examining the wording of the individual items it became clear that
the first factor could relate to aspects of broader understanding and subsequent control
taken, whereas the second factor speaks to intrapersonal aspects in terms of the job
providing a platform for self-expression and being an extension of the self. Mot_2 and
Mot_5 seem to relate to the self-investment (route) whereas the remaining items seem to
Stellenbosch University https://scholar.sun.ac.za

179
speak to forms of effort in terms of understanding and control. The fact that the third route
item (Mot_8) of self-investment did not load sufficiently on the second factor was a surprise
to the researcher67. There were additionally 18 (50.0%) nonredundant residuals with
absolute values greater than .05 pointing to the failure of this 2-factor solution to provide
a plausible explanation for the observed covariance matrix.
A three-factor solution was subsequently forced. The resultant pattern matrix is shown in
Table 5.54.
Table 5.54
Rotated 3-Factor Factor Structure (Pattern Matrix) for the Motivation to Pursue the
Routes to Psychological Ownership Valence Subscale
Factor 1 2 3
Mot_7 .810 -.057 -.106 Mot_4 .786 .008 .043 Mot_1 .691 .087 -.016 Mot_5 -.073 .831 .026 Mot_2 .157 .691 -.091 Mot_6 -.088 .012 -.893 Mot_9 -.024 .029 -.886 Mot_3 .231 .053 -.627 Mot_8 .296 .006 -.484
MOT=Motivation
Three items loaded on the first factor (MOT_7, MOT_4 and MOT_1), two items loaded on
factor 2 (MOT_5 and MOT_2 and four items loaded on factor 3 (MOT_6, MOT_9, MOT_3
and MOT_8). Inspection of the wording of these three sets of items highlighted that the
first factor seems to relate to the intimate knowledge valence component of motivation
(being intimately familiar with one’s job, having depth of knowledge). The second factor
relates to the self-investment valence component of motivation, in that the items attempt
to determine if an individual experiences the job as an extension of who they are. The
third factor relates to aspects of control and attempts to determine an individual’s level of
or ability to control and make decisions pertaining to how the job is done. It comes as a
surprise to the researcher that Mot_8 did not fall under the second factor. However, upon
closer inspection of the wording it does seem to point towards aspects of control in that in
exerting effort and seeing it come to fruition one could posit that this effort might require a
certain degree of control, hence it’s loading on the third factor.
67 The trend within the factor loadings and the wording of the individual items speaks to the three factor model.
Stellenbosch University https://scholar.sun.ac.za

180
None (0%) of the residual correlations were large. The three-factor factor solution
therefore provided a credible explanation for the observed inter-item correlation matrix.
A one factor solution was subsequently forced to determine if all of the items could load
satisfactorily onto the single factor, thereby providing evidence that the subscale items
could be interpreted as indicators of Motivation to Pursue the Routes to Psychological
Ownership Valence. The results of which are presented below in Table 5.55.
Table 5.55
Factor Structure (Forced One Factor) for the Motivation to Pursue the Routes to
Psychological Ownership Valence Subscale
Factor 1
Mot_3 .830 Mot_9 .812 Mot_7 .750 Mot_6 .749 Mot_8 .724 Mot_1 .666 Mot_4 .635 Mot_2 .616 Mot_5 .388
Mot=Motivation
There were 17 (47.0%) nonredundant residuals with absolute values greater than 0.05,
indicating that this 1-factor solution failed to provide a plausible explanation for the
observed covariance matrix. It is evident from Table 5.55 above that all of the items load
satisfactorily on a single factor, except for Mot_5. This item was identified as a problematic
item during the item analysis however further analysis was necessary before taking a
decision pertaining to its deletion.
The statistics were a lot more promising for the motivation to pursue the routes to
psychological ownership expectancy subscale. All correlations were larger than .30 and
all inter-item correlations were additionally statistically significant. A KMO of .857
(Tabachnick & Fidell, 2014) confirmed that the correlations in the correlation matrix were
suitable for factor analysis (>.60). The factor analysability assumption was further
corroborated by the Bartlett Test of Sphericity (2170.589; p=.00) which indicated that the
null hypothesis that the correlation matrix is an identity matrix in the population could be
rejected (p<.05).
The eigenvalue greater than one rule (5.172, 1.198, and 1.114) and scree-plot both
indicated the extraction of three factors (the amount of variance explained by each factor
was 53%, 13% and 9% respectively). This did not corroborate the unidimensionality
Stellenbosch University https://scholar.sun.ac.za
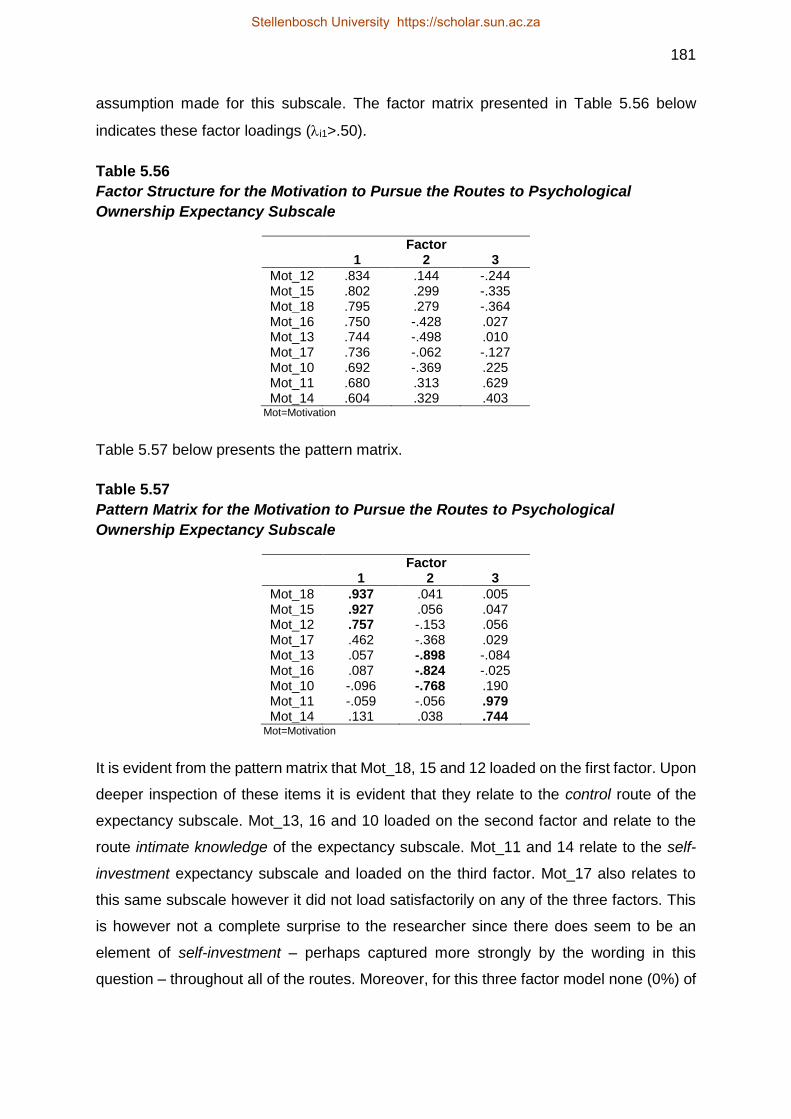
181
assumption made for this subscale. The factor matrix presented in Table 5.56 below
indicates these factor loadings (i1>.50).
Table 5.56
Factor Structure for the Motivation to Pursue the Routes to Psychological
Ownership Expectancy Subscale
Factor
1 2 3
Mot_12 .834 .144 -.244 Mot_15 .802 .299 -.335 Mot_18 .795 .279 -.364 Mot_16 .750 -.428 .027 Mot_13 .744 -.498 .010 Mot_17 .736 -.062 -.127 Mot_10 .692 -.369 .225 Mot_11 .680 .313 .629 Mot_14 .604 .329 .403
Mot=Motivation
Table 5.57 below presents the pattern matrix.
Table 5.57
Pattern Matrix for the Motivation to Pursue the Routes to Psychological
Ownership Expectancy Subscale
Factor
1 2 3
Mot_18 .937 .041 .005 Mot_15 .927 .056 .047 Mot_12 .757 -.153 .056 Mot_17 .462 -.368 .029 Mot_13 .057 -.898 -.084 Mot_16 .087 -.824 -.025 Mot_10 -.096 -.768 .190 Mot_11 -.059 -.056 .979 Mot_14 .131 .038 .744
Mot=Motivation
It is evident from the pattern matrix that Mot_18, 15 and 12 loaded on the first factor. Upon
deeper inspection of these items it is evident that they relate to the control route of the
expectancy subscale. Mot_13, 16 and 10 loaded on the second factor and relate to the
route intimate knowledge of the expectancy subscale. Mot_11 and 14 relate to the self-
investment expectancy subscale and loaded on the third factor. Mot_17 also relates to
this same subscale however it did not load satisfactorily on any of the three factors. This
is however not a complete surprise to the researcher since there does seem to be an
element of self-investment – perhaps captured more strongly by the wording in this
question – throughout all of the routes. Moreover, for this three factor model none (0%) of
Stellenbosch University https://scholar.sun.ac.za

182
the nonredundant residuals obtained absolute values greater than .05. Therefore, this
model provides a very convincing explanation for the observed correlation matrix.
A one factor solution was subsequently forced to determine whether the items in question
may be considered to be successful indicators of a higher-order motivation to pursue the
routes to psychological ownership expectancy factor. The 1-factor, factor structure, is
shown in Table 5.58.
Table 5.58
Factor Structure (Forced One Factor) for the Motivation to Pursue the Routes to
Psychological Ownership Expectancy Subscale
Factor 1
Mot_12 .843 Mot_15 .784 Mot_18 .776 Mot_17 .755 Mot_16 .736 Mot_13 .719 Mot_10 .676 Mot_11 .612 Mot_14 .574 Mot=Motivation
It is evident from Table 5.58 above that all of the items loaded satisfactorily on the single
factor. However, 47% of the nonredundant residuals still obtained absolute values greater
than .05. Again failing to provide a very convincing explanation of the covariance matrix.
It seemed possible to suggest that another, perhaps more general factor, was influencing
this model and that it might be more prudent to investigate the routes as individual
unidimensional constructs within the two motivational areas of valence and expectancy.
This factor structure would therefore point to a six factor construct68. Further analysis in
the form of CFA was conducted to provide corroboratory evidence for the factor structure
of this complex construct. The following section presents the results of the CFA analysis
on the multidimensional constructs within the proposed psychological ownership structural
model.
68 This six factor structure would therefore represent the motivation to pursue the routes to psychological ownership valence (Mot_Val) and expectancy (Mot_Exp) subscales, coupled with the routes, namely self investment, control and intimate knowledge (Mot_Val_SI, Mot_Val_C and Mot_Val_IK as well as Mot_Exp_SI, Mot_Exp_C and Mot_Exp_IK.
Stellenbosch University https://scholar.sun.ac.za

183
5.6 CONFIRMATORY FACTOR ANALYSIS ON MULTI-DIMENSIONAL
MEASUREMENT SCALES
Confirmatory factor analysis (CFA) is a very sophisticated technique used to “test a theory
about latent processes” (Tabachnick & Fidell, 2014, p. 662). The above item and
dimensionality analysis conducted on the job characteristics, individual’s psychological
ownership needs (roots) and the routes towards psychological ownership69, as well as
motivation to pursue the routes towards psychological ownership subscales did not allow
for the testing of the assumption that the 15-item, 12-item, 14-item and 18-item scales,
developed to reflect these latent variables, adequately operationalised them given their
multi-dimensional constitutive definitions. This therefore meant that the foregoing
analyses were not sufficient in testing the assumptions theorised in Chapter 2.
This subsequently lead to the conclusion that it would be prudent to conduct CFA on the
job characteristics, both the roots and the routes subscales as well as the motivation to
pursue the routes subscales, to provide further indications as to the psychometric quality
of these scales, prior to fitting the measurement model explicating the operationalisation
of the structural model. Therefore, although Fabrigar, MacCallum, Wegener, and Strahan,
(1999) caution against the use of CFA post EFA (with the purpose of confirming EFA
results) the CFA results70 will be presented for each scale below in sections 5.6.1 to 5.6.4
respectively.
Measurement model fit for the job characteristics scale
The measurement model fit in this case refers to the quality of the operationalisation of
the five job characteristics namely autonomy, task identity, task significance, skill variety
and feedback by the 15-item job characteristics scale developed to represent this latent
variable job characteristics. Figure 5.1 displays a visual representation of the fitted job
characteristics measurement model. Furthermore, the overall fit statistics are presented
below in Table 5.63. The goodness-of-fit statistics provided an opportunity to test the exact
fit and the close fit null hypothesis for the measurement model.
69 The researcher acknowledges that the routes are treated as separate latent variables within the proposed psychological ownership model. However they are treated as a single subscale within the CJBPOS and therefore the researcher felt that conducted CFA would be prudent. 70 These results have been reported very succinctly and a more detailed discussion pertaining to the fit statistics and the theoretical basis for their use and cut-offs will be provided during the interpretation of the fitting of the psychological ownership measurement and structural models.
Stellenbosch University https://scholar.sun.ac.za
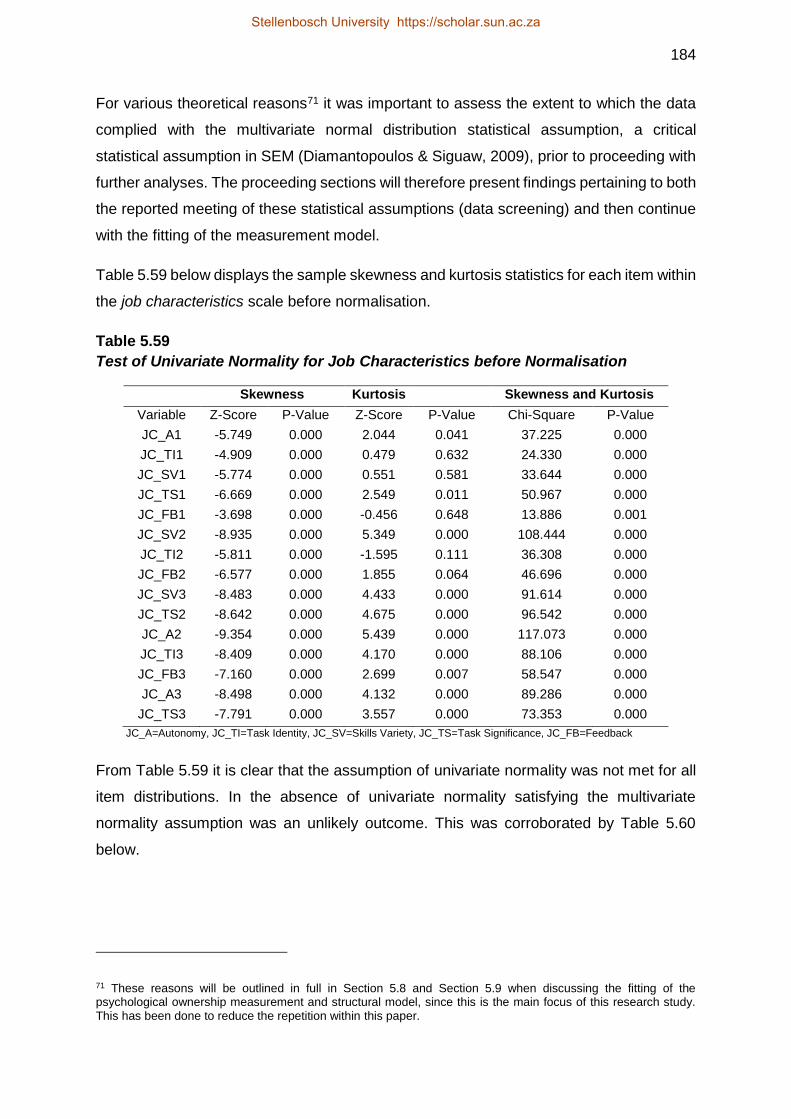
184
For various theoretical reasons71 it was important to assess the extent to which the data
complied with the multivariate normal distribution statistical assumption, a critical
statistical assumption in SEM (Diamantopoulos & Siguaw, 2009), prior to proceeding with
further analyses. The proceeding sections will therefore present findings pertaining to both
the reported meeting of these statistical assumptions (data screening) and then continue
with the fitting of the measurement model.
Table 5.59 below displays the sample skewness and kurtosis statistics for each item within
the job characteristics scale before normalisation.
Table 5.59
Test of Univariate Normality for Job Characteristics before Normalisation
Skewness Kurtosis
Skewness and Kurtosis
Variable Z-Score P-Value Z-Score P-Value Chi-Square P-Value
JC_A1 -5.749 0.000 2.044 0.041 37.225 0.000
JC_TI1 -4.909 0.000 0.479 0.632 24.330 0.000
JC_SV1 -5.774 0.000 0.551 0.581 33.644 0.000
JC_TS1 -6.669 0.000 2.549 0.011 50.967 0.000
JC_FB1 -3.698 0.000 -0.456 0.648 13.886 0.001
JC_SV2 -8.935 0.000 5.349 0.000 108.444 0.000
JC_TI2 -5.811 0.000 -1.595 0.111 36.308 0.000
JC_FB2 -6.577 0.000 1.855 0.064 46.696 0.000
JC_SV3 -8.483 0.000 4.433 0.000 91.614 0.000
JC_TS2 -8.642 0.000 4.675 0.000 96.542 0.000
JC_A2 -9.354 0.000 5.439 0.000 117.073 0.000
JC_TI3 -8.409 0.000 4.170 0.000 88.106 0.000
JC_FB3 -7.160 0.000 2.699 0.007 58.547 0.000
JC_A3 -8.498 0.000 4.132 0.000 89.286 0.000
JC_TS3 -7.791 0.000 3.557 0.000 73.353 0.000
JC_A=Autonomy, JC_TI=Task Identity, JC_SV=Skills Variety, JC_TS=Task Significance, JC_FB=Feedback
From Table 5.59 it is clear that the assumption of univariate normality was not met for all
item distributions. In the absence of univariate normality satisfying the multivariate
normality assumption was an unlikely outcome. This was corroborated by Table 5.60
below.
71 These reasons will be outlined in full in Section 5.8 and Section 5.9 when discussing the fitting of the psychological ownership measurement and structural model, since this is the main focus of this research study. This has been done to reduce the repetition within this paper.
Stellenbosch University https://scholar.sun.ac.za
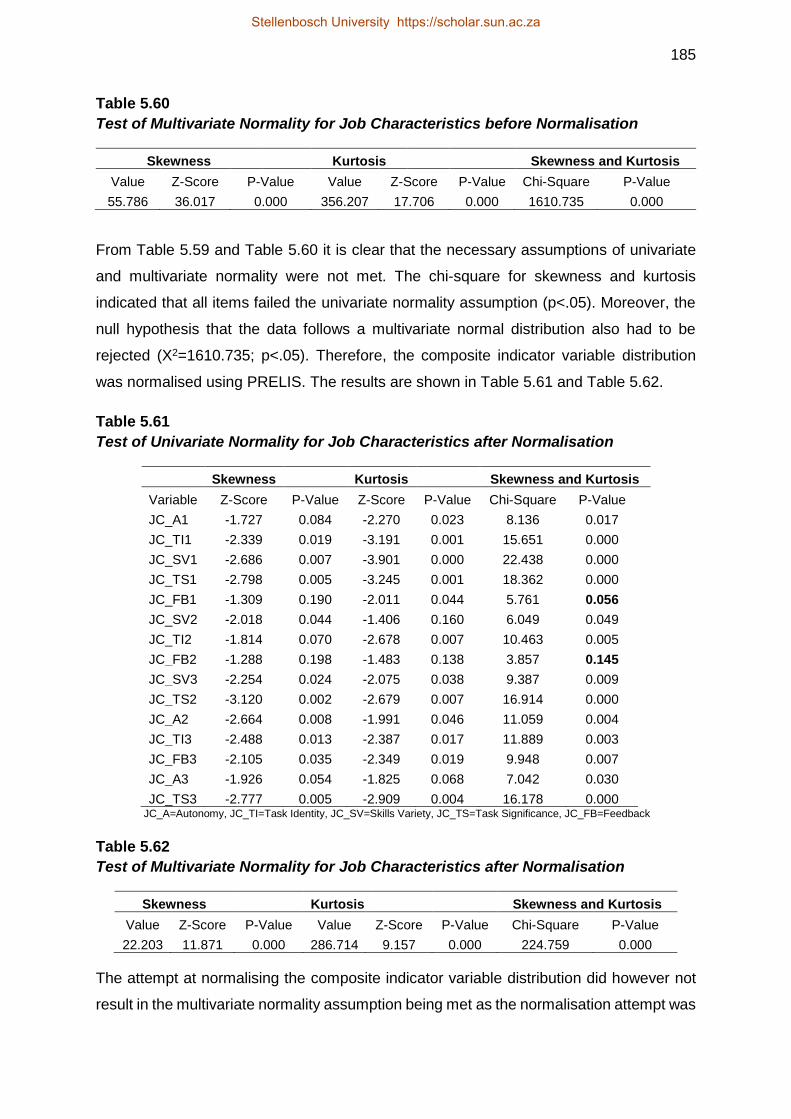
185
Table 5.60
Test of Multivariate Normality for Job Characteristics before Normalisation
Skewness Kurtosis Skewness and Kurtosis
Value Z-Score P-Value Value Z-Score P-Value Chi-Square P-Value
55.786 36.017 0.000 356.207 17.706 0.000 1610.735 0.000
From Table 5.59 and Table 5.60 it is clear that the necessary assumptions of univariate
and multivariate normality were not met. The chi-square for skewness and kurtosis
indicated that all items failed the univariate normality assumption (p<.05). Moreover, the
null hypothesis that the data follows a multivariate normal distribution also had to be
rejected (X2=1610.735; p<.05). Therefore, the composite indicator variable distribution
was normalised using PRELIS. The results are shown in Table 5.61 and Table 5.62.
Table 5.61
Test of Univariate Normality for Job Characteristics after Normalisation
Skewness Kurtosis Skewness and Kurtosis
Variable Z-Score P-Value Z-Score P-Value Chi-Square P-Value
JC_A1 -1.727 0.084 -2.270 0.023 8.136 0.017
JC_TI1 -2.339 0.019 -3.191 0.001 15.651 0.000
JC_SV1 -2.686 0.007 -3.901 0.000 22.438 0.000
JC_TS1 -2.798 0.005 -3.245 0.001 18.362 0.000
JC_FB1 -1.309 0.190 -2.011 0.044 5.761 0.056
JC_SV2 -2.018 0.044 -1.406 0.160 6.049 0.049
JC_TI2 -1.814 0.070 -2.678 0.007 10.463 0.005
JC_FB2 -1.288 0.198 -1.483 0.138 3.857 0.145
JC_SV3 -2.254 0.024 -2.075 0.038 9.387 0.009
JC_TS2 -3.120 0.002 -2.679 0.007 16.914 0.000
JC_A2 -2.664 0.008 -1.991 0.046 11.059 0.004
JC_TI3 -2.488 0.013 -2.387 0.017 11.889 0.003
JC_FB3 -2.105 0.035 -2.349 0.019 9.948 0.007
JC_A3 -1.926 0.054 -1.825 0.068 7.042 0.030
JC_TS3 -2.777 0.005 -2.909 0.004 16.178 0.000 JC_A=Autonomy, JC_TI=Task Identity, JC_SV=Skills Variety, JC_TS=Task Significance, JC_FB=Feedback
Table 5.62
Test of Multivariate Normality for Job Characteristics after Normalisation
Skewness Kurtosis Skewness and Kurtosis
Value Z-Score P-Value Value Z-Score P-Value Chi-Square P-Value
22.203 11.871 0.000 286.714 9.157 0.000 224.759 0.000
The attempt at normalising the composite indicator variable distribution did however not
result in the multivariate normality assumption being met as the normalisation attempt was
Stellenbosch University https://scholar.sun.ac.za

186
not fully successful. It did result in an improvement in the symmetry and kurtosis of the
indicator variable distributions, but did not completely salvage the situation. The
normalisation succeeded in reducing the extent to which all the individual item distributions
deviated from univariate normality. However, they still all failed the test of univariate
normality except for JC_FB1 (p=0.056) and JC_FB2 (p=0.145). Table 5.62 provided
further corroboratory evidence of the failure of this scale to meet the critical statistical
assumption of multivariate normality in that, although the procedure did result in a
reduction of the deviation of the observed indicator distribution from the theoretical
multivariate normal distribution (chi-square decreased from 1610.735 to 224.759), the null
hypothesis that the data follows a multivariate normal distribution still had to be rejected
(X2 = 224.759; p<.05).
Since the normalisation lead to a reduction in the chi-square statistics, robust maximum
likelihood was used as an alternative estimation technique. The fact that the data used is
continuous and does not satisfy the multivariate normality assumption critical for the
multivariate statistical analysis to follow made this estimation technique an applicable
technique to use (Mels, 2003).
A visual representation of the job characteristics measurement model is displayed in
Figure 5.1, followed by the overall fit statistics in Table 5.63. These statistics provided an
opportunity to test the exact fit and the close fit null hypothesis for the measurement
model.
Stellenbosch University https://scholar.sun.ac.za

187
Figure 5.1. Visual Representation of the Job Characteristics Measurement Model
Stellenbosch University https://scholar.sun.ac.za
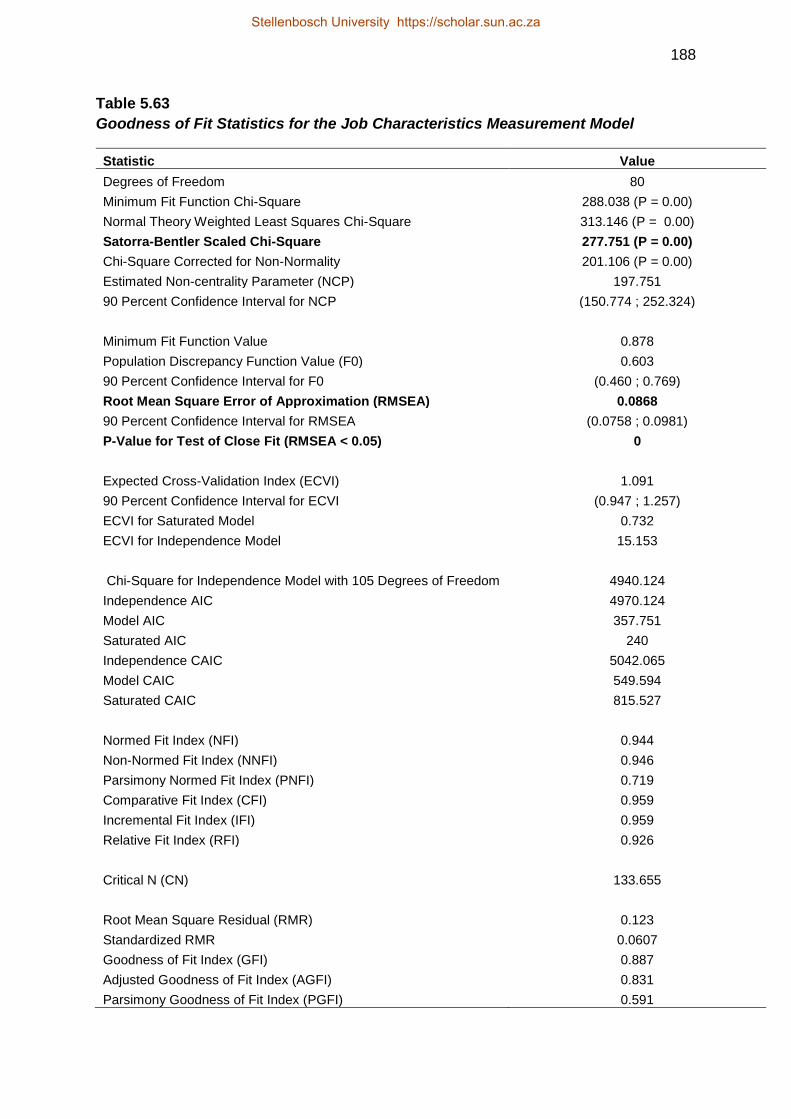
188
Table 5.63
Goodness of Fit Statistics for the Job Characteristics Measurement Model
Statistic Value
Degrees of Freedom 80
Minimum Fit Function Chi-Square 288.038 (P = 0.00)
Normal Theory Weighted Least Squares Chi-Square 313.146 (P = 0.00)
Satorra-Bentler Scaled Chi-Square 277.751 (P = 0.00)
Chi-Square Corrected for Non-Normality 201.106 (P = 0.00)
Estimated Non-centrality Parameter (NCP) 197.751
90 Percent Confidence Interval for NCP (150.774 ; 252.324)
Minimum Fit Function Value 0.878
Population Discrepancy Function Value (F0) 0.603
90 Percent Confidence Interval for F0 (0.460 ; 0.769)
Root Mean Square Error of Approximation (RMSEA) 0.0868
90 Percent Confidence Interval for RMSEA (0.0758 ; 0.0981)
P-Value for Test of Close Fit (RMSEA < 0.05) 0
Expected Cross-Validation Index (ECVI) 1.091
90 Percent Confidence Interval for ECVI (0.947 ; 1.257)
ECVI for Saturated Model 0.732
ECVI for Independence Model 15.153
Chi-Square for Independence Model with 105 Degrees of Freedom 4940.124
Independence AIC 4970.124
Model AIC 357.751
Saturated AIC 240
Independence CAIC 5042.065
Model CAIC 549.594
Saturated CAIC 815.527
Normed Fit Index (NFI) 0.944
Non-Normed Fit Index (NNFI) 0.946
Parsimony Normed Fit Index (PNFI) 0.719
Comparative Fit Index (CFI) 0.959
Incremental Fit Index (IFI) 0.959
Relative Fit Index (RFI) 0.926
Critical N (CN) 133.655
Root Mean Square Residual (RMR) 0.123
Standardized RMR 0.0607
Goodness of Fit Index (GFI) 0.887
Adjusted Goodness of Fit Index (AGFI) 0.831
Parsimony Goodness of Fit Index (PGFI) 0.591
Stellenbosch University https://scholar.sun.ac.za

189
A relatively good indication of fit, given the models multivariate normality nature, is given
by the Satorra-Bentler scaled chi-square statistic. The null hypothesis that the model fits
the population data perfectly is tested by the X2 test statistic:
H0159: RMSEA=072
Ha159: RMSEA>0
Table 5.63 indicates that this model achieved a Satorra-Bentler scaled chi-squared
statistic of 277.751 (p=.000).The null hypothesis of exact fit was therefore rejected (p<.05).
This was not surprising as the assumption that a model could fit exactly in the population
is rather ambitious and somewhat unrealistic. A more realistic assumption is that this
model could fit well or reasonably well and therefore the hypothesis of close fit was rather
tested, namely:
H0160: RMSEA=073
Ha160: RMSEA>0
According to Table 5.63 above it is evident that the close fit null hypothesis should be
rejected (p<.05; 0.0491). Therefore, according to this test statistic the position that this
model displayed close fit in the parameter was not a permissible position. The assumption
of mediocre fit in the sample was further corroborated by the RMSEA value in Table 5.63
above (RMSEA=0.0868). Further investigation of the modification indices provided a
certain degree of clarity. A visual representation of the modification indices is presented
in Figure 5.2, followed by the theta-delta modification indices in Table 5.64.
72 H0159 and Ha159 were not formulated upfront in Chapter 3. 73 H0160 and Ha160 were not formulated upfront in Chapter 3.
Stellenbosch University https://scholar.sun.ac.za

190
Figure 5.2. Visual Representation of the Job Characteristics Modification Indices
Stellenbosch University https://scholar.sun.ac.za

191
Table 5.64
Theta-delta Modification Indices for the Job Characteristics Measurement Model
JC_A1 JC_TI1 JC_SV1 JC_TS1 JC-FB1 JC_SV2
JC_A1 --
JC_TI1 20.885 --
JC_SV1 6.796 13.229 --
JC_TS1 0.374 15.693 21.592 --
JC-FB1 1.323 11.146 23.236 27.602 --
JC_SV2 0.111 0.246 1.423 0.463 0.605 --
JC_TI2 5.662 1.012 4.389 1.473 3.617 0
JC_FB2 0.190 0.011 0.299 0.410 21.284 1.227
JC_SV3 3.263 2.183 2.053 1.389 1.939 --
JC_TS2 2.628 9.649 1.080 42.414 0.580 6.254
JC_A2 1.100 0.692 3.835 1.533 1.578 0.31
JC_TI3 3.699 9.865 5.261 3.607 4.358 0.339
JC_FB3 0.017 0.422 1.815 18.015 3.263 0.143
JC_A3 19.306 2.342 0.175 0.023 3.228 0.35
JC_TS3 4.644 6.038 2.746 -- 4.168 5.972
JC_TI2 JC_FB2 JC_SV3 JC_TS2 JC_A2 JC_TI3
JC_TI2 --
JC_FB2 5.083 --
JC_SV3 0.265 0.004 --
JC_TS2 0.001 0.901 13.285 --
JC_A2 0.582 0.830 0.817 4.190 --
JC_TI3 -- 10.513 0.067 3.819 1.000 --
JC_FB3 0.066 -- 0.154 0.839 0.105 11.013
JC_A3 0.018 2.115 0.458 1.746 -- 6.378
JC_TS3 1.006 1.439 5.689 -- 0.436 1.113
JC_FB3 JC_A3 JC_TS3
JC_FB3 --
JC_A3 1.384 --
JC_TS3 5.507 10.530 -- JC_A=Autonomy, JC_TI=Task Identity, JC_SV=Skills Variety, JC_TS=Task Significance, JC_FB=Feedback
The theta-delta modification indices suggested 18 covariances (out of the original 105 –
17%), if freed, that would statistically significantly (p<.01) improve the fit of the model.
Although this percentage did seem somewhat small to argue the introduction of a general
factor, it seemed plausible that the item responses could be a function of both a general
or primary factor and a more specific secondary factor, especially from a theoretical point
of view. According to Reise (2012, p. 667) a bi-factor model, also known as a nested or
Stellenbosch University https://scholar.sun.ac.za

192
general-specific model “specifies that the covariance among a set of item responses can
be accounted for by a single general factor that reflects the common variance running
among all scale items and group factors that reflect additional common variance among
clusters of items, typically, with highly similar content.” DeMars (2013, p. 354) in turn
highlights that item responses in a bi-factor model “are a function of a general or primary
factor and no more than one specific or secondary factor”.
When the theorising surrounding job characteristics was considered this did seem
somewhat plausible. An individual may experience the specific characteristics of their job
such as autonomy, task identity, skill variety, feedback from the job and task significance
as distinct facets and may experience these differently. These are the nuanced view of an
individual’s job. Employees are offered the opportunity to take control and make decisions
independently, feel that their job has a certain level of significance within the broader
scope of the organisation (or project), obtain feedback directly from their work/job and also
be afforded the opportunity to use a variety of their skills within the broader context of their
job. Specific items of the scale capture the specific nuanced essence of the various job
characteristics, but the items also capture a broader underlying enrichment opportunity
afforded to individuals via these characteristics. Hence the presence of a general factor
on which all of the job characteristics load makes theoretical sense.
A visual representation of the job characteristics bi-factor measurement model is
presented in Figure 5.3.
Stellenbosch University https://scholar.sun.ac.za

193
Figure 5.3. Visual Representation of the Job Characteristics Bi-factor Measurement
Model (completely standardised solution)
Figure 5.3 above illustrates that the bi-factor model was fitted by constraining the
correlation between the broad, general job characteristics factor and the narrower, specific
job characteristics factors, to zero. The narrower, more specific job characteristics factors
Stellenbosch University https://scholar.sun.ac.za

194
were allowed to correlate. Table 5.65 below presents the goodness of fit statistics for the
job characteristics bi-factor measurement model.
Table 5.65
Job Characteristics Bi-factor Measurement Model Goodness of Fit Statistics
Statistic Value
Degrees of Freedom 65.000
Minimum Fit Function Chi-Square 151.059 (P= 0.00)
Normal Theory Weighted Least Squares Chi-Square 149.453 (P = 0.000)
Satorra-Bentler Scaled Chi-Square 132.653 (P = 0.000)
Chi-Square Corrected for Non-Normality 147.070 (P = 0.000)
Estimated Non-centrality Parameter (NCP) 67.653
90 Percent Confidence Interval for NCP (38.549 ; 104.529)
Minimum Fit Function Value 0.461
Population Discrepancy Function Value (F0) 0.206
90 Percent Confidence Interval for F0 (0.118 ; 0.319)
Root Mean Square Error of Approximation (RMSEA) 0.056
90 Percent Confidence Interval for RMSEA (0.0425 ; 0.0700)
P-Value for Test of Close Fit (RMSEA < 0.05) 0.213
Expected Cross-Validation Index (ECVI) 0.740
90 Percent Confidence Interval for ECVI (0.651 ; 0.852)
ECVI for Saturated Model 0.732
ECVI for Independence Model 15.153
Chi-Square for Independence Model with 105 Degrees of Freedom 4940.124
Independence AIC 4970.124
Model AIC 242.653
Saturated AIC 240.000
Independence CAIC 5042.065
Model CAIC 506.436
Saturated CAIC 815.527
Normed Fit Index (NFI) 0.973
Non-Normed Fit Index (NNFI) 0.977
Parsimony Normed Fit Index (PNFI) 0.602
Comparative Fit Index (CFI) 0.986
Incremental Fit Index (IFI) 0.986
Relative Fit Index (RFI) 0.957
Critical N (CN) 234.473
Root Mean Square Residual (RMR) 0.088
Standardized RMR 0.044
Goodness of Fit Index (GFI) 0.943
Adjusted Goodness of Fit Index (AGFI) 0.894
Parsimony Goodness of Fit Index (PGFI) 0.511
Stellenbosch University https://scholar.sun.ac.za
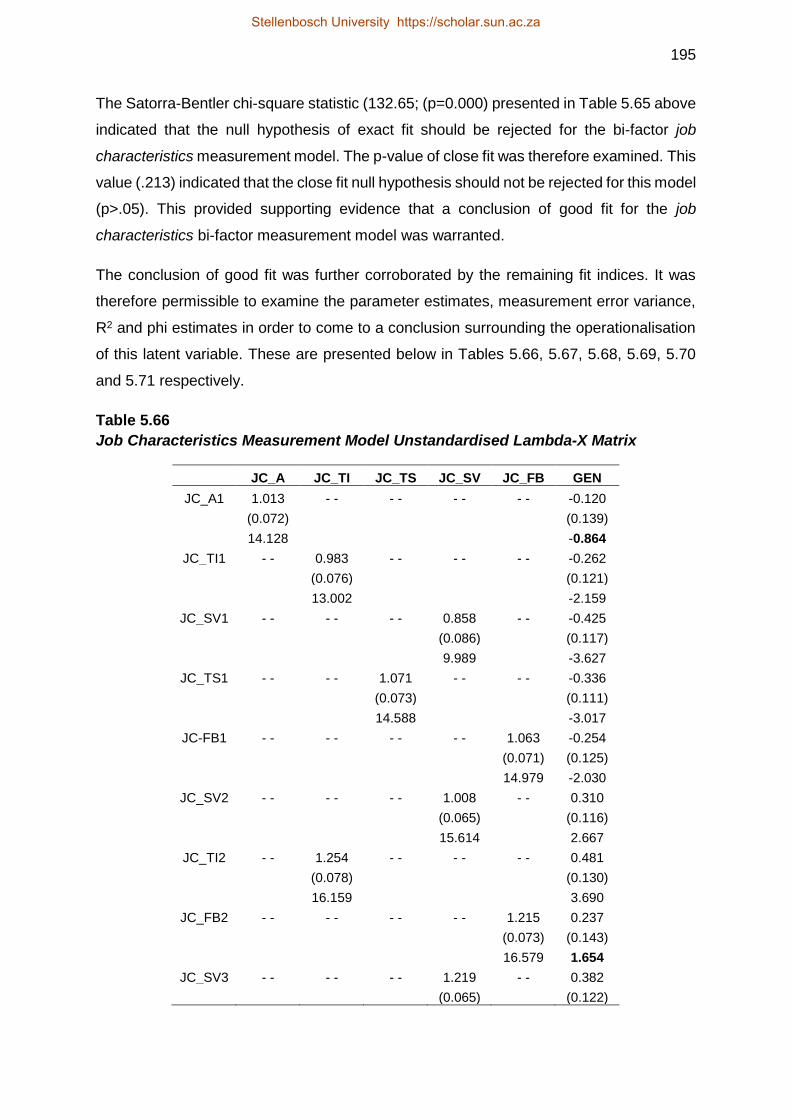
195
The Satorra-Bentler chi-square statistic (132.65; (p=0.000) presented in Table 5.65 above
indicated that the null hypothesis of exact fit should be rejected for the bi-factor job
characteristics measurement model. The p-value of close fit was therefore examined. This
value (.213) indicated that the close fit null hypothesis should not be rejected for this model
(p>.05). This provided supporting evidence that a conclusion of good fit for the job
characteristics bi-factor measurement model was warranted.
The conclusion of good fit was further corroborated by the remaining fit indices. It was
therefore permissible to examine the parameter estimates, measurement error variance,
R2 and phi estimates in order to come to a conclusion surrounding the operationalisation
of this latent variable. These are presented below in Tables 5.66, 5.67, 5.68, 5.69, 5.70
and 5.71 respectively.
Table 5.66
Job Characteristics Measurement Model Unstandardised Lambda-X Matrix
JC_A JC_TI JC_TS JC_SV JC_FB GEN
JC_A1 1.013 - - - - - - - - -0.120
(0.072) (0.139)
14.128 -0.864
JC_TI1 - - 0.983 - - - - - - -0.262
(0.076) (0.121)
13.002 -2.159
JC_SV1 - - - - - - 0.858 - - -0.425
(0.086) (0.117)
9.989 -3.627
JC_TS1 - - - - 1.071 - - - - -0.336
(0.073) (0.111)
14.588 -3.017
JC-FB1 - - - - - - - - 1.063 -0.254
(0.071) (0.125)
14.979 -2.030
JC_SV2 - - - - - - 1.008 - - 0.310
(0.065) (0.116)
15.614 2.667
JC_TI2 - - 1.254 - - - - - - 0.481
(0.078) (0.130)
16.159 3.690
JC_FB2 - - - - - - - - 1.215 0.237
(0.073) (0.143)
16.579 1.654
JC_SV3 - - - - - - 1.219 - - 0.382
(0.065) (0.122)
Stellenbosch University https://scholar.sun.ac.za

196
18.823 3.117
JC_TS2 - - - - 0.917 - - - - 0.305
(0.079) (0.113)
11.666 2.704
JC_A2 1.058 - - - - - - - - 0.196
(0.058) (0.129)
18.120 1.515
JC_TI3 - - 1.030 - - - - - - 0.518
(0.079) (0.112)
13.029 4.609
JC_FB3 - - - - - - - - 0.996 0.424
(0.079) (0.130)
12.566 3.259
JC_A3 1.169 - - - - - - - - 0.278
(0.074) (0.138)
15.698 2.011
JC_TS3 - - - - 1.072 - - - - 0.291
(0.071) (0.124)
15.167 2.341 JC_A=Autonomy, JC_TI=Task Identity, JC_SV=Skills Variety, JC_TS=Task Significance, JC_FB=Feedback
All of the factor loadings were statistically significant (p<.05)74, per Table 5.66 above,
except for the representation of the general factor by three items. Providing evidence that
this argument is somewhat more strongly supported from a theoretical point of view than
from an empirical point of view.
The fact that all of the narrow, more specific factors, load statistically significantly
commented favourably on the validity with which the constructs of interest were
represented by these manifest variables. However, it was nonetheless prudent to examine
the completely standardised solution for X, presented in Table 5.67 below.
It is evident from Table 5.67 that the magnitude of all of the factor loading estimates were
more than satisfactory, except for JC_SV1 and JC_FB3. Factor loading estimates in this
case were considered satisfactory if the completely standardised factor loading estimates
exceeded .71 and marginally satisfactory if above .50 (Theron, 2014a). Therefore JC_SV1
(.549) was merely marginally satisfactory and JC_FB3 (.703) just missed the satisfactory
cut-off criteria.
74 The statistical significance of the factor loading estimates were tested via two-tailed significance tests based on non-directional Hai hypotheses that all hypothesised non-zero factor loadings, without specifying the sign of the loading. Therefore, the critical value was |1.96|.
Stellenbosch University https://scholar.sun.ac.za

197
Table 5.67
Job Characteristics Measurement Model Completely Standardised Lambda-X
Matrix
JC_A JC_TI JC_TS JC_SV JC_FB GEN
JC_A1 0.747 - - - - - - - - -0.088
JC_TI1 - - 0.714 - - - - - - -0.190
JC_SV1 - - - - - - 0.549 - - -0.272
JC_TS1 - - - - 0.775 - - - - -0.243
JC-FB1 - - - - - - - - 0.769 -0.184
JC_SV2 - - - - - - 0.825 - - 0.254
JC_TI2 - - 0.753 - - - - - - 0.289
JC_FB2 - - - - - - - - 0.826 0.161
JC_SV3 - - - - - - 0.899 - - 0.281
JC_TS2 - - - - 0.705 - - - - 0.235
JC_A2 0.817 - - - - - - - - 0.151
JC_TI3 - - 0.736 - - - - - - 0.371
JC_FB3 - - - - - - - - 0.703 0.299
JC_A3 0.804 - - - - - - - - 0.191
JC_TS3 - - - - 0.765 - - - - 0.208 JC_A=Autonomy, JC_TI=Task Identity, JC_SV=Skills Variety, JC_TS=Task Significance, JC_FB=Feedback
It is also evident that a very small proportion of the variance in the items was due to the
broad general factor. Table 5.68 displays the unstandardised measurement error variance
estimates.
Table 5.68
Job Characteristics Measurement Model Unstandardised Theta-delta Matrix
JC_A1 JC_TI1 JC_SV1 JC_TS1 JC-FB1 JC_SV2
0.799 0.861 1.527 0.649 0.718 0.380
(0.090) (0.118) (0.145) (0.115) (0.101) (0.071)
8.841 7.293 10.535 5.637 7.106 5.366
JC_TI2 JC_FB2 JC_SV3 JC_TS2 JC_A2 JC_TI3
0.966 0.632 0.209 0.756 0.521 0.626
(0.156) (0.116) (0.069) (0.099) (0.068) (0.085)
6.209 5.460 3.010 7.629 7.617 7.338
JC_FB3 JC_A3 JC_TS3
0.834 0.671 0.728
(0.086) (0.097) (0.098)
9.742 6.938 7.439 JC_A=Autonomy, JC_TI=Task Identity, JC_SV=Skills Variety, JC_TS=Task Significance, JC_FB=Feedback
Stellenbosch University https://scholar.sun.ac.za
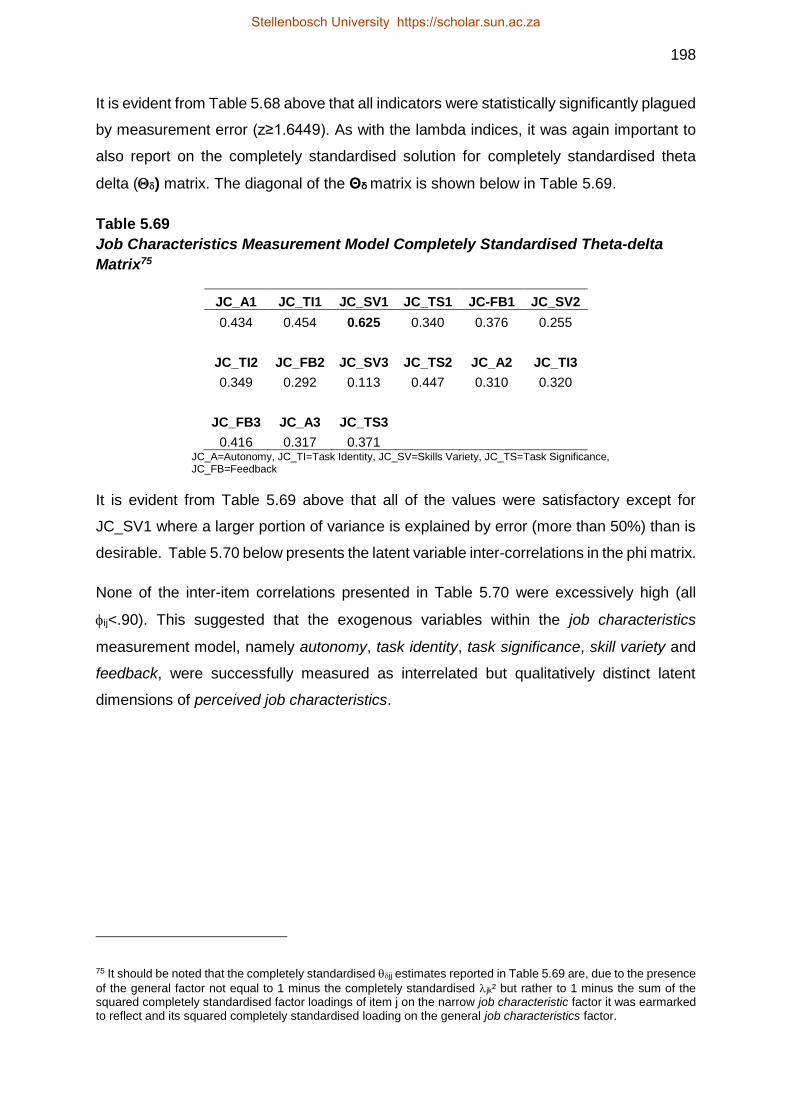
198
It is evident from Table 5.68 above that all indicators were statistically significantly plagued
by measurement error (z≥1.6449). As with the lambda indices, it was again important to
also report on the completely standardised solution for completely standardised theta
delta () matrix. The diagonal of the Θδ matrix is shown below in Table 5.69.
Table 5.69
Job Characteristics Measurement Model Completely Standardised Theta-delta
Matrix75
JC_A1 JC_TI1 JC_SV1 JC_TS1 JC-FB1 JC_SV2
0.434 0.454 0.625 0.340 0.376 0.255
JC_TI2 JC_FB2 JC_SV3 JC_TS2 JC_A2 JC_TI3
0.349 0.292 0.113 0.447 0.310 0.320
JC_FB3 JC_A3 JC_TS3
0.416 0.317 0.371 JC_A=Autonomy, JC_TI=Task Identity, JC_SV=Skills Variety, JC_TS=Task Significance, JC_FB=Feedback
It is evident from Table 5.69 above that all of the values were satisfactory except for
JC_SV1 where a larger portion of variance is explained by error (more than 50%) than is
desirable. Table 5.70 below presents the latent variable inter-correlations in the phi matrix.
None of the inter-item correlations presented in Table 5.70 were excessively high (all
ij<.90). This suggested that the exogenous variables within the job characteristics
measurement model, namely autonomy, task identity, task significance, skill variety and
feedback, were successfully measured as interrelated but qualitatively distinct latent
dimensions of perceived job characteristics.
75 It should be noted that the completely standardised jj estimates reported in Table 5.69 are, due to the presence
of the general factor not equal to 1 minus the completely standardised jk² but rather to 1 minus the sum of the squared completely standardised factor loadings of item j on the narrow job characteristic factor it was earmarked to reflect and its squared completely standardised loading on the general job characteristics factor.
Stellenbosch University https://scholar.sun.ac.za

199
Table 5.70
Job Characteristics Measurement Model Phi Matrix76
JC_A JC_TI JC_TS JC_SV JC_FB GEN
JC_A 1.000
JC_TI 0.610 1.000
(0.057)
10.767
JC_TS 0.407 0.226 1.000
(0.072) (0.078)
5.652 2.890
JC_SV 0.612 0.443 0.511 1.000
(0.048) (0.058) (0.059)
12.730 7.582 8.659
JC_FB 0.615 0.674 0.518 0.576 1.000
(0.052) (0.058) (0.060) (0.050)
11.793 11.697 8.711 11.417
GEN - - - - - - - - - - 1.000 JC_A=Autonomy, JC_TI=Task Identity, JC_SV=Skills Variety, JC_TS=Task Significance, JC_FB=Feedback, GEN=General
Table 5.71 below presents the squared multiple correlations for the exogenous variables
within the job characteristics measurement model.
Table 5.71
Job Characteristics Measurement Model Squared Multiple Correlations
JC_A1 JC_TI1 JC_SV1 JC_TS1 JC-FB1 JC_SV2
0.566 0.546 0.375 0.660 0.624 0.745
JC_TI2 JC_FB2 JC_SV3 JC_TS2 JC_A2 JC_TI3
0.651 0.708 0.887 0.553 0.690 0.680
JC_FB3 JC_A3 JC_TS3
0.584 0.683 0.629 JC_A=Autonomy, JC_TI=Task Identity, JC_SV=Skills Variety, JC_TS=Task Significance, JC_FB=Feedback
The R2 values ranged from .375 to .745 suggesting satisfactory validity for most of the
indicators, except for JC_SV1. JC_SV1 seemed to be cause for concern in that only a
very small portion of variance was explained by the underlying indicator (0.375).
76 The ij estimates reported in the phi matrix are the correlations between the latent variables and are therefore the same as the values in the standardised solution.
Stellenbosch University https://scholar.sun.ac.za

200
JC_SV1 and JC_FB3 were earmarked as potentially problematic items during the item
analysis. Therefore, the possibility of deleting these indicators had to be considered. The
researcher was aware that both the deletion and the retention of these items would have
potential pros and cons and that either options could easily be contended.
Deletion of these items would seem prudent, due to the potential increase in psychometric
quality seen in the item analysis, especially for JC_SV1. The deletion of this item would
improve the internal consistency (Cronbach’s alpha increased from .770 to .915).
Furthermore, the item additionally suffered from a low item-total correlation and squared
multiple correlation, bringing into question whether the item is in fact measuring the same
underlying factor as the remaining items. However, evidence of a poorly performing item
was not substantiated by the presence of an extreme mean or large standard deviation.
Moreover, the factor analysis did not identify JC_SV1 as problematic in that its loading
was more than satisfactory on the single factor. The measurement model fit statistics also
painted a conflicting picture of this item.
The situation is somewhat different for JC_FB3 in that the deletion of this item decreased
the Cronbach’s alpha and no evidence of a poorly performing item was evident in the
factor analysis. It therefore did not seem prudent to delete this item since there did not
seem to be enough substantiating evidence.
Additionally, DeVellis (2012) highlights that scale length influences reliability and that
longer scales seem to show better reliability. Therefore, due to the fact that these
subscales are reflected by merely three items each, the entire scale itself consists of
merely 15 items (to operationalise five variables) and the entire survey itself is rather short
(79 items in total), and the evidence against retaining these items was not all-together
damaging, deletion would not be sensible at this stage. Therefore, these items were
retained and no items were deleted for this subscale. This is in contrast to the decision
taken by Van Deventer (2015), however, after careful investigation of the psychometric
evidence for and against deletion, within her work engagement study, it was clear that her
item and dimensionality analysis painted a far more damming picture of the skill variety
subscale. From the basket of evidence provided above it can be concluded that the bi-
factor job characteristics measurement model fits reasonably well. Therefore, it seemed
reasonable to argue that the operationalisation of the job characteristics latent variable via
the job characteristics scale was successful and additionally that all items should be
retained.
Stellenbosch University https://scholar.sun.ac.za

201
The next multidimensional construct to be analysed was the individual psychological
ownership needs or roots. This will be discussed below in Section 5.6.2.
Individual psychological ownership needs (roots)
Before the measurement model for the individual psychological ownership needs could
be fitted, the critical assumption of normality was again tested. Table 5.72 below displays
the sample univariate skewness and kurtosis statistics for each item within the individual
psychological ownership needs scale before normalisation. Table 5.73 displays the results
for the test of multivariate normality.
Table 5.72
Test of Univariate Normality for the Roots before Normalisation
Variable Skewness Kurtosis Skewness and Kurtosis
Variable Z-Score P-Value Z-Score P-Value Chi-Square P-Value PO_Need_SI_1 -7.099 .000 3.607 .000 63.405 .000 PO_Need_SI_2 -7.832 .000 3.736 .000 75.301 .000 PO_Need_SI_3 -6.536 .000 1.932 0.053 46.455 .000 PO_Need_SI_4 -6.770 .000 2.639 0.008 52.798 .000 PO_Need_SOB_1 -6.979 .000 2.724 0.006 56.121 .000 PO_Need_ SOB_2 -8.036 .000 4.548 .000 85.265 .000 PO_Need_ SOB_3 -8.002 .000 4.658 .000 85.731 .000 PO_Need_ SOB_4 -8.106 .000 4.759 .000 88.354 .000 PO_Need_SE_1 -8.839 .000 5.632 .000 109.855 .000 PO_Need_SE_2 -7.971 .000 4.812 .000 86.700 .000 PO_Need_SE_3 -7.339 .000 3.861 .000 68.759 .000 PO_Need_SE_4 -9.556 .000 6.644 .000 135.462 .000
PO_Need_SI= Self Identity, PO_Need_SOB= Sense of Belonging, PO_Need_SE= Self efficacy/effectance
The chi-square for skewness and kurtosis presented in Table 5.72 indicated that all of the
items failed the test of univariate normality (p<.05).
Table 5.73
Test of Multivariate Normality for the Roots before Normalisation
Skewness Kurtosis Skewness and Kurtosis
Value Z-Score P-Value Value Z-Score P-Value Chi-Square P-Value 48.588 38.133 0.000 294.906 20.456 0.000 1872.576 0.000
Furthermore, the null hypothesis that the data follows a multivariate normal distribution
also had to be rejected (X2=1872.576; p<.05), as per Table 5.73. This therefore indicated
Stellenbosch University https://scholar.sun.ac.za

202
the need to normalise the univariate item distributions77 in PRELIS. These results are
presented below in Table 5.74 and 5.75 respectively.
It is evident from the results that the normalisation was not fully successful. The
normalisation in PRELIS did succeed in reducing the extent to which all the individual item
distributions deviated from univariate normality. However, unfortunately, all 12 items still
failed the test of univariate normality (p<.05). Further corroboratory evidence of the failure
of these items to meet the critical statistical assumption of normality is evident in Table
5.75 in that, although the procedure did succeed in reducing the deviation of the observed
indicator distribution from the theoretical multivariate normal distribution (Chi-square
statistic decreased from 1872.576 to 500.570), the null hypothesis that the data follows a
multivariate normal distribution still had to be rejected (X2 = 500.570; p<.05).
Table 5.74
Test of Univariate Normality for the Roots after Normalisation
Variable Skewness Kurtosis Skewness and Kurtosis
Variable Z-Score P-Value Z-Score P-Value Chi-Square P-Value PO_Need_SI_1 -2.066 .039 -2.277 .023 9.452 .009
PO_Need_SI_2 -2.332 .020 -1.959 .050 9.274 .010 PO_Need_SI_3 -2.123 .034 -2.469 .014 10.604 .005 PO_Need_SI_4 -2.025 .043 -2.241 .025 9.123 .010 PO_Need_SOB_1 -2.444 .015 -2.860 .004 14.153 .001 PO_Need_ SOB_2 -2.769 .006 -2.128 .033 12.198 .002 PO_Need_ SOB_3 -2.856 .004 -2.369 .018 13.770 .001 PO_Need_ SOB_4 -3.360 .001 -2.628 .009 18.192 .000 PO_Need_SE_1 -3.246 .001 -2.168 .030 15.236 .000 PO_Need_SE_2 -3.380 .001 -2.314 .021 16.778 .000 PO_Need_SE_3 -3.132 .002 -2.146 .032 14.413 .001 PO_Need_SE_4 -5.076 .000 -1.609 .108 28.353 .000
PO_Need_SI= Self Identity, PO_Need_SOB= Sense of Belonging, PO_Need_SE= Self efficacy/effectance
Table 5.75
Test of Multivariate Normality for the Roots after Normalisation
Skewness Kurtosis Skewness and Kurtosis
Value Z-Score P-Value Value Z-Score P-Value Chi-Square P-Value 18.752 16.765 0.000 229.298 14.816 0.000 500.570 0.000
77 Normalisation was conducted in an attempt to ensure that the data satisfies the assumption of multivariate normality as the quality of the solutions obtained is critically dependent upon this assumption being met. Normalisation, however, unfortunately occurs on the univariate item distributions. Multivariate normality can therefore not be guaranteed even if the univariate normalisation succeeds.
Stellenbosch University https://scholar.sun.ac.za

203
Therefore, since the normalisation was not completely successful, but there was a
reduction in the chi-square statistic, an alternative estimation technique, namely robust
maximum likelihood was used78 (Mels, 2003).
Fitting of the measurement model was subsequently conducted. The measurement model
fit in this case refers to the quality of the operationalisation of the three individual
psychological ownership needs namely the need for a sense of self-identity, sense of
belonging and self-efficacy and effectance by the 12 items developed to represent them.
Figure 5.4 displays a visual representation of the fitted psychological ownership individual
needs measurement model. Furthermore, the overall fit statistics are presented below in
Table 5.76. The goodness of fit statistics provided an opportunity to test the exact fit and
the close fit null hypothesis for the measurement model.
78 The use of RML necessitates the creation of an asymptotic covariance matrix via PRELIS. This will enable the calculation of appropriate fit indices in LISREL (Mels, 2003)
Stellenbosch University https://scholar.sun.ac.za

204
Figure 5.4. Representation of the fitted individual psychological ownership needs
measurement model (completely standardised solution)
The below highlighted indices have been used to assess goodness of fit in the case of the
individual psychological ownership needs measurement model.
Stellenbosch University https://scholar.sun.ac.za

205
Table 5.76
Individual Psychological Ownership Needs Measurement Model Goodness of Fit
Statistics
Statistic Value
Degrees of Freedom Minimum Fit Function Chi-Square Normal Theory Weighted Least Squares Chi-Square Satorra-Bentler Scaled Chi-Square Chi-Square Corrected for Non-Normality Estimated Non-centrality Parameter (NCP) 90 Percent Confidence Interval for NCP Minimum Fit Function Value Population Discrepancy Function Value (F0) 90 Percent Confidence Interval for F0 Root Mean Square Error of Approximation (RMSEA) 90 Percent Confidence Interval for RMSEA P-Value for Test of Close Fit (RMSEA < 0.05) Expected Cross-Validation Index (ECVI) 90 Percent Confidence Interval for ECVI ECVI for Saturated Model ECVI for Independence Model Chi-Square for Independence Model with 66 Degrees of Freedom Independence AIC Model AIC Saturated AIC Independence CAIC Model CAIC Saturated CAIC Normed Fit Index (NFI) Non-Normed Fit Index (NNFI) Parsimony Normed Fit Index (PNFI) Comparative Fit Index (CFI) Incremental Fit Index (IFI) Relative Fit Index (RFI) Critical N (CN) Root Mean Square Residual (RMR) Standardized RMR Goodness of Fit Index (GFI) Adjusted Goodness of Fit Index (AGFI) Parsimony Goodness of Fit Index (PGFI)
51 167.510 (P=0.00) 174.268 (P=0.00) 121.385 (P=0.000) 123.295 (P=0.000)
70.385 (41.953 ; 106.523)
0.511 0.215
(0.128 ; 0.325) 0.0649
(0.0501 ; 0.0798) 0.0491
0.535
(0.448 ; 0.645) 0.476 13.275
4330.127 4354.127 175.385 156.000
4411.680 304.878 530.093
0.972 0.979 0.751 0.983 0.984 0.964
210.122
0.0667 0.0493 0.919 0.876 0.601
Table 5.76 indicates that this model achieved a Satorra-Bentler scaled chi-squared
statistic of 121.385 (p=.000).The null hypothesis of exact fit was therefore rejected (p<.05).
79According to Table 5.76 above it is evident that the close fit null hypothesis should be
79 This outcome is not surprising. A more realistic assumption was that this model could fit well or reasonably well and therefore the hypothesis of close fit was tested.
Stellenbosch University https://scholar.sun.ac.za

206
rejected (p<.05; 0.0491). Therefore, according to this test statistic the position that this
model displayed close fit in the parameter was not a permissible position. The assumption
of merely reasonable fit in the sample was further corroborated by the RMSEA value in
Table 5.76 above for the individual psychological ownership needs measurement model
(RMSEA=0.0649). It is, however, noted that if the exceedance probability would have
been rounded up to two decimal figures the null hypothesis of close fit would not have
been rejected (p=.05).
The remaining fit indices suggested that the individual psychological ownership needs
scale measurement model fitted reasonably. These findings therefore allowed for the
interpretation of the measurement model parameter estimates since the success of the
operationalisation of the latent variable individual psychological ownership needs cannot
be determined without an explicit conclusion pertaining to model fit. Here the significance
and the magnitude of the hypothesised paths between each of the manifest and the latent
variable they were earmarked to reflect were investigated by looking at the unstandardised
and completely standardised lambda-X matrices presented below in Table 5.77 and Table
5.78 respectively.
Table 5.77
Individual Psychological Ownership Needs Measurement Model Unstandardised
Lambda-X Matrix
SI SOB SE
SI_1 0.901 - - - -
(0.064)
14.010
SI_2 0.878 - - - -
(0.068)
12.864
SI_3 1.234 - - - -
(0.058)
21.465
SI_4 1.121 - - - -
(0.063)
17.728
SOB_1 - - 0.983 - -
(0.070)
13.956
SOB_2 - - 0.998 - -
(0.051)
19.513
SOB_3 - - 0.842 - -
Stellenbosch University https://scholar.sun.ac.za

207
(0.057)
14.889
SOB_4 - - 0.840 - -
(0.052)
16.290
SE_1 - - - - 0.759
(0.049)
15.473
SE_2 - - - - 0.784
(0.050)
15.839
SE_3 - - - - 0.800
(0.044)
18.110
SE_4 - - - - 0.556
(0.044)
12.785 SI=Self Identity, SOB=Sense of Belonging, SE=Self efficacy/effectance
It is evident from Table 5.77 above that all of the factor loadings are statistically significant
(p<.05). This suggested that the items therefore load statistically significantly on the latent
variables that they were designed to reflect and speaks favourably to their validity. Table
5.78 below highlights the completely standardised lambda-X factor loadings.
Table 5.78
Individual Psychological Ownership Needs Measurement Model Completely
Standardised Lambda-X Matrix
SI SOB SE
SI_1 0.692 - - - -
SI_2 0.672 - - - -
SI_3 0.890 - - - -
SI_4 0.812 - - - -
SOB_1 - - 0.695 - -
SOB_2 - - 0.844 - -
SOB_3 - - 0.718 - -
SOB_4 - - 0.730 - -
SE_1 - - - - 0.756
SE_2 - - - - 0.762
SE_3 - - - - 0.823
SE_4 - - - - 0.688 SI=Self Identity, SOB=Sense of Belonging, SE=Self efficacy/effectance
It is evident from Table 5.78 above that the majority of the items exceeded the critical cut-
off factor loading value of .71. However, 4 of the 12 items were merely marginally
satisfactory (<.71), namely SI_1 (.692), SI_2 (.672), SOB_1 (.695) and SE_4 (.688).
Stellenbosch University https://scholar.sun.ac.za

208
Nonetheless, they did meet the .50 cut-off and therefore it could be concluded that all of
the items provide a reasonable representation of the latent variable they were meant to
reflect.
Table 5.79 and 5.80 below presents the unstandardised and standardised theta-delta
estimates.
Table 5.79
Individual Psychological Ownership Needs Measurement Model Unstandardised
Theta-delta Estimates
SI_1 SI_2 SI_3 SI_4 SOB_1 SOB_2
0.882 0.934 0.398 0.647 1.033 0.403
(0.109) (0.116) (0.077) (0.102) (0.134) (0.068)
8.067 8.078 5.183 6.367 7.690 5.943
SOB_3 SOB_4 SE_1 SE_2 SE_3 SE_4
0.668 0.620 0.431 0.444 0.304 0.344
(0.086) (0.066) (0.059) (0.068) (0.051) (0.032)
7.753 9.348 7.342 6.527 5.960 10.840 SI=Self Identity, SOB=Sense of Belonging, SE=Self efficacy/effectance
It is evident from Table 5.79 above that all of the indicators were statistically significantly
(z>1.6449) plagued by measurement error.
Table 5.80
Individual Psychological Ownership Needs Measurement Model Completely
Standardised Theta-delta Estimates
SI_1 SI_2 SI_3 SI_4 SOB_1 SOB_2
0.521 0.548 0.207 0.340 0.517 0.288 SOB_3 SOB_4 SE_1 SE_2 SE_3 SE_4
0.485 0.468 0.428 0.419 0.322 0.526 SI=Self Identity, SOB=Sense of Belonging, SE=Self efficacy/effectance
The observed values in Table 5.80 above indicate the proportion of item variance not
explained by the underlying latent variable. The majority of the completely standardised
error variance values were satisfactory in that less than 50% of the item variance could
be ascribed to systematic non-relevant variance and random error variance. The same
four items that were previously flagged in Table 5.78 are again indicated here as
somewhat problematic in that less than 50% (but more than 25%) of the variance in these
items is due to the latent dimension of interest.
Table 5.81 below presents the latent variable inter-correlations in the phi matrix.
Stellenbosch University https://scholar.sun.ac.za

209
Table 5.81
Individual Psychological Ownership Needs Measurement Model Phi Matrix
SI SOB SE
SI 1.000
SOB 0.744 1.000
(0.039)
18.913
SE 0.596 0.634 1.000
(0.056) (0.053)
10.696 11.893 SI=Self Identity, SOB=Sense of Belonging, SE=Self efficacy/effectance
All three individual psychological ownership needs inter-correlations were statistically
significant (p<.05). It is evident from Table 5.81 above that none of the inter-correlations
were excessively high (all ij<.90). This suggested that the exogenous variables within the
individual psychological ownership needs scale measurement model were interrelated but
measured as qualitatively distinct latent variables.
Table 5.82 below presents the squared multiple correlations for the exogenous variables.
Table 5.82
Individual Psychological Ownership Needs Measurement Model Squared Multiple
Correlations for X-Variables
SI_1 SI_2 SI_3 SI_4 SOB_1 SOB_2
0.479 0.452 0.793 0.660 0.483 0.712
SOB_3 SOB_4 SE_1 SE_2 SE_3 SE_4
0.515 0.532 0.572 0.581 0.678 0.474 SI=Self Identity, SOB=Sense of Belonging, SE=Self efficacy/effectance
The R2 values in Table 5.82 above ranged from .452 to .793. It can therefore be suggested
that these items in the psychological ownership individual needs scale displayed
satisfactory validity. Higher R2 values for SI_1, SI_2, SOB_1 and SE_4 would have been
desirable (i.e. R²>.50).
It can therefore be concluded from the above basket of evidence that the individual
psychological ownership needs measurement model fits reasonably. Furthermore, it
seemed reasonable to argue that the operationalisation of the individual psychological
ownership needs via the individual psychological ownership needs scale was relatively
successful. Further analysis of the third “multidimensional” construct namely the routes
towards psychological ownership was therefore undertaken post data screening.
Stellenbosch University https://scholar.sun.ac.za

210
Psychological ownership routes
The data was screened to again test assumptions of normality prior to investigating model
fit. Results of the test for univariate and multivariate normality before normalisation, are
presented below in Table 5.83 and Table 5.84 respectively.
Table 5.83
Test of Univariate Normality for the Routes before Normalisation
Variable Skewness Kurtosis Skewness and Kurtosis
Variable Z-Score P-Value Z-Score P-Value Chi-Square P-Value
IK_1 -9.946 0.000 6.794 0.000 145.081 0.000
IK_2 -8.230 0.000 5.589 0.000 98.965 0.000 IK_3 -7.229 0.000 4.007 0.000 68.319 0.000 IK_4 -10.160 0.000 7.701 0.000 162.535 0.000
SINV_1 -10.080 0.000 6.668 0.000 146.070 0.000 SINV_2 -8.589 0.000 5.113 0.000 99.914 0.000 SINV_3 -9.766 0.000 6.248 0.000 134.410 0.000 SINV_4 -8.655 0.000 4.544 0.000 95.565 0.000
C_1 -5.446 0.000 1.690 0.091 32.514 0.000 C_2 -5.669 0.000 0.618 0.537 32.523 0.000 C_3 -5.607 0.000 0.719 0.472 31.956 0.000 C_4 -4.615 0.000 -1.695 0.090 24.173 0.000 C_5 -7.025 0.000 2.968 0.003 58.163 0.000 C_6 -6.311 0.000 1.411 0.158 41.817 0.000
IK=Intimate Knowledge, SINV=Self Investment, C=Control
Table 5.84
Test of Multivariate Normality for the Routes before Normalisation
Skewness Kurtosis Skewness and Kurtosis
Value Z-Score P-Value Value Z-Score P-Value Chi-Square P-Value 65.049 42.874 0.000 361.007 20.519 0.000 2259.220 0.000
The chi-square for skewness and kurtosis presented in Table 5.83 above indicates that all
of the items similarly failed the test of univariate normality (p<.05). Furthermore, the null
hypothesis that the data follows a multivariate normal distribution also had to be rejected
(X2=2259.220; p<.05). This therefore indicated the need to normalise the items80 in
PRELIS. The results of this normalisation on the univariate and multivariate assumptions
are presented below in Table 5.85 and Table 5.86
80 Normalisation was conducted in order for the data to satisfy the assumption of multivariate normality as the quality of the solutions obtained is critically dependent upon this assumption being met.
Stellenbosch University https://scholar.sun.ac.za

211
Table 5.85
Test of Univariate Normality for the Routes after Normalisation
Variable Skewness Kurtosis Skewness and Kurtosis
Variable Z-Score P-Value Z-Score P-Value Chi-Square P-Value
IK_1 -3.202 0.001 -1.317 0.188 11.984 0.002
IK_2 -3.040 0.002 -1.649 0.099 11.959 0.003 IK_3 -3.540 0.000 -2.202 0.028 17.380 0.000 IK_4 -4.300 0.000 -1.775 0.076 21.641 0.000
SINV_1 -3.954 0.000 -2.051 0.040 19.845 0.000 SINV_2 -2.899 0.004 -2.591 0.010 15.114 0.001 SINV_3 -3.475 0.001 -2.023 0.043 16.170 0.000 SINV_4 -3.873 0.000 -2.813 0.005 22.916 0.000
C_1 -0.714 0.475 -0.362 0.718 0.640 0.726 C_2 -0.991 0.322 -1.238 0.216 2.515 0.284 C_3 -1.083 0.279 -1.269 0.204 2.783 0.249 C_4 -0.992 0.321 -2.207 0.027 5.856 0.054 C_5 -1.677 0.094 -1.615 0.106 5.422 0.066 C_6 -1.539 0.124 -1.943 0.052 6.143 0.046
IK=Intimate Knowledge, SINV=Self Investment, C=Control
Table 5.86
Test of Multivariate Normality for the Routes after Normalisation
Skewness Kurtosis Skewness and Kurtosis
Value Z-Score P-Value Value Z-Score P-Value Chi-Square P-Value 23.688 16.271 0.000 265.477 11.228 0.000 390.810 0.000
It is evident from the results presented above in Table 5.85 and Table 5.86 that the
normalisation was not fully successful. The normalisation in PRELIS did succeed in
reducing the extent to which the univariate item distributions deviate from univariate
normality. However, unfortunately nine of the 14 univariate item distributions still failed the
test of univariate normality (p<.05). Further corroboratory evidence of the failure of these
items to meet the critical statistical assumption of normality is evident in Table 5.86 above
in that although the procedure did succeed in reducing the deviation of the observed
multivariate indicator distribution from the theoretical multivariate normal distribution (chi-
square statistic decreased from 2259.220 to 390.810), the null hypothesis that the data
follows a multivariate normal distribution still had to be rejected (X2 = 390.810; p<.05).
Therefore, similar to the situation found above when investigating the measurement model
fit for the individual psychological ownership needs, since the normalisation was not
completely successful, but there was a reduction in the chi-square statistic, an alternative
estimation technique, namely robust maximum likelihood estimation was used. The
appropriateness of this technique was highlighted above in Section 5.6.1. A visual
Stellenbosch University https://scholar.sun.ac.za

212
representation of the psychological ownership routes measurement model is presented
below in Figure 5.5 followed by the goodness of fit statistics in Table 5.87.
Figure 5.5. Visual Representation of the Psychological Ownership Routes
(Completely Standardised Solution)
Stellenbosch University https://scholar.sun.ac.za

213
Table 5.87
Psychological Ownership Routes Measurement Model Goodness of Fit Statistics
Statistic Value
Degrees of Freedom = 74 Minimum Fit Function Chi-Square = 315.233 (P=0.0) Normal Theory Weighted Least Squares Chi-Square = 335.871 (P=0.0) Satorra-Bentler Scaled Chi-Square = 257.640 (P=0.0) Chi-Square Corrected for Non-Normality = 239.357 (P=0.0) Estimated Non-centrality Parameter (NCP) = 183.640 90 Percent Confidence Interval for NCP=(138.520 ; 236.354) Minimum Fit Function Value Population Discrepancy Function Value (F0) 90 Percent Confidence Interval for F0 Root Mean Square Error of Approximation (RMSEA) 90 Percent Confidence Interval for RMSEA P-Value for Test of Close Fit (RMSEA < 0.05) Expected Cross-Validation Index (ECVI) 90 Percent Confidence Interval for ECVI ECVI for Saturated Model ECVI for Independence Model Chi-Square for Independence Model with 91 Degrees of Freedom Independence AIC Model AIC Saturated AIC Independence CAIC Model CAIC Saturated CAIC Normed Fit Index (NFI) Non-Normed Fit Index (NNFI) Parsimony Normed Fit Index (PNFI) Comparative Fit Index (CFI) Incremental Fit Index (IFI) Relative Fit Index (RFI) Critical N (CN) Root Mean Square Residual (RMR) Standardized RMR Goodness of Fit Index (GFI) Adjusted Goodness of Fit Index (AGFI) Parsimony Goodness of Fit Index (PGFI)
74 315.233 (P=0.0) 335.871 (P=0.0) 257.640 (P=0.0) 239.357 (P=0.0)
183.640 (138.520 ; 236.354)
0.96 0.560
(0.422 ; 0.721) 0.0870
(0.0755 ; 0.0987) 0.000
0.975
(0.837 ; 1.135) 0.640 17.082
5574.836 5602.836 319.640 210.000 5669.981 468.318 713.586
0.954 0.959 0.776 0.967 0.967 0.943
134.934
0.0864 0.0499 0.872 0.819 0.615
Initial inspection of the fit indices for the psychological ownership routes measurement
model provided conflicting information. Several indices pointed to a poor fitting model,
namely the RMSEA (.0870), 90 percent confidence interval RMSEA (0.0755 ; 0.0987), p-
value test of close fit (.000) and CN (134.934). While several indicators pointed to a good
fitting model namely; NFI (.954), NNFI (.959), CFI (967), IFI (.967), RFI (.943) and SRMR
(.0499). The AIC and ECVI values when compared to the independent models were also
lower. However, upon further investigation an indication of the problem was evident in the
matrix of modification indices calculated for the theta-delta matrix. Here a large number of
Stellenbosch University https://scholar.sun.ac.za

214
statistically significant modification indices in the off-diagonal of the matrix suggested that
the items had something else in common, other than the specific route to psychological
ownership that they were earmarked to reflect.
The modification indices calculated for the theta-delta matrix more specifically suggested
that almost all the items of the psychological ownership routes scale had a common
source of variance in addition to the specific route source of variance (with the exception
of C_1). Figure 5.6 depicts the statistically significant (p<.01) modification indices
calculated for the fitted psychological ownership routes measurement model.
Figure 5.6. Visual Representation of the Statistically Significant (p<.01) Modification
Indices Calculated for the Fitted Psychological Ownership Routes Measurement
Model
Stellenbosch University https://scholar.sun.ac.za

215
The large number of statistically significant modification index values depicted in Figure
5.6 above provided a visual representation of the motivation for hypothesising a broad,
general route factor in addition to the three narrow, more specific routes.
The presence of a broad, general route factor made sense from a theoretical point of view
if the theorising surrounding the routes towards psychological ownership is considered.
Pierce et al. (2001; 2003) argued that psychological ownership is the result of being
afforded the opportunity to “travel on specific routes” that brings with it specific
experiences. Pierce et al. (2001) specifically propose that the opportunity to have control
over a target, the opportunity to gain knowledge about the target and the opportunity to
immerse one’s self into the target, through self-investment, leads to feelings of
psychological ownership. Effect indicators written to reflect the extent to which employees
have been offered the opportunity to “travel these specific routes” should all also reflect
the extent to which employees have been offered the broad opportunity to be intimately
psychologically involved in their jobs. Hence the presence of a broad, general factor on
which all the psychological ownership routes items load makes theoretical sense.
Bi-factor confirmatory factor analysis was subsequently used to evaluate the
psychological ownership routes measurement model expanded with the inclusion of a
general route factor. A visual representation of the psychological ownership routes bi-
factor measurement model is presented below in Figure 5.7. The goodness of fit results
are then presented in Table 5.88 and subsequently discussed.
Stellenbosch University https://scholar.sun.ac.za

216
Figure 5.7. Visual Representation of the Psychological Ownership Routes Bi-factor
Measurement Model (Completely Standardised Solution)
Figure 5.7 illustrates that the bi-factor model was fitted by constraining the correlation
between the broad, general route factor and the narrower, specific route factors, to zero.
The narrower, more specific route factors were allowed to correlate. Table 5.88 below
presents the goodness of fit statistics for the psychological ownership routes bi-factor
measurement model.
Stellenbosch University https://scholar.sun.ac.za

217
Table 5.88
Psychological Ownership Routes Bi-factor Measurement Model Goodness of Fit
Statistics
Statistic Value
Degrees of Freedom Minimum Fit Function Chi-Square Normal Theory Weighted Least Squares Chi-Square Satorra-Bentler Scaled Chi-Square Chi-Square Corrected for Non-Normality Estimated Non-centrality Parameter (NCP) 90 Percent Confidence Interval for NCP Minimum Fit Function Value Population Discrepancy Function Value (F0) 90 Percent Confidence Interval for F0 Root Mean Square Error of Approximation (RMSEA) 90 Percent Confidence Interval for RMSEA P-Value for Test of Close Fit (RMSEA < 0.05) Expected Cross-Validation Index (ECVI) 90 Percent Confidence Interval for ECVI ECVI for Saturated Model ECVI for Independence Model Chi-Square for Independence Model with 91 Degrees of Freedom Independence AIC Model AIC Saturated AIC Independence CAIC Model CAIC Saturated CAIC Normed Fit Index (NFI) Non-Normed Fit Index (NNFI) Parsimony Normed Fit Index (PNFI) Comparative Fit Index (CFI) Incremental Fit Index (IFI) Relative Fit Index (RFI) Critical N (CN) Root Mean Square Residual (RMR) Standardized RMR Goodness of Fit Index (GFI) Adjusted Goodness of Fit Index (AGFI) Parsimony Goodness of Fit Index (PGFI)
60 167.654 (P=0.00) 177.982 (P=0.00)
130.449 (P=0.000) 115.298 (P=0.000)
70.449 (41.281 ; 107.360)
0.511 0.215
(0.126 ; 0.327) 0.0598
(0.0458 ; 0.0739) 0.119
0.672
(0.583 ; 0.785) 0.640 17.082
5574.836 5602.836 220.449 210.000 5669.981 436.271 713.586
0.977 0.981 0.644 0.987 0.987 0.965
223.224
0.0497 0.0350 0.928 0.874 0.530
It is evident from Table 5.88 above that the psychological ownership routes bi-factor
measurement model obtained a Satorra-Bentler scaled chi-square value of 130.449
(p=0.000). This suggested that the null hypothesis of exact fit should be rejected. Again,
this was no surprise and therefore the p-value of the test of close fit should rather be
examined. This value (.119) indicated that the close fit null hypothesis should not be
rejected for this model (p>.05). This provided supporting evidence that a conclusion of
Stellenbosch University https://scholar.sun.ac.za

218
good fit for the psychological ownership routes bi-factor measurement model was
warranted.
The remaining fit indices additionally showed evidence of good fit. It seemed reasonable
to therefore conclude that the psychological ownership routes bi-factor measurement
model showed good fit and therefore the parameter estimates, measurement error
variance, R2 and phi estimates were investigated in order to come to a conclusion
surrounding the success of the operationalisation of this latent variable. These are
presented below in Tables 5.89, 5.90, 5.91, 5.92, 5.93, and 5.94, respectively.
Table 5.89
Psychological Ownership Routes Bi-factor Measurement Model Unstandardised
Lambda-X Matrix
IK SI C GEN
IK_1 0.694 - - - - 0.258
(0.051) (0.088)
13.548 2.932
IK_2 0.698 - - - - 0.231
(0.045) (0.079)
15.598 2.900
IK_3 0.783 - - - - 0.127
(0.036) (0.088)
21.838 1.444
IK_4 0.608 - - - - 0.238
(0.044) (0.072)
13.684 3.314
SINV_1 - - 0.799 - - 0.290
(0.055) (0.095)
14.653 3.038
SINV_2 - - 0.822 - - 0.629
(0.091) (0.101)
9.001 6.252
SINV_3 - - 0.844 - - 0.438
(0.070) (0.106)
12.056 4.143
SINV_4 - - 0.804 - - 0.333
(0.071) (0.104)
11.262 3.192
C_1 - - - - 0.615 0.723
(0.185) (0.166)
3.326 4.346
C_2 - - - - 0.718 1.017
(0.244) (0.190)
Stellenbosch University https://scholar.sun.ac.za

219
2.938 5.360
C_3 - - - - 0.740 0.925
(0.221) (0.189)
3.345 4.892
C_4 - - - - 1.326 0.451
(0.137) (0.329)
9.703 1.369
C_5 - - - - 0.860 0.657
(0.170) (0.219)
5.071 2.998
C_6 - - - - 1.369 0.108
(0.092) (0.318)
14.834 0.338 IK=Intimate Knowledge, SINV=Self Investment, C=Control
It is evident from Table 5.89 above that all of the factor loadings were statistically
significant except for the relationship between the general factor and IK_3 as well as the
relationship between the general factor and C_6.
Table 5.90
Psychological Ownership Routes Bi-Factor Measurement Model Completely
Standardised Lambda-X Matrix
IK SI C GEN
IK_1 0.711 - - - - 0.264
IK_2 0.790 - - - - 0.261
IK_3 0.871 - - - - 0.141
IK_4 0.744 - - - - 0.292
SINV_1 - - 0.739 - - 0.268
SINV_2 - - 0.662 - - 0.506
SINV_3 - - 0.741 - - 0.385
SINV_4 - - 0.637 - - 0.264
C_1 - - - - 0.477 0.562
C_2 - - - - 0.489 0.693
C_3 - - - - 0.514 0.643
C_4 - - - - 0.810 0.275
C_5 - - - - 0.631 0.482
C_6 - - - - 0.909 0.071 IK=Intimate Knowledge, SINV=Self Investment, C=Control
It is evident that for the majority of the items the narrower, more specific route latent
variables explained more than 50% of the variance in the items, and with the exception of
two control items, more than 25% of the item variance. This was a favourable position.
However, Table 5.90 above indicates that there could potentially have been problems with
two of the control items (C_1 and C_2). However, these items were not indicated as
Stellenbosch University https://scholar.sun.ac.za
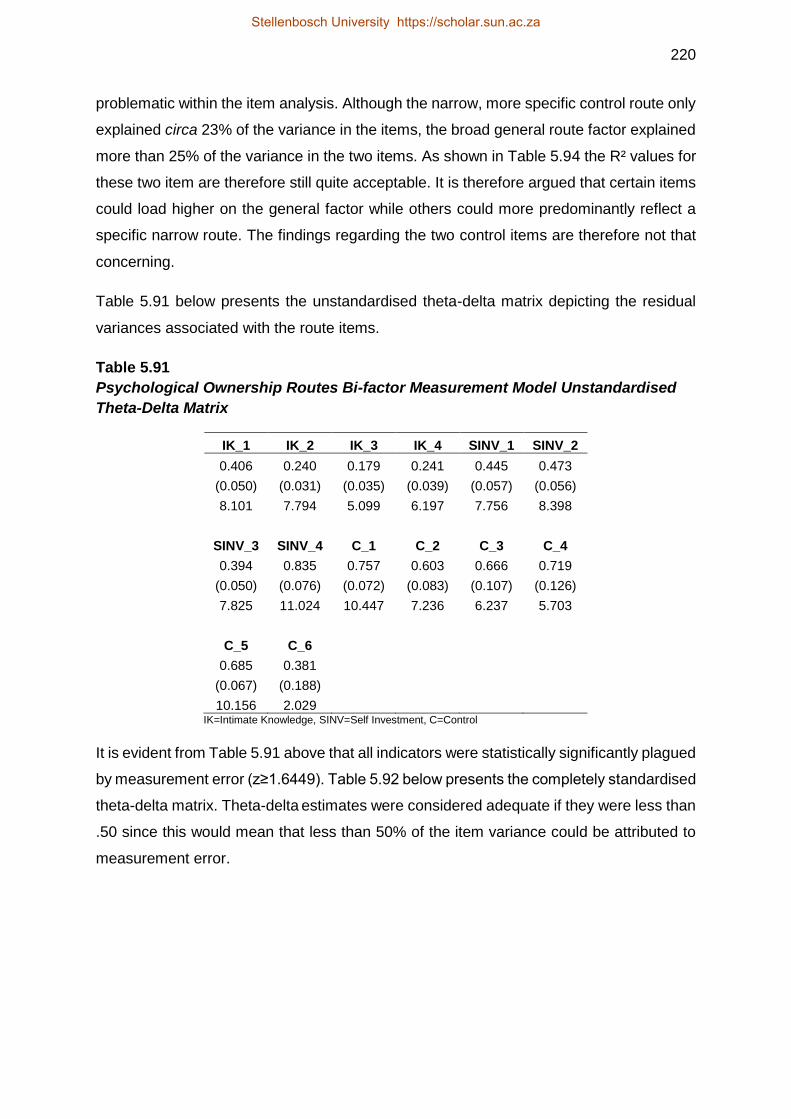
220
problematic within the item analysis. Although the narrow, more specific control route only
explained circa 23% of the variance in the items, the broad general route factor explained
more than 25% of the variance in the two items. As shown in Table 5.94 the R² values for
these two item are therefore still quite acceptable. It is therefore argued that certain items
could load higher on the general factor while others could more predominantly reflect a
specific narrow route. The findings regarding the two control items are therefore not that
concerning.
Table 5.91 below presents the unstandardised theta-delta matrix depicting the residual
variances associated with the route items.
Table 5.91
Psychological Ownership Routes Bi-factor Measurement Model Unstandardised
Theta-Delta Matrix
IK_1 IK_2 IK_3 IK_4 SINV_1 SINV_2
0.406 0.240 0.179 0.241 0.445 0.473
(0.050) (0.031) (0.035) (0.039) (0.057) (0.056)
8.101 7.794 5.099 6.197 7.756 8.398
SINV_3 SINV_4 C_1 C_2 C_3 C_4
0.394 0.835 0.757 0.603 0.666 0.719
(0.050) (0.076) (0.072) (0.083) (0.107) (0.126)
7.825 11.024 10.447 7.236 6.237 5.703
C_5 C_6
0.685 0.381
(0.067) (0.188)
10.156 2.029 IK=Intimate Knowledge, SINV=Self Investment, C=Control
It is evident from Table 5.91 above that all indicators were statistically significantly plagued
by measurement error (z≥1.6449). Table 5.92 below presents the completely standardised
theta-delta matrix. Theta-delta estimates were considered adequate if they were less than
.50 since this would mean that less than 50% of the item variance could be attributed to
measurement error.
Stellenbosch University https://scholar.sun.ac.za
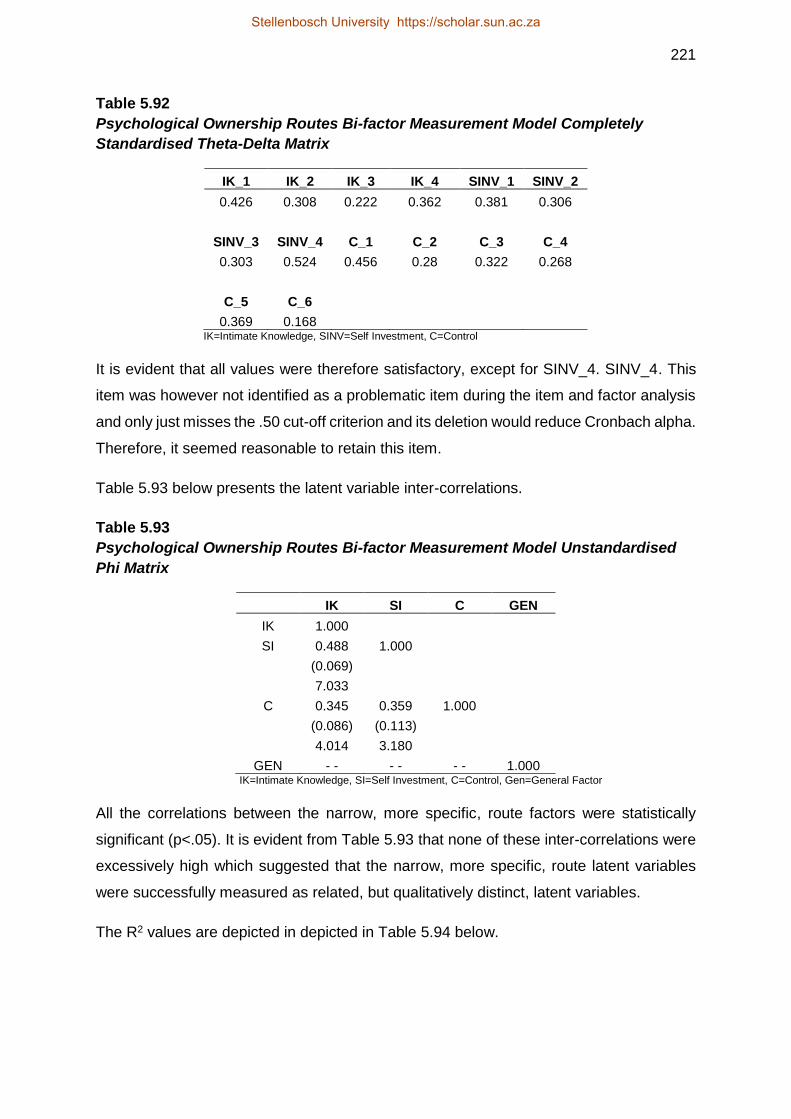
221
Table 5.92
Psychological Ownership Routes Bi-factor Measurement Model Completely
Standardised Theta-Delta Matrix
IK_1 IK_2 IK_3 IK_4 SINV_1 SINV_2
0.426 0.308 0.222 0.362 0.381 0.306
SINV_3 SINV_4 C_1 C_2 C_3 C_4
0.303 0.524 0.456 0.28 0.322 0.268
C_5 C_6
0.369 0.168 IK=Intimate Knowledge, SINV=Self Investment, C=Control
It is evident that all values were therefore satisfactory, except for SINV_4. SINV_4. This
item was however not identified as a problematic item during the item and factor analysis
and only just misses the .50 cut-off criterion and its deletion would reduce Cronbach alpha.
Therefore, it seemed reasonable to retain this item.
Table 5.93 below presents the latent variable inter-correlations.
Table 5.93
Psychological Ownership Routes Bi-factor Measurement Model Unstandardised
Phi Matrix
IK SI C GEN
IK 1.000
SI 0.488 1.000
(0.069)
7.033
C 0.345 0.359 1.000
(0.086) (0.113)
4.014 3.180
GEN - - - - - - 1.000 IK=Intimate Knowledge, SI=Self Investment, C=Control, Gen=General Factor
All the correlations between the narrow, more specific, route factors were statistically
significant (p<.05). It is evident from Table 5.93 that none of these inter-correlations were
excessively high which suggested that the narrow, more specific, route latent variables
were successfully measured as related, but qualitatively distinct, latent variables.
The R2 values are depicted in depicted in Table 5.94 below.
Stellenbosch University https://scholar.sun.ac.za

222
Table 5.94
Psychological Ownership Routes Bi-factor Measurement Model Squared Multiple
Correlations81
IK_1 IK_2 IK_3 IK_4 SINV_1 SINV_2
0.574 0.692 0.778 0.638 0.619 0.694
SINV_3 SINV_4 C_1 C_2 C_3 C_4
0.697 0.476 0.544 0.720 0.678 0.732
C_5 C_6
0.631 0.832 IK=Intimate Knowledge, SINV=Self Investment, C=Control
These values ranged from .476 to .832. This suggested somewhat satisfactory validity
and that the portion of variance explained by each of the indicator variables was
satisfactory except for SINV_4 which again failed to meet the 50% criterion and indicated
that only circa 48% of the variance in this indicator is due to self-investment and the broad
general route factor. Again, this item was not identified as problematic during the item
analysis, however it did suffer from both a lower R2 as well as a less than desirable (but
not outright terrible) measurement error variance.
After interpreting and analysing the above basket of evidence it seemed reasonable to
conclude that the psychological ownership routes bi-factor measurement model fitted the
data reasonably, the vital standardised factor loadings were statistically significant and
large, the variance terms were small and statistically significant and the R2 indices were
large, for most of the indicators, and discriminant validity was indicated. It was therefore
concluded that the operationalisation of the psychological ownership routes was
successful.
Motivation to pursue psychological ownership routes
The data was screened to test assumptions of normality prior to investigating model fit.
Results of the test for univariate and multivariate normality before normalisation, are
presented below in Table 5.95 and Table 5.96 respectively.
81 The R2-values are given by the sum of the completely standardised squared loading of the item on its narrow route factor and its completely standardised squared loading on the broad, general factor.
Stellenbosch University https://scholar.sun.ac.za

223
Table 5.95
Test of Univariate Normality for Motivation to Pursue the Routes before
Normalisation
Skewness Kurtosis Skewness and Kurtosis
Variable Z-Score P-Value Z-Score P-Value Chi-Square P-Value
MOT_1 -8.556 0.000 5.811 0.000 106.970 0.000
MOT_2 -7.720 0.000 3.814 0.000 74.145 0.000
MOT_3 -8.662 0.000 5.711 0.000 107.647 0.000
MOT_4 -10.361 0.000 7.410 0.000 162.258 0.000
MOT_5 -4.327 0.000 -2.014 0.044 22.776 0.000
MOT_6 -8.295 0.000 4.786 0.000 91.709 0.000
MOT_7 -10.979 0.000 8.066 0.000 185.595 0.000
MOT_8 -11.342 0.000 7.550 0.000 185.635 0.000
MOT_9 -9.146 0.000 5.764 0.000 116.879 0.000
MOT_10 -7.867 0.000 3.776 0.000 76.141 0.000
MOT_11 -5.508 0.000 0.800 0.423 30.978 0.000
MOT_12 -6.911 0.000 3.182 0.001 57.891 0.000
MOT_13 -8.370 0.000 5.096 0.000 96.020 0.000
MOT_14 -4.601 0.000 -1.389 0.165 23.100 0.000
MOT_15 -7.411 0.000 3.473 0.001 66.988 0.000
MOT_16 -8.633 0.000 5.127 0.000 100.810 0.000
MOT_17 -8.397 0.000 4.432 0.000 90.151 0.000
MOT_18 -8.157 0.000 4.177 0.000 83.980 0.000 Mot=Motivation
Table 5.96
Test of Multivariate Normality for Motivation to Pursue the Routes before
Normalisation
Skewness Kurtosis Skewness and Kurtosis
Value Z-Score P-Value Value Z-Score P-Value Chi-Square P-Value
103.614 50.733 0.000 568.648 23.001 0.000 3102.841 0.000
The chi-square for skewness and kurtosis presented in Table 5.95 above indicates that all
of the items similarly failed the test of univariate normality (p<.05). Furthermore, the null
hypothesis that the data follows a multivariate normal distribution also had to be rejected
(X2=3102.841; p<.05). This therefore indicated the need to normalise the items82 in
82 Normalisation was conducted in order for the data to satisfy the assumption of multivariate normality as the quality of the solutions obtained is critically dependent upon this assumption being met.
Stellenbosch University https://scholar.sun.ac.za
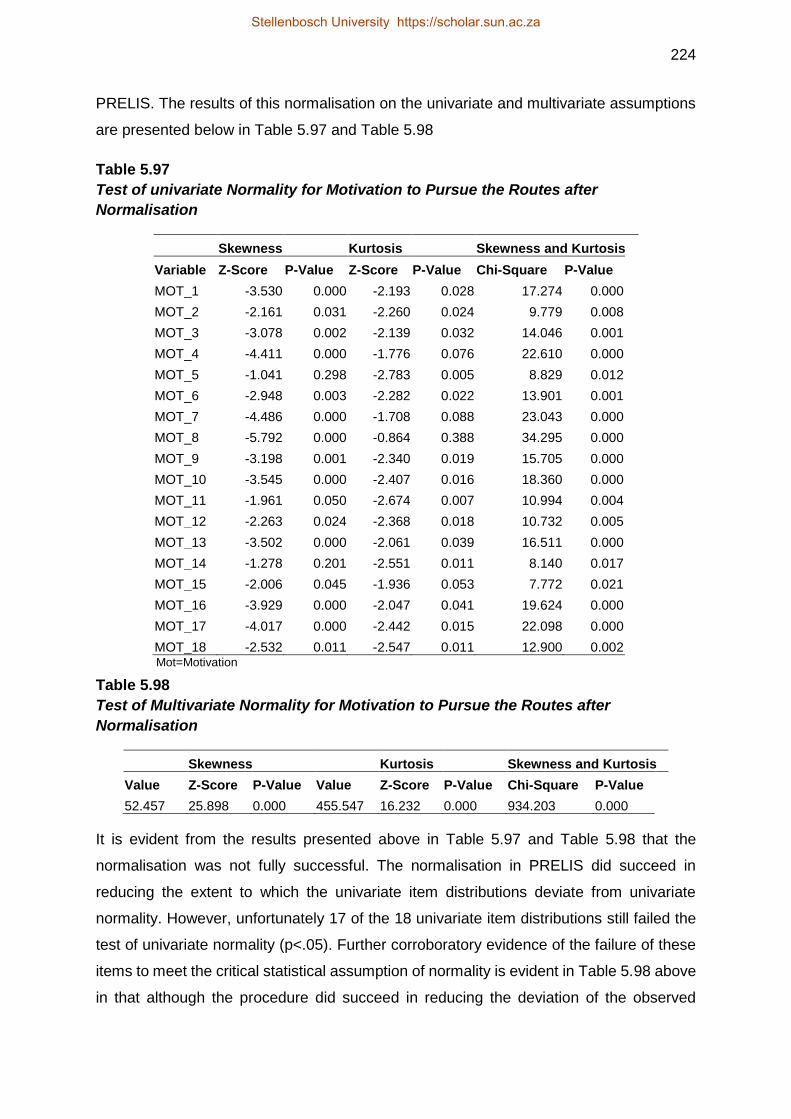
224
PRELIS. The results of this normalisation on the univariate and multivariate assumptions
are presented below in Table 5.97 and Table 5.98
Table 5.97
Test of univariate Normality for Motivation to Pursue the Routes after
Normalisation
Skewness Kurtosis Skewness and Kurtosis
Variable Z-Score P-Value Z-Score P-Value Chi-Square P-Value
MOT_1 -3.530 0.000 -2.193 0.028 17.274 0.000
MOT_2 -2.161 0.031 -2.260 0.024 9.779 0.008
MOT_3 -3.078 0.002 -2.139 0.032 14.046 0.001
MOT_4 -4.411 0.000 -1.776 0.076 22.610 0.000
MOT_5 -1.041 0.298 -2.783 0.005 8.829 0.012
MOT_6 -2.948 0.003 -2.282 0.022 13.901 0.001
MOT_7 -4.486 0.000 -1.708 0.088 23.043 0.000
MOT_8 -5.792 0.000 -0.864 0.388 34.295 0.000
MOT_9 -3.198 0.001 -2.340 0.019 15.705 0.000
MOT_10 -3.545 0.000 -2.407 0.016 18.360 0.000
MOT_11 -1.961 0.050 -2.674 0.007 10.994 0.004
MOT_12 -2.263 0.024 -2.368 0.018 10.732 0.005
MOT_13 -3.502 0.000 -2.061 0.039 16.511 0.000
MOT_14 -1.278 0.201 -2.551 0.011 8.140 0.017
MOT_15 -2.006 0.045 -1.936 0.053 7.772 0.021
MOT_16 -3.929 0.000 -2.047 0.041 19.624 0.000
MOT_17 -4.017 0.000 -2.442 0.015 22.098 0.000
MOT_18 -2.532 0.011 -2.547 0.011 12.900 0.002 Mot=Motivation
Table 5.98
Test of Multivariate Normality for Motivation to Pursue the Routes after
Normalisation
Skewness Kurtosis Skewness and Kurtosis
Value Z-Score P-Value Value Z-Score P-Value Chi-Square P-Value
52.457 25.898 0.000 455.547 16.232 0.000 934.203 0.000
It is evident from the results presented above in Table 5.97 and Table 5.98 that the
normalisation was not fully successful. The normalisation in PRELIS did succeed in
reducing the extent to which the univariate item distributions deviate from univariate
normality. However, unfortunately 17 of the 18 univariate item distributions still failed the
test of univariate normality (p<.05). Further corroboratory evidence of the failure of these
items to meet the critical statistical assumption of normality is evident in Table 5.98 above
in that although the procedure did succeed in reducing the deviation of the observed
Stellenbosch University https://scholar.sun.ac.za

225
multivariate indicator distribution from the theoretical multivariate normal distribution (chi-
square statistic decreased from 3102.841 to 934.203), the null hypothesis that the data
follows a multivariate normal distribution still had to be rejected (X2 = 934.203; p<.05).
Therefore, since the normalisation was not completely successful, but there was a
reduction in the chi-square statistic, an alternative estimation technique, namely robust
maximum likelihood estimation was used. CFA was conducted on the motivation to pursue
the routes towards psychological ownership subscale with two factors namely expectancy
and valence. The goodness of fit statistics are presented below in Table 5.99.
It is evident from the statistics in Table 5.99 that this model fits very poorly (RMSEA=.170).
Therefore, due to the findings of the dimensionality analysis and the high number of theta-
delta modification indices (44.44%) a general factor was added to the measurement
model. These results are presented below in Table 5.10083.
It is evident from the goodness of fit statistics that this did not substantially improve the fit
of the motivation to pursue the routes measurement model. In an attempt to improve the
fit the researcher fitted a six factor measurement model. This decision was guided by the
results of the dimensionality and factor analysis as it seemed prudent to separate each of
the routes per motivational element namely expectancy and valence. The fit statistics for
the six-factor measurement model are shown in Table 5.101.
It is evident from Table 5. 101 below that this revised model fits reasonably, however the
close fit null hypothesis still had to be rejected. Upon deeper investigation of the model’s
modification indices it became clear that it was still plagued by a high number of
statistically significant (p<.01) modification indices associated with the theta-delta matrix.
It was therefore decided that a general factor should be added to the model. The visual
representation of this revised measurement model and goodness of fit results are
presented below in Figure 5.8 and Table 5.101 respectively.
83 Table 5.100 and Table 5.101 have been inserted on the pages that follow in order to improve readability.
Stellenbosch University https://scholar.sun.ac.za
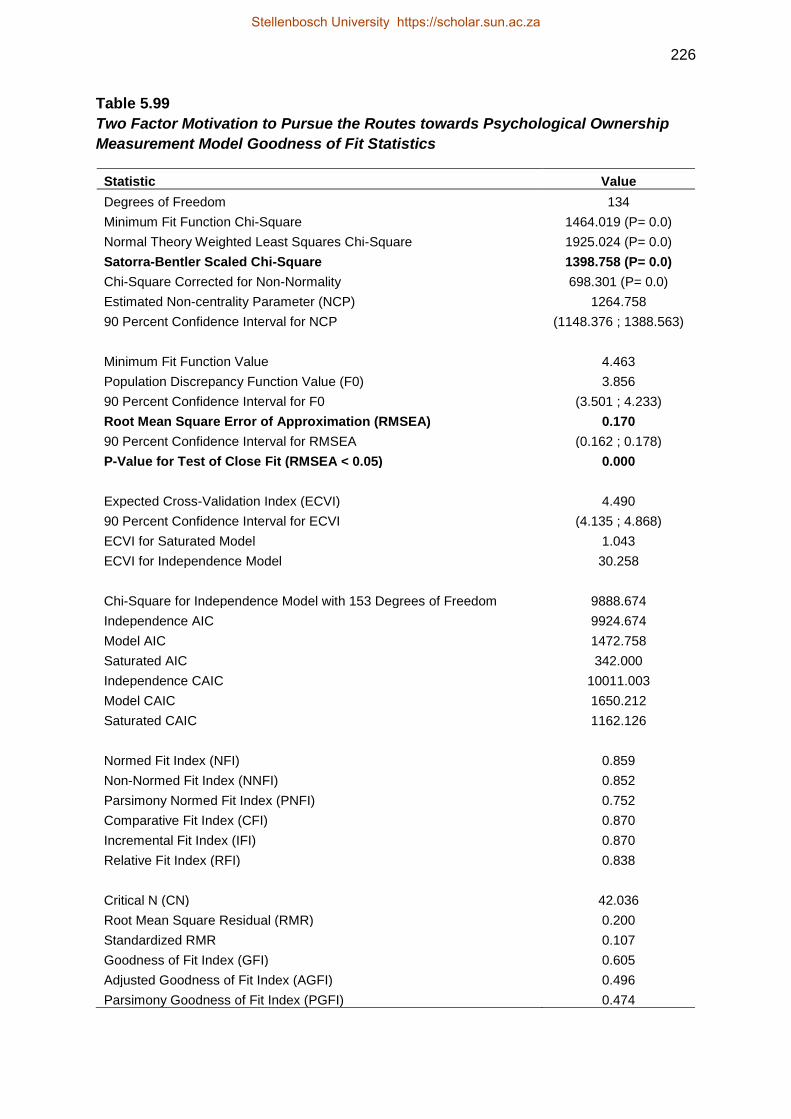
226
Table 5.99
Two Factor Motivation to Pursue the Routes towards Psychological Ownership
Measurement Model Goodness of Fit Statistics
Statistic Value
Degrees of Freedom 134
Minimum Fit Function Chi-Square 1464.019 (P= 0.0)
Normal Theory Weighted Least Squares Chi-Square 1925.024 (P= 0.0)
Satorra-Bentler Scaled Chi-Square 1398.758 (P= 0.0)
Chi-Square Corrected for Non-Normality 698.301 (P= 0.0)
Estimated Non-centrality Parameter (NCP) 1264.758
90 Percent Confidence Interval for NCP (1148.376 ; 1388.563)
Minimum Fit Function Value 4.463
Population Discrepancy Function Value (F0) 3.856
90 Percent Confidence Interval for F0 (3.501 ; 4.233)
Root Mean Square Error of Approximation (RMSEA) 0.170
90 Percent Confidence Interval for RMSEA (0.162 ; 0.178)
P-Value for Test of Close Fit (RMSEA < 0.05) 0.000
Expected Cross-Validation Index (ECVI) 4.490
90 Percent Confidence Interval for ECVI (4.135 ; 4.868)
ECVI for Saturated Model 1.043
ECVI for Independence Model 30.258
Chi-Square for Independence Model with 153 Degrees of Freedom 9888.674
Independence AIC 9924.674
Model AIC 1472.758
Saturated AIC 342.000
Independence CAIC 10011.003
Model CAIC 1650.212
Saturated CAIC 1162.126
Normed Fit Index (NFI) 0.859
Non-Normed Fit Index (NNFI) 0.852
Parsimony Normed Fit Index (PNFI) 0.752
Comparative Fit Index (CFI) 0.870
Incremental Fit Index (IFI) 0.870
Relative Fit Index (RFI) 0.838
Critical N (CN) 42.036
Root Mean Square Residual (RMR) 0.200
Standardized RMR 0.107
Goodness of Fit Index (GFI) 0.605
Adjusted Goodness of Fit Index (AGFI) 0.496
Parsimony Goodness of Fit Index (PGFI) 0.474
Stellenbosch University https://scholar.sun.ac.za
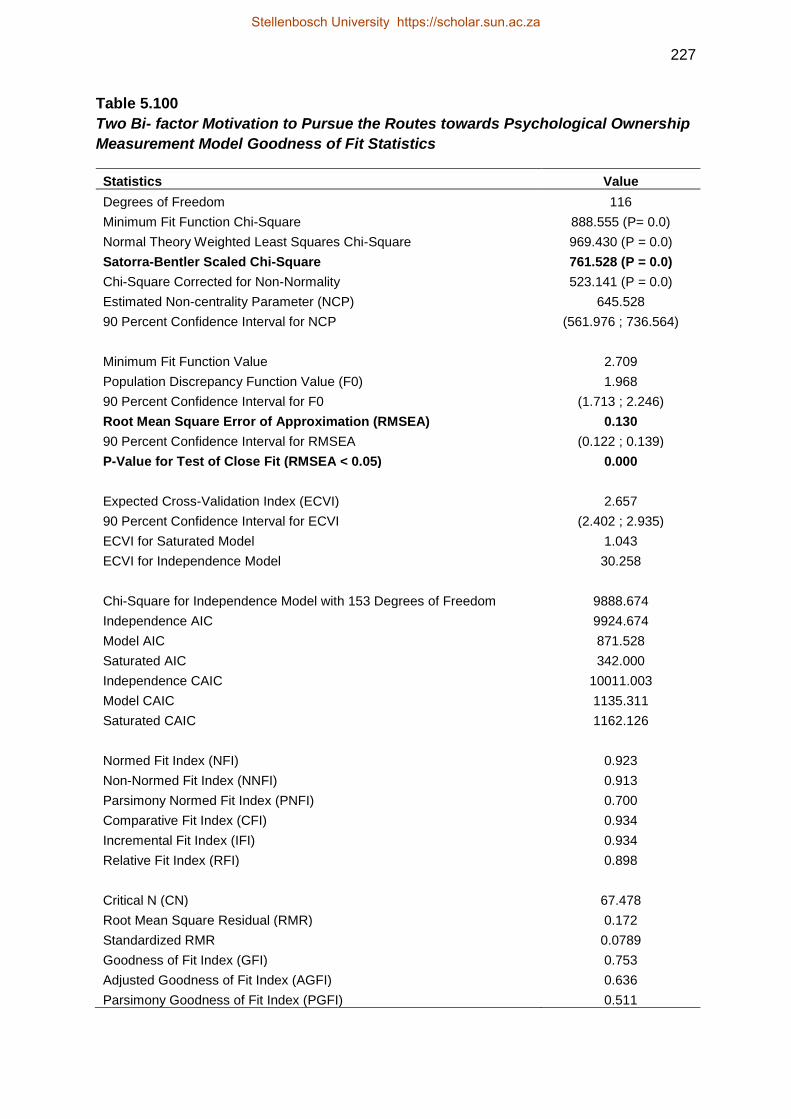
227
Table 5.100
Two Bi- factor Motivation to Pursue the Routes towards Psychological Ownership
Measurement Model Goodness of Fit Statistics
Statistics Value
Degrees of Freedom 116
Minimum Fit Function Chi-Square 888.555 (P= 0.0)
Normal Theory Weighted Least Squares Chi-Square 969.430 (P = 0.0)
Satorra-Bentler Scaled Chi-Square 761.528 (P = 0.0)
Chi-Square Corrected for Non-Normality 523.141 (P = 0.0)
Estimated Non-centrality Parameter (NCP) 645.528
90 Percent Confidence Interval for NCP (561.976 ; 736.564)
Minimum Fit Function Value 2.709
Population Discrepancy Function Value (F0) 1.968
90 Percent Confidence Interval for F0 (1.713 ; 2.246)
Root Mean Square Error of Approximation (RMSEA) 0.130
90 Percent Confidence Interval for RMSEA (0.122 ; 0.139)
P-Value for Test of Close Fit (RMSEA < 0.05) 0.000
Expected Cross-Validation Index (ECVI) 2.657
90 Percent Confidence Interval for ECVI (2.402 ; 2.935)
ECVI for Saturated Model 1.043
ECVI for Independence Model 30.258
Chi-Square for Independence Model with 153 Degrees of Freedom 9888.674
Independence AIC 9924.674
Model AIC 871.528
Saturated AIC 342.000
Independence CAIC 10011.003
Model CAIC 1135.311
Saturated CAIC 1162.126
Normed Fit Index (NFI) 0.923
Non-Normed Fit Index (NNFI) 0.913
Parsimony Normed Fit Index (PNFI) 0.700
Comparative Fit Index (CFI) 0.934
Incremental Fit Index (IFI) 0.934
Relative Fit Index (RFI) 0.898
Critical N (CN) 67.478
Root Mean Square Residual (RMR) 0.172
Standardized RMR 0.0789
Goodness of Fit Index (GFI) 0.753
Adjusted Goodness of Fit Index (AGFI) 0.636
Parsimony Goodness of Fit Index (PGFI) 0.511
Stellenbosch University https://scholar.sun.ac.za

228
Table 5.101
Six Factor Motivation to Pursue the Routes Measurement Model Goodness of Fit
Statistics
Statistic Value
Degrees of Freedom 107.000
Minimum Fit Function Chi-Square 399.798 (P= 0.0)
Normal Theory Weighted Least Squares Chi-Square 377.905 (P= 0.0)
Satorra-Bentler Scaled Chi-Square 298.338 (P= 0.0)
Chi-Square Corrected for Non-Normality 327.312 (P= 0.0)
Estimated Non-centrality Parameter (NCP) 191.338
90 Percent Confidence Interval for NCP (143.642 ; 246.687)
Minimum Fit Function Value 1.219
Population Discrepancy Function Value (F0) 0.583
90 Percent Confidence Interval for F0 (0.438 ; 0.752)
Root Mean Square Error of Approximation (RMSEA) 0.074
90 Percent Confidence Interval for RMSEA (0.0640 ; 0.0838)
P-Value for Test of Close Fit (RMSEA < 0.05) 0.000
Expected Cross-Validation Index (ECVI) 1.300
90 Percent Confidence Interval for ECVI (1.154 ; 1.469)
ECVI for Saturated Model 1.043
ECVI for Independence Model 30.258
Chi-Square for Independence Model with 153 Degrees of Freedom 9888.674
Independence AIC 9924.674
Model AIC 426.338
Saturated AIC 342.000
Independence CAIC 10011.003
Model CAIC 733.286
Saturated CAIC 1162.126
Normed Fit Index (NFI) 0.970
Non-Normed Fit Index (NNFI) 0.972
Parsimony Normed Fit Index (PNFI) 0.678
Comparative Fit Index (CFI) 0.980
Incremental Fit Index (IFI) 0.980
Relative Fit Index (RFI) 0.957
Critical N (CN) 159.258
Root Mean Square Residual (RMR) 0.060
Standardized RMR 0.041
Goodness of Fit Index (GFI) 0.887
Adjusted Goodness of Fit Index (AGFI) 0.819
Parsimony Goodness of Fit Index (PGFI) 0.555
Stellenbosch University https://scholar.sun.ac.za
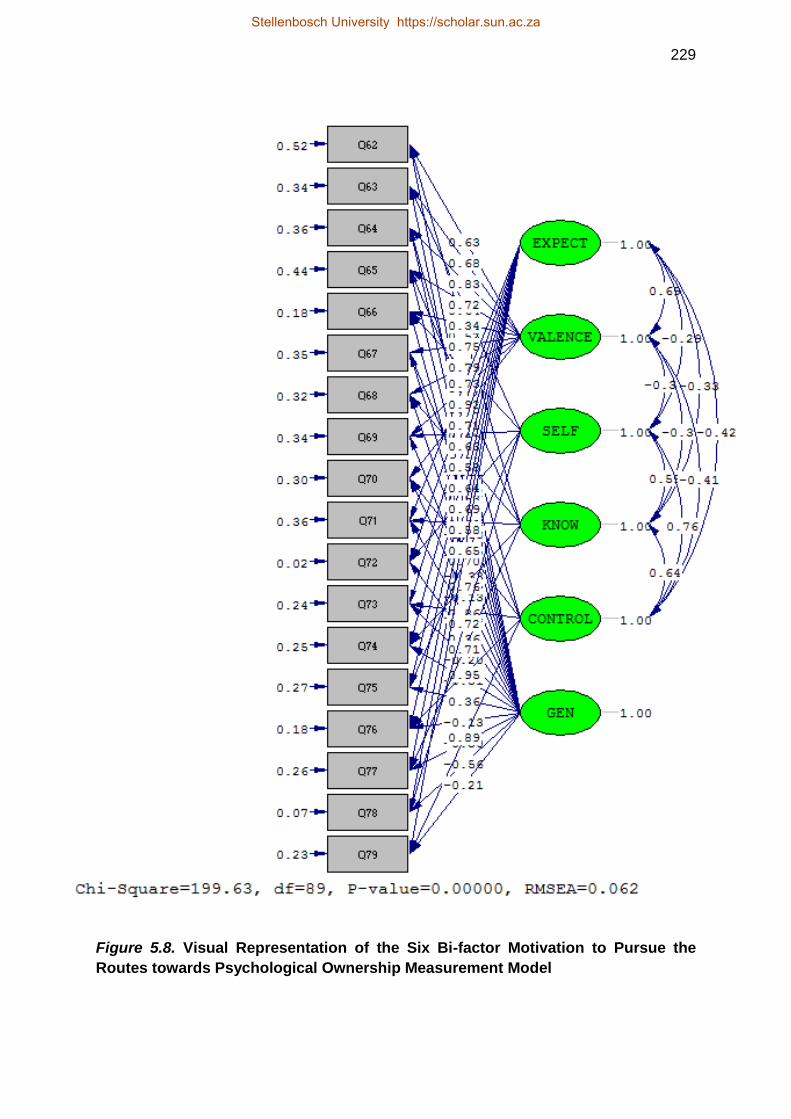
229
Figure 5.8. Visual Representation of the Six Bi-factor Motivation to Pursue the
Routes towards Psychological Ownership Measurement Model
Stellenbosch University https://scholar.sun.ac.za

230
Table 5.102
Six Bi-factor Motivation to Pursue the Routes towards Psychological Ownership
Measurement Model Goodness of Fit Statistics
Statistics Value
Degrees of Freedom 89
Minimum Fit Function Chi-Square 264.814 (P=0.0)
Normal Theory Weighted Least Squares Chi-Square 244.542 (P=0.00)
Satorra-Bentler Scaled Chi-Square 199.628 (P=0.00)
Chi-Square Corrected for Non-Normality 260.935 (P=0.0)
Estimated Non-centrality Parameter (NCP) 110.628
90 Percent Confidence Interval for NCP (73.465 ; 155.524)
Minimum Fit Function Value 0.807
Population Discrepancy Function Value (F0) 0.337
90 Percent Confidence Interval for F0 (0.224 ; 0.474)
Root Mean Square Error of Approximation (RMSEA) 0.062
90 Percent Confidence Interval for RMSEA (0.0502 ; 0.0730)
P-Value for Test of Close Fit (RMSEA < 0.05) 0.048
Expected Cross-Validation Index (ECVI) 1.109
90 Percent Confidence Interval for ECVI (0.995 ; 1.245)
ECVI for Saturated Model 1.043
ECVI for Independence Model 30.258
Chi-Square for Independence Model with 153 Degrees of Freedom 9888.674
Independence AIC 9924.674
Model AIC 363.628
Saturated AIC 342.000
Independence CAIC 10011.003
Model CAIC 756.905
Saturated CAIC 1162.126
Normed Fit Index (NFI) 0.980
Non-Normed Fit Index (NNFI) 0.980
Parsimony Normed Fit Index (PNFI) 0.570
Comparative Fit Index (CFI) 0.989
Incremental Fit Index (IFI) 0.989
Relative Fit Index (RFI) 0.965
Critical N (CN) 203.004
Root Mean Square Residual (RMR) 0.038
Standardized RMR 0.029
Goodness of Fit Index (GFI) 0.923
Adjusted Goodness of Fit Index (AGFI) 0.853
Parsimony Goodness of Fit Index (PGFI) 0.481
Stellenbosch University https://scholar.sun.ac.za

231
The exact fit null hypothesis was rejected in favour of the exact fit alternative hypothesis.
The close fit null hypothesis was also rejected, when interpreting the exceedance
probability without rounding, but was not rejected when rounding the exceedance
probability up to two decimal figures.
The remaining fit statistics provide an indication of reasonable fit, however this fit was
marginally better than the fit of the six factor measurement model. This improvement was
a promising conclusion. The finding of reasonable fit meant that the parameter estimates
could be explored to determine final conclusions pertaining to this scales ability to
operationalise the latent variable they were developed to reflect. The parameter estimates
are presented below in Tables 5. 103 to Table 5.107.
Table 5.103
Motivation to Pursue the Routes towards Psychological Ownership Six, Bi-Factor
Unstandardised Lambda-X Matrix
EXPECT VALENCE SELF KNOW CONTROL GEN
Mot_1 - - 0.606 - - 0.501 - - -0.035
(0.106) (0.099) (0.080)
5.702 5.082 -0.444
Mot_2 - - 0.925 0.867 - - - - 0.409
(0.144) (0.207) (0.201)
6.408 4.186 2.041
Mot_3 - - 0.888 - - - - 0.603 -0.121
(0.124) (0.156) (0.111)
7.188 3.875 -1.091
Mot_4 - - 0.598 - - 0.395 - - -0.096
(0.092) (0.087) (0.076)
6.483 4.556 -1.260
Mot_5 - - 0.579 1.407 - - - - 0.747
(0.183) (0.279) (0.371)
3.156 5.038 2.014
Mot_6 - - 0.901 - - - - 0.870 -0.099
(0.153) (0.159) (0.149)
5.881 5.479 -0.666
Mot_7 - - 0.692 - - 0.447 - - -0.148
(0.108) (0.095) (0.085)
6.421 4.726 -1.736
Mot_8 - - 0.798 0.470 - - - - -0.342
(0.132) (0.179) (0.123)
6.059 2.622 -2.775
Mot_9 - - 0.924 - - - - 0.854 -0.148
(0.154) (0.157) (0.144)
Stellenbosch University https://scholar.sun.ac.za

232
5.984 5.421 -1.023
Mot_10 0.782 - - - - 0.674 - - -0.150
(0.176) (0.135) (0.137)
4.446 4.977 -1.094
Mot_11 1.339 - - 0.763 - - - - 0.529
(0.147) (0.329) (0.249)
9.121 2.316 2.124
Mot_12 0.922 - - - - - - 1.112 -0.254
(0.246) (0.200) (0.227)
3.747 5.571 -1.116
Mot_13 0.640 - - - - 0.773 - - -0.316
(0.213) (0.134) (0.130)
2.999 5.776 -2.433
Mot_14 0.948 - - 1.132 - - - - 0.588
(0.163) (0.287) (0.294)
5.822 3.940 1.997
Mot_15 0.860 - - - - - - 1.278 -0.180
(0.257) (0.186) (0.262)
3.341 6.857 -0.686
Mot_16 0.664 - - - - 0.684 - - -0.291
(0.195) (0.126) (0.123)
3.414 5.443 -2.358
Mot_17 0.679 - - 0.840 - - - - -0.657
(0.269) (0.273) (0.209)
2.521 3.077 -3.139
Mot_18 0.891 - - - - - - 1.227 -0.291
(0.262) (0.201) (0.250)
3.396 6.105 -1.167 Mot=Motivation
The addition of the bi-factor did seem to improve the fit of the motivation to pursue the
routes towards psychological ownership measurement model with eight items loading
statistically significantly (p<.05)84 on the broad factor. Unfortunately however, ten of the
items did not load significantly on the broad general motivation factor. All of the items did
load statistically significantly (p<.05) on the narrow factors that they were meant to load.
It was therefore concluded that the bi-factor argument was tenuous although not
altogether without merit (C.C. Theron, personal communication, May 10, 2017). As above,
it is however prudent to investigate the completely standardised lambda-X matrix (Table
5.104) before making any decisions.
84 The statistical significance of the factor loadings were evaluated via a two-tailed test by testing H0i:
ij=0 against Hai: ij≠0.
Stellenbosch University https://scholar.sun.ac.za

233
Table 5.104
Motivation to Pursue the Routes towards Psychological Ownership Six, Bi-Factor
Completely Standardised Lambda-X Matrix
EXPECT VALENCE SELF KNOW CONTROL GEN
Mot_1 - - 0.631 - - 0.522 - - -0.037 Mot_2 - - 0.678 0.635 - - - - 0.3 Mot_3 - - 0.833 - - - - 0.566 -0.113 Mot_4 - - 0.722 - - 0.477 - - -0.116 Mot_5 - - 0.344 0.836 - - - - 0.444 Mot_6 - - 0.752 - - - - 0.726 -0.083 Mot_7 - - 0.792 - - 0.512 - - -0.169 Mot_8 - - 0.766 0.451 - - - - -0.328 Mot_9 - - 0.786 - - - - 0.727 -0.126 Mot_10 0.727 - - - - 0.626 - - -0.139 Mot_11 0.921 - - 0.525 - - - - 0.364 Mot_12 0.711 - - - - - - 0.858 -0.196 Mot_13 0.627 - - - - 0.758 - - -0.31 Mot_14 0.585 - - 0.698 - - - - 0.362 Mot_15 0.640 - - - - - - 0.952 -0.134 Mot_16 0.687 - - - - 0.707 - - -0.301 Mot_17 0.582 - - 0.720 - - - - -0.563 Mot_18 0.648 - - - - - - 0.893 -0.212
Mot=Motivation
Table 5.104 above indicates that several of the items were less than satisfactory (<.50)
while others were good (>.71) at reflecting the variance in the latent variable in question.
However, the researcher believes that this situation arose due to the complex nature of
each item. This complexity revolves around the fact that the items had to represent both
a motivational factor as well as a route. The wording of each item therefore had to refer to
a specific motivational factor (valence or expectancy) as well as a specific route (investing
of the self, gaining intimate knowledge and ability to take control) very clearly. The fact
that all the items statistically significantly load on two narrow factors indicated that the
items did succeed in doing so but the magnitude of the completely standardised factor
loadings on the other hand suggest that not all of the items achieved this objective equally
successfully. In the case of some items only one of the factors on which the item loads is
explained well as judged by the factor loading criteria applied thus far. The criteria
requiring loadings of .71 or at least .50, however, assumed that each item is only meant
to reflect a single underlying latent dimension. In the case of complex items the existing
criteria become unrealistic. In some instances it is the expectancy factor or valence factor
Stellenbosch University https://scholar.sun.ac.za

234
and in the case of other items more variance is explained in the route factor on which the
item loads.
In the final analysis the factor matrix should, however, not be interpreted in terms of the
individual factor loadings in isolation but should rather be viewed collectively for each item.
The critical question is therefore what proportion of the variance in each item is explained
by the four factors that it represented. The sum of the squared completely standardised
factor loadings have therefore to be interpreted. The interpretation of results shown in
Table 5.104 should therefore take cognisance of the R² values shown in Table 5.10. The
researcher is of the opinion that when viewed from this perspective the complex situation
presented above in terms of factor loadings is tolerable for all the items except Mot_1.
Table 5.107 shows that the four factors each item was designated to reflect explained
more than 50% of the variance in all the items except Mot_185.
It is additionally evident from Table 5.104 above that the items at times [but not
consistently] also reflect a general broad motivation factor, but where they do, a very small
proportion of the variance in the items are due to the broad general factor.
Table 5.105 shows the unstandardised theta-delta matrix.
Table 5.105
Motivation to Pursue the Routes towards Psychological Ownership Six, Bi-Factor
Unstandardised Theta-Delta Matrix
Mot_1 Mot_2 Mot_3 Mot_4 Mot_5 Mot_6
0.483 0.640 0.406 0.304 0.522 0.496
(0.053) (0.098) (0.051) (0.037) (0.237) (0.066)
9.172 6.524 7.912 8.224 2.201 7.531
Mot_7 Mot_8 Mot_9 Mot_10 Mot_11 Mot_12
0.246 0.370 0.420 0.415 0.040 0.398
(0.035) (0.056) (0.048) (0.050) (0.180) (0.052)
7.095 6.596 8.769 8.272 0.222 7.590
Mot_13 Mot_14 Mot_15 Mot_16 Mot_17 Mot_18
0.258 0.717 0.331 0.239 0.089 0.432
(0.046) (0.114) (0.044) (0.036) (0.088) (0.061)
5.670 6.270 7.445 6.641 1.006 7.100 Mot=Motivation
85 The R2-value for Mot_1 also only marginally missed the 50% cut-off value.
Stellenbosch University https://scholar.sun.ac.za

235
It is evident from Table 5.105 above that most of the items are statistically significantly
plagued with error variance, except for Mot_11 and Mot_17. Although this finding would
be a pleasant one it is somewhat unrealistic in that this could mean that (in the parameter)
Mot_11 and Mot_17 were perfect indicators of the latent variables they were developed
to reflect. This is, as mentioned, a somewhat unrealistic finding. However, it is the
completely standardised theta-delta matrix that is of particular interest. This is presented
below in Table 5.106.
Table 5.106
Motivation to Pursue the Routes towards Psychological Ownership Six, Bi-Factor
Completely Standardised Theta-Delta
Mot_1 Mot_2 Mot_3 Mot_4 Mot_5 Mot_6
0.524 0.344 0.357 0.442 0.184 0.346
Mot_7 Mot_8 Mot_9 Mot_10 Mot_11 Mot_12
0.323 0.341 0.304 0.359 0.019 0.237
Mot_13 Mot_14 Mot_15 Mot_16 Mot_17 Mot_18
0.248 0.273 0.183 0.256 0.065 0.228 Mot=Motivation
The error variance level is reasonable for all items, except for Mot_1 where it fell just
above the .50, as displayed in Table 5.106. This means that more than 50% of the
variance in Mot_1 can be ascribed to systematic and random error and puts into question
the success with which this item reflect the latent variables it was meant to reflect. This
item was however not identified as a problematic item during the item analysis. It should,
however, be conceded that the item analysis was not conducted with this factor structure
in mind. Mot_11 and Mot_17 stand out as items with very low sample measurement error
variance estimates. Lastly, the squared multiple correlation matrix was investigated, as
presented below in Table 5.107.
Stellenbosch University https://scholar.sun.ac.za

236
Table 5.107
Motivation to Pursue the Routes towards Psychological Ownership Six, Bi-Factor
Squared Multiple Correlations
Mot_1 Mot_2 Mot_3 Mot_4 Mot_5 Mot_6
0.476 0.656 0.643 0.558 0.816 0.654
Mot_7 Mot_8 Mot_9 Mot_10 Mot_11 Mot_12
0.677 0.659 0.696 0.641 0.981 0.763
Mot_13 Mot_14 Mot_15 Mot_16 Mot_17 Mot_18
0.752 0.727 0.817 0.744 0.935 0.772 Mot=Motivation
As indicated above, Mot_1 was somewhat less related to the motivation factors it was
designated to reflect in terms of the imposed model, however it only marginally misses the
.50 cut-off for this assumption. It is evident that for all the remaining items a satisfactory
percentage of variance of the observed item variance was accounted for by their
relationship with the motivation factors they were designated to reflect.
It was therefore concluded that, although there is a certain level of complexity present
within the motivation to pursue the routes subscale, this measurement model fitted
reasonably well. The standardised factor loadings were statistically significant and large,
the variance terms were again small and statistically significant and the R2 indices were
large, for most of the indicators. It was therefore concluded that the operationalisation of
the motivation to pursue the routes was successful.
The item analysis was re-run for the motivation to pursue the routes towards psychological
ownership scale using the six bi-factor model. A summary of the results is presented below
in Table 5.108 and Table 5.109 respectively.
Stellenbosch University https://scholar.sun.ac.za

237
Table 5.108
Summary Item Analysis Statistics for the Motivation to Pursue the Routes towards
Psychological Ownership Six Factor
Subscale Cronbach's Alpha N of Items Mot_Val_IK .824 3 Items Mean Std. Deviation N Mot_1 6.12 .960 329 Mot_4 6.35 .828 329 Mot_7 6.33 .874 329
Subscale Cronbach's Alpha N of Items
Mot_Val_SI .680 3 Items Mean Std. Deviation N Mot_2 5.56 1.365 329 Mot_5 4.81 1.684 329 Mot_8 6.34 1.042 329
Subscale Cronbach's Alpha N of Items
Mot_Val_C .880 3 Items Mean Std. Deviation N Mot_9 5.94 1.175 329 Mot_6 5.85 1.198 329 Mot_3 5.98 1.066 329
Subscale Cronbach's Alpha N of Items
Mot_Exp_IK .883 3 Items Mean Std. Deviation N Mot_13 6.07 1.020 329 Mot_16 6.17 .967 329 Mot_10 6.04 1.076 329
Subscale Cronbach's Alpha N of Items
Mot_Exp_SI .768 3 Items Mean Std. Deviation N Mot_11 5.33 1.453 329 Mot_14 4.96 1.622 329 Mot_17 6.02 1.167 329
Subscale Cronbach's Alpha N of Items
Mot_Exp_C .928 3 Items Mean Std. Deviation N Mot_15 5.53 1.343 329 Mot_18 5.66 1.375 329 Mot_12 5.60 1.296 329 Mot=Motivation
It is evident that all but two of the motivation to pursue the routes towards psychological
ownership subscales achieved a Cronbach’s alpha above the critical cut-off point (.80).
Mot_Val_SI (.680) and Mot_Exp_SI (.768)86 failed to meet this criterion therefore providing
evidence of questionable internal consistency within this subscale. There do not however
86 This again brings into question Mot_17, since it was previously identified as a potentially problematic item during the CFA. It, however, needs to be remembered that the previous item analysis assumed a different underlying factor structure.
Stellenbosch University https://scholar.sun.ac.za

238
seem to be any extreme means or low standard deviations to support the notion of
problematic items, suggested by the low Cronbach alpha. However, Mot_5’s mean,
although not extreme, is slightly lower when compared to the remaining items for
Mot_Val_SI. However, from Table 5.109 below it is evident that deletion of this item would
decrease the internal consistency of this scale (Cronbach’s alpha decreases from .680 to
.588). Given the small number of items designated to each subscale the somewhat lower
coefficients of internal consistency are not altogether surprising.
Further supporting evidence for the potential of poor items is provided by the summary
Table 5.10987 below.
Table 5.109
Summary Statistics for the Motivation to Pursue the Routes Six Factor – if Items
Deleted
Item Scale Mean if Item Deleted
Scale Variance if
Item Deleted
Corrected Item-Total Correlation
Squared Multiple
Correlation
Cronbach's Alpha if Item
Deleted
Mot_1 12.68 2.395 .655 .437 .789 Mot_4 12.45 2.748 .666 .460 .773 Mot_7 12.47 2.494 .727 .531 .710 Mot_2 11.16 4.670 .685 .470 .321 Mot_5 11.91 4.177 .518 .378 .588 Mot_8 10.38 7.510 .346 .191 .749 Mot_9 11.83 4.329 .789 .623 .811 Mot_6 11.92 4.295 .772 .599 .828 Mot_3 11.79 4.896 .749 .562 .850 Mot_13 12.21 3.500 .804 .659 .805 Mot_16 12.11 3.736 .787 .638 .823 Mot_10 12.24 3.506 .731 .535 .873 Mot_11 10.98 5.414 .737 .606 .525 Mot_14 11.35 4.832 .708 .597 .562 Mot_17 10.29 8.365 .412 .172 .866 Mot_15 11.26 6.380 .870 .757 .881 Mot_18 11.12 6.308 .853 .732 .895 Mot_12 11.19 6.773 .835 .698 .909 Mot=Motivation
It is evident that an improvement in internal consistency occurred only when Mot_8 and
Mot_17 were to be deleted. For all of the remaining indicators deletion would result in a
poorer internal consistency. Since each subscale was only reflected by three indicators
and the evidence for deletion of certain items was not overwhelming, it was decided that
these items would be retained.
87 Table 5.105 is a summary of the item statistics collated from the separate outputs obtained from the six item
analyses performed on the three items included in each subscale.
Stellenbosch University https://scholar.sun.ac.za

239
5.7 ITEM PARCELS
An ideal situation in research would be to use the individual items that make up the scale
to operationalise the latent variables they were developed to represent. However, this
scenario would lead to very complex models with a large number of structural and
measurement model parameters that need to be estimated88. Therefore, to operationalise
the latent variables in a manner that reduces the complexity of the model, two item parcels
were created for each latent variable. Little, Cunningham, Shahar and Widaman (2002)
point out that there are several advantages or psychometric merits justifying the use of
item parcelling. These include, but are not limited to the low reliability, communality and
greater likelihood of distributional violations involved in the use of individual items. Models
based on parcels are also, according to Little et al. (2002), more parsimonious and display
less of a chance of correlation between the measurement error terms.
Therefore, before the fitting of the measurement and structural model could commence
item parcels were created by calculating the means of the even and uneven numbered
items of each scale or subscale and creating two item parcels per latent variable. The
orthogonalising, or residual centering procedure proposed by Little et al. (2006) was used
to calculate the effect indicators for the latent product terms and the latent squared terms
in the model.
5.8 FITTING THE PSYCHOLOGICAL OWNERSHIP MEASUREMENT MODEL
Data screening prior to fitting the measurement model and structural model
Multivariate statistics, and particularly SEM, hinge on certain critical statistical
assumptions. One such assumption is that the indicator variables, used to operationalise
the latent variables, follow a multivariate normal distribution. More specifically, the default
method of estimation, namely maximum likelihood, when fitting the measurement model
to continuous data, assumes that the distribution of the indicator variables follows a
multivariate normal distribution. The inappropriate analysis of continuous non-normal
88 It was originally considered to use the job characteristic dimension scores and the root need dimension scores to represent the perceived job characteristics and the salient psychological ownership need strength latent variables. This would have resulted in a relatively large number of indicators for the phantom latent variables. This resulted in the calculation of two item parcels for these two latent variables with the parcelling being done in an odd-even format across the subscales as opposed to an approach that honoured the underlying factor structure. The drawback of this subsequent approach is recognised but the researcher would like to highlight that the situation was an unavoidable one due to a smaller than desired sample size (a problem that plagues many research studies especially at an academic level).
Stellenbosch University https://scholar.sun.ac.za

240
variables can result in incorrect standard errors and chi-square estimates, according to
DuToit and Du Toit (as cited in Theron, 2014a). This critical statistical assumption, in terms
of the default estimation technique used when fitting measurement models, of multivariate
normal distribution, must therefore be assessed prior to fitting the measurement or
structural models. It was therefore imperative to assess the null hypothesis that the item
parcels, used to operationalise the latent variables, follow a multivariate normal
distribution.
The test for univariate normality evaluates each indicator individually with regards to the
standardised test statistics of skewness and kurtosis, and whether these are significantly
different from zero. Departures from normality are indicated by significant skewness
and/or kurtosis sample estimates. However, it is crucial to examine multivariate values of
skewness and kurtosis and not exclusively evaluate univariate normality. If the null
hypothesis of multivariate normality is rejected, then the composite indicator variables
need to be normalised in an attempt to improve the symmetry and kurtosis of the indicator
variable distribution. Alternatively, other methods of estimation such as weighted least
squares, diagonal weighted least squares and robust maximum likelihood (RML) could be
used should the null hypothesis of multivariate normality be rejected. Mels (2003) supports
the use of RML if the assumption of normality does not hold. The results of the test of
univariate and multivariate normality of the psychological ownership measurement model
are presented below in Table 5.110 and Table 5.111 respectively.
The chi-square for skewness and kurtosis, presented in Table 5.106 above, indicated that
all of the composite indicator variables failed the test of univariate normality (p<.05).
Furthermore, the null hypothesis that the data follows a multivariate normal distribution
also had to be rejected (X2=14486.535; p<.05). This therefore indicated the need to
normalise the indicator variables89 in PRELIS.
89 Normalisation was conducted in order for the data to satisfy the assumption of multivariate normality as the quality of the solutions obtained is critically dependent upon this assumption being met.
Stellenbosch University https://scholar.sun.ac.za

241
Table 5.110
Test of Univariate Normality for the Psychological Ownership Measurement Model
before Normalisation
Variable Skewness Kurtosis Skewness and Kurtosis
Variable Z-Score P-Value Z-Score P-Value Chi-Square P-Value
JC_1 -7.075 0.000 3.498 0.000 62.289 0.000 JC_2 -7.229 0.000 4.278 0.000 70.570 0.000 IK_1 -7.741 0.000 4.911 0.000 84.046 0.000 IK_2 -7.727 0.000 5.763 0.000 92.925 0.000 SI_1 -9.898 0.000 6.647 0.000 142.149 0.000 SI_2 -8.686 0.000 5.237 0.000 102.868 0.000 C_1 -6.295 0.000 1.991 0.047 43.593 0.000 C_2 -5.768 0.000 0.706 0.480 33.773 0.000
PO_1 -9.186 0.000 5.172 0.000 111.140 0.000 PO_2 -8.416 0.000 4.896 0.000 94.799 0.000
PON_1 -6.459 0.000 4.131 0.000 58.787 0.000 PON_2 -6.376 0.000 3.817 0.000 55.219 0.000 MOT_1 -5.905 0.000 3.371 0.001 46.231 0.000 MOT_2 -6.381 0.000 3.566 0.000 53.431 0.000 RES_1 8.180 0.000 9.582 0.000 158.717 0.000 RES_2 1.601 0.109 6.934 0.000 50.642 0.000 RES_3 8.951 0.000 9.564 0.000 171.598 0.000 RES_4 4.326 0.000 7.159 0.000 69.975 0.000 RES_5 11.514 0.000 9.623 0.000 225.155 0.000 RES_6 11.914 0.000 9.708 0.000 236.189 0.000 RES_7 10.640 0.000 8.438 0.000 184.411 0.000 RES_8 10.595 0.000 8.500 0.000 184.505 0.000 RES_9 10.117 0.000 7.266 0.000 155.137 0.000 RES_10 11.901 0.000 8.648 0.000 216.415 0.000 RES_11 11.349 0.000 8.366 0.000 198.805 0.000 RES_12 13.336 0.000 9.745 0.000 272.826 0.000 RES_13 13.295 0.000 9.880 0.000 274.376 0.000 RES_14 13.375 0.000 9.847 0.000 275.842 0.000
JC=Job Characteristics, IK=Intimate Knowledge, SI=Self Investment, C=Control, PO=Psychological Ownership,
PON=Psychological Ownership Individual Needs, Mot=Motivation, Res=Residuals
Table 5.111
Test of Multivariate Normality for the Psychological Ownership Measurement
Model before Normalisation
Skewness Kurtosis Skewness and Kurtosis
Value Z-Score P-Value Value Z-Score P-Value Chi-Square P-Value 478.169 116.552 0.000 1415.975 30.035 0.000 14486.535 0.000
The results of this normalisation are presented below in Table 5.112 and Table 5.113
respectively.
Stellenbosch University https://scholar.sun.ac.za

242
Table 5.112
Test of Univariate Normality for the Psychological Ownership Measurement Model
after Normalisation
Variable Skewness Kurtosis Skewness and Kurtosis
Variable Z-Score P-Value Z-Score P-Value Chi-Square P-Value
JC_1 -0.072 0.943 -0.030 0.976 0.006 0.977 JC_2 -0.172 0.863 -0.226 0.821 0.081 0.960 IK_1 -2.487 0.013 -2.608 0.009 12.988 0.002 IK_2 -2.843 0.004 -2.688 0.007 15.310 0.000 SI_1 -2.676 0.007 -2.752 0.006 14.734 0.001 SI_2 -2.077 0.038 -2.427 0.015 10.204 0.006 C_1 -0.303 0.762 -0.356 0.722 0.219 0.896 C_2 -0.380 0.704 -0.562 0.574 0.460 0.794
PO_1 -2.918 0.004 -3.380 0.001 19.940 0.000 PO_2 -2.430 0.015 -3.209 0.001 16.205 0.000
PON_1 -0.608 0.543 -0.962 0.336 1.296 0.523 PON_2 -0.823 0.411 -1.316 0.188 2.407 0.300 MOT_1 -0.434 0.664 -0.821 0.412 0.862 0.650 MOT_2 -0.454 0.650 -0.767 0.443 0.794 0.672 RES_1 0.000 1.000 0.082 0.935 0.007 0.997 RES_2 0.000 1.000 0.082 0.935 0.007 0.997 RES_3 0.000 1.000 0.082 0.935 0.007 0.997 RES_4 0.000 1.000 0.082 0.935 0.007 0.997 RES_5 -0.005 0.996 0.075 0.940 0.006 0.997 RES_6 -0.003 0.997 0.077 0.938 0.006 0.997 RES_7 -0.006 0.995 0.073 0.942 0.005 0.997 RES_8 -0.003 0.997 0.077 0.938 0.006 0.997 RES_9 0.000 1.000 0.081 0.936 0.007 0.997 RES_10 0.001 0.999 0.079 0.937 0.006 0.997 RES_11 0.001 0.999 0.080 0.936 0.006 0.997 RES_12 -0.056 0.955 0.017 0.987 0.003 0.998 RES_13 0.069 0.945 -0.173 0.863 0.035 0.983 RES_14 -0.084 0.933 -0.007 0.995 0.007 0.996
JC=Job Characteristics, IK=Intimate Knowledge, SI=Self Investment, C=Control, PO=Psychological Ownership,
PON=Psychological Ownership Individual Needs, Mot=Motivation, Res=Residuals
Table 5.113
Test of Multivariate Normality for the Psychological Ownership Measurement
Model after Normalisation
Skewness Kurtosis Skewness and Kurtosis
Value Z-Score P-Value Value Z-Score P-Value Chi-Square P-Value
242.575 65.592 0.000 1079.123 21.686 0.000 4772.569 0.000
It is evident from the results presented above in Table 5.112 and Table 5.113 that the
normalisation was not fully successful. The normalisation in PRELIS did succeed in
increasing the p-values for all 28 composite indicator variables. However, unfortunately 6
of the 28 still failed the test of univariate normality (p<.05). Further corroboratory evidence
of the failure of these items to meet the critical statistical assumption of normality is evident
in Table 5.109 above, in that although the procedure did succeed in reducing the deviation
of the observed indicator distribution from the theoretical multivariate normal distribution
Stellenbosch University https://scholar.sun.ac.za

243
(chi-square statistic decreased from 14486.535 to 4772.569), the null hypothesis that the
data follows a multivariate normal distribution still had to be rejected (X2 = 4772.569;
p<.05).
Therefore, since the normalisation was not completely successful, but there was a
reduction in the chi-square statistic, an alternative estimation technique, namely robust
maximum likelihood estimation90 was used to analyse the normalised data set. The
appropriateness of this technique has been outlined above.
Evaluating the fit of the psychological ownership measurement model
An investigation into the substantive relationships of interest cannot occur unless the
psychometric quality of the measures used to operationalise the latent variables have
been verified. It is therefore important to first determine the psychometric quality of the
measures, prior to investigating the fit of the structural model or the substantive
relationships of interest. Evaluating the fit of the psychological ownership measurement
model involves the evaluation of the hypothesised relationships between the latent
variables in the psychological ownership structural model and the composite indicators
created to represent them. The objective is to determine the reliability and validity with
which the measures designed to represent the latent variables do just that. When fitting
the measurement model, verdicts pertaining to the goodness of fit are more credible if
derived from a combination of a variety of fit indices (Tanaka, 1993; Theron 2014a).
Although a wide range of goodness-of-fit statistics are available to evaluate model fit, no
one single measure is unequivocally superior when compared to the others. This is due
to the fact that intervening factors such as sample size, estimation procedure and model
complexity influence the way in which certain indices operate and furthermore fit is
measured differently by the various fit indices (Diamantopoulos & Siguaw, 2009).
Consensus about what constitutes "good fit statistics" (Tanaka, 1993) also seems to be
missing. Therefore, in order to reach a valid conclusion regarding the fit of a model it is
imperative to consider a basket of evidence surrounding measurement model fit (Theron,
2014a). However, this does not imply that all fit indices should be reported on, nor should
the choice of fit indices be purely motivated by popularity of use. Several relevant
90 The use of RML necessitates the creation of an asymptotic covariance matrix via PRELIS. This will enable the calculation of appropriate fit indices in LISREL (Mels, 2003)
Stellenbosch University https://scholar.sun.ac.za

244
indicators were subsequently considered when evaluating the measurement model fit of
the psychological ownership measurement model, but not all.
Fit was assessed using absolute fit indices and incremental as well as parsimony fit
indices simultaneously. In addition to these goodness of fit indices, the distribution of the
standardised variance and covariance residuals and the magnitude of the model
modification indices calculated for X and were also assessed to determine model fit.
The overall fit statistics used to assess measurement model fit, highlighted91 in Table
5.110 below, should according to Diamantopoulos and Siguaw, (2009), Hooper, Coughlan
and Mullen, (2008) and Hu and Bentler (1999), along with an evaluation of the
standardised residuals and percentage of large modification indices, be more than
sufficient to aid in reaching a well informed conclusion surrounding model fit.
Upon initial investigation or analysis of the psychological ownership measurement model
with the two interaction effects, the squared terms and the correlated measurement error
terms the model showed close fit, as is evident from Table 5.114 below. However, the
fitted measurement model unfortunately suffered from inadmissible parameter estimates,
evident in Table 5.115 and Table 5.116 below.
The slope of the regression of a standardised composite indicator on the (single)
standardised latent variable that it had been earmarked to reflect cannot exceed unity. In
a completely standardised simple regression model the slope coefficient is the bivariate
correlation between the indicator and the latent variable. Despite the fact that the close fit
null hypothesis had not been rejected the model therefore still had to be rejected because
of the six inadmissible parameter estimates. Various approaches were attempted to
resolve the problem with the inadmissible factor loadings. Firstly, the problematic factor
loadings were constrained to .90. This constrained the unstandardised lambda’s to .90,
but left the completely standardised values unaffected and still problematic. Secondly,
RES1, one of the problematic indicators, was deleted as an indicator. Although this solved
the problem with the factor loadings, in as far as all of the remaining loadings now had
permissible values, it subsequently created a problem with an inadmissible phi estimate.
Therefore, the methodologically prudent thing to do, given that the problems centred on
91 The measures used have been highlighted by bolding the specific values under investigation. The discussion surrounding the benefit of the use of each measure will be presented hand-in-hand with the data interpretation. Additionally, the justification for ignoring certain other indices have also been provided.
Stellenbosch University https://scholar.sun.ac.za

245
the indicators of the polynomial latent variables, was to remove the squared latent
variables and the interaction effect92 and subsequently the residualised indicators, from
the model.
Table 5.114
Psychological Ownership Measurement Model Goodness of Fit Statistics
Statistic Value
Degrees of Freedom 279
Minimum Fit Function Chi-Square 507.535 (p= 0.00)
Normal Theory Weighted Least Squares Chi-Square 476.218 (p= 0.00)
Satorra-Bentler Scaled Chi-Square 427.155 (p= 0.000)
Chi-Square Corrected for Non-Normality 3684.218 (p=0.0)
Estimated Non-centrality Parameter (NCP) 148.155
90 Percent Confidence Interval for NCP (96.302 ; 207.965)
Minimum Fit Function Value 1.547
Population Discrepancy Function Value (F0) 0.452
90 Percent Confidence Interval for F0 (0.294 ; 0.634)
Root Mean Square Error of Approximation (RMSEA) 0.0402
90 Percent Confidence Interval for RMSEA (0.0324 ; 0.0477)
P-Value for Test of Close Fit (RMSEA < 0.05) 0.986
Expected Cross-Validation Index (ECVI) 2.077
90 Percent Confidence Interval for ECVI (1.919 ; 2.259)
ECVI for Saturated Model 2.476
ECVI for Independence Model 39.594
Chi-Square for Independence Model with 378 Degrees of Freedom 12930.806
Independence AIC 12986.806
Model AIC 681.155
Saturated AIC 812
Independence CAIC 13121.095
Model CAIC 1290.255
Saturated CAIC 2759.199
Normed Fit Index (NFI) 0.967
Non-Normed Fit Index (NNFI) 0.984
Parsimony Normed Fit Index (PNFI) 0.714
Comparative Fit Index (CFI) 0.988
Incremental Fit Index (IFI) 0.988
Relative Fit Index (RFI) 0.955
Critical N (CN) 259.677
Root Mean Square Residual (RMR) 0.0405
Standardized RMR 0.035
Goodness of Fit Index (GFI) 0.906
92 The latent psychological safety*motivation to pursue the routes towards psychological ownership interaction effect was, however, retained.
Stellenbosch University https://scholar.sun.ac.za

246
Adjusted Goodness of Fit Index (AGFI) 0.863
Parsimony Goodness of Fit Index (PGFI) 0.623
Table 5.115
Psychological Ownership Measurement Model Completely Standardised Lambda-
X Matrix
JC PO MOT SQJC SQPON IK C SI PS_MOT JC_PON PON
JC_1 0.935 - - - - - - - - - - - - - - - - - - - -
JC_2 0.919 - - - - - - - - - - - - - - - - - - - -
IK_1 - - - - - - - - - - 0.914 - - - - - - - - - -
IK_2 - - - - - - - - - - 0.937 - - - - - - - - - -
SI_1 - - - - - - - - - - - - - - 0.922 - - - - - -
SI_2 - - - - - - - - - - - - - - 0.850 - - - - - -
C_1 - - - - - - - - - - - - 0.956 - - - - - - - -
C_2 - - - - - - - - - - - - 0.829 - - - - - - - -
PO_1 - - 0.949 - - - - - - - - - - - - - - - - - -
PO_2 - - 0.949 - - - - - - - - - - - - - - - - - -
PON_1 - - - - - - - - - - - - - - - - - - - - 0.963
PON_2 - - - - - - - - - - - - - - - - - - - - 0.899
MOT_1 - - - - 0.967 - - - - - - - - - - - - - - - -
MOT_2 - - - - 0.978 - - - - - - - - - - - - - - - -
RES_1 - - - - - - - - - - - - - - - - - - 1.091 - -
RES_2 - - - - - - - - - - - - - - - - - - 0.747 - -
RES_3 - - - - - - - - - - - - - - - - - - 0.959 - -
RES_4 - - - - - - - - - - - - - - - - - - 0.646 - -
RES_5 - - - - - - - - - - - - - - - - 0.907 - - - -
RES_6 - - - - - - - - - - - - - - - - 0.88 - - - -
RES_7 - - - - - - - - - - - - - - - - 0.938 - - - -
RES_8 - - - - - - - - - - - - - - - - 0.900 - - - -
RES_9 - - - - - - 0.889 - - - - - - - - - - - - - -
RES_10 - - - - - - 0.854 - - - - - - - - - - - - - -
RES_11 - - - - - - 1.018 - - - - - - - - - - - - - -
RES_12 - - - - - - - - 0.805 - - - - - - - - - - - -
RES_13 - - - - - - - - 0.794 - - - - - - - - - - - -
RES_14 - - - - - - - - 1.012 - - - - - - - - - - - - JC=Job Characteristics, IK=Intimate Knowledge, SI=Self Investment, C=Control, PO=Psychological Ownership, PON=Psychological Ownership
Individual Needs, Mot=Motivation, SQJC=Squared Job Characteristics, SQPON= Squared Psychological Ownership Individual Needs,
PS_MOT=Interaction between Psychological Safety and Motivation, JC_PON=Interaction between Job Characteristics and Squared
Psychological Ownership Individual Needs, Res=Residuals
Stellenbosch University https://scholar.sun.ac.za

247
Table 5.116
Psychological Ownership Measurement Model Squared Multiple Correlations for
X-Variables
Variable Value JC_1 0.875 JC_2 0.845 IK_1 0.835 IK_2 0.877 SI_1 0.850 SI_2 0.723 C_1 0.914 C_2 0.687 PO_1 0.900 PO_2 0.900 PON_1 0.928 PON_2 0.808 MOT_1 0.935 MOT_2 0.957 RES_1 1.191 RES_2 0.558 RES_3 0.921 RES_4 0.418 RES_5 0.823 RES_6 0.775 RES_7 0.879 RES_8 0.811 RES_9 0.791 RES_10 0.729 RES_11 1.037 RES_12 0.648 RES_13 0.631 RES_14 1.025
JC=Job Characteristics, IK=Intimate
Knowledge, SI=Self Investment,
C=Control, PO=Psychological Ownership,
PON=Psychological Ownership Individual
Needs, Mot=Motivation, Res=Residuals
This reduced psychological ownership model, however, prevented the testing of a number
of the original hypothesises. More specifically, the polynomial regression hypothesises
could not be tested as originally intended, but they now had to be tested through observed
score polynomial regression analysis. This in turn implied that a separate narrow-focused
structural model had to be created that hypothesised the motivation to pursue the routes
to psychological ownership to be a function of the salience of the individual psychological
ownership needs (still treated as a multidimensional composite latent variable), perceived
job characteristics (also still treated as a multidimensional composite latent variable), the
squared psychological needs, the interaction between needs and job characteristics and
the squared job characteristics. This is as opposed to the original proposed method of
including the polynomial effects in the structural model, and conducting latent variable
polynomial regression. Therefore, an additional overarching substantive research
Stellenbosch University https://scholar.sun.ac.za

248
hypothesis (Hypothesis 19) had to be added to the study. Hypothesis 19 claims that the
narrow-focused structural model provides an accurate account of the psychological
mechanisms that underpin the levels of motivation to pursue the routes towards
psychological ownership. The narrow-focused structural model attributes the level of
motivation to pursue the routes towards psychological ownership to the congruence (or
lack of it) between the salience of psychological ownership needs and the ability of the job
characteristics to satisfy these needs. The manner in which the motivation to pursue the
routes towards psychological ownership changes as the magnitude and nature of the
congruence (and incongruence) changes is still hypothesised to change as described
under hypotheses 7 and 8. This is examined in Section 5.11 via observed score
polynomial regression analysis.
The reduced psychological ownership measurement and structural models were
subsequently evaluated and the results are presented below in Section 5.8.3.
A visual representation of the reduced psychological ownership measurement model
(Model A) is presented in Figure 5.9 below. This is followed by Table 5.117, in Section
5.8.3, which outlines the goodness of fit indices.
Stellenbosch University https://scholar.sun.ac.za
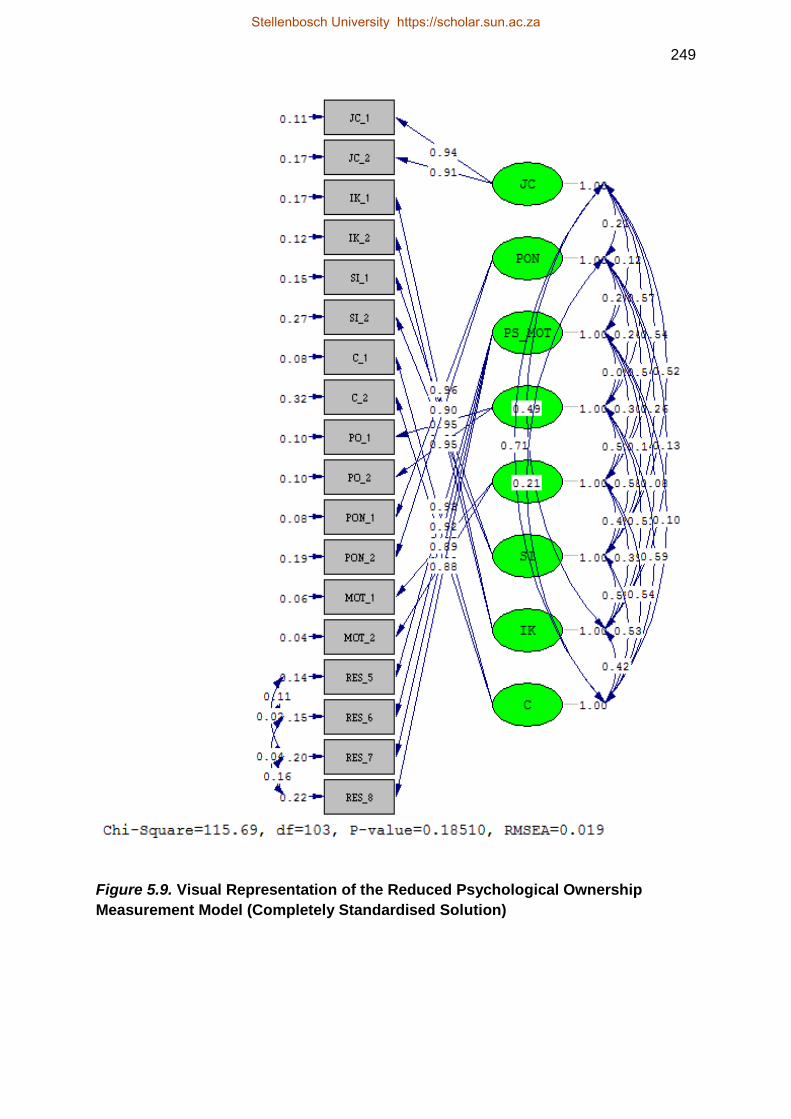
249
Figure 5.9. Visual Representation of the Reduced Psychological Ownership
Measurement Model (Completely Standardised Solution)
Stellenbosch University https://scholar.sun.ac.za

250
Reduced psychological ownership measurement model fit indices
The overall fit statics presented below in Table 5.117 provide a chance to test the exact
fit and close fit hypotheses.
Table 5.117
Reduced Psychological Ownership Measurement Model Goodness of Fit Statistics
Statistic Value
Degrees of Freedom 103
Minimum Fit Function Chi-Square 125.356 (p=0.0664)
Normal Theory Weighted Least Squares Chi-Square 121.483 (p=0.103)
Satorra-Bentler Scaled Chi-Square 115.688 (p=0.185)
Chi-Square Corrected for Non-Normality 192.325 (p=0.000)
Estimated Non-centrality Parameter (NCP) 12.688
90 Percent Confidence Interval for NCP (0.0; 43.254)
Minimum Fit Function Value 0.382
Population Discrepancy Function Value (F0) 0.0387
90 Percent Confidence Interval for F0 (0.0; 0.132)
Root Mean Square Error of Approximation (RMSEA) 0.0194
90 Percent Confidence Interval for RMSEA (0.0; 0.0358)
P-Value for Test of Close Fit (RMSEA < 0.05) 1.00
Expected Cross-Validation Index (ECVI) 0.767
90 Percent Confidence Interval for ECVI (0.729; 0.861)
ECVI for Saturated Model 1.043
ECVI for Independence Model 25.251
Chi-Square for Independence Model with 153 Degrees of Freedom 8246.166
Independence AIC 8282.166
Model AIC 251.688
Saturated AIC 342
Independence CAIC 8368.495
Model CAIC 577.82
Saturated CAIC 1162.126
Normed Fit Index (NFI) 0.986
Non-Normed Fit Index (NNFI) 0.998
Parsimony Normed Fit Index (PNFI) 0.664
Comparative Fit Index (CFI) 0.998
Incremental Fit Index (IFI) 0.998
Relative Fit Index (RFI) 0.979
Critical N (CN) 395.954
Root Mean Square Residual (RMR) 0.0155
Standardized RMR 0.0155
Goodness of Fit Index (GFI) 0.960
Adjusted Goodness of Fit Index (AGFI) 0.934
Parsimony Goodness of Fit Index (PGFI) 0.579
Stellenbosch University https://scholar.sun.ac.za
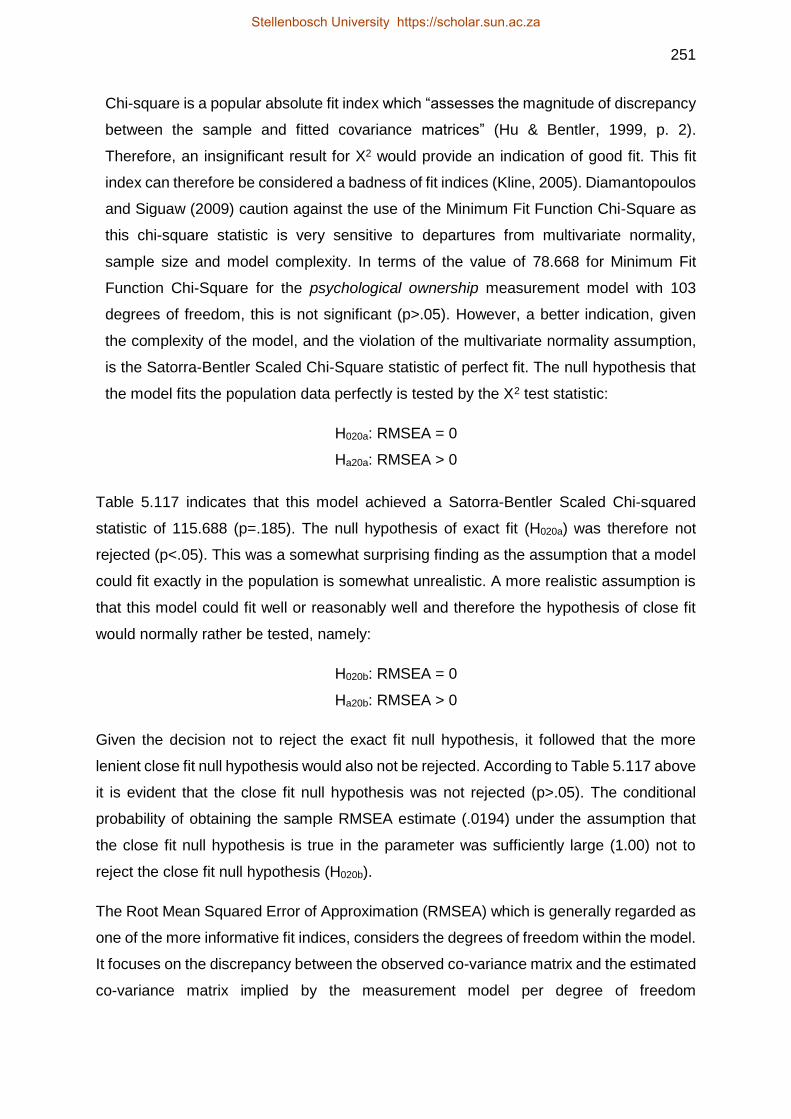
251
Chi-square is a popular absolute fit index which “assesses the magnitude of discrepancy
between the sample and fitted covariance matrices” (Hu & Bentler, 1999, p. 2).
Therefore, an insignificant result for X2 would provide an indication of good fit. This fit
index can therefore be considered a badness of fit indices (Kline, 2005). Diamantopoulos
and Siguaw (2009) caution against the use of the Minimum Fit Function Chi-Square as
this chi-square statistic is very sensitive to departures from multivariate normality,
sample size and model complexity. In terms of the value of 78.668 for Minimum Fit
Function Chi-Square for the psychological ownership measurement model with 103
degrees of freedom, this is not significant (p>.05). However, a better indication, given
the complexity of the model, and the violation of the multivariate normality assumption,
is the Satorra-Bentler Scaled Chi-Square statistic of perfect fit. The null hypothesis that
the model fits the population data perfectly is tested by the X2 test statistic:
H020a: RMSEA = 0
Ha20a: RMSEA > 0
Table 5.117 indicates that this model achieved a Satorra-Bentler Scaled Chi-squared
statistic of 115.688 (p=.185). The null hypothesis of exact fit (H020a) was therefore not
rejected (p<.05). This was a somewhat surprising finding as the assumption that a model
could fit exactly in the population is somewhat unrealistic. A more realistic assumption is
that this model could fit well or reasonably well and therefore the hypothesis of close fit
would normally rather be tested, namely:
H020b: RMSEA = 0
Ha20b: RMSEA > 0
Given the decision not to reject the exact fit null hypothesis, it followed that the more
lenient close fit null hypothesis would also not be rejected. According to Table 5.117 above
it is evident that the close fit null hypothesis was not rejected (p>.05). The conditional
probability of obtaining the sample RMSEA estimate (.0194) under the assumption that
the close fit null hypothesis is true in the parameter was sufficiently large (1.00) not to
reject the close fit null hypothesis (H020b).
The Root Mean Squared Error of Approximation (RMSEA) which is generally regarded as
one of the more informative fit indices, considers the degrees of freedom within the model.
It focuses on the discrepancy between the observed co-variance matrix and the estimated
co-variance matrix implied by the measurement model per degree of freedom
Stellenbosch University https://scholar.sun.ac.za

252
(Diamantopoulos & Siguaw, 2009; Hooper et al. 2008). It therefore accounts for model
complexity. In terms of RMSEA values certain rules of thumb are available for the
interpretation of model fit in the sample. Values of .05, or less, are a sign of good fit,
reasonable fit can be suggested for values above .05 and under .08, mediocre fit is
indicated by a value of .08 and poor fit in the sample is indicated for RMSEA values of .10
and greater (Diamantopoulos & Siguaw, 2009).
The value of the sample estimate for RMSEA in Table 5.113 above, for the reduced
psychological ownership measurement model (RMSEA = .0194), shows that the model fit
in the sample is good. If assessed in conjunction with the 90 percent confidence interval
for RMSEA (0.0; 0.0358) (as recommended by Byrne, 2001) it is further suggested that
this model shows good fit in the parameter in that the interval is small, which is indicative
of a higher level of precision of model fit in the population and in that the upper bound of
the confidence interval falls below .05. The SRMR (0.0155) reported in Table 5.117 above
additionally indicates good fit (SRMR<.05).
The final two absolute measures of model fit suggested as prudent measures of model fit
include the goodness-of-fit index (GFI) and adjusted goodness-of-fit index (AGFI). The
GFI acts as an indication of how closely the model can reproduce the observed covariance
matrix (Diamantopoulos & Siguaw, 2009; Tabachnick & Fidell, 2014). The AGFI
additionally takes degrees of freedom into account. Values for both indices should range
between 0 and 1 and any value greater than .90 reflects good fit (Diamantopoulos &
Siguaw, 2009; Tabachnick & Fidell, 2014). Table 5.117 above presents values of 0.960
and 0.934 for GFI and AGFI respectively, further suggesting good fit.
The incremental or relative fit indices, namely normed-fit Index (NFI) and comparative fit
index (CFI) indicate that when compared to a baseline independent model, suggested a
well-fitting model. NFI assesses fit by comparing the chi-square value of the model to the
chi-square value of the null hypothesis model93. According to Bentler and Bonnet (1980)
values greater than .90 are indicative of good fit. However, Hu and Bentler (1999) more
recently suggested that a better cut-off would be values equal to or greater than .95. An
NFI of 0.986 was reported for the reduced psychological ownership measurement model
which suggests that this model fits well. A major drawback of this index however is its
sensitivity to sample size. However, it is believed that the sample of 329 should be
93 In this model all of the measured variables will be uncorrelated and this is therefore a worst case scenario (Hooper et al. 2008).
Stellenbosch University https://scholar.sun.ac.za
253
sufficient. The non-normed fit index is suggested as a fit statistic that could be used to
counteract the sensitivities of the NFI (but it is not without its own sensitivities, especially
in terms of model complexity). The NNFI of 0.998 supports the assumption of good fit
presented by the NFI (and other statistics presented thus far). A revised form of the NFI
which is less affected by sample size is the comparative fit index (CFI). Values closer to
one are an indication of good fit (Diamantopoulos & Siguaw, 2009; Hooper, Coughlan, &
Mullen, 2008). Therefore, according to Table 5.117 above it is suggested that this model
fitted very well (0.997).
Lastly, a collection of parsimony fit indices was considered before making the final
conclusions surrounding model fit, namely parsimony goodness-of-fit index (PGFI) and
the parsimonious normed fit index (PNFI). Both indices take degrees of freedom into
account when assessing fit. These indices must be viewed with caution however when
assessing complex models and Hooper et al. (2008) explain that PGFI and PNFI values
that are lower than the reported fit statistics should not be cause for concern. They suggest
that values within the .50 region could indicate good fit. From Table 5.117 above it is
therefore evident that this model fitted well (PGFI =.579 and PNFI = .664).
Taking all of the above fit indices into account is seemed reasonable to suggest that the
reduced psychological ownership measurement model showed good fit. However, before
a final conclusion is drawn with regards to the model fit, the standardised residuals and
modification indices were considered. These analyses are presented below in Sections
5.8.4 and 5.8.5 respectively.
Reduced psychological ownership measurement model standardised
residuals
Standardised residuals point to variance and/or covariance terms in the observed sample
covariance matrix that were poorly estimated from the model parameter estimates.
Numerous large standardised residuals would therefore comment negatively on the ability
of the model and its parameter estimates to reproduce the observed covariance matrix.
Therefore, the shape and distribution, as well as the number of large and small
standardised residuals,94 were considered.
94 It must be noted here that the standardised residuals have been reported on due to the fact that they do not display a dependence on the unit of measurement (unlike fitted residuals which are influence heavy by the units of measurement used in the questionnaire).
Stellenbosch University https://scholar.sun.ac.za

254
In terms of the shape and distribution of the residuals it is suggested (Diamantopoulos &
Siguaw, 2009) that they should be dispersed more or less symmetrically around zero. The
shape and distribution of the standardised residuals for the reduced psychological
ownership measurement model are shown in Figure 5.10 below.
- 3|7 - 3| - 2| - 2| - 1|866 - 1|0000 - 0|8887777766655 - 0|444444444444333333322222221111111111111000000000000000000000000000000000+13 0|11111111111111112222222333333334444444 0|55555556666779999 1|0001133 1|89 2|4
Figure 5.10. Stem-and-leaf plot of the reduced psychological ownership measurement
model standardised residuals
Inspection of the standardised stem-and-leaf plot of standardised residuals indicated a
distribution of residuals that was more or less symmetrically dispersed around zero if the
one large negative outlier is ignored. This is further supporting evidence of a good fitting
model. However, this needs to be interpreted in conjunction with the number of large and
small residuals. According to Diamantopoulos and Siguaw (2009) standardised residual
values that exceed +2.58 can be considered as positively large or negatively large if they
are smaller than -2.58. The standardised residuals are presented below in Table 5.118.
Table 5.118
Summary Statistics for the Psychological Ownership Measurement Model
Standardised Residuals
Description Value
Smallest Standardised Residual -3.664 Median Standardised Residual 0.000 Largest Standardised Residual 2.416
The findings presented in Figure 5.10 are supported by the summary statistics for the
reduced psychological ownership measurement model standardised residuals. Table
5.118 indicates that only one large negative residual was observed. Only one of the 171
unique variance and covariance terms in the observed sample covariance matrix (circa
.59%) were therefore poorly reproduced from the measurement model parameter
estimates. The presence of a large negative standardised residual was an indication that
only one term in the covariance matrix was overestimated and thus that the culling of paths
Stellenbosch University https://scholar.sun.ac.za

255
in the measurement model would not be necessary. However, the presence of only one
large negative residual and no large positive residuals provided further support for good
fit.
The Q-plot presented below in Figure 5.11 provides further corroboratory evidence of a
well-fitting model.
Figure 5.11. Q- Plot of the Reduced Psychological Ownership Measurement Model
The Q-plot above, in Figure 5.11, provided further supporting evidence that, the model
fitted very well in that the data points were concentrated predominantly around the 45
degree reference line. It additionally corroborates the findings presented in Table 5.118 in
that the data points swivelled away from the 45 degree line specifically at the tails (and
more so at the lower region) indicating the one large negative residual. It is important to
also consider the modification indices for the reduced psychological ownership
measurement model before making a final decision with regards to model fit.
Stellenbosch University https://scholar.sun.ac.za

256
Reduced psychological ownership measurement model modification
indices
Modification indices provide estimates of model parameters of paths that are freed which
are currently set to zero. These modifications subsequently allow for the statistical
significance of these unspecified relationships within the model to be assessed. The
modification indices indicate the decrease in the model’s X2 if a previously fixed parameter
is freed and the model re-estimated. Modification indices larger than 6.64 represent
statistically significant (p<.01) decreases in the X² fit statistic. The intention of this
investigation into the modification indices was not to determine any specific parameters to
be freed or appropriate model modifications but rather to act as an indication of the
integrity of the model fit. It seems logical to suggest that if the proposed modifications are
limited that this alludes to a well-fitting model. The modification indices for the lambda-X
matrix are presented below in Table 5.119. It is evident from the matrix that only in the
case of 4 (3.2%) of the current 126 fixed factor loading parameters would setting them
free statistically significantly (p<.05) improve the fit of the reduced psychological
ownership measurement model. This small percentage of large modification indices for
X was further evidence of a well-fitting model.
Table 5.119
Modification Indices Calculated for the Lambda-X Matrix
JC PON PS_MOT PO MOT SI IK C
JC_1 - - 0.849 0.004 0.323 0.144 0.136 8.064 4.115
JC_2 - - 0.830 0.004 0.324 0.132 0.128 7.924 1.639
IK_1 1.791 0.005 1.060 0.066 0.041 1.261 - - 0.428
IK_2 1.987 0.005 1.069 0.078 0.045 1.586 - - 0.474
SI_1 0.354 0.018 0.265 0.009 3.448 - - 0.419 1.979
SI_2 0.311 0.018 0.261 0.007 3.509 - - 0.586 1.967
C_1 1.354 0.101 0.699 1.764 1.098 2.924 0.111 - -
C_2 0.800 0.103 0.723 1.980 1.260 2.839 0.101 - -
PO_1 0.269 0.171 0.284 - - 0.185 1.136 0.933 0.251
PO_2 0.225 0.162 0.285 - - 0.161 1.115 0.918 0.212
PON_1 2.139 - - 1.299 3.304 0.323 0.634 0.214 0.705
PON_2 2.114 - - 1.314 3.342 0.367 0.625 0.214 0.714
MOT_1 0.312 0.037 4.265 1.181 - - 0.164 7.676 0.037
MOT_2 0.385 0.039 4.439 1.344 - - 0.186 8.060 0.044
RES_5 0.876 0.989 - - 2.039 0.581 1.291 1.046 1.902
RES_6 0.978 0.855 - - 1.958 0.649 1.085 0.713 1.550
RES_7 1.350 0.233 - - 0.592 0.761 1.135 0.659 2.022
RES_8 1.490 0.144 - - 0.521 0.801 0.899 0.368 1.597 JC=Job Characteristics, IK=Intimate Knowledge, SI=Self Investment, C=Control, PO=Psychological Ownership, PON=Psychological
Ownership Individual Needs, Mot=Motivation, PS_MOT=Interaction between Psychological Safety and Motivation Res=Residuals
Stellenbosch University https://scholar.sun.ac.za
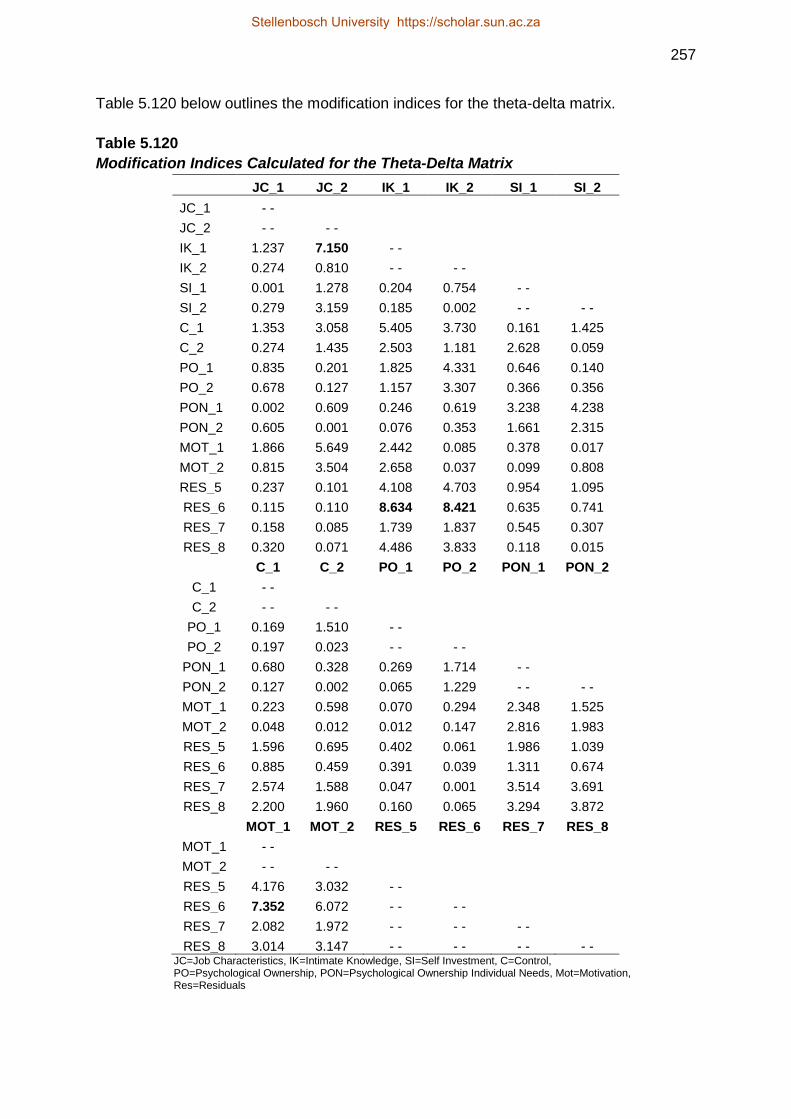
257
Table 5.120 below outlines the modification indices for the theta-delta matrix.
Table 5.120
Modification Indices Calculated for the Theta-Delta Matrix
JC_1 JC_2 IK_1 IK_2 SI_1 SI_2
JC_1 - -
JC_2 - - - -
IK_1 1.237 7.150 - -
IK_2 0.274 0.810 - - - -
SI_1 0.001 1.278 0.204 0.754 - -
SI_2 0.279 3.159 0.185 0.002 - - - -
C_1 1.353 3.058 5.405 3.730 0.161 1.425
C_2 0.274 1.435 2.503 1.181 2.628 0.059
PO_1 0.835 0.201 1.825 4.331 0.646 0.140
PO_2 0.678 0.127 1.157 3.307 0.366 0.356
PON_1 0.002 0.609 0.246 0.619 3.238 4.238
PON_2 0.605 0.001 0.076 0.353 1.661 2.315
MOT_1 1.866 5.649 2.442 0.085 0.378 0.017
MOT_2 0.815 3.504 2.658 0.037 0.099 0.808
RES_5 0.237 0.101 4.108 4.703 0.954 1.095
RES_6 0.115 0.110 8.634 8.421 0.635 0.741
RES_7 0.158 0.085 1.739 1.837 0.545 0.307
RES_8 0.320 0.071 4.486 3.833 0.118 0.015
C_1 C_2 PO_1 PO_2 PON_1 PON_2
C_1 - -
C_2 - - - -
PO_1 0.169 1.510 - -
PO_2 0.197 0.023 - - - -
PON_1 0.680 0.328 0.269 1.714 - -
PON_2 0.127 0.002 0.065 1.229 - - - -
MOT_1 0.223 0.598 0.070 0.294 2.348 1.525
MOT_2 0.048 0.012 0.012 0.147 2.816 1.983
RES_5 1.596 0.695 0.402 0.061 1.986 1.039
RES_6 0.885 0.459 0.391 0.039 1.311 0.674
RES_7 2.574 1.588 0.047 0.001 3.514 3.691
RES_8 2.200 1.960 0.160 0.065 3.294 3.872
MOT_1 MOT_2 RES_5 RES_6 RES_7 RES_8
MOT_1 - -
MOT_2 - - - -
RES_5 4.176 3.032 - -
RES_6 7.352 6.072 - - - -
RES_7 2.082 1.972 - - - - - -
RES_8 3.014 3.147 - - - - - - - - JC=Job Characteristics, IK=Intimate Knowledge, SI=Self Investment, C=Control, PO=Psychological Ownership, PON=Psychological Ownership Individual Needs, Mot=Motivation, Res=Residuals
Stellenbosch University https://scholar.sun.ac.za

258
It is evident from Table 5.120 above that similarly only 4 of the 149 covariance terms in
the theta-delta matrix currently fixed to zero, if set free, would significantly (p<.01) improve
the fit of the model. Therefore, only 2.7% of the values, if set free, would lead to a
statistically significant (p<.01) decrease in the X2 statistic. The low percentages obtained
here again speaks to a measurement model that fits very well.
The above evidence pertaining to the level of fit obtained for the measurement model
allowed for further investigation of the measurement model parameter estimates and
squared multiple correlations.
Reduced psychological ownership measurement model parameter
estimates and squared multiple correlations
In order to determine if the manifest variables reliably and validly represented the latent
variables they are supposed to measure, it was firstly important to ascertain the
significance and the magnitude of the hypothesised paths between each of the manifest
and the latent variable they were earmarked to reflect. This was done by investigating the
unstandardised and completely standardised lambda-X matrices. Diamantopoulos and
Siguaw (2009) and Theron (2014a) suggest that although the unstandardised matrix
should be viewed and interrogated to evaluate the statistical significance of the factor
loading estimates, it is more prudent to report on the completely standardised matrix for
lambda-X when evaluating the magnitude of the factor loadings. This is because the
unstandardised matrix is more complicated to interpret, due to its reliance on the original
unit of measurement, and the fact that different scales may have been used to measure
indicators of different constructs.
The unstandardised matrix still provides some valuable information pertaining specifically
to three aspects namely 1) the unstandardised parameter estimate, 2) the standard error
term, and 3) the z-value, which is the value of the parameter divided by its standard error.
This provides an indication of the significance of the relationship.
As a rule of thumb a smaller value, in terms of the precision with which the parameter
value has been estimated (standard error term), is an indication of a good estimation (Van
Deventer, 2015). The value of particular importance here is however the z-value, which
indicates whether factor loadings/path coefficients are statistically significant (i.e. whether
the indicator variables/parcels load statistically significantly on the latent variables that
Stellenbosch University https://scholar.sun.ac.za

259
they were designed to reflect). The unstandardised lambda-X matrix is presented below
in Table 5.121.
Table 5.121
Reduced Psychological Ownership Measurement Model Unstandardised Lambda-
X Matrix
JC PON PS_MOT PO MOT SI
JC_1 0.889 - - - - - - - - - -
(0.041)
21.475
JC_2 0.812 - - - - - - - - - -
(0.038)
21.158
IK_1 - - - - - - - - - - - -
IK_2 - - - - - - - - - - - -
SI_1 - - - - - - - - - - 0.926
(0.042)
22.151
SI_2 - - - - - - - - - - 0.940
(0.052)
18.230
C_1 - - - - - - - - - - - -
C_2 - - - - - - - - - - - -
PO_1 - - - - - - 1.235 - - - -
(0.048)
25.804
PO_2 - - - - - - 1.180 - - - -
(0.044)
26.562
PON_1 - - 0.818 - - - - - - - -
(0.038)
21.764
PON_2 - - 0.734 - - - - - - - -
(0.036)
20.421
MOT_1 - - - - - - - - 0.774 - -
(0.031)
25.321
MOT_2 - - - - - - - - 0.788 - -
(0.032)
24.902
RES_5 - - - - 0.808 - - - - - -
(0.063)
12.817
RES_6 - - - - 0.840 - - - - - -
Stellenbosch University https://scholar.sun.ac.za

260
(0.068)
12.361
RES_7 - - - - 0.839 - - - - - -
(0.072)
11.633
RES_8 - - - - 0.859 - - - - - -
(0.075)
11.492
IK C
JC_1 - - - -
JC_2 - - - -
IK_1 0.757 - -
(0.034)
22.110
IK_2 0.700 - -
(0.030)
23.230
SI_1 - - - -
SI_2 - - - -
C_1 - - 1.135
(0.051)
22.134
C_2 - - 1.112
(0.062)
17.793
PO_1 - - - -
PO_2 - - - -
PON_1 - - - -
PON_2 - - - -
MOT_1 - - - -
MOT_2 - - - -
RES_5 - - - -
RES_6 - - - -
RES_7 - - - -
RES_8 - - - - JC=Job Characteristics, PON=Psychological Ownership Individuals Needs, PS_Mot=Psychological Safety*Mot Interaction ,PO=Psychological Ownership, Mot=Motivation, SI=Self Investment, IK=Intimate Knowledge, C=Control
According to C.C. Theron (personal communication, January 8, 2017) paths are significant
if the test statistics (z-vales) associated with the factor loadings are greater than |1.6449|
due to the fact that the alternative hypotheses proposed in Chapter 3 are formulated as
directional hypotheses. From the above Table 5.121 it is evident that all of the factor
loadings were statistically significant (p<.05). This commented favourably on the validity
with which the constructs of interest, the latent variables, were represented by the manifest
Stellenbosch University https://scholar.sun.ac.za
261
variables, in this case the item parcels that were earmarked to reflect them. This matrix is
very useful in determining whether the factor loadings/path coefficients are significant but
as mentioned a “problem with relying on unstandardised loadings and associated t-values
is that it may be difficult to compare the validity of different indicators measuring a
particular construct” (Diamantopoulos & Siguaw, 2009, p. 89). It was therefore important
to also report on the completely standardised solution for X, which is presented below in
Table 5.122.
The completely standardise ij estimates, in the matrix in Table 5.122, should be
interpreted as the slope of the regression of the standardised indicator variables on the
standardised latent variables. The completely standardised factor loadings therefore
indicate the average change, expressed in standard deviation units, in the indicator
variable associated with one standard deviation change in the latent variable. In the case
of simple linear regression, the completely standardised factor loadings are correlation
coefficients. The ideal is to have the estimated factor loadings in the completely
standardised lambda-X correlations as close to one as possible. A correlation greater than
.50 was considered marginally satisfactory; however, the aim was to get the correlation
as high as possible. Factor loading estimates in this case were considered satisfactory if
the completely standardised factor loading estimates exceeded .71 (Theron, 2014a).
It is evident from Table 5.122 above that the magnitude of all of the factor loading
estimates were more than satisfactory.
In terms of the reliability and validity of the indicators it was considered important to
investigate their squared multiple correlations (R2). These squared correlations, displayed
in Table 5.123 below, provide an indication of the proportion of variance in an indicator
that the underlying latent variable it was earmarked to reflect, explains. It is a measure of
the percentage of variance in a dependent variable that is accounted for by its relationship
with the independent variable. Given that the R² will always be equal to, or smaller than
rttx, R² therefore constitutes a conservative, lower-bound estimate of the reliability of the
indicator measures. Higher values are an indication of stronger validity and reliability and
Hair et al (2010) suggest that loading estimates of at least .50 and ideally exceeding .71
should be found as evidence of good reliability and validity95. Low R2 is a sign that the
95 Given that each item parcel only represents a single latent variable, the square of the completely standardised factor loadings equals the R² for each indicator variable.
Stellenbosch University https://scholar.sun.ac.za

262
outcome is relatively unrelated to the predictors and as alluded to above values closer to
one indicate that the indicator variables and their underlying latent variables are highly
related.
Table 5.122
Reduced Psychological Ownership Measurement Model Completely Standardised
Lambda-X Matrix
JC PON PS_MOT PO MOT SI IK C
JC_1 0.943 - - - - - - - - - - - - - -
JC_2 0.912 - - - - - - - - - - - - - -
IK_1 - - - - - - - - - - - - 0.912 - -
IK_2 - - - - - - - - - - - - 0.938 - -
SI_1 - - - - - - - - - - 0.920 - - - -
SI_2 - - - - - - - - - - 0.852 - - - -
C_1 - - - - - - - - - - - - - - 0.958
C_2 - - - - - - - - - - - - - - 0.827
PO_1 - - - - - - 0.948 - - - - - - - -
PO_2 - - - - - - 0.949 - - - - - - - -
PON_1 - - 0.959 - - - - - - - - - - - -
PON_2 - - 0.903 - - - - - - - - - - - -
MOT_1 - - - - - - - - 0.968 - - - - - -
MOT_2 - - - - - - - - 0.978 - - - - - -
RES_5 - - - - 0.927 - - - - - - - - - -
RES_6 - - - - 0.920 - - - - - - - - - -
RES_7 - - - - 0.894 - - - - - - - - - -
RES_8 - - - - 0.884 - - - - - - - - - -
JC=Job Characteristics, PON=Psychological Ownership Individuals Needs, PS_Mot=Psychological Safety*Mot Interaction ,PO=Psychological Ownership, Mot=Motivation, SI=Self Investment, IK=Intimate Knowledge, C=Control
Stellenbosch University https://scholar.sun.ac.za

263
Table 5.123
Reduced Psychological Ownership Measurement Model Squared Multiple
Correlations for X-Variables
JC_1 JC_2 IK_1 IK_2 SI_1 SI_2
0.888 0.832 0.832 0.880 0.847 0.725
C_1 C_2 PO_1 PO_2 PON_1 PON_2
0.918 0.684 0.899 0.901 0.920 0.815
MOT_1 MOT_2 RES_5 RES_6 RES_7 RES_8
0.936 0.956 0.860 0.847 0.800 0.782 JC=Job Characteristics, IK=Intimate Knowledge, SI=Self Investment, C=Control, PON=Psychological Ownership Individuals Needs, PO=Psychological Ownership, Mot=Motivation, Res=Residuals
As is evident from Table 5.123 above, the R²-values ranged from .684 to .956. Therefore,
it can be suggested that the measurement model displays satisfactory validity in that a
satisfactory proportion of variance is explained by each indicator variable and
consequently, by implication also satisfactory reliability.
The unstandardised theta-delta matrix, in Table 5.124 below, presents the variance in
measurement error terms of the indicators of the latent variables in the measurement
model (all treated as exogenous latent variables). Interpretation of the magnitude of the
error variances in the completely standardised theta-delta matrix is again preferred,
however, the interpretation of the error variance estimates in the unstandardised theta-
delta matrix below provides an indication of the statistical significance of the jj estimates.
Table 5.124
Reduced Psychological Ownership Measurement Model Unstandardised Theta-
Delta Matrix
C_1 C_2 PO_1 PO_2 PON_1 PON_2
C_1 0.115
(0.055)
2.089
C_2 - - 0.571
(0.060)
9.463
PO_1 - - - - 0.171
(0.050)
3.447
PO_2 - - - - - - 0.153
(0.042)
3.607
Stellenbosch University https://scholar.sun.ac.za

264
PON_1 - - - - - - - - 0.058
(0.030)
1.952
PON_2 - - - - - - - - - - 0.123
(0.024)
5.009
MOT_1 - - - - - - - - - - - -
MOT_2 - - - - - - - - - - - -
RES_5 - - - - - - - - - - - -
RES_6 - - - - - - - - - - - -
RES_7 - - - - - - - - - - - -
RES_8 - - - - - - - - - - - -
MOT_1 MOT_2 RES_5 RES_6 RES_7 RES_8
MOT_1 0.041
(0.012)
3.290
MOT_2 - - 0.029
(0.012)
2.300
RES_5 - - - - 0.106
(0.095)
1.113
RES_6 - - - - 0.085 0.127
(0.098) (0.107)
0.871 1.192
RES_7 - - - - 0.020 - - 0.176
(0.025) (0.111)
0.822 1.588
RES_8 - - - - - - 0.032 0.147 0.206
(0.025) (0.108) (0.112)
1.258 1.361 1.841 C=Control, PON=Psychological Ownership Individuals Needs, PO=Psychological Ownership, Mot=Motivation, Res=Residuals
It is evident from Table 5.124 above that all indicators were statistically significantly
plagued by measurement error as is evident in the fact that all indicators, report z-values
greater than 1.6449 (z≥1.6449) except for RES_5 (1.113), RES_6 (1.192) and RES_7
(1.588). This finding was disconcerting in that it suggested that it would be permissible to
regard these indicator variables, in general (or in the parameter), as perfectly reliable and
valid measures of the psychological safety*motivation to pursue the routes towards
psychological ownership latent variable. Although such a finding could, on the one hand
have been welcomed, it, on the other hand, evoked suspicion simply because it was too
good a finding to be trusted. All the covariances between the measurement error terms of
Stellenbosch University https://scholar.sun.ac.za
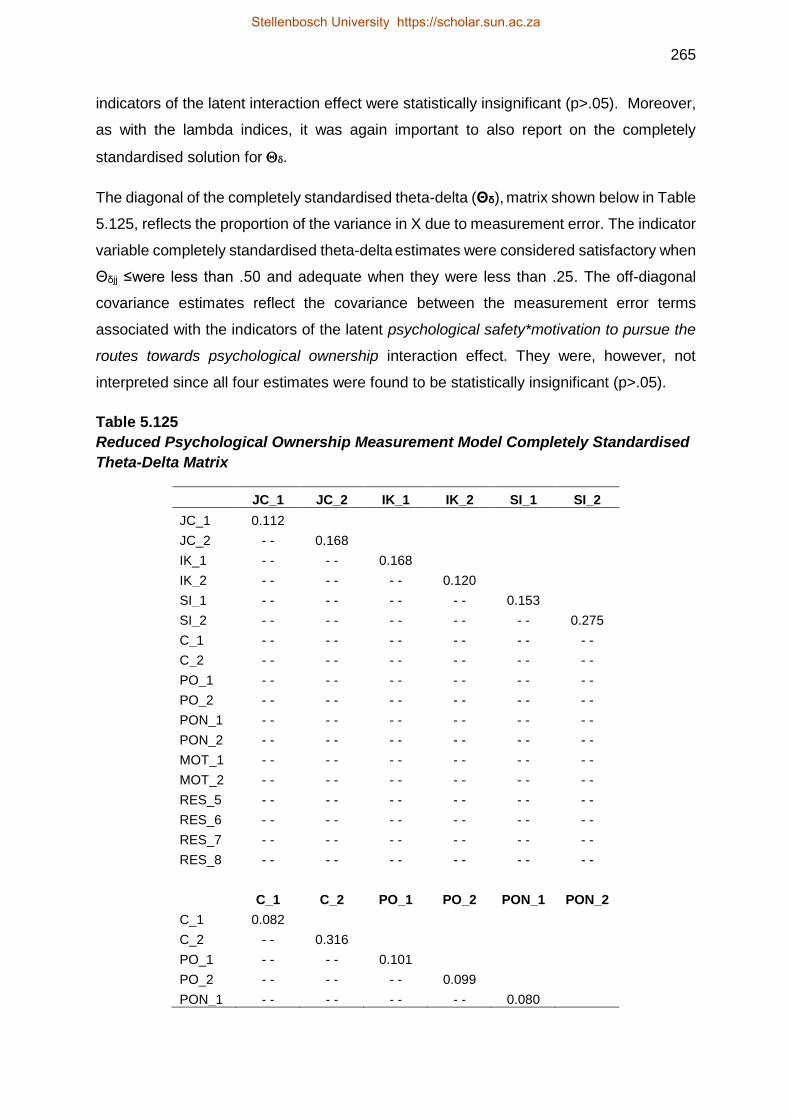
265
indicators of the latent interaction effect were statistically insignificant (p>.05). Moreover,
as with the lambda indices, it was again important to also report on the completely
standardised solution for .
The diagonal of the completely standardised theta-delta (Θδ), matrix shown below in Table
5.125, reflects the proportion of the variance in X due to measurement error. The indicator
variable completely standardised theta-delta estimates were considered satisfactory when
Θδjj ≤were less than .50 and adequate when they were less than .25. The off-diagonal
covariance estimates reflect the covariance between the measurement error terms
associated with the indicators of the latent psychological safety*motivation to pursue the
routes towards psychological ownership interaction effect. They were, however, not
interpreted since all four estimates were found to be statistically insignificant (p>.05).
Table 5.125
Reduced Psychological Ownership Measurement Model Completely Standardised
Theta-Delta Matrix
JC_1 JC_2 IK_1 IK_2 SI_1 SI_2
JC_1 0.112
JC_2 - - 0.168
IK_1 - - - - 0.168
IK_2 - - - - - - 0.120
SI_1 - - - - - - - - 0.153
SI_2 - - - - - - - - - - 0.275
C_1 - - - - - - - - - - - -
C_2 - - - - - - - - - - - -
PO_1 - - - - - - - - - - - -
PO_2 - - - - - - - - - - - -
PON_1 - - - - - - - - - - - -
PON_2 - - - - - - - - - - - -
MOT_1 - - - - - - - - - - - -
MOT_2 - - - - - - - - - - - -
RES_5 - - - - - - - - - - - -
RES_6 - - - - - - - - - - - -
RES_7 - - - - - - - - - - - -
RES_8 - - - - - - - - - - - -
C_1 C_2 PO_1 PO_2 PON_1 PON_2
C_1 0.082
C_2 - - 0.316
PO_1 - - - - 0.101
PO_2 - - - - - - 0.099
PON_1 - - - - - - - - 0.080
Stellenbosch University https://scholar.sun.ac.za

266
PON_2 - - - - - - - - - - 0.185
MOT_1 - - - - - - - - - - - -
MOT_2 - - - - - - - - - - - -
RES_5 - - - - - - - - - - - -
RES_6 - - - - - - - - - - - -
RES_7 - - - - - - - - - - - -
RES_8 - - - - - - - - - - - -
MOT_1 MOT_2 RES_5 RES_6 RES_7 RES_8
MOT_1 0.064
MOT_2 - - 0.044
RES_5 - - - - 0.140
RES_6 - - - - 0.107 0.153
RES_7 - - - - 0.025 - - 0.200
RES_8 - - - - - - 0.036 0.162 0.218 JC=Job Characteristics, IK=Intimate Knowledge, SI=Self Investment, C=Control, PON=Psychological Ownership Individuals Needs, PO=Psychological Ownership, Mot=Motivation, Res=Residuals
The observed values in Table 5.125 above indicate the proportion of item parcel variance
not explained by the underlying latent variable. All values were satisfactory and less than
32% of the variance could be ascribed to systematic non-relevant variance and random
error variance for each indicator variable.
A final aspect that is relevant in determining conclusions surrounding the reduced
psychological ownership measurement model fit is the discriminant validity of the indicator
measures. The phi matrix below in Table 5.126 presents the latent variable inter-
correlations. It is evident that none of these inter-correlations were excessively high (all
ij<.90). Given the magnitude of the latent variable inter-correlations it was not deemed
necessary to examine the discriminant validity of the operationalisation of the latent
variables comprising the structural model more stringently (Diamantopoulos & Siguaw,
2009). It was therefore concluded that the manner in which the latent variables comprising
the psychological ownership structural model were operationalised succeeded in
discriminating between the latent variables as related but qualitatively distinct variables.
Stellenbosch University https://scholar.sun.ac.za

267
Table 5.126
Unstandardised Phi Matrix96
JC PON PS_MOT PO MOT SI IK C
JC 1.000
PON 0.212 1.000
(0.060)
3.516
PS_MOT 0.117 0.258 1.000
(0.079) (0.063)
1.471 4.109
PO 0.568 0.261 0.094 1.000
(0.052) (0.055) (0.077)
11.000 4.741 1.218
MOT 0.536 0.544 0.296 0.509 1.000
(0.055) (0.046) (0.092) (0.048)
9.839 11.691 3.206 10.505
SI 0.519 0.264 0.143 0.578 0.451 1.000
(0.059) (0.059) (0.079) (0.050) (0.053)
8.820 4.480 1.822 11.595 8.473
IK 0.490 0.126 0.082 0.508 0.386 0.546 1.000
(0.059) (0.061) (0.072) (0.050) (0.059) (0.049)
8.375 2.070 1.136 10.194 6.491 11.255
C 0.706 0.209 0.103 0.591 0.537 0.531 0.425 1.000
(0.035) (0.055) (0.080) (0.046) (0.047) (0.051) (0.059)
20.053 3.801 1.300 12.813 11.414 10.366 7.236 JC=Job Characteristics, PON=Psychological Ownership Individuals Needs, PS_Mot=Psychological Safety*Mot Interaction ,PO=Psychological Ownership, Mot=Motivation, SI=Self Investment, IK=Intimate Knowledge, C=Control
Overall conclusions regarding the fit of the reduced psychological
ownership measurement model
Van Deventer (2015) outlines general criteria in terms of arriving at a verdict on the
success with which the latent variables comprising a structural model have been
operationalised. She suggests that successful operationalisation can be assumed if the
following criteria have been met:
1) the measurement model fits the data reasonably well,
2) the completely standardised factor loadings λxij are large (λij≥.71) and statistically
significant (p<.05),
96 Although this illustrates the so-called unstandardised phi matrix the ij estimates displayed are nonetheless standardised estimates and can therefore be interpreted as correlation coefficients rather than covariances.
Stellenbosch University https://scholar.sun.ac.za
268
3) the variance terms (θδjj) in the completely standardised solution are small and
statistically significant (p<.05) for all indicators,
4) the R2 indices are large for all indicators; and
5) discriminant validity had been demonstrated.
When considering the above-mentioned criteria in terms of the reduced psychological
ownership measurement model specifically, the following can be concluded. Good model
fit indices were reported in the goodness-of-fit statistics. The completely standardised
factor loadings in terms of the lambda-X parameter estimates were relatively high.
Furthermore, the measurement error terms were all small and mostly statistically
significant. Finally, discriminant validity had been demonstrated. It was therefore
concluded that the operationalisation of the latent variables comprising the psychological
ownership structural model was successful. It was therefore permissible to interpret the fit
of the psychological ownership structural model.
5.9 EVALUATING THE FIT OF THE PSYCHOLOGICAL OWNERSHIP STRUCTURAL
MODEL
When assessing the structural model, the focus is on the substantive relationships of
interest (Diamantopoulos & Siguaw, 2009). Here the focus is on the various relationships
hypothesised in the model, between the exogenous and endogenous latent variables, as
well as between the endogenous latent variables. The objective of this part of the research
study is to determine if the hypothesised relationships are in fact supported by the data.
The inadmissible values obtained in the original measurement model necessitated the
deletion of latent salience of psychological ownership needs * job characteristics
interaction effect, the latent squared salience of psychological ownership needs effect and
the latent squared job characteristics effect. This in turn necessitated the deleting of the
following three paths from the model: γ23 γ24 γ25. Therefore, the reduced psychological
ownership structural model, deemed Model A, and depicted in Figure 5.12, was evaluated
using LISREL 8.80.
Evaluating the goodness of fit of the reduced psychological ownership
structural model (Model A)
Figure 5.12 portrays a visual representation of the reduced psychological ownership
structural model (Model A). This is followed by Table 5.127 which outlines the fit statistics.
Stellenbosch University https://scholar.sun.ac.za

269
Figure 5.12. Visual Representation of the Reduced Psychological Ownership
Structural Model (Model A) (Completely Standardised Solution)
Stellenbosch University https://scholar.sun.ac.za

270
The conclusion on structural model fit, for Model A, was similarly based on a basket of
evidence and not merely one single indicator (as seen above in the interpretation of the
measurement model fit). Therefore, several fit indices, highlighted in Table 5.127 below,
were considered in determining the fit of the reduced psychological ownership structural
model (Model A).
The exact fit null hypothesis (H01a: RMSEA = 0) was rejected (p<.05). The close fit null
hypothesis was not rejected (p>.05). The remainder of the fit statistics in Table 5.127
above indicated reasonable to good fit. The completely standardised structural error
variance estimate for 3, however, returned an inadmissible value (33=1.219). The model
was therefore not further interpreted.
The model was subsequently modified by removing the path from intimate knowledge (4)
on self-investment (3). The hypothesised influence of intimate knowledge on self-
investment was found to be statistically significant (p<.05) but the sign of the regression
slope disagreed with the nature of the relationship hypothesised under the directional
alternative hypothesis. The modified psychological ownership structural model with 34
deleted (Model B) was subsequently refitted. The model converged in 37 iterations. The
fitted modified psychological ownership structural model (completely standardised
solution) is shown in Figure 5.13. Inspection of the completely standardised solution
indicated no inadmissible parameter estimates. The fit statistics are shown in Table 5.127.
Stellenbosch University https://scholar.sun.ac.za

271
Table 5.127
Reduced Psychological Ownership Structural Model (Model A) Goodness of Fit
Statistics
Statistic Value
Degrees of Freedom 116
Minimum Fit Function Chi-Square 325.490 (P = 0.0)
Normal Theory Weighted Least Squares Chi-Square 267.441 (P = 0.00)
Satorra-Bentler Scaled Chi-Square 248.225 (P = 0.00)
Chi-Square Corrected for Non-Normality 414.027 (P = 0.0)
Estimated Non-centrality Parameter (NCP) 132.225
90 Percent Confidence Interval for NCP (90.678 ; 181.523)
Minimum Fit Function Value 0.992
Population Discrepancy Function Value (F0) 0.403
90 Percent Confidence Interval for F0 (0.276 ; 0.553)
Root Mean Square Error of Approximation (RMSEA) 0.059
90 Percent Confidence Interval for RMSEA (0.0488 ; 0.0691)
P-Value for Test of Close Fit (RMSEA < 0.05) 0.072
Expected Cross-Validation Index (ECVI) 1.092
90 Percent Confidence Interval for ECVI (0.965 ; 1.242)
ECVI for Saturated Model 1.043
ECVI for Independence Model 25.251
Chi-Square for Independence Model with 153 Degrees of Freedom 8246.166
Independence AIC 8282.166
Model AIC 358.225
Saturated AIC 342.000
Independence CAIC 8368.495
Model CAIC 622.008
Saturated CAIC 1162.126
Normed Fit Index (NFI) 0.970
Non-Normed Fit Index (NNFI) 0.978
Parsimony Normed Fit Index (PNFI) 0.735
Comparative Fit Index (CFI) 0.984
Incremental Fit Index (IFI) 0.984
Relative Fit Index (RFI) 0.960
Critical N (CN) 204.947
Root Mean Square Residual (RMR) 0.114
Standardized RMR 0.107
Goodness of Fit Index (GFI) 0.917
Adjusted Goodness of Fit Index (AGFI) 0.878
Parsimony Goodness of Fit Index (PGFI) 0.622
Stellenbosch University https://scholar.sun.ac.za

272
Figure 5.13. Visual Representation of the Modified Psychological Ownership
Structural Model (Model B) (Completely Standardised Solution)
Stellenbosch University https://scholar.sun.ac.za

273
Table 5.128
Modified Psychological Ownership Structural Model (Model B) Goodness of Fit
Statistics
Statistic Value
Degrees of Freedom 117
Minimum Fit Function Chi-Square 333.984 (p=0.0)
Normal Theory Weighted Least Squares Chi-Square 272.103 (p=0.00)
Satorra-Bentler Scaled Chi-Square 252.716 (p=0.00)
Chi-Square Corrected for Non-Normality 464.818 (p=0.0)
Estimated Non-centrality Parameter (NCP) 135.716
90 Percent Confidence Interval for NCP (93.694 ; 185.486)
Minimum Fit Function Value 1.018
Population Discrepancy Function Value (F0) 0.414
90 Percent Confidence Interval for F0 (0.286 ; 0.566)
Root Mean Square Error of Approximation (RMSEA) 0.0595
90 Percent Confidence Interval for RMSEA (0.0494 ; 0.0695)
P-Value for Test of Close Fit (RMSEA < 0.05) 0.0602
Expected Cross-Validation Index (ECVI) 1.100
90 Percent Confidence Interval for ECVI (0.972 ; 1.251)
ECVI for Saturated Model 1.043
ECVI for Independence Model 25.251
Chi-Square for Independence Model with 153 Degrees of Freedom 8246.166
Independence AIC 8282.166
Model AIC 360.716
Saturated AIC 342.000
Independence CAIC 8368.495
Model CAIC 619.703
Saturated CAIC 1162.126
Normed Fit Index (NFI) 0.969
Non-Normed Fit Index (NNFI) 0.978
Parsimony Normed Fit Index (PNFI) 0.741
Comparative Fit Index (CFI) 0.983
Incremental Fit Index (IFI) 0.983
Relative Fit Index (RFI) 0.960
Critical N (CN) 202.819
Root Mean Square Residual (RMR) 0.120
Standardized RMR 0.115
Goodness of Fit Index (GFI) 0.916
Adjusted Goodness of Fit Index (AGFI) 0.877
Parsimony Goodness of Fit Index (PGFI) 0.626
Stellenbosch University https://scholar.sun.ac.za
274
In order to test the exact fit null hypothesis (H01a: RMSEA = 0; Ha1a: RMSEA > 0) the
Satorra-Bentler Scaled Chi-Square was examined. It is evident from Table 5.128 above
that the modified psychological ownership structural model obtained a Satorra-Bentler
Scaled Chi-Square value of 252.716 (p=0.0).This finding of significance attests to the fact
that the null hypothesis of exact fit should be rejected.
A more reasonable assumption is that the modified psychological ownership model could
provide a valid plausible explanation, and therefore close fit would be more realistic. In
order to determine close fit, the RMSEA and p-value test of close fit were examined. The
modified psychological ownership structural model obtained a RMSEA value of .0595,
indicating reasonable to good fit. The conditional probability of obtaining such a sample
RMSEA value, if it is assumed that the close fit null hypothesis is true in the parameter,
was sufficiently large (p>.05) not to reject the close fit null hypothesis. When viewed in
conjunction with the 90 percent confidence interval for RMSEA (.0494; .0695) further
evidence of good to reasonable fit was obtained, in that in a well-fitting model the lower
limit should be close to 0 (at least below .05) while the upper limit should be less than .08.
It is apparent that these conditions have been met and therefore the fit of this model was
good to reasonable. This bolstered confidence in this modified psychological ownership
structural model and it seemed reasonable to suggest that it may provide a reasonable
reproduction, and therefore explanation, of the observed covariance matrix. But further
exploration was necessary.
The ECVI value showed that the difference between the sample covariance matrix derived
from fitting the modified psychological ownership structural model on the current sample,
and the expected covariance, should the fitted model be cross validated to another
sample, was favourable (IECVI: 25.251 to ECVI: 1.100). It is evident that the ECVI for the
fitted model is much lower than that of the independent model. It was however slightly
higher than that reported for the saturated model (1.043), providing evidence for a model
potentially lacking paths (Diamantopoulos & Siguaw, 2009).
The NFI (.969), NNFI (.978), CFI (.983) IFI (.983) and RFI (.960) fit indices, presented in
Table 5.128 above, in agreement with the preceding indices, rather convincingly
suggested a favourable fit of the psychological ownership structural model. All values
exceed the more stringent cut-off value of .95 that has been suggested for these indices
(Hu and Bentler, 1999).
Stellenbosch University https://scholar.sun.ac.za

275
The CN (202.819) moreover also provided corroboratory evidence for this finding of good
fit in that the reported value was above the 200 threshold, albeit only marginally, and
therefore sufficient representation of data by the fitted model was suggested. Further
evidence of a merely reasonably well fitting model was evident in the final fit indices
namely the SRMR, GFI and AGFI. The model obtained a satisfactory GFI (.916) but an
unsatisfactory AGFI (.877). It should be acknowledged however that these values fell just
below the cut-off (>.90) and therefore the model should not be assumed to be a poor-
fitting model. The SRMR (.115) did however provide further support for a problematic-
fitting model, as it fell above the .05 threshold.
Considering the above it can thus far be suggested that the modified psychological
ownership structural model, presented in Figure 5.13, shows reasonable model fit.
However, before a final conclusion can be drawn pertaining to the fit of this model the
standardised residuals and modification indices were evaluated and interpreted (Jöreskog
& Sörbom, 1996).
Modified psychological ownership structural model (Model B) standardised
residuals
The distribution of the standardised residuals is visually depicted below in Figure 5.14,
followed by a summary of both the large positive and large negative residuals presented
in Table 5.129.
- 3|98 - 2|43210 - 1|5554210 - 0|99988888777665544432221111100000000000000000000000000000000000000000 0|1112233444455555555666666667777788888999 1|0111112222333344457778 2|144 3|03447 4|0456899 5|13789 6|011 7|0358
Figure 5.14. Stem-And-Leaf Plot for the Modified Psychological Ownership
Structural Model (Model B)
A stem-and-leaf plot, that depicts a good fitting model, would display residuals distributed
closely around 0. It is evident from Figure 5.14 above that the distribution of the
standardised residuals for the modified psychological ownership structural model were
somewhat positively skewed. Therefore, it can be suggested that in general the observed
Stellenbosch University https://scholar.sun.ac.za

276
covariance matrix is being underestimated by the model parameters. Additional support
for this finding was found in Table 5.129 below where only 2 of the 26 significant
standardised residuals were negative.
Table 5.129
Summary Statistics for the Modified Psychological Ownership Structural Model
(Model B) Standardised Residuals
Largest Negative Standardised Residuals Residual for MOT_1 and SI_1 -3.809
Residual for MOT_2 and SI_1 -3.922
Largest Positive Standardised Residuals Residual for MOT_1 and C_1 4.914
Residual for MOT_1 and C_2 3.440
Residual for MOT_1 and PO_1 4.895
Residual for MOT_1 and PO_2 5.750
Residual for MOT_2 and C_1 4.803
Residual for MOT_2 and C_2 3.443
Residual for MOT_2 and PO_1 4.450
Residual for MOT_2 and PO_2 5.055
Residual for JC_1 and IK_1 4.610
Residual for JC_1 and IK_2 4.393
Residual for JC_1 and SI_1 3.706
Residual for JC_1 and SI_2 3.312
Residual for JC_1 and C_1 7.765
Residual for JC_1 and C_2 6.970
Residual for JC_1 and PO_1 5.710
Residual for JC_1 and PO_2 6.098
Residual for JC_2 and IK_1 5.870
Residual for JC_2 and IK_2 5.310
Residual for JC_2 and SI_1 4.041
Residual for JC_2 and SI_2 2.991
Residual for JC_2 and C_1 7.513
Residual for JC_2 and C_2 7.311
Residual for JC_2 and PO_1 5.981
Residual for JC_2 and PO_2 6.146 JC=Job Characteristics, PO=Psychological Ownership, Mot=Motivation, SI=Self Investment, IK=Intimate Knowledge, C=Control
It was additionally concluded that 26 residuals were large (>|2.58|), with two being large
negative and 24 being reported as large positive residuals. It can therefore be concluded
that 15.2%97 of the unique variance-covariance terms were poorly estimated. This
97 26/[(18x19)/2]=26/171=.1520467
Stellenbosch University https://scholar.sun.ac.za

277
corroborates the findings concluded from the fit statistics in Table 5.128 and standardised
residuals depicted in Figure 5.14 above. The inference derived from the standardised
residual distribution that the model tended to the underestimate the observed covariance
matrix dovetailed with the finding that both ECVI and the Akaike information criterion (AIC)
were more favourable for the saturated model than for the fitted model. The consistent
Akaike information criterion (CAIC) did not support this trend. It seemed that the addition
of new paths might be necessary to improve model fit.
The Q-plot, displayed below in Figure 5.15, provided further corroboratory evidence of the
findings of underestimation in that the data points swivelled away from the 45-degree line
predominantly in the upper region.
Figure 5.15. Q-Plot of the Modified Psychological Ownership Structural Model
(Model B) Standardised Residuals
This provided further evidence for a model that displayed only reasonable fit, as good fit
would have been indicated by data points gathered tightly around the 45-degree reference
line.
Stellenbosch University https://scholar.sun.ac.za

278
Since it seemed reasonable, based on the foregoing basket of evidence, to suggest that
the fit of the modified psychological ownership structural model was reasonable, it was
decided that it would be permissible to examine and interpret the statistical significance of
the unstandardised parameter estimates, the magnitude of the completely standardised
parameter estimates as well as the proportion of variance explained in each of the
endogenous latent variables.
Modified psychological ownership structural model parameter estimates
and squared multiple correlations
When assessing the modified psychological ownership structural model in terms of the
parameter estimates three specific matrices were of interest, namely, Gamma, Beta and
Psi. Gamma describes the estimated slopes of the regression relationships that were
hypothesised between the exogenous and endogenous latent variables and Beta
describes the estimated slopes of the directional regression relationships hypothesised
between the endogenous variables. Both ij and ij were interpreted as partial regression
coefficients unless only a single i or i was hypothesised to affect j. This therefore meant
that ij and ij described the average change in j associated with one unit change in i
when holding constant (or controlling for) all other latent variables that were structurally
linked to j. Psi describes the estimated variances of the structural error terms associated
with each endogenous latent variable in the modified psychological ownership structural
model.
Diamantopoulos and Siguaw (2009) highlight four aspects of importance when
investigating the above-mentioned parameters. Firstly, the sign of the estimated path
coefficients should correspond to the relevant path-specific substantive hypotheses,
theorised in Chapter 2, and the statistical alternative hypotheses proposed in Chapter 3.
If, for example a positive relationship had been hypothesised between psychological
ownership and motivation, the sign of the parameter estimate for this path should be
positive (and vice versa). All structural error variance estimates have to be positive.
Secondly, it should be determined whether the parameter estimates were statistically
significant (p<.05). Thirdly, the magnitude of the parameter estimates should be
interpreted and, lastly, the squared multiple correlations should be analysed to determine
the variance in each endogenous variable that was accounted for by the latent variables
linked to it in the structural model.
Stellenbosch University https://scholar.sun.ac.za

279
Both the standardised and unstandardised matrices for gamma, beta and psi will be
discussed below, presented in Tables 5.130, 5.131, 5.132, 5.133, 5.134 and 5.135
respectively.
In the unstandardised matrices three figures are reported, the unstandardised parameter
estimates (the first value), the standard error terms (the middle value) and the z-values
(the bottom value). Due to the directional alternative hypotheses, a parameter estimate
was considered statistically significant (p<.05) if the absolute z-value obtained was greater
than or equal to |1.6449|.
Table 5.130
Modified Psychological Ownership Structural Model (Model B) Unstandardised
Gamma Matrix
JC PON PS_MOT
PO - - - - - -
MOT 0.466* 0.457* - -
(0.057) (0.053)
8.126 8.581
SI - - - - -0.009
(0.063)
-0.135
IK - - - - - -
C - - - - - - * (p<.05) JC=Job Characteristics, PON=Psychological Ownership Individuals Needs, PS_Mot=Psychological Safety*Mot Interaction, PO=Psychological Ownership, Mot=Motivation, SI=Self Investment, IK=Intimate Knowledge, C=Control
The unstandardised gamma matrix above, describes the slopes of the regression of the
endogenous latent variables (η) on the exogenous latent variables (ξ). Table 5.130
provides an assessment of the strength and the statistical significance of the relationship
between job characteristics (JC) and the motivation to pursue the routes towards
psychological ownership (MOT), of the relationship between individual psychological
ownership individual needs (PON) and motivation to pursue the routes towards
psychological ownership (MOT) and of the moderating effect of psychological safety (PS)
on the effect of the motivation to pursue the routes towards psychological ownership
(MOT) on investing the self (SI).
The sign of two of the three ij estimates, indicating the nature of the relationships, both
agreed with the hypothesised positive relationships. Additionally, two of the three path
Stellenbosch University https://scholar.sun.ac.za

280
coefficient estimates were statistically significant (p<.05). H02: 21=0 and H03: 22=0 were
therefore rejected98. Path-specific substantive hypotheses 2 and 3 were therefore
corroborated. Support was therefore obtained for the hypothesised effect of job
characteristics (JC) on the motivation to pursue the routes towards psychological
ownership and for the hypothesised effect individual psychological ownership needs
(PON) on the motivation to pursue the routes towards psychological ownership (MOT).
H010:36=0 could, however, not be rejected. Path-specific substantive hypotheses 10 was
therefore not corroborated. Support was therefore not obtained for the hypothesised
moderating effect of psychological safety on the effect of the motivation to pursue the
routes towards psychological ownership on investing the self. The unstandardised beta
matrix, describing the slope of the relationship between the various endogenous variables
in the modified psychological ownership structural model (Model B), is presented below in
Table 5.131.
Table 5.131
Modified Psychological Ownership Structural Model Unstandardised Beta Matrix
(Model B)
PO MOT SI IK C
PO - - - - 0.331 0.185 0.331
(0.079) (0.059) (0.071)
4.205 3.126 4.655
MOT -0.045 - - - - - - - -
(0.060)
-0.756
SI - - 0.544 - - - - - -
(0.069)
7.887
IK - - - - 0.477 - - 0.155
(0.077) (0.073)
6.162 2.118
C - - - - 0.578 - - - -
(0.056)
10.308 PO=Psychological Ownership, Mot=Motivation, SI=Self Investment, IK=Intimate Knowledge, C=Control
According to Table 5.131 above, all of the hypothesised relationships between the
endogenous variables within the model are statistically significant (p<.05) except for the
98 Given the fact that the ij (and the ij) represent partial regression coefficients the H02 and H03 tested here are not strictly speaking equal to the hypotheses formulated in Chapter 3. H02 here, when written in full states H02:
21=0|20 whereas in the original model H02, when written in full states H02: 21=0|20; 30; 40; 50.
Stellenbosch University https://scholar.sun.ac.za

281
relationship between psychological ownership and motivation to pursue the routes
towards psychological ownership. H09: 32=0, H013: 13=0, H016: 43=0, H011: 53=0, H015:
14=0, H014: 15=0 and H012: 45=0 were therefore all rejected in favour of Haj: j=9, 11, 12,
13, 14, 15, 16. Path-specific substantive hypotheses 9, 11, 12, 13, 14, 15 and 16 were
therefore corroborated. H018: 21=0 could not be rejected. Path-specific substantive
hypotheses 18 was therefore not corroborated.
The standardised matrices were investigated as they provided additional “insights into the
relative impact of each independent variable on each endogenous variable”
(Diamantopoulos & Siguaw, 2009, p. 93). Similar to the standardised matrices
investigated in the measurement model these standardised matrices for gamma, beta and
psi provide information that is unaffected by differences in the units of measurement in the
questionnaire. The completely standardised gamma and beta matrices describe the
average change in the endogenous latent variable j expressed in standard deviation units
associated with one standard deviation change in the exogenous latent variable i or
endogenous latent variable i. Moreover, both the unstandardised and the completely
standardised path coefficients should be interpreted as partial regression coefficients. The
ij estimate therefore describes the average change in i associated with one unit change
in j when holding all other effects that have been hypothesised to affect i constant.
Likewise the ij estimate describes the average change in i associated with one unit
change in j when holding all other effects that have been hypothesised to affect i
constant. Table 5.132 below depicts the completely standardised gamma matrix.
Table 5.132
Modified Psychological Ownership Structural Model Completely Standardised
Gamma Matrix (Model B)
JC PON PS_MOT
PO - - - - - -
MOT 0.466 0.457 - -
SI - - - - -0.009
IK - - - - - -
C - - - - - - JC=Job Characteristics, PON=Psychological Ownership Individuals Needs, PS_Mot=Psychological Safety*Mot Interaction ,PO=Psychological Ownership, Mot=Motivation, SI=Self Investment, IK=Intimate Knowledge, C=Control
According to Table 5.128, above the influence of job characteristics on motivation to
pursue the routes towards psychological ownership (.466) and the influence of an
Stellenbosch University https://scholar.sun.ac.za

282
individual’s salient psychological ownership root need on motivation to pursue the routes
towards psychological ownership (.457) were both moderately strong. On average, the
motivation to pursue the routes to psychological ownership increased approximately half
a standard deviation for every standard deviation increase in job characteristics when
holding all other effects in the model that are structurally mapped on motivation constant.
Likewise on average the motivation to pursue the routes to psychological ownership
increased approximately half a standard deviation for every standard deviation increase
in salience of the needs for psychological ownership when holding all other effects in the
model that are structurally mapped on motivation constant.
Table 5.133 depicts the completely standardised gamma matrix.
Table 5.133
Modified Psychological Ownership Structural Model Completely Standardised
Beta Matrix (Model B)
PO MOT SI IK C
PO - - - - 0.331 0.185 0.331
MOT -0.045 - - - - - - - -
SI - - 0.544 - - - - - -
IK - - - - 0.477 - - 0.155
C - - - - 0.578 - - - - PO=Psychological Ownership, Mot=Motivation, SI=Self Investment, IK=Intimate Knowledge, C=Control
Table 5.133 above indicates that the relationship between self-investment and control was
the most pronounced (.578), followed by the positive effect of motivation to pursue the
routes to psychological ownership on self-investment (.544) and the positive effect of self-
investment on intimate knowledge (.477). The paths between control and psychological
ownership (.331), intimate knowledge and psychological ownership (.185), and between
control and intimate knowledge (.155), were somewhat less pronounced. It was
heartening to the researcher to see that one of the most pronounced relationship is that
of motivation on self-investment as this was an additional path included in the model after
much theorising and questioning of current literature pertaining to psychological
ownership.
Table 5.134 below depicts the unstandardised psi matrix which outlines the variance in
the structural error terms. Similar to the previous unstandardised gamma and beta
matrices, the top value represents the unstandardised psi coefficients. The second value
is the standard error and the last value represents the test statistic z. A moderate to small,
Stellenbosch University https://scholar.sun.ac.za

283
but statistically significant (p<.05) psi variance is to be expected since the model cannot
be regarded as perfect.
Table 5.134
Modified Psychological Ownership Structural Model Unstandardised Psi Matrix
(Model B)
PO MOT SI IK C
0.516 0.515 0.728 0.667 0.673
(0.053) (0.057) (0.080) (0.065) (0.084)
9.787 9.032 9.144 10.258 8.040 PO=Psychological Ownership, Mot=Motivation, SI=Self Investment, IK=Intimate Knowledge, C=Control
It is evident from Table 5.134 above that the null hypothesis that the variance in the jth
structural error term is zero could be rejected (z>1.6449) for all of the endogenous latent
variables. This implies that the estimated structural error variance was statistically
significant (p<.05), which was to be expected since it is unlikely that the model would
provide a perfect explanation for variance in the endogenous latent variables99.
Table 5.135 depicts the completely standardised psi matrix
Table 5.135
Modified Psychological Ownership Structural Model Completely Standardised Psi
Matrix (Model B)
PO MOT SI IK C
0.516 0.515 0.728 0.667 0.673 PO=Psychological Ownership, Mot=Motivation, SI=Self Investment, IK=Intimate Knowledge, C=Control
Table 5.135 depicting the completely standardised psi matrix provides a somewhat
disappointing view in terms of the magnitude of the error variance coefficients for the
modified psychological ownership structural model (Model B). It was expected that these
variances would be significant but reasonably modest in magnitude. However, this is not
the case and the magnitude is somewhat disappointing. This evidence suggests that the
model did a reasonably poor job of explaining variance in each of the endogenous latent
99 Models within psychological research are not meant to be perfect representation of reality. They are ever changing, ever evolving representation or explanations that provide us with a window into the uniqueness that underlies each individual within society. They act as mere glimpses into the complex world of human nature and therefore are expected to provide a somewhat close or reasonable representation but not perfect explanation of reality.
Stellenbosch University https://scholar.sun.ac.za

284
variables100. It must however be highlighted here that the psi estimate for the focal variable
of interest (psychological ownership) was relatively satisfactory (.516) as was the 22
estimate for motivation to pursue the routes to psychological ownership. Additionally, it
must be highlighted that the self-investment latent variable posed several questions for
the researcher and it did not altogether come as a surprise that this variable requires much
more exploration to reduce its psi variance.
Approaching the same question from the opposite angle, the proportion of variance
evident within each endogenous variable that the weighted composite of effects linked to
it in the model explained will now be examined in order to identify areas in the model that
require further elaboration. These values are presented below in Table 5.136.
Table 5.136
Squared Multiple Correlations for the Endogenous Variables of the Modified
Psychological Ownership Structural Model (Model B)
PO MOT SI IK C
0.484 0.485 0.272 0.333 0.327 PO=Psychological Ownership, Mot=Motivation, SI=Self Investment, IK=Intimate Knowledge, C=Control
It is evident from the squared multiple correlations above in Table 5.136 that 48% of the
variance for psychological ownership was explained by the proposed psychological
ownership structural model. It can therefore be concluded that the proposed structural
model was therefore reasonably successful in explaining variance in psychological
ownership. This was similarly true for its attempts to explain variance in the motivation to
pursue the routes to psychological ownership in that the proposed psychological
ownership model explains 48% of the variance in the motivation to pursue the routes to
psychological ownership. However, the same could unfortunately not be deduced for the
three routes to psychological ownership namely self-investment (.272), taking control of
the job (.327) and gaining intimate knowledge (.333). The need for further research to
elaborate the current structural model can therefore be inferred from these values.
100 At the same time, however, the reasonably large error variance estimates attest to the complex nature of the psychological mechanism that operates to regulate the levels of psychological ownership and that the current model still suffers from substantial deficiencies. The purpose of research is to uncover complex interrelationships and antecedents of intricate behaviours of, in this case, working man. It is therefore acknowledged here that although these findings are somewhat disappointing it highlights the need for ongoing research in this area to uncover the “omitted” variables and to build them into an improved version of the psychological mechanism regulating levels of psychological ownership.
Stellenbosch University https://scholar.sun.ac.za

285
The modification indices will now be investigated with a twofold objective, firstly to
corroborate model fit and secondly to determine paths or relationships that could be added
to this seemingly underestimated model to provide a more valid explanation of the
antecedents of levels of psychological ownership experienced by working man. The latter
aspect was regarded as data-driven suggestions for future research and was
consequently discussed in Chapter 6.
Modified psychological ownership structural model modification indices
According to Van Deventer (2015) currently fixed parameters, that if set free, would
statistically significantly (p<.01) improve the model fit are indicated by critical chi-square
values above 6.6449. The modification indices for gamma and beta are depicted below in
Tables 5.137 and Table 5.138.
Table 5.137
Modified Psychological Ownership Structural Model Modification Indices for Beta
(Model B)
PO MOT SI IK C
PO - - 14.115 - - - - - -
MOT - - - - 70.924 1.102 0.401
SI 278.955 - - - - 9.078 24.928
IK - - 3.146 - - - - - -
C - - 47.376 - - - - - - PO=Psychological Ownership, Mot=Motivation, SI=Self Investment, IK=Intimate Knowledge, C=Control
From Table 5.137 above it is evident that six of the nine parameters, suggested as
additional paths or relationships in Model B, if set free, would statistically significantly
(p<.01) improve model fit. This percentage (67%) seems to provide further corroboratory
evidence for reasonable fit, underestimation and the subsequent need for further paths to
be added to the model to improve its explanatory power. However, a pertinent question to
ask is whether these suggested modifications make substantive theoretical sense. Before
considering possible modifications between the endogenous variables within the model
the gamma modifications were also examined, as presented in Table 5.138 below.
Stellenbosch University https://scholar.sun.ac.za
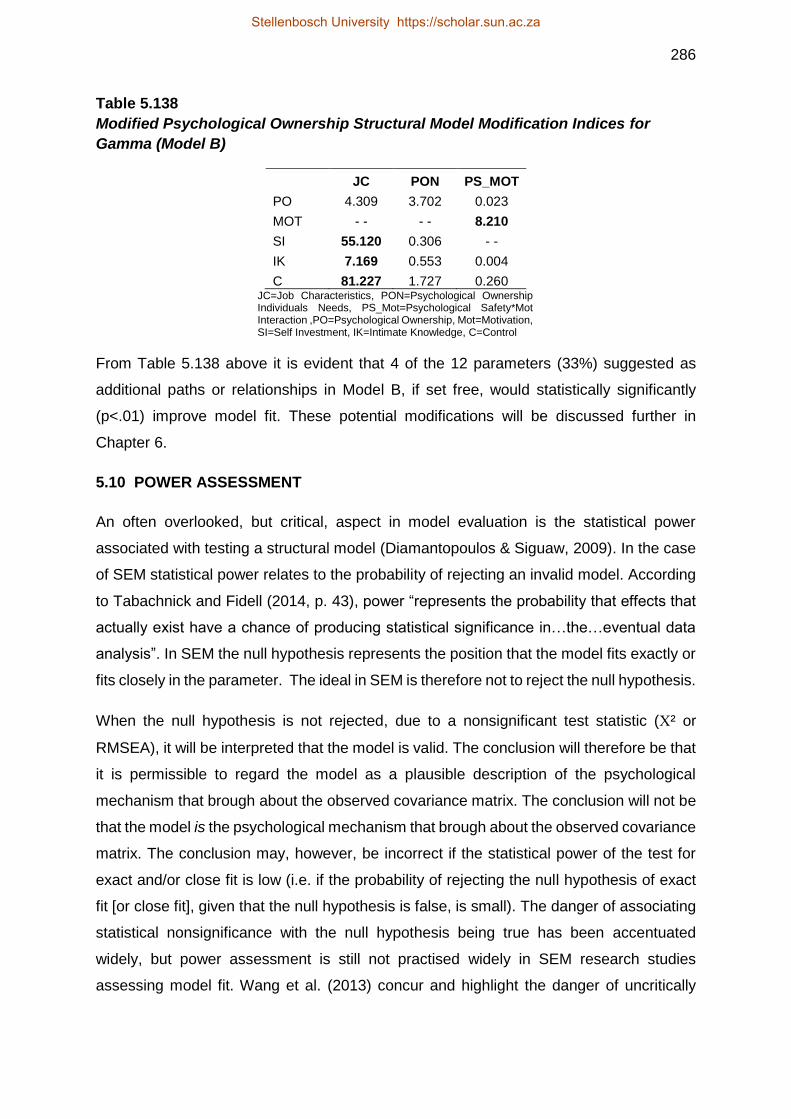
286
Table 5.138
Modified Psychological Ownership Structural Model Modification Indices for
Gamma (Model B)
JC PON PS_MOT
PO 4.309 3.702 0.023
MOT - - - - 8.210
SI 55.120 0.306 - -
IK 7.169 0.553 0.004
C 81.227 1.727 0.260 JC=Job Characteristics, PON=Psychological Ownership Individuals Needs, PS_Mot=Psychological Safety*Mot Interaction ,PO=Psychological Ownership, Mot=Motivation, SI=Self Investment, IK=Intimate Knowledge, C=Control
From Table 5.138 above it is evident that 4 of the 12 parameters (33%) suggested as
additional paths or relationships in Model B, if set free, would statistically significantly
(p<.01) improve model fit. These potential modifications will be discussed further in
Chapter 6.
5.10 POWER ASSESSMENT
An often overlooked, but critical, aspect in model evaluation is the statistical power
associated with testing a structural model (Diamantopoulos & Siguaw, 2009). In the case
of SEM statistical power relates to the probability of rejecting an invalid model. According
to Tabachnick and Fidell (2014, p. 43), power “represents the probability that effects that
actually exist have a chance of producing statistical significance in…the…eventual data
analysis”. In SEM the null hypothesis represents the position that the model fits exactly or
fits closely in the parameter. The ideal in SEM is therefore not to reject the null hypothesis.
When the null hypothesis is not rejected, due to a nonsignificant test statistic (² or
RMSEA), it will be interpreted that the model is valid. The conclusion will therefore be that
it is permissible to regard the model as a plausible description of the psychological
mechanism that brough about the observed covariance matrix. The conclusion will not be
that the model is the psychological mechanism that brough about the observed covariance
matrix. The conclusion may, however, be incorrect if the statistical power of the test for
exact and/or close fit is low (i.e. if the probability of rejecting the null hypothesis of exact
fit [or close fit], given that the null hypothesis is false, is small). The danger of associating
statistical nonsignificance with the null hypothesis being true has been accentuated
widely, but power assessment is still not practised widely in SEM research studies
assessing model fit. Wang et al. (2013) concur and highlight the danger of uncritically
Stellenbosch University https://scholar.sun.ac.za

287
interpreting statistical nonsignificance of chi-square and RMSEA test statistics in SEM as
necessarily indicating that the fitted model is valid.
Power assessments are important due to the influence of sample size on model testing.
Kline (2004) and Wang et al. (2013) offer the following cautionary note: “If you increase
the sample enough, any result will be statistically significant. This is scary,” (Kline, 2004,
p. 16). Wang et al. (2013, p.736) concur and express that “the reverse logic applies: If you
decrease the sample size enough, then any result will be statistically nonsignificant – thus
supporting the theory that no effect exists. This is even scarier because a researcher could
claim the posited theory of no effect by simply doing a small sample study”. By not
including power information or supporting evidence any results, specifically nonsignificant
results, will be questionable and inconclusive and should be treated as such during
interpretation.
Diamantopoulos and Siguaw (2009) caution that the mechanism by which a model is
tested can increase the probability of experiencing a Type I or Type II error. As such,
testing a model using chi-square, as is the case above, could emphasise or exacerbate a
Type I error, whereby a correct model is rejected. A Type II error occurs when an incorrect
model is not rejected. The statistical power indicates the likeliness of rejecting a false null
hypothesis (invalid model).
For the purposes of this research study power was taken into account prospectively when
determining the appropriate or required sample size (Tabachnick & Fidell, 2014). The
prudent thing to do when assessing a structural model is to additionally investigate power
retrospectively. There are various mechanisms that can be employed to conduct an
assessment of power. A variety of software is additionally available to aid in estimating
the power available given the sample size and statistical technique used.
For the purposes of this study, power was assessed using the Preacher and Coffman
software developed in R and freely available online at
http://www.quantpsy.org/rmsea/rmsea.htm (Prinsloo, 2013). In order to conduct the
analysis a significance level of .05 was specified, a sample size (N) of 329, the degrees
of freedom were set to 117, the value of RMSEA was set to .05 under H0 and the value of
RMSEA under Ha was set to .08. According to the results, obtained via the Preacher and
Coffman software, the probability of rejecting the close fit null hypothesis if the model
showed mediocre fit in the parameter (RMSEA=.08) was therefore quite high (.9996016).
This provided confidence in the close fit verdict on the model and the statistical sensitivity
Stellenbosch University https://scholar.sun.ac.za

288
of the close fit hypothesis test. It is therefore unlikely that the close fit null hypothesis in
the current study had not been not rejected because of low statistical power. It is more
likely that the close fit null hypothesis in the current study had not been rejected because
the model fits closely in the parameter. Therefore it is suggested that the verdict on the fit
of the model can be trusted as a credible verdict and that allowed for the confident
interpretation of the model parameter estimates.
5.11 OBSERVED SCORE POLYNOMIAL REGRESSION ANALYSIS WITH
RESPONSE SURFACE ANALYSIS
The primary focus of this research study was the development and empirical testing of a
psychological ownership structural model. In response to the research initiating question
a comprehensive psychological ownership structural model was developed in Chapter 2.
In order to empirically test the proposed psychological ownership structural model, SEM
was employed. Although the measurement model containing the three latent higher-order
polynomial regression terms converged and fitted the data well, the completely
standardised X matrix nonetheless contained four inadmissible factor loading estimates
associated with the latent squared job characteristics, the latent squared salient
psychological ownership needs and the latent job characteristics x salient psychological
ownership needs interaction effect that exceeded unity.
These inadmissible factor loadings necessitated the deletion of the three latent higher-
order polynomial regression terms from the model and consequently also the paths
through which these latent polynomial effects were hypothesised to non-linearly affect the
motivation to pursue the routes to psychological ownership. This is unfortunate as it
erodes the value and meaning derived from this analysis.
These modifications therefore forced the use of observed score polynomial regression on
a narrow-focused structural model as opposed the latent variable polynomial regression
within the comprehensive psychological ownership structural model, to understand the
manner in which the degree of congruence, or lack of it, between the ability of the job
characteristics to meet the individual psychological ownership needs, and the salience of
the individual psychological ownership need nonlinearly affect the motivation to pursue
the routes towards psychological ownership. The narrow-focussed motivation to pursue
the routes towards psychological ownership structural model is depicted in Figure 5.16.
Stellenbosch University https://scholar.sun.ac.za

289
Figure 5.16. Narrow Focused Motivation to Pursue the Routes towards
Psychological Ownership Structural Model
The below sections outline the results of this analysis, after determining the viability of this
investigation.
MOT
Motivation to
pursue the
routes towards
psychological
ownership
η1
Psychological
ownership needs
ξ1
Squared
psychological
ownership needs
ξ2
Psychological
ownership needs *
job characteristics
ξ3
Squared Job
Characteristics
ξ4
Job
Characteristics
ξ5
γ12
γ14
γ15
γ13
γ11
ζ1
Stellenbosch University https://scholar.sun.ac.za

290
Describing the incidence of congruence and incongruence
Before commencing the polynomial regression analysis it was important to first determine
whether different degrees of congruence and incongruence are sufficiently represented to
allow a credible estimate of the response surface over the whole regression space
(Theron, 2014b). In other words, determining whether there were sufficient
correspondences and discrepancies between the two predictors to warrant an
investigation into how these correspondences and discrepancies affect the outcome
variable (Shanock et al. 2010).
To determine whether the procedure would result in a credible response surface the
measures of the two predictor variables [salience of the individual psychological
ownership need and job characteristics (i.e. perceived ability of the job to satisfy the root
needs)] were standardised (i.e. transformed to z-scores) and the difference between them
calculated. According to Shanock et al. (2010) any participant with a standardised score
on one predictor variable that is more than half a standard deviation above or below the
standardised score on the other predictor variable is considered to have discrepant
values. These differences were categorised into three groups, as seen in Table 5.139
below.
Table 5.139
Incidence of Congruence and Incongruence
Frequency Percent Valid Percent Cumulative
Percent
Valid Incongruence JOBC<PON 95 28.9 28.9 28.9 Congruence 127 38.6 38.6 67.5 Incongruence JOBC>PON 107 32.5 32.5 100.0 Total 329 100.0 100.0
JOBC=Job Characteristics, PON=Psychological Ownership Individual Needs
From Table 5.139 above it is evident that just under two thirds (61%) of the sample
(N=329) experienced the salience of their psychological ownership root needs differently
from the perceived ability of their jobs to satisfy these psychological ownership root needs,
in one direction or another. Just over a third experienced congruence between the
salience of their psychological ownership root needs and the perceived ability of their jobs
to satisfy these psychological ownership root needs. Further evidence with regards to the
levels of congruence and incongruence can be portrayed graphically using a bar chart as
depicted in Figure 5.17.
Stellenbosch University https://scholar.sun.ac.za

291
Figure 5.17. Bar Chart Representing Incidence of Congruence and Incongruence
Figure 5.17 above portrays a reasonably equal representation of congruence and the two
forms of incongruence. It would therefore seem, from Figure 5.17, that there were
sufficient incidences of congruence and both types of incongruence to warrant further
investigation.
The problem with the manner in which Table 5.139 and Figure 5.17 examines the question
whether the different degrees of congruence and incongruence are sufficiently
represented to allow a credible estimate of the response surface over the whole regression
space is that it (a) fails to distinguish between + + and - - congruence and (b) it fails to
take the magnitude of the two forms of congruence (+ + and - -) and the two forms of
incongruence (+ - and - +) into account. These problems are mitigated by not calculating
the difference in the standardised predictors and by not trichotomising the difference.
Rather, the standardised salience of psychological ownership root needs were plotted
against the perceived ability of jobs to satisfy these psychological ownership root needs
to create a two-dimensional scatter plot. Each observation in the scatterplot was colour-
code based on his/her classification in the previous trichotomy. The scatterplot is depicted
in Figure 5.18.
The finding of sufficient incidences of congruence and both types of incongruence was
however not substantiated by the scatterplot which allowed for a more nuanced view of
Stellenbosch University https://scholar.sun.ac.za

292
the incidence of congruence and incongruence, as well as the exact position of these
observations across the response surface. The scatterplot does show sufficient cases of
congruence and incongruence. However, Figure 5.18 below indicates that there seemed
to be a lack of both congruence and incongruence in the bottom left-hand corner of the
graph (indicated by the yellow highlighted triangle).
Ideally, one would have wanted to see a few more observations in the triangular area
demarcated in yellow. The lack of observations in this area inevitably meant treating the
response surface that emerged in this region as somewhat more tentative. Saying this,
the scatterplot did show sufficient cases of congruence and incongruence to allow credible
results. Based on this data it was concluded that exploring, how the satisfaction of salient
individual psychological ownership needs by the characteristics of the job relates to the
motivation to pursue the routes towards psychological ownership, made practical sense.
Figure 5.18. Scatterplot Representing Incidents of Congruence and Incongruence
Incongruent JOBC<PON
Congruent
Incongruent JOBC>PON
Stellenbosch University https://scholar.sun.ac.za

293
Fitting the polynomial regression model
Fitting the polynomial regression model involved first preventatively dealing with the
problem of multicollinearity, then calculating the squared and product terms in the
equation, specifying the model and finally inspecting the significance of R2.
5.11.2.1 Preventatively dealing with the problem of multicollinearity
The problem of high multicollinearity occurs when one of the independent variables has
nearly a perfect linear relationship to one or more of the other X-variables – robbing each
other of significance due to the shared explanatory power (Kahane, 2001). The problem
here lies with the “inability of our data to clearly distinguish the separate yet subtle effects
of two independent variables,” (Kahane, 2001, p. 114). Because the three higher-order
polynomial regression terms were calculated from the job characteristics measure (X) and
the salience of psychological ownership needs measure (Y) the danger of multicoliniarity
presented itself as a very real one. Dealing with multicollinearity therefore alleviated the
problem of overly high correlations between the five predictors in the polynomial
regression model.
There are several options for dealing with this issue namely, midpoint-centering, mean-
centering or residual-centering (Little, Card, Bovaird, Preacher, & Crandal, 2007). In this
case, mean-centering was used because the scale scores were calculated from the job
characteristics and psychological ownership needs instruments and the midpoints of these
scales were unclear. See Table 5.140 below for the mean values used.
Table 5.140
Descriptive Statistics
N Minimum Maximum Mean Std. Deviation
JOBC 329 28.00 105.00 82.6900 13.40053 PON 329 29.00 84.00 69.8875 9.64283 Valid N (listwise)
329
JOBC=Job Characteristics, PON=Psychological Ownership Individual Needs
Stellenbosch University https://scholar.sun.ac.za

294
5.11.2.2 Calculating the squared and product terms
Calculating the squared and product terms (the ingredients necessary for second-order
polynomial regression and insertion in the Cunningham Excel Macro) involved manually
creating the quadratic and product terms in SPSS that form the latter part of the polynomial
regression equation, shown as equation 2 below.
E[Z|X,Y] = b0 + b1X + b2Y + b3Y2 + b4XY + b5Y2………………………………Equation 2
Where:
• Z is the predicted motivation to pursue the routes to psychological ownership
outcome value for the polynomial model
• X and Y are the predictor variables job characteristics and the salience of the
psychological ownership needs respectively
• X2 and Y2 are the quadratic terms for the predictors X and Y, respectively
• XY is the interaction term of the two predictors
Motivation to pursue the routes to psychological ownership was subsequently regressed
on the weighted linear combination of job characteristics (X), the salience of the
psychological ownership needs (Y), X², Y² and XY. The results of the polynomial
regression is shown in Table 5.141.
Table 5.141
Polynomial regression analysis
Model
Unstandardised Coefficients
Standardised Coefficients
t Sig. b Std. Error Beta
1 (Constant) 303.876 4.327 70.234 .000 *JOBCCEN_b1 (X) 2.820 .328 .487 8.609 .000 *PONCEN_b2 (Y) 3.701 .410 .460 9.018 .000 *JOBCCENSQ_b3 (X²) .024 .012 .107 1.918 .056 *INTER_b4 (XY) -.060 .026 -.098 -2.261 .024 *PONCENSQ_b5 Y²) .063 .022 .145 2.877 .004
a. Dependent Variable: MOTIV
*Predictor variables in the polynomial regression model namely, as listed from the top, X, Y, quadratic X
(X2), product/interaction (XY) and quadratic Y (Y2)101.
It is evident from Table 5.141 above that most of the b-coefficients were significant (p<.05).
Four of the five effects statistically significantly (p<.05) explained unique variance in
101 These ingredients form part of the second-order polynomial regression model
Stellenbosch University https://scholar.sun.ac.za

295
motivation to pursue the routes to psychological ownership (Z). The only exception was
X². It was therefore assumed that the a-values will also be significant102. Values from Table
5.141 above, as well as Table 5.142 below, were used to create the response surface
pattern, using the Cunningham Excel Macro (Shanock et al. 2010).
Interpreting the fit by specifying the model and inspecting significance
The overarching substantive research hypothesis (Hypothesis 19) that the salient needs-
job characteristics motivation to pursue the routes to psychological ownership structural
model (depicted in Figure 5.16) provided an accurate explanation of the psychological
processes that underpin the level of motivation to pursue the routes towards psychological
ownership was tested by testing the null hypothesis:
HO19: P=0103
Ha19: P>0
Hypothesis 19 was tested by inspecting the significance of the multiple correlation. It is
evident from Table 5.142 and Table 5.143 below that the R value (.644) is statistically
significant (p<.05). Therefore the null hypothesis HO19: P=0 had to be rejected. This implies
that the fitted observed score second-order polynomial regression model statistically
significantly (p<.05) explained variance in levels of motivation to pursue the routes towards
psychological ownership. The proportion of variance in motivation to pursue the routes
explained by the weighted linear composites of the five effects within the narrow focused
structural model is represented by R2. The R2 value (.415) shown in Table 5.142 below
indicated that the narrow focused structural model explained 41.5% of variance in the
motivation to pursue the routes.
Table 5.142
Regression Output: Model Summary
Model R R Square Adjusted R Square Std. Error of the Estimate
1 .644a .415 .405 59.81799 a. Predictors: (Constant), PONCENSQ_b5, JOBCCENSQ_b3, INTER_b4, PONCEN_b2, JOBCCEN_b1
102 This is done with a certain degree of trepidation as the rationalisation behind this process/reasoning/conclusion requires investigation. Further information is required surrounding the motivation for such assumptions and the complexity of the relationship between the b-coefficients and a-values. Questions surrounding further use of the b-coefficients are cautiously raised however as this is a new area and some reflection may be needed here to determine the usefulness of interpreting the b-coefficients. 103 represents the Greek capital letter R (rho)
Stellenbosch University https://scholar.sun.ac.za

296
Table 5.143
Regression Output: Anovaa
Model Sum of Squares df Mean Square F Sig.
1 Regression 818308.140 5 163661.628 45.739 .000b Residual 1155755.847 323 3578.191
Total 1974063.988 328 a. Dependent Variable: MOTIV b. Predictors: (Constant), PONCENSQ_b5, JOBCCENSQ_b3, INTER_b4, PONCEN_b2, JOBCCEN_b1
At first sight this finding did not seem satisfactory, however it must be noted here that this
interaction has been extracted from a greater, more complex, model and thus 41.5% can
be deemed as quit a satisfactory percentage in terms of the explanation of variance by
this narrow focused model. It might even have been somewhat over-ambitious to have
expected that congruence between root need salience and the ability of the job to satisfy
these needs as represented by this model could explain a large percentage of variance in
motivation to pursue the routes towards psychological ownership.
Creating and interpreting the response surface test values and graph
In order to determine the influence of congruence and incongruence in the two predictor
or exogenous variables (salience of the individual psychological ownership needs and the
ability of the job characteristics to satisfy salient individual psychological ownership needs)
on the outcome or endogenous variable (motivation to pursue the routes towards
psychological ownership) the response surface was created and examined.
Rather than using the bi coefficients directly in the analysis, a Cunningham Excel Macro
was used to convert them by calculating four response surface test values (a1, a2, a3, a4).
Once created, there are four characteristics of the response surface that are of particular
importance and that are described by these four response surface test values namely:
• The slope (either positive or negative) of the response surface as one moves
along the line of congruence from extreme - -104 congruence to extreme + +
congruence described by a1 [b1 + b2],
• The curvature (either concave or convex) of the response surface as one moves
along the line of congruence from extreme - - congruence to extreme + +
congruence as described by a2 [b3 + b4 + b5],
104 The first sign refers to the standardised (0, 1) X and the second sign to the standardised (0, 1) Y
Stellenbosch University https://scholar.sun.ac.za

297
• The slope (positive or negative) of the response surface as one moves along the
line of incongruence from extreme - + incongruence to extreme + - incongruence
as described by a3 [b1 – b2]; and
• The curvature (either concave or convex) of the response surface as one moves
along the line of incongruence from extreme - + incongruence to extreme + -
incongruence as described by a4 [b3 – b4 + b5].
These characteristics allowed for the examination of the manner in which the outcome
variable (Z) responded as the exogenous variables moved along both the line of
congruence and incongruence. This therefore allowed for a description of the manner in
which motivation to pursue the routes towards psychological ownership responded as the
salient individual psychological ownership needs and the ability of the job characteristics
to satisfy the individual psychological ownership root needs moved along the line of
incongruence as well as the line of congruence. This will now be discussed below using
Table 5.144, which displays the above mentioned response surface values coupled with
an evaluation of their statistical significance.
Table 5.144
Statistical Significance of the Calculated Response Surface Test Values
Effect Coefficient Standard
Error Test
Stat (t) p-value
a1: Slope along x = y (as related to Z) 6.52 0.46 14.198 0.000 Sig!
a2: Curvature on x = y (as related to Z) 0.03 0.04 0.764 0.445
a3: Slope along x = -y (as related to Z) -0.88 0.58 -1.510 0.132
a4: Curvature on x = -y (as related to Z) 0.15 0.04 3.648 0.000 Sig!
Where X represents the ability of the job characteristics to meet the individual psychological ownership needs, Y represents the
salience of the individual psychological ownership needs and Z represents the motivation to pursue the routes towards
psychological ownership.
When looking at the effect of the nature and the direction of congruence and incongruence
between the salience of individual psychological ownership root needs and the ability of
job characteristics to meet these needs on the motivation to pursue the routes towards
psychological ownership the statistically significant positive a1 (p<.05) (gradient or slope)
indicated that in general there is a positive trend or change in Z as we move along the line
of congruence (X=Y) from - - to + +. Therefore, motivation to pursue the routes towards
psychological ownership increases along the line of congruence as congruence moves
from low salient psychological ownership needs and low ability of the job characteristics
to satisfy these salient psychological ownership needs towards high salient psychological
ownership needs and high ability of the job characteristics to satisfy these salient
Stellenbosch University https://scholar.sun.ac.za

298
psychological ownership needs. Therefore, H07a: a1=0 was rejected due to the fact that
the conditional probability associated with the sample a1 estimate under H07a was
sufficiently small.
Furthermore, it can additionally be concluded that there is a linear relationship between
the outcome variable Z and the position of observations on the line of congruence, since
the sample a1 (slope) estimates were significant, as well as positive, and the sample a2
(curvature) estimates were statistically insignificant (p>.05). Consequently, hypothesis
H07b: a2=0 was not rejected indicating a lack of support for the hypothesised convex
relationship between the predictor interaction and outcome variable. Should the results
have indicated a statistically significant a2 the response surface along this line would have
been curvilinear. However, the statistically insignificant a2 (p>.05) indicated that this
change of the response surface along the line of congruence was linear. It can therefore
be concluded that the motivation to pursue the routes towards psychological ownership
(outcome/Y) increases linearly as the salient individual psychological ownership root
needs and the ability of the job characteristics to satisfy salient root need values increases
along the line of congruence (- - to + +).
The positive and statistically significant a4 (couple with the statistically insignificant a3) and
subsequent rejection of H08b: a4=0 but failure to reject H08a: a3=0) implied that the outcome
variable Z changed convexly as the predictor variables moved along the line of
incongruence from - + to + -. Therefore, the motivation to pursue the routes towards
psychological ownership increased non-linearly as the discrepancy between the salience
of the individual psychological ownership root needs and the ability of the job
characteristics to meet these salient root needs increased along the line of incongruence
outward from 0 0. In other words, as the discrepancy between the two predictors moved
further away from the centre of the graph along the line of incongruence the outcome
variable changes convexly.
Taken in conjunction with the statistically insignificant a3 estimate the positive and
statistically significant a4 estimate implied that the lips of the convex surface at the two
extremes of the line of incongruence do not differ significantly in terms of height. The
conclusions on both H08a and H08b were not in line with the proposed substantive
hypotheses on the manner in which motivation to pursue the route to psychological
ownership responds to incongruence in job characteristics and the salience of the
psychological ownership needs. In terms of the two substantive hypotheses in question
Stellenbosch University https://scholar.sun.ac.za

299
H08a should have been rejected and H08b should not have been rejected. Despite the fact
that the results were contrary to that which had been expected in terms of the substantive
hypothesis H08b: a4=0 could still be rejected because Ha8b was formulated as a non-
directional alternative hypothesis.
Figure 5.19 below provides a visual representation of this interpretation.
Figure 5.19. Response Surface Graph
Where X represents the individuals salient psychological ownership root needs, Y represents the ability of the job characteristics
to satisfy salient root needs and Z represents the motivation to pursue the routes towards psychological ownership.
The above statistical interpretations are to some degree reflected in the response surface
graph depicted in Figure 5.19 above. It is clearly evident that along the line of congruence,
motivation to pursue the routes towards psychological ownership (Z) increased from low
Stellenbosch University https://scholar.sun.ac.za

300
salient individual psychological ownership root needs (X) and low ability of the job
characteristics to satisfy salient root needs (Y) to high salient individual psychological
ownership root needs (X) and high ability of the job characteristics to satisfy salient root
needs (Y) (i.e. increased from - - to + + congruence). This linear trend is also apparent
when visually inspecting the change in the response surface moving from the right front (-
-) corner to the left back (+ +) corner of the congruence-incongruence response space.
The convex nature of the relationship along the line of incongruence is upon initial
inspection, difficult to detect. However, the significant but small a4 value provides evidence
that indicates a modest convex response surface along the line of incongruence. If,
however, the colour codes are taken into account it does become apparent that with
movement along the line of incongruence from the lower left (- +) corner to the back right
(+ -) corner the response surface changes from blue to purple to green and back to purple
but not quite back into blue (suggesting a negative, albeit not statistically significant,
slope).
5.12 SUMMARY
This chapter outlined the results of the statistical analysis conducted to determine if the
proposed psychological ownership structural model provided a plausible and permissible
(i.e. valid) description of the psychological mechanism that regulates differences in the
level of psychological ownership of employees that could be generalised to the sampling
population. Circumstance necessitated the deletion of observed variables from the model,
which unavoidably necessitated concomitant modifications to the original psychological
ownership structural model. This in turn lead to the creation of an additional, not originally
anticipated, narrow-focused structural model.
Chapter 6 will discuss the findings of the study in more detail and elaborate on aspects
such as the limitations of this study and recommendations in terms of future research
opportunities and workplace implications of these results.
Stellenbosch University https://scholar.sun.ac.za

301
CHAPTER 6
CONCLUSIONS, RECOMMENDATIONS, IMPLICATIONS AND SUGGESTIONS FOR
FUTURE RESEARCH
6.1 INTRODUCTION
The level of psychological ownership that employees experience towards their jobs is not
the outcome of a random event. Rather it is complexly determined by an extensive and
richly interconnected nomological network of latent variables characterising the employee
and his/her work environment. The current study had as its objective to identify at least
some of the influential latent variables and the manner in which they structurally combine
to affect psychological ownership. The motivation behind understanding the psychological
mechanism that underpins levels of psychological ownership within working man pertains
to its practical use within the context of workplace improvement. By gaining a valid
understanding pertaining to the determinants of the construct of psychological ownership,
and the manner in which they structurally combine in the nomological network, HR can
begin to implement relevant interventions to enhance the level of psychological ownership
experienced by employees. These interventions will, however, only be as effective as our
own level of understanding of the psychological mechanism that influences the feelings of
ownership that employees experience for their job specifically.
In the preceding chapters an attempt was made to answer the research initiating question
outlined in Chapter 1 namely; why variance in psychological ownership exists across
employees, jobs and organisations. The theorising, conducted in Chapter 2, lead to the
construction of a proposed explanatory psychological ownership structural model as a
tentative answer to the above posed question for job-based psychological ownership
specifically. This explanatory structural model was then empirically tested in Chapter 5,
using statistical as well as ethical best practises outlined in Chapters 3 and 4 respectively.
The preceding work was undertaken in order to meet the research study objectives in
terms of developing and empirically testing an explanatory psychological ownership
structural model that provides a valid description of the psychological mechanism that
regulates the level of job-based psychological ownership that employees experience.
This final chapter of the research study will provide a discussion surrounding the
subsequent evaluation of the measurement and structural models as well as the response
surface analysis and subsequent implications of this research from an applied and
theoretical sense.
Stellenbosch University https://scholar.sun.ac.za

302
6.2 RESULTS
This section outlines a discussion pertaining to the statistical results presented in Chapter
5. An overall evaluation of both the measurement and structural models are presented
alongside the required modification rationale. This culminates in the presentation of a
newly modified psychological ownership structural model and a brief discussion pertaining
to some insights gained from the data.
Evaluation of the psychological ownership measurement model
The process of evaluating the measurement model was undertaken to determine the
validity and reliability of the measures used to operationalise the latent variables. The
aim was to determine whether the measures used to represent the latent variables of
interest could be trusted. This was a critical first step in the evaluation of the model as a
whole since untrustworthy indicators would diminish our faith in the investigation of the
substantive relationships of interest within the proposed psychological ownership
strutural model.
Post data screening, via item and dimensionality analysis, the original psychological
ownership model was evaluated. This model ran successfully and a finding of close fit
was found. However, the model was unfortunatley plagued with inadmissable parameter
estimates. These values related specifically to the indicators of the polynomial latent
variables. Therefore, as discussed, after much troubleshooting and problem-solving,
attempting various statistical procedures to navigate this issue, these observed variables
and the associated latent variables were unfortunately deleted from the model. This lead
to the development of a reduced psychological ownership model.
This change had unavoidable implications for the analysis of the impact of the interaction
between the salient individual psychological ownership root needs and the ability of the
job characteristics to satisfy these needs, and this influence on motivation to pursue the
routes towards psychological ownership (the polynomial regression with response
surface analysis). These will be discussed in more detail in Section 6.2.3.
After rejecting the null hypothesis in favour of the alternative close fit hypothesis and
examining several statistical outputs it was determined that the reduced psychological
ownership measurement model fitted very well. Various goodness of fit indices were
used to establish this. These findings were additionally further substantiated by the
Stellenbosch University https://scholar.sun.ac.za

303
measurement model standardised residuals, modification indices and squared multiple
correlations.
Several questions were asked in determining the final conclusion surrounding the
success with which the latent variables comprising the reduced psychological ownership
structural model had been operationalised, namely, did the measurement model fit the
data reasonably well, were the standardised factor loadings large and statistically
significant, were the measurement error variance terms in the completely standardised
solution small and significant and were the R2 indices large? The answer to all of the
above posed questions was yes, pointing to the conclusion that the reduced
psychological ownership structural model had been successfully operationalised. It was
therefore possible to interpret the fit of the psychological ownership structural model.
Evaluation of the psychological ownership structural model
In order to determine if the relationships, identified through theorising in Chapter two,
were supported by the data, the reduced structural model was evaluated. The adaptation
of the measurement model necessitated the deletion of γ23 γ24 γ25 and therefore the
formation of a reduced psychological ownership structural model.
The reduced psychological ownership model obtained reasonable fit but was similarly
plagued with an inadmissible parameter estimate in that the completely standardised
structural error variance estimate for 3 returned an inadmissible value (33=1.219.).
Further interpretation was halted and the path between intimate knowledge (4) and self-
investment (3) was deleted. This subsequent modified psychological ownership
structural model, as presented below in Figure 6.1, was fitted. Conclusions surrounding
the fit of the structural model were again based on a basket of evidence.
The goodness of fit statistics were considered as well as the statistical significance and
magnitude of the structural model parameter estimates, squared multiple correlations for
the endogenous latent variables and the modification indices for and B.
Stellenbosch University https://scholar.sun.ac.za

304
Figure 6.1. The Final Modified Psychological Ownership Structural Model
Psychological
ownership
η1
Job
characteristics
ξ1
Motivation
to pursue
η2
Intimate
knowledge
η4
β53
Control of
the job
η5
Intimate
knowledge
η4
Self-
investment
η3
Salient needs
ξ2
β13
β15
β14
β43
β45
β32 γ21
γ22 β53
β53
β21
ζ1
ζ3
ζ5
ζ4
ζ2
Psychological
safety *
Motivation
ξ6 γ36
Stellenbosch University https://scholar.sun.ac.za
Stellenbosch University https://scholar.sun.ac.za

305
As is evident from Figure 6.1 above this modified psychological ownership structural
model consisted of 11 paths instead of the initially hypothesised 16 paths. The modified
psychological ownership structural model showed reasonable to good fit according to the
goodness of fit statistics (RMSEA: .0595, p-value of close fit: 0.0602). The finding of
reasonable fit was corroborated by the Q-plot and stem-and-leaf in that the data points
swivelled away from the 45 degree line, specifically at the upper and lower regions and
the stem-and-leaf indicated a model that was positively skewed. This therefore implied the
potential of an underestimated covariance matrix. The conclusion of reasonable fit was
further corroborated by the standardised residuals in that 26 were large (24 of which were
large positive, pointing to the need to add more paths). Furthermore, 67% of the additional
paths, suggested between the endogenous variables within the modified psychological
ownership structural model, if set free, would improve model fit. This is a rather high
percentage, again supporting the assumption of a merely reasonably fitting model.
Upon examining the parameter estimates (beta and gamma matrices), to determine
whether the data supported the relationships hypothesised in Chapter 2, it was evident
that all of the paths were statistically significant (p<.05) except for the feedback path
between psychological ownership and the motivation to pursue the routes and the path
between the interaction of psychological safety and motivation and self-investment. This
meant that Ho1b could be rejected in favour of Ha1b, and similarly of the original
hypothesised relationships H02, H03, H09, H011, H012, H013, H014, H015, and H016, could be
rejected in favour of Ha2, Ha3, Ha9, Ha11, Ha12, Ha13, Ha14, Ha15, and Ha16. However, H010
and H018 could not be rejected.
From these findings it can therefore be suggested that evidence was found to support
relationships between job characteristics and motivation to pursue the routes, individual
psychological ownership needs and motivation to pursue the routes, motivation to pursue
the routes and self-investment, self-investment and control, and between control and
intimate knowledge as well as between the three routes towards psychological ownership,
namely taking control, gaining intimate knowledge and self-investment, and psychological
ownership. However, evidence to support the relationship between psychological safety *
motivation to pursue the routes towards psychological ownership and self-investment, as
well as psychological ownership and motivation to pursue the routes was not found.
It was somewhat disappointing that support for the path between psychological safety *
motivation to pursue the routes and self-investment was not found. A seemingly well
thought-out theoretical argument for the positive influence of this interaction on an
Stellenbosch University https://scholar.sun.ac.za

306
individual’s level of self-investment was argued in Chapter two. It was argued that
investment of the self requires an element of vulnerability or exposing of the self within the
job and according to Kahn this investment, which was likened to personal employee
engagement within this research study, would be positively influenced by a certain level
of psychological safety. It was argued that an employee that experiences a level of
psychological safety would be more willing to invest him or herself in the job role and
therefore would be willing to enact his/her motivation to pursue the routes towards
psychological ownership if psychological safety was experienced. It was therefore argued
that a high motivation to pursue the routes towards psychological ownership should result
in the investment of the self in the job provided doing so is experienced as psychologically
safe. Therefore it was argued that perceived psychological safety would moderate the
effect of motivation to pursue the routes, on the extent to which the employee invests the
self in the job.
This argument was however not supported by the data. Upon further consideration, deep
reflection and investigating the motivational model presented in Chapter 2 it became
apparent that perhaps it could be suggested that the relationship between the motivation
to pursue the routes and psychological safety might be more of a direct relationship as
opposed to a moderator, as initially suggested. This will be discussed further in Section
6.4.1.
The hypothesised path between psychological ownership and motivation to pursue the
routes towards psychological ownership was additionally not supported by the data. In
Chapter 2 it was argued that an employee, after experiencing levels of psychological
ownership towards a job will feel further motivated to invest more of the self, take further
control and gain even more knowledge about the target. This hypothesis was not
supported by the data and after some careful consideration the researcher concurs and
believes that the experience of motivation to pursue the routes post experiencing feelings
of ownership may differ depending on the root need that was “activated initially”. Moreover,
the researcher believes that perhaps the experience of feelings of ownership could in turn
have the opposite effect on the motivation to pursue the routes towards psychological
ownership temporarily and that perhaps a state of maintenance is reached whereby the
employee nurtures the current state and feels less inclined (motivated) to invest the self
or gain intimate knowledge and take control until another need is activated and the
motivation to pursue the routes is again followed. It is conceded though that this line of
reasoning points to a negative relationship between psychological ownership and
Stellenbosch University https://scholar.sun.ac.za

307
motivation to pursue the routes which was also not borne out by the 21 estimate. The
complexity of the multidimensional constructs within this proposed structural model,
specifically the roots or individual psychological ownership needs and the motivation to
pursue the routes calls for further investigation into these variables.
It was evident that the model was reasonably successful in its attempt to explain variance
in levels of psychological ownership, the prime variable under study, in that 48% of the
variance in feelings of ownership was explained by the modified psychological ownership
structural model. However, 52% was still explained by latent effects that were not
recognised by the model. This highlights the need for further research to elaborate the
current model and provide more satisfying answers.
Before concluding this evaluation of the psychological ownership structural model there
are two important points that should be stressed in order to aid in future research studies.
Firstly, the hypothesised paths within the psychological ownership structural model should
be treated as partial regression coefficients. By combining several hypothesised paths in
a single complex model it is implied that the influence of one exogenous, or endogenous
variable, on another variable within the model occurs when the variance in the remaining
latent variables linked to it are controlled for. The insignificant 21 estimate therefore
should not be interpreted to mean that psychological ownership does not statistically
significantly explain variance in motivation to pursue the routes to psychological
ownership. It means that psychological ownership does not statistically significantly
explain unique variance in motivation to pursue the routes to psychological ownership that
is not explained by the perceived ability of the job to satisfy the root needs and by the
salience of the root needs. In order for future research studies to be comparable this must
be kept in mind. Secondly, it must be noted that the model only obtained reasonable fit,
therefore the subsequent discussion pertaining to the implications within the workplace
has been made with some circumspection.
Evaluation of the response surface analyses
The initial modification (reduction) of the proposed psychological ownership structural
model (the deletion of the observed and latent variables pertaining to the polynomial
regression analysis) necessitated the development of a narrow-focused structural model
in order to investigate the complex interaction between two endogenous variables and this
interaction’s subsequent effect on a single exogenous latent variable namely the
Stellenbosch University https://scholar.sun.ac.za
308
motivation to pursue the routes towards psychological ownership. The subsequent
response surface was created to determine the reaction of the motivation to pursue the
routes to the interaction between an individual’s salient needs and the ability of the job
characteristics to satisfy these salient needs.
In order to determine this response, and to evaluate the hypotheses developed pertaining
to this response, the response surface test values were analysed to determine the slope
and curvature of the response surface in the three dimensional congruence/incongruence
space.
Upon inspection of the response surface test values a significant and positive a1 and
insignificant a2 was found. H07a: a1 = 0 was therefore rejected in favour of the alternative
hypothesis Ha7a: a1 > 0 due to the fact that the observed sample a1 value unlikely would
have been obtained under H07. Support was therefore obtained for the hypothesis that
motivation to pursue the routes towards psychological ownership increases as one moves
along the line of congruence from - - to + +. Hypothesis H07b: a2 = 0 was not rejected
indicating a lack of support for the hypothesised convex relationship between the predictor
interaction and outcome variable. It can therefore be concluded that if an individual’s
psychological ownership root needs are satisfied by characteristics of the job, motivation
to pursue the routes towards psychological ownership will increase linearly.
When examining the response surface test values further is was evident that H08b a4 = 0
should be rejected. The positive and statistically significant a4 (coupled with the statistically
insignificant a3, and subsequent non rejection of H08a: a3 = 0) implies that the outcome
variable changes convexly as the predictor variables move along the line of incongruence.
The height of the convex response surface however does not significantly differ under the
two extreme forms of incongruence. H08b a4 = 0 was rejected.
From the above it can therefore be concluded that motivation to pursue the routes towards
psychological ownership will increase linearly as congruence moves from - - to ++. Not
unsurprisingly, the optimal conditions for employees to experience increased motivation
to pursue the routes (and possibly by extension increased levels of psychological
ownership) is therefore when the psychological ownership root needs are highly salient
and the job characteristics allow the satisfaction of the root needs. The convex response
surface along the line of incongruence indicates that there is a dip towards the middle of
the line of incongruence, however, the level of motivation to pursue the routes at the edges
of the convex cup, under the two extreme forms of incongruence, do not differ significantly
Stellenbosch University https://scholar.sun.ac.za

309
(p>.05). It is therefore not permissible to claim that a scenario where the job offers the
opportunity to satisfy the root needs but where employees do not experience the root
needs as salient is somewhat more conducive to motivating the employee to pursue the
routes to psychological ownership than the opposite scenario even though the sample
response surface and the sample response surface test value estimates would suggest
this (a3=-0.88).
6.3 LIMITATIONS TO THE STUDY
Several limitations were highlighted throughout the research study, however they will
briefly be outlined and discussed here. The limitations began from the commencement of
theorising in Chapter two. The fact that the psychological ownership root needs, as well
as the job characteristics were conceptualised as multidimensional constructs but
nonetheless employed as single latent variables in the proposed psychological ownership
model posed certain limitations on the analysis and interpretation of these complex
variables. Here, the combined effect of the psychological ownership needs and the job
characteristics were taken into account and the actual complexity of the influence of the
individual latent dimensions that make up these multidimensional latent variables was
somewhat lost. Therefore, it cannot be said with any degree of certainty which roots or job
characteristics influenced the motivation to pursue the route to psychological ownership
and how this influence comes to fruition. Therefore, it is the researcher’s opinion that a
certain degree of meaning was lost by combining these variables into multidimensional
variables.
An additional limitation that unfortunately fell outside of the control of the researcher, but
that plagues many academic research studies, was the sample size. Although the sample
size seemed to meet the minimum criteria outlined in Chapter three105, namely a sample
size of between 300 and 350, it only narrowly complied (329). Furthermore, insufficient
sample size necessitated the use of an alternative parcelling/indicator procedure that was
less than desirable. It is hoped that future studies will be able to obtain larger samples so
as to ensure more stable and precise parameter estimates.
An additional limitation, in terms of the sampling, was the use of a convenience sample in
the form of an email to the researchers’ contacts on LinkedIn. This convenience sample
105 And with the deletion of several paths within the model the sample size is possibly more than adequate.
Stellenbosch University https://scholar.sun.ac.za

310
potentially lacked the diversity required to properly represent the South African workforce.
Therefore, generalisations to the South African workplace population as a whole should
be made suggestively and with some circumspection.
Several limitations pertain to the modifications made to the psychological ownership
model and the creation of an additional narrow focused model. By assessing the narrow
focused structural model separately, as opposed to within the psychological ownership
model as a whole, a certain degree of meaning is lost and the complexity of the
interrelationships within the model as a whole are not fully interpretable. An additional
modification was the deletion of the interrelationship between intimate knowledge and self-
investment due to inadmissible parameter estimates.
A final limitation relates to the polynomial regression analysis and response surface
analyses, specifically the lack of full coverage of the response surface. This lack of
coverage necessitates caution when drawing conclusions since areas of the graph would
be “drawn on extensive extrapolation of trends that was observed in more populated areas
of the floor of the response surface space” (Van Deventer, 2015, p. 271).
6.4 RECOMMENDATIONS FOR FUTURE RESEARCH
“It is in fact a great virtue of a good model that it does suggest further questions, taking us
beyond the phenomenon from which we began, and tempts us to formulate hypotheses
which turn out to be experimentally fertile…Certainly it is this suggestiveness, and
systematic deployment, that makes a good model something more than a simple
metaphor106” (Black, 1962, p. 239).
A danger when investigating complex phenomenon, with multiple potential influences, is
to accept the first and most obvious interpretation of any established relation. However, it
is also similarly as dangerous to embark upon a fishing expedition without the foundation
of sound theory in an attempt to make a model fit well. It was evident when interpreting
the structural model that not only were additional paths recommended by the data, but
some paths were suggested for deletion (they were found to be insignificant).
106 It is acknowledged that Black (1962) uses the term model in a different sense than the current study does when referring to a structural model. For Black (1962) a model refers to an “as if”, analogue representation that is permissible because of sufficient isomorphism between the model and that which is been modelled. In the current study the term model is, however, used to refer to a representation of the psychological mechanism that regulates the level of psychological ownership that employees experience. Black’s (1962) comments on the fertility of a model to generate further hypotheses also applies to the current study.
Stellenbosch University https://scholar.sun.ac.za

311
This therefore allowed for the opportunity to provide theoretical evidence to substantiate
relevant suggestions for future research efforts. The researcher is of the opinion that
empirically testing a proposed model should not culminate in the testing and re-testing of
several different models in order to obtain a model that fits best. It seems prudent to rather
expose suggested modifications, whether they be data driven in terms of the modification
indices or due to the finding of insignificance or theory driven in light of the current findings,
to new data.
It is with this in mind that the following suggestions for future research have been
developed from both a data driven and theoretical point of view.
Suggested additional paths - data driven perspective
The complexity of social phenomena and the challenging task of a researcher to decipher
meaning from the interplay of several latent variables within a model is confirmed by the
suggestion of additional paths within the psychological ownership model. More
specifically, an additional six paths were suggested between the endogenous variables
within the modified psychological ownership structural model by the modification indices
calculated for B, namely paths in which107:
- Psychological ownership affects self investment (278.955),
- Self investment affects motivation to pursue the routes towards psychological
ownership (70.924),
- Motivation to pursue the routes affects control (47.376),
- Control affects self investment (24.928),
- Motivation to pursue the routes affects psychological ownership (14.115); and
- Intimate knowledge affects self investment (9.078).
Furthermore, an additional four paths were identified between the exogenous and
endogenous variables by the modification indices calculated for within the model,
namely paths in which108:
- Job characteristics affects control (81.227),
- Job characteristics affects self investment (55.120),
107 The values in brackets refer to the modification indices calculated for B. 108 The values in brackets refer to the modification indices calculated for .
Stellenbosch University https://scholar.sun.ac.za

312
- Psychological safety x motivation interaction affects motivation to pursue the
routes towards psychological ownership (8.210); and
- Job characteristics affects intimate knowledge (7.169).
When using modification indices to guide the addition of paths for future research, it was
important that each suggested path be considered one by one, starting from the largest
modification index value across and B (Hooper et al. 2008). Furthermore, three aspects
were additionally considered to determine whether or not to allow the data to dictate model
changes that should in turn be tested using different data. Firstly, whether the proposed
structural path made substantive theoretical sense. If so, whether the sign of the expected
change dovetailed with the theoretical argument offered in support of the path. If so, was
the magnitude of the standardised expected change sufficiently large to justify the addition
of the path. If the proposed path with the highest modification index value failed any one
of these three criteria the proposed path with the next highest modification index value
was evaluated.
The first path considered was therefore the suggested path from psychological ownership
to self-investment. This path upon initial investigation seemed to make substantive
theoretical sense. As argued in Chapter two, an individual who experiences feelings of
ownership towards a target will care for that target. This act of caring would involve a level
of self-investment. For example, when an individual buys photographic equipment he or
she will tend to, and care for, this equipment by making sure it is cleaned regularly, placed
in protective gear and not ill-treated. He or she will make use of the protective strap when
taking photographs in order to maintain this possession in pristine condition. All of these
acts involve a certain level of self-investment by the owner of the photographic equipment.
It therefore seems reasonable, if we apply the same thinking or rationale to a workplace
situation, to suggest that if an employee experiences feelings of ownership towards a job
that the employee will tend and care for the job and therefore invest of him or herself to
take this care. Therefore, it is argued that this suggested path does make theoretical
sense. However, the sign does not dovetail this hypothesised argument. The researcher
would have hypothesised this link to be positive in nature, however the findings were that
this relationship would be negative. It is acknowledged here that perhaps once an
individual has experienced a certain level of psychological ownership that he or she may
Stellenbosch University https://scholar.sun.ac.za
313
well decrease the investment of the self109. However, the researcher is of the opinion that
the former argument makes better sense and this suggests that this path does not meet
the second criterion. It is therefore proposed that this path not be explored further until
additional theoretical evidence is provided to substantiate this negative relationship
between psychological ownership and self investment (and if it is again proposed via
significant modification index values in subsequent studies).
The remaining suggested paths, except for one other110, did not make theoretical sense
to the researcher, within the context of psychological ownership theory. However, it is
acknowledged that outside of the context of psychological ownership theory certain links
hypothesised as indirect could potentially be direct. However, it is important to bear in
mind that this proposed explanatory model provides a glimpse of a tentative answer and
as mentioned within social phenomenon this glimpse is far more complex than can be
captured within a single model.
The suggested (feedback) path between self-investment and motivation to pursue the
routes towards psychological ownership did not make sufficient substantive theoretical
sense to suggest the freeing of this path. In terms of the original theorising the motivation
to engage in the investment of the self, as a route towards psychological ownership,
should occur first, after the assessment that the job via its characteristics would allow the
satisfaction of the individual psychological ownership root needs if the act of
psychologically “purchasing the job” would be embarked on, before an individual will
actually pursue the routes, which then should lead to feelings of ownership. The motivation
to pursue the routes have been shown in the current study to be affected by the job
characteristics (i.e., the ability of the job to satisfy the root needs) and the salience of the
root needs. The statistically significant modification index associated with path from self-
investment to motivation to pursue the routes towards psychological ownership implies
that self-investment would explain unique variance in motivation to pursue the routes that
109 This argument points to the relevance of longitudinal models in industrial psychology research. Since the
hypotheses describes mechanisms operating over time, the risk of failing to capture the full complexity of these mechanisms, when using a cross sectional design, is evident. 110 This path is the suggested path between psychological safety and motivation – this will be covered under this section as the rational and thinking was prompted by the data, although not formally via a statistically significant modification index value (psychological safety as such was not included as a latent variable in the model). It is, however, acknowledged that it could have been discussed under the theoretical perspective too.
Stellenbosch University https://scholar.sun.ac.za

314
is not explained by the two effects currently linked to it. It is therefore not denying the initial
theorising.
The complexity of interactions, specifically those pertaining to the relationships between
the roots, the routes and the motivation to pursue the routes is however acknowledged.
The bi-factor nature of the measurement model pertaining to the routes further
complicates interpretation as there does seem to be a broad, general underlying factor
that influences all the items in the three route subscales.
Feedback loops could additionally be present within the interaction. It is the researcher’s
opinion, however, that feedback from the routes to motivation to pursue the routes would
need to occur through the experience of feelings of ownership first. A direct link from self-
investment to the motivation to pursue the routes would mean that the individual has not
experienced the desired outcome of feelings of ownership towards the target, in this case
the job. The act of self-investment (more generally the act of psychologically “purchasing
the job”) has not as yet paid any dividends. It does not seem to make theoretical sense
for an individual to be more motivated to pursue the routes towards psychological
ownership if he or she has not yet experienced the desired result of psychological
ownership of the target. Unless if perhaps the individuals needs were further activated or
perhaps the individual experiences very high valence for the outcome of feelings of
ownership. It seems reasonable to argue that the feedback loop would be between
psychological ownership and motivation to pursue the routes and not directly from either
of the routes but additionally research attention is needed to this interaction. At the same
time, however, it needs to be acknowledged that the current study did not support the
hypothesised feedback loop from psychological ownership to motivation to pursue the
routes.
Similarly, the suggested paths between job characteristics and the routes namely control,
self-investment and intimate knowledge111 do not make sufficient substantive theoretical
sense to the researcher. This is due to the argument presented in Chapter two pertaining
to the mechanisms through which psychological ownership develops. Pierce and Jussila,
(2011) state that the routes act as paths to the emergence of feelings of ownership and
feelings of ownership will only be initiated via the satisfaction of the individuals root needs.
111 The researchers acknowledges that this modification is the smallest in terms of magnitude and should not be consider in this order. However, it seemed to make logical sense to discuss the three routes simultaneously since the suggested paths did not make substantive theoretical sense. If the paths were to make substantive theoretical sense this would have been the tenth path that would have been considered.
Stellenbosch University https://scholar.sun.ac.za

315
As argued, J. Pierce (personal communication, May 12, 2016) believes “that absent of
one or more aroused motives (roots) psychological ownership is unlikely to develop, as
we do not, for example, come to a sense of ownership for everything that we experience
control over”. Therefore, as argued in Chapter two, it is suggested that “psychological
ownership emerges at the confluence of several factors…In the presence of a target
possessing a certain set of attributes…when one or more of the motives that underpin
psychological ownership (e.g., effectance, home, self-identity) is in an aroused state” (J.
Pierce, personal communication, May 12, 2016), an individual, according to the
researcher, will feel a sense of motivation to pursue the routes towards psychological
ownership and travel “down one or more of the routes” (J. Pierce, personal
communication, May 12, 2016). Therefore, direct paths from the target (job characteristics,
in this case) to the routes, does not make substantive theoretical sense to the researcher
as this would in a sense mean bypassing the psychological mechanism (activation and
satisfaction of the salient psychological ownership needs) underpinning the experience of
feelings of ownership.
It is however acknowledged here that outside of the context of psychological ownership a
direct link from job characteristics to the essence of the routes could make sense in that
the characteristics of the job will allow for, or prohibit, a certain level of route to be reached.
For example, the level of autonomy granted within a job will influence the level of control
and individual can take. However, it is argued here that this process, within the context of
psychological ownership, is conducted through a level of motivation to pursue these routes
via the manner in which the needs-job characteristics interaction is assessed by the
individual and then influenced by the motivation of the employee to follow the routes, post
accessing the autonomy granted within the job. The researcher acknowledges that this is
a rather complex relationship with several multidimensional variables which in future could
be separated to provide a more nuanced view of these particular interactions. It is
therefore suggested that in future research projects these multidimensional variables
should be dealt with separately112.
In terms of the suggested path or relationship between motivation to pursue the routes
and control, this could make theoretical sense. It has been argued that in the context of
this proposed explanatory model that this relationship occurs via an element of self-
112 The researcher however acknowledges that this will have major sample size implications and that within the South African context may be difficult to study.
Stellenbosch University https://scholar.sun.ac.za

316
investment. It was argued in Chapter two that a certain degree of investment of the self
needs to occur in order for an individual to take control of their job and gain intimate
knowledge about the job. For example, taking the time to ask questions about the specific
aspects of the job would be an act of exerting energy and intellect pertaining to the job. It
is therefore suggested that a certain amount of self-investment is involved in taking
control. Therefore, a direct link to control via motivation to pursue the routes as an
alternative to the originally proposed link between motivation to pursue the routes and
control via self-investment seemed unlikely. This is, however not what is suggested by the
modification index in question. What is suggested (along with the suggested path from
control to self-investment) is an additional path through which motivation to pursue the
routes translates into the act of actually psychologically “purchasing the job”. Therefore,
although it does not make substantive theoretical sense to add a direct path between the
variable of motivation to pursue the routes and any other routes, besides self-investment
(which then in turn acts as a mediator to the two remaining routes of intimate knowledge
and taking control of the job) in place of the current pathway, it is not without theoretical
merit to compliment the mechanism with an additional pathway where motivation to pursue
the routes also operates through control to affect psychological ownership and root need
satisfaction. The foregoing argument does not, however, sufficiently convincingly reason
why control specifically should be an additional portal through which motivation to affect
the routes translates into the act of actually psychologically “purchasing the job”.
The same argument applies when considering the suggested path between control and
self-investment. It was argued that a certain degree of self-investment is necessary in
order to take control therefore the act of taking control of one’s job requires a certain
investment of the self first. Therefore, a direct path between control and self-investment
does not make theoretical sense to the researcher. It could however be argued that after
investing of the self within the job and gaining control that an individual may be motivated
to invest in the self further. This is really what the modification index in question suggests.
But again it feels more satisfactory to interpret this as a feedback loop returning to the
motivation to pursue the routes, and specifically the motivation to pursue the route of
control, since the outcome of psychological ownership has not yet been experienced.
Future studies could look at separating the elements of each route motivational factor
within a more complex model to gain further insights into these interactions. This
suggested path additionally failed the second criterion in that the sign does not dovetail
the theoretical argument (a negative expected was associated with this path). On the
Stellenbosch University https://scholar.sun.ac.za

317
other hand though, it could be argued that an individual who experiences a certain level
of control would minimise the self-investment however, again this would then occur without
the individual experiencing the outcome of psychological ownership.
The same thinking applies to a direct link between motivation to pursue the routes and
psychological ownership. It was argued in Chapter two that, according psychological
ownership theory, an individual must first anticipate the satisfaction of salient
psychological ownership needs (root needs), then embark on psychologically “purchasing
the job” by travelling the routes towards psychological ownership by investing of the self
to take control and gain intimate knowledge of the job before experiencing psychological
ownership as a state of root need satisfaction. Therefore, feelings of ownership are only
experienced through these routes or paths. Pierce and Jussila, (2011, p. 78) explain this
process as the “antecedents…influencing the emergence of psychological ownership
working through one or more of the routes”. Therefore a direct link between the motivation
to pursue the routes113 towards psychological ownership and psychological ownership
does not make theoretical sense to the researcher.
A suggested modification which baffled114 the researcher somewhat is the path between
intimate knowledge and self-investment. A theoretical argument was provided for this path
in Chapter two, pertaining to the investment that a gardener makes into a garden and
upon receiving feedback (knowledge), in the form of flourishing/wilting flowers, then
invests further effort and time into maintaining the garden, due to a newly formed deeper
understanding of the garden’s needs. When applied within a working context it seems
reasonable to suggest that upon investing of one’s self into the job and gaining intimate
knowledge about aspects of the job one would in return further invest the self. However,
when this path was tested (in the original Model A), the completely standardised structural
error variance estimate for 3 returned an inadmissible value (33=1.219) and the path
between intimate knowledge (4) and self-investment (3) was subsequently removed
from the model. Although the relationship was statistically significant the sign of the
regression slope was in contrast to the nature of the relationship hypothesised under the
113 It must be emphasised here that this form of motivation refers to the motivation to engage in behaviour pertaining to self-investment and taking time and energy to gain control and intimate knowledge. This is not purely motivation to act. It is motivation to act in a specific way (following the routes) that will lead to the emergence of feelings of ownership via the paths. 114 The researcher was surprised to see this suggested modification since the path had to be deleted due to inadmissible parameter estimates. It is comforting that it was re-suggested but then the question remains as to why the inadmissible values were found.
Stellenbosch University https://scholar.sun.ac.za
318
directional alternative hypothesis. This suggested path therefore failed the second
criterion in that the sign did not dovetail with the theoretical argument.
A final suggested modification is the path between the psychological safety x motivation
interaction and motivation to pursue the routes towards psychological ownership. The
suggested path was not considered meaningful given the fact that the psychological safety
x motivation interaction effect means that the effect of motivation to pursue the routes on
another latent variable is moderated by the level of psychological safety. Motivation can,
however, not be modelled to affect itself so as allow psychological safety to moderate that
relationship. Nonetheless, as alluded to in Section 6.2.2, the finding that the initially
hypothesised path between the psychological safety motivation interaction and self-
investment was insignificant was very thought provoking. This lead the researcher to
consider alternative options.
The researcher feels that perhaps a direct path between psychological safety and
motivation to pursue the routes towards psychological ownership makes better
substantive theoretical sense, as opposed to the originally hypothesised psychological
safety x motivation interaction effect on self-investment path. It seems reasonable to argue
that the influence of psychological safety might be more apparent when considered as a
main effect on the motivation to pursue the routes, as opposed to a factor which influences
an individual level of self-investment post feeling motivated to pursue the routes.
The initial interaction argument assumed that the psychological safety appraisal was
stimulated only once the motivation to pursue the routes had been formed, without actually
influencing the motivation to pursue the routes. It, however, would seem more reasonable
to suggest that an employee who feels psychologically safe (or has evaluated a situation
or context as psychologically safe within his or her work environment/job) will experience
maximal strength expectancies. In contrast, an employee who wishes to attach
themselves to a job (by providing ideas or exerting energy to make the job "theirs"), but
fears they may be ridiculed for doing so, might not be as motivated to pursue the routes
towards psychological ownership. It could be considered as a latent variable influencing
the valence of the salient outcomes within the equation for motivation. Appraising the act
of psychologically “purchasing the job” as psychologically unsafe implies that negatively
valenced outcomes are anticipated with non-zero probabilities, if the routes to
psychological ownership would be pursued. It is therefore hypothesised that psychological
safety would influence the action-outcome associations that employees experience, which
would then negatively (or positively) influence the level of motivation experienced to
Stellenbosch University https://scholar.sun.ac.za

319
pursue the routes. Psychological safety could therefore possibly influence, or form part of,
the evaluation process (how an individual evaluates the outcome of pursuing the routes
to psychological ownership) that influences the motivational process.
It is however acknowledged here that this psychological safety effect could differ from
individual to individual as a function of individual characteristics that moderate the effect
of psychological safety on motivation to pursue the routes to psychological ownership.
Should an employee experience very high valence for feelings of ownership towards their
job then they may not deem psychological safety as an important factor (less risk-averse
individuals take risks to own things that they really want, for example). It is therefore
suggested here that this interaction deserves future research attention.
In terms of the deletion of insignificant paths, an important question to ask is whether the
theoretical argument for the inclusion of these paths still holds true. Two path coefficients
were identified as statistically insignificant namely the path coefficient associated with the
path between the psychological safety x motivation to pursue the routes interaction and
self-investment (33) as well as the path coefficient associated with the path between
psychological ownership and motivation to pursue the routes (21).
As discussed, it is suggested that the former path should be aborted and rather replaced
with a direct relation between psychological safety and motivation to pursue the routes
towards psychological ownership. In terms of the latter path, the relationship between
psychological ownership and motivation to pursue the routes it is argued here that the
theoretical argument, presented in Chapter two, still applies. However, a further caveat
may need to be considered. What level of psychological ownership will cause the
motivation to pursue the routes towards psychological ownership to decrease as opposed
to increase? It has been argued that once an individual experiences feelings of ownership
they will be further motivated to tend and care for the target, increasing levels of
psychological ownership. However, at the same time, it seems reasonable to argue that
perhaps should an individual experience very high levels of feelings of ownership or
experience these feelings for an extended period of time, that an individual’s psychological
ownership needs may evolve and that this feedback loop may actually have an inverse
effect. This line of reasoning moreover raises the question whether the feedback should
not impact on the salience of the psychological ownership roots and thus only indirectly
on the motivation to pursue the routes to psychological ownership. It should in addition be
noted that this is not a path that LISREL could have suggested via the modification indices.
Stellenbosch University https://scholar.sun.ac.za

320
However, this argument has not been solidified within the researchers mind and requires
further elaboration and investigation.
Moreover, since the modified psychological ownership structural model did not allow for
the testing of the polynomial regression with response surface analysis it is additionally
suggested that further research could include these aspects within the structural model as
a whole, rather than looking at them separately in a narrow focused model. Further
polynomial regression could also be conducted to determine the effect of the congruence
between the profile of root needs and the ability of the job to satisfy these separate root
needs on motivation to pursue the routes to psychological ownership. This kind of
evaluation would however require the extension of the polynomial regression model115
(Edwards, 1993) and the drawing and interpreting of three response surfaces.
Additional paths – theoretical perspectives
It is evident that the complexity of the interactions within the nomological network of latent
variables provides broadened scope for future research endeavours in an attempt to
capture the nuanced relationships within a single model. Theoretical proposals, pertaining
to proposed future paths, relating to either the individual employee, the target (or job) and
the organisation as a whole were additionally elicited when the current paths, with new
insights gleaned from the statistical analysis and interpretation, were considered.
As seen from the discussion in Chapter two, psychological ownership is understandably
perceived as a latent variable that is by its very nature a personal experience (between
an owner and a target). According to Hillenbrand and Money (2015) explanations of how
psychological ownership develops at an individual level are inherently more variable and
depend on an individual’s sense-making and self-concept and an individual personal
interpretation of ‘this is me’. Therefore, future research attempts could focus on the nature
of the individual. Emphasis here could shift to focus on an individual level model where
layers of the self, as highlighted by Hillenbrand and Money, are then interpreted in
combination with the employee’s job or the entire organisation. Here the emphasis is on
the individual’s self-identity (personality, race, gender, cultural aspect) and how he or she
115 E[Y|X1i, X
2i] = b
0 + b
1X
11 + b
2X
21 + b
3X
11
2
+ b4X
11X
21 + b
5X
21
2
+ b6X
12 + b
7X
22 + b
8X
1
2
+ b9X
12X
22 + b
10X
22
2
+
b11
X13
+ b12
X23
+ b13
X13
2
+ b14
X13
X23
+ b15
X23
2
Stellenbosch University https://scholar.sun.ac.za

321
sees, understands and knows the self, and how this level of knowing will influence any
attachment to a target, whether it be a job or organisation. This would shift the target of
emphasis to a more intrapersonal, individual, focus.
Another individual level area of interest is the interrelationship between employee
wellbeing and the experience of feelings of ownership. This conjures up several questions
within the researcher’s mind in terms of whether an employee experiencing psychological
distress would attach to a target object or not? Would an individual currently experiencing
burnout have the ability to attach him or herself to a job and experience feelings of
ownership? Would a psychologically well employee experience feelings of ownership
more frequently than an employee that was experiencing wellbeing shortcomings?
Another important consideration at an individual level is whether feelings of ownership are
good or bad for employees. Research could look at aspects such as the resultant “strain”
on individuals with the increased burden of responsibility of attaching oneself to the target
or job and the subsequent exploitation of this by organisations.
Human behaviour does however not occur in isolation, void of any situational factors
(Mischel, 1973). Several authors, for example, Porter, Lawler and Hackman (1975),
Clayton (1981) and Brousseau (1983) have suggested that an individual's reaction to his
or her job may be influenced not only by the properties of the job and the individual’s
needs, but also by the nature of the work context or the organisational "milieu" surrounding
the job. Kahn (1990) additionally points out the importance of psychological experiences
within organisations and the influence of elements of the work context. The focus of this
research study was on the psychological mechanism at work underpinning levels of
psychological ownership and job characteristics, a contextual factor. However, since job-
based psychological ownership occurs within the organisation context, further contextual
factors should additionally be considered when tackling the nomological network
underpinning these feelings of ownership. It is suggested that future research should focus
on the additional contextual or environmental factors influencing levels of psychological
ownership within individuals at work. This could include, but is not limited to, aspects such
as the role of leadership (different leadership styles), organisational culture and climate,
tenure and the like.
Future research endeavours could focus on determining the manner in which
psychological ownership directly and/or indirectly affects important outcome aspects
pertaining to individuals at work including its influence on employee performance, state
Stellenbosch University https://scholar.sun.ac.za

322
engagement, psychological empowerment, job satisfaction, job commitment and how
these feedback onto psychological ownership. Furthermore, and specifically within the
diverse South African organisational landscape, the aspect of Ubuntu, as well as societal
perspectives pertaining to ownership, could be evaluated within the context of
psychological ownership. It is suggested here that an investigation of collective
psychological ownership at a team level would be valuable within the South African
organisational context. According to Pierce and Jussila (2011) a social-identity motive
underpins the presence of collective psychological ownership. Within the South African
context it could be argued that a lack of social-identity or a burdened social identity could
negatively influence the experience or development of feelings of ownership within the
diverse organisational context in South Africa. This could in turn have negative
implications for interventions, if applied within a context where they are destined to fail.
Further research is needed to shed some light on this matter.
As mentioned, this research study investigated the influence of the psychological
ownership root needs, and their subsequent satisfaction, collectively. This was noted as
a potential weakness of this current research study. Future research could therefore
investigate the role of each of the three psychological ownership root needs, namely the
need for belonging, the need for self-identity and the need for efficacy and effectance,
individually, in order to determine their influence on motivation to pursue the routs to
psychological ownership and eventually the levels of psychological ownership.
Another area which could potentially require further clarification, specifically pertaining to
the root needs, is the definition of the root need of efficacy and effectance and a
clarification of the use of these two terms. It could be argued that one (efficacy) could
potentially be considered as an outcome of the other (effectance). According to J. Pierce
(personal communication, May 10, 2016) the motivation to effect outcomes, to make
things happen, to experience oneself as competent; is pleasure producing. It leads to
experiencing personal efficacy. As such, efficacy is a resulting condition, stemming from
one’s ability to interact effectively with one’s environment. But this requires further thought
and research to solidify the meaning of these terms within the theory of psychological
ownership.
In terms of deepening the body of knowledge surrounding psychological ownership future
research endevours could focus on the specific underlying psychological mechanisms that
lead to the development and experience of the two different types of psychological
ownership namely preventative and promotion oriented. According to Alok, (2014) and
Stellenbosch University https://scholar.sun.ac.za

323
Dawkins et al. (2017) these two types of psychological ownership are too independent to
be considerd within a single multidimensional construct. It therefore seems prudent to look
at these two types of psychological ownership seperately within future research studies.
Moreover, future research could additionaly focus on the darkside of feelings of
ownership. This is an area that has received very little attention within the literature
(Dawkins et al. 2017), and it would be prudent to have knowledge pertaining to the point
at which feelings of ownership turn bad.
From a personal experience point of view the researcher would like to posit time as an
additional factor that requires future investigation in terms of its influence on the levels of
psychological ownership employee’s experience. It seems reasonable to suggest that as
an employee invests time (this could be seen as an element of self-invest or moderated
by self-investment and could potentially be considered as an additional route towards
feelings of ownership) into their job they will begin to experience feelings of ownership.
Although the researcher acknowledges that there is still much research to be done
pertaining to the topic of psychological ownership within the work context, it is hoped that
this research will expand the research base on psychological ownership and provide
further empirical support for the value of psychological ownership within organisations as
well as its assessment and development in the workplace.
6.5 PRACTICAL IMPLICATIONS
The objective of this research study was to develop and empirically test a proposed
psychological ownership structural model. However, it is important to bear the arguments
presented in Chapter one in mind with regards to the working world and the influence it
has on working man when considering the results. In order to provide employees a context
or environment that allows working man to present his or her true self and flourish, it is
important that the findings from research studies, undertaken to better understand the
complexities of a working environment as well as individual employees, are translated into
practical solutions. A better understanding of working man, and the psychological
mechanisms at play at an individual, group and organisational level will lead to improved,
more successful, interventions that are aimed at improving performance as well as the
working environment for employees. Therefore, the usefulness of research could be
contested should it not provide practical solutions for organisations.
Stellenbosch University https://scholar.sun.ac.za

324
The structural model does not in and of itself provide information pertaining specifically to
the types of interventions that should be introduced within organisational contexts.
However, the results, when applied to the body of research available surrounding
organisational effectiveness, do provide some food for thought and possible intervention
examples. It is with this in mind that the preceding section discusses several practical
implications uncovered via the results of this research study.
The data suggests that in order to influence levels of job-based psychological ownership
organisations could attempt to influence the characteristics of an employee’s job. More
specifically, organisations could attempt to increase levels of autonomy, task variety, and
skill variety, as well as provide employees with more insight pertaining to the level of task
significance and feedback. Organisations can additionally attempt to align individual
psychological ownership needs with specific job characteristics by determining the level
of individual psychological ownership needs experienced by a potential employee before
selection and aligning these with the characteristics of the specific job applied for.
Organisations can also focus on facilitating the process of self-investment, taking control
and gaining intimate knowledge of a job. Although it was not covered within the statistical
analysis it is suggested that an employee’s line manager would have a certain degree of
influence here.
Literature highlights the importance of the job in one’s relationship with an organisation.
Attempts by organisations to influence job characteristics would imply job design or
redesigning of jobs116. According to Strümpfer, (2006) and Tims and Bakker (2010) jobs
that are well designed have positive effects and can lead to improved employee wellness,
and may even bring about thriving, when employees experience growth in the face of
challenges. It therefore seems reasonable to suggest that jobs should be designed in a
way that allows for increased levels of autonomy and task significance. Organisations can
additionally design jobs that allow for increased levels of performance feedback, while
making use of several skills in completing a task or job from beginning to end. Jobs should
therefore be designed so that they are more complex, challenging and stimulating. This
can be done by examining the job characteristics and tailoring these in such a way that
they ignite the needs and motivate employees to invest of themselves in the job as well
116 The researcher is of the opinion that an employee’s involvement in job redesign would have further motivational force than a job design exercise fully undertaken by the organisation alone (top-down). However, it must be acknowledged that since it is individual needs that are satisfied by these job characteristics and that job cannot feasibly be designed for each and every employee individually, that a best case design would need to be considered.
Stellenbosch University https://scholar.sun.ac.za

325
as take control and gain intimate knowledge of the job. It must however be noted that
further empirical research is required to determine the specific job characteristics that
should be developed or designed into a job to have the most pronounced influence on
levels of psychological ownership (and avoid the dark side of psychological ownership).
Proper understanding pertaining to the individual job characteristics and their interactions
with the individual psychological ownership needs is therefore a vital first step before jobs
are redesigned.
A question organisations should ask themselves, however, is how much of this design
should occur pre-hiring an employee (job design) for the job or post hiring (job redesign)
an individual. It is suggested that answers to this question would have further implications
for the level of psychological ownership experienced by an employee.
Furthermore, role theory (Biddle, 1979) states that the same job would be performed
differently by two individuals, since they enact their roles in different ways. Pierce and
Jussila (2011) additionally state that a job becomes a big part of one’s own identity. It is
therefore suggested that job redesign should take an individual slant and therefore involve
more than merely a top-down scientific approach (Taylor, 1911). It is suggested that
organisations and HR in particular could facilitate job crafting by employees, where they
can be afforded the opportunity to “change elements of their jobs and relationships with
others to change the meaning of their work and the social environment at work”
(Wingerden, Bakker, & Derks, 2017, p. 165). Employees could then mould or craft their
job by shifting the emphasis of the job to suit their own unique personality, preferences
and most importantly strengths.
By affording employees the opportunity to craft their own jobs employees are encouraged
to self-invest in not only the job itself (with a desired organisational outcome), but also
creating the job, further contributing to the experience of feelings of ownership for the job.
Three strategies are often employed by individuals to craft their own jobs. They change
their relationship with co-workers in terms of how much time they spend interacting, they
change their job perspective or they adapt the tasks in terms of type and frequency
(Wrzesniewski & Dutton, 2001). Therefore, employees should be afforded the opportunity
to invest of themselves within their job by having the ability to take control and gain
intimate knowledge and using this knowledge and control to adapt their job and relations
within it to suit their sense of self in order to experience increased levels of psychological
ownership.
Stellenbosch University https://scholar.sun.ac.za
326
Managers additionally need to allow employees the flexibility to craft their own jobs. It
seems reasonable to argue here that managers within organisations should allow their
employees a certain degree of freedom within their jobs to implement these three
strategies. Furthermore, managers should carry out programs within job roles that can
lead to experienced control, intimate knowing and investment of the self into the job to
harness the abovementioned benefits. Managers have the opportunity to create working
environments where their employees can easily gain intimate knowledge about their job,
take control over that job and invest parts of themselves into that job. Therefore, managers
should be trained and empowered with information pertaining to the general benefits of
psychological ownership within the world of work, and more specifically the benefits that
increased levels of promotion-oriented psychological ownership can elicit.
Taking the individual, person-centred, aspects into consideration, coupled with the linear
interaction of motivation to pursue the routes towards psychological ownership when job
characteristics and individuals needs are aligned, it seems reasonable to consider the
implications for selection. Specifically in terms of the salience of psychological ownership
root needs and how these can be assessed as part of the recruitment and selection
process within organisations. Given the substantial benefits of the experience of
psychological ownership to both employees and the organisation it begs to reason that
organisations could look at their selection process and as part of their battery of selection
assessments and methods, they could additionally assess the salience of an individual’s
psychological root need/needs. Increased levels of salience, coupled with a correctly
designed job could elicit higher levels of psychological ownership which as outlined in
Chapter two could lead to increased organisational commitment, extra-role or citizenship
behaviour, reduced turnover, improved employee performance and in turn improved
organisational performance.
6.6 CONCLUDING THOUGHT
Psychological ownership is an important construct in industrial psychology. It holds
important implications for harvesting optimal performance from working man. At the same
time, however, it holds implications for granting working man his moral right to become
who he fundamentally is. Johan Steinbeck (1939, p. 50), in The Grapes of Wrath,
beautifully expresses something of the latter thought.
Funny thing how it is. If a man owns a little property, that property is him, it's
part of him, and it's like him. If he owns property only so he can walk on it and
Stellenbosch University https://scholar.sun.ac.za

327
handle it and be sad when it isn't doing well, and feel fine when the rain falls
on it, that property is him, and some way he's bigger because he owns it.
Even if he isn't successful he's big with his property. That is so.'
But let a man get property he doesn't see, or can't take time to get his fingers
in, or can't be there to walk on it - why, then the property is the man. He can't
do what he wants, he can't think what he wants. The property is the man,
stronger than he is. And he is small, not big. Only his possessions are big -
and he's the servant of his property. That is so, too.
Stellenbosch University https://scholar.sun.ac.za

328
REFERENCES
Aguinis, H. (2009). Performance management. New Jersey: Pearson Education
International.
Ainsworth, M., & Smith , N. (1993). Making it happem: Managing performance at work.
Sydney: Prentice Hall.
Algina, J., & Moulder, B. C. (2001). A note on estimating the Joreskog-Yang model for
latent variable interaction using LISREL 8.3. Structural Equation Modeling, 8, 40-
52.
Allison, P. D. (2001). Missing data. Thousand Oaks: Sage.
Alok, K. (2014). Authentic leadership and psychological ownership: Investigation of
interrelations. Leadership & Organization Development Journal, 4, 266-285.
Arnold, H. G., & House, R. J. (1980). Methodological and substantive extensions to the
job characteristics model of motivation. Organizational Behavior and Human
Performance, 25, 161-183.
Arthur, W., Bell, S. T., Villado, A. J., & Doverspike, D. (2006). The use of person-
organization fit in employment decision making: An assessment of its criterion-
related validity. Journal of Applied Psychology, 91, 786-801.
Asatyran, V., & Oh, H. (2008). Psychological ownership theory: An exploratory application
in the restaurant industry. Journal of Hospitality and Tourism Research, 32(3), 363-
386.
Avey, J. B., Avolio, B., Crossley, C., & Luthans, F. (2009). Psychological ownership:
Theoretical extensions, measurement and relation to work outcomes. Journal of
Organisational Behavior, 30, 173-191.
Avital, M., & Vandenbosch, B. (2000). The relationship between psychological owenrship
and IT-driven value. International conference of information systems proceedings
(pp. 652-659). Atlanta, CA: Association for information systems.
Ayandele, I. A., & Nnamseh, M. P. (2014). Hackman and Oldham Job Characteristics
Model (JCM) and Akwa Ibom State. Canadian Social Science, 10(2), 89-97.
Stellenbosch University https://scholar.sun.ac.za
329
Babbie, E., & Mouton, J. (2014). The practice of social research. Southern Africa: Oxford
University Press.
Baer, M., & Brown, G. (2012). Blind in one eye: How psychological ownership of ideas
affects the types of suggestions people adopt. Organizational Behavior and Human
Decisions Processes, 118, 60-71.
Bandura, A. (1997). Self-efficacy: The exercise of control. New York: Freeman.
Barendse, M. T., Oort, F. J., & Timmerman, M. E. (2015). Using exploratory factor analysis
to determine the dimensionality of discrete responses. Structural Equation
Modeling: A Multidisciplinary Journal, 22, 87-101.
Bartram, D. (2005). The great eight competencies: A croterion-centric approach to
validation. Journal of Applied Psychology, 90(6), 1185-1203.
Bartram, D., Callinan, M., & Robertson, I. T. (2002). A framework for examining
organizational effectiveness. In D. Bartram, M. Callinan, & I. T. Robertson,
Organizational effectiveness: The role of psychology. West Sussex: John Wiley &
Sons, Ltd.
Beaglehole, E. (1932). Property: A study in social psychology. New York: Macmillan.
Belk, R. W. (1988). Possessions and the extended self. Journal of Consumer Research,
15, 139-168.
Bentler, P. M., & Bonnet, D. C. (1980). Significance tests and goodness of fit in the
analysis of covariance structures. Psychological Bulletin, 88(3), 588-606.
Bentler, P. M., & Chou, C. P. (1987). Practical issues in structural modeling. Sociological
Methods Research, 16, 78-117.
Bentler, P. M., & Raykov, T. (2000). On measures of explained variance in nonrecursive
structural equation models. Journal of Applied Psychology, 85(1), 125-131.
Berman, H. J. (1983). Law and revolution: The formation of the Western legal tradition.
Cambridge, Mass: Harvard University Press.
Bernadin, H. J., Kane, J. S., Ross, S., Spina, J. D., & Johnson, D. L. (1995). Performance
appraisal design, development, and implementation. In G. R. Ferris, S. D. Rosen,
Stellenbosch University https://scholar.sun.ac.za

330
& D. T. Barnum, Handbook of Human Resources Management. Cambridge: MA:
Blackwell.
Bernhard, F., & O'Driscoll, P. M. (2011). Psychological ownership in small family-owned
businesses: Leadership style and non family-employees work attitudes and
behaviors. Group & Organization Management, 36(3), 345-384.
Biddle, B. J. (1979). Role theory: Expectations, identities, and behaviours. New York:
Academic Press.
Binning, J. F., & Barrett, G. V. (1989). Validity for personnel decisions: A conceptual
analysis of the inferential and evidential bases. Journal of Applied Psychology,
74(3), 478-494.
Black, M. (1962). Models and metaphors: Studies in language and philosophy. Ithaca:
Cornell University Press.
Boonzaier, B. B. (2001). Revision of the job characteristics model. Unpublished doctoral
dissertation. Cape Town, South Africa: Cape Technikon.
Boonzaier, B. B., Ficker, B., & Rust, B. (2001). A review of research on the JOb
Characteristics Model and the attendant job diagnostic survey. South African
JOurnal of Business Management, 32(1), 11-34.
Bronkhorst, P. (2011). The architecture of high-performance organisation - building
corporate capability. South Africa: Evalex Publications.
Brousseau, K. R. (1983). Toward a dynamic model of job-person relationships: Findings,
research questions, and implications for work system design. Academy of
Management Review, 8, 33-45.
Brown, G., Lawrence, T. B., & Robinson, S. A. (2005). Territorality in organizations.
Academy of Management Review, 3, 577-594.
Brown, G., Pierce, J. L., & Crossley, C. (2011). Job design, psychological ownership and
work effects: A test of a mediated model. Labovitz school of business and
economics, University of Minnesota Duluth: Working paper.
Stellenbosch University https://scholar.sun.ac.za

331
Brown, G., Pierce, J. L., & Crossley, C. (2014). Toward an understanding of the
development of ownership feelings. Journal of Organizational Behavior, 35, 318-
338.
Brown, S. P., & Leigh, T. W. (1996). A new look at psychological climate and its
relationship to job involvement, effort, and performance. Journal of Applied
Psychology, 81(4), 358-368.
Brown, T. L. (1989). What will it take to win? Two words say it all: psychological ownership.
Industry Week, 239(19), 12.
Burger, R. (2012). Elaboration and empirical evaluation of the De Goede learning potential
structural model. Unpublished masters thesis: Stellenbosch University, South
Africa.
Burk, C. (1900). The collecting instinct. Pedagogical Seminary, 7, 179-207.
Buys, M. A., Olckers, C., & Schaap, P. (2007). The construct validity of the revised job
diagnostic survey. South African JOurnal of Business Management, 38(2), 33-40.
Byrne, B. M. (2001). Structural equation modelling with AMOS: Basic concepts,
applications and programming. New Jersey: Lawrence Erlbaum Associates, Inc.
Cable, D. M., & Edwards, J. R. (2004). Complementary and supplementary fit: A
theoretical and empirical integration. Journal od Applied Psychology, 89(5), 822-
834.
Campbell, J. P. (1990). Handbook of industrial and organizational psychology. In M. D.
Dummette, & L. M. Hough, Modeling the performance prediction problem in
industrial and organizational psychology. Palo Alto: Consulting Psychologists
Press.
Caplan, R. D. (1987). Person-environment fit theory and organizations: Commensurate
dimensions, time perspectives and mechanisms. Journal of Vocational Behaviour,
31, 248-267.
Cascio, W. F., & Aguinis, H. (2011). Applied psychology in human resource management
(7th ed.). New Jersey: Pearson International.
Stellenbosch University https://scholar.sun.ac.za

332
Casler, K., Bickel, L., & Hackett, E. (2013). Seperate but equal? A comparison of
participants and data gathered via Amazon's MTirk, social media and face-to-fce
behavioral testing. Computers in Human Behavior, 29, 2156-2160.
Cilliers, P. (1998). Complexity and postmodernism: Understanding complex systems.
London: Rouledge.
Clayton, S. H. (1981). Moderators of the relationship between individual-task-strueture
congruencies and job satisfaction and performance. Unpublished Doctoral
Dissertation, The University of Texas.
Coase, R. H. (1937). The nature of the firm. Economica, 4(16), 386-405.
Csikszentmihalyi, M., & Rochberg-Halton, E. (1981). The meaning of things: Domestic
symbols and the self. Cambridge: Cambridge University Press.
Daniels, A. C. (2000). Bringing out the best in people. New York: McGraw-Hill.
Dawkins, S., Tian, A. W., Newman, A., & Martin, A. (2017). Psychological ownership: A
review and research agenda. Journal of Organizational Behavior, 38, 163-183.
De Goede, J., & Theron, C. (2010). An investogation into the internal struture of the
learning potential construct as measured by the APIL-B test battery. Management
Dynamics, 19(4), 30-55.
De Vaus, D. A. (2001). Researcg design in Social research. London: Sage.
DeMars, C. E. (2013). A tutorial on interpreting bifactor model scores. International Journal
of Testing, 13, 354-378.
Department of Health. (2013). Regulations relating to research on human subjects.
Pretoria: SA Government agencies.
DeVellis, F. R. (2012). Scale development: Theory and applications. Thousand Oaks CA:
Sage Publications.
Diamantopoulos, A., & Siguaw, J. A. (2009). Introducing Lisrel. Thousand Oaks,
California: SAGE Publications.
Dittmar, H. (1992). The social psychology of material possessions: To have is to be. New
York: St Martin's Press.
Stellenbosch University https://scholar.sun.ac.za
333
Dixon, J. C., & Street, J. W. (1957). The distinction between self and not-self in children
and adolescents. Journal of Genetic Psychology, 127, 157-162.
Druskat, V. U., & Kubzansky, P. E. (1995). Measuring the psychological sense of
ownership in the workplace. Paper presented at the Annual Conference of the
Academy of Management. Vancouver, Canada.
Druskat, V. U., & Pescosolido, A. T. (2002). The content of effective teamwork mental
models in self-managing teams: Ownership, learning and heedful interrelating.
Human Relations, 55, 283-314.
Du Toit, B. (2014). The modification, elaboration and empirical evaluation of the De Goede
learning potential structural model through the incorporation of non-cognitive
learning competency potential latent variables. Cape Town: Unpublished thesis,
Stellenbosch University.
Du Toit, M., & Du Toit, S. H. (2001). Interactive LISREL: User’s guide. Lincolnwood:
Scientific Software International.
Duncan , N. G. (1981). Home ownership and social theory. In S. Duncan, Housing and
Identity: Cross-cultural Perspectives. New York: Holmes and Meier.
Durrheim, K. (2011). Research design. In M. Terre Blanche, K. Durrheim, & D. Painter,
Research in practice: Applied methods for the scial sciences. Cape Town: UCT
Press (Pty) Ltd.
Edwards, J. R. (1993). Problems with the use of profile similarity indices in the study of
congruence in organizational research. Personnel Psychology, 641-665.
Edwards, J. R. (2008). Person-environment fit in organizations: An assessment of
theoretical progress. The Academy of Management Annals(2), 167-230.
Edwards, J. R., Caplan, R. D., & Harrison, R. V. (1998). Person-environment fit theory:
Conceptual foundations, empirical evidence, and directions for future research. In
C. L. Cooper, Theories of organizational stress (pp. 28-67). Oxford: Oxford
University Press.
Ehrenreich, B. (1991, June 3). Science, lies and the ultimate truth. TIME Magazine.
Stellenbosch University https://scholar.sun.ac.za

334
Ellwood, C. A. (1927). Cultural evolution: A study of social origins and development. New
York: Century.
Etzioni, A. (1991). The socio-economics of property. Journal of Social Behavior and
Personality, 6, 465-468.
Fabrigar, L. R., MacCallum, R. C., Wegener, D. T., & Strahan, E. J. (1999). Evaluating the
use of exploratory factor analysis in psychological research. Psychological
Methods, 4(3), 272-299.
Ferraro, R., Escalas, J. E., & Bettman, J. R. (2011). Our possessions, our selves: Domains
of self-worth and the possession-self link. Journal of Consumer Psychology, 169-
177.
Fiorito, J. D., Bozeman, A., Young, A., & Meurs, J. A. (2007). Organizational commitment,
human resource practices, and organisational characteristics. Journal of
Managerial issues, 19(2), 186-207.
French, J. P., Caplan, R. D., & Harrison, R. V. (1982). The mechanisms of job stress and
strain. London: Wiley.
Fried, Y., & Ferris, G. R. (1987). The validity of the job characteristics model: A review and
meta-analysis. Personnel Psychology, 40(2), 287-322.
Furby, L. (1976). The socialization of possession and ownership among children in three
cultural groups: Israeli kibbutz, Isreal City and American. In S. Modgil, & Modgil C,
Piagetian Research: Compilation and commentary (pp. 95-127). Windsor: NFER
Publishing.
Furby, L. (1978). Possession in humans: An exploratory study of its meaning and
motivation. Social behaviour and Personality, 6(1), 49-65.
Furby, L. (1980). The origins of early development of possessive behavior. Political
Psychology, 2(1), 30-42.
Furby, L. (1991). Understanding the psychology of possession and ownership: a personal
memoir and an appraisal of our progress. Journal of Social Behavior and
Personality, 6, 457-463.
Stellenbosch University https://scholar.sun.ac.za
335
Gibson, J. L., Ivancevich, J. M., & Donnelly, J. H. (1997). Organizations: Behavior,
Structure, Processes. United States of America: Irwin/McGraw-Hill.
Gibson, J. L., Ivancevich, J. M., Donnelly, J. H., & Konopaske, R. (2009). Organizations:
Behavior, Structure, Processes (13th ed.). Singapore: Mc Graw Hill.
Giuffre, M. (1997). Designing research: Ex post facto designs. Journal of PeriAnesthetia
Nursing, 12(3), 191-195.
Grobler, P. A., Warnich, S., Carrell, M. R., Elbert, N. F., & Hatfield, R. D. (2011). Human
resource management in South Africa. United Kingdom: South-Western Cengage
Learning.
Guha. (2009). Two essays on escalation of commitment. Doctoral dissertation,
Department of Business Administration, Duke University, Durham, North Carolina.
Hackman, J. R., & Oldham, G. E. (1975). Development of a job diagnostic survey. Journal
of applied psychology, 60(2), 159-170.
Hackman, J. R., & Oldham, G. R. (1976). Motivation through the design of work: Test of a
theory. Organizational behavior and human performance, 16, 250-279.
Hair, J. F., Black, W. C., Babin, B. J., & Anderson, R. E. (2010). Multivariate data analysis.
New Jersey: Pearson Education Inc.
Harrison, R. V. (1978). Person-environment fit and job stress. In C. L. Cooper, & R. Payne,
Stress at work (pp. 175-205). New York: Wiley.
Hayasbi, K., & Yuan, K. (2010). Exploratory factor analysis. In N. J. Salkind, Encyclopedia
of research design. Thousand Oaks: SAGE Publications Inc.
Health Professionals Council of South Africa. (1974). Ethical rules of conduct for
practitionser registered under the health professions act (Act no.56 of 1974).
Heider, F. (1958). The psychology of interpersonal relations. New York : Wiley.
Higgins, T. E. (1997). Beyond pleasure and pain. American Psychologists, 52(12), 1280-
1300.
Stellenbosch University https://scholar.sun.ac.za

336
Hillenbrand, C., & Money, K. G. (2015). Unpacking the mechanism by which psychological
ownership manifests at the level of the individual: A dynamic model of identity and
self. Journal of Marketing Theory and Practice, 23(2), 148-165.
Hitt, M. A., Miller, C. C., & Collela, A. (2009). Organizational behavior (2nd ed.). Hoboken:
NJ: Wiley.
Holt, J. K. (2004). Item parcelling in structural equation models for optimum solutions.
Paper presented at the 2004 Annual Meeting of the Mid-Western Educational
Research Association. Columbus, OH.
Hooper, D. C., Coughlan, J., & Mullen, M. R. (2008). Structural equation modelling:
Guidelines for determining model fit. The Electronic Journal of Business Research
Methods, 6(1), 53-60. Retrieved 11 12, 2016, from
http://www.ssnpstudents.com/wp/wp-content/uploads/2015/02/ejbrm-volume6-
issue1-article183.pdf
Horn, L., Graham, C., Prozesky, H., & Theron, C. (2015). Getting ethics approval for your
research project. Cape Town: Stellenbosch University.
Hou, S. (2010). Psychological ownership and technology adoption. Wisdom, Technology
and Applied Statistics Journal, 6, 31-51.
Hsu, C., & Sandford, B. A. (2007). The delphi technique: Making sense of consensus.
Practical Assessment, Research & Evaluation, 12(10), 1-8.
Hu, L. T., & Bentler, P. M. (1999). Cutoff criteria for fit indexes in covariance structure
analysis: Conventional criteria versus new alternatives. Structural Equation
Modelling, 6(1), 1-55.
Humphrey, S. E., Nahrgang, J. D., & Morgeson, F. P. (2007). Integrating motivational,
social and contextual work design features: a meta-analytic summary and
theoretical extension of work design literature. Journal of Applied Psychology, 92,
1332-1356.
Hunter, C. (2012). Managing people in South Africa: Human resource management as
competitive advantage. Durban: Sherwood Books.
Idaszak, J. R., & Drasgow, F. (1987). A revision of the Job Diagnostic Survey: Elimination
of a measurement artifact. Journal of Applied Psychology, 72, 69-74.
Stellenbosch University https://scholar.sun.ac.za

337
Idaszak, J. R., Bottom, W. P., & Drasgow, F. (1988). A test of the measurement
equivalence of the Revised Job Diagnostic Survey: Past problems and current
solutions. Journal of Applied Psychology, 73(4), 647-656.
Isaacs, S. (1933). Social development in young children. London: Routledge.
James, W. (1890). The principles of psychology. New York: Holt.
Jöreskog, K. G., & Sörbom, D. (1996). LISREL 8: User’s reference guide. Chicago:
Scientific Software International.
Kahane, L. H. (2001). Regression basics. London: Sage Publications.
Kahn, W. A. (1990). Conditions of personal engagement and disengagement at work. The
Academy of Management Journal, 33(4), 692-724.
Kane, J. S. (1986). Performance distribution assessment. In R. Berk, Performance
assessment: Methods and applications. London: The John Hopkins University
Press.
Kemp, N. J., & Cook, J. D. (1983). Job longevity and growth need strength as joint
moderators of the task design-job satisfaction relationship. Human Relations, 36,
883-898.
Kenny, D. A., & Judd, C. M. (1984). Estimating the nonlinear and interactive effects of
latent variables. Psychological Bulletin, 96, 201-210.
Kerlinger, F. N. (1979). Behavioral research: A conceptual approach. New York: Holt,
Rinehart and Winston.
Kerlinger, F. N. (1986). Foundations of behavioural research (3rd ed.). New York: CBS
College Publishing.
Kerlinger, F. N., & Lee, H. B. (2000). Foundations of behavioural research (4th ed.). USA:
Harcourt Colege Publishers.
Kimberlin, C. L., & Winterstein, A. G. (2008). Validity and reliability of measurement
instruments used in research. American journal of health-system pharmacy, 65.
Kline, L., & France, C. J. (1899). The psychology of mine. Pedagogical Seminary and
Genetic Psychology, 6, 421-470.
Stellenbosch University https://scholar.sun.ac.za

338
Kline, R. B. (1998). Principles and practise of structural equation modeling. New York: The
Guilford Press.
Kline, R. B. (2004). Beyond significance testing: Reforming data analysis methods in
behavioral research. Washington,DC: American Psychological Association.
Kline, R. B. (2005). Principles and practice of structural equation modelling (2nd ed.). New
York: The Guilford Press.
Koopmans, L., Bernaards, C., Hilderbrandt, V. H., Schaufeli, W. B., De Wet, H. C., & Van
der Beek, A. J. (2011). Conceptual frameworks of individual work performance.
Journal of Occupational and Environmental Medicine, 53(8), 856-866.
Kristof, A. L. (1996). Person-organization fit: An integrative review of its
conceptualizations, measurement, and implications. Personnel Psychology, 49, 1-
49.
Kristof-Brown, A., & Guay, R. P. (2011). Person-environment fit. In S. Zedeck, APA
handbook of industrial and organizational psychology: Maintaining, expanding, and
contracting the organization (Vol. 3, pp. 3-50). Washington, DC: American
Psychological Association.
Landeta, J. (2006). Current validity of the delphi method in social sciences. Technology
Forecasting and Social Change, 73, 467-482.
Liang, J., Farh, C. I., & Farh, J. L. (2012). Psychological antecedents of promotive and
prohibitive voice: A two wave examination. Academy of Management Journal,
55(1), 71-92.
Little, T. D., Bovaird, J. A., & Widaman, K. F. (2006). On the merits of orthogonalizing
powered and product terms: Implications for modeling interactions amog latent
variables. Structural Equation Modeling: A Multidisciplinary Journal, 13(4), 497-
519.
Little, T. D., Card, N. A., Bovaird, J. A., Preacher, K. J., & Crandal, C. S. (2007). Structural
equation modeling of mediation and moderation with contextual factors. In T. D.
Little , J. A. Bovaird, & N. A. Card, Modeling contextual effects in longitudinal
studies (pp. 207-230). Kansas: Lawrence Erlbaum Associates.
Stellenbosch University https://scholar.sun.ac.za

339
Little, T. D., Cunningham, W. A., Shahar, G., & Widaman, K. F. (2002). To parcel or not
to parcel: Exploring the question, weighing and merits. Structural equation
modeling, 9(2), 151-173.
Litwinski, L. (1942). Is there instinct in possession? British Journal of Psychology, 23, 28-
39.
Locke, J. (1960). Two treaties of government. London: Awnsham Churchill.
Luthans, F. (2011). Organizational behaviour: An evidence based approach. New York:
McGraww-Hill.
Luthans, F., & Youssef, C. M. (2004). Human, social, and now positive psychological
capital management: Investing in people for competitive advantage. Organizational
Dynamics, 33(2), 143-160.
MacCallum, R. C., & Austin, J. T. (2000). Applications of structural equation modeling in
psychological research. Annu. Rev Psychol, 51, 201-226.
MacCallum, R. C., Widaman, K. F., Zhang, S., & Hong, S. (1999). Sample size in factor
analysis. Psychological Methods, 4(1), 84-99.
Mahembe, B. (2013). The development and empirical evaluation of an extended learning
potential structural model. Cape Town: Stellenbosch University: Unpublished PHD
Dissertation.
Marsh, H. W., Wen, Z., & Hau, K. (2004). Structural equation models of latent interactions:
Evaluation of alternative estimation strategies and indicator constrcution.
Psychological Methods, 9, 275-300.
May, D. R., Gilson, R. L., & Harter, L. M. (2004). The psychological conditions of
meaningfulness, safety and availability and the engagement of the human spirit at
work. Journal of Occupational and Organisational psychology, 77, 11-37.
Mayhew, M. G., Ashkanasy, N. M., Bramble, T., & Gardner, J. (2007). A study of the
antecedents and consequences of psychological ownership in organizational
settings. The Journal of Social Psychology, 147(5), 477-500.
McClelland, D. (1951). Personality. New York: Holt, Rinchart & Winston.
Mead, G. H. (1934). Mind, self and society. Chicago: University of Chicago Press.
Stellenbosch University https://scholar.sun.ac.za

340
Mels, G. (2003). A workshop on structural equation modeling with LISREL 8.54 for
windows. Chicago: Scientific Software International.
Miller, D. C., & Salkind, N. J. (2002). Handbook of research design and social
measurement. Thousand Oaks, CA: SAGE Publications.
Millsap, R. E., & Maydeu-Olivares, A. (2009). The SAGE handbook of quantitative
methods in psychology. Thousand Oaks, California: SAGE.
Mischel, W. (1973). Toward a cognitive social learning reconceptualization of personality.
Psychological review, 80, 252-283.
Morrow, P. C. (1983). Concept redundancy in organizational research: The case of work
commitment. Academy of Management Review, 8, 486-500.
Motowidlo, S. J., Borman, W. C., & Schmidt, M. J. (1997). A theory of individual differences
in task and contextual performance. Human Performance, 10(2), 71-83.
Mouton, J. (2012). How to succeed in your master's and doctoral studies: A South African
guide and resource book. Pretoria: Van Schaik Publishers.
Muchinsky, P. M., & Monahan, C. J. (1987). What is person-environment congruence?
Supplementary versus complementary models of fit. Journal of Vocational
Behavior, 31, 268-277.
Murphy, K. R. (1989). Is the relationship between cognitive ability and job performance
stable over time? Human Performance, 2, 183-200.
Myburgh, H. M. (2013). The development and evaluation of a generic individual non-
managerial performance measure. Published Masters Thesis. Cape Town:
Stellenbosch University.
Nadeem, U., Kim, H., & Kim, S. T. (1995). "Human capital flight": Impact f migration on
income and growth. International Monetary Fund, 42(3), 577-607.
Netemeyer, R. G., Bearden, W. O., & Sharma, S. (2003). Scaling procedures. Sage
publications, Inc.
Neuman, L. W. (1997). Social research methods: Qualitative and quantitative approaches.
Needham Heights MA: Allyn & Bacon.
Stellenbosch University https://scholar.sun.ac.za

341
O'Driscoll, M. P., Pierce, J. L., & Coghlan, A. (2006). The psychology of ownership: Work
environment structure, organisational commitment and citizenship behaviors.
Group & Organization Management, 31(3), 388-416.
Olckers, C. (2011). A multi-dimensional measure of psychological ownership for South
African organisations.
Olckers, C. (2014). The impact of employment equity perceptions on psychological
ownership. Global Institute of Applied Business Research Journal of Business,
1(1), 67-82.
Olckers, C., & Du Plessis, Y. (2012a). Psychological ownership: A managerial construct
for talent retention and organisational effectiveness. African Journal of Business
Management, 6(7), 2585-2596.
Olckers, C., & Du Plessis, Y. (2012b). The role of psychological ownership in retaining
talent: A systematic literature review. SA Journal of Human Resources
Management, 10(2), 415-433.
Olckers, C., & Du Plessis, Y. (2015). Psychological ownership as a requisite for talent
retention: The voice of highly skilled employees. European Journal of International
Management, 9(1), 52-73.
Olckers, C., & Schaap, P. (2013). Measurement equivalence of the South African
psychological ownership questionnaire for diverse South African cultural groups.
Journal of Psychology in Africa, 23(4), 569-577.
Olckers, C., & Van Zyl, L. (2015). The relationship between employment equity
perceptions and psychological ownership in a South African mining house. Social
Indicators Research.
Olsen, J. (2012). Random sampling - Is it worth it? Paediatric and Perinatal Epidemiology,
27, 27-28.
O'Reilly, C. A. (2002). The wrong kind of "ownership". Across the Board, 39(5), 19-20.
Osborne, J. W. (2013). Best practices in data cleaning: A complete guide to everything
you need to do before and after collecting your data. Los Angeles, CA: SAGE
Publications.
Stellenbosch University https://scholar.sun.ac.za

342
Ozler, H., Yilmaz, A., & Ozler, D. (2008). Psychological ownership: An empirical study on
its antecedents and impacts upon organizational behaviour. Problems and
Perspectives in Management, 6(3), 38-47.
Parker, S. K., Wall, T. D., & Jackson, P. R. (1997). "That's not my job": Developing flexible
employee work orientations. Academy of Management Journal, 40, 899-929.
Peng, H., & Pierce, J. (2015). Job-and organization-based psychological ownership:
Relationship and outcomes. Journal of managerial osychology, 30(2).
Pervin, L. A., Cervone, D., & John, O. P. (2005). Personality: Theory and research.
Hoboken, New Jersey: John Wiley & Sons.
Pierce, J. L., & Jussila, I. (2011). Psychological ownership and the organizational context:
Theory, research evidence and application. Cheltenham: Edward Elgar Publishing
Limited.
Pierce, J. L., Jussila, I., & Cummings, A. (2009). Psychological ownership within the job
design context: Revision of the job characteristics model. Journal of organizational
behavior, 30, 477-496.
Pierce, J. L., Kostova, T., & Dirks, K. T. (2001). Toward a theory of psychological
ownership in organizations. The Academy of Management Review, 26(2), 298-
310.
Pierce, J. L., Kostova, T., & Dirks, K. T. (2003). The state of psychological ownership:
Integrating and extending a century of research. Rview of general psychology, 7,
84-107.
Pierce, J. L., Van Dyne, L., & Cummings, L. L. (1992). Psychological ownership: A
conceptual and operational examination. Southern Management Association
Proceedings. Valdosta, G.A.
Porteous, J. D. (1976). Home: The territorial core. Geographical Review, 66, 383-390.
Porter, L. W. (1961). A study of perceived job satisfaction in bottom and middle
management jobs. Journal of Applied Psychology, 46, 373-384.
Porter, L. W. (1962). Job attitudes in management: Perceived deficiencies in need
fulfillment as a function of job level. Journal of Applied Psychology, 46, 375-384.
Stellenbosch University https://scholar.sun.ac.za

343
Porter, L. W., & Lawler, E. E. (1968). Managerial attitudes and performance.
Homewood,IL: Dorsey Press .
Porter, L. W., Lawler, E. E., & Hackman, J. R. (1975). Behavior in organizations. New
York: McGraw-Hill.
Preacher, K. J., & Coffman, D. L. (n.d.). Computing power and minimum sample size for
RMSEA (computer software. Available from http://quantpsy.org/.
Prelinger, E. (1959). Extension and structure of the self. The Journal of Psychology, 47(1),
13-23.
Prinsloo, J. (2013). Modification, elaboration and empirical evaluation of the Burger
learning potential structural model. Cape Town: Stellenbosch University,
Unpublished Master Thesis.
Ramlall, S. (2004). A review of employee motivation theories and their implications for
employee retention within organizations. The Journal of American Academy of
Business, 5(1), 52-63.
Reber, A. S. (1985). Dictionary of Psychology. Harmondsworth: Penguin.
Reio, T. G., & Shuck, B. (2015). Exploratory factor analysis: Implications for theory,
research and practise. Advances in Developing Human Resources, 17(1), 12-25.
Reise, S. P. (2012). The rediscovery of bifactor measurement models. Multivariate
Behavioural Research, 47(5), 667-696.
Salkind, N. J. (2010). Encyclopedia of research design. Thousand Oaks, California: SAGE
Publications, Inc.
Sartre, J. P. (1943/1969). Being and nohingness: A phenomenological essay on ontology.
New York: Philosophical Library.
Saunders, M., Lewis, P., & Thornhill, A. (2009). Research methods for business students
(Fifth ed.). Harlow: England: Pearson Education Limited.
Schafer, J. L., & Graham, J. W. (2002). Missing data: Our view of the state of the art.
Psychological methods, 7(2), 147-177.
Stellenbosch University https://scholar.sun.ac.za

344
Schaufeli, W. B., Salanova, M., Gonzalez-Roma, V., & Bakker, A. A. (2002). The
measurement of engagement and burnout: A two sample confirmatory factor
analytic approach. Journal of Happiness Studies, 3, 71-92.
Schneider, B. (2001). Fits about fit. Applied Psychology: An International Review, 50(1),
141-152.
Seligman, M. E. (1975). Helplessness. San Fransisco: Freeman.
Seligman, M. E., & Csikszentmihalyi, M. (2000). Positive psychology: An introduction.
American Psychologist, 55(1), 5-14.
Shanock, L. R., Baran, B. E., Gentry, W. A., Pattison, S. C., & Heggestad, E. D. (2010).
Polynomial regression with response surface analysis: A powerful approach for
examining moderation and overcoming limitations of difference scores. Journal of
Business Psychology, 25, 543-554.
Sherry, E., Mainiero, L., & Mainiero, S. (2007). Kaleidoscopecareer: Benchmarking ideas
for fostering family-friendly workplaces. Organizational Dynamics, 45-62.
Shrader-Frechette, K. (1994). Ethics of scientific research. Lanham, Maryland: Rowman
& Littlefield Publishers.
Steers, R. M., & Porter, L. W. (1983). Motivation and work behavior. New York: McGraww-
Hill.
Steinbeck, J. (1939). The grapes of wrath. USA: Random House.
Stellenbosch University. (2012). Standard operating procedures: Human research ethics.
Cape Town, Stellenbosch.
Stellenbosch University, Division for Research Development. (2013). Policy for
responsible research conduct at Stellenbosch University. Cape Town:
Stellenbosch University.
Strümpfer, D. (2006). The strengths perspective: Fortigenesis in adult life. Social
Indicators Research, 77, 11-36.
Swedberg, R. (2012). Theorizing in sociology and social science: Turning to the context
of discovery. Theory and Society, 41(1), 1-40.
Stellenbosch University https://scholar.sun.ac.za

345
Tabachnick, B. G., & Fidell, L. S. (2014). Using multivariate statistics. Edinburgh: Pearson
Education Limited.
Tanaka, J. S. (1993). Multifaceted conceptions of fit in structural equation models. In K.
A. Bollen, & J. S. Long, Testing structural equation models. Newbury Park, CA:
Sage.
Taylor, F. W. (1911). Principles of scientific management. New York: Harper.
Tetrik, L. E., & LaRocco, J. M. (1987). Understanding, prediction, and control as
moderators of the relationship between perceived stress, satisfaction, and
psychological well-being. Journal of Applied Psychology, 72, 538-543.
Theron, C. (2014a). Intermediate statistics and computer usage 873. Unpublished Class
Notes.
Theron, C. (2014b). Polynomial regression analyses with response surface modeling.
Cape Town: Stellenbosch University: Class Notes.
Theron, C. (2015). Intermediate statistics and computer usage 873. Unpublished class
notes: Stellenbosch University.
Theron, C. C., & Spangenberg, H. H. (2005). Towards a comprehensive leadership-unit
performance strutural model: The developmet of second-order factors for the
Leadership Behaviour Inventory (LBI). Management dynamics, 14(1), 35-50.
Tims, M., & Bakker, A. B. (2010). Job crafting: TOwards a new model of individual job
redesign. SA Journal of Industrial Psychology, 36(2), 841-850.
Tredoux, C., & Durrheim, K. (2002). Numbers, hypotheses & conclusions: A course in
statistics for the social sciences. Cape Town: UCT Press.
Van Deventer, M. (2015). The development and empirical evaluation of a work
engagement structural model. Cape Town: Stellenbosch Unversity: Unpublished
Masters Thesis.
Van Dyne, L., & Pierce, J. L. (2004). Psychological ownership and feelings of possession:
Three field studies predicting employee attitudes and organizational citizenship
behavior. Journal of organizational behavior, 25, 439-459.
Stellenbosch University https://scholar.sun.ac.za
346
Van Heerden, S., & Theron, C. C. (2014). The elaboration and empirical evaluation of the
De Goede learning potential structural model. South AFrican Journal of Business
Management, 45(3), 1-29.
Van Loggerenberg, I. (2012). The construct validity of the job diagnostic survey within the
South African context. University of Pretoria, published thesis. Viewed 20160122
(http://upetd.up.ac.za/thesis/available/etd-09292012-143641/ ).
Viswesvaran, C., & Ones, D. S. (2000). Perspectives on models models of job
performance. International Journal of Selection and Assessment, 8(4), 216-226.
Vorster, M., Olckers, C., Buys, M. A., & Schaap, P. (2005). The construct equivalence of
the job diagnostic survey for diverse South African cultural groups. SA Journal of
Industrial psychology, 31(1), 31-37.
Vroom, V. H. (1964). Work and motivation. New York: John Wiley & Sons.
Wagner, S. H., Parker, C. P., & Christianson, N. D. (2003). Employees that think and act
like owners: Effects of ownership beliefs and behaviors on organizational
effectiveness. Personnel Psychology, 56, 847-871.
Wang, L. L., Watts, A. S., Anderson, R. A., & Little, T. D. (2013). Common fallacies in
quantitative research methodology. In T. D. Little, The Oxford handbook of
quantitaive methods, Volume 2, Statistical Analysis (pp. 718-759). New York:
Oxford University Press.
Warnich, S., Carrell, M. R., Elbert, N. F., & Hatfield, R. D. (2015). Human resource
management in South Africa. United Kingdom: Cengage Learning.
Weick, K. E. (1979). The social psychology of organizing. New York: Random House.
Weil, S. (1971). The need for roots : Prelude to a declaration of duties toward mankind.
New York: Harper & Row.
White, R. W. (1959). Motivation reconsidered: The concept of competence. Psychological
review, 66(5), 297-330.
Williams, R., & Fletcher, C. (2002). Performance management and organizational
effectiveness. In I. T. Robertson, M. Callinan, & D. Bartram, Organizational
effectiveness: The role of psychology. West Sussex: John Wiley & Sons Ltd.
Stellenbosch University https://scholar.sun.ac.za

347
Wingerden, J. V., Bakker, A. B., & Derks, D. (2017). Fostering employee well-being via a
job crafting intervention. Journal of Vocational Behavior, 100, 164-174.
Wrzesniewski, A., & Dutton, J. E. (2001). Crafting a job: Revisioning employees as active
crafters of their work. Academy of Management Review, 26, 179-201.
Yuan, P., Bare, M. G., Johnson, M. O., & Saberi, P. (2014). Using online social media for
recruitment of human immunodeficiency virus-positive participants: A cross-
sectional survey. J Med Internet Res, 16(5).
Zedeck, S. (2014). APA Dictionary of Statistics and Research Methods. American
Psychological Association.
Stellenbosch University https://scholar.sun.ac.za

348
APPENDIX 1
DEVELOPMENT AND EMPIRICAL EVALUATION OF AN EXPLANATORY
PSYCHOLOGICAL OWNERSHIP STRUCTURAL MODEL
Angela Lee
SUPERVISOR: PROFESSOR C.C. THERON
CO-SUPERVISOR: MR T MARIRI
MARCH 2016
Stellenbosch University https://scholar.sun.ac.za

349
STELLENBOSCH UNIVERSITY
CONSENT TO PARTICIPATE IN RESEARCH – DELPHI TECHNIQUE
DEVEOPMENT AND EMPIRICAL TESTING OF A PSYCHOLOGICAL OWNERSHIP
STRUCTURAL MODEL - DELPHI TECHNIQUE
You are invited to participate in a research study conducted by Angela Lee, a Master of
Commerce student, from the Department of Industrial Psychology at the faculty of
Economic and Management Sciences, Stellenbosch University. The results of this
research study will contribute towards the completion of the research component of the
thesis and consequently the completion of her studies.
Brief introduction to the purpose of this mini study within the larger context of the
development and testing of a psychological ownership structural model:
In order to operationalise certain variables within the proposed psychological ownership
structural model certain new items have been proposed. Before these items can be
included within the psychological ownership scale, and subsequent testing of the
structural model can begin, they require vetting and quality assessment to determine their
applicability for inclusion. You were selected as a possible participant in this study due
to your knowledge and expertise in the field of industrial psychology in general and/or with
regards to psychological ownership specifically. Your participation would be greatly
appreciated but is totally on a voluntary basis.
1. PURPOSE OF THE STUDY
In response to the research initiating question, why does variance in levels of
psychological ownership exist among different employees working in different
organisational contexts, the objective of this research study is to develop an
explanatory psychological ownership structural model as well as to empirically test the
Stellenbosch University https://scholar.sun.ac.za

350
validity of the model. It is hoped that this model will provide a description of the
psychological mechanism that regulates the level of psychological ownership that
employees experience.
2. PROCEDURES
If you decide to participate in this research study, we would ask you to complete a
Subject matter Expert (SME) Item analysis questionnaire. The questionnaire will be
presented in an electronic Word document, to enable reviewers to provide feedback
and suggestions. If you do not want to answer specific questions or evaluate certain
items you may leave them blank, without the risk of any negative consequence. There
are no right or wrong answers and there is also no time limit. Please set aside a quiet
time and place to complete this SME Item Analysis questionnaire and answer the
questions as honestly as possible. Your responses and feedback will be manually
processed by the researcher herself.
3. POTENTIAL RISKS AND DISCOMFORTS
There are no foreseeable harmful risks for you as a participant. However, the
completion of the questionnaire will entail some of your time and energy.
4. POTENTIAL BENEFITS TO SUBJECTS AND/OR TO SOCIETY
You as a participant may not directly benefit from your participation in this study.
However, your participation could potentially benefit the field of Industrial Psychology.
Your participation could help to generate understanding surrounding feelings of
ownership within the workplace. The development of this model of psychological
ownership will create a deeper understanding of employees and how they experience
psychological ownership at work. This in turn could aid in the understanding of
interventions (in terms of employee wellness, incentives, job redesign and the like)
aimed at increasing levels of psychological ownership for employees, benefiting both
the employees and the organisation.
5. PAYMENT FOR PARTICIPATION
There is no offer of payment for participation in this study.
Stellenbosch University https://scholar.sun.ac.za

351
6. CONFIDENTIALITY
Any information that is obtained in connection with this study and that can be identified
with you will remain confidential and will be disclosed only with your permission or as
required by law.
Upon completion of the thesis, information supplied to the public (the thesis is
available online via the Stellenbosch Library E-thesis portal) will only be supplied
on an aggregate basis. This information is supplied in order to uplift the research
community, to inform organisational interventions and to strengthen the body of
knowledge available within the academic field of Industrial Psychology. The
researcher will endeavour to protect all participants’ confidentiality and anonymity
rights at all costs.
7. PARTICIPATION AND WITHDRAWAL
You can choose whether to be in this study or not. If you volunteer to be in this study,
you may withdraw at any time without consequences of any kind.
8. IDENTIFICATION OF INVESTIGATORS
If you have any questions or concerns about the research, please feel free to contact:
- Angela Lee on [email protected] or 082 607 1120
- Professor Callie Theron, at the department of Industrial Psychology, 021
8083009 or [email protected]
- Mr Mariri, at the department of Industrial Psychology, 021 808 3008 or
9. RIGHTS OF RESEARCH SUBJECTS
You may withdraw your consent at any time and discontinue participation without
penalty. You are not waiving any legal claims, rights or remedies because of your
participation in this research study. If you have questions regarding your rights as a
research subject, contact Ms Maléne Fouché [[email protected]; 021 808 4622] at
the Division for Research Development.
Stellenbosch University https://scholar.sun.ac.za

352
INFORMED CONSENT
After due consideration please tick the statement that applies to you.
I have read and understand the information that was provided to me surrounding
my potential participation in the Psychological ownership research study. I would
like to participate and therefore voluntarily consent to further participation.
I have read and understand the information that was provided to me surrounding
my potential participation in the psychological ownership research study. I would
not like to participate.
I, _______________________________________, provide my voluntary informed
consent to participate in the Delphi Technique study as part of Angela Lee’s development
and empirical testing of a psychological ownership structural model, at
__________________________________________________ on, this _____ day of
_______________2016.
Signed: ___________________________________
Stellenbosch University https://scholar.sun.ac.za

353
Thank you for taking the time to work through the proposed items for inclusion in five subscales of the composite Job –based Psychological
Ownership Scale that will be used to operationalise the latent variables in an explanatory psychological ownership structural model. This
will be of great value to our study.
The composite Job –based Psychological Ownership Scale consists of ten subscales. Four of these are existing scales. These existing
scales will be used to measure the job characteristics, psychological safety; the two psychological ownership routes (gaining control and
self-investment) latent variables within the proposed psychological ownership structural model.
Appropriate existing measures could, however, not be found in the literature for the five latent variables in the model, namely motivation to
pursue the routes to psychological ownership, the psychological ownership route gaining intimate knowledge and the three psychological
ownership needs, the need for self-identity, the need for a sense of belonging and the need for self-efficacy and effectance. The items that
were written for these five subscales are displayed below.
What is expected of you:
1. For each statement, please indicate, by marking with an X, whether you regard the item to be highly inappropriate (HI), slightly
inappropriate (SI), slightly appropriate (SA) or highly appropriate (HA) in measuring the behaviours described in the dimension.
2. Please consider the following questions when working through the item and address these in the comments column:
- Does the item assess the behaviour described in the definition of the dimension it relates to, or is it better suited to another
dimension?
- Is the item clear and unambiguous?
- Is the language of the item clear enough for employees with Grade 12 level English to understand?
- Does each item assess only one construct?
- Does each item assess a unique aspect/facet of the construct which is not measured by any other listed for a specific
dimension? If there is duplication, which is the stronger item?
3. Feel free to suggest any additional items you feel should be included with a brief motivation.
Stellenbosch University https://scholar.sun.ac.za
Stellenbosch University https://scholar.sun.ac.za
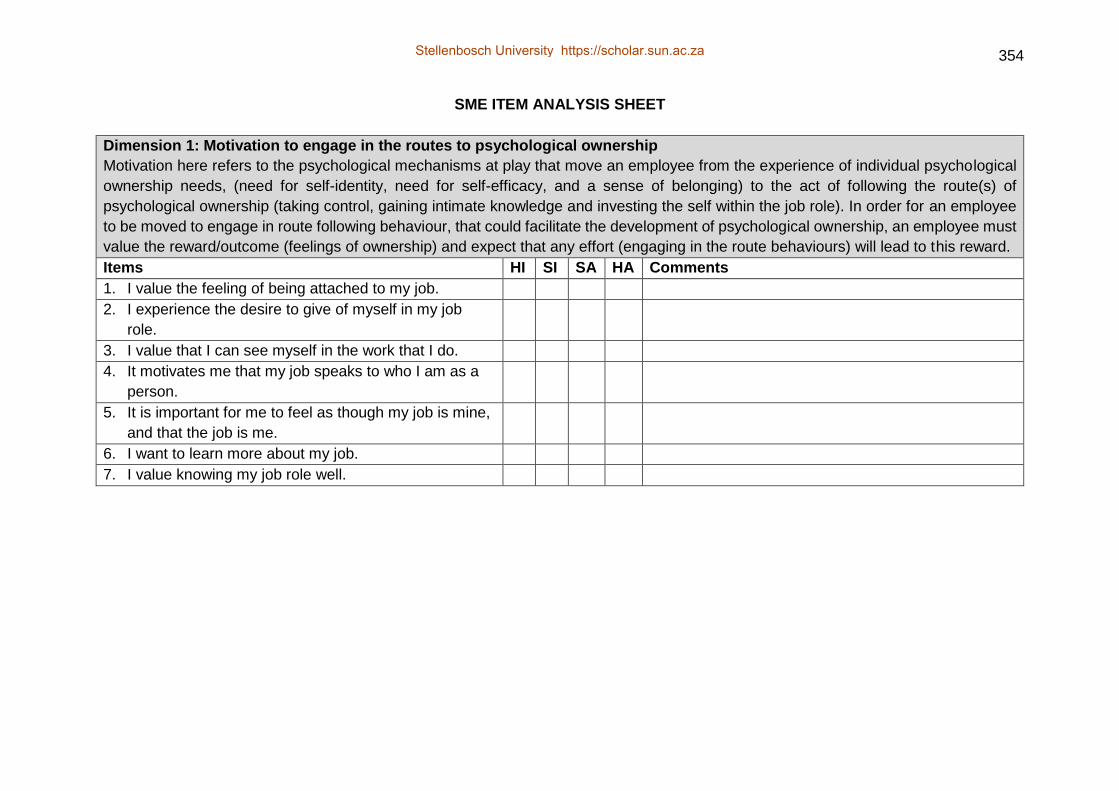
354
SME ITEM ANALYSIS SHEET
Dimension 1: Motivation to engage in the routes to psychological ownership
Motivation here refers to the psychological mechanisms at play that move an employee from the experience of individual psychological
ownership needs, (need for self-identity, need for self-efficacy, and a sense of belonging) to the act of following the route(s) of
psychological ownership (taking control, gaining intimate knowledge and investing the self within the job role). In order for an employee
to be moved to engage in route following behaviour, that could facilitate the development of psychological ownership, an employee must
value the reward/outcome (feelings of ownership) and expect that any effort (engaging in the route behaviours) will lead to this reward.
Items HI SI SA HA Comments
1. I value the feeling of being attached to my job.
2. I experience the desire to give of myself in my job
role.
3. I value that I can see myself in the work that I do.
4. It motivates me that my job speaks to who I am as a
person.
5. It is important for me to feel as though my job is mine,
and that the job is me.
6. I want to learn more about my job.
7. I value knowing my job role well.
Stellenbosch University https://scholar.sun.ac.za
Stellenbosch University https://scholar.sun.ac.za

355
Dimension 2: Gaining intimate knowledge
Active participation with/in the job leads an employee to feel an attachment to the job. This active participation involves learning more
about the intricacies of the job (by becoming familiar with its needs) thereby providing more information to an employee. This in turn
facilitates the building of a connection between the employee and the job. This living relationship evolves and changes over time. The
more information possessed about the job, the more intimate the connection between the employee and the job becomes. This knowing
the job intimately leads to the job feeling as though it is an extension of the self. Therefore, the investment of time and energy (through
self-investment) into the job, to gather information, leads an employee to experience the job as an ‘extension of me’ and subsequently
feelings of ownership towards the job develop.
Items HI SI SA HA Comments
1. I actively make an effort to be informed about aspects
of my job.
2. I ask questions if I don’t know something about my
job.
3. I seek understanding and clarity about my job.
4. I like to know every little detail about my job.
5. I do not take time to find out about my job.
Stellenbosch University https://scholar.sun.ac.za
Stellenbosch University https://scholar.sun.ac.za

356
Please note that dimensions three to five refer to an employees need for three identified psychological constructs. This therefore means
we are not measuring the individuals actual level on these psychological constructs of self-efficacy, self-identity and having a home, per
say. Rather the purpose is to determine an individual’s desire/need/motive level. This has therefore influenced the nature of the questions
for these three dimensions.
Dimension 3: Need for self-identity
Individuals, in an attempt to understand themselves, express themselves to others and maintain a sense of continuity of self-identity,
have a need to attach themselves, and create a relationship, with an object or several objects, such as a job. Employees have a need
to interact with their job in order to explore, experience and construct meaning through self-expression within the job role. The job,
therefore acts as an extension of one’s self, communicating to the world ‘this is mine, this is me’. Employees have a need to achieve
continuity of the self within the job role. Employees find comfort in their relationship with their job should it indeed form part of who they
are.
Items HI SI SA HA Comments
1. I have a desire for my job to be an extension of me.
2. I need to understand who I am within my job role.
3. I need my job to be an expression of who I am.
4. I desire to explore my own identity within my job role
5. I desire to explore aspects of my job to discover if they
communicate ‘me’ to my colleagues.
Stellenbosch University https://scholar.sun.ac.za
Stellenbosch University https://scholar.sun.ac.za

357
Dimension 4: Need for a sense of belonging / having a home
Individuals need to feel ‘within’ and ‘a part of’ a place. ‘Home’ provides an element of safety as well as a mechanism for self-expression,
through self-invest. From a psychological perspective, objects that are considered ‘home’ are those objects that an individual has invested
themselves into emotionally and physically. Within the organisational context this refers to the need to find one’s ‘place’ and invest one’s
energy into a job that allows for personalisation and development of the self as well as a safe place for self-expression.
Items HI SI SA HA Comments
1. I have a desire to personalise my work space.
2. I have a desire to feel ‘at home’ in my job role.
3. I want my job to allow for self-expression.
4. I need to be able to invest ‘me’ in my job role.
Dimension 5: Need for self-efficacy and effectance
An individual’s need to be in control of their job and the ability to make changes within the job. It also refers to an individual’s need to
effectively interact with their environment and a need to make changes within that environment. The job is seen as an element that the
employee can control. Employees need to be the cause of outcomes within their job. Person-job interactions lead to the exercising of
control and subsequent changes to the environment, causing pleasure producing feelings.
Items HI SI SA HA Comments
1. I have a desire to take control of different aspects of
my job.
2. I want to be able to make changes within my job.
3. I have a desire to have the ability to control job
outcomes.
4. I have a desire to be resourceful and solve problems
within my job role.
5. I have a desire to know the part that I have played in a
job outcome.
Stellenbosch University https://scholar.sun.ac.za
Stellenbosch University https://scholar.sun.ac.za

358
APPENDIX 2
STELLENBOSCH UNIVERSITY
CONSENT TO PARTICIPATE IN RESEARCH
DEVEOPMENT AND EMPIRICAL TESTING OF A PSYCHOLOGICAL OWNERSHIP
STRUCTURAL MODEL
You are invited to participate in a research study conducted by Angela Lee, a Master of
Commerce student, from the Department of Industrial Psychology at the Faculty of
Economic and Management Sciences, Stellenbosch University. The results of this
research study will contribute towards the completion of the research component of the
thesis and consequently the completion of her studies. You were selected as a possible
participant in this study because the study requires an investigation into employees under
full-time employment, within different industries, within the borders of South Africa. Your
participation would be greatly appreciated, but is on a voluntary basis.
1. PURPOSE OF THE STUDY
In response to the research initiating question, why does variance in levels of
psychological ownership exist among different employees working in different
organisational contexts, the objective of this research study is to develop an
explanatory psychological ownership structural model, as well as to empirically test
the validity of the model. It is hoped that this model will provide a description of the
psychological mechanism that regulates the level of psychological ownership that
employees experience.
2. PROCEDURES
If you decide to participate in this research study, we would ask you to complete a
questionnaire. The questionnaire will be presented in an online format (that is mobile
device friendly). Access to either a smart device or personal computer and the internet
Stellenbosch University https://scholar.sun.ac.za

359
will be required. The questionnaire should take about 30 minutes to complete. Should
you not wish to continue (if you do not want to answer specific questions) you may exit
the questionnaire by closing the browser. There are no right or wrong answers and
there is also no time limit. Please set aside a quiet time and place to complete this
questionnaire and answer the questions as honestly as possible, bearing your current
job in mind. You can save and stop at any point in time and return to complete the
remaining questions later. Your responses will be captured electronically and
automatically stored for processing.
3. POTENTIAL RISKS AND DISCOMFORTS There are no foreseeable harmful risks for you as a participant. However, the
completion of the questionnaire will entail some of your time and energy.
4. POTENTIAL BENEFITS TO SUBJECTS AND/OR TO SOCIETY
All participants in this study will be eligible for an entry into a lucky draw to win one
mobile tablet. Other than this you as a participant may not directly benefit from
participation in this study. However, your participation could potentially greatly benefit
the field of Industrial Psychology. Your participation could help to generate
understanding surrounding feelings of ownership within the workplace.
The development of this model of psychological ownership will create a deeper
understanding of employees and how they experience psychological ownership at
work. This in turn could aid in the understanding of interventions (in terms of employee
wellness, incentives, job redesign and the like) aimed at increasing levels of
psychological ownership for employees, benefiting both the employees and the
organisation.
5. PAYMENT FOR PARTICIPATION
There is no offer of payment for participation in this study. This extends to both the
organisation and you as the participant.
6. CONFIDENTIALITY
Any information that is obtained in connection with this study and that can be identified
with you will remain confidential and will be disclosed only with your permission or as
required by law. Confidentiality will be maintained by several means, briefly described
below:
Stellenbosch University https://scholar.sun.ac.za

360
- Coding and access to questionnaire data
The questionnaires utilise a system that cleans the sending information. This
means that the researcher will not be able to identify the source of the
questionnaire data. You will additionally not be asked for any information that
directly links to your identity, such as your name or a physical address. The
information you supply will therefore be anonymous.
Should you wish to partake in the opportunity to win a smart device you may
complete a second survey after you have complete the Composite Job-based
psychological Ownership Questionnaire. This will not be linked to your survey
answers and will merely require you to provide your cellphone number.
Furthermore, the data received will only be accessible by Angela Lee, Professor
Theron and Mr Mariri of the Industrial Psychology Department at Stellenbosch
University. Any access to the data will be protected by the use of a password
protected computer to which access is restricted.
- Questionnaire results
Upon completion of the thesis information supplied to either the public, (the thesis
is available online via the Stellenbosch Library E-thesis portal) or to the
organisation, will only be supplied on an aggregate basis. This information is
supplied in order to uplift the research community, to inform organisational
interventions and to strengthen the body of knowledge available within the
academic field of Industrial Psychology.
7. PARTICIPATION AND WITHDRAWAL
It is your choice whether you wish to participate in this study. It would be of great value
if you chose to, but participation is purely voluntary. If you volunteer to be in this study,
you may withdraw at any time without negative consequences, to yourself, of any kind.
8. IDENTIFICATION OF INVESTIGATORS
If you have any questions or concerns about the research, please feel free to contact:
- Angela Lee on [email protected] or 082 607 1120
- Professor Callie Theron, at the department of Industrial Psychology, 021 8083009
Stellenbosch University https://scholar.sun.ac.za

361
- Mr Mariri, at the department of Industrial Psychology, 3008 or [email protected]
021 808 3008
9. RIGHTS OF RESEARCH SUBJECTS
You may withdraw your consent at any time and discontinue participation without
penalty. You are not waiving any legal claims, rights or remedies because of your
participation in this research study. If you have questions regarding your rights as a
research subject, contact Ms Maléne Fouché [[email protected]; 021 808 4622] at
the Division for Research Development, Stellenbosch University.
Stellenbosch University https://scholar.sun.ac.za

362
INFORMED CONSENT
After proper consideration please select the statement that applies to you.
I have read and understand the information that was provided to me surrounding
my participation in the psychological ownership research study. I would like to
participate and therefore voluntarily consent to further participation.
I have read and understand the information that was provided to me surrounding
my potential participation in the psychological ownership research study. I would
not like to participate.
Stellenbosch University https://scholar.sun.ac.za
363
APPENDIX 3
LETTER OF PERMISSION FOR RESEARCH STUDY
DEVEOPMENT AND EMPIRICAL TESTING OF A PSYCHOLOGICAL OWNERSHIP
STRUCTURAL MODEL
To whom it may concern,
Letter requesting permission for a research study to be conducting within your
organisation
Research into the complex psychological constructs that underpin the behaviour of
working man is necessary in order to understand the complex network of latent variables
that underpin employee behaviour. This will inevitably inform interventions geared towards
the effective and efficient use of society’s most precious resource – human capital. One
such complex construct within the network of latent variables underpinning behaviour of
working man is psychological ownership. Research shows several positive side effects of
the development and nurturing of levels of psychological ownership within the work place.
These include but are not limited to increased satisfaction, performance, tenure,
commitment and decreased levels of absenteeism.
In order to successfully develop and manage the levels of psychological ownership
experienced by employees within organisations, to aid in individual flourishing and ensure
optimal organisational performance, a valid understanding of the manner in which the
construct of psychological ownership is embedded in this complex nomological network
of latent variables is however critical. Only to the extent that the identity of the
determinants that directly and indirectly affect the level of psychological ownership that
employees experience and the manner in which they structurally combine in the
nomological network is validly understood would it allow HR management to rationally and
purposefully affect the well-being and work behaviour of employees and to develop
appropriate interventions to harness this psychological construct within the workplace.
Stellenbosch University https://scholar.sun.ac.za

364
Research surrounding the concept of psychological ownership therefore needs to address
some unanswered questions which refer to the processes by which psychological
ownership develops within an individual and a target becomes an inherent part of an
individuals identity. This, in turn, could improve organisational performance as well as
employee wellbeing.
We hereby request permission to conduct our research within your organisation. The
Psychological Ownership Questionnaire will be administered for the purpose of the study,
via the Stellenbosch University web-based e-Survey service [SUrveys]. The following link
will be distributed to the staff compliment made available:
www.psychologicalownershipsurvey.co.za
In order to protect the personal information of the employees of any participating
organisation, and comply with the Protection of Personal Information Act No 4, 2013, the
link will distributed by an internal staff member. The details of which should be filled in
below.
Participants can choose whether to be in this study or not. If they volunteer to be in this
study, they may withdraw at any time without consequences of any kind. Participants are
not waiving any legal claims, rights or remedies because of their participation in this
research study. No payment will be made to participants for taking part in this study. An
offer of eligibility for participation in a lucky draw will be provided to all participants to
potentially increase the response rate. Each participant’s cellphone number will be
required for participation in this lucky draw. However, they will have the option to enter it
or opt out (entry into the lucky draw is voluntary and will only be requested once the
questionnaire has been completed. So should a participant not wish to enter they do not
have to supply their details. Cellphone numbers entered will not be linked to
questionnaires completed. A second survey requesting merely a cellphone number will be
offered upon completion of the questionnaire. The researcher will randomly select one
number and only call the winner. Permission will be asked for the researcher to make
contact to obtain further delivery details. The other numbers will not be used in any way,
shape or form and will be deleted once the draw has been completed.
Any information that is obtained in connection with this study and that can be identified
with participants will remain confidential and will be disclosed only with their permission or
as required by law. Confidentiality will be maintained by means of a coding procedure,
restricting access to data and aggregating results. Furthermore, should the results of this
Stellenbosch University https://scholar.sun.ac.za

365
research study be used for publication in academic or peer reviewed journals
confidentiality will be maintained. Participant’s names will not be published.
If you have any questions or concerns about the research, please feel free to contact
Angela Lee ([email protected] / 082 607 1120) or Professor Callie Theron of the
Department of Industrial Psychology of Stellenbosch University ([email protected] /
0218083009).
We trust that you will kindly grant us the institutional permission to conduct the
psychological ownership study in your organisation. Thanking you in anticipation.
Yours sincerely
Angela Lee
Professor C Theron
Mr Mariri
Stellenbosch University https://scholar.sun.ac.za

366
PERMISSION FOR A RESEARCH STUDY TO BE CONDUCTED WITHIN OUR
ORGANISATION
The signature below hereby confirms that permission has been granted, by an authorised
signatory, for the research study: Development and empirical testing of a psychological
ownership structural model, to be conducted within our organisation. It is acknowledged
that this study is being conducted for academic purposes by Angela Lee, Professor
Theron117 and Mr Mariri118, from Stellenbosch University. It is additionally acknowledged
that any results provided will be supplied in an aggregate format and the data will be
collected anonymously.
Company name to remain anonymous: Yes No
Signed: ______________________ Print name & surname: _______________
Position: _____________________
Date: ________________________
Witnessed: ___________________ Print name & surname: ________________
Date: ________________________
Individual responsible for distributing the email link to participants:
Print name & surname: _________________________
Signature: ____________________ Date: __________________
117 Supervisor for this research study 118 Co-supervisor for this research study
Stellenbosch University https://scholar.sun.ac.za

APPENDIX 4 119
STELLENBOSCH UNIVERSITY CONSENT
TO PARTICIPATE IN RESEARCH
DEVELOPMENT AND EMPIRICAL TESTING OF A PSYCHOLOGICAL OWNERSHIP STRUCTURAL MODEL
You are invited to participate in a research study conducted by Angela Lee, a Master of Commerce student, from the Department of Industrial Psychology at the
Faculty of Economic and Management Sciences, Stellenbosch University. The results of this research study will contribute towards the completion of the research
component of the thesis and consequently the completion of her studies. You were selected as a possible participant in this study because the study requires an
investigation into employees under full-time employment, within different industries, within the borders of South Africa. Your participation would be greatly
appreciated, but is on a voluntary basis.
PURPOSE OF THE STUDY
In response to the research initiating question, why does variance in levels of psychological ownership exist among different employees working in different
organisational contexts, the objective of this research study is to develop an explanatory psychological ownership structural model, as well as to empirically test the
validity of the model. It is hoped that this model will provide a valid description of the psychological mechanism that regulates the level of psychological ownership
that employees experience.
PROCEDURES
If you decide to participate in this research study, we would ask you to complete a questionnaire. The questionnaire should take about 15 minutes to complete.
Should you not wish to continue (if you do not want to answer specific questions) you may exit the questionnaire by closing the browser. There are no right or wrong
answers and there is also no time limit. Please set aside a quiet time and place to complete this questionnaire and answer the questions as honestly as possible,
bearing your current job in mind. You can save and stop at any point in time and return to complete the remaining questions later. Your responses will be captured
electronically and automatically stored for processing.
POTENTIAL RISKS AND DISCOMFORTS
There are no foreseeable harmful risks for you as a participant. However, the completion of the questionnaire will entail some of your time and energy.
POTENTIAL BENEFITS TO SUBJECTS AND/OR TO SOCIETY
All participants in this study will be eligible for an entry into a lucky draw to win one Samsung Galaxy Tablet. Other than this, you as a participant may not directly
benefit from participation in this study. However, your participation could potentially greatly benefit the field of Industrial Psychology. Your participation could help to
generate understanding surrounding feelings of ownership within the workplace.
The development of this model of psychological ownership will create a deeper understanding of employees and how they experience psychological ownership at
work. This in turn could aid in the understanding of interventions (in terms of employee wellness, incentives, job redesign and the like) aimed at increasing levels of
psychological ownership for employees, benefiting both the employees and the organisation.
PAYMENT FOR PARTICIPATION
There is no offer of payment for participation in this study. This extends to both the organisation and you as the participant.
CONFIDENTIALITY
Any information that is obtained in connection with this study and that can be identified with you will remain confidential and will be disclosed only with your
permission or as required by law. Confidentiality will be maintained by several means, briefly described below:
Coding and access to questionnaire data:
The questionnaire utilizes a system that cleans the sending information. This means that the researcher will not be able to identify the source of the questionnaire
data. You will additionally not be asked for any information that directly links to your identity, such as your name or a physical address. The information you supply
will therefore be anonymous. Should you wish to partake in the opportunity to win a smart device you may complete a second survey after you have completed the
Composite Job-based psychological Ownership Questionnaire. This will not be linked to your survey answers and will merely require you to provide your cellphone
number.Furthermore, the data received will only be accessible by Angela Lee, Professor Theron and Mr Mariri of the Department of Industrial Psychology at
Stellenbosch University. Any access to the data will be protected by the use of a password protected computer to which access is restricted.
Questionnaire results:
Upon completion of the thesis information supplied to either the public, (the thesis is available online via the Stellenbosch Library E-thesis portal) or to the
organisation, will only be supplied on an aggregate basis. This information is supplied in order to uplift the research community, to inform organisational interventions
and to strengthen the body of knowledge available within the academic field of Industrial Psychology.
PARTICIPATION AND WITHDRAWAL
It is your choice whether you wish to participate in this study. It would be of great value if you chose to, but participation is purely voluntary. If you volunteer to be in
this study, you may withdraw at any time without negative consequences, to yourself, of any kind.
IDENTIFICATION OF INVESTIGATORS
If you have any questions or concerns about the research, please feel free to contact:
Angela Lee on [email protected] 082 607 1120
Professor Callie Theron, at the department of Industrial Psychology, 021 808 3009 or [email protected]
Mr Mariri, at the department of Industrial Psychology, 021 808 3008 or [email protected]
RIGHTS OF RESEARCH SUBJECTS
You may withdraw your consent at any time and discontinue participation without penalty. You are not waiving any legal claims, rights or remedies because of your
participation in this research study.
If you have questions regarding your rights as a research subject, contact Ms Maléne Fouché [[email protected]; 021 808 4622] at the Division for Research
Development, Stellenbosch University.
I have read and understand the information that was provided to me surrounding my participation in the psychological ownership research study. I would like to participate and therefore voluntarily consent to further participation.
I have read and understand the information that was provided to me surrounding my potential participation in the psychological ownership research study. I would not like to participate.
Stellenbosch University https://scholar.sun.ac.za

119 Please note that some formatting may differ from the online version.
Thank you for your willingness to complete this Composite Job-Based Psychological Ownership Survey. The below questions or statements cover information
pertaining to demographic information. This information will be used for statistical purposes only.
*Please indicate your age group from the drop down list. 71+
61-70
51-60
40-50
35-39
30-34
25-29
20-24
16-19
*Please indicate your race from the drop down list. Black
Coloured
Indian
White
Other
*Please indicate your gender from the drop down list. Female
Male
Other
*Please indicate your field of work/industry from the drop down list. Agriculture
Communications - Marketing/Advertising/PR
Construction
Education
Engineering
Finance
Government
Health and fitness
I work across industries
Mining and manufacturing
Retail
Telecommunications
Tourism
Transport
Sales
Other
*Please indicate your current job level from the drop down list. Entry level
Junior Management
Middle Management
Senior Management
Specialist
*Please indicate how long you have been with your current organisation from the list below.
Less than one year
1-2 years
3-5 years
6-10 years
11-15 years
Stellenbosch University https://scholar.sun.ac.za

16-25 years
More than 25 years
*Please indicate how long you have occupied your current job from the list below.
Less than one year
1-2 years
3-5 years
6-10 years
11-15 years
16-25 years
More than 25 years
*Please indicate you highest qualification achieved, from the drop down list. Matric
Diploma or certificate
Undergradaute degree
Post graduate diploma
Post graduate degree
Doctorate
Other
Stellenbosch University https://scholar.sun.ac.za
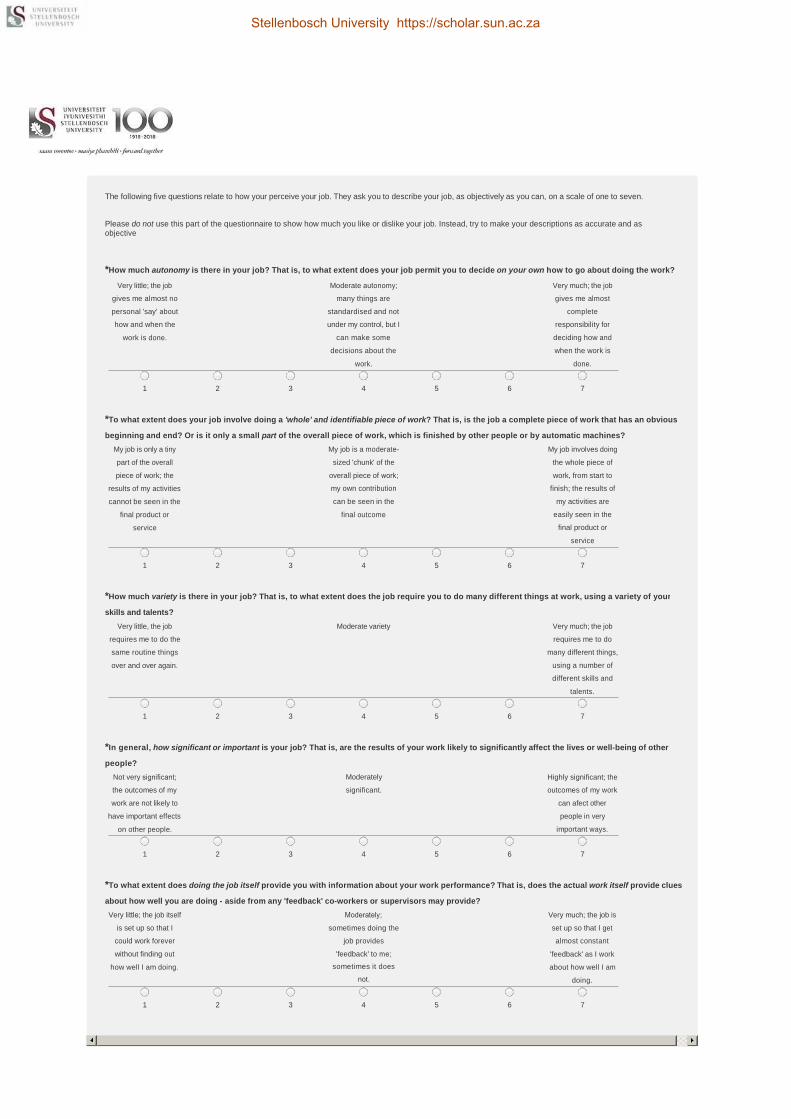
The following five questions relate to how your perceive your job. They ask you to describe your job, as objectively as you can, on a scale of one to seven.
Please do not use this part of the questionnaire to show how much you like or dislike your job. Instead, try to make your descriptions as accurate and as objective
as you possibly can.
*How much autonomy is there in your job? That is, to what extent does your job permit you to decide on your own how to go about doing the work?
Very little; the job
gives me almost no
personal 'say' about
how and when the
work is done.
Moderate autonomy;
many things are
standardised and not
under my control, but I
can make some
decisions about the
work.
Very much; the job
gives me almost
complete
responsibility for
deciding how and
when the work is
done.
1 2 3 4 5 6 7
*To what extent does your job involve doing a 'whole' and identifiable piece of work? That is, is the job a complete piece of work that has an obvious
beginning and end? Or is it only a small part of the overall piece of work, which is finished by other people or by automatic machines?
My job is only a tiny
part of the overall
piece of work; the
results of my activities
cannot be seen in the
final product or
service
My job is a moderate-
sized 'chunk' of the
overall piece of work;
my own contribution
can be seen in the
final outcome
My job involves doing
the whole piece of
work, from start to
finish; the results of
my activities are
easily seen in the
final product or
service
1 2 3 4 5 6 7
*How much variety is there in your job? That is, to what extent does the job require you to do many different things at work, using a variety of your
skills and talents?
Very little, the job
requires me to do the
same routine things
over and over again.
Moderate variety Very much; the job
requires me to do
many different things,
using a number of
different skills and
talents.
1 2 3 4 5 6 7
*In general, how significant or important is your job? That is, are the results of your work likely to significantly affect the lives or well-being of other
people?
Not very significant;
the outcomes of my
work are not likely to
have important effects
on other people.
Moderately
significant.
Highly significant; the
outcomes of my work
can afect other
people in very
important ways.
1 2 3 4 5 6 7
*To what extent does doing the job itself provide you with information about your work performance? That is, does the actual work itself provide clues
about how well you are doing - aside from any 'feedback' co-workers or supervisors may provide?
Very little; the job itself
is set up so that I
could work forever
without finding out
how well I am doing.
Moderately;
sometimes doing the
job provides
'feedback' to me;
sometimes it does
not.
Very much; the job is
set up so that I get
almost constant
'feedback' as I work
about how well I am
doing.
1 2 3 4 5 6 7
Stellenbosch University https://scholar.sun.ac.za
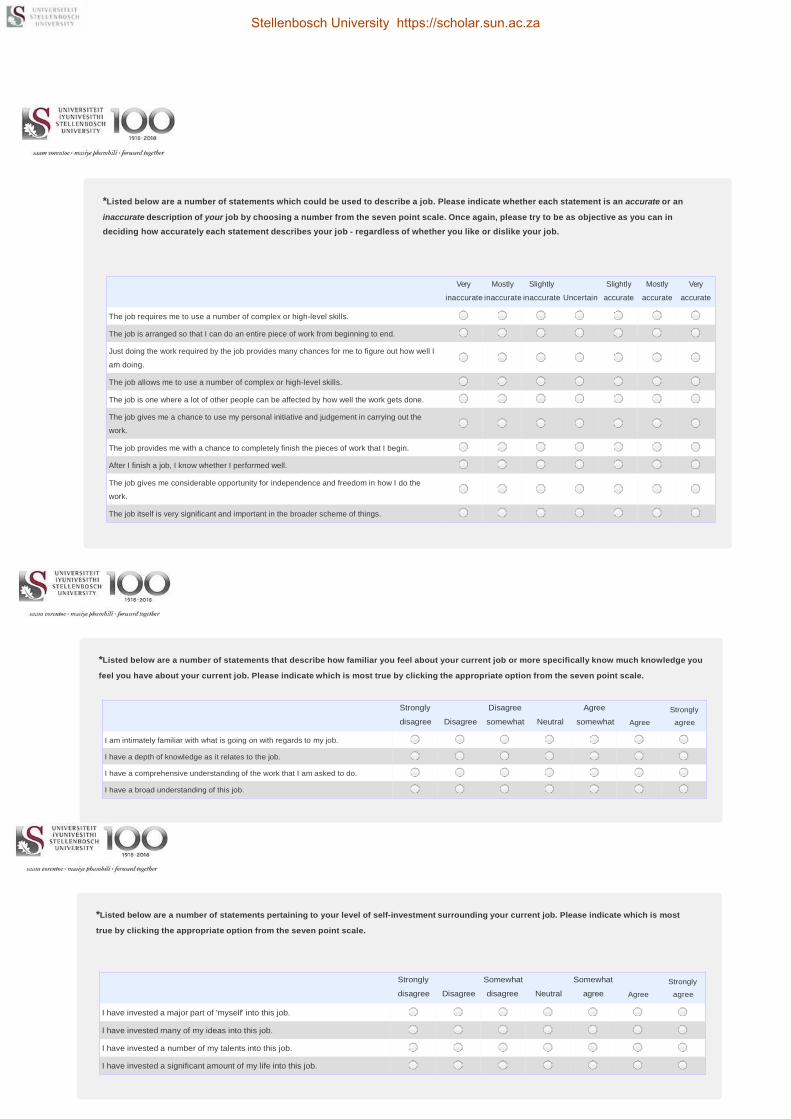
*Listed below are a number of statements which could be used to describe a job. Please indicate whether each statement is an accurate or an
inaccurate description of your job by choosing a number from the seven point scale. Once again, please try to be as objective as you can in
deciding how accurately each statement describes your job - regardless of whether you like or dislike your job.
Very Mostly Slightly Slightly Mostly Very
inaccurate inaccurate inaccurate Uncertain accurate accurate accurate
The job requires me to use a number of complex or high-level skills.
The job is arranged so that I can do an entire piece of work from beginning to end.
Just doing the work required by the job provides many chances for me to figure out how well I
am doing.
The job allows me to use a number of complex or high-level skills.
The job is one where a lot of other people can be affected by how well the work gets done.
The job gives me a chance to use my personal initiative and judgement in carrying out the
work.
The job provides me with a chance to completely finish the pieces of work that I begin.
After I finish a job, I know whether I performed well.
The job gives me considerable opportunity for independence and freedom in how I do the
work.
The job itself is very significant and important in the broader scheme of things.
*Listed below are a number of statements that describe how familiar you feel about your current job or more specifically know much knowledge you
feel you have about your current job. Please indicate which is most true by clicking the appropriate option from the seven point scale.
Strongly Disagree Agree Strongly
disagree Disagree somewhat Neutral somewhat Agree agree
I am intimately familiar with what is going on with regards to my job.
I have a depth of knowledge as it relates to the job.
I have a comprehensive understanding of the work that I am asked to do.
I have a broad understanding of this job.
*Listed below are a number of statements pertaining to your level of self-investment surrounding your current job. Please indicate which is most
true by clicking the appropriate option from the seven point scale.
Strongly Somewhat Somewhat Strongly
disagree Disagree disagree Neutral agree Agree agree
I have invested a major part of 'myself' into this job.
I have invested many of my ideas into this job.
I have invested a number of my talents into this job.
I have invested a significant amount of my life into this job.
Stellenbosch University https://scholar.sun.ac.za

*Listed below are a number of statements surrounding the control that you feel you have over your current job. Please indicate which is most true
by
clicking the appropriate option from the seven point scale.
To an
To a extremely
Somewhat moderate To some A great large
Not at all Very little little extent extent extent extent
To what extent do you have influence over the things that affect you on the job?
To what extent do you have input in deciding what tasks or parts of tasks you will do?
To what extent do you have the opportunity to take part in making job-related decisions
that affect you?
To what extent can you set your own work deadlines?
To what extent does your job allow you the opportunity for independent thought and
action?
To what extent do you control the pace and scheduling of your work?
Stellenbosch University https://scholar.sun.ac.za

*Listed below are a number of statements about personal needs that you may wish to fulfill through your job. Please indicate which is most true by
clicking the appropriate option from the seven point scale.
Strongly Disagree Agree Strongly
disagree Disagree somewhat Neutral somewhat Agree agree
I have a desire for my job to be an extension of me.
I need to understand who I am within my job role.
I need my job to be an expression of who I am.
I desire to explore my own identity within my job role.
I have a desire to personalise my work space.
I have a desire to feel "at home" in my job role.
I want my job to feel like 'familiar ground' to me.
I want my job to provide me with a sense of belonging.
I have a desire to take control of different aspects of my job.
I want to be able to make changes within my job.
I have a desire to have the ability to control job outcomes.
I have a desire to be resourceful and solve problems within my job
role.
Stellenbosch University https://scholar.sun.ac.za

*Listed below are a number of job outcomes. How good or bad, -3 being very bad and +3 being very good, are the following outcomes?
*If you personally engage with your job, in the sense that you psychologically and physically invest of yourself, on a scale
from one (extremely unlikely) to seven (extremely likely), how likely are the following outcomes?
1 2 3 4 5 6 7
Being intimately familiar with your job.
Experiencing your job as an extension of your self.
Having control over your job.
Having a depth of knowledge that relates to your job.
Your job defining who you are.
Having the ability to decide what tasks to do.
Having a broad understanding of your job.
Seeing your effort come to fruition in your job.
Having the ability to decide how things are done in your job
-3 -2 -1 0 1 2 3
Being intimately familiar with your job.
Experiencing your job as an extension of your self.
Having control over your job.
Having a depth of knowledge that relates to your job.
Your job defining who you are.
Having the ability to decide what tasks to do.
Having a broad understanding of your job.
Seeing your effort come to fruition in your job.
Having the ability to decide how things are done in your job.
*Do you wish to participate in the lucky draw to stand a chance to win a Samsung Galaxy Tablet?
Yes
No
Thank you for your time.
Stellenbosch University https://scholar.sun.ac.za