a comparative evaluation of empirical methods for
TRANSCRIPT

BEPLS Vol 3 [5] April 2014 100 | P a g e ©2014 AELS, INDIA
Bulletin of Environment, Pharmacology and Life Sciences Bull. Env. Pharmacol. Life Sci., Vol 3 (5) April 2014: 100-108 ©2014 Academy for Environment and Life Sciences, India Online ISSN 2277-1808 Journal’s URL:http://www.bepls.com CODEN: BEPLAD Global Impact Factor 0.533 Universal Impact Factor 0.9804
OORRIIGGIINNAALL AARRTTIICCLLEE
A Comparative Evaluation of Empirical Methods for Estimating Instantaneous Peak Flow (Case Study: Zafarqand Basin)
Mohammad Hosein Nassajian Zavareh1, Maryam Dashti Marvili2*, Seyyed Morteza Kazemi 3 1- Expert of Natural Resources and Watershed Management Main office in Isfahan province
2- Malayer Branch, Islamic Azad University, Malayer, Iran 3- Educated in civil Engeener in Islamic Azad University of Ardestan
ABSTRACT
Regarding the significance of estimating instantaneous peak flow discharge in catchment basin for watershed management studies, the present study is aimed to select the most appropriate method via making a comparison between empirical relationships. Here, Fuller's method, empirical rational relationships and curve number are used. Resulted data was calculated in return periods 10-, 2-, 50-, and 200-year in each sub-basin. Also, the water flow passing the bridge existing in each sub-basin was calculated as probable flow. This study was conducted for 32 sub-basins in Ardistan Province, Isfahan. Finally, to compare the empirical methods of estimating flow discharge in each sub-basin, SPSS Software was used for each return period at a time. Results demonstrated that no significant difference was observed between Fuller's method and rational technique yet a significant difference was observed between the rational method and curve number and between Fuller's method and curve number (p<0.05). In most cases, the estimation of curve number method was higher than Fuller's and Fuller's is higher than the rational method. Hence, it can be concluded that the greater the area of basin is, the greater the differences between rational and Fuller's method results will be. Key words: Ardestan, Empirical method, Instantaneous peak flow discharge Received 12/02/2014 Accepted 20/03/2014 ©2014 AELS, INDIA INTRODUCTION With the critical role water plays in environmental and economic issues in our country and the application of the science of hydrology across the land, annually severe floods happen in different parts of Iran. In hydrology, it is always required that the size of incidences is estimated in the places where no data is observed. For instance, the design of a watercourse in a highway and/or the design of overflow for a modified dam in a watercourse need the estimation of peak flow discharge in a certain period which there may not exist in respective statistical area. In this regard, domestic and foreign studies have been conducted some of which are implied here. In Greece, Mi Mi Ko (1990) showed that, in addition to average precipitation and area of the watershed, three major factors play a great role in the incidence of flood discharges: main watershed slope, the frequency of watercourses, and the index related to soil. Chive conducted researches on the simultaneous use of eye and gap. [2] Doing so, he gained considerable results regarding the control of scour. He observed that an eye with a diameter twice times the basis diameter can reduce scour depth as about %20, whereas if a gap with a width of 0.25b (or one fourth of the basis width) is also added then the scour depth will reach 0. Studying the data of flood in the South basins of Central Africa, Rodir concluded that the variables of runoff coefficient have been the most important effect regarding the basin's physiographic factors. Telvari has evaluated the efficiency of some empirical methods such as Kriger, Horton, and Fuller methods to estimate maximum flood flow discharge in Karkheh watershed, and concluded that Fuller's method is a suitable technique in estimating maximum flood discharge due to considering quantitative geomorphologic characteristics, vegetation and climate. [18] In a study on 10 watersheds in Azerbaijan zone and Northern Alborz, Yazdani examined maximum flood flow discharge using 7 methods. [17] Results indicated that among Kriger, Mayer, Horton, Brid and Mc Ilirt, SCS, graphic SCS, and FHWA for all basins under study, the graphic method and FHWA respectively have minimum and maximum error.

BEPLS Vol 3 [5] April 2014 101 | P a g e ©2014 AELS, INDIA
MATERIALS AND METHODS The Geographical Status of the Area under Study Ardistan Province (A=11591Km2) is located 118km from the Northeast of Isfahan Province's center. Ardistan Province is located N33'23 and E52'22 . Zafarqnad has 32 sub-basins. Methods To design the water structures in the areas where there is no hydrologic data to determine flood, many empirical formulae are offered by hydrologists corresponding to special areas. In this study, three methods are used: rational, Fuller, and curve number. First Method: Rational Relationship This method is applied for small basins and in particular in urban hydrology to commercially design drainage (Equation 1).
(1) Q: maximum flood M3/Sec
A: the area of basin taking part in flow Km2 I: shower intensity m.m/h
C: ground flow coefficient, from the table related to the American Association of Civil Engineering (ASCE) and Water Pollution Committee (WPCE) resulted from single showers Second Method: Fuller's Relationship This method is proposed for calculating maximum flood flow discharge with different return periods (Eq. 2 & 3). (2)
(3) q1: average maximum flow discharges in each year (annual overflow) based on statistical data q(t): maximum flood flow discharge with different return periods
qm: maximum instantaneous flow discharge Third Method: Estimating the Height of Runoff in Curve Number Method and NRCS In this method developed based on several observations in different well-known basins and in various American climates, the height of rain runoff is gained from the following equation which cannot be used for precipitations like snow and does not include basic water, as well [15, 16, 17, 18]. (Eq. 4).
(4)
Q: the height of runoff P: the height of precipitation in 24h S: maximum strength related to intercession and permeation into soil and ground reserve Recent studies show that a notation of 0.2 for S might be good for great showers in nonurban areas but it is too much for small and medium showers as well as urban areas. Sum of permeation amount for a rain incident can be as follow (Eq. 5 & 6):
(5)
For P>0.2S, the permeation intensity (f) is:
Where i is the rain intensity (i=dP/dt). Total loss or S is gained with a dimensionless factor called Curve Number (CN). Formula Field Studies Estimating Flow Discharge To estimate maximum by Maning's method, the watercourse intersection was required. To do so, in addition to rotation area, the field visit of the intersections of all respective watercourses was done. After surveying the height of points from the bottom of the watercourse up to the balance line (a line connecting the past floods hot waters) and the interval distances of the points, the data was entered into Auto CAD Software and the intersection of the intercourse was drawn. Using respective options, the area
AICQ ..278/0
)10log8/0)( 1 TqTq
Atqqm
66/21)(
Zavareh et al

BEPLS Vol 3 [5] April 2014 102 | P a g e ©2014 AELS, INDIA
of watercourse was estimated. In Figure (2) illustrates an example of the intersections drawn by the software.
Fig (2): drawing the watercourses' intersections by the aid of Auto CAD Software Estimating the Dimensions of Bridge Span For the sake of comparison regarding the existence of a rational relationship between maximum flow discharge and bridges' span, the dimensions of all bridges were collected. Estimating Concrete Compressive Strength To estimate the compressive strength of concrete used in bridges, three points of the bridge section was randomly beaten by Schmidt's hammer and average numbers gained was chosen as the compressive strength. Estimating the Presence and Absence of Scour To do so, during the field visit of respective area, most foundations were not exposed to scour and/or if they were the extent of scour was insignificant (except seven cases). The amount of their scour is presented in Table (1). Table (1): The amount of their scour in the foundations of bridges in the area under study
Number Code ) cm( amount of scour 1 100 5 2 103 5 3 105 10 4 107 10 5 108 4 6 109 6 7 126 5
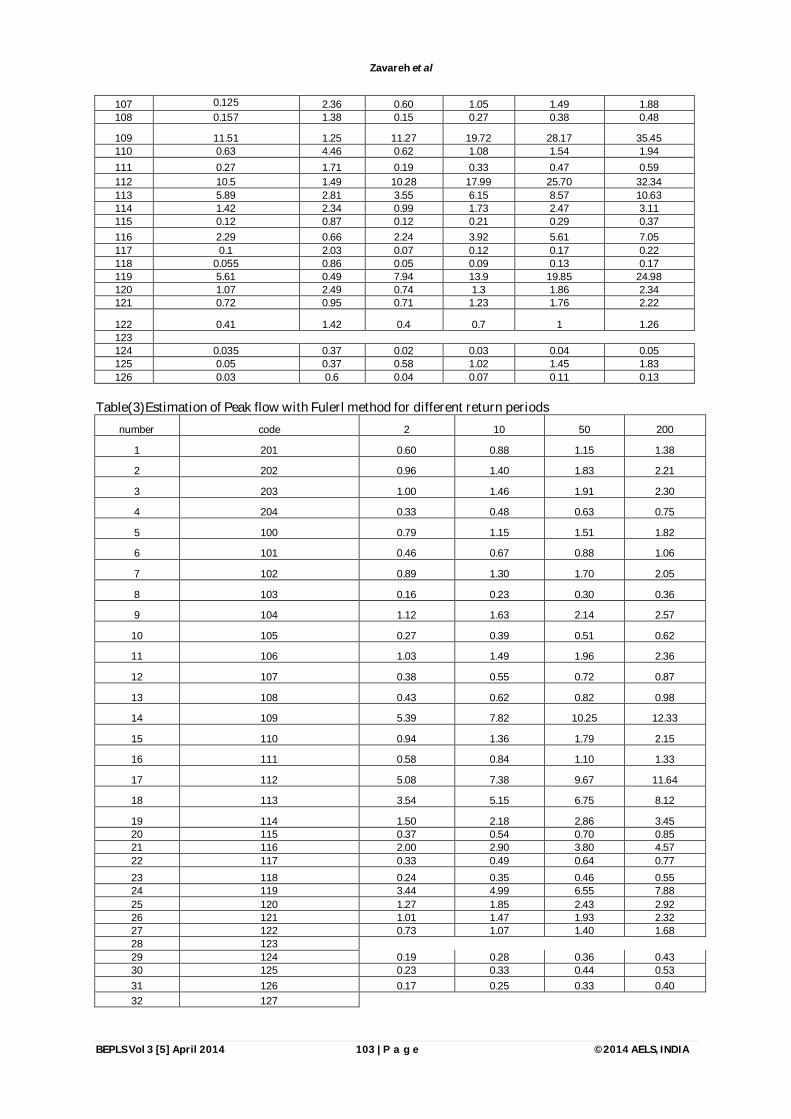
It must be noted that all topographic maps (scale=1:25000) were prepared from their respective offices in digital form and the surveyed points including bridges and respective watercourses were specified on them using Arc GIS and Arc View softwares. Since the empirical formulae are mainly based on the physiographic characteristics of basins, hence these characteristics were calculated for the area under study using GIS. Data Analysis In the present study, to compare the methods, data normalization was examined using Shapiro-Wilk. Since data was not normal, to make a total comparison, nonparametric Kruskal-wallis test was used and, in case of any differences (p<0.05), Mann-withney U test was used for two-by-two comparison. RESULTS After data collection, the probable floods in return periods 10-, 2-, 50-, and 200-year was calculated using Fuller, rational, curve number and Manning's methods. The methods were compared and the best one was chosen regarding the rational estimation of flood. Results of the above methods are presented in Tables (2-3-4-5). Table (2) Estimation of Peak flow with rational method for different return periods
Sub Basin
A(km2) Tc( hr) 2 10 50 200
201 0.29 1.01 0.28 0.50 0.71 0.89 202 0.66 1.55 0.65 1.13 1.62 2.03 203 0.71 2.48 0.49 0.86 1.23 1.55 204 0.097 2.30 0.07 0.12 0.17 0.21 100 0.47 0.84 0.46 0.81 1.15 1.45 101 0.18 1.95 0.13 0.22 0.31 0.39 102 0.58 1.56 0.40 0.71 1.01 1.27 103 0.025 2.53 0.02 0.03 0.04 0.05
104 0.86 0.28 1.22 2.13 3.04 3.83 105 0.0675 2.89 0.04 0.07 0.10 0.12 106 0.74 0.65 0.84 1.47 2.10 2.65
Zavareh et al
BEPLS Vol 3 [5] April 2014 103 | P a g e ©2014 AELS, INDIA
107 0.125 2.36 0.60 1.05 1.49 1.88 108 0.157 1.38 0.15 0.27 0.38 0.48
109 11.51 1.25 11.27 19.72 28.17 35.45 110 0.63 4.46 0.62 1.08 1.54 1.94 111 0.27 1.71 0.19 0.33 0.47 0.59 112 10.5 1.49 10.28 17.99 25.70 32.34 113 5.89 2.81 3.55 6.15 8.57 10.63 114 1.42 2.34 0.99 1.73 2.47 3.11 115 0.12 0.87 0.12 0.21 0.29 0.37 116 2.29 0.66 2.24 3.92 5.61 7.05 117 0.1 2.03 0.07 0.12 0.17 0.22 118 0.055 0.86 0.05 0.09 0.13 0.17 119 5.61 0.49 7.94 13.9 19.85 24.98 120 1.07 2.49 0.74 1.3 1.86 2.34 121 0.72 0.95 0.71 1.23 1.76 2.22
122 0.41 1.42 0.4 0.7 1 1.26 123 124 0.035 0.37 0.02 0.03 0.04 0.05 125 0.05 0.37 0.58 1.02 1.45 1.83 126 0.03 0.6 0.04 0.07 0.11 0.13
Table(3)Estimation of Peak flow with Fulerl method for different return periods
number code 2 10 50 200
1 201 0.60 0.88 1.15 1.38
2 202 0.96 1.40 1.83 2.21
3 203 1.00 1.46 1.91 2.30
4 204 0.33 0.48 0.63 0.75
5 100 0.79 1.15 1.51 1.82
6 101 0.46 0.67 0.88 1.06
7 102 0.89 1.30 1.70 2.05
8 103 0.16 0.23 0.30 0.36
9 104 1.12 1.63 2.14 2.57
10 105 0.27 0.39 0.51 0.62
11 106 1.03 1.49 1.96 2.36
12 107 0.38 0.55 0.72 0.87
13 108 0.43 0.62 0.82 0.98
14 109 5.39 7.82 10.25 12.33
15 110 0.94 1.36 1.79 2.15
16 111 0.58 0.84 1.10 1.33
17 112 5.08 7.38 9.67 11.64
18 113 3.54 5.15 6.75 8.12
19 114 1.50 2.18 2.86 3.45 20 115 0.37 0.54 0.70 0.85 21 116 2.00 2.90 3.80 4.57 22 117 0.33 0.49 0.64 0.77 23 118 0.24 0.35 0.46 0.55 24 119 3.44 4.99 6.55 7.88 25 120 1.27 1.85 2.43 2.92 26 121 1.01 1.47 1.93 2.32 27 122 0.73 1.07 1.40 1.68 28 123 29 124 0.19 0.28 0.36 0.43 30 125 0.23 0.33 0.44 0.53 31 126 0.17 0.25 0.33 0.40 32 127
Zavareh et al
BEPLS Vol 3 [5] April 2014 104 | P a g e ©2014 AELS, INDIA
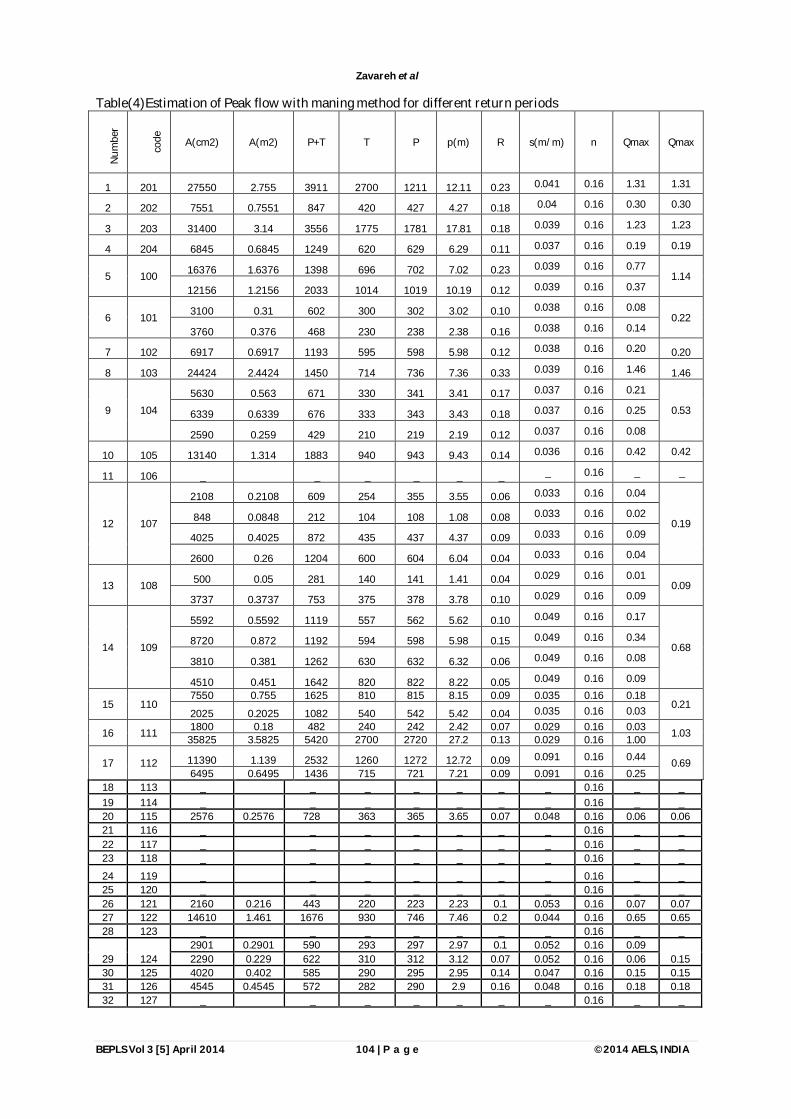
Table(4)Estimation of Peak flow with maning method for different return periods Nu
mbe
r
code
A(cm2) A(m2) P+T T P p(m) R s(m/m) n Qmax Qmax
1 201 27550 2.755 3911 2700 1211 12.11 0.23 0.041 0.16 1.31 1.31
2 202 7551 0.7551 847 420 427 4.27 0.18 0.04 0.16 0.30 0.30
3 203 31400 3.14 3556 1775 1781 17.81 0.18 0.039 0.16 1.23 1.23
4 204 6845 0.6845 1249 620 629 6.29 0.11 0.037 0.16 0.19 0.19
5 100 16376 1.6376 1398 696 702 7.02 0.23 0.039 0.16 0.77 1.14
12156 1.2156 2033 1014 1019 10.19 0.12 0.039 0.16 0.37
6 101 3100 0.31 602 300 302 3.02 0.10 0.038 0.16 0.08 0.22
3760 0.376 468 230 238 2.38 0.16 0.038 0.16 0.14
7 102 6917 0.6917 1193 595 598 5.98 0.12 0.038 0.16 0.20 0.20
8 103 24424 2.4424 1450 714 736 7.36 0.33 0.039 0.16 1.46 1.46
9 104 5630 0.563 671 330 341 3.41 0.17 0.037 0.16 0.21
0.53 6339 0.6339 676 333 343 3.43 0.18 0.037 0.16 0.25
2590 0.259 429 210 219 2.19 0.12 0.037 0.16 0.08
10 105 13140 1.314 1883 940 943 9.43 0.14 0.036 0.16 0.42 0.42
11 106 _ _ _ _ _ _ _ 0.16 _ _
12 107
2108 0.2108 609 254 355 3.55 0.06 0.033 0.16 0.04
0.19 848 0.0848 212 104 108 1.08 0.08 0.033 0.16 0.02
4025 0.4025 872 435 437 4.37 0.09 0.033 0.16 0.09
2600 0.26 1204 600 604 6.04 0.04 0.033 0.16 0.04
13 108 500 0.05 281 140 141 1.41 0.04 0.029 0.16 0.01 0.09
3737 0.3737 753 375 378 3.78 0.10 0.029 0.16 0.09
14 109
5592 0.5592 1119 557 562 5.62 0.10 0.049 0.16 0.17
0.68 8720 0.872 1192 594 598 5.98 0.15 0.049 0.16 0.34
3810 0.381 1262 630 632 6.32 0.06 0.049 0.16 0.08
4510 0.451 1642 820 822 8.22 0.05 0.049 0.16 0.09
15 110 7550 0.755 1625 810 815 8.15 0.09 0.035 0.16 0.18
0.21 2025 0.2025 1082 540 542 5.42 0.04 0.035 0.16 0.03
16 111 1800 0.18 482 240 242 2.42 0.07 0.029 0.16 0.03 1.03 35825 3.5825 5420 2700 2720 27.2 0.13 0.029 0.16 1.00
17 112 11390 1.139 2532 1260 1272 12.72 0.09 0.091 0.16 0.44 0.69 6495 0.6495 1436 715 721 7.21 0.09 0.091 0.16 0.25
18 113 _ _ _ _ _ _ _ 0.16 _ _ 19 114 _ _ _ _ _ _ _ 0.16 _ _ 20 115 2576 0.2576 728 363 365 3.65 0.07 0.048 0.16 0.06 0.06 21 116 _ _ _ _ _ _ _ 0.16 _ _ 22 117 _ _ _ _ _ _ _ 0.16 _ _ 23 118 _ _ _ _ _ _ _ 0.16 _ _
24 119 _ _ _ _ _ _ _ 0.16 _ _ 25 120 _ _ _ _ _ _ _ 0.16 _ _ 26 121 2160 0.216 443 220 223 2.23 0.1 0.053 0.16 0.07 0.07 27 122 14610 1.461 1676 930 746 7.46 0.2 0.044 0.16 0.65 0.65 28 123 _ _ _ _ _ _ _ 0.16 _ _
29 124 2901 0.2901 590 293 297 2.97 0.1 0.052 0.16 0.09
0.15 2290 0.229 622 310 312 3.12 0.07 0.052 0.16 0.06 30 125 4020 0.402 585 290 295 2.95 0.14 0.047 0.16 0.15 0.15 31 126 4545 0.4545 572 282 290 2.9 0.16 0.048 0.16 0.18 0.18 32 127 _ _ _ _ _ _ _ 0.16 _ _
Zavareh et al

BEPLS Vol 3 [5] April 2014 105 | P a g e ©2014 AELS, INDIA
Table (5) Estimating the maximum of discharge in Curve Number Method for different return periods
number code Tc(min) Tp (min) Tp (h) CN S (mm) P (mm) Q(mm) Q(cm) Qmax
(m3/s)
1 201 92.99 15.22 0.25 66.00 130.85 52.00 10.68 1.07 2.54
2 202 148.60 21.11 0.35 66.00 130.85 52.00 10.68 1.07 4.17
3 203 138.27 20.06 0.33 66.00 130.85 52.00 10.68 1.07 4.73
4 204 50.24 10.10 0.17 66.00 130.85 52.00 10.68 1.07 1.28
5 100 117.09 17.85 0.30 66.00 130.85 52.00 10.68 1.07 3.52
6 101 93.60 15.29 0.25 66.00 130.85 52.00 10.68 1.07 1.57
7 102 151.85 21.43 0.36 66.00 130.85 52.00 10.68 1.07 3.61
8 103 16.98 5.14 0.09 66.00 130.85 52.00 10.68 1.07 0.65
9 104 173.35 23.57 0.39 66.00 130.85 52.00 10.68 1.07 4.87
10 105 39.11 8.60 0.14 66.00 130.85 52.00 10.68 1.07 1.05
11 106 141.64 20.40 0.34 66.00 130.85 52.00 10.68 1.07 4.84
12 107 82.95 14.08 0.23 66.00 130.85 52.00 10.68 1.07 1.18
13 108 74.99 13.16 0.22 66.00 130.85 52.00 10.68 1.07 1.59
14 109 267.67 32.42 0.54 66.00 130.85 52.00 10.68 1.07 47.39
15 110 102.36 16.26 0.27 66.00 130.85 52.00 10.68 1.07 5.17
16 111 89.62 14.84 0.25 66.00 130.85 52.00 10.68 1.07 2.43
17 112 168.61 23.10 0.39 66.00 130.85 52.00 10.68 1.07 60.67
18 113 140.48 20.28 0.34 66.00 130.85 52.00 10.68 1.07 38.77
19 114 52.10 10.34 0.17 66.00 130.85 52.00 10.68 1.07 18.32
20 115 39.78 8.69 0.14 66.00 130.85 52.00 10.68 1.07 1.84 21 116 121.51 18.31 0.31 66.00 130.85 52.00 10.68 1.07 16.69 22 117 51.48 10.26 0.17 66.00 130.85 52.00 10.68 1.07 1.30 23 118 29.54 7.21 0.12 66.00 130.85 52.00 10.68 1.07 1.02
24 119 149.50 21.20 0.35 66.00 130.85 52.00 10.68 1.07 35.33
25 120 56.99 10.97 0.18 66.00 130.85 52.00 10.68 1.07 13.02 26 121 85.18 14.34 0.24 66.00 130.85 52.00 10.68 1.07 6.70 27 122 52.62 10.41 0.17 66.00 130.85 52.00 10.68 1.07 5.26 28 123 _ _ _ _ _ _ _ _ _ 29 124 22.19 6.04 0.10 66.00 130.85 52.00 10.68 1.07 0.77 30 125 36.00 8.16 0.14 66.00 130.85 52.00 10.68 1.07 0.82 31 126 19.99 5.67 0.09 66.00 130.85 52.00 10.68 1.07 0.71
32 127 _ _ _ _ _ _ _ _ Finally, to calculate maximum probable flow discharge based on the dimensions of the bridges' spans, the intersection required was calculated for the passage of maxim probable flood and maximum probable water velocity. The examination of suitable intersection of bridges for maximum flood flow discharge is presented in Table (6). Table (6): the number of bridges with suitable span dimensions in different return periods
the number of bridges with suitable span return periods
18 2
13 10 12 50 8 200
In studying the intersections of the bridges, 10 out of 32 basins in the area under study (codes: 106, 113, 114, 116, 117, 118, 119, 120, 123, 127) were omitted because of not having any specific basin and the 22
Zavareh et al

BEPLS Vol 3 [5] April 2014 106 | P a g e ©2014 AELS, INDIA
others were compared using Fuller, rational, curve number and Manning's methods with maximum flow discharge through bridges intersections and the results are presented in Diagrams (1), (2), (3), and (4).
Diagram (1): comparing maximum flow discharges in 2-year return period with maximum probable flow discharge
Diagram (2): comparing maximum flow discharges in 10-year return period with maximum probable
flow discharge
Diagram (3): comparing maximum flow discharges in 50-year return period with maximum probable
flow discharge
Zavareh et al

BEPLS Vol 3 [5] April 2014 107 | P a g e ©2014 AELS, INDIA
Diagram (4): comparing maximum flow discharges in 200-year return period with maximum probable flow discharge DISCUSSION AND CONCLUSION Regarding the above diagrams, it can be concluded that the significant differences between estimations in basins 108 and 111 is due to very low concentration time. The simultaneous increase of watercourse length and reduction of height difference and the reduction of slope lead to the reduction of concentration time using Makcus method. Based on the abovementioned, following results can be implied: curve number method is highly sensitive to area factor so that, in basins with over 50 acre area, the estimation is too large and most of the time illogical. In most cases, curve number's estimation is more than Fuller’s and the Fuller's one is more than the rational method estimation. Results of Fuller and rational method are close in most cases. The larger the area of basin is, the further the differences of results from the two methods will be. Based on the results of the number of bridges with suitable span dimensions in different return periods, it seems that in most cases the span dimensions were calculated based on Maning' method and determined as suitable. Whereas results of rational method, curve number and Fuller are higher estimations. There was no significant difference between rational and Fuller method yet the difference was significant between rational and curve number methods as well as Fuller and curve number methods (p<0.05). The results of estimating the concrete compressive strength of the bridges using Schmidt's hammer demonstrate that the existing concrete has adequate strength against the compressive forces from live and dead loads. Also, using the hammer for estimation was in a non-destructive form the results of which are not reliable and definite. Yet, they are considered as criterion for estimating strength. Another important issue is concrete durability in melt-freeze cycles and minerals like sulfates. In most cases, concrete surface cracks and armature corrosion is observed. About %22 of bridges are exposed to mild scour which, with respect to the deep foundations of bridges, it does not seem that such scours lead to any problems by posing sub-pressure forces. Frequently, the estimation by curve number method is more than Fuller's and Fuller's is more than the rational method, so it can be concluded that the greater the area of basin is, the greater the difference between the results of rational and Fuller's methods will be. [12] Also concluded that Fuller's method is the best for estimating maximum flood flow discharge in most sub-basins of the area under study with respect to quantitative geomorphologic qualities, vegetation, and climate. REFERENCES 1. Campbell, A.J., and R.C. Sidle. 1984 : prediction of peak flows on small watersheds in orgeon for use in culvert
design. Water resource Bulletin, 20:1,P:9-14 2. Chiew, Y.M., 1992 : Scour protection at bridge piers. J,Hyd.Eng.,Asce,Vol.118, No.11, pp. 1260-1269. 3. Hjorth, P, 1975: Studies on the nature of local scour, Department of Water Research Engenering , lund .Inst. of
Technology, Bulletin seriesA,No.46, 4. Hockiss,R.H., and B.E.Mc Callum.1995: peak discharge for small agricultural watersheds .J. Hydraulic
Eng.121(1),P:36-48S 5. Jones, J. S., Kilgore, R.T. and Mistichell ,M.P., 1992: Effects of footing location on bridge pier scour,
J,Hyd.Eng.,Asce,Vol.118, No.2, pp. 280-289 6. Kao S.E., Fogel M.M., Resnck S.D., 1973: Effect of urbanization runoff form small watershed, In: Proceeding of the
1973 Meeting Arizona Section, Arizona Academy of Science (3), 86-91. 7. Melville, B. W. and Raudkivi, A.J., 1996: Effect of foundation Geometry on bridge pier scour ,
J,Hyd.Eng.,Asce,Vol.22, No.4, pp. 203-209, 8. Miller.J.B., and M.D.nNewson.1975: flood estimation from catchment characteristics .Proc. flood studies
conference London,p:57-61
Zavareh et al

BEPLS Vol 3 [5] April 2014 108 | P a g e ©2014 AELS, INDIA
9. Mimiko ,M.1990: Regional analysis of hydrol;ogical variables in Greece,In: Regionalization in hydrology.Ed:bern.M.A. and Brilly.M.and Beiker, A.& Bonacci, O.Land publication190, p:195-202
10. Parola , A. C., Mahdavi , S.K., Brwan, B.W. and Khouri, A. E., 1996: effect of rectangular foundation geometry on local pier scour , J,Hyd.Eng.,Asce,Vol.122, No.1, pp. 35-40
11. Raudkivi,.A J.,and Ettema, R., 1983: Clear-water scour at cylindrical piers. J. hydr. Engrg., ASCE, 109(3), 338-350 12. Riggs.HC.1990: estimating flow characteristics at gauged site IAHS publication,NO.190,PP:159-170 13. Sing, K. K., Verma, V. S., and Tiwar, N. I., 1995: Scour protection at circular bridge pier, 6th International
symposium on river sedimentation, New delhi , India . 14. Sadeghi, S.H.R, Singh, J.K. and Das, G. 2000: Rainfall - runoff relationship for Amameh water- shed in Iran, In:
Proceedings of International Conference on Integrated Water Resources Management for Sustainable Development, India: 796-804.
15. Das, G. 2000: Hydrology and soil conservation engineering, Prentice Hall of India, Pp 70-75. 16. Mishra S. K. Tyaghij.v. Singh R. 2006: SCS- CN based modeling of sediment yield. Journal of hydrology.301 -322 17. Walker, S.E. and Hawkins, R.H. 2003:Application of the SCS curve number method to Investigation of curve
number procedure, Journal of Irrigation and Drainage Engineering, 117(6):911-917 18. National Engineering Handbook, Section 4 (NEH-4). 1986. US Department of Agriculture, p 7.2-10.25. Citation of this article Mohammad H. N. Z, Maryam D. M., Seyyed M. K.A Comparative Evaluation of Empirical Methods for Estimating Instantaneous Peak Flow (Case Study: Zafarqand Basin).Bull. Env. Pharmacol. Life Sci., Vol 3 (5) April 2014: 100-108
Zavareh et al