modification, elaboration and empirical evaluation
TRANSCRIPT

MODIFICATION, ELABORATION AND EMPIRICAL EVALUATION OF THE
BEYERS EMOTIONAL INTELLIGENCE AND TRANSFORMATIONAL
LEADERSHIP MODEL
Thesis presented in fulfilment of the requirements for the degree of
MCOMM (HRM)
INDUSTRIAL PSYCHOLOGY
AT
STELLENBOSCH UNIVERSITY
CHENé ROUX
SUPERVISOR: DR G GöRGENS
March 2016
ii
DECLARATION
By submitting this thesis electronically, I declare that the entirety of the work contained
therein is my own, original work, that I am the sole author thereof (save to the extent
explicitly otherwise stated), that reproduction and publication thereof by Stellenbosch
University will not infringe any third party rights and that I have not previously in its entirety or
in part submitted it for obtaining any qualification.
Signed: Chené Roux Date: March 2016
Copyright © 2016 Stellenbosch UniversityAll rights reserved
Stellenbosch University https://scholar.sun.ac.za

iii
ABSTRACT
This origin of this study lies in the importance of leadership in organisations. The
behaviour of individuals in leadership positions affects the attitudes and performance
of employees, and therefore, also the overall effectiveness and success of the
organisation. Understanding which factors contribute to effective leadership is
therefore critical, so that employee performance and organisational success can be
enhanced.
A construct that has received increased attention with regard to effective leadership
is Emotional Intelligence (EI). It has been argued that leaders with a higher EI are
more effective than leaders with a lower EI. Beyers (2006) examined the relationship
between EI and leadership (more specifically, the Transformational Leadership
style). The present study aimed to expand on the work of Beyers by using a more
recent model and measurement of EI. Furthermore, three constructs were assessed
as outcomes of effective leadership (Perceived Supervisor Support, Organisational
Commitment and Job Satisfaction). Leadership has been shown to be an antecedent
of these three constructs. It was argued that gaining insight into the outcomes of
effective leadership, as experienced by the follower of a particular leader that
exhibits certain transformational leadership behaviours being influenced by various
EI competencies, could hold important positive outcomes for an organisation (i.e.
better employee performance and retention rates).
The results of the study confirmed that EI affects Transformational Leadership (TFL)
behaviours. Only one dimension of TFL was found to be associated with one of the
three outcomes of effective leadership (i.e. Perceived Supervisor Support). The
relationships between the three outcomes were also tested, and the only significant
path was from Organisational Commitment to Job Satisfaction. Reflecting on these
results, the study concludes with a discussion of the limitations of the study, as well
as recommendations for future research.
Stellenbosch University https://scholar.sun.ac.za

iv
OPSOMMING
Die oorsprong van hierdie studie lê in die belangrikheid van leierskap in
organisasies. Individue in leierskapposisies se gedrag beinvloed die houdings en
prestasies van werknemers en derhalwe ook die algehele doeltreffendheid en
sukses van die organisasie. Begrip van watter faktore bydra tot effektiewe leierskap
is dus van kardinale belang om sodoende werknemer prestasie en organisasie
sukses te verbeter.
Emosionele Intelligensie (EI) is `n konstruk wat toenemende aandag ontvang ten
opsigte van effektiewe leierskap. Dit word aangevoer dat leiers met `n hoër EI meer
effektief is as leiers met `n laer EI. Beyers (2006) het die verhouding tussen EI en
leierskap (meer spesifiek die Transformasionele Leierskap styl) ondersoek. Die
huidige studie het dit ten doel gehad om uit te brei op die werk van Beyers deur die
gebruik van 'n meer onlangse model en meting van EI. Verder was drie konstrukte
geassesseer as uitkomste van effektiewe leierskap (Waargenome Toesighouer
Ondersteuning, Organisasie-toegewydheid en Werksbevrediging). Dit blyk dat
Leierskap `n determinant van hierdie drie konstrukte is. Dit was aangevoer dat om
insig in te win in die resultate van EI soos ondervind deur die volgeling van ‘n
spesifieke leier wie sekere Transformasionele Leierskap gedrag openbaar, wat
beïnvloed is deur verskeie EI vaardighede, kan belangrike positiewe uitkomste tot
gevolg hê vir die organisasie (naamlik beter werknemer prestasie en verhoogde
retensie syfers).
Die resultate van die studie het bevestig dat Transformasionele Leierskapsgedrag
beinvloed word deur Emosionele Intelligensie. Slegs een dimensie van
Transformasionele Leierskap het verband gehou met een van die drie uitkomste van
effektiewe leierskap (naamlik Waarneembare Toesighouer Ondersteuning). Die
verhoudings tussen die drie uitkomste is ook getoets, en die enigste beduidende
verwantskap was tussen Organisatoriese toegewydheid en Werksbevrediging. Ter
nabetraging van hierdie resultate, is die studie voltooi met n bespreking van die
beperkinge van die studie, sowel as aanbevelings vir toekomstige navorsing.
Stellenbosch University https://scholar.sun.ac.za

v
ACKNOWLEDGEMENTS
I’d like to thank the following people who were a part of this journey over the last few
years:
• My supervisor, Dr Gina Görgens, for your guidance, patience, criticism and
advice.
• Prof. Martin Kidd, for your patience and assistance with the statistical
analysis.
• Prof Callie Theron for your advice and input into this study.
• To all the participants for your willingness and time to complete the
questionnaires.
• Odille Duncan, Lucy van der Merwe, Judy Wyngaard, Dillan Beukes and Silke
Joseph for your encouragement, friendship and prayer.
• My parents and Charlton for the constant moral support.
• Most importantly…Thank you, heavenly Father. It’s all by grace that I got this
far.
Stellenbosch University https://scholar.sun.ac.za

vi
Table of Contents
DECLARATION .....................................................................................................................ii
ABSTRACT ........................................................................................................................... iii
OPSOMMING ....................................................................................................................... iv
ACKNOWLEDGEMENTS ..................................................................................................... v
LIST OF FIGURES ............................................................................................................... x
LIST OF TABLES .................................................................................................................. xi
CHAPTER 1: INTRODUCTION ............................................................................................. 1
1.1 Introduction ................................................................................................................. 1
1.1.1 Research aim, question and objectives ................................................................ 3
1.1.2 Structure of the thesis ........................................................................................... 4
CHAPTER 2: THEORETICAL FRAMEWORK OF THIS RESEARCH ................................... 5
2.1 Introduction ................................................................................................................. 5
2.2. Leadership ................................................................................................................. 5
2.2.1 General Background ............................................................................................. 5
2.2.2 Leadership defined ............................................................................................... 6
2.2.3 Brief discussion of leadership theories and/or styles ............................................. 7
2.2.4 Transformational Leadership .............................................................................. 10
2.2.4.1 Individualised Consideration ......................................................................... 11
2.2.4.2 Inspirational Motivation ................................................................................. 12
2.2.4.3 Intellectual Stimulation .................................................................................. 12
2.2.4.4 Idealised Influence ........................................................................................ 12
2.2.5 The Value of TFL ................................................................................................ 13
2.3 Outcomes of Effective Leadership ............................................................................. 16
2.3.1 Job Satisfaction .................................................................................................. 16
2.3.1.1 Conceptualising Job Satisfaction .................................................................. 16
2.3.1.2 Antecedents and Outcomes of Job Satisfaction ............................................ 17
2.3.2 Organisational Commitment ............................................................................... 21
2.3.2.1 Conceptualising Organisational Commitment ............................................... 21
2.3.2.2 General Antecedents and Outcomes of Organisational Commitment ........... 22
2.3.3 Perceived Supervisor Support ............................................................................ 23
2.3.3.1 Conceptualising Perceived Supervisor Support ............................................ 24
2.3.3.2 General antecedents and outcomes of Perceived Supervisor Support ......... 25
2.3.4 Relationships between Job Satisfaction, Organisational Commitment, and
Perceived Supervisor Support ..................................................................................... 27
2.3.5 Relationships between TFL and outcomes of effective leadership ...................... 28
Stellenbosch University https://scholar.sun.ac.za

vii
2.4 Emotional Intelligence ............................................................................................... 32
2.4.1 Definition and General Background .................................................................... 32
2.4.2 Brief Discussion of EI Models and Measurement ................................................ 34
2.4.2.1 MSCEIT (Mayer-Salovey-Caruso Emotional Intelligence Test) ..................... 34
2.4.2.2 ECI (Emotional Competence Inventory) (Boyatzis, Goleman & HayGroup,
2001) ........................................................................................................................ 35
2.4.2.3 Bar-On EQ-i (Emotional Quotient Inventory) (Bar-On, 1997) ........................ 35
2.4.2.4 Emotional Intelligence Scale (EIS) ................................................................ 36
2.4.3 Dimensions of the Emotional and Social Competency Inventory (ESCI) ............. 36
2.4.3.1 Self-awareness ............................................................................................. 37
2.4.3.2 Self-management ......................................................................................... 37
2.4.3.3 Social Awareness ......................................................................................... 37
2.4.3.4 Relationship Management ............................................................................ 37
2.4.4 The Value of EI in the Workplace ....................................................................... 37
2.4.5 The relationship between EI and TFL ................................................................. 39
2.5 The modified and elaborated Beyer’s (2006) conceptual model proposed for this study
........................................................................................................................................ 45
2.5.1 Beyer’s (2006) EI and TFL conceptual model ..................................................... 46
2.5.2 Proposed modifications and elaborations of the Beyer’s model ..................... 48
2.6 Summary ................................................................................................................... 57
CHAPTER 3: RESEARCH METHODOLOGY ..................................................................... 58
3. 1 Introduction .............................................................................................................. 58
3.2 Research Purpose..................................................................................................... 58
3.3 Research Aim, Question and Objectives ................................................................... 59
3.4 Research Hypotheses ............................................................................................... 59
3.5 Research Design and Procedure ............................................................................... 61
3.5.1 Research Design ................................................................................................ 61
3.5.2 Sampling design, data collection and ethical considerations ............................... 61
3.5.3 Sample characteristics ....................................................................................... 63
3.5.4 Data Analysis ..................................................................................................... 67
3.5.4.1 Item analysis................................................................................................. 67
3.5.4.2 Structural Equation Modeling (SEM) ............................................................. 68
3.5.4.3 Partial Least Square (PLS) ........................................................................... 70
3.6 Measurement Instruments ......................................................................................... 72
3.6.1 Emotional Intelligence ........................................................................................ 72
3.6.2 Transformational Leadership .............................................................................. 75
Stellenbosch University https://scholar.sun.ac.za

viii
3.6.3 Outcomes of Effective Leadership ...................................................................... 75
3.6.3.1 Perceived Supervisor Support ...................................................................... 75
3.6.3.2 Job Satisfaction ............................................................................................ 76
3.6.3.3 Organisational Commitment ......................................................................... 76
3.7 Summary ................................................................................................................... 76
CHAPTER 4: RESEARCH RESULTS ................................................................................. 77
4. 1 Introduction .............................................................................................................. 77
4.2 Validating the Measurement Instruments .................................................................. 77
4.2.1 Item Analysis ...................................................................................................... 77
4.2.1.1 Transformational Leadership ........................................................................ 77
4.2.1.1.1 Individualised Consideration ................................................................. 78
4.2.1.1.2 Idealised Influence ................................................................................ 79
4.2.1.1.3 Intellectual Stimulation .......................................................................... 80
4.2.1.1.4 Inspirational Motivation ......................................................................... 81
4.2.1.2 Emotional Intelligence (EI) ............................................................................ 82
4.2.1.2.1 Relationship Management .................................................................... 82
4.2.1.2.2 Self-awareness ..................................................................................... 84
4.2.1.2.3 Self-management ................................................................................. 86
4.2.1.2.4 Social Awareness ................................................................................. 88
4.2.1.3 Job Satisfaction (JS) ..................................................................................... 90
4.2.1.4 Organisational Commitment (OC) ................................................................. 91
4.2.1.5 Perceived Supervisor Support (PSS) ............................................................ 92
4.3 PLS Results: Validating the Measurement (Outer) Model .......................................... 93
4.3.1 Reliability Analysis .............................................................................................. 93
4.3.2 Discriminant Validity ........................................................................................... 94
4.3.3 Evaluating the outer loadings ............................................................................. 98
4.4 PLS Results: Validating the Structural (Inner) Model ............................................... 105
4.5 Interpreting the proposed hypotheses ..................................................................... 109
4.6 Summary ................................................................................................................. 115
CHAPTER 5: DISCUSSION .............................................................................................. 116
5. 1 Introduction ............................................................................................................ 116
5.2 Emotional Intelligence ............................................................................................. 116
5.3 EI and TFL .............................................................................................................. 118
5.4 TFL and outcomes of effective leadership ............................................................... 122
5.5 Relationship between the Outcomes of Effective Leadership .................................. 126
5.6 Practical Implications ............................................................................................... 127
Stellenbosch University https://scholar.sun.ac.za
ix
5.7 Limitations of the Study ........................................................................................... 129
5.8 Recommendations for Future Research .................................................................. 130
5.9 Conclusion .............................................................................................................. 130
REFERENCE LIST ........................................................................................................... 132
APPENDIX ONE: CONSENT FORM ................................................................................ 155
APPENDIX TWO: SUBORDINATES INFORMED CONSENT FORM ............................... 157
APPENDIX THREE: SUPERVISORS INFORMED CONSENT FORM .............................. 160
Stellenbosch University https://scholar.sun.ac.za

x
LIST OF FIGURES
Figure 2.1. Personal leadership as a mediator of professional leadership and willing cooperation ......................... 8
Figure 2.2. Hackman and Oldham’s (1976) Job Characteristics Model ................................................................ 18
Figure 2.3. The initial proposed Beyers (2006) model ........................................................................................... 47
Figure 2.4. The summarised conceptual model of significant relationships .......................................................... 48
Figure 2.5. Proposed conceptual (structural) model for this study ........................................................................ 57
Figure 3.1. A two-step process of PLS path model assessment...……………………………………...……………..70
Figure 4.1. PLS results for the Structural Model………………..………………………………………………….…..108
Stellenbosch University https://scholar.sun.ac.za

xi
LIST OF TABLES
Table 2.1 Transformational and Transactional Leadership ..................................................................................... 9
Table 2.2 The Bar-On EQ-i scales and what they assess ..................................................................................... 35
Table 2.3 Conceptual Overlap between Goleman’s Emotional Intelligence Framework and the ESCI ................. 49
Table 3.1 Supervisors: Gender ............................................................................................................................. 63
Table 3.2 Supervisors: Age ................................................................................................................................... 63
Table 3.3 Supervisors: Highest Qualification ........................................................................................................ 64
Table 3.4 Supervisors: Marital Status ................................................................................................................... 64
Table 3.5 Supervisors: First Language ................................................................................................................. 64
Table 3.6 Supervisors: Second Language ............................................................................................................ 64
Table 3.7 Supervisors: Ethnic Group .................................................................................................................... 65
Table 3.8 Subordinates: Gender ........................................................................................................................... 65
Table 3.9 Subordinates: Age Distribution .............................................................................................................. 65
Table 3.10 Subordinates: Highest Qualification .................................................................................................... 66
Table 3.11 Subordinates: Marital Status ............................................................................................................... 66
Table 3.12 Subordinates: First Language ............................................................................................................. 66
Table 3.13 Subordinates: Second Language ........................................................................................................ 67
Table 3.14 Subordinates: Ethnic Group ................................................................................................................ 67
Table 3.15 Comparison between PLS and CBSEM Approaches .......................................................................... 69
Table 3.16 ESCI competency clusters and definitions .......................................................................................... 73
Table 3.17 Cronbach’s Alpha Reliability for ESCI Competencies ......................................................................... 74
Table 4.1 The means, standard deviation and reliability statistics for TFL (supervisors) ...................................... 77
Table 4.2 The means, standard deviation and reliability statistics for TFL (Subordinates) .................................... 78
Table 4.3 Supervisors: Item statistics for Individualised Consideration Subscale ................................................. 78
Table 4.4 Subordinates: Item statistics for Individualised Consideration Subscale ............................................... 79
Table 4.5 Supervisors: Item Statistics for Idealised Influence Subscale ............................................................... 80
Table 4.6 Subordinates: Item Statistics for Idealised Influence Subscale ............................................................. 80
Table 4.7 Supervisors: Item Statistics for Intellectual Stimulation Subscale ......................................................... 81
Table 4.8 Subordinates: Item Statistics for Intellectual Stimulation Subscale ....................................................... 81
Table 4.9 Supervisors: Item Statistics for Inspirational Motivation Subscale ......................................................... 82
Table 4.10 Subordinates: Item Statistics for Inspirational Motivation Subscale .................................................... 82
Table 4.11 Supervisors: Item statistics for Relationship Management Subscale .................................................. 83
Table 4.12 Subordinates: Item statistics for Relationship Management Subscale ................................................ 84
Table 4.13 Supervisors: Item statistics for Self-awareness Subscale ................................................................... 85
Table 4.14 Subordinates: Item statistics for Self-awareness Subscale ................................................................. 86
Table 4.15 Supervisors: Item statistics for Self-Management Subscale ................................................................ 87
Table 4.16 Subordinates: Item statistics for Self-Management Subscale ............................................................. 87
Table 4.17 Supervisors: Item statistics for Social awareness Subscale ................................................................ 89
Table 4.18 Subordinates: Item statistics for Social awareness Subscale .............................................................. 89
Table 4.19 The means, standard deviation and reliability statistics for Emotional Intelligence (Subordinates) ..... 89
Table 4.20 The means, standard deviation and reliability statistics for Emotional Intelligence (Supervisors) ....... 90
Table 4.21 The mean, standard deviation and reliability statistic for Job Satisfaction (Subordinates) .................. 90
Table 4.22 Item statistics for Job Satisfaction scale .............................................................................................. 91
Stellenbosch University https://scholar.sun.ac.za

xii
Table 4.23 The mean, standard deviation and reliability statistic for OC (Subordinates) ...................................... 91
Table 4.24 Item statistics for Organisational Commitment Subscale .................................................................... 91
Table 4.25 The mean, standard deviation and reliability statistic for PSS (Subordinates) .................................... 92
Table 4.26 Item statistics for Perceived Supervisor Support scale ....................................................................... 93
Table 4.27 Composite Reliability, Cronbach's Alpha, and AVE ............................................................................. 93
Table 4.28 Discriminant Validity (Heterotrait-Monotrait ratio) ................................................................................ 95
Table 4.29 PLS-SEM Outer Loadings: TFL ........................................................................................................... 98
Table 4.30 PLS-SEM Outer Loadings: TFL after the deletion of the IS subscale from the analysis ...................... 99
Table 4.31 Discriminant Validity (Heterotrait-Monotrait ratio) after the deletion of the IS subscale from the analysis
............................................................................................................................................................................ 100
Table 4.32 PLS-SEM Outer Loadings: EI ............................................................................................................ 102
Table 4.33 PLS-SEM Outer Loadings: Job Satisfaction (JS) .............................................................................. 104
Table 4.34 PLS-SEM Outer Loadings: Organisational Commitment (OC) .......................................................... 104
Table 4.35 PLS-SEM Outer Loadings: Perceived Supervisor Support (PSS) ..................................................... 105
Table 4.36 R square values for the PLS Path model .......................................................................................... 106
Table 4.37 Path Coefficients ............................................................................................................................... 106
Stellenbosch University https://scholar.sun.ac.za

1
CHAPTER 1: INTRODUCTION
1.1 Introduction
Many researchers have argued in favour of the central role of leadership in an
organisation’s success and survival (Engelbrecht, Van Aswegen & Theron, 2005;
Wexley & Yukl, 1984). The dynamic nature of the world of work today deems it
necessary for organisations to handle complex changes. These changes demand
innovative “knowledge, resources, and perspectives” (Martin & Ernst, 2005, p. 82),
and, in turn, leads to elevated challenges for leadership (Martin & Ernst, 2005).
Therefore, understanding how to develop and improve effective leadership would be
to the benefit of organisations.
The Transformational Leadership (TFL) style has been found to be more effective
than other leadership styles (e.g., Transactional or Laissez-faire Leadership), and
has been associated with positive outcomes in the workplace such as increased
effort, performance, satisfaction, and commitment (Leban & Zulauf, 2004; Limsila &
Ogunlana, 2008; Moshavi, Brown & Dodd, 2003). Moreover, Leban and Zulauf
(2004) also found that subordinates have more trust and confidence in
transformational leaders, which in turn contributes to higher performance levels.
Considering this wide range of constructive consequences related to the TFL style,
the development of this leadership style is important.
Recently, a large body of research has been devoted to understanding which factors
make certain transformational leaders better than others in getting the best out of
their subordinates (Bass, Avolio, Jung & Berson, 2003). In organisations today, the
role of leaders is not just to plan, control and manage the operations of the company,
but also to motivate and create an environment where employees feel significant and
have positive attitudes (Hogan, Curphy & Hogan, 1994). Various researchers have
found that leaders with a higher level of Emotional Intelligence (EI) are more
effective in influencing subordinates’ attitudes (Polychroniou, 2009). Beyers (2006)
addressed the effect of EI on TFL and developed and tested a structural model
which reflects the relationship between EI and TFL. This study aims to contribute to
the body of research on TFL by expanding on the work done by Beyers (2006).
Stellenbosch University https://scholar.sun.ac.za

2
Cherniss and Goleman (2001) discussed the significant role of EI in the
effectiveness of organisations. These authors argued that the most effective leaders
in the workplace are those that are able to identify their subordinates’ emotions, as
well as their own, and to effectively deal with employees who need encouragement
and are not satisfied at work. In essence, Cherniss and Goleman (2001) state that
effective leaders are those who are emotionally intelligent. The assumption that
leaders with a higher EI are more effective has been studied and confirmed by
various researchers, for example Rosete and Ciarrochi (2005) as well as Higgs and
Aitken (2003).
Beyers’ (2006) study focused on the EI dimensions based on Goleman’s emotional
competence framework (measured with the EI Index, developed by Rahim & Minors,
2003), which include self-awareness, self-regulation, self-motivation, empathy and
social skills. Bass and Avolio’s (1995) dimensions of TFL were assessed in Beyers’
study using the Multifactor Leadership Questionnaire which measures the following
four dimensions: Idealised Influence, Inspirational Motivation, Intellectual Stimulation
and Individualised Consideration. Results of that study revealed that the EI
dimensions of Goleman’s model correlated with three out of four of the TFL
dimensions: Idealised Influence, Inspirational Motivation, and Individualised
Consideration. No positive relationships were hypothesised between Intellectual
Stimulation and any of the EI dimensions due to the more cognitive nature of this
TFL dimension. This notion was highlighted as an area where further research is
needed. The results of the structural model highlighted the importance of the
hierarchical nature of the EI construct with Self-awareness forming the cornerstone
of the other EI dimensions (e.g. Self-regulation and Empathy). The results also
highlighted the importance of Self-awareness in leadership success. For example,
the effect of Self-awareness on Idealised Influence was mediated by Self-regulation
and Social Skills. Moreover, the effect of Self-awareness on Individualised
Consideration was mediated by Empathy, whilst Self-motivation mediated the effect
of Self-awareness on Inspirational Motivation. Three direct effects of EI on TFL were
evident from the Beyers (2006) structural model results: Social Skills on Idealised
Influence, Empathy on Individualised Consideration, and Self-motivation on
Inspirational Motivation.
Stellenbosch University https://scholar.sun.ac.za

3
Various studies have assessed the effects of leadership styles on employee attitudes
and/or organisational success (e.g. Barbuto & Burbach, 2006; Kaiser, Hogan &
Craig, 2008; Leban & Zulauf, 2004; Moshavi et al., 2003). It has been reported that
subordinates of transformational leaders have higher levels of Organisational
Commitment (Krishnan, 2005), and if leaders are attentive to their subordinates, they
would have higher levels of Job Satisfaction (Kaiser et al., 2008). Nemanich and
Keller (2007) also found a correlation between the characteristics of transformational
leaders and their subordinates’ levels of Job Satisfaction.
Research has also shown that where there is a positive relationship between leaders
and their subordinates, this will lead to increased Job Satisfaction (Graen, Novak &
Sommerkamp, 1982), and a lower level of turnover intentions (Harris, Wheeler &
Kacmar, 2009). In the present study, therefore, the Beyers (2006) model will be
further elaborated on with the addition of three constructs as outcomes of effective
leadership: Job Satisfaction, Organisational Commitment and Perceived Supervisor
Support.
1.1.1 Research aim, question and objectives
The present study aims to expand on the work of Beyers (2006) by using a more
recent model of EI developed by Boyatzis and Goleman in 2007, which will be
measured with an updated measuring instrument, namely the Emotional and Social
Competency Inventory (ESCI). Research clearly shows that successful leadership is
related to positive organisational outcomes such as increased Job Satisfaction and
Organisational Commitment (Barbuto & Burbach, 2006; Leban & Zulauf, 2004;
Limsila & Ogunlana, 2008; Lowe, Kroek, & Sivasubramaniam, 1996). Organisational
Commitment and Job Satisfaction have also been revealed as outcomes of
Perceived Supervisor Support (Yousef, 2000), which, in turn, is an outcome of
successful leadership. In other words, effective leadership will result in positive
Perceived Supervisor Support. This study, therefore, will aim to elaborate on the
work of Beyers (2006) by including Perceived Supervisor Support, Organisational
Commitment and Job Satisfaction as outcomes of TFL in an elaborated conceptual
model that depicts the nature of the relationships between EI dimensions, TFL
dimensions and the three outcomes of effective leadership.
The research question for this study, therefore, is:
Stellenbosch University https://scholar.sun.ac.za

4
Does the expanded and adapted conceptual model developed in this study provide a
valid account of the psychological processes that determines the outcomes of
effective leadership, defined as Perceived Supervisor Support, Job Satisfaction and
Organisational Commitment, as experienced by the follower of a particular leader
that exhibits certain TFL behaviours being influenced by various EI competencies?
The research objectives included to:
• develop a conceptual model, which is an expanded and adapted version of
the Beyers’ (2006) model, and to
• test the fit of the outer and inner model via Partial Least Squares modelling
(PLS).
1.1.2 Structure of the thesis
In chapter two the theoretical background of the research is presented. Here, all the
constructs are defined, and relationships between the constructs are explained. The
significance of the constructs in organisations is also highlighted. The rationale, aims
and objectives, as well as the research methodology utilised in this study are
presented in chapter 3. Details regarding the sample, measuring instruments and
data analyses are described as well.
In chapter 4 the results are presented and discussed. Chapter 5 concludes the thesis
with an overview of the research results, the limitations of the study, and
recommendations for further research.
Stellenbosch University https://scholar.sun.ac.za
5
CHAPTER 2: THEORETICAL FRAMEWORK OF THIS RESEARCH
2.1 Introduction
In this chapter, each construct will be defined separately, including a discussion on
various styles of leadership and different models of EI. The importance of leadership
as well as EI in organisations will also be discussed. This is followed by the
conceptualisation, antecedents and outcomes of the three constructs that were
assessed as outcomes of effective leadership in this study: Job Satisfaction,
Organisational Commitment and Perceived Supervisor Support. Built on these
discussions, the reasoning and logic behind the proposed, modified model of Beyers
(2006) is presented.
2.2. Leadership
This section includes a general background on and definition of leadership. Various
leadership styles and the value of leadership is discussed.
2.2.1 General Background
Various researchers have reported the essential role of leadership in an
organisation’s effectiveness and success (e.g. Olmstead, 2000; Wexley & Yukl,
1984; Yeo, 2006), as well as on the employees’ attitudes and work-related health
(Kuoppala, Lamminpaa, Liira & Vainio, 2008, Lok & Crawford, 2004). For example, it
has been argued that a requirement of managerial success is the element of
leadership, not just “good management” (Kotter, 1995, p.155). Not being able to lead
can have an adverse effect on the performance of individual employees, and
therefore on the performance of the whole organisation. Organisational success is
hampered when leadership is not developed in individuals (Kotter, 1995).
Individuals in positions of leadership at various levels in an organisation have an
effect on their subordinates’ behaviours, principles and perceptions, and through
this, therefore have an influence on the environment in the workplace and the
success of the organisation (Kaiser et al., 2008; Yeo, 2006). Companies showing
strong leadership make more profits than those that don’t, and therefore are more
successful (Storey, 2004). The work of Bloom and Van Reenen (2007) also confirms
that in organisations where poor leadership is displayed, performance is negatively
Stellenbosch University https://scholar.sun.ac.za
6
affected. In contrast, in organisations where leadership depth is displayed, enhanced
performance is evident.
To achieve organisational objectives, skilful employees need to work together
(Olmstead, 2000). The overall effectiveness of their working together is dependent
on how well each individual works, and how well their combined efforts are
synchronized. To this end, effective leadership, as argued above, is a key ingredient
in organisational effectiveness. In addition, effective leaders will, in time, be accepted
by most, if not all of their followers. If leaders are not accepted by their subordinates,
subordinates will leave out of their own free will, or they will be given notice to leave
(House, Javidan, Hanges & Dorfman, 2002).
2.2.2 Leadership defined
A large part of being a leader in an organisation includes creating a working
environment that will facilitate top performance by the employees (Olmstead, 2000).
Olmstead (2000) discusses the effective leadership of people in superior positions
and defines leadership as a process of influence. Wexley and Yukl (1984) similarly
argue that leadership entails influencing individuals to use more effort in a specific
task, or causing a change in behaviour. They assert that leaders have to ensure that
goals are set and made clear to everyone in the organisation, that plans and policies
are developed, and that the required talent is recruited and trained. Furthermore,
leaders need to motivate, encourage, and build the confidence and morale of
subordinates. Leadership moreover comprises of actions such as assisting in
getting groups to reach toward set goals, improving the quality of relations between
group members, and making sure that groups are able to acquire resources
(Nicholsan, Audia & Pillutla, 2005).
Leadership can be examined with regard to its elements and processes. According
to Nicholsan et al. (2005), the elements of leadership refer to groups of behaviours
(of the leader), that aim to achieve specific objectives by having an influence on the
attitudes and actions of followers. Furthermore, it is known that along with the
leader’s behaviour, the circumstances, and the social climate in the organisation also
affect the “manifestation of leadership” (Nicholsan et al., 2005, p.208). Nicholsan et
al. (2005) go on to suggest that leadership infers influencing others through different
bases of power, so as to attain the cooperation and commitment of followers.
Stellenbosch University https://scholar.sun.ac.za

7
2.2.3 Brief discussion of leadership theories and/or styles
As suggested by Dulewicz and Higgs (2005), behaviours of leaders can be grouped
into three categories. These categories are: goal-oriented, involving and engaging.
They describe goal-oriented behaviour as “a set of behaviours in which the leader
sets direction and behaves in a way in which he/she plays a significant role in
directing others to achieve the key goals required to attain the performance required”
(Dulewicz & Higgs, 2005, p.107). In “involving” leadership, the focus of the leader is
still on providing a sense of direction, but there is an increased focus on getting
others involved in giving direction and deciding how goals will be reached.
“Engaging” leadership behaviour refers to leaders assisting others in achieving the
“nature of the direction and means of achieving the necessary goals” (Dulewicz &
Higgs, 2005, p.108).
Wexley and Yukl (1984) suggest four categories of leadership namely supportive,
directive, participative and achievement-oriented, which bear similarities to those of
Dulewicz and Higgs (2005). “Supportive leadership” includes behaviour such as
considering the needs of followers, whereas “directive leadership” refers to guiding
followers and informing them of what is expected of them. “Participative leadership”
furthermore is conceptualised by discussing matters with followers in decision
making. Lastly, “achievement-oriented leadership” involves setting standards and
looking for improvement in performance.
Cooper and Starbuck (2005) illustrate the domains of leadership by focusing on the
leader, follower, and the relationship between the two. In the leader-based domain,
the main object is the leader. Here, the primary topic of interest is what the ideal
combination of personal characteristics and leader behaviours is, so as to achieve
the desired outcome. Keeping this in mind, they argue that studies of leadership
should include assessments of leader behaviours, traits, personalities, attitudes,
perceptions and influence. With regard to the follower-based domain, the focus
would be on what the ideal combination of followers’ characteristics and behaviour
should be to achieve the desired outcomes. Similar to the leader-based domain,
when studying followers, the followers’ behaviours, traits and perceptions should be
included. From a relationship-based perspective, the focus would be on the
relationship between the follower and leader. Here the issues concern what the ideal
Stellenbosch University https://scholar.sun.ac.za

8
combination of relational aspects is to achieve the desired outcomes. Each of these
domains is there to be carefully thought about in conjunction with the others. This will
then lead to another set of questions with regard to how the characteristics of these
three domains should interact to achieve the desired leadership outcomes.
According to Mastrangelo, Eddy and Lorenzet (2004, p.435), effective leaders
display “professional leadership behaviours”, such as creating a mission and
direction for meeting it, as well as ensuring that various processes are aligned. They
also display “personal leadership behaviours”, including fostering trust, showing
individual interest and behaving ethically. The authors argue that the outcome of
leadership should result in willing co-operation from followers. Figure 2.1 illustrates
how the professional and personal leadership behaviours can lead to “willing
cooperation” from followers.
(Mastrangelo, Eddy & Lorenzet, 2004)
Popper and Zakkai (1994) posit that the relationship between leaders and followers
have been studied from two perspectives. The first perspective views the relationship
between leaders and followers as a “framework of exchange relations” (Popper &
Zakkai, 1994, p.3). This conceptualisation focuses on the leader’s ability to make
his/her followers knowledgeable about the link between their efforts and the rewards.
Figure 2.1. Personal leadership as a mediator of professional leadership and
willing cooperation
Stellenbosch University https://scholar.sun.ac.za

9
Within this perspective of leadership an effective leader “is a sensitive psychological
diagnostician who accurately discerns subordinates’ needs and expectations and
responds to them accordingly” (Popper & Zakkai, 1994, p.3). This is essentially how
Transactional Leadership is defined. From the other perspective, the relationship
between leaders and their followers is mainly emotional. In this view, the leader is
seen as charismatic, inspirational and is someone who motivates his/her followers to
perform beyond what is necessary (Dvir, Eden, Avolio & Shamir, 2002). This is
referred to as TFL.
TFL has been shown to have a stronger correlation with positive organisational
outcomes than Transactional Leadership (Wells & Peachey, 2011). For example,
Wang and Huang (2009) report the positive relationship between TFL and the
performance of groups and individuals as being stronger than the relationship
between Transactional Leadership and performance. This implies that TFL is a more
effective leadership style than Transactional Leadership. Table 2.1 depicts the
different dimensions of TFL and Transactional Leadership, reflecting the difference
between the two styles.
Table 2.1
Transformational and Transactional Leadership
Transformational leadership Transactional leadership
Charisma: provides vision and sense of mission, instills pride, gains respect and trust
Contingent reward: contracts exchange of
rewards for efforts, promises rewards for
good performance, recognises
accomplishments
Inspiration: communicates high expectations, uses symbols to focus efforts, expresses important purposes in simple ways
Management by exception (active):
watches and searches for deviations from
rules and standards, takes corrective action
Intellectual stimulation: promotes intelligence, rationality and careful problem solving
Management by exception (passive):
intervenes only if standards are not met
Individualised consideration: gives personal attention, treats each employee individually, coaches and advises
Laissez-faire: abdicates responsibilities,
avoids making decisions
(Bass, 1990, p.630)
Stellenbosch University https://scholar.sun.ac.za

10
2.2.4 Transformational Leadership
Researchers have clearly established the significance of leadership for a business’
success (Duckett & Macfarlane, 2003). Burns’ (1978) initial work on Transformational
and Transactional Leadership was advanced by Bass (1985), and has since gained
increased attention by business management researchers. Bass (1999) argues that
the continuous change in workplaces over the years demands more transformational
leaders and less transactional leaders. In a time where consistent income, benefits
and a secure job is not guaranteed, it is argued that Transactional Leadership by
itself would not cause Job Satisfaction (Bass, 1999), emphasising the importance of
TFL. Researchers note that the TFL style has not only been useful in research on
organisational change (Burns, 1978; Duckett & Macfarlane, 2003), but also in
clarifying the extent of positive organisational outcomes such as employees’
satisfaction (Bass, 1985, 1999), commitment and performance (Bass, 1985). With
the ever-changing nature of workplaces, characterised by technological changes and
international competition, leadership is becoming increasingly critical in organisations
(Beugre, Acar & Braun, 2006; Krishnan, 2005). The focus of researchers has been
more on TFL as a way of meeting the challenges stemming from the continually
transforming business environment (Krishnan, 2005). Krishnan (2005) goes on to
explain that transformational leaders are essential when it comes to realising new
opportunities and developing the required skills to keep up with changes. The author
furthermore argues that greater performance is only possible through affecting
followers by applying the characteristics of TFL, and that there is a correlation
between TFL and individual, as well as organisational outcomes.
Generally, TFL has been explained as a group of behaviours that aim to generate
and assist processes of organisational changes (Derue, Nahrgang, Wellman &
Humphrey, 2011). Kaiser et al. (2008) investigated the significance of leadership
when it comes to organisational success/failure, and found that different styles of
leadership have been linked to certain outcomes. For example, employees’ Job
Satisfaction levels are higher if their leaders are considerate, while levels of
commitment from subordinates are higher if they have transformational leaders.
TFL has been defined by various authors. For example, Burns (1978) states that a
transformational leader attempts to identify subordinates’ possible motivations and
Stellenbosch University https://scholar.sun.ac.za
11
strives to fulfill their higher needs. Similarly, according to Bass and Avolio (as cited in
Ismail, Abidin & Tudin, 2009, p.6), transformational leaders have been defined as
those leaders “who want to develop their followers’ full potential, higher needs, good
value systems, moralities and motivation”. According to Bryman (1992)
transformational leaders are visionary and contribute to employees feeling significant
in the workplace.
In a study by Moshavi et al. (2003) where the correlation between leaders’
awareness of their behaviour and the attitudes of their followers were investigated, it
was reported that transformational leaders heighten their followers’ interests through
making them aware and accepting of the company goals, and by encouraging them
to not only focus on themselves, but on the well-being of the company too. To this
end, Bass (as cited in Ismail et al., 2009) suggested that the relations between
transformational leaders and their subordinates can motivate subordinates to not
only work with their own interests in mind, but that of the organisation as well.
Bass and Avolio (as cited in Ismail, Abidin & Tudin, 2009) posit that the TFL
construct has four components. These include:
1. Individualised Consideration
2. Inspirational Motivation
3. Intellectual Stimulation
4. Idealised Influence
2.2.4.1 Individualised Consideration
This dimension is characterised by leaders treating their followers as valuable and
significant contributors in the organisation (Sarros & Santora, 2001), giving personal
attention to followers, and treating each follower as an individual (Hoffman & Frost,
2006). It further involves leaders considering the needs of their followers, and
encouraging development (Bass, 1985). Earlier studies revealed that employees
who feel they are developing as time passes, experience more Job Satisfaction
(Derue et al., 2011).
Stellenbosch University https://scholar.sun.ac.za
12
Various researchers have reported evidence confirming the positive correlation
between Individualised Consideration (a dimension of TFL) and organisational
citizenship behaviours (Pillai, Schriesheim, & Williams, 1999; Podsakoff, MacKenzie,
& Bommer, 1996; Wang, Law, Hackett, Wang, & Chen, 2005). Cho and Dansereau
(2010) as well as Blau (1964) argue that this relationship can be explained by the
fact that employees will engage in positive behaviour at work (beyond what is
expected) because their leaders attend to their individual needs. Cho and Dansereau
(2010) examined the correlation between TFL and followers’ organisational
citizenship behaviours by considering the mediating effects of the followers’
perceptions regarding justice. They found that the perceptions of justice do affect the
relationship between TFL and organisational citizenship behaviours.
2.2.4.2 Inspirational Motivation
Inspirational Motivation involves making followers aware about the mission and
vision of the company (Sarros & Santora, 2001), and encouraging them to commit to
the vision. Outcomes of this dimension include aspects such as “extra effort, ethical
behaviour, learning orientation, and project success” (Densten, 2002, p.40). Extra
effort is of specific importance as it refers to performance beyond that achieved
through Transactional Leadership.
2.2.4.3 Intellectual Stimulation
This dimension entails leaders encouraging followers to be creative, to not avoid
challenges, and to participate in decision-making. Here, leader behaviour involves
remaining calm and dealing with problems rationally, and involving the followers
(Sarros & Santora, 2001). This dimension furthermore “arouses in followers the
awareness of problems and ways of solving them, stirs the imagination, and
generates thoughts and insights” (Banerji & Krishnan, 2000, p.407). Bruch and
Walter (2007) argue that leaders who stimulate their followers intellectually
encourage them to be innovative and to not just accept the normal ways of working.
2.2.4.4 Idealised Influence
Idealised Influence refers to the dimension of TFL which relates to leaders being role
models to their followers (Sarros & Santora, 2001). The notion of Idealised Influence
has as its basis in the study of charismatic leadership (House & Shamir, 1993; Hinkin
& Tracey, 1999), typified by exceptional leaders. Charisma is inspirational as it
Stellenbosch University https://scholar.sun.ac.za
13
affects attitudes and emotions regarding significant issues of life, and the self-
confidence of charismatic leaders is contagious (Sarros & Santora, 2001). Although
charismatic leaders are generally characterised as self-confident, the key to their
motivational behaviour lies in their confidence in the abilities of their subordinates
(Sarros & Santora, 2001).
Confirming the above-mentioned association between charisma and Idealised
Influence, Banerji and Krishnan (2000) suggest that charisma is the most significant
element of TFL. Employees perceive charismatic leaders as individuals who instil
enthusiasm into others about tasks, are respected, know what is essential, and
whose positive work ethic rubs off onto followers. In turn, this inspirational leadership
behaviour leads to followers being more motivated.
In 1992 a review on charismatic leadership research, conducted by House (1992),
was published. In the review it was argued that TFL augments organisational
effectiveness, and that charismatic leaders are perceived to be more effective than
other types of leaders (House, 1992). The notion that TFL enhances the
effectiveness of organisations is echoed by Cho and Dansereau (2010) who
investigated the correlation between TFL and organisational citizenship behaviours,
revealing that individual and group perceptions with regard to justice mediate the
relationship.
2.2.5 The Value of TFL
The popularity of TFL is partially due to its pervasive connection to advanced
performance (Camps & Rodriguez, 2010; Dvir et al., 2002; McColl-Kennedy &
Anderson, 2002). For example, TFL has been shown to be positively correlated with
leader effectiveness (r = .66, p < .001) (Hur, Van Den Berg & Wilderom, 2011).
Various other researchers have also shown that TFL is generally more effective than
other leadership styles (Downey, Papageorgiou & Stough, 2006; Dubinsky,
Yammarino & Jolson, 1995; Gardner & Stough, 2002; Leban & Zulauf, 2004; Limsila
& Ogunlana, 2008; Lowe, Kroeck & Sivasubramaniam, 1996), and has been
associated with increased effort, performance, satisfaction, and commitment in
followers (Barbuto & Burbach, 2006; Leban & Zulauf, 2004; Limsila & Ogunlana,
2008; Lowe, et al., 1996).
Stellenbosch University https://scholar.sun.ac.za
14
Further indicating the value of TFL, Bass (1985) postulates that subordinates receive
useful feedback from transformational leaders, and that such a leader encourages
employees to perform beyond expectations. Performing beyond what is expected,
i.e. putting in extra effort, is reflective of organisational citizenship behaviours, which
is enhanced by TFL (Piccolo & Colquitt, 2006; Podsakoff, Mackenzie, Moorman &
Fetter, 1990). Based on this notion, Camps and Rodriguez (2010) argue that the TFL
is the most effective leadership style. Similarly, using a sample of managers from
different units of a large firm providing financial services, Howell and Avolio (1993)
also reported that the leaders who portrayed TFL reflected superior performance in
comparison to other leaders.
Vera and Crossan (2004) argue that transformational leaders are agents of change:
with their vision of the future, transformational leaders inspire subordinates to work
toward that vision. Such leaders are able to communicate the significance of the
organisations’ goals, and this encourages employees to work toward these goals,
and even perform beyond expectations (Bass, 1985; Beugre et al., 2006; Cheung &
Wong, 2011). Cheung and Wong (2011) elaborate on the significance of TFL by
reporting a positive correlation of 0.23 (p < 0.01) between TFL and employee
creativity, which is essential in keeping up with the constant changes in business
environments. On the other hand, Lok and Crawford (2004) explain the value of this
leadership style in arguing that individuals’ levels of commitment and Job
Satisfaction are often influenced by characteristics of TFL. These characteristics
include the empowering of subordinates, as well as communicating understandable
goals and a vision (Lok & Crawford, 2004).
Using the multifactor leadership questionnaire and the Maslach burnout inventory,
Zopiatis and Constanti (2010) investigated the association between leadership styles
and burnout. The authors report a significant positive correlation between TFL and
personal accomplishment; and a negative correlation between TFL and emotional
exhaustion. Transformational leaders were found to be more effective than leaders
that follow an alternative leadership style (for example, avoidance leadership).
Avoidance leaders (laissez-faire leaders), furthermore, were shown to be more prone
to burnout, which could also prove harmful to their followers, who would be looking
Stellenbosch University https://scholar.sun.ac.za

15
for encouragement and guidance from their leaders in vain (Zopiatis & Constanti,
2010).
The findings of Dvir et al. (2002) also highlight the potential importance of TFL. The
authors investigated the effect of TFL on the development and performance of
subordinates. The sample consisted of two groups – a control group and an
experimental group. In the experimental group, the leaders went through training
specifically aimed at increasing TFL, while the control group’s leaders underwent
varied leadership training, i.e. not specific to the TFL style. Their findings revealed
that the leaders from the experimental group had a greater positive effect on the
development and performance of subordinates than the leaders from the control
group.
In another empirical study, conducted in Taiwan, Li and Hung (2009) also confirm
the findings of many other researchers (e.g. McColl-Kennedy & Anderson, 2002) that
there is a positive correlation between the behaviours of transformational leaders
and the performance of their followers. For example, a positive correlation was found
between good co-worker relations and Individualised Consideration, as well as
Inspirational Motivation. Good co-worker relations are important because, as
confirmed by Li and Hung (2009), the better the co-worker relations are, the better
employees perform their duties. Li and Hung (2009, p.1133) confirm this when
arguing that leader-follower relations are significant given that it has “perceptual,
motivational, attitudinal, and behavioural consequences.” In addition, the authors
report that subordinates of a transformational leader have more support and
consideration from their leader, and are therefore more satisfied with him/her. Such
subordinates will also have more trust in their leader, and be more open to
establishing and maintaining a valuable relationship with their superior (Li & Hung,
2009).
Further accentuating the value of TFL, Nemanich and Keller (2007) report empirical
evidence of the positive relationship between TFL and employee performance and
Job Satisfaction; while Krishnan (2005) reports that TFL increases employees’ level
of commitment to the organisation. On the other hand, Wells and Peachy (2011)
report empirical evidence of the negative relationship between TFL and voluntary
intentions to quit in organisations (r = -0.33, p < 0.01). The authors also found that
Stellenbosch University https://scholar.sun.ac.za

16
employees’ satisfaction with their leaders mediates the negative relationship
between the leaders’ behaviour and the employees’ turnover intentions. Turnover
intentions have been shown to cause various adverse effects in an organisation
(Abbasi & Hollman, 2000). Abbasi and Hollman (2000) highlight that the costs for a
company caused by turnover are not just financial; the company would also have to
alleviate the consequences of the turnover such as affected customer relations,
efficiency in the workplace, employees’ morale, and the combined effect on the
effectiveness of the whole organisation.
The following section looks at different outcomes of leadership which will be
assessed when measuring effective leadership in this study. The notion of leadership
effectiveness will be defined through the three constructs of Perceived Supervisor
Support, employee Job Satisfaction and employee Organisational Commitment.
2.3 Outcomes of Effective Leadership
This section discusses Job Satisfaction, Organisational Commitment and Perceived
Supervisor Support as outcomes of effective leadership.
2.3.1 Job Satisfaction
In this section, Job Satisfaction is conceptualised, and antecedents and outcomes of
Job Satisfaction are discussed.
2.3.1.1 Conceptualising Job Satisfaction
Employees’ performance is affected by their attitudes at work, which are portrayed in
their levels of Job Satisfaction and Organisational Commitment (Rocha &
Chelladurai, 2008). The extent to which employees enjoy their jobs is portrayed in
their levels of Job Satisfaction. Job Satisfaction has been described as multifaceted
affective reactions toward the job (Carmeli, 2003; Kalleberg, 1977; Pool & Pool,
2007). Similarly, Locke (1969) defines Job Satisfaction as the pleasing emotion
experienced when employees feel their job values are being met. Examples of job
values include recognition; remuneration; and autonomy.
Job Satisfaction has been studied extensively over the years. Along with
Organisational Commitment, it is considered to be a very significant construct in
Organisational and Industrial Psychology when it comes to predicting organisational
performance (Pool & Pool, 2007). According to Pool and Pool (2007, p.354, 355) Job
Stellenbosch University https://scholar.sun.ac.za

17
Satisfaction reveals the extent to which there is “a good fit between the individual
and the organisation”. In their study of the relationship between Organisational
Commitment, motivation and Job Satisfaction of executives, the authors report that
72% of the variation in executives’ motivation levels is related to their levels of
Organisational Commitment. It was furthermore found that 64% of the variation in
their Job Satisfaction levels is related to their motivation levels.
Individuals are more committed and productive if they perceive their jobs as
gratifying and rewarding. Knowing which factors affect Job Satisfaction levels can
help recognise possible desires and requirements that can be generally applied to
specialized professions, which could help improve performance (George, Louw &
Badenhorst, 2008; Pool & Pool, 2007). The following section discusses a range of
antecedents and outcomes of Job Satisfaction.
2.3.1.2 Antecedents and Outcomes of Job Satisfaction
Knowledge of the factors that positively and negatively affect Job Satisfaction can
help employers improve morale at the workplace, which will have a positive effect on
organisational outcomes (Pool & Pool, 2007). Many researchers in the field of
industrial-organisational psychology have studied the nature, antecedents, outcomes
and measurement of attitudes such as Job Satisfaction. Understanding the causes
and effects of Job Satisfaction is important, given that it has an effect on employees’
emotional and/or psychological well-being, as well as on their productivity, which, in
turn, effects how well the organisation functions. For example, company
effectiveness is influenced by the retention of sufficient and competent employees
(Van Saane, Sluiter, Verbeek & Frings-Dresen, 2003). Given that there is a
significant correlation between low Job Satisfaction levels and turnover, it could be
argued that increased Job Satisfaction could aid in preventing increased turnover
(Van Saane et al., 2003), and so increase retention. High retention and low turnover
rates are thus positive outcomes of high Job Satisfaction. If employers know and
understand which factors contribute to Job Satisfaction they can take the necessary
steps to prevent high turnover levels and the costs associated with it.
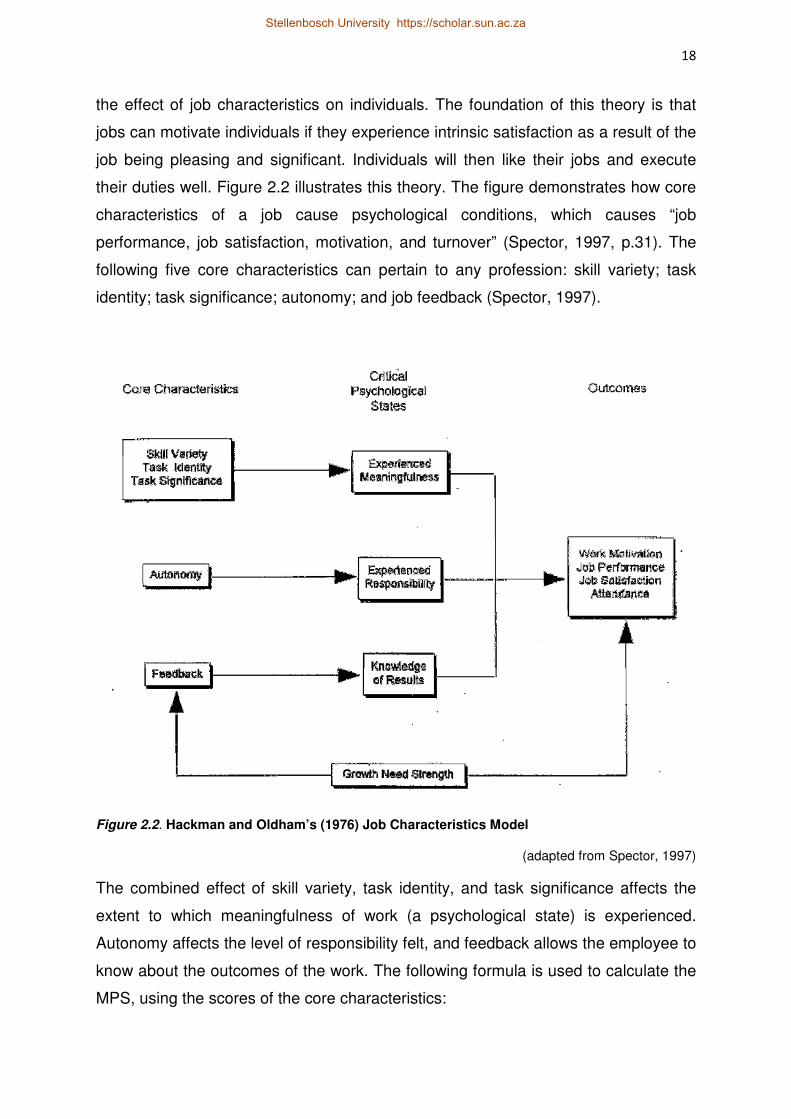
A popular model depicting the antecedents of Job Satisfaction is based on Hackman
and Oldham’s (1976) job characteristics theory, which is the dominant theory about
Stellenbosch University https://scholar.sun.ac.za
18
the effect of job characteristics on individuals. The foundation of this theory is that
jobs can motivate individuals if they experience intrinsic satisfaction as a result of the
job being pleasing and significant. Individuals will then like their jobs and execute
their duties well. Figure 2.2 illustrates this theory. The figure demonstrates how core
characteristics of a job cause psychological conditions, which causes “job
performance, job satisfaction, motivation, and turnover” (Spector, 1997, p.31). The
following five core characteristics can pertain to any profession: skill variety; task
identity; task significance; autonomy; and job feedback (Spector, 1997).
Figure 2.2. Hackman and Oldham’s (1976) Job Characteristics Model
(adapted from Spector, 1997)
The combined effect of skill variety, task identity, and task significance affects the
extent to which meaningfulness of work (a psychological state) is experienced.
Autonomy affects the level of responsibility felt, and feedback allows the employee to
know about the outcomes of the work. The following formula is used to calculate the
MPS, using the scores of the core characteristics:
Stellenbosch University https://scholar.sun.ac.za

19
MPS = (S.V. + T.I. + T.S)/3 x Auton. X Feed.
The higher the MPS score is, the higher the motivation and satisfaction levels
experienced as a result of the job will be.
According to Spector (1997), there are two types of factors that affect and/or cause
Job Satisfaction. The first type includes factors such as the characteristics of the job,
relationships with colleagues, and incentives. These factors are related to the work
environment, and the job itself. The second types of factors are aspects related to
each individual, such as their personalities and previous experience. These two
types of causes work together to affect the Job Satisfaction of employees. Other
examples of aspects that affect Job Satisfaction include remuneration, promotion
opportunities, supervision, working conditions and colleagues (Spector, 1997).
Various researchers, for example Avolio, Bass and Jung (1999) as well as
Mardanov, Heischmidt and Henson (2008) found that employees’ Job Satisfaction is
mostly affected by their immediate leaders. Similarly, Koc (2011) used a sample of
266 employees from 11 institutions and reported a positive correlation between
leadership behaviors and Job Satisfaction replicating other research that have
shown that a leader’s behaviour is one of the most significant antecedents of
employees’ Job Satisfaction. Koc (2011, p.11837) defined leaders as those “who
can direct the followers to the behaviour in line with the leaders’ desires in order to
realise the individual and group objectives.” The measure used to examine
leadership behaviour was a 36-item scale developed by Ekvall and Arvonen (1991);
and Job Satisfaction was examined through the use of the 20-item Minnesota job
satisfaction scale. Employee performance was tested with the use of 7 items – 3
items from the work of Lam, Chen and Schaubroeck (2002), and 4 items from the
work of Kirkman and Rosen (1999). Koc (2011) reports a positive correlation of
0.815 between leadership behaviour and Job Satisfaction; as well as a positive
correlation of 0.259 between leadership behaviour and employee performance.
Similar to the view of Spector (1997), Koc (2011) further points out that other
antecedents of Job Satisfaction include individual factors and organisational factors.
Individual factors are aspects such as age; sex; education; rank; and intelligence.
Organisational aspects include: the nature of the job; communication; remuneration
and leadership style.
Stellenbosch University https://scholar.sun.ac.za

20
Research also suggests that work values are antecedents of Job Satisfaction. Work
values have been described as the “level and importance of certain job outcomes
desired by individuals” and include achievement; status; and autonomy (Keller,
Bouchard Jr, Arvey, Segal & Dawis, 1992, pp. 79). Kalleberg (1977) empirically
analysed the relationship between Job Satisfaction and work values and job
rewards. Results of the study revealed that work values have direct effects on Job
Satisfaction levels.
Ghazzawi (2010) indicates another antecedent of Job Satisfaction when arguing that
individuals’ personalities affects how they think and feel about their work, and in this
way, affects Job Satisfaction. The author furthermore also explains how employees’
work situations and happiness (life satisfaction) also are antecedents of Job
Satisfaction. How stimulating or tedious an employee perceives the job to be; the
physical setting; and relations with colleagues and clients all relate to the work
situation (Ghazzawi, 2010) which affects Job Satisfaction. Ghazzawi (2010) goes on
to explain that organisational citizenship behaviour is an outcome of Job Satisfaction.
Organisational citizenship behaviours refers to actions involving being a team player
and considering others without the expectation of being compensated.
Glisson and Durick (1988), using a sample of 319 human service (not specified)
employees from 22 organisations, studied which job, organisation and individual
characteristics affect Job Satisfaction and Organisational Commitment. Results
revealed that skill variety and role ambiguity were the strongest predictors of Job
Satisfaction, while commitment was best predicted by the organisation
characteristics and leadership. The only worker characteristic that significantly
predicted commitment was education, while no correlation was found between other
worker characteristics and Job Satisfaction. In this study, most of the antecedents of
satisfaction and commitment that were used were objective factors such as age;
gender; education; salary; etc. Therefore higher satisfaction levels will be
experienced by the employees if they are clear about what their responsibilities are,
and they have the opportunity to utilize a variety of their abilities. It was also reported
that worker characteristics have no correlation with satisfaction; and that leadership
was found to be a significant predictor of satisfaction levels (Glisson & Durick, 1988).
Considering this reported relation between leadership and levels of subordinate
Stellenbosch University https://scholar.sun.ac.za

21
satisfaction, this study intends to investigate Job Satisfaction as an outcome of
effective leadership, defined as TFL. Therefore, in the conceptual model (depicted in
figure 2.5, section 2.5.2) all the TFL dimensions are hypothesised to have an either
direct effect on Job Satisfaction, and/or an indirect effect on Job Satisfaction through
the mediator of Organisational Commitment (this is discussed in more detail in
section 2.3.5).
2.3.2 Organisational Commitment
In this section, Organisational Commitment is conceptualised, and antecendents and
outcomes of Organisational Commitment are discussed.
2.3.2.1 Conceptualising Organisational Commitment
Work attitudes have an influence on the performance levels of employees. These
attitudes involve employees accepting the objectives of the organisation (Mc Carthy,
2008; Pool & Pool, 2007). Not only are these attitudes portrayed In Job Satisfaction
levels, but also in levels of Organisational Commitment (Rocha & Chelladurai, 2008).
Meyer and Allen (1997) recognise the constant need of a committed workforce of
employees that can adjust to necessary changes, and therefore the significance of
Organisational Commitment. Organisational Commitment indicates the extent to
which employees identify with, and are involved in organisations (Mowday, Porter &
Steers, 1982).
According to Catano, Pond and Kelloway (2001, p.257) commitment can be defined
as “a strong belief in, and acceptance of the organisation’s goals and values…a
willingness to exert considerable effort on behalf of the organisation; and…a desire
to maintain organisational membership”. According to Pool and Pool (2007),
Organisational Commitment joins the employee to the organisation and reveals how
much the employee feels linked with the organisation, as well as to what extent the
employee will work toward the aims of the organisation. Pool and Pool (2007)
acknowledge that Organisational Commitment has been extensively studied
practically as a work outcome, as well as an antecedent variable in the workplace.
For example, as a work outcome, or a consequence, leaders’ Organisational
Commitment has been shown to be a key variable in creating a workplace that
fosters employees’ motivation and Job Satisfaction levels.
Stellenbosch University https://scholar.sun.ac.za
22
Meyer and Allen’s (1991) model of Organisational Commitment “retains the greatest
empirical scrutiny and arguably receives the greatest support” (Pool & Pool, 2007,
pp.354, 355) and will be used in this study. In their model, Organisational
Commitment has three dimensions: affective commitment, continuance commitment
and normative commitment. Whereas affective commitment is when an employee
stays with an organisation because he wants to, continuance commitment is when
an employee stays with an organisation because he needs to. Normative
commitment is when an employee stays with an organisation because he feels he
ought to. Benefits that can come from the three components of commitment lies in
the implications it has with regard to behaviour at work (Allen & Meyer, 1996).
2.3.2.2 General Antecedents and Outcomes of Organisational Commitment
Arnold and Davey (1999) conducted a study using a sample of 474 graduates from
eight companies in the UK. The focus was to study the effect of experiences at work
on Job Satisfaction and/or Organisational Commitment, and, in turn, its effect on
turnover. Questionnaires were obtained on two occasions, a year apart. It was
reported that, over the year, the changes in Organisational Commitment were largely
a result of intrinsic work aspects, such as career development. Results therefore
suggest that intrinsic work aspects, as well as career development have a strong
impact on Organisational Commitment levels and turnover. Examples of intrinsic
work characteristics include: having an “impact on others…use and development of
skills; a variety of tasks, as well as autonomy” (Arnold & Davey, 1999, p.221).
Therefore, the more employees feel there is autonomy at work, and the more they
feel their skills are being used and developed, the more committed they will be to the
organisation. These results emphasise the importance of ensuring and maintain high
levels of Organisational Commitment – higher levels of Organisational Commitment
will decrease turnover in the organisation.
In 1997 Meyer and Allen published a review of studies on Organisational
Commitment. The authors argued that committed individuals are those who stay with
the company through bad and good times, are at work most of the time, and work a
whole working day (possibly longer). Such individuals furthermore share the
company’s vision and are undoubtedly a benefit in an organisation. In a similar vein,
Pool and Pool (2007), argue that Organisational Commitment causes employees to
want to stay with the organisation. The results of their study confirm that
Stellenbosch University https://scholar.sun.ac.za

23
Organisational Commitment is an antecedent to employees’ motivation levels, which
affect Job Satisfaction. Organisational Commitment fosters a feeling of trust in the
workplace, and aids in employees achieving the objectives of the organisation.
Increased trust amongst employees promotes Organisational Commitment, and
employees are encouraged to stay with the organisation as Organisational
Commitment is key in boosting Job Satisfaction and motivation levels (Pool & Pool,
2007). The role of individuals in leadership positions is therefore significant in
maintaining and increasing high levels of employees’ Organisational Commitment.
Leaders, through creating a climate of trust, can increase the employees’
commitment in the organisation, and this will, in turn, increase employee Job
Satisfaction. Confirming the findings of Pool and Pool (2007), it has been established
that Organisational Commitment is a predictor of turnover intentions/behaviour (Allen
& Meyer, 1996; Maertz, Griffeth, Campbell & Allen, 2007) as well as of absenteeism
and Job Satisfaction (Pool & Pool, 2007).
Revealing similar results to the study by Pool and Pool (2007), Yousef (2000)
conducted an empirical study investigating the effect of Organisational Commitment
on the relationship between a leader’s behaviour and the followers’ performance and
satisfaction levels. The sample consisted of 430 people from different companies in
the United Arab Emirates. The results revealed that there is a positive correlation
between employees’ Organisational Commitment and satisfaction, as well as
between their levels of Organisational Commitment and performance. Confirming
previous results, Yousef (2000) also reported that commitment levels of employees
mediated the relationship between the behaviour of the leaders and the followers’
satisfaction and performance levels. Given this finding, as well as research indicating
the importance of leadership in establishing follower Organisational Commitment,
this research intends to investigate the direct relationships between the different TFL
dimensions, and subordinate Organisational Commitment (this is elaborated on in
section 2.3.5). Moreover, given the substantial evidence that Organisational
Commitment predicts Job Satisfaction, this relationship will also be included in the
conceptual model (see figure 2.5, section 2.5.2).
2.3.3 Perceived Supervisor Support
In this section, Perceived Supervisor Support is conceptualised, and antecedents
and outcomes of Perceived Supervisor Support are discussed.
Stellenbosch University https://scholar.sun.ac.za

24
2.3.3.1 Conceptualising Perceived Supervisor Support
As noted by Murry, Sivasubramaniam and Jacques (2001), various researchers have
reported on the quality of the relationship between leaders and their followers, and it
has been established that the quality of this relationship is possibly one of the most
significant antecedents of organisational outcomes such as employees’ job
performance, organisational citizenship behaviours, Job Satisfaction and turnover
intentions (Harris et al., 2009). Furthermore, when it comes to the performance and
growth of employees, support is a key factor. When sufficient support is available it is
easier to handle difficult situations, and so, remain optimistic about one’s ability to
learn and grow in the organisation (Gentry, Kuhnert, Mondore & Page, 2007).
Subordinates establish perceptions regarding how much their supervisors value their
work, and to what extent their supervisors are concerned about their well-being. This
is referred to as Perceived Supervisor Support. According to Yoon, Seo and Yoon
(2004, p.396), supervisory support can be described as “the socio-emotional
concerns of the supervisor, and represents the degree to which the supervisor
creates a facilitative climate of psychological support, mutual trust, friendliness, and
helpfulness”. How subordinates react to their supervisors depends on how the
subordinates perceive their supervisors’ actions, as well as the subordinates’
expectations, standards and interpersonal skills (Likert, 1961 as cited in Locke,
1969). Showing personal concern and applying fair decision making practices are,
for example, different forms of Perceived Supervisor Support (Maertz et al., 2007).
Research indicates that Perceived Supervisor Support has a significant negative
correlation with subordinates’ turnover (Maertz et al., 2007) and contributes to the
level of effectiveness of the subordinate (Gentry et al., 2007).
To cultivate an environment characterised by high Perceived Supervisor Support
levels, employers should allow subordinates to have a say when it comes to
important issues in the organisation. Regular meetings, recognition, open
communication (including feedback) between leaders and subordinates, and
allowing employees to voice their opinions all contribute to increased Perceived
Supervisor Support levels, and, in turn, increased retention. This is because the
employees will then feel that they, and their contributions, are essential to the
leaders, and that their leaders are considering their point-of-view on issues. Under
Stellenbosch University https://scholar.sun.ac.za
25
such circumstances, the work environment could be described as fair, open,
consistent, where there is trust and respect (Gentry, et al., 2007).
2.3.3.2 General antecedents and outcomes of Perceived Supervisor Support
The quality of the leader-employee relationship has been shown to be a critical factor
in a range of important organisational outcomes. For example, Harris et al. (2009)
studied how empowerment of employees impacted the quality of supervisor-
subordinate relations and work outcomes such as “job satisfaction, turnover
intentions, job performance, and OCB’s” (p.379). The authors argued that strong
relationships between employees and their leaders have been correlated with good
communication among staff as well as receiving rewards, further leading to
increased job satisfaction (Graen et al.,1982) and a lower level of turnover intentions
(Harris et al., 2009). Harris et al. (2009) found that the empowerment of employees
moderates the positive relationship between the quality of the supervisor-subordinate
relationship and the three outcomes of Job Satisfaction, job performance and
organisational citizenship behaviours. It was furthermore found that the
empowerment of employees moderated the negative relationship between the
quality of the supervisor-subordinate relationship and turnover intentions.
Another study that highlights the significance of leaders’ support is that of Gentry et
al. (2007). The authors investigated whether leaders’ support for their subordinates
has an impact on retention levels. High retention is important as fewer resources will
be spent on finding and training new employees. Such resources can then be utilised
for further training and development of current employees. The results of the study
revealed that, particularly with regards to retaining part-time employees, support
from their supervisor(s) is a key concern. When leaders value their subordinates’
efforts, interests and welfare, and allow for good communication at the workplace,
employees tend to remain at the organisation (Graen, Liden & Hoel, 1982). This is
characteristic of an environment with high Perceived Supervisor Support. Employees
generally report feeling attached to the organisation, which will, in turn, lead to the
organisation being successful at retaining employees (Gentry et al., 2007, Maertz et
al., 2007).
When it comes to the growth and performance of subordinates, receiving support is
significant. When individuals have support, it is easier to handle hardships; deal with
Stellenbosch University https://scholar.sun.ac.za

26
challenges and remain positive in order to continue being successful (Gentry et al.,
2007). It is further suggested that various forms of support (such as fair decision-
making process and individual concern) result in employees’ satisfaction,
development, and effective performance (Gentry et al., 2007). Furthermore,
according to Maertz et al. (2007), a supervisor that is supportive could make up for
the weaknesses in company policies and decisions, and so prevent an increase in
turnover. These authors, using 225 social service employees, studied how Perceived
Supervisor Support and Perceived Organisational Support affect turnover intentions.
Results revealed that Perceived Supervisor Support has an independent impact on
turnover intentions. In other words, Perceived Organisational Support did not have
an effect on the correlation between Perceived Supervisor Support and turnover
intention. Perceived Organisational Support was shown to be more important to
employees when Perceived Supervisor Support was considered to be low. As
turnover can be a big cost to an organisation, gaining a greater understanding of the
causes can help manage it, and in turn, benefit employers and the organisation
(Maertz et al., 2007). It was furthermore found that the relationship between
Perceived Supervisor Support and turnover is partially affected by affective
commitment, and that Perceived Supervisor Support is an antecedent of
Organisational Commitment. These findings support the extensive research that
shows Perceived Supervisor Support has an independent effect on outcomes in the
workplace (Maertz et al., 2007). In a similar vein, Eisenberger, Huntington, Hutchison
and Sowa (1986) found that another antecedent of Organisational Commitment is
Perceived Organisational Support, which refers to the extent to which organisations
are committed to their employees. This notion is confirmed by Wayne, Shore and
Liden (1997).
Based on the literature above, in this study Perceived Supervisor Support will be
assessed as an outcome of effective leadership, and as an antecedent of Job
Satisfaction and Organisational Commitment. Given that Perceived Supervisor
Support involves supervisors expressing personal concern for subordinates (Maertz
et al., 2007) with regard to their well-being, as well as treating subordinates as
valuable contributors, the present study will examine the relationship between the
Individualised Consideration dimension of TFL and Perceived Supervisor Support.
As discussed in section 2.2.4.1, Individualised Consideration includes the leader
Stellenbosch University https://scholar.sun.ac.za

27
showing that the subordinate is valuable and significant to the organisation, as well
as giving personal attention to the subordinate. This definition is consistent with what
constitutes positive Perceived Supervisor Support by the subordinate.
Similarly, as discussed in section 2.2.4.4, Idealised Influence refers to leader
behaviour that instils confidence in the abilities of subordinates, and behaviour
causing subordinates to perceive the leader as a role model. It is argued that such
behaviour will enhance the quality of the relationship between the leader and
subordinate, and it is therefore hypothesised that there is also a positive relationship
between the Idealised Influence dimension of TFL and Perceived Supervisor
Support.
2.3.4 Relationships between Job Satisfaction, Organisational Commitment,
and Perceived Supervisor Support
Various studies support the notion that the abovementioned variables are related
(see the conceptual model, figure 2.5, for a visual representation of the various
proposed paths between the three variables included in this study). For example,
Arnold and Davey (1999) as well as Glisson and Durick (1988) report evidence that
Organisational Commitment are correlated to Job Satisfaction. Pool and Pool (2007)
also reported an indirect relationship between Organisational Commitment and Job
Satisfaction. Their findings revealed that Organisational Commitment is an
antecedent of employee motivation, which in turn impacted on Job Satisfaction. On
the other hand, Ghazzawi (2010) reported that Organisational Commitment is an
outcome of Job Satisfaction; and similarly Rue and Byars (cited in Ghazzawi, 2010)
also argued that Job Satisfaction has a positive relation with Organisational
Commitment. Furthermore, Rocha and Chelladurai (2008) suggested that Perceived
Supervisor Support affects Perceived Organisational Support, which has been
shown to have an influence on the performance of employees as it has an impact on
their level of Organisational Commitment. Similarly, Murry et al. (2001) reported a
positive relationship between Organisational Commitment and leader-subordinate
relations that are of good quality.
Yousef (2000) conducted an empirical study investigating the effect of commitment
on the relationship between a leader’s behaviour and the followers’ performance and
satisfaction levels. The results revealed that there is a positive correlation between
Stellenbosch University https://scholar.sun.ac.za
28
commitment and satisfaction, as well as between commitment and performance.
Confirming previous literature, it was also found that commitment levels mediate the
relationship between the behaviour of the leaders and the followers’ satisfaction and
performance levels. Dunham, Grube and Castaneda (1994) investigated how
leaders that apply a participatory management style (i.e. Intellectual Stimulation) and
provide feedback, affect the commitment levels of followers. The authors reported
that such leaders’ behaviour is strongly related to higher commitment levels in
followers, more specifically, higher affective commitment. This suggests that the
followers stay because they actually want to stay with the organisation, not because
they feel obliged to. In an empirical study by Gok, Karatuna and Karaca (2015), the
authors noted that Perceived Supervisor Support not only increases subordinates’
commitment, but their Job Satisfaction levels, too. Therefore, based on these
studies, it is hypothesised that Perceived Supervisor Support directly influences
Organisational Commitment and Job Satisfaction, and indirectly influences Job
Satisfaction through its effect on Organisational Commitment.
2.3.5 Relationships between TFL and outcomes of effective leadership
Research has clearly shown that increased Organisational Commitment and Job
Satisfaction are positive outcomes related to successful leadership. For example,
leadership styles have been shown to be correlated with Organisational Commitment
(Arnold & Davey, 1999), and similarly Dulewicz and Higgs (2005) have argued that
Job Satisfaction of followers has been used as a measure of leadership
effectiveness. This notion is echoed by Miles and Mangold (2002) who argue that
one determinant of subordinates’ satisfaction is the performance of the leader.
Furthermore, a leaders’ performance is also affected by subordinates’ satisfaction
with the leader’s performance. Miles and Mangold (2002) further argue that
understanding subordinates’ perception of their leader is necessary. If subordinates
are not satisfied with the relationship with their leaders, they will probably be
experiencing tension internally, which could possibly hamper productivity. Clear
evidence exists that a leader’s behaviour has an influence on the Job Satisfaction
levels of his/her subordinates (Avolio et al., 1999; Mardanov et al., 2008). For
example, Erkutlu (2008) reports a positive correlation between TFL and Job
Satisfaction; while Nemanich and Keller (2007), with a sample of 447 individuals,
found that TFL explains 10% of the variance in Job Satisfaction scores. Similarly
Stellenbosch University https://scholar.sun.ac.za

29
Mast, Jonas, Cronauer and Darioly (2011) studied the significance of leaders’
interpersonal sensitivity on their effectiveness as leaders. The authors noted that
Individualised Consideration, a dimension of TFL, has been shown to be positively
correlated to subordinates’ levels of satisfaction in various studies.
According to Dulewicz and Higgs (2005), like satisfaction, another way of assessing
the effectiveness of a leader is through the commitment of his/her followers.
According to Piccolo and Colquitt (2006) transformational leaders heighten the
amount of commitment received from their subordinates. For example, charisma, a
characteristic of Idealised Influence (a dimension of TFL), is said to boost
employees’ levels of commitment, inspiring them to perform beyond what is
expected (Klein & House, 1995). Various other researchers have posited that TFL
has a positive association with the extent to which employees are dedicated and
committed to an organisation, as well as on organisational success (Erkutlu, 2008;
Gill & Mathur, 2007; Gill, Flaschner, & Shachar, 2006). Erkutlu (2008), with a sample
of 722 individuals, investigated the effect of leadership behaviours on the
effectiveness of leaders and the organisation. It was reported that there is a
significant positive correlation between the dimensions of TFL and employees’
Organisational Commitment. The strongest correlation was between the
Individualised Consideration dimension and Organisational Commitment (r = 0.94, p
< 0.001). In a similar vein, Catano et al. (2001) report evidence that TFL has an
effect on commitment even with the absence of possible rewards and punishments.
The authors argue that transformational leaders cause followers to accept the
company’s objectives and standards and in so doing, draw support and commitment
from the followers.
Limsila and Ogunlana (2008) examined the relationship between leadership styles
and Organisational Commitment and performance. A positive correlation was found
between TFL and work performance as well as between TFL and subordinates’
Organisational Commitment (r = 0.438, p < 0.01). These correlations were stronger
than those found with the Transactional Leadership style. The results of this study
therefore confirmed that the TFL style is more effective than the Transactional and
Laissez-faire leadership styles in stimulating Organisational Commitment in
followers. More specifically, looking at leadership outcomes (effectiveness,
satisfaction and extra effort), the laissez-faire style had negative correlations with
Stellenbosch University https://scholar.sun.ac.za

30
these three constructs. Transactional Leadership had a positive correlation of 0.196
and 0.085 with effectiveness and extra effort respectively, and a negative correlation
(-0.023) with satisfaction. The relationships between effectiveness; satisfaction and
extra effort, and the Transformational Leadership style were the strongest, with
correlations of 0.818, 0.672, and 0.732 (p < 0.01) respectively. Further confirming the
significance of the TFL style, Banerji and Krishnan (2000) reported positive
correlations between TFL and how much effort followers offer at work, their
satisfaction levels, and job performance. Krishnan (2004) also confirmed this notion
in a study which found a positive relationship between TFL and subordinates’
tendency to contribute more effort than is necessary, as well as between TFL and
subordinates’ satisfaction (Connelly & Ruark, 2010; Krishnan, 2004).
Amabile, Schatzel, Moneta, and Kramer (2004) conducted an exploratory study
examining the behaviour of leaders and its link to perceived leader support. The
regression analysis reflected that certain behaviours of leaders predicted followers’
perceptions of their leader’s support. More specifically, the authors report that
examples of leader behaviour that have a positive correlation with subordinates’
perceptions of their leaders’ support include: “showing support for a team member’s
actions or decision”; “providing general guidance”; “providing constructive feedback”
and “recognizing good performance” (Amabile et al., 2004, p.17,18). Examples of
leader behaviors that have a negative correlation with subordinates’ perceptions of
their leaders’ support include: “Displaying lack of interest in subordinates’ work”; and
“nonconstructive negative feedback” (Amabile et al., 2004. p.19). Furthermore, it was
also found that leaders’ behaviours affect followers’ perceptions of themselves, with
specific regard to their capability and significance at work. Wells and Peachey
(2011), using a sample of 208 individuals, examined the relationship between
leadership and turnover intentions. The authors report that employees’ satisfaction
with the leader mediates the negative relationship between TFL and turnover
intentions (r = -0.33, p < 0.01). Low turnover intention rates are essential to avoid
using extra time and money on the recruitment, selection and development of new
employees. Using resources on improving and developing current employees will be
more beneficial for an organisation (Gentry et al., 2007). Moreover, a significant
correlation (0.579) was found between TFL and employees’ satisfaction with their
supervisor (p < 0.01).
Stellenbosch University https://scholar.sun.ac.za

31
The present study aims to explicate the complex relationships between the TFL
style, in terms of the different sub-dimensions of this style, and its direct and indirect
effects on the outcomes of effective leadership (subordinates’ levels of
Organisational Commitment, Job Satisfaction, and their Perceived Supervisor
Support). Figure 2.5 in section 2.5.2 provides a visual representation of the various
hypothesised paths between the TFL dimensions and each of the outcomes of
effective leadership.
For example, leaders that display Idealised Influence according to the TFL style
would be charismatic and natural role models to their followers. Such leaders display
confidence in the abilities of their subordinates. Hence one could argue that such
confidence would help create a leader – follower relationship that is characterised by
trust and positive interactions. Hence it is possible that the follower, in this instance,
would report positive experiences of Perceived Supervisor Support, which could lead
to greater feelings of Job Satisfaction and more Organisational Commitment. It could
further be argued that this leadership behaviour (i.e. Idealised Influence) could also
directly influence the Job Satisfaction and Organisational Commitment of followers.
According to research by Glisson and Durick (1988), employees who find their work
stimulating and requiring a wide variety of skills have higher levels of Job
Satisfaction. The Intellectual Stimulation dimension of TFL refers to leadership
behaviour in which the leader encourage employees to be creative and come up with
fresh ideas. Such leaders stimulate their followers intellectually to be innovative. It
can therefore be hypothesised that leaders who display the Intellectual Stimulation
dimension of TFL may cause higher employee Job Satisfaction in followers as such
followers may find their work to be more stimulating and challenging. Hence,
Intellectual Stimulation is proposed to have a direct effect on follower Job
Satisfaction.
When leaders display the TFL dimension of Individualised Consideration, they pay
attention to the needs of each individual employee. This mentoring and supporting
behaviour encourages employees’ growth and development, and helps the
employee to reach their full potential. It can therefore be argued that such leadership
behaviour will foster a good quality relationship between the leader and employee,
characterised by high Perceived Supervisor Support (i.e. direct effect between
Stellenbosch University https://scholar.sun.ac.za

32
Individualised Consideration and Perceived Supervisor Support). Furthermore, it is
also hypothesised that Individualised Consideration will have a direct effect on
employee Job Satisfaction (Derue et al., 2011) and Organisational Commitment (e.g.
Podsakoff et al., 1996).
The Inspirational Motivation dimension of TFL involves leaders challenging their
subordinates, motivating and inspiring them, and getting them involved. Once again
it is argued that this leadership behaviour will lead to positive leader-follower
relations, which will have a positive effect on Organisational Commitment. It is
therefore hypothesised that Inspirational Motivation directly influences Organisational
Commitment.
2.4 Emotional Intelligence
This section includes a discussion about the definition and general background of EI.
Various EI models are also discussed.
2.4.1 Definition and General Background
Mayer, Caruso, and Salovey (1999) describe EI as a group of interconnected
abilities that assist individuals to process significant emotional information with
precision. According to Zeidner, Matthews and Roberts (2004) the most widely
accepted scientific definition of EI is Salovey and Mayer’s (1990, p.189) definition:
‘‘the subset of social intelligence that involves the ability to monitor one’s and others’
feelings and emotions, to discriminate among them and to use this information to
guide one’s thinking and actions.’’
The changes that are continually transpiring in the world of work put pressure not
only on individuals’ cognitive resources, but also on their emotional resources
(Cherniss, 2000). This requires the ability to effectively manage and control
emotions, so as to cope with the pace of change. Individuals’ EI levels affect how
well they cope with stress and difficult situations (Cacioppe, 1997; Slaski &
Cartwright, 2002). Slaski and Cartwright (2002), using a sample of individuals in
managerial positions, reported empirical evidence of the positive correlation between
EI levels and health and well-being, as well as performance. Those with higher EI
also showed lower levels of stress. In addition to this, employees are not just being
evaluated by their cognitive intelligence and qualifications any longer, but also by
how well they handle themselves and others (Goleman, 1998). The focus is
Stellenbosch University https://scholar.sun.ac.za

33
therefore on personal characteristics such as empathy, creativity and adaptability,
and Goleman (1998) argues that developing these EI skills in organisations will
positively affect the effectiveness and productivity of the organisation.
Ziedner et al. (2004) reviewed empirical evidence supporting the role of EI in the
workplace, and reported that an increasing amount of organisations are coming to
the realisation that EI competencies are critical for organisational success. The
construct of EI was first labelled as such by Salovey and Mayer (1990), and is rooted
in the work of Thorndike (1920) who did research on social intelligences as a way of
explaining variations in outcomes that are not explained by IQ.
Researchers have differing opinions about EI with regard to its scientific viability
(Landy, 2005; Mayer, Salovey & Caruso, 2004; Roberts, Zeidner, & Matthews,
2001). For example, some argue that EI is a vague concept (Davies, Stankov, &
Roberts, 1998) and cannot be measured adequately (Becker, 2003), whereas many
other researchers suggest that EI is at the root of necessary abilities individuals need
to perform effectively at work (Cherniss, 2000). For instance, it has been argued that
the concept of EI has received increasing attention (Averill, 2004) because of its
prospective practical significance, for example, as an antecedent to important
aspects such as occupational success (Ciarrochi, Chan & Caputi, 2000; Palmer,
Gardner & Stough, 2003; Salovey & Grewal, 2005). Groves, Mc Enrue and Shen
(2008) suggest that the expanding research on EI has been encouraged by the
realisation that emotions play a significant part in the lives of people at work with
regard to their perceptions and interactions with other individuals, as they (i.e.
emotions) serve as a valuable basis of information that assists in understanding and
adapting in social settings (Salovey & Grewal, 2005).
Mayer et al. (2004) argue that individuals with a high EI typically identify emotions
better, and are able to understand and manage them better than individuals with a
lower EI. EI “is an intelligence that operates on, and with, emotional information.
Emotional information concerns the meaning of emotions, emotional patterns and
sequences, the appraisals of relationships they reflect…” (Mayer et al., 2004, p.209).
Whereas, EI can be increased through training (to, for example, improve
performance at work), cognitive intelligence and personality characteristics are rather
set in that it cannot easily be developed.
Stellenbosch University https://scholar.sun.ac.za
34
Based on Bar-On’s (Bar-On 1997; 2000; 2005) conceptualisation of EI, individuals
who portray emotional and social intelligence have the capability to understand
themselves and express their thoughts and feelings, and are also able to understand
others well, and develop strong relations with others. It has been argued that such
individuals handle life’s difficult situations more effectively than those who are less
emotionally and socially intelligent (Bar-On, Maree & Elias, 2007).
2.4.2 Brief Discussion of EI Models and Measurement
According to McEnrue, Groves, and Shen (2009), EI has been studied from four
perspectives. One model is Goleman’s “four-dimensional trait-based model of self-
awareness, self-management, social awareness and social skills” (McEnrue et al.,
2009, p.152). Another perspective is “Bar-On’s…five-dimensional trait-based model
consisting of intrapersonal, interpersonal, adaption, stress management, and general
mood factors” (McEnrue et al., 2009, p.152). Thirdly is “Dulewicz and Higgs’…seven-
dimensional trait-based model…comprised of self-awareness, emotional resilience,
motivation, interpersonal sensitivity, influence, intuitiveness, and conscientiousness”
(McEnrue et al., 2009, p.152). The last perspective is Mayer and Salovey’s (1997)
four branch ability model (McEnrue et al., 2009; Mayer et al., 2004). These authors
divided the EI abilities and skills into four components, which include the following
abilities (Mayer and Salovey, 1997; Mayer et al., 2004): (1) perception of emotions;
(2) using emotions in the facilitation of thoughts; (3) understanding emotions; and (4)
managing emotions. Spielberger (2004) reports that the three most used instruments
to measure EI are: (1) MSCEIT (Mayer-Salovey-Caruso Emotional Intelligence Test)
(Mayer, Salovey & Caruso, 2002); (2) ECI (Emotional Competence Inventory)
(Boyatzis, Goleman & HayGroup, 2001); and (3) Bar-On EQ-i (Emotional Quotient
Inventory) (Bar-On, 1997).
2.4.2.1 MSCEIT (Mayer-Salovey-Caruso Emotional Intelligence Test)
This instrument consists of 141 items that load onto four components of EI, which
have reliability coefficients ranging between 0.76 and 0.91 (Bar-On et al., 2007).
Compared to other measures of EI, the MSCEIT have showed the strongest
correlations with instruments that measure cognitive ability (Bar-On et al., 2007).
Furthermore, it has been found that scores increase with age, and that females tend
to score higher than males.
Stellenbosch University https://scholar.sun.ac.za
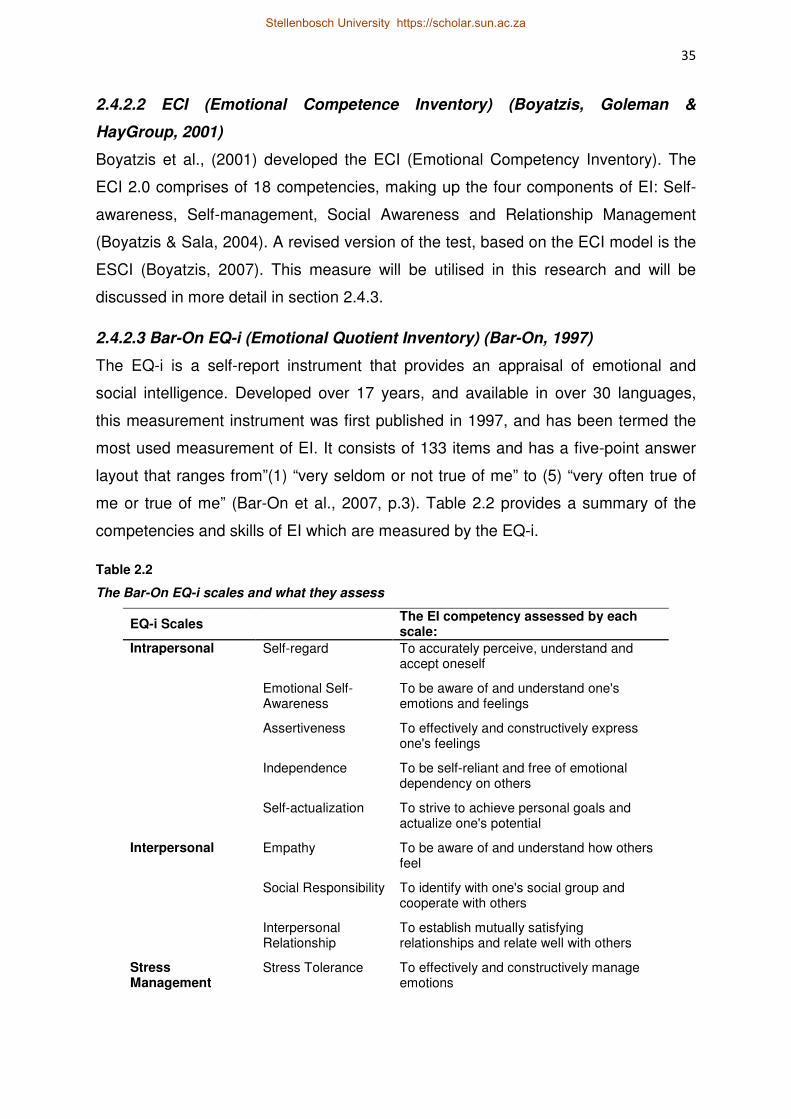
35
2.4.2.2 ECI (Emotional Competence Inventory) (Boyatzis, Goleman &
HayGroup, 2001)
Boyatzis et al., (2001) developed the ECI (Emotional Competency Inventory). The
ECI 2.0 comprises of 18 competencies, making up the four components of EI: Self-
awareness, Self-management, Social Awareness and Relationship Management
(Boyatzis & Sala, 2004). A revised version of the test, based on the ECI model is the
ESCI (Boyatzis, 2007). This measure will be utilised in this research and will be
discussed in more detail in section 2.4.3.
2.4.2.3 Bar-On EQ-i (Emotional Quotient Inventory) (Bar-On, 1997)
The EQ-i is a self-report instrument that provides an appraisal of emotional and
social intelligence. Developed over 17 years, and available in over 30 languages,
this measurement instrument was first published in 1997, and has been termed the
most used measurement of EI. It consists of 133 items and has a five-point answer
layout that ranges from”(1) “very seldom or not true of me” to (5) “very often true of
me or true of me” (Bar-On et al., 2007, p.3). Table 2.2 provides a summary of the
competencies and skills of EI which are measured by the EQ-i.
Table 2.2
The Bar-On EQ-i scales and what they assess
EQ-i Scales The EI competency assessed by each scale:
Intrapersonal Self-regard To accurately perceive, understand and accept oneself
Emotional Self-Awareness
To be aware of and understand one's emotions and feelings
Assertiveness To effectively and constructively express one's feelings
Independence To be self-reliant and free of emotional dependency on others
Self-actualization To strive to achieve personal goals and actualize one's potential
Interpersonal Empathy To be aware of and understand how others feel
Social Responsibility To identify with one's social group and cooperate with others
Interpersonal Relationship
To establish mutually satisfying relationships and relate well with others
Stress Management
Stress Tolerance To effectively and constructively manage emotions
Stellenbosch University https://scholar.sun.ac.za

36
Impulse Control To effectively and constructively control emotions
Adaptability Reality Testing To objectively validate one's feelings and thinking with external reality
Flexibility To adapt and adjust one's feelings and thinking to new situations
Problem-solving To effectively solve problems of a personal and interpersonal nature
General Mood Optimism To be positive and look at the brighter side of life
Happiness To feel content with oneself, others and life in general
(Bar-On, Maree & Elias, 2007)
2.4.2.4 Emotional Intelligence Scale (EIS)
Schutte et al. (1998) developed a self-report measure of EI based on the model of
Salovey and Mayer (1990). Starting with an initial pool of 62 items based on Salovey
and Mayer’s (1990) theoretical model, a result of a one-factor solution of 33 items
were suggested after a factor analysis. The 33 items represent components that fall
under the following categories: appraisal and expression of emotion in the self as
well as others; regulation of emotion in the self as well as others; and using emotions
in solving problems (Schutte et al., 1998). According to Bar-On et al., (2007), the EIS
(Schutte et al., 1998) has enjoyed the most experimental consideration. With internal
consistency approximations usually above 0.9, and test-retest reliability of 0.78
(Schutte et al., 1998), this measurement proves to be a very reliable instrument.
2.4.3 Dimensions of the Emotional and Social Competency Inventory (ESCI)
This study will focus on the EI dimensions measured by the ESCI: Self-awareness;
Self-management; Social Awareness; and Relationship Management. These EI
dimensions differ slightly from those used in Beyers’ research. Beyers’ (2006) work
was based on Goleman’s (1995) five components of EI: Self- awareness; Self-
regulation; Self-motivation; Empathy and Social Skills. Given that many of the EI
dimensions as used by Beyers (2006) are conceptually linked to the ESCI
components, the Goleman EI dimensions and the Beyers (2006) results will be
incorporated into the discussion in section 2.5, where the elaborated model will be
discussed.
Stellenbosch University https://scholar.sun.ac.za

37
2.4.3.1 Self-awareness
Self-awareness has to do with individuals being knowledgeable about their “internal
states, preferences, resources and intuitions” (Boyaztis, 2009, p.754). Self-
awareness refers to the awareness of one’s own feelings and the capability to
recognise and manage these in a way that one feels that one can control. It
describes a degree of self-belief in one’s capability to manage one’s emotions and to
control their impact in a work environment (Dulewicz & Higgs, 2005). Similarly,
Moshavi et al. (2003, p.407) state that Self-awareness has been defined “as one’s
ability to self-observe…to accurately compare one’s behaviour to a standard…and to
assess others’ evaluation of the self.”
2.4.3.2 Self-management
Self-management has to do with “managing one’s internal states, impulses and
resources” (Boyatzis, 2009, p.754); and includes achievement orientation,
adaptability, emotional self-control as well as having a positive outlook.
2.4.3.3 Social Awareness
Social Awareness has to do with the way in which individuals deal with, and manage
relationships. It involves being aware of the opinions, feelings and desires of other
people, and it comprises of empathy, organisational awareness and having a service
orientation (Boyatzis, 2009).
2.4.3.4 Relationship Management
Relationship Management has to do with the skill of positively affecting others’
responses and/or emotions. It includes “coach and mentor…inspirational
leadership…influence…conflict management… [and] teamwork…” (Boyatzis, 2009,
p.754).
2.4.4 The Value of EI in the Workplace
The increasing interest in the relationship between the effects of EI on success in the
workplace is rooted in the idea that EI possibly accounts for features of performance
at work (Carmeli, 2003; Côté & Miners, 2006) that personality and cognitive
intelligence does not affect (Rode et al., 2007). Research reflects the positive
relationship between individuals’ levels of EI and success in their careers, strength of
their personal relationships and their general health (Cooper; 1997). This could be
explained through the fact that people who are more emotionally intelligent are able
Stellenbosch University https://scholar.sun.ac.za
38
to communicate their thoughts more effectively (Goleman, 1998). Furthermore,
Cherniss (2001) argues that when organisations are led by individuals who are
emotionally intelligent, the employees’ levels of EI will increase, as well as their
levels of Organisational Commitment. Other examples of work aspects that are
affected by employees’ EI include teamwork, talent advancement, creativity, and
performance (Koman & Wolff, 2008). EI has also been found to predict employees’
levels of Job Satisfaction and Organisational Commitment. For example, Giles
(2001) reported a positive correlation between supervisors’ EI and the commitment
levels of employees on lower job grades.
Oginska-Bulik (2005) argues that not only is EI a significant aspect in ensuring
success in life and psychological health, but it is also plays an essential part in
determining the collaboration between employees and their workplace. The aim of
this study was to investigate the correlation between EI and the perceived stress
experienced in the workplace and other outcomes related to health (focussing
specifically on symptoms of depression). A sample of 330 employees from various
professions (including physicians and managers) were used in this study, and results
revealed an important (although weak) role of EI in the perception of stress in the
workplace and in the prevention of undesirable health consequences. The more
stress workers experienced at work, the worse their health was. The factors that
caused stress at work included being overworked and absence of rewards. It was
concluded that the capability to handle emotions and emotional information well in
the workplace helps workers to cope with stress at work (Oginska-Bulik, 2005).
People with a higher level of EI (who could better identify, express and manage
emotions), portrayed the capability to manage stress better than those with a lower
EI. Those with a higher EI also suffered less from negative health. It is therefore
suggested that EI be developed in stress management programs (Oginska-Bulik,
2005).
Guleryuz, Guney, Aydin and Asan (2008), using the data of 267 questionnaires
completed by nurses, studied the effect of the dimensions of EI on the levels of
Organisational Commitment of nurses, as well as the mediating effect of Job
Satisfaction in this relationship. Results showed that Job Satisfaction mediates the
relationship between EI and Organisational Commitment, and that Organisational
Commitment affects the effectiveness and efficiency of the organisation. The study
Stellenbosch University https://scholar.sun.ac.za

39
also further revealed that, amongst the nurses, those with a higher EI are likely to
have a higher level of Job Satisfaction. As discussed earlier, Job Satisfaction leads
to better performance, which is beneficial to the effectiveness of the organisation.
Palmer, Gardner and Stough (2003) also reported positive outcomes at work for
employees who have a high level of EI. As also noted by Emmerling, Shanwal and
Mandal (2008), such employees are likely to demonstrate better performance at
work. Furthermore, it has been shown that employees with higher EI will also be
more committed to the organisation, be more satisfied with their jobs, and are less
susceptible to stress in the workplace. From another perspective, Bagshaw (2000)
explains how employees who do not behave in an emotionally intelligent manner
could be a great cost for organisations. The author argues that low levels of EI
causes negative emotions such as “fear, anger and hostility” which will decrease
employee morale and increase absenteeism (Bagshaw, 2000, p.62).
Goleman (2001) argues that the presence of EI competencies may result in excellent
performance in the workplace. For example, Bachman, Stein, Campbell and
Sitarenios (2000), using a sample of account officers, reported empirical evidence
that those with a higher level of EI were more successful than those with a lower EI.
According to Goleman (1998), the main difference between successful and
unsuccessful managers is their level of EI. Those managers who do not perform well
are those who have weaker control over emotions, regardless of the fact that they
may have a high IQ and practical experience. Similarly, according to Gardner and
Stough (2002), assessing employees’ EI could assist an organisation in identifying
who will be effective leaders. The next section therefore focuses on the relationship
between EI and TFL.
2.4.5 The relationship between EI and TFL
EI skills are essential for excellent performance at work, especially for leaders
(Goleman, 1998). For example, Boyatzis (1982) has argued that various social skills,
such as being positive and having high self-esteem, predict successful leadership. In
a similar vein, Gowing (2001) argues that EI competencies have been used as
predictors of organisational effectiveness and successful performance of leaders in
various organisations for over three decades. According to Goleman (1998, p.92, as
cited by Duckett & Macfarlane, 2003) “IQ and technical skills do matter, but mainly
Stellenbosch University https://scholar.sun.ac.za
40
as threshold capabilities…recent research clearly shows that EI is the sine qua non
of leadership. Without it, a person can have the best training in the world, an incisive,
analytical mind, and an endless supply of smart ideas, but still will not make a good
leader.” Supporting this notion, Duckett and Macfarlane’s (2003) empirical study
revealed an association between success, EI and TFL. Salovey and Mayer (1990)
state that realising, responding to and influencing subordinates’ emotions is essential
in developing quality relationships with them; and George (2000) argues that leaders
who have a high EI will be able to develop such relationships, and this, in turn, will
lead to positive results for employees and the organisation. George (2000)
furthermore postulates that leaders with a higher EI will be more effective in their
decision making processes, and will be able to manage their emotions which may
hamper decision making.
Over the past few years organisational behavioural researchers have studied
emotions in the field of leadership (Bono & Ilies, 2006; Hur, et al., 2011). Hur et al.
(2011) examined the mediating effect of TFL on the relationship between EI and
team outcomes. The study revealed a positive correlation between EI and TFL (r =
0.46, p < .001), and the authors report that leaders with a higher level of EI were
rated as more effective, than leaders with a lower level of EI. Sy, Tram and O’Hara
(2006) found that leaders with higher levels of EI positively affect the Job Satisfaction
experienced by their subordinates.
Leaders who are perceived as successful and/or effective are those that portray EI
skills, such as being aware of, and responsive to, their own and other’s emotions
(Cacioppe, 1997; Cooper, 1997; Zeidner et al., 2004). Fitzgerald and Schutte (2010)
investigated whether enhancing leaders’ self-efficacy would increase their level of
TFL and TFL self-efficacy. In their study, the authors note that a number of
researchers have reported that leaders with a higher EI have been shown to apply a
more TFL style; and that TFL enhances positive organisational outcomes. Fitzgerald
and Schutte (2010) reported a positive association between EI and TFL (r = 0.58, p =
0.001). This result was a replication of the Polychroniou (2009) results. Using a
sample of 267 individuals in managerial positions, Polychroniou (2009) reported a
positive correlation between EI and TFL. The correlations between the various EI
dimensions and TFL ranged from 0.627 to 0.782 (p < 0.01).
Stellenbosch University https://scholar.sun.ac.za

41
Cote, Lopes, Salovey and Miners (2010) reported the results of two studies that
investigated the relationship between EI and the emergence of leadership in small
groups. Leadership emergence refers to the extent to which someone “who is not in
a formal position of authority influences the other members of a group” (Cote et al.,
2010, p.496). These studies were conducted using the MSCEIT, as well as five items
of the Conger-Kanungo leadership scale (Conger & Kanungo, 1994; Conger,
Kanungo & Menon, 2000). A number of EI dimensions correlated with the
emergence of leadership. The most consistent relationship was between leadership
emergence and the ability to understand emotions (one dimension of EI). This
suggests that potential leaders in an organisation can be identified through testing
their levels of EI.
Connelly and Ruark (2010) argue that, given the significance of expressing emotions
(a regular occurrence between leaders and subordinates) as a way of attaching
themselves to subordinates, more researchers have been giving attention to
transformational leaders’ emotions. They investigated the effect of leaders’ emotional
displays on subordinates’ satisfaction as well as performance levels. They also
looked at how the leaders’ emotional displays affected how subordinates assess
their leaders. The authors found that positive, as well as negative emotions are likely
to affect leaders, either positively or negatively; and it is conceded that effective
leadership is possibly affected by whether or not leaders understand the effect of
their emotional displays on their followers. It was also reported that transformational
leaders are more able at expressing a wider range of emotions (including negative
emotions) without causing subordinates to adversely alter their perceptions of their
leader. Furthermore, subordinates will feel less threatened by negative emotional
displays of the leaders if their leaders display individual consideration (a dimension
of TFL) of the followers’ needs (Connelly & Ruark, 2010).
According to various researchers, EI is a key factor that influences the effectiveness
of leaders (Gardner & Stough, 2002; Rosete & Ciarrochi, 2005) and it is clear that
leaders who are aware of emotions- their own and others’, are more effective in
challenging and motivating followers (Leban & Zulauf, 2004). Dincer, Gencer, Orhan
and Sahinbas (2011), for example, reported empirical evidence that managers with a
higher level of EI are better at making strategic decisions. The authors argue that
nowadays making effective decisions are critical in ensuring organisational success,
Stellenbosch University https://scholar.sun.ac.za

42
and that the EI of the leader is a core aspect that has an influence of the quality of
decision making (Dincer et al., 2011). The study clearly illustrated the significant
effect of EI on the performance of managers (e.g. Rahim & Psenicka, 2002).
Barling, Slater and Kelloway (2000) argue that there are numerous reasons why
transformational behaviours would probably be used more by individuals with a
higher EI than those with lower EI. Firstly, a leader who understands and is capable
of managing his/her own emotions, and who exhibits self-control, may be perceived
as a role model by his/her followers, so developing their trust in and respect for their
leader. This goes hand-in-hand with the core of Idealised Influence (a component of
TFL). From this it can therefore be hypothesised that a leader’s level of self-
management (according to the ESCI, i.e. emotional self-control) is positively related
to his/her Idealised Influence. Secondly, highlighting the concept of understanding
the emotions of other individuals, leaders with a high EI would be capable of
realising the degree to which their followers’ expectations could be lifted, “a hallmark
of inspirational motivation” (Barling et al., 2000, p.157). From this, it can be
hypothesised that the more Empathy (a sub-dimension of the ESCI Social
Awareness sub-scale) a leader displays, the more inspirationally motivating he/she
will be. Thirdly, a significant component of Individualised Consideration is to be able
to understand the needs of the followers, and take action according to this
understanding (encapsulated in the developing others sub-scale of the ESCI
Relationship Management dimension). “With its emphasis on empathy and the ability
to manage relationships positively, leaders manifesting EI would be likely to manifest
individualized consideration” (Barling et al., 2000, p.157).
According to Kerr, Garvin, Heaton and Boyle (2006, p.268), “Leadership is a process
of social interaction where the leader’s ability to influence the behaviour of their
followers can strongly influence performance outcomes”. Leadership is essentially an
emotional process through which leaders become aware of their subordinates’
emotions, try to affect emotions, and attempt to control their emotional states. Kerr et
al. (2006, p.268) further found that leaders enhance unity and morale by “creating
shared emotional experiences.” If leaders can affect emotions, they can also
significantly affect performance (Kerr et al., 2006). Staniforth and West (1995, p.28)
state that “effective leadership can provide motivation, task and goal clarification and
prompt and appropriate feedback.” It is furthermore stated that leadership “is the
Stellenbosch University https://scholar.sun.ac.za
43
process of making appropriate strategic interventions in order to give direction and
motivation to the team” (Staniforth & West, 1995, p.31). Leaders need intuition, good
judgement and to be able to analyse and handle risk. “Without sufficient and
appropriate leadership, residing in either one person or distributed across several
members, teams are unlikely to offer significant improvements over traditional ways
of working” (Staniforth & West, 1995, p.33). As highlighted previously, Kerr et al.
(2006) also argue that leaders that have high levels of EI can positively affect
effectiveness at all levels in a company. Also, those with an exceptional ability to
perceive and fathom emotions of people (e.g. empathy) are capable of responding
with flexibility to changes in their circumstances.
It is therefore clear that higher EI leads to better leadership effectiveness (Higgs &
Aitken, 2003; Rosete & Ciarrochi, 2005; Sosik & Megerian, 1999). Higgs and Aitken
(2003) noted numerous studies confirming the strong link between EI and leadership
effectiveness. According to them “much of the literature on Transformational
Leadership implies that leaders require emotional intelligence...there appears to be
strong indications of a linkage between leadership and emotional intelligence”
(Dulewicz & Higgs, 2005, pp.109, 110).
Boyatzis and Saatcioglu (2008, p.92) argue that EI and cognitive intelligence
competencies can be used to predict leadership effectiveness. These authors
furthermore suggest that EI can be developed in adults, implying that effective
leaders are in fact not born, but can also be developed. It is further highlighted that
cognitive intelligence is not the only factor affecting leadership effectiveness, but that
EI and social intelligence competencies are also essential (Boyatzis & Saatcioglu,
2008). The significance of these three constructs (cognitive intelligence, EI and
social intelligence) with regard to leadership effectiveness, is furthermore confirmed
by Goyal and Akhilesh (2007) as well as Hoffman and Frost (2006).
Downey et al. (2006) evaluated the correlation between EI, intuition and leadership
style. Their study was based on a sample of 176 female managers from various
industries, and EI was measured using a measure of EI specific to the workplace
(workplace Swinburne University Emotional Intelligence Test, Palmer & Stough,
2001) as well as the Trait Meta-Mood Scale (TMMS). The Multifactor Leadership
Questionnaire was used to evaluate leadership. The SUEIT measured the following
Stellenbosch University https://scholar.sun.ac.za

44
dimensions of EI: emotional recognition and expression; understanding emotions
external; emotions direct cognition; emotional management; and emotional control.
The TMMS measured the following dimensions of EI: attention to feelings; clarity of
feelings; and mood repair. Five components of TFL were assessed by the MLQ:
Inspirational Motivation; Idealised Behaviours; Idealised Attributes; Intellectual
Stimulation; and Individualised Consideration. The results revealed a positive
correlation between the TFL style and EI. More specifically, significant correlations
were found between understanding emotions external, emotional management,
emotional control, attention to feelings, clarity of feelings and each of the five
components of TFL.
Similarly, Barbuto and Burbach (2006), using a sample of 388 public officials
(including people in leadership positions as well as their subordinates), also
investigated the relationship between TFL and EI. The individuals in leadership
positions that were used in this study completed a self-report measure of EI by
Carson, Carson and Birkenmeier (2000), that consists of five subscales, namely
empathetic response, mood regulation, interpersonal skills, internal motivation, and
self-awareness (Barbuto & Burbach, 2006). To measure TFL, the authors used Bass
and Avolio’s (1995) MLQ (Multi-Factor Leadership Questionnaire). They, however,
only used four of the eight subscales: Inspirational Motivation; Intellectual
Stimulation; Idealised Influence (behaviors); and Individualised Consideration. Their
results revealed a significant correlation between the leaders’ EI and the four
dimensions of TFL (as rated by themselves as well as their subordinates). Their
results support the predictive significance of EI as an antecedent of TFL behaviours.
In another study, Gardner and Stough (2002), with a sample of 110 managers,
assessed whether EI as measured by the SUEIT predicts leadership (including the
transformational, transactional and laissez-faire leadership styles) as measured by
the MLQ. The strongest relationship that emerged was between Individualised
Consideration and understanding emotions of others. Results from the regression
analyses suggested that the being able to identify and understand others’ emotions
was the strongest predictor of TFL. Strong correlations were reported between all the
TFL components and two of the components of EI (understanding of emotions and
emotional management – the extent to which positive and negative emotions in
oneself and others can be managed) (Gardner & Stough, 2002). In a similar vein,
Stellenbosch University https://scholar.sun.ac.za
45
Barling et al. (2000), using a sample of 49 managers, reported a positive correlation
between Idealised Influence, Inspirational Motivation and Individualised
Consideration (three components of TFL) and EI (as measured by the Bar-On EQ-i,
Bar-On, 1997). The strongest correlation (r = 0.56, p < 0.01) was between total EI
and Inspirational Motivation. Therefore, leaders who are aware of their emotions, as
well as those of their subordinates, are most likely to challenge and inspire their
subordinates, and this Inspirational Motivation will lead to increased satisfaction with,
and more commitment from the subordinates (Barling et al., 2000). The authors
suggest a possible explanation for there not being a relationship between EI and
Intellectual Stimulation is that this specific component of TFL is more cognitive in
nature than the other three TFL components. Moreover, Palmer, Walls, Burgess and
Stough (2001) also reported a significant correlation between the ability to monitor
and manage emotions and the Inspirational Motivation and Individualised
Consideration dimensions of TFL. More specifically, Inspirational Motivation had a
0.42 (p < 0.01) and 0.37 (p < 0.01) correlation with the ability to monitor and manage
emotions respectively; and Individualised Consideration had a 0.55 and 0.35 (p <
0.05) correlation with the ability to monitor and manage emotions respectively.
Beyers’ (2006) findings confirmed that there is a positive correlation between EI and
TFL. Significant relationships were found between Social Skills and Idealised
Influence; Self-motivation and Inspirational Motivation; and between Empathy and
Social Skills and Individualised Consideration.
2.5 The modified and elaborated Beyer’s (2006) conceptual model proposed for
this study
All the literature presented above provides clear evidence for the association
between EI and TFL. However, apart from the attempt by Beyers (2006) to build a
conceptual model that reflects the nature of the interrelationships between the
different EI variables and dimensions of TFL, no other study could be located that
has attempted to explore the nature of these two constructs in this manner.
Hence, based on the findings of Beyers (2006) and the literature that was presented
in the previous section, a modified and elaborated conceptual model that depicts the
nature of the relationships between EI dimensions (based on the ESCI model and
measure), TFL dimensions and the three outcomes of effective leadership (i.e.
Stellenbosch University https://scholar.sun.ac.za

46
Perceived Supervisor Support, Organisational Commitment and Job Satisfaction) are
depicted in figure 2.5. In order to explain how the Beyer’s (2006) model has been
modified and elaborated, a short discussion of the original model, the results of the
model testing, as well as the unique components added to the model in this study
(ESCI components, outcomes of effective leadership) is presented next.
2.5.1 Beyer’s (2006) EI and TFL conceptual model
The Emotional Intelligence Index scale developed by Rahim and Minors (2003) was
utilised in Beyer’s (2006) research. This scale consists of five components of EI
based on the Goleman (1995) definition of EI. The five components include (Beyers,
2006) (1) self-awareness (i.e. knowledge of internal states, preferences, resources
and intuitions) which is comprised of emotional self-awareness; accurate self-
assessment, and self-confidence; (2) self-regulation (i.e. the ability to manage one’s
internal states, impulses, and resources) which is comprised of self-control,
trustworthiness, conscientiousness, adaptability, innovativeness; (3) self-motivation
(i.e. tendencies that guide an individual to reach his/her goals) comprised of
achievement drive, commitment, initiative, optimism; (4) social competence (i.e. how
an individual handles relationships) comprised of empathy, service orientation,
developing others, leveraging diversity, political awareness, and (5) social skills (i.e.
adeptness at inducing desirable responses in others) comprised of influence,
communication, leadership, change catalyst, conflict management, building bonds,
collaboration and cooperation, and team capabilities. The five components were
included in the structural model together with the four dimensions of TFL discussed
throughout this study. The initial proposed Beyer’s (2006) conceptual model is
presented in figure 2.3.
Stellenbosch University https://scholar.sun.ac.za

47
Figure 2.3. The initial proposed Beyers (2006) model
(Beyers, 2006, p.50)
The model was tested with Statistica’s SEPATH programme. Only two goodness-of-
fit (GIF) indicators were reported: the GFI (.483) and the AGFI (.440). Given that as a
general rule .9 is applied for these two indices to indicate good model fit, it was
concluded that the results did not provide evidence that the data supported the
model. Furthermore, almost no information was given as to whether the data was
formally tested in order to ensure that the normality assumption was not violated. It
was, however stated that “completed questionnaires clearly indicated that the
respondents’ answers were skewed to the right... the assumption of normality was
probably not met, and it was therefore unclear whether the SEPATH model results
could be accepted” (Beyers, 2006, p.75). Therefore the model was refitted with a
partial least squares approach (with SmartPLS). According to Beyers (2006) the
results of this analysis (together with the SEPATH results) provided empirical
support for 8 of the 11 proposed paths in the model. The final model for which
sufficient support, according to Beyers (2006) was found in the study, is presented in
figure 2.4.
Stellenbosch University https://scholar.sun.ac.za

48
Figure 2.4. The summarised conceptual model of significant relationships
(Beyers, 2006, p.84)
2.5.2 Proposed modifications and elaborations of the Beyer’s model
A modification of the Beyer’s (2006) final model entailed that the ESCI was utilised
as a measure of EI in this research. The EI dimensions as used by Beyers (2006),
based on the Goleman EI model, bare similarity to some of the ESCI dimensions and
sub-dimensions that were used in this research. For example, both models include
the dimension of Self-awareness with similar sub-dimensions (i.e. emotional
awareness, accurate self-assessment). However, the ESCI includes self-
management as a dimension, which consists of self-control, adaptability,
transparency, achievement orientation, initiative and optimism). One could argue that
these have a conceptual overlap with the Self-regulation EI dimension utilised in the
Beyers’ model (which also include self-control, adaptability, trustworthiness,
conscientiousness and innovativeness). The ESCI includes a Social Awareness
dimension. Empathy, organisational awareness and service orientation are sub-
dimensions of social awareness. Empathy, however, was a separate dimension in
the EI model utilised in the Beyer’s (2006) research. Within the Goleman framework
Empathy consists of five sub-dimensions (see table 2.3). However, by investigating
the content of the “Empathy” and “Social awareness” dimensions, it was clear that
these dimensions were conceptually fairly similar. Furthermore, a last dimension of
Stellenbosch University https://scholar.sun.ac.za
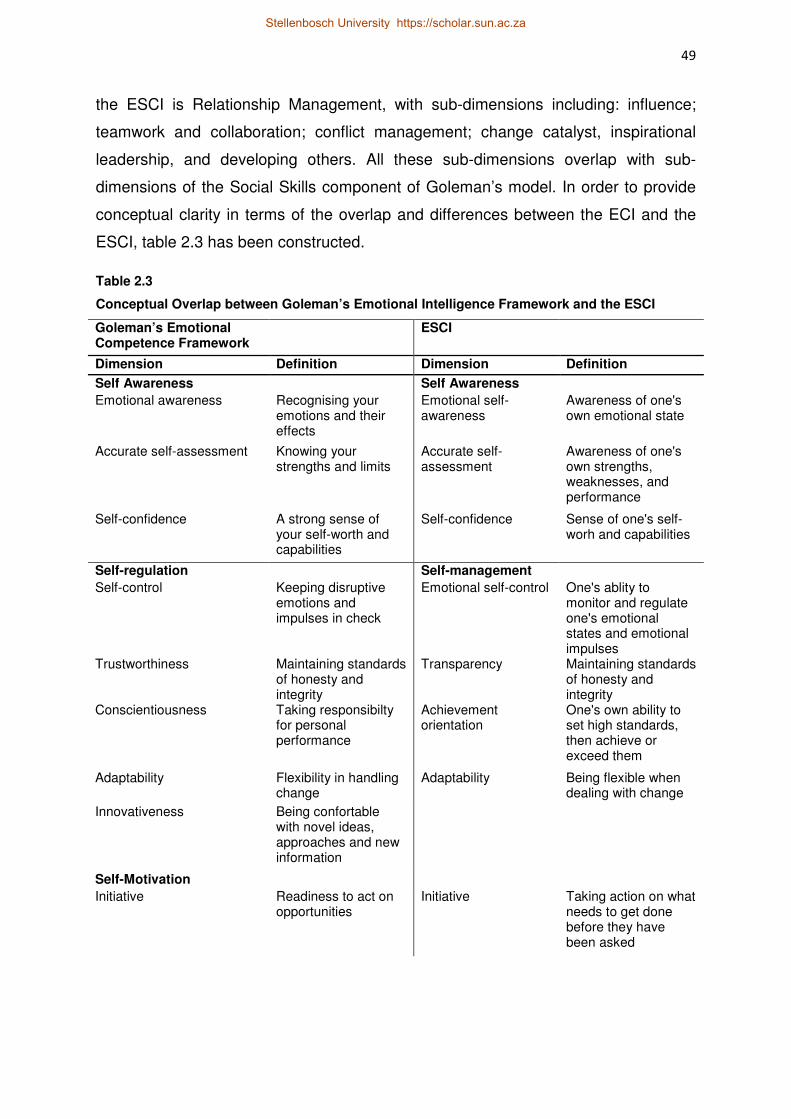
49
the ESCI is Relationship Management, with sub-dimensions including: influence;
teamwork and collaboration; conflict management; change catalyst, inspirational
leadership, and developing others. All these sub-dimensions overlap with sub-
dimensions of the Social Skills component of Goleman’s model. In order to provide
conceptual clarity in terms of the overlap and differences between the ECI and the
ESCI, table 2.3 has been constructed.
Table 2.3
Conceptual Overlap between Goleman’s Emotional Intelligence Framework and the ESCI
Goleman’s Emotional Competence Framework
ESCI
Dimension Definition Dimension Definition
Self Awareness Self Awareness
Emotional awareness Recognising your emotions and their effects
Emotional self-awareness
Awareness of one's own emotional state
Accurate self-assessment Knowing your strengths and limits
Accurate self-assessment
Awareness of one's own strengths, weaknesses, and performance
Self-confidence A strong sense of your self-worth and capabilities
Self-confidence Sense of one's self-worh and capabilities
Self-regulation Self-management
Self-control Keeping disruptive emotions and impulses in check
Emotional self-control One's ablity to monitor and regulate one's emotional states and emotional impulses
Trustworthiness Maintaining standards of honesty and integrity
Transparency Maintaining standards of honesty and integrity
Conscientiousness Taking responsibilty for personal performance
Achievement orientation
One's own ability to set high standards, then achieve or exceed them
Adaptability Flexibility in handling change
Adaptability Being flexible when dealing with change
Innovativeness Being confortable with novel ideas, approaches and new information
Self-Motivation
Initiative Readiness to act on opportunities
Initiative Taking action on what needs to get done before they have been asked
Stellenbosch University https://scholar.sun.ac.za

50
Optimism Persistence in pursuing goals despite obstacles and setbacks
Optimism Optimistic outlook; persistence in pursuing goals despite obstacles
Achievement drive Striving to improve or meet a standard of excellence
Commitment Aligning with the goals of the group or organisation
Social skills Relationship Management
Influence Wielding effective tactics for persuasion
Influence Wielding effective tactics for persuasion
Communication Listening openly and sending convincing messages
Inspirational leadership
Inspiring and guiding individuals and having them follow without force
Leadership Inspiring and guiding individuals and groups
Change catalyst Initiating or managing change
Change catalyst Initiating or managing change
Conflict management Negotiating and resolving disagreements
Conflict management Negotiating and resolving disagreements
Developing others Sensing and bolstering others' development needs
Building bonds Nurturing instrumental relationships
Teamwork and collaboration
Respecting, and collaborating with other team members while being cooperative and sharing
Collaboration and cooperation
Working with others towards shared goals
Team capabilities Creating group synergy in pursuing collective goals
Empathy Social Awareness
Developing others Sensing the development needs of others and bolstering their abilities
Empathy Sensing and understanding what others are feeling
Understanding others Sensing the feelings and perspectives of others and taking active interest in their concerns
Organisational awareness
Reading a group's emotional currents and power relationships
Service Orientation Anticipating, recognising and meeting customer's needs
Service orientation Ability to understand others' needs and provide services to meet their needs
Stellenbosch University https://scholar.sun.ac.za

51
Leveraging diversity Cultivating opportunities through different kinds of people
Political awareness Reading a group's emotional currents and power relationships
It has been established that EI is a key factor that influences the effectiveness of
leaders (Gardner & Stough, 2002; Rosete & Ciarrochi, 2005). Leaders who are
aware of emotions – their own and others’ are more effective in challenging and
motivating followers (Leban & Zulauf, 2004). Furthermore, leaders who have a TFL
style have been shown to be more able at expressing a wider range of emotions
(including negative emotions) without causing subordinates to adversely alter their
perceptions of the leader. In the Beyer’s (2006) results it was argued that emotional
Self-awareness was found to be the cornerstone of the EI. The results highlighted
the fact that Self-awareness, “influences self-regulation, empathy and self-
motivation, while empathy and self-regulation in turn influences social skills” (Beyers,
2006, p.85). The hierarchical nature of the EI construct was originally mentioned by
Salovey and Mayer (1990). In the modified and elaborated conceptual (structural)
model tested in this research, this assumption is also built into the model. It is
hypothesised that Self-awareness only affects various TFL behaviours through its
effect on other EI components (e.g. Self-management and Social Awareness).
For example, Beyers (2006) reported evidence that supported the hypothesis that
the effect of leader self-awareness on Individualised Consideration was mediated
through Empathy. This result made sense as a significant component of
Individualised Consideration is to be able to understand the needs of followers, and
take action according to this understanding. Hence it was argued that leaders who
display empathy as a component of EI will probably display Individualised
Consideration (Barling et al., 2000). In the ESCI model, empathy is a sub-dimension
of Social Awareness. The path between Self-awareness and Individualised
Consideration was, therefore, replicated in this study. However, it was modified
through the hypothesis that the relationship is mediated by Social Awareness.
Beyers (2006) also reported evidence that the effect of Self-awareness on Social
Skills were mediated by empathy, as well as Self-regulation. Furthermore, a
Stellenbosch University https://scholar.sun.ac.za
52
significant effect of Social Skills on the TFL dimension of Idealised Influence was
also evident. It has been argued that TFL behaviours will be used more by
individuals with a higher EI than those with a lower EI (Barling et al, 2000). For
example, a leader who understands his/her emotions (Self-awareness), is more able
to exhibit self-control (a component of self-regulation or self-management within the
ESCI model), may be more aware, of and in tune with, what others may be feeling
(i.e. social awareness / empathy) and may therefore be perceived as a role model to
his/her followers (Idealised Influence) due to the trust and respect that is developed
for the way in which the leader reacts towards the follower. These paths were also
replicated in the current model. That is, it was hypothesised that the effect of Self-
awareness on Idealised Influence is mediated by Self-management. Moreover, it
was also hypothesised the effect of Self-awareness on Idealised Influence could also
be mediated through Social Awareness and Relationship Management. Hence it is
argued that when a leader exhibits emotional Self-awareness, this will impact on the
Social Awareness capability of the leader, which in turn would manifest in better
Relationship Management (e.g. sensing and meeting development needs of the
follower), which would ultimately impact on the degree to which the follower
perceives the leader to display Idealised Influence, as a TFL behaviour. In the same
vein it was argued that there is also a relationship between a leader’s Self-
management and Relationship Management.
Furthermore, Beyers reported evidence that the path from Self-awareness to
Inspirational Motivation was mediated by Self-motivation. Given the conceptual
overlap between the sub-dimensions of Goleman’s motivation dimension with the
sub-dimensions of the ESCI’s self-management dimension, it was hypothesised in
the present study that there is a path between Self-awareness and Inspirational
Motivation, mediated by Self-management.
Beyers (2006) also reported evidence to support a path from Self-awareness to
Empathy. Given that Empathy is a sub-dimension of the ESCI’s Social Awareness
dimension, a path from Self-awareness to Social Awareness was hypothesised in
this study. Social Awareness contains the sub-dimensions of empathy,
organisational awareness and service orientation. These sub-dimensions entail the
skills of being able to read and understand the emotions of others, being able to
understand what other individuals need, and finding ways of meeting those needs. It
Stellenbosch University https://scholar.sun.ac.za

53
also entails the ability to read a group's emotional currents and power relationships.
These characteristics in a leader can help encourage followers to commit to the
organisation’s vision and mission as employees would feel valued if the leader
displays an awareness of the emotional needs of their followers. Committed
employees would also put in extra effort at work – which is an outcome of
Inspirational Motivation (TFL dimension). Therefore a direct path from Social
Awareness to Inspirational Motivation was also hypothesised.
Beyers’ (2006) results revealed no correlations between any of the EI dimensions
and Intellectual Stimulation. Moreover, no paths from any of the EI sub-dimensions
to Intellectual Stimulation in the initial model were included. Barling et al., (2000)
conducted an exploratory study on the relationship between and TFL and EI. With a
sample of 60 managers, using the MLQ to assess TFL and the Emotional
Intelligence Inventory to assess EI, the authors also reported no relationship
between any of the EI dimensions and Intellectual Stimulation (however, significant
relationships between EI and the other three dimensions of TFL were found). The
authors argued that a possible explanation for the lack of any relationship between
EI and Intellectual Stimulation could be because of the cognitive nature of this TFL
dimension: providing intellectual challenges, encouraging initiative; whereas the
other three dimensions (Inspirational Motivation, Idealised Influence and
Individualised Consideration) rely more on emotional competencies. In the present
study, therefore, consistent to the Beyer’s model, no paths were hypothesised
between any of the EI dimensions and Intellectual Stimulation.
As part of the extension of the Beyer’s model, three positive outcomes of TFL were
added into the model (i.e. Perceived Supervisor Support, Job Satisfaction and
Organisational Commitment of the follower). For example, it was hypothesised in the
present study that Individualised Consideration directly affects all three of these
outcomes positively. Previous research has established that a leader’s behaviour is
one of the most significant predictors of an employee’s Job Satisfaction (Glisson &
Durick, 1988; Koc, 2011). For example, Li and Hung (2009) have shown that due to
the fact that transformational leaders provide more support and consideration for
subordinates, subordinates report higher satisfaction with the leader. Recognition
and regular feedback from leaders, characteristic of Individualised Consideration,
also create good relations between the leader and follower (Gentry et al., 2007)
Stellenbosch University https://scholar.sun.ac.za

54
which could impact positively on follower Job Satisfaction. In addition, it is also
argued that leaders who display such Individualised Consideration, through paying
individual attention to followers and encouraging development, will have a positive
influence on the subordinates’ levels of Organisational Commitment. For example,
Arnold and Davey (1999) found that intrinsic work aspects such as career
development play a large role in the Organisational Commitment levels of
employees. Similarly, Graen et al. (1982) reported that when leaders value their
subordinates’ efforts, interests and welfare, employees tend to remain at the
organisation. A direct path from Individualised Consideration to Organisational
Commitment was therefore hypothesised in the present study. A path from
Individualised Consideration dimension of TFL to Perceived Supervisor Support was
also hypothesised in the study. As discussed in section 2.3.3.2, the leader behaviour
required for positive subordinate Perceived Supervisor Support (for example:
showing personal concern for subordinates and treating them as significant) are
portrayed in the Individualised Consideration dimension which involves the leader
paying personal attention the each subordinate.
Moreover, in the extended Beyer’s model proposed for this study, it was further
argued that the TFL dimension of Idealised Influence also directly affects all three
outcomes of effective leadership (i.e. Perceived Supervisor Support, Job Satisfaction
and Organisational Commitment). Idealised Influence refers to the fact that leaders
are viewed as role models by their followers. Such leaders have high self-
confidence. However, such leaders also display confidence in the abilities of their
followers, which acts as a motivational factor for followers. Hence, such a display of
trust and confidence in followers may enhance follower Job Satisfaction positively as
leader behaviour is a major contributor to employees’ Job Satisfaction (Avolio et al.,
1999; Glisson & Durick, 1988; Mardanov, et al., 2008). It may also enhance feelings
of Organisational Commitment as leaders who display Idealised Influence instil
enthusiasm into followers about tasks, whilst displaying a positive work ethic which
followers often would like to emulate. Furthermore, given that Perceived Supervisor
Support involves supervisors expressing personal concern for subordinates (Maertz
et al., 2007) with regard to their well-being, as well as treating subordinates as
valuable contributors, it was argued that such behaviour would enhance the quality
of the relationship between the leader and subordinate. It was therefore
Stellenbosch University https://scholar.sun.ac.za

55
hypothesised that there is a positive relationship between the Idealised Influence
dimension of TFL and Perceived Supervisor Support as well.
As argued by Krishnan (2005), employees’ Organisational Commitment levels
increases as a result of TFL behaviours. More specifically, Inspirational Motivation as
a TFL behaviour could be particularly important in enhancing the Organisational
Commitment of followers. Hence, it was hypothesised that Inspirational Motivation as
displayed by a leader, has a direct positive effect on the Organisational Commitment
of followers. Leaders who display Inspirational Motivation are adept at making
followers aware of the mission and vision of the company, whilst encouraging
followers to commit to the vision. Such leadership behaviours also often lead to extra
effort from followers, which could be encapsulated in Organisational Commitment
from the follower.
The extended model also includes a direct path from Organisational Commitment to
Job Satisfaction, suggesting that when followers are likely to report more
Organisational Commitment they may experience more Job Satisfaction. Arnold and
Davey (1999) as well as Glisson and Durick (1988) report evidence that
Organisational Commitment are correlated to Job Satisfaction. Pool and Pool (2007)
have argued that increased trust amongst employees promotes Organisational
Commitment, and employees are encouraged to stay with the organisation as
Organisational Commitment is key in boosting Job Satisfaction and motivation levels.
Similarly, Yousef (2000) reports that commitment levels of employees mediated the
relationship between the behaviour of the leaders and the followers’ satisfaction and
performance levels. It is therefore believed that there is a path from Organisational
Commitment to Job Satisfaction. When it comes to the growth and performance of
subordinates, receiving support is significant. When individuals have support, it is
easier to handle hardships; deal with challenges and remain positive in order to
continue being successful (Gentry, et al., 2007). It is further suggested that various
forms of support (such as fair decision-making process and individual concern) result
in employees’ satisfaction, development, and effective performance (Gentry, et al.,
2007). From this, as argued earlier, it was therefore hypothesised that there should
be a path from Individualised Consideration to Perceived Supervisor Support, and
from Individualised Consideration to Job Satisfaction. In addition to this, a path from
Perceived Supervisor Support to Job Satisfaction was also hypothesised.
Stellenbosch University https://scholar.sun.ac.za

56
When leaders value their subordinates’ efforts, interests and welfare, and allow for
good communication at the workplace, employees tend to remain at the organisation
(Graen et al., 1982). This is characteristic of an environment with high Perceived
Supervisor Support. Employees generally report feeling attached to the organisation,
which will, in turn, lead to the organisation being successful at retaining employees
(Gentry et al., 2007, Maertz, et al., 2007). It was therefore hypothesised that there
should be a direct path from Perceived Supervisor Support to Organisational
Commitment included in the model.
The TFL style has been found to be more effective than other leadership styles (e.g.,
Transactional or Laissez-faire Leadership), and has been associated with positive
outcomes in the workplace such as increased effort, performance, satisfaction, and
commitment (Leban & Zulauf, 2004; Limsila & Ogunlana, 2008; Moshavi et al.,
2003). Hence, it was argued that when leaders encourage innovation, creativity and
participation in decision making from subordinates (characteristic of Intellectual
Stimulation), subordinates will be more satisfied at work. From this it was
hypothesised that there should be a direct path from Intellectual Stimulation to Job
Satisfaction. The modified and elaborated Beyer’s (2006) model, proposed for this
study, is depicted in figure 2.5.
Stellenbosch University https://scholar.sun.ac.za

57
Figure 2.5. Proposed conceptual (structural) model for this study
2.6 Summary
This study aims to elaborate on the work of Beyers (2006) by including Perceived
Supervisor Support, Organisational Commitment and Job Satisfaction as outcomes
of TFL in an elaborated conceptual model that depicts the nature of the relationships
between EI dimensions, TFL dimensions and the three outcomes of effective
leadership. The literature study presented a theoretical background which argued for
suggested relationships between EI, TFL, Job Satisfaction, Organisational
Commitment and Perceived Supervisor Support in the proposed model, presented
above. The validity of these suggested relationships will be evaluated by testing the
model. The next chapter will present the various research hypotheses and the
methodology that will be used to test these hypotheses.
NOTE: SA: Self Awareness; SM: Self-management; SocA: Social awareness; RM: Relationship management; II: Idealized
influence; IS: Intellectual stimulation; IC: Individualized consideration; IM: Inspirational motivation; PSS: Perceived
supervisor support; JS: Job satisfaction; OC: Organisational commitment
Stellenbosch University https://scholar.sun.ac.za

58
CHAPTER 3: RESEARCH METHODOLOGY
3. 1 Introduction
Chapter two reviewed the literature regarding the various constructs and their
relationships with each other. This chapter will present a discussion regarding the
purpose and aims of this study, as well the research objectives, hypotheses and
design. This will be followed by a discussion about the measurement instruments
that were used in the study. A detailed analysis of the psychometric properties of the
instruments for the current sample is presented at the beginning of chapter 4.
3.2 Research Purpose
Cherniss and Goleman (2001) discussed the significant role of EI in the
effectiveness of organisations. These authors argued that the most effective leaders
in the workplace are those that are able to identify their subordinates’ emotions, as
well as their own, and to effectively deal with employees who need encouragement
and are not satisfied at work. In essence, Cherniss and Goleman (2001) state that
effective leaders are those who are emotionally intelligent. The assumption that
leaders with a higher EI are more effective has been studied and confirmed by
various researchers, for example Rosete and Ciarrochi (2005) as well as Higgs and
Aitken (2003).
The results of the Beyers’ (2006) study were discussed in detail in chapter 2. The
present study aimed to expand on the work of Beyers (2006) by using a more recent
model of EI developed by Boyatzis and Goleman in 2007, which was measured with
an updated measuring instrument, namely the Emotional and Social Competency
Inventory (ESCI). Research clearly shows that successful leadership is related to
positive organisational outcomes, such as increased Job Satisfaction and
Organisational Commitment. Organisational Commitment and Job Satisfaction have
also been revealed as outcomes of Perceived Supervisor Support (Yousef, 2000),
which, in turn, is an outcome of successful leadership. In other words, effective
leadership will result in positive Perceived Supervisor Support. This study, therefore,
aimed to elaborate on the work of Beyers (2006) by including Perceived Supervisor
Support, Organisational Commitment and Job Satisfaction as outcomes of TFL in an
Stellenbosch University https://scholar.sun.ac.za
59
elaborated structural model that depicts the nature of the relationships between EI
dimensions, TFL dimensions and the three outcomes of effective leadership.
3.3 Research Aim, Question and Objectives
This research attempted to expand and elaborate Beyers’ (2006) structural model
reflecting the impact of EI on TFL. The Beyers’ (2006) model was modified and
elaborated on by suggesting the use of a more recent measure of EI (the ESCI) and
also adding Perceived Supervisor Support, Job Satisfaction and Organisational
Commitment to the model as outcomes of effective TFL.
Based on the theoretical background, the following research question could be
stated:
Does the conceptual model (depicted in figure 2.5) provide a valid account of the
psychological processes that determines the outcomes of effective leadership,
defined as Perceived Supervisor Support, Job Satisfaction and Organisational
Commitment, as experienced by the follower of a particular leader that exhibits
certain TFL behaviours being influenced by various EI competencies?
The research objectives included to:
• develop a conceptual (structural) model, which is an expanded and adapted
version of the Beyers’ (2006) model, and to
• test the fit of the outer and inner model via Partial Least Squares modelling
(PLS).
3.4 Research Hypotheses
The overarching notion of this study is that the conceptual model depicted in figure
2.5 (section 2.5.2) provides a valid account of the psychological process that
determines the outcomes of effective leadership (defined as Perceived Supervisor
Support, Job Satisfaction and Organisational Commitment) as experienced by the
follower of a particular leader that exhibits certain TFL behaviours being influenced
by various EI competencies.
Therefore, the following twenty research hypotheses were developed, describing the
conceptual (structural) model.
Stellenbosch University https://scholar.sun.ac.za

60
Hypothesis 1: Self-awareness (SA) positively influences Self-management (SM).
Hypothesis 2: Self-awareness (SA) positively influences Social Awareness (SocA).
Hypothesis 3: Self-management (SM) positively influences Relationship
Management (RM).
Hypothesis 4: Self-management (SM) positively influences Idealised Influence (II).
Hypothesis 5: Self-management (SM) positively influences Inspirational Motivation
(IM).
Hypothesis 6: Social Awareness (SocA) positively influences Relationship
Management (RM).
Hypothesis 7: Social Awareness (SocA) positively influences Individualised
Consideration (IC).
Hypothesis 8: Social Awareness (SocA) positively influences Inspirational Motivation
(IM).
Hypothesis 9: Relationship Management (RM) positively influences Idealised
Influence (II).
Hypothesis 10: Idealised Influence (II) positively influences Perceived Supervisor
Support (PSS).
Hypothesis 11: Idealised Influence (II) positively influences Job Satisfaction (JS).
Hypothesis 12: Idealised Influence (II) positively influences Organisational
Commitment (OC).
Hypothesis 13: Intellectual Stimulation (IS) positively influences Job Satisfaction
(JS).
Hypothesis 14: Individualised Consideration (IC) positively influences Perceived
Supervisor Support (PSS).
Hypothesis 15: Individualised Consideration (IC) positively influences Job
Satisfaction (JS).
Hypothesis 16: Individualised Consideration (IC) positively influences Organisational
Commitment (OC).
Hypothesis 17: Inspirational Motivation (IM) positively influences Organisational
Commitment (OC).
Hypothesis 18: Perceived Supervisor Support (PSS) positively influences Job
satisfaction (JS).
Stellenbosch University https://scholar.sun.ac.za

61
Hypothesis 19: Organisational commitment (OC) positively influences Job
satisfaction (JS).
Hypothesis 20: Perceived Supervisor Support (PSS) positively influences
Organisational Commitment (OC).
3.5 Research Design and Procedure
3.5.1 Research Design
The relationship between the variables in the proposed model was investigated
using an ex post facto correlation design. Given the nature of the variables,
experimental manipulation is not possible. The research design should control
variance so that the effect of EI and TFL on the outcomes of effective leadership can
be differentiated from other factors that could be causing variance in the outcomes of
effective leadership. However, with this design, one does not have control over
extraneous variables that could cause variance. Furthermore, causal conclusions
from significant path coefficients obtained through the results cannot be made, as
correlations do not suggest causation.
3.5.2 Sampling design, data collection and ethical considerations
The aim of sampling is to use a sample that represents the whole population as
efficiently as possible. A sample that accurately portrays the characteristics of the
population is said to be representative. The ideal would be to use the whole target
population in the study, but this is not practically possible. Therefore a sample of the
population was used.
For the purpose of this study, units of analysis were sampled from the population.
The target population was individuals in leadership positions (managers and
supervisors). More specifically, a total of 132 managers and supervisors from
institutions in various industries were approached to participate. These industries
included: government services, financial services, higher education, as well as a
non-government organisation.
.
Two types of sampling procedures can be distinguished, namely:
Stellenbosch University https://scholar.sun.ac.za

62
1. probability sampling procedures in which each element in the sampling
population has a known, positive probability of being selected into the
sample; and
2. non-probability sampling procedures in which the probability of
selection is unknown for each element of the sampling population.
A non-probability sampling procedure was used in this study. The managers rated
their own EI and TFL. It was requested that at least two subordinates of each
manager also participate (therefore at least 264 subordinates). The subordinates
were asked to rate their manager’s TFL and EI. Furthermore, each subordinate self-
reported on their perceived levels of Job Satisfaction, Organisational Commitment,
and Perceived Supervisor Support.
Of the 132 managers that were approached, questionnaires were received back from
92 managers (a response rate of 69.7%) of which 85 questionnaires were suitable
for use in this study. Given that it was requested that at least 2 subordinates per
manager participates, more than two subordinate questionnaires were distributed to
each manager (allowing for as many subordinate participants as possible). This
means that in many cases there were differing amounts of subordinate responses
per manager. For example, some managers had two subordinates linked to them,
where other managers had four subordinates linked to them. In total, 305
subordinate questionnaires were distributed, of which 198 were returned (which is a
response rate of 64.92%) of which 182 questionnaires were suitable for use in this
study.
Data collection commenced after ethical clearance had been obtained. The
institution’s management (or human resources director) was asked to provide written
permission that access will be given to their employees. The supervisor / manager
were asked to complete an informed consent form informing them that their
leadership behaviour and EI will be rated by their employees. Their own responses
on the TFL and EI assessments were anonymous, as well as the subordinate
ratings, and a coding system was employed to match the employee to the supervisor
/ manager. Every employee rated their supervisor’s leadership behaviours and EI, as
well as their own levels of Job Satisfaction, Organisational Commitment and
Stellenbosch University https://scholar.sun.ac.za
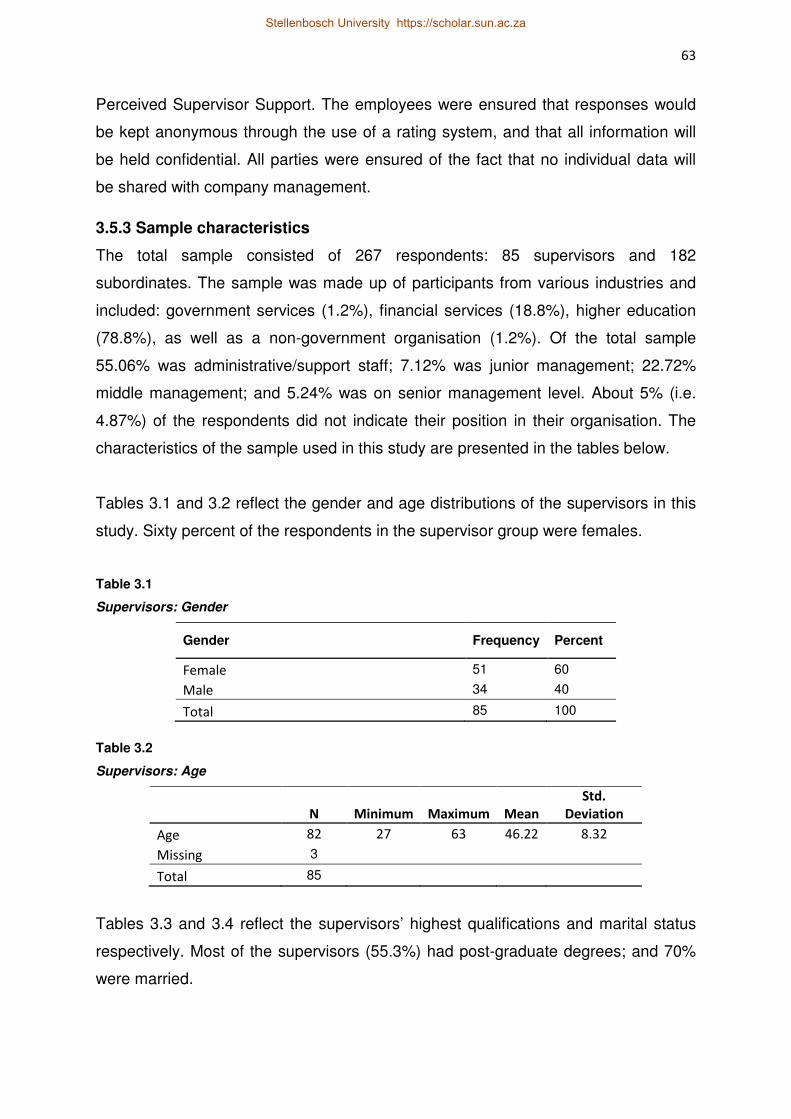
63
Perceived Supervisor Support. The employees were ensured that responses would
be kept anonymous through the use of a rating system, and that all information will
be held confidential. All parties were ensured of the fact that no individual data will
be shared with company management.
3.5.3 Sample characteristics
The total sample consisted of 267 respondents: 85 supervisors and 182
subordinates. The sample was made up of participants from various industries and
included: government services (1.2%), financial services (18.8%), higher education
(78.8%), as well as a non-government organisation (1.2%). Of the total sample
55.06% was administrative/support staff; 7.12% was junior management; 22.72%
middle management; and 5.24% was on senior management level. About 5% (i.e.
4.87%) of the respondents did not indicate their position in their organisation. The
characteristics of the sample used in this study are presented in the tables below.
Tables 3.1 and 3.2 reflect the gender and age distributions of the supervisors in this
study. Sixty percent of the respondents in the supervisor group were females.
Table 3.1
Supervisors: Gender
Gender Frequency Percent
Female 51 60
Male 34 40
Total 85 100
Table 3.2
Supervisors: Age
N Minimum Maximum Mean
Std.
Deviation
Age 82 27 63 46.22 8.32
Missing 3
Total 85
Tables 3.3 and 3.4 reflect the supervisors’ highest qualifications and marital status
respectively. Most of the supervisors (55.3%) had post-graduate degrees; and 70%
were married.
Stellenbosch University https://scholar.sun.ac.za
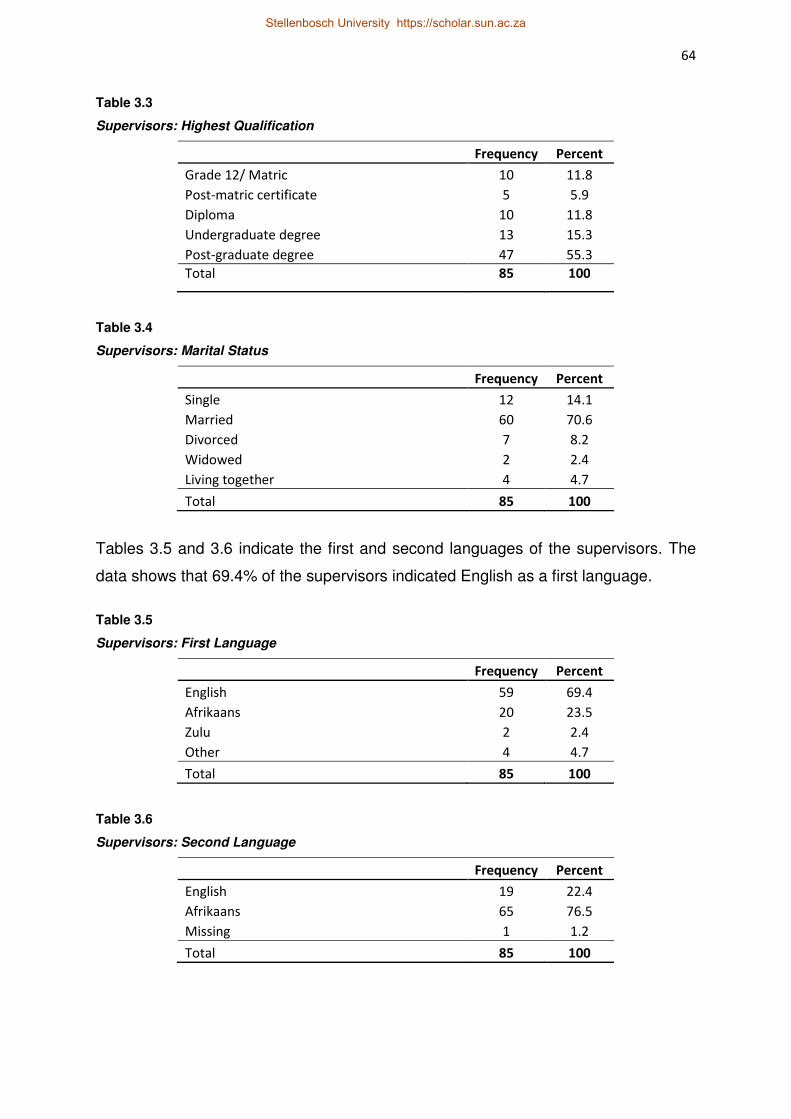
64
Table 3.3
Supervisors: Highest Qualification
Frequency Percent
Grade 12/ Matric 10 11.8
Post-matric certificate 5 5.9
Diploma 10 11.8
Undergraduate degree 13 15.3
Post-graduate degree 47 55.3
Total 85 100
Table 3.4
Supervisors: Marital Status
Frequency Percent
Single 12 14.1
Married 60 70.6
Divorced 7 8.2
Widowed 2 2.4
Living together 4 4.7
Total 85 100
Tables 3.5 and 3.6 indicate the first and second languages of the supervisors. The
data shows that 69.4% of the supervisors indicated English as a first language.
Table 3.5
Supervisors: First Language
Frequency Percent
English 59 69.4
Afrikaans 20 23.5
Zulu 2 2.4
Other 4 4.7
Total 85 100
Table 3.6
Supervisors: Second Language
Frequency Percent
English 19 22.4
Afrikaans 65 76.5
Missing 1 1.2
Total 85 100
Stellenbosch University https://scholar.sun.ac.za

65
Table 3.7 indicates the ethnic groups of the supervisors that participated in the study.
Of the supervisor sample, 58.8% were white and 29.4% coloured.
Table 3.7
Supervisors: Ethnic Group
Frequency Percent
Black 3 3.5
Coloured 25 29.4
White 50 58.8
Indian 2 2.4
Other Asian 1 1.2
Other 2 2.4
Total 85 100
Tables 3.8 and 3.9 reflect the gender and age distribution of the subordinates that
participated in this study. Roughly 66% of the respondents in the subordinates group
were females, with a mean age of 39.
Table 3.8
Subordinates: Gender
Gender Frequency Percent
Female 120 65.93
Male 59 32.42
Missing 3 1.65
Total 182 100
Table 3.9
Subordinates: Age Distribution
N Minimum Maximum Mean
Std.
Deviation
Age 178 22 66 39.93 10.36
Missing 4
Total 182
Tables 3.10 and 3.11 reflect the subordinates’ highest qualifications and marital
status respectively. About 39% of the subordinates have postgraduate degrees
whilst 20.88% only have a matric certificate. Fifty four percent were married.
Stellenbosch University https://scholar.sun.ac.za
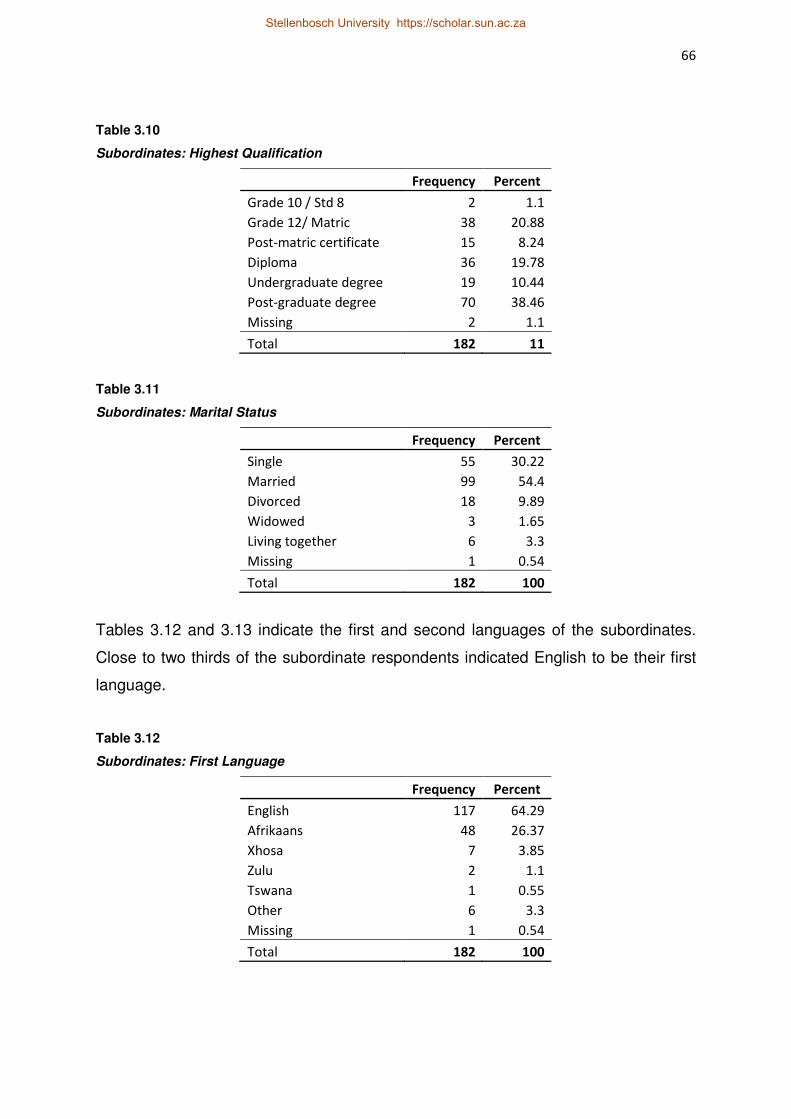
66
Table 3.10
Subordinates: Highest Qualification
Frequency Percent
Grade 10 / Std 8 2 1.1
Grade 12/ Matric 38 20.88
Post-matric certificate 15 8.24
Diploma 36 19.78
Undergraduate degree 19 10.44
Post-graduate degree 70 38.46
Missing 2 1.1
Total 182 11
Table 3.11
Subordinates: Marital Status
Frequency Percent
Single 55 30.22
Married 99 54.4
Divorced 18 9.89
Widowed 3 1.65
Living together 6 3.3
Missing 1 0.54
Total 182 100
Tables 3.12 and 3.13 indicate the first and second languages of the subordinates.
Close to two thirds of the subordinate respondents indicated English to be their first
language.
Table 3.12
Subordinates: First Language
Frequency Percent
English 117 64.29
Afrikaans 48 26.37
Xhosa 7 3.85
Zulu 2 1.1
Tswana 1 0.55
Other 6 3.3
Missing 1 0.54
Total 182 100
Stellenbosch University https://scholar.sun.ac.za

67
Table 3.13
Subordinates: Second Language
Frequency Percent
Afrikaans 47 25.82
English 130 71.43
Zulu 1 0.55
Missing 4 2.2
Total 182 100
Table 3.14 indicates the ethnic groups of the subordinates that participated in the
study. A rather large percentage (19.8%) opted to not answer this question, whilst
the data further revealed that 37.9% were coloured and 33% were white.
Table 3.14
Subordinates: Ethnic Group
Frequency Percent
Black 12 6.6
Coloured 69 37.9
White 60 33
Indian 3 1.6
Other 2 10
Missing 36 19.8
Total 182 100
3.5.4 Data Analysis
This section will discuss the data analyses techniques used to examine the research
hypotheses as well as certain characteristics of the measurement instruments.
3.5.4.1 Item analysis
Prior to conducting the Partial Least Squares (PLS) analyses on the conceptual
model, the internal consistency of the participants’ responses to the measuring
instruments’ items was determined through a separate item analysis procedure with
Statistica for each instrument. Item analysis assists in identifying poor items which
can be considered for removal, which in turn will ensure better reliability and validity
of the relevant measured construct. The item statistics that were investigated to
evaluate whether an item should be deleted or not, included the Cronbach Alpha if
Stellenbosch University https://scholar.sun.ac.za

68
item is to be deleted, as well as the inter-item correlation for a particular item within
the scale. Internal consistency results of 0.70 could be deemed acceptable;
however, coefficients in the range of 0.80 and 0.90 are better indicators of
satisfactory reliability (Nunnally & Bernstein, 1994).
After the preliminary item analyses were conducted (discussed in section 4.2) the
PLS model were fitted to the data with the revised item set (i.e. where problematic
items were identified, they were removed from the dataset).
3.5.4.2 Structural Equation Modeling (SEM)
A variety of methods can be used to assess the link between a number of variables.
For this study, Structural Equation Modeling (SEM) was used, which is a method that
analyses the relationships between multiple items (Hair, Black, Babin and Anderson,
2010) in the testing and modification of theoretical models (Anderson & Gerbing,
1988). SEM is used not only to analyse the measurement model, but also the
relationship between one construct and another. SEM can be used as a confirmatory
as well as an exploratory method.
SEM has two approaches:
• the covariance-based approach, and
• the Partial Least Squares (PLS) approach (variance-based approach) (Hair et
al., 2010; Haenlein & Kaplan, 2004).
Table 3.15 provides a comparison between PLS and covariance-based SEM,
provided by Urbach and Ahlemann (2010).
Stellenbosch University https://scholar.sun.ac.za

69
Table 3.15
Comparison between PLS and CBSEM Approaches
Criteria PLS SEM
Objective Prediction-oriented Parameter-oriented
Approach Variance-based Covariance-based
Assumption Predictor specification
(non-parametric)
Typically multivariate
normal distribution and
independent observation
(parametric)
Parameter estimates Consistent as indicators
and sample size increase
Consistent
Latent variable scores Explicitly estimated Indeterminate
Epistemic relationship between
and LVs and its measures
Can be modelled in either
formative and reflective
mode
Typically only with
reflective indicators.
However, the formative
mode is also supported.
Implications Optimal for prediction
accuracy
Optimal for parameter
accuracy
Model complexity Large complexity Small to moderate
complexity
Sample size Power analysis based on
the portion of the model
with the largest number of
predictor. Minimal
recommendation range
from 30 - 100 cases.
Ideally based on power
analysis of specific model -
minimal recommendation
range from 200 to 800
Type of Optimization Locally iterative Globally iterative
Siginificance tests Only by means of
simulations: restricted
validity
Available
Availability of global Goodness
of Fit (GOF)
Are currently being
developed and discussed
Established GOF metric
available
(Urbach & Ahlemann, 2010)
Given that this study has a small sample size1 and that the aim of the model was
exploration and prediction, the PLS approach was used.
1 The actual calculated sample size for this study was limited to the number of supervisors in
the sample (i.e. 85) as the supervisors were the unit of analyses in this study. In order to
calculate the average score for the supervisor from their own perceived EI and TFL ratings,
as well as from the subordinates linked to a particular supervisor, an average was calculated
from the supervisor score, as well as all the relevant subordinate scores, for that particular
supervisor. For example, for supervisor 100A, there was 2 subordinates. For item El1 the
Stellenbosch University https://scholar.sun.ac.za
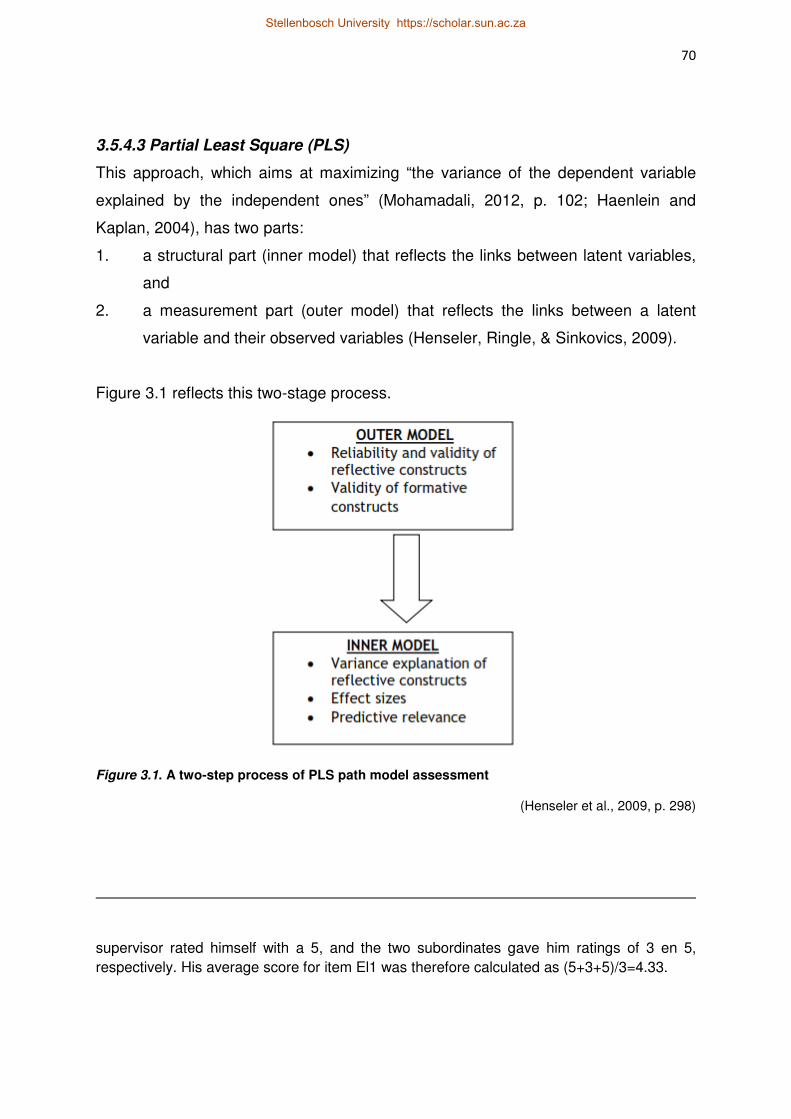
70
3.5.4.3 Partial Least Square (PLS)
This approach, which aims at maximizing “the variance of the dependent variable
explained by the independent ones” (Mohamadali, 2012, p. 102; Haenlein and
Kaplan, 2004), has two parts:
1. a structural part (inner model) that reflects the links between latent variables,
and
2. a measurement part (outer model) that reflects the links between a latent
variable and their observed variables (Henseler, Ringle, & Sinkovics, 2009).
Figure 3.1 reflects this two-stage process.
Figure 3.1. A two-step process of PLS path model assessment
(Henseler et al., 2009, p. 298)
supervisor rated himself with a 5, and the two subordinates gave him ratings of 3 en 5,
respectively. His average score for item El1 was therefore calculated as (5+3+5)/3=4.33.
Stellenbosch University https://scholar.sun.ac.za

71
The PLS approach currently has no criteria for Goodness-of-Fit, however, evaluation
of the model is conducted through a two-stage process (Chin, 1998):
1. Evaluating the measurement model (outer model)
According to Urbach and Ahlemann (2010) as well as Aibinu and Al-Lawati (2010)
the following criteria can be used to test whether a measurement model is adequate:
Individual item reliability. This looks at whether each question statement of the
questionnaire is understood similarly by each respondent. The item reliability in PLS
is assessed through the examination of the item loadings in the specific construct. As
with Cronbach’s alpha, a Composite reliability value of 0.70 is required indicating that
the variance in the item is attributed to the construct.
In contrast to the Cronbach alpha, composite reliability does not make the
assumption that all indicators are equivalently reliable, and also considers that
indicators have different loadings. This results in PLS paths having a more reliable
estimation of internal consistency. Whether Cronbach’s alpha is used or composite
reliability, a value of at least 0.7 is recommended (Nunnally & Bernstein, 1994), and
values below 0.6 are considered poor.
Convergent validity of the instrument to assesses construct validity. Urbach and
Ahlemann (2010) define convergent validity as the extent to which specific construct
items link to other items of another construct. The PLS approach analyses
convergent validity of constructs by assessing the Average Variance Extracted
(AVE) (Hair et al., 2010; Fornell & Larcker, 1981). Shi, Olson and Stam (2007, p.310)
define AVE as “the amount of variance that a latent variable component captures
from its indicators relative to the amount of variance due to measurement error”, and
a value of at least 0.50 is suggested (Urbach & Ahlemann, 2010; Hair et al., 2010).
Discriminant validity of the instrument to also assesses construct validity – looking at
the extent to which the items of an instrument do not indicate other variables (Straub,
Boudreau & Gefen, 2004). Here the value of the square root of each construct’s AVE
should be bigger than the correlations with other constructs. Looking at specific
items, the cross-loadings are also examined to assess discriminant validity. The
Stellenbosch University https://scholar.sun.ac.za

72
item’s loading with its specific construct should not be lower than its loading with
another construct.
In addition, to determine whether the measurement model’s factor loadings were
significant or not, Bootstrap was used. Confidence intervals of 95% were used.
Therefore, if zero did not fall within the 95% confidence interval, the factor loadings
were found to be statistically significant.
Once the outer model has been found to be reliable and valid, the inner model can
be assessed.
2. Evaluation of the structural model (inner model) to assess the proposed
relationships. Here the following criteria are considered:
The Coefficient of Determination, R², which assess how much variation of each
endogenous variable is accounted for by the whole model. Chin (1998) suggests that
values of about 0.67 are significant, whereas values of 0.33 and 0.19 are moderate
and weak respectively.
Path coefficient. This refers to the estimated values for path relationships in the
structural model and should be evaluated in terms of sign, magnitude, and
significance (the latter via bootstrapping).
3.6 Measurement Instruments
3.6.1 Emotional Intelligence
The ECI (Emotional Competence Inventory) measures Goleman’s emotional
competencies. It has been shown to have an average reliability of 0.63 (Wolff, 2006).
Byrne (2003) found that the ECI has good validity. However, the instrument has
been criticised, and as a result, an attempt to revise the instrument to assure better
psychometric properties was made. Boyatizis and Goleman released the Emotional
and Social Competency Inventory (ESCI) (a revision of the ECI) in 2007. Table 3.17
shows the reliability coefficients of the ESCI.
Stellenbosch University https://scholar.sun.ac.za

73
Rahim (2010) used the ESCI to measure EI in a study on the relationship between EI
and stress levels. The 72-item instrument makes use of a 6-point Likert scale. Rahim
(2010) reported Cronbach’s alphas ranging between .74 and .84 for the instrument.
In the present study, Goleman and Boyatzis’s ESCI was used to measure EI. Table
3.16 includes a description of the sub-dimensions of the ESCI. Self-awareness is
measured focusing on emotional self-awareness; accurate self-assessment and self-
confidence. Self-management includes, amongst other aspects: achievement
orientation; adaptability; emotional self-control and positive outlook. Social
Awareness includes empathy, organisational awareness and service orientation.
Relationship Management includes, amongst others, conflict management; coaching
and mentoring; influence; and inspirational leadership. The ESCI is a 360-degree
instrument, and employs a 6-point Likert scale where respondents indicate to what
extent they agree with a list of statements on a rating scale which includes the
following options: “Never”; “Rarely”, “Sometimes”, “Often”, “Consistently” or “Don’t
know”2.
Table 3.16
ESCI competency clusters and definitions
Cluster Competency Definition
Self-awareness Emotional self-awareness Awareness of one's own emotional state
Accurate self-assessment Awareness of one's own strengths, weaknesses, and performance
Self-confidence Sense of one's self-worth and capabilities
Self-management Emotional self-control One's ability to monitor and regulate one’s emotional states and emotional impulses
Transparency Maintaining standards of honesty and integrity
Adaptability Being flexible when dealing with change
2 The final category in the Likert rating scale, “don’t know” was treated as a missing value in
the data analysis procedure.
Stellenbosch University https://scholar.sun.ac.za

74
Achievement orientation One's own ability to set high standards, then achieve or exceed them
Initiative Taking action on what needs to get done before they have been asked
Optimism Optimistic outlook; persistence in pursuing goals despite obstacles
Social awareness Empathy Sensing and understanding what others are feeling
Organizational awareness Reading a group's emotional currents and power relationships
Service orientation Ability to understand others' needs and provide services to meet their needs
Relationship management Development others Sensing and bolstering others' development needs
Teamwork and collaboration Respecting, and collaborating with other team members while being cooperative and sharing
Conflict management Negotiating and resolving disagreements
Change catalyst Initiating or managing change
Inspirational leadership Inspiring and guiding individuals and having them follow without force
Influence Wielding effective tactics for persuasion
(Koman & Wolff, 2008)
Table 3.17
Cronbach’s Alpha Reliability for ESCI Competencies
Cronbach’s Alpha Reliability for ESCI Competencies
Emotional Self-Awareness 0.83
Achievement Orientation 0.74
Adaptability 0.76
Emotional Self-Control 0.80
Positive Outlook 0.76
Empathy 0.79
Organizational Awareness 0.76
Conflict Management 0.84
Stellenbosch University https://scholar.sun.ac.za

75
Coach and Mentor 0.83
Influence 0.74
Inspirational Leadership 0.79
Teamwork 0.87
(Boyatzis, 2007)
3.6.2 Transformational Leadership
The Multifactor Leadership Questionnaire (MLQ) was used to measure the four
variables of TFL: Idealised Influence, Intellectual Stimulation, Individualised
Consideration and Inspirational Motivation. This questionnaire was developed by
Bass and Avolio (1995). It comprises of 45 items, and includes a 5-point Likert type
response scale. Eight items measure Idealised Influence; four items measure
Inspirational Motivation; four items measure Intellectual Stimulation; and four items
measure Individualised Consideration. Engelbrecht et al., (2005), using a South
African sample, reported that the MLQ’s sub-scale reliabilities in alpha values ranged
between .72 and .84.
The MLQ measures both TFL and Transactional Leadership. However, in this study,
as in the Beyers’ (2006) study, only the TFL section of the questionnaire was used.
3.6.3 Outcomes of Effective Leadership
3.6.3.1 Perceived Supervisor Support
To measure Perceived Supervisor Support, Eisenberger et al.’s (1986) questionnaire
that measures Perceived Organisational Support (POS) was used. However, similar
to the practice employed by other researchers (e.g. Pazy & Ganzach, 2009), the
word “organisation” was replaced with “supervisor”. The instrument uses a 7-point
Likert scale, ranging from 0 (Strongly disagree) to 6 (Strongly agree) in which a half
of the items are negatively worded, and the other half are positively worded.
Eisenberger et al. (1986) reported a reliability coefficient of .93 (Cronbach’s alpha)
for this scale.
Stellenbosch University https://scholar.sun.ac.za

76
3.6.3.2 Job Satisfaction
The Job Descriptive Index (JDI) was used to measure Job Satisfaction. With an
alpha coefficient in the range of .68 and .96, the JDI has been reported to have
satisfactory internal consistency (Buckley, Carraher & Cote, 1992). The original
version of Smith, Kendall and Hullin (1969) consisted of 72 items with a yes/no
format. The instrument was subsequently adapted into a more flexible 30-item
measure. This version is a Likert-type questionnaire, with the scoring ranging from 1,
which is “strongly disagree”, to 5 which is “strongly agree”- higher scores reflecting
higher satisfaction levels. For the purpose of the present study, the 5 items of the
questionnaire that specifically relate to satisfaction with work was used.
3.6.3.3 Organisational Commitment
Meyer and Allen’s three-component model of Organisational Commitment was used
and measured using the Organisational Commitment Questionnaire (OCQ) (Allen &
Meyer, 1990). The instrument uses a 4-point Likert type scale ranging from 1
(Strongly disagree) to 4 (Strongly agree), and focuses on affective, continuance and
normative commitment. Allen and Meyer (1996) studied a wide range of data
regarding the construct validity of the measurements of the three components of
commitment. The development of the measures had its basis in theory and existing
views of commitment as a work attitude. A satisfactory reliability (alpha) coefficient
has been reported for each OCQ subscale: affective commitment =.87; continuance
commitment = .75 and normative commitment = .79 (Allen & Meyer, 1990).
3.7 Summary
This chapter addressed the purpose and aim of this research study and presented
the proposed hypotheses which were based on the theoretical background and
literature review. The research design and statistical analyses techniques were also
explained. In the next chapter, the research results will be presented and elaborated
on.
Stellenbosch University https://scholar.sun.ac.za

77
CHAPTER 4: RESEARCH RESULTS
4. 1 Introduction
This chapter reports on the data analyses that were conducted in this study. The
first part of the chapter discusses the steps taken regarding the validation of the
measurement instruments and measurement model, which will be followed by a
discussion about the results attained for the structural model so as to test the
proposed hypotheses presented in chapters 2 and 3.
4.2 Validating the Measurement Instruments
4.2.1 Item Analysis
The psychometric properties of the various constructs were explored through item
analysis. This section reports on the results of these analyses. The supervisors and
subordinates results are presented separately.
4.2.1.1 Transformational Leadership
TFL was measured with the MLQ. This instrument assesses TFL as well as
Transactional Leadership, but for the purposes of this study, only the 24 items
assessing TFL were used. Item analyses were conducted on all four subscales of
TFL using STATISTICA (Statsoft Inc., 2012) for the subordinate and supervisor
groups separately. The statistics of each of the 4 subscales (Individualised
Consideration, Idealised Influence, Intellectual Stimulation and Inspirational
Motivation) of TFL will be presented below.
The results of the item analyses for TFL, as well as the descriptive statistics for the
supervisor and subordinate data are presented in tables 4.1 and 4.2 respectively.
Table 4.1
The means, standard deviation and reliability statistics for TFL (supervisors)
TFL subscale Number of Items M SD α
Intellectual Stimulation 4 17.81 2.85 0.73
Idealised Influence 8 35.82 5.81 0.83
Inspirational Motivation 4 18.82 2.97 0.83
Individualised Consideration 4 19.48 3.13 0.79
Stellenbosch University https://scholar.sun.ac.za
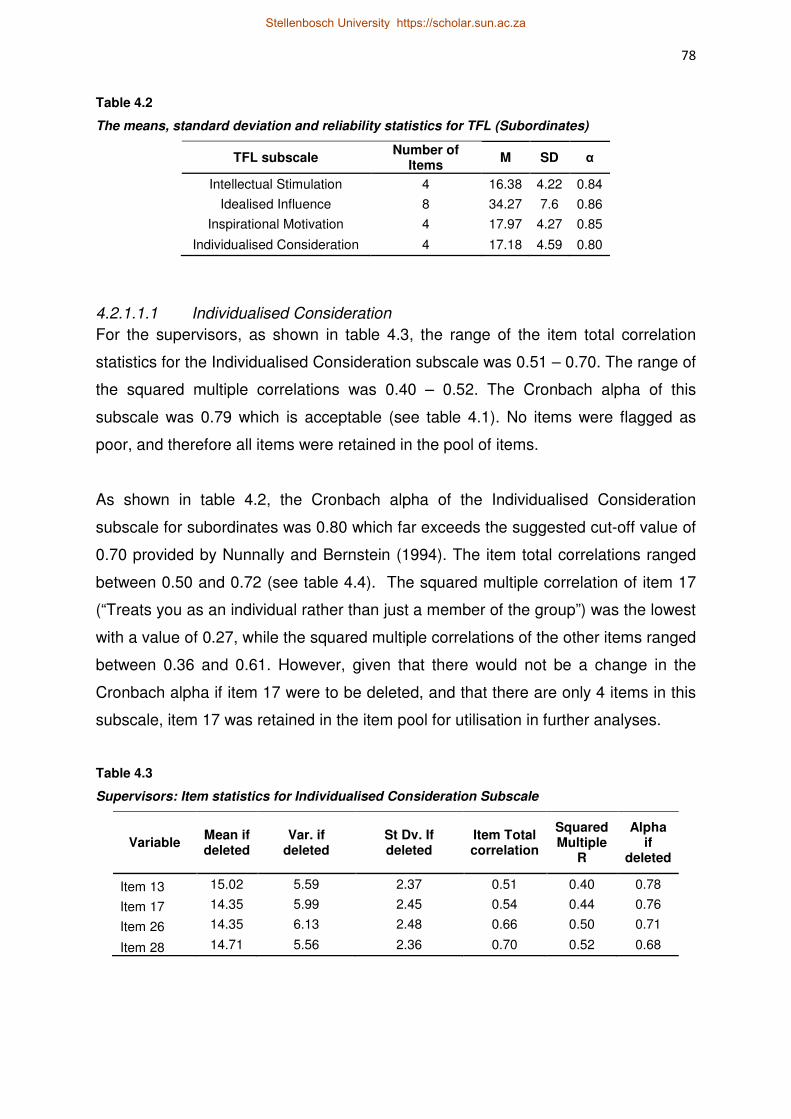
78
Table 4.2
The means, standard deviation and reliability statistics for TFL (Subordinates)
TFL subscale Number of
Items M SD α
Intellectual Stimulation 4 16.38 4.22 0.84
Idealised Influence 8 34.27 7.6 0.86
Inspirational Motivation 4 17.97 4.27 0.85
Individualised Consideration 4 17.18 4.59 0.80
4.2.1.1.1 Individualised Consideration
For the supervisors, as shown in table 4.3, the range of the item total correlation
statistics for the Individualised Consideration subscale was 0.51 – 0.70. The range of
the squared multiple correlations was 0.40 – 0.52. The Cronbach alpha of this
subscale was 0.79 which is acceptable (see table 4.1). No items were flagged as
poor, and therefore all items were retained in the pool of items.
As shown in table 4.2, the Cronbach alpha of the Individualised Consideration
subscale for subordinates was 0.80 which far exceeds the suggested cut-off value of
0.70 provided by Nunnally and Bernstein (1994). The item total correlations ranged
between 0.50 and 0.72 (see table 4.4). The squared multiple correlation of item 17
(“Treats you as an individual rather than just a member of the group”) was the lowest
with a value of 0.27, while the squared multiple correlations of the other items ranged
between 0.36 and 0.61. However, given that there would not be a change in the
Cronbach alpha if item 17 were to be deleted, and that there are only 4 items in this
subscale, item 17 was retained in the item pool for utilisation in further analyses.
Table 4.3
Supervisors: Item statistics for Individualised Consideration Subscale
Variable Mean if deleted
Var. if deleted
St Dv. If deleted
Item Total correlation
Squared Multiple
R
Alpha if
deleted
Item 13 15.02 5.59 2.37 0.51 0.40 0.78
Item 17 14.35 5.99 2.45 0.54 0.44 0.76
Item 26 14.35 6.13 2.48 0.66 0.50 0.71
Item 28 14.71 5.56 2.36 0.70 0.52 0.68
Stellenbosch University https://scholar.sun.ac.za

79
Table 4.4
Subordinates: Item statistics for Individualised Consideration Subscale
Variable Mean if deleted
Var. if deleted
St Dv. If deleted
Item Total correlation
Squared Multiple
R
Alpha if deleted
Item 13 13.09 12.42 3.52 0.64 0.57 0.73
Item 17 12.43 13.76 3.71 0.50 0.27 0.80
Item 26 13.27 12.28 3.50 0.59 0.36 0.76
Item 28 12.75 11.74 3.43 0.72 0.61 0.69
4.2.1.1.2 Idealised Influence
This subscale consists of eight items. The Cronbach alpha for the Idealised Influence
subscale for the supervisors, as shown in table 4.1, was 0.83 which is good. The
range of the item total correlation statistics (see table 4.5) was 0.44 – 0.69, and the
range of the squared multiple correlations was 0.31 – 0.61. As presented in table
4.5, most of the item-total correlation statistics for the supervisors were high, with
values above 0.50. According to the results, no item if deleted would incur an
increase in the scale Cronbach alpha value. All the items were therefore retained in
the item pool for further analysis.
The alpha coefficient of the Idealised Influence subscale for subordinates was 0.86
(see table 4.2) which greatly exceeds the guideline of ≥ 0.70 provided by Nunnally
and Bernstein (1994). The item-total correlations for the subordinates group were
also mostly above 0.50, with only two items falling below this threshold with values of
0.31 and 0.42 (see table 4.6).
As shown in table 4.6, the item total correlation of item 23 (“Displays a sense of
power and confidence”) was the lowest (0.31) and the only one below 0.4. The
squared multiple correlation of this item was also the lowest on this subscale, with a
value of 0.22, while the squared multiple correlations of the other items ranged
between 0.26 and 0.72. However, given that that the deletion of this item will not
cause a significant increase in the Cronbach alpha value (change = 0.01), it was
decided to retain this item in the item pool.
Stellenbosch University https://scholar.sun.ac.za
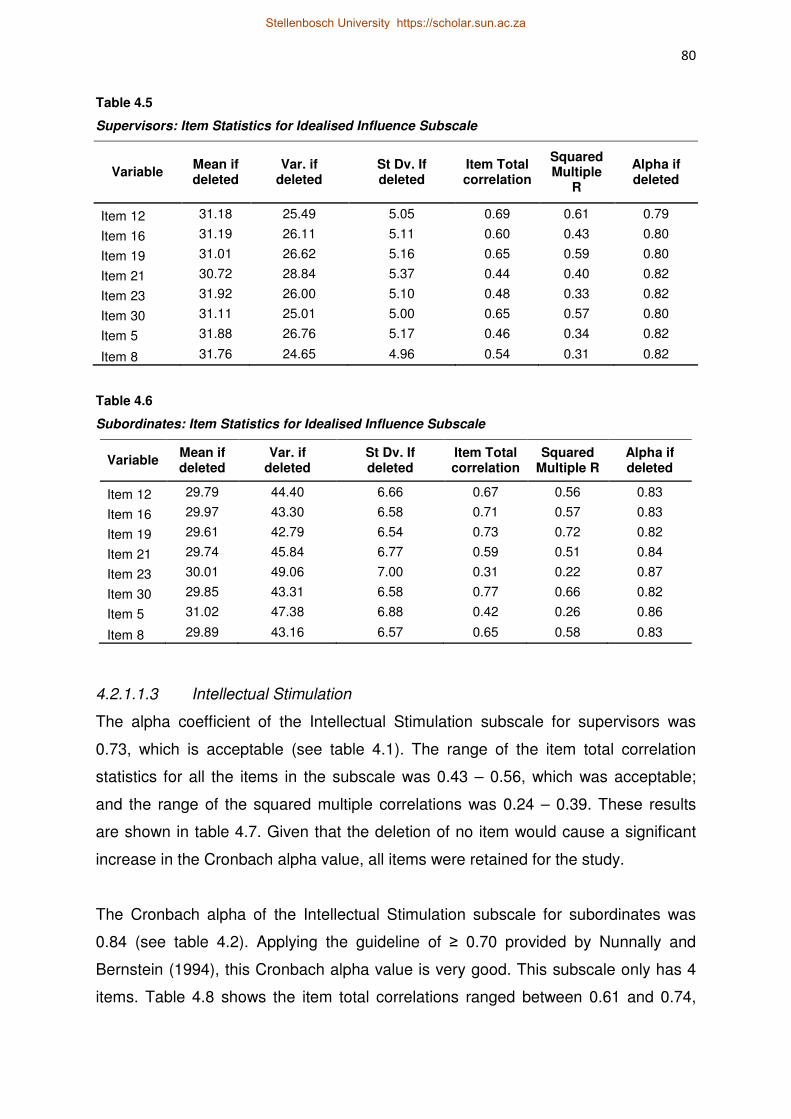
80
Table 4.5
Supervisors: Item Statistics for Idealised Influence Subscale
Variable Mean if deleted
Var. if deleted
St Dv. If deleted
Item Total correlation
Squared Multiple
R
Alpha if deleted
Item 12 31.18 25.49 5.05 0.69 0.61 0.79
Item 16 31.19 26.11 5.11 0.60 0.43 0.80
Item 19 31.01 26.62 5.16 0.65 0.59 0.80
Item 21 30.72 28.84 5.37 0.44 0.40 0.82
Item 23 31.92 26.00 5.10 0.48 0.33 0.82
Item 30 31.11 25.01 5.00 0.65 0.57 0.80
Item 5 31.88 26.76 5.17 0.46 0.34 0.82
Item 8 31.76 24.65 4.96 0.54 0.31 0.82
Table 4.6
Subordinates: Item Statistics for Idealised Influence Subscale
Variable Mean if deleted
Var. if deleted
St Dv. If deleted
Item Total correlation
Squared Multiple R
Alpha if deleted
Item 12 29.79 44.40 6.66 0.67 0.56 0.83
Item 16 29.97 43.30 6.58 0.71 0.57 0.83
Item 19 29.61 42.79 6.54 0.73 0.72 0.82
Item 21 29.74 45.84 6.77 0.59 0.51 0.84
Item 23 30.01 49.06 7.00 0.31 0.22 0.87
Item 30 29.85 43.31 6.58 0.77 0.66 0.82
Item 5 31.02 47.38 6.88 0.42 0.26 0.86
Item 8 29.89 43.16 6.57 0.65 0.58 0.83
4.2.1.1.3 Intellectual Stimulation
The alpha coefficient of the Intellectual Stimulation subscale for supervisors was
0.73, which is acceptable (see table 4.1). The range of the item total correlation
statistics for all the items in the subscale was 0.43 – 0.56, which was acceptable;
and the range of the squared multiple correlations was 0.24 – 0.39. These results
are shown in table 4.7. Given that the deletion of no item would cause a significant
increase in the Cronbach alpha value, all items were retained for the study.
The Cronbach alpha of the Intellectual Stimulation subscale for subordinates was
0.84 (see table 4.2). Applying the guideline of ≥ 0.70 provided by Nunnally and
Bernstein (1994), this Cronbach alpha value is very good. This subscale only has 4
items. Table 4.8 shows the item total correlations ranged between 0.61 and 0.74,
Stellenbosch University https://scholar.sun.ac.za

81
which are high values. Considering the results of the item analysis and descriptive
statistics, no items were flagged as possible poor items.
Table 4.7
Supervisors: Item Statistics for Intellectual Stimulation Subscale
Variable Mean if deleted
Var. if deleted
St Dv. If deleted
Item Total correlation
Squared Multiple R
Alpha if deleted
Item 2 13.58 5.12 2.26 0.43 0.24 0.72
Item 27 13.20 4.69 2.16 0.54 0.39 0.65
Item 29 13.24 4.73 2.17 0.56 0.35 0.64
Item 6 13.40 5.19 2.28 0.54 0.32 0.66
Table 4.8
Subordinates: Item Statistics for Intellectual Stimulation Subscale
Variable Mean if deleted
Var. if deleted
St Dv. If deleted
Item Total correlation
Squared Multiple
R
Alpha if deleted
Item 2 12.36 11.46 3.39 0.61 0.39 0.83
Item 27 12.19 10.05 3.17 0.72 0.57 0.78
Item 29 12.21 9.25 3.04 0.74 0.60 0.77
Item 6 12.38 11.29 3.36 0.64 0.42 0.81
4.2.1.1.4 Inspirational Motivation
This subscale consists of four items, and obtained very good Cronbach alpha values
of 0.83 (supervisors) and 0.85 (subordinates). These results are reported in tables
4.1 and 4.2 respectively.
The range of the item total correlation statistics for the supervisor analysis for the
subscale was 0.62 – 0.71 (see table 4.9), and the range of the squared multiple
correlations was 0.39 – 0.53. The alpha value would not have increased if any of the
items were removed, therefore no items were considered for deletion.
As shown in table 4.10, the item total correlations of the four items for the
subordinate analysis of this subscale ranged between 0.62 and 0.79, which is high.
Stellenbosch University https://scholar.sun.ac.za

82
The range of the squared multiple correlations was 0.44 – 0.63. As reflected by the
results, no problematic items could be identified in this subscale.
Table 4.9
Supervisors: Item Statistics for Inspirational Motivation Subscale
Variable Mean if deleted
Var. if deleted
St Dv. If deleted
Item Total correlation
Squared Multiple
R
Alpha if deleted
Item 11 13.99 5.49 2.34 0.69 0.50 0.77
Item 24 14.62 4.66 2.16 0.62 0.39 0.81
Item 32 13.70 5.76 2.40 0.65 0.43 0.79
Item 7 14.15 4.82 2.20 0.71 0.53 0.76
Table 4.10
Subordinates: Item Statistics for Inspirational Motivation Subscale
Variable Mean if deleted
Var. if deleted
St Dv. If deleted
Item Total correlation
Squared Multiple
R
Alpha if deleted
Item 11 13.32 10.29 3.21 0.79 0.63 0.76
Item 24 13.71 10.12 3.18 0.68 0.49 0.81
Item 32 13.22 11.93 3.45 0.62 0.44 0.83
Item 7 13.67 10.63 3.26 0.66 0.45 0.81
4.2.1.2 Emotional Intelligence (EI)
Item analyses were conducted using STATISTICA (Statsoft Inc., 2012) on the four EI
subscales (Relationship Management, Self-management, Self-awareness and Social
Awareness) for the subordinate and supervisor groups separately.
4.2.1.2.1 Relationship Management
This subscale obtained very good Cronbach alpha values of 0.91 (supervisors) and
0.96 (subordinates) as indicated in tables 4.19 and 4.20. The subscale consists of 28
items. The reverse-scored items are indicated in tables 4.11 and 4.12.
For the supervisor analysis (table 4.11), the item total correlation statistic (0.19) of
the reversed keyed item 5 (“You do not cooperate with others”) was the lowest of the
28 items of this subscale. The other item total correlations for the subscale ranged
between 0.28 and 0.71. The squared multiple correlation for item 5 was 0.43, falling
within the range of the correlations for the subscale: 0.42 – 0.72. The Cronbach
Stellenbosch University https://scholar.sun.ac.za
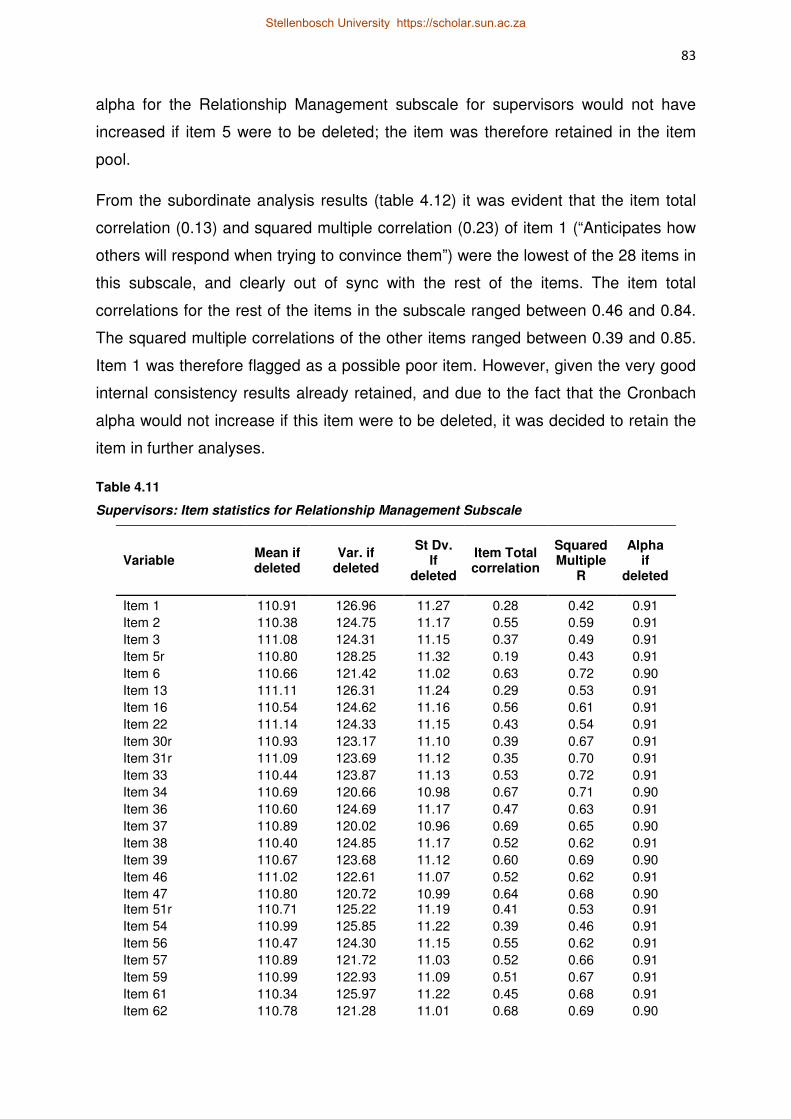
83
alpha for the Relationship Management subscale for supervisors would not have
increased if item 5 were to be deleted; the item was therefore retained in the item
pool.
From the subordinate analysis results (table 4.12) it was evident that the item total
correlation (0.13) and squared multiple correlation (0.23) of item 1 (“Anticipates how
others will respond when trying to convince them”) were the lowest of the 28 items in
this subscale, and clearly out of sync with the rest of the items. The item total
correlations for the rest of the items in the subscale ranged between 0.46 and 0.84.
The squared multiple correlations of the other items ranged between 0.39 and 0.85.
Item 1 was therefore flagged as a possible poor item. However, given the very good
internal consistency results already retained, and due to the fact that the Cronbach
alpha would not increase if this item were to be deleted, it was decided to retain the
item in further analyses.
Table 4.11
Supervisors: Item statistics for Relationship Management Subscale
Variable Mean if deleted
Var. if deleted
St Dv. If
deleted
Item Total correlation
Squared Multiple
R
Alpha if
deleted
Item 1 110.91 126.96 11.27 0.28 0.42 0.91
Item 2 110.38 124.75 11.17 0.55 0.59 0.91
Item 3 111.08 124.31 11.15 0.37 0.49 0.91
Item 5r 110.80 128.25 11.32 0.19 0.43 0.91
Item 6 110.66 121.42 11.02 0.63 0.72 0.90
Item 13 111.11 126.31 11.24 0.29 0.53 0.91
Item 16 110.54 124.62 11.16 0.56 0.61 0.91
Item 22 111.14 124.33 11.15 0.43 0.54 0.91
Item 30r 110.93 123.17 11.10 0.39 0.67 0.91
Item 31r 111.09 123.69 11.12 0.35 0.70 0.91
Item 33 110.44 123.87 11.13 0.53 0.72 0.91
Item 34 110.69 120.66 10.98 0.67 0.71 0.90
Item 36 110.60 124.69 11.17 0.47 0.63 0.91
Item 37 110.89 120.02 10.96 0.69 0.65 0.90
Item 38 110.40 124.85 11.17 0.52 0.62 0.91
Item 39 110.67 123.68 11.12 0.60 0.69 0.90
Item 46 111.02 122.61 11.07 0.52 0.62 0.91
Item 47 110.80 120.72 10.99 0.64 0.68 0.90 Item 51r 110.71 125.22 11.19 0.41 0.53 0.91
Item 54 110.99 125.85 11.22 0.39 0.46 0.91
Item 56 110.47 124.30 11.15 0.55 0.62 0.91
Item 57 110.89 121.72 11.03 0.52 0.66 0.91
Item 59 110.99 122.93 11.09 0.51 0.67 0.91
Item 61 110.34 125.97 11.22 0.45 0.68 0.91
Item 62 110.78 121.28 11.01 0.68 0.69 0.90
Stellenbosch University https://scholar.sun.ac.za

84
Item 63 110.64 122.26 11.06 0.62 0.66 0.90
Item 67 110.65 121.22 11.01 0.71 0.72 0.90
Item 68 110.96 121.99 11.04 0.53 0.70 0.91
Table 4.12
Subordinates: Item statistics for Relationship Management Subscale
Variable Mean if deleted
Var. if deleted
St Dv. If
deleted
Item Total correlation
Squared Multiple
R
Alpha if
deleted
Item 1 109.29 346.18 18.61 0.13 0.23 0.96
Item 2 108.64 328.25 18.12 0.72 0.63 0.96
Item 3 109.08 326.84 18.08 0.65 0.61 0.96
Item 5r 109.05 331.58 18.21 0.46 0.39 0.96
Item 6 109.02 328.08 18.11 0.66 0.61 0.96
Item 13 109.04 333.79 18.27 0.49 0.47 0.96
Item 16 109.03 331.00 18.19 0.62 0.50 0.96
Item 22 109.36 329.40 18.15 0.56 0.39 0.96
Item 30r 109.21 327.92 18.11 0.55 0.56 0.96
Item 31r 109.12 331.28 18.20 0.46 0.48 0.96
Item 33 108.74 327.15 18.09 0.75 0.76 0.96
Item 34 109.01 320.61 17.91 0.82 0.76 0.96
Item 36 108.99 327.22 18.09 0.70 0.64 0.96
Item 37 109.26 319.18 17.87 0.82 0.78 0.96
Item 38 108.94 323.04 17.97 0.82 0.82 0.96
Item 39 108.91 325.13 18.03 0.77 0.76 0.96
Item 46 109.54 330.75 18.19 0.49 0.42 0.96
Item 47 109.10 319.88 17.89 0.83 0.81 0.96
Item 51r 108.92 327.54 18.10 0.66 0.58 0.96
Item 54 109.25 333.73 18.27 0.55 0.44 0.96
Item 56 108.89 322.08 17.95 0.79 0.73 0.96
Item 57 109.16 321.51 17.93 0.75 0.70 0.96
Item 59 109.46 331.69 18.21 0.52 0.43 0.96
Item 61 108.74 327.84 18.11 0.67 0.67 0.96
Item 62 109.01 320.57 17.90 0.84 0.81 0.96
Item 63 109.00 317.82 17.83 0.84 0.82 0.95
Item 67 109.04 318.55 17.85 0.84 0.85 0.95
Item 68 109.19 326.83 18.08 0.69 0.62 0.96
4.2.1.2.2 Self-awareness
The Cronbach alpha of the Self-awareness subscale for supervisors was 0.76 which
is acceptable (table 4.20). The item total correlation (0.36) and squared multiple
correlation (0.18) of item 58 (“You do not describe your own feelings”) were the
lowest on this subscale (table 4.13). The item total correlations of the rest of the
items ranged between 0.38 and 0.70; and the squared multiple correlations of the
rest of the items ranged between 0.20 and 0.56. The results of the item analysis
Stellenbosch University https://scholar.sun.ac.za

85
showed that if item 58 were to be deleted, the Cronbach alpha of the subscale would
not increase, the item was therefore not removed from the item pool.
The results revealed that the Cronbach alpha for the Self-awareness subscale for
subordinates was 0.66, which was below the recommended 0.70 level (table 4.19).
The results of the item analysis (table 4.14) revealed that if item 58 (“Does not
describe own feelings”) were to be deleted, the alpha coefficient of the subscale
would increase to 0.71. The item total correlation of item 58 was the lowest on this
subscale with a value of 0.14. The item total correlations of the other items of the
subscale ranged between 0.34 and 0.55. The squared multiple correlation of item 58
was also the lowest on this subscale with a value of 0.06 while the squared multiple
correlations of the other items ranged between 0.20 and 0.37. Although these results
suggested that item 58 should be deleted, further inspection of the PLS
measurement model results (i.e. the outer model) revealed that this poor performing
item did not adversely affect the composite reliability of the Self-awareness subscale
(composite reliability of 0.81, see section 4.3.1). Given the fact that the adverse
effect of this poor performing item was relatively insignificant in the further analyses,
as well as the fact that if the item were to be deleted, it had to be deleted from the
supervisor item pool as well (for which the evidence was not as strong), it was
decided to retain the item in the pool for further analyses.
Table 4.13
Supervisors: Item statistics for Self-awareness Subscale
Variable Mean if deleted
Var. if deleted
St Dv. If
deleted
Item Total correlation
Squared Multiple
R
Alpha if
deleted
Item 9 19.26 6.49 2.55 0.59 0.40 0.69
Item 17 19.18 6.40 2.53 0.70 0.56 0.66
Item 29 18.85 8.01 2.83 0.38 0.20 0.75
Item 42 18.94 8.01 2.83 0.44 0.22 0.74
Item 55 19.55 6.76 2.60 0.53 0.41 0.71
Item 58r 19.66 7.78 2.79 0.36 0.18 0.75
Stellenbosch University https://scholar.sun.ac.za
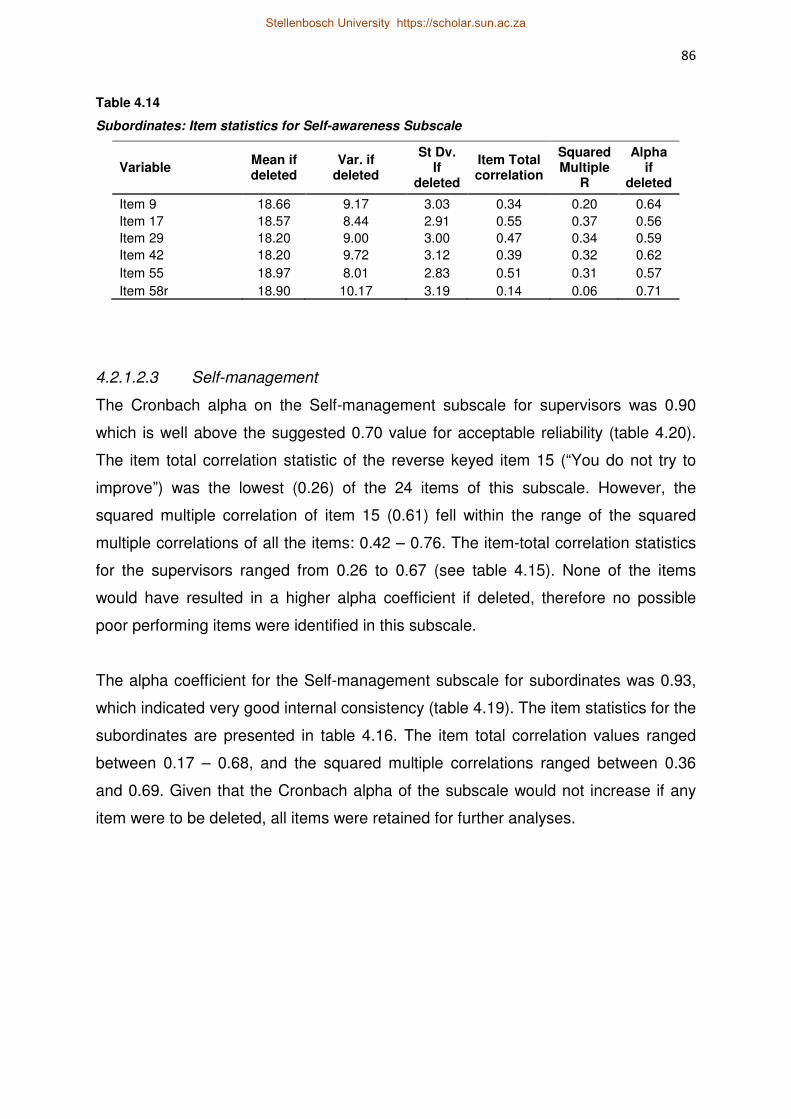
86
Table 4.14
Subordinates: Item statistics for Self-awareness Subscale
Variable Mean if deleted
Var. if deleted
St Dv. If
deleted
Item Total correlation
Squared Multiple
R
Alpha if
deleted
Item 9 18.66 9.17 3.03 0.34 0.20 0.64
Item 17 18.57 8.44 2.91 0.55 0.37 0.56
Item 29 18.20 9.00 3.00 0.47 0.34 0.59
Item 42 18.20 9.72 3.12 0.39 0.32 0.62
Item 55 18.97 8.01 2.83 0.51 0.31 0.57
Item 58r 18.90 10.17 3.19 0.14 0.06 0.71
4.2.1.2.3 Self-management
The Cronbach alpha on the Self-management subscale for supervisors was 0.90
which is well above the suggested 0.70 value for acceptable reliability (table 4.20).
The item total correlation statistic of the reverse keyed item 15 (“You do not try to
improve”) was the lowest (0.26) of the 24 items of this subscale. However, the
squared multiple correlation of item 15 (0.61) fell within the range of the squared
multiple correlations of all the items: 0.42 – 0.76. The item-total correlation statistics
for the supervisors ranged from 0.26 to 0.67 (see table 4.15). None of the items
would have resulted in a higher alpha coefficient if deleted, therefore no possible
poor performing items were identified in this subscale.
The alpha coefficient for the Self-management subscale for subordinates was 0.93,
which indicated very good internal consistency (table 4.19). The item statistics for the
subordinates are presented in table 4.16. The item total correlation values ranged
between 0.17 – 0.68, and the squared multiple correlations ranged between 0.36
and 0.69. Given that the Cronbach alpha of the subscale would not increase if any
item were to be deleted, all items were retained for further analyses.
Stellenbosch University https://scholar.sun.ac.za
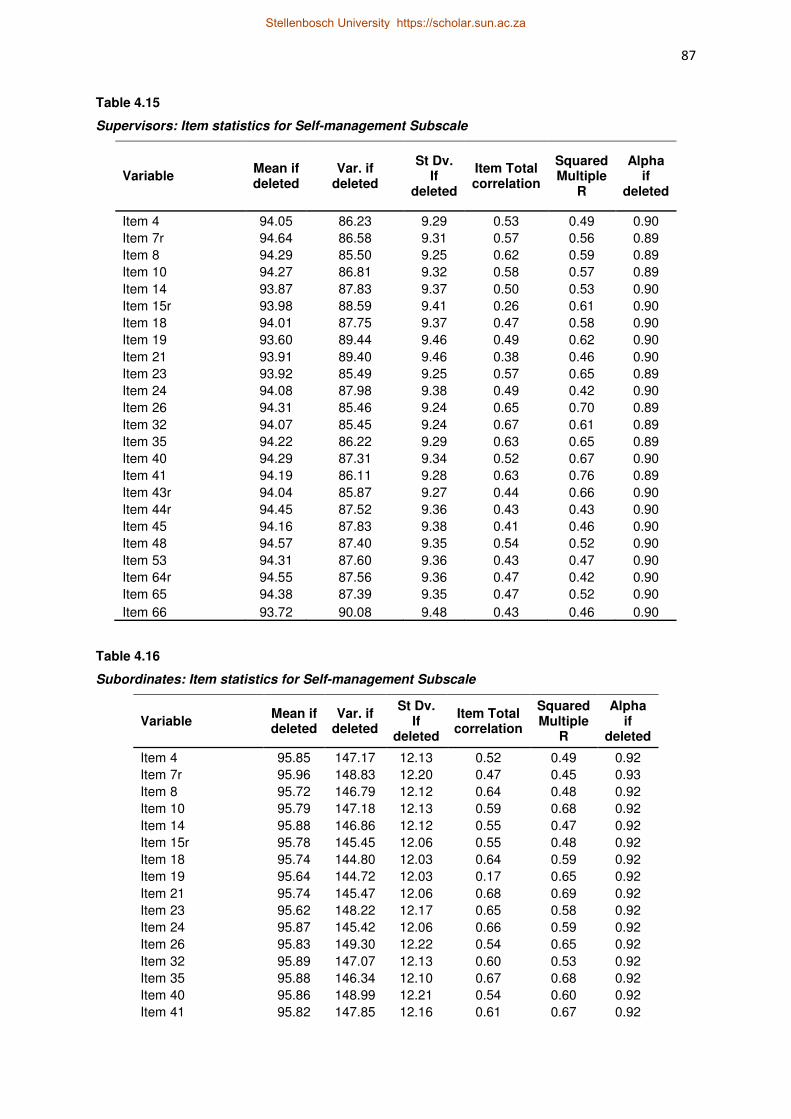
87
Table 4.15
Supervisors: Item statistics for Self-management Subscale
Variable Mean if deleted
Var. if deleted
St Dv. If
deleted
Item Total correlation
Squared Multiple
R
Alpha if
deleted
Item 4 94.05 86.23 9.29 0.53 0.49 0.90
Item 7r 94.64 86.58 9.31 0.57 0.56 0.89
Item 8 94.29 85.50 9.25 0.62 0.59 0.89
Item 10 94.27 86.81 9.32 0.58 0.57 0.89
Item 14 93.87 87.83 9.37 0.50 0.53 0.90
Item 15r 93.98 88.59 9.41 0.26 0.61 0.90
Item 18 94.01 87.75 9.37 0.47 0.58 0.90
Item 19 93.60 89.44 9.46 0.49 0.62 0.90
Item 21 93.91 89.40 9.46 0.38 0.46 0.90
Item 23 93.92 85.49 9.25 0.57 0.65 0.89
Item 24 94.08 87.98 9.38 0.49 0.42 0.90
Item 26 94.31 85.46 9.24 0.65 0.70 0.89
Item 32 94.07 85.45 9.24 0.67 0.61 0.89
Item 35 94.22 86.22 9.29 0.63 0.65 0.89
Item 40 94.29 87.31 9.34 0.52 0.67 0.90
Item 41 94.19 86.11 9.28 0.63 0.76 0.89
Item 43r 94.04 85.87 9.27 0.44 0.66 0.90
Item 44r 94.45 87.52 9.36 0.43 0.43 0.90
Item 45 94.16 87.83 9.38 0.41 0.46 0.90
Item 48 94.57 87.40 9.35 0.54 0.52 0.90
Item 53 94.31 87.60 9.36 0.43 0.47 0.90
Item 64r 94.55 87.56 9.36 0.47 0.42 0.90
Item 65 94.38 87.39 9.35 0.47 0.52 0.90
Item 66 93.72 90.08 9.48 0.43 0.46 0.90
Table 4.16
Subordinates: Item statistics for Self-management Subscale
Variable Mean if deleted
Var. if deleted
St Dv. If
deleted
Item Total correlation
Squared Multiple
R
Alpha if
deleted
Item 4 95.85 147.17 12.13 0.52 0.49 0.92
Item 7r 95.96 148.83 12.20 0.47 0.45 0.93
Item 8 95.72 146.79 12.12 0.64 0.48 0.92
Item 10 95.79 147.18 12.13 0.59 0.68 0.92
Item 14 95.88 146.86 12.12 0.55 0.47 0.92
Item 15r 95.78 145.45 12.06 0.55 0.48 0.92
Item 18 95.74 144.80 12.03 0.64 0.59 0.92
Item 19 95.64 144.72 12.03 0.17 0.65 0.92
Item 21 95.74 145.47 12.06 0.68 0.69 0.92
Item 23 95.62 148.22 12.17 0.65 0.58 0.92
Item 24 95.87 145.42 12.06 0.66 0.59 0.92
Item 26 95.83 149.30 12.22 0.54 0.65 0.92
Item 32 95.89 147.07 12.13 0.60 0.53 0.92
Item 35 95.88 146.34 12.10 0.67 0.68 0.92
Item 40 95.86 148.99 12.21 0.54 0.60 0.92
Item 41 95.82 147.85 12.16 0.61 0.67 0.92
Stellenbosch University https://scholar.sun.ac.za

88
Item 43r 95.89 149.16 12.21 0.34 0.42 0.93
Item 44r 95.99 145.80 12.07 0.57 0.53 0.92
Item 45 95.77 148.07 12.17 0.52 0.45 0.92
Item 48 96.28 145.43 12.06 0.57 0.48 0.92
Item 53 95.80 147.23 12.13 0.58 0.51 0.92
Item 64r 95.96 152.27 12.34 0.31 0.36 0.93
Item 65 96.11 145.82 12.08 0.63 0.56 0.92
Item 66 95.73 147.01 12.12 0.59 0.54 0.92
4.2.1.2.4 Social Awareness
The Cronbach alpha of the Social Awareness subscale for supervisors was 0.81
(table 4.20), which is good (Nunnally & Bernstein, 1994). The item total correlation
statistic of item 49 (“Does not understand the subtle feelings of others”) was 0.37
while item total correlations of the other items ranged between 0.43 and 0.60 (table
4.17). The squared multiple correlation of item 49 was the lowest of the items in this
subscale, with a value of 0.25, while the squared multiple correlations of the other 9
items ranged between 0.30 and 0.50. Given that the deletion of item 49 would not
increase the Cronbach alpha value of the subscale, it was retained in the pool for
further analyses.
The Cronbach alpha on the Social Awareness subscale for subordinates was 0.90
(table 4.19), which is well above Nunnally and Bernstein’s (1994) suggested cut-off
value of 0.70. The item total correlation (0.43) and squared multiple correlation (0.23)
statistic of the reversed keyed3 item 49 was the lowest of the subscale (table 4.18).
The range of the item total correlation statistics for the subscale was 0.43 – 0.76,
and the range of the squared multiple correlations was 0.23 – 0.62. If item 49 were to
be deleted, the Cronbach alpha value would not have increased. Item 49 was
therefore retained in the pool for further analysis.
3 It can be noted from all the item analysis results for the EI instrument that the items which
underperformed were all reverse keyed items (item 5, 15, 58 and 49). This may suggest
some method bias effect which may have resulted from respondent’s inability to easily
interpret reverse phrased items. However, given the composite reliability results for the EI
instrument (see table 4.27) subscales in the PLS results, it is clear that this effect did not
adversely affect the quality of measurement of the EI construct.
Stellenbosch University https://scholar.sun.ac.za

89
Table 4.17
Supervisors: Item statistics for Social Awareness Subscale
Variable Mean if deleted
Var. if deleted
St Dv. If
deleted
Item Total correlation
Squared Multiple
R
Alpha if
deleted
Item 11 37.16 14.98 3.87 0.48 0.41 0.80
Item 12 37.19 14.93 3.86 0.56 0.44 0.79
Item 20 37.05 15.60 3.95 0.43 0.30 0.80
Item 25 37.51 14.70 3.83 0.52 0.42 0.80
Item 27 37.45 13.96 3.74 0.54 0.42 0.79
Item 28 37.35 15.00 3.87 0.47 0.31 0.80
Item 49r 37.78 15.30 3.91 0.37 0.25 0.81
Item 50 37.60 15.70 3.96 0.45 0.30 0.80
Item 52 37.28 14.48 3.81 0.60 0.50 0.79
Item 60 37.51 14.25 3.77 0.56 0.47 0.79
Table 4.18
Subordinates: Item statistics for Social Awareness Subscale
Variable Mean if deleted
Var. if deleted
St Dv. If
deleted
Item Total correlation
Squared Multiple
R
Alpha if
deleted
Item 11 36.89 34.87 5.91 0.69 0.57 0.89
Item 12 36.81 36.76 6.06 0.54 0.52 0.90
Item 20 36.71 34.84 5.90 0.76 0.63 0.88
Item 25 37.32 33.60 5.80 0.71 0.61 0.89
Item 27 36.91 35.80 5.98 0.62 0.48 0.89
Item 28 36.96 34.31 5.86 0.72 0.60 0.88
Item 49r 37.40 36.72 6.06 0.43 0.23 0.90
Item 50 37.34 35.00 5.92 0.70 0.55 0.89
Item 52 37.01 35.14 5.93 0.67 0.53 0.89
Item 60 37.57 33.98 5.83 0.70 0.62 0.89
Table 4.19
The means, standard deviation and reliability statistics for Emotional Intelligence
(Subordinates)
EI subscale Number of Items M SD α
Relationship Management 28 113.11 18.79 0.96
Self-management 24 100.02 12.68 0.93
Self-awareness 6 22.30 3.51 0.66
Social Awareness 10 41.21 6.57 0.90
Stellenbosch University https://scholar.sun.ac.za

90
Table 4.20
The means, standard deviation and reliability statistics for Emotional Intelligence
(Supervisors)
EI subscale Number of Items M SD α
Relationship Management 28 114.87 11.58 0.91
Self-management 24 98.26 9.78 0.90
Self-awareness 6 23.09 3.17 0.76
Social Awareness 10 41.54 4.27 0.81
Item analyses were also conducted with STATISTICA (Statsoft Inc., 2012) on the
data of the following three questionnaires: Organisational Commitment, Job
Satisfaction and Perceived Supervisor Support. Only the subordinates provided self-
reported ratings of their own perceived levels of these three constructs.
4.2.1.3 Job Satisfaction (JS)
The results of the item analysis, as well as the descriptive statistics for this scale, are
presented in tables 4.21 and 4.22. The Cronbach alpha of the Job satisfaction scale
was 0.84. Applying the guideline of ≥ 0.70 provided by Nunnally and Bernstein
(1994), this Cronbach alpha value is good. Table 4.22 below presents the item-total
correlations of the Job Satisfaction scale. All the values ranged between 0.50 and
0.77. Although the item total correlation as well as the squared multiple correlation of
item 4 (“My work is challenging”) were the lowest of all the items in this scale, item 4
was not considered for deletion. This decision was based on the fact that the
Cronbach alpha value would only increase by 0.01 if this item would be deleted.
Furthermore, the relative brevity of the scale (only 5 items) swayed the decision
towards not deleting this item from the item pool.
Table 4.21
The mean, standard deviation and reliability statistic for Job Satisfaction (Subordinates)
JS Scale Number of Items M SD α
Job Satisfaction 5 16.62 2.49 0.84
Stellenbosch University https://scholar.sun.ac.za

91
Table 4.22
Item statistics for Job Satisfaction scale
Variable Mean if deleted
Var. if deleted
St Dv. If deleted
Item Total correlation
Squared Multiple
R
Alpha if deleted
Item 1 13.31 3.90 1.97 0.69 0.55 0.79
Item 2r 13.28 3.84 1.96 0.69 0.50 0.79
Item 3 13.29 4.65 2.16 0.58 0.39 0.82
Item 4 13.37 4.26 2.06 0.50 0.30 0.85
Item 5 13.23 3.83 1.96 0.77 0.61 0.77
4.2.1.4 Organisational Commitment (OC)
Allen and Meyer’s (1990) OCQ was used to assess the subordinates’ levels of
Organisational Commitment. The Cronbach alpha of the Organisational Commitment
scale was 0.85 which indicated satisfactory internal reliability (Nunnally & Bernstein,
1994). The range of the item total correlation statistics for the scale was between
0.20 and 0.61. The range of the squared multiple correlations was 0.11 – 0.57. The
item total correlation as well as the squared multiple correlation of item 3 were the
lowest; however the results revealed the deletion of this item would only increase the
Cronbach alpha by 0.01. All the items in the scale were therefore retained for further
analyses. The item statistics are presented in table 4.24.
Table 4.23
The mean, standard deviation and reliability statistic for OC (Subordinates)
OC Scale Number of Items M SD α
Organisational Commitment 16 45.48 7.07 0.85
Table 4.24
Item statistics for Organisational Commitment Subscale
Variable Mean if deleted
Var. if deleted
St Dv. If
deleted
Item Total correlation
Squared Multiple
R
Alpha if deleted
Item 1 42.58 43.03 6.56 0.48 0.33 0.84
Item 2r 42.83 43.84 6.62 0.44 0.29 0.84
Item 3 42.92 46.61 6.83 0.20 0.11 0.86
Item 4 43.25 43.89 6.62 0.49 0.36 0.84
Stellenbosch University https://scholar.sun.ac.za

92
Item 5r 42.26 45.33 6.73 0.41 0.47 0.84
Item 6 42.96 43.00 6.56 0.48 0.45 0.84
Item 7r 42.48 43.14 6.57 0.58 0.49 0.84
Item 8 42.31 44.28 6.65 0.59 0.45 0.84
Item 9 42.37 43.93 6.63 0.61 0.48 0.84
Item 10 42.71 42.45 6.52 0.59 0.53 0.83
Item 11r 42.30 44.12 6.64 0.58 0.57 0.84
Item 12 42.49 44.01 6.63 0.54 0.43 0.84
Item 13 42.55 44.08 6.64 0.46 0.43 0.84
Item 14 42.69 45.44 6.74 0.37 0.22 0.85
Item 15r 43.06 44.28 6.65 0.49 0.29 0.84
Item 16r 42.48 45.18 6.72 0.35 0.30 0.85
4.2.1.5 Perceived Supervisor Support (PSS)
The instrument used to measure the subordinates’ Perceived Supervisor Support
consisted of eight items. The results of the item analysis, as well as the descriptive
statistics for this scale, are contained in tables 4.25 and 4.26.
Table 4.25
The mean, standard deviation and reliability statistic for PSS (Subordinates)
PSS Scale Number of Items M SD α
Perceived Supervisory Support 8 36.37 9.38 0.91
The alpha coefficient of the Perceived Supervisory Support scale was 0.91 which
indicated very good internal consistency. The range of the item total correlation
statistics for the scale was 0.62 - 0.79. The range of the squared multiple
correlations was 0.41 – 0.70. Considering the results of the item analysis and
descriptive statistics, none of the items were flagged as a poor. Table 4.26 reflects
the item statistics of the Perceived Supervisor Support scale.
Stellenbosch University https://scholar.sun.ac.za
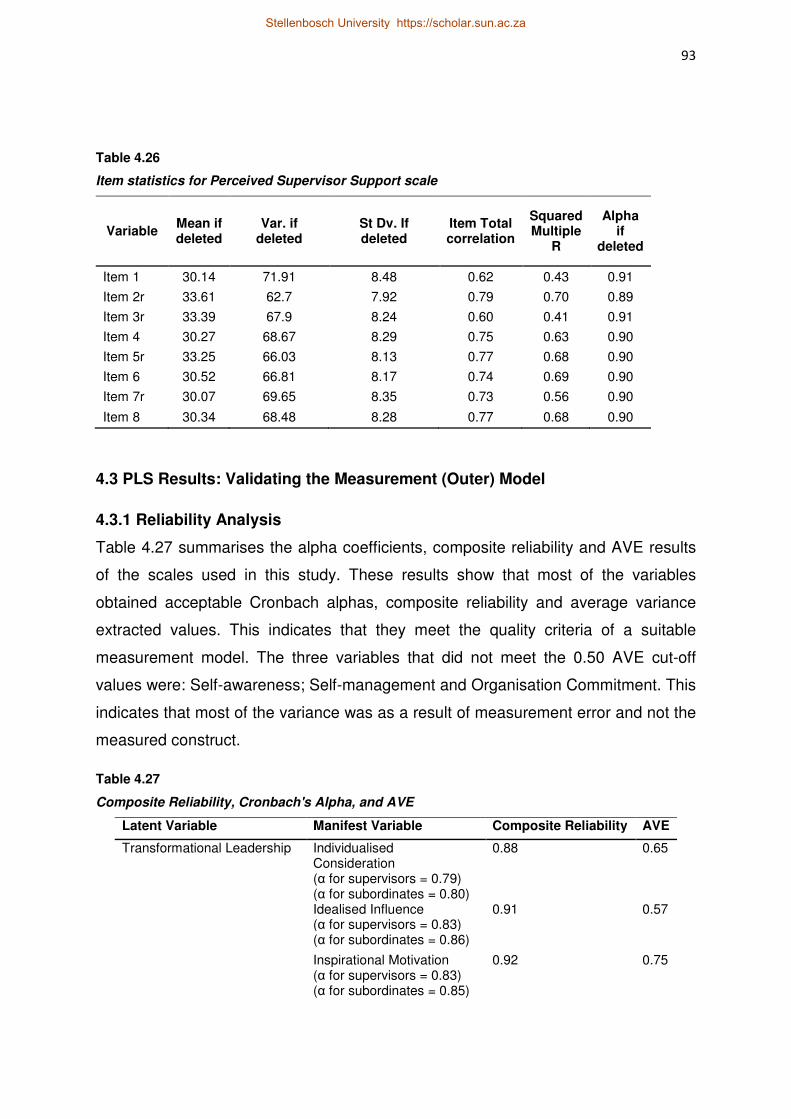
93
Table 4.26
Item statistics for Perceived Supervisor Support scale
Variable Mean if deleted
Var. if deleted
St Dv. If deleted
Item Total correlation
Squared Multiple
R
Alpha if
deleted
Item 1 30.14 71.91 8.48 0.62 0.43 0.91
Item 2r 33.61 62.7 7.92 0.79 0.70 0.89
Item 3r 33.39 67.9 8.24 0.60 0.41 0.91
Item 4 30.27 68.67 8.29 0.75 0.63 0.90
Item 5r 33.25 66.03 8.13 0.77 0.68 0.90
Item 6 30.52 66.81 8.17 0.74 0.69 0.90
Item 7r 30.07 69.65 8.35 0.73 0.56 0.90
Item 8 30.34 68.48 8.28 0.77 0.68 0.90
4.3 PLS Results: Validating the Measurement (Outer) Model
4.3.1 Reliability Analysis
Table 4.27 summarises the alpha coefficients, composite reliability and AVE results
of the scales used in this study. These results show that most of the variables
obtained acceptable Cronbach alphas, composite reliability and average variance
extracted values. This indicates that they meet the quality criteria of a suitable
measurement model. The three variables that did not meet the 0.50 AVE cut-off
values were: Self-awareness; Self-management and Organisation Commitment. This
indicates that most of the variance was as a result of measurement error and not the
measured construct.
Table 4.27
Composite Reliability, Cronbach's Alpha, and AVE
Latent Variable Manifest Variable Composite Reliability AVE
Transformational Leadership Individualised Consideration (α for supervisors = 0.79) (α for subordinates = 0.80)
0.88 0.65
Idealised Influence (α for supervisors = 0.83) (α for subordinates = 0.86)
0.91 0.57
Inspirational Motivation (α for supervisors = 0.83) (α for subordinates = 0.85)
0.92 0.75
Stellenbosch University https://scholar.sun.ac.za

94
Intellectual Stimulation (α for supervisors = 0.73) (α for subordinates = 0.85)
0.79 0.51
Emotional Intelligence Relationship Management (α for supervisors = 0.91) (α for subordinates = 0.84)
0.97 0.53
Self-awareness (α for supervisors = 0.76) (α for subordinates = 0.66)
0.81 0.42
Self-management (α for supervisors = 0.90) (α for subordinates = 0.93)
0.94 0.40
Social awareness (α for supervisors = 0.81) (α for subordinates = 0.90)
0.92 0.53
Job Satisfaction Job Satisfaction (α = 0.84)
0.89 0.63
Organisational Commitment Organisational Commitment (α = 0.85)
0.90 0.37
Perceived Supervisor Support Perceived Supervisor Support (α = 0.91)
0.94 0.66
4.3.2 Discriminant Validity
The Heterotrait-Monotrait ratio (HTMT) was calculated to examine discriminant
validity. This approach evaluates the correlations of items within a scale and
compares it with cross correlations of another scale. The within correlations should
be higher than the cross correlations. According to Henseler, Ringle, and Sarstedt
(2015, p.121), “HTMT approach is an estimate of the correlation between the
constructs ξi and ξj, which parallels the disattenuated construct score correlation.
Because the HTMT is an estimate of the correlation between the constructs ξi and
ξj, its interpretation is straightforward: if the indicators of two constructs ξi and ξj
exhibit an HTMT value that is clearly smaller than one, the true correlation between
the two constructs is most likely different from one, and they should differ”. Table
4.28 shows the discriminant validity results.
Stellenbosch University https://scholar.sun.ac.za

95
Table 4.28
Discriminant Validity (Heterotrait-Monotrait ratio)
Original Sample
(O) 2.50% 97.50% Discriminate
Self-awareness -> Relationship Management
0.81 0.68 0.91 yes
Self-management-> Relationship Management
0.93 0.88 0.96 yes
Self-management-> Self-awareness 0.75 0.61 0.89 yes
Social Awareness -> Relationship Management
0.94 0.87 0.98 yes
Social Awareness -> Self-awareness
0.82 0.72 0.96 yes
Social Awareness -> Self-management
0.92 0.87 1.01 no
Job Satisfcation -> Relationship Management
0.12 0.14 0.36 yes
Job Satisfcation -> Self-awareness 0.22 0.20 0.46 yes
Job Satisfcation -> Self-management
0.18 0.20 0.41 yes
Job Satisfcation -> Social Awareness
0.15 0.16 0.39 yes
Organisational Commitment -> Relationship Management
0.37 0.31 0.58 yes
Organisational Commitment -> Self-awareness
0.39 0.34 0.62 yes
Organisational Commitment -> Self-management
0.38 0.36 0.59 yes
Organisational Commitment -> Social Awareness
0.30 0.29 0.52 yes
Organisational Commitment -> Job Satisfaction
0.51 0.38 0.71 yes
Perceived Supervisor Support -> Relationship Management
0.74 0.54 0.86 yes
Perceived Supervisor Support -> Self-awareness
0.61 0.41 0.80 yes
Perceived Supervisor Support -> Self-management
0.73 0.56 0.85 yes
Perceived Supervisor Support -> Social Awareness
0.73 0.51 0.86 yes
Perceived Supervisor Support -> Job Satisfaction
0.16 0.14 0.42 yes
Perceived Supervisor Support -> Organisational Commitment
0.39 0.31 0.60 yes
Individualised Consideration -> Relationship Management
0.86 0.75 0.95 yes
Individualised Consideration -> Self-awareness
0.67 0.47 0.84 yes
Individualised Consideration -> Self-management
0.75 0.60 0.87 yes
Individualised Consideration -> Social Awareness
0.79 0.65 0.90 yes
Stellenbosch University https://scholar.sun.ac.za

96
Individualised Consideration -> Job Satisfaction
0.13 0.12 0.37 yes
Individualised Consideration -> Organisational Commitment
0.36 0.27 0.58 yes
Individualised Consideration -> Perceived Supervisor Support
0.77 0.61 0.89 yes
Idealised Influence -> Relationship Management
0.91 0.86 0.96 yes
Idealised Influence -> Self-awareness
0.70 0.53 0.85 yes
Idealised Influence -> Self-management
0.85 0.75 0.94 yes
Idealised Influence -> Social Awareness
0.79 0.68 0.89 yes
Idealised Influence -> Job Satisfaction
0.20 0.14 0.46 yes
Idealised Influence -> Organisational Commitment
0.47 0.37 0.65 yes
Idealised Influence -> Perceived Supervisor Support
0.75 0.61 0.86 yes
Idealised Influence -> Individualised Consideration
0.99 0.94 1.06 no
Intellectual Stimulation -> Relationship Management
0.92 0.83 0.99 yes
Intellectual Stimulation -> Self-awareness
0.67 0.45 0.85 yes
Intellectual Stimulation -> Self-management
0.82 0.68 0.93 yes
Intellectual Stimulation -> Social Awareness
0.81 0.67 0.91 yes
Intellectual Stimulation -> Job Satisfaction
0.15 0.11 0.40 yes
Intellectual Stimulation -> Organisational Commitment
0.39 0.30 0.59 yes
Intellectual Stimulation -> Perceived Supervisor Support
0.73 0.54 0.86 yes
Intellectual Stimulation -> Individualised Consideration
1.02 0.96 1.10 no
Intellectual Stimulation -> Idealised Influence
1.03 0.99 1.09 no
Inspirational Motivation -> Relationship Management
0.93 0.86 0.97 yes
Inspirational Motivation -> Self-awareness
0.71 0.50 0.86 yes
Inspirational Motivation -> Self-management
0.89 0.80 0.96 yes
Inspirational Motivation -> Social Awarenss
0.84 0.75 0.92 yes
Inspirational Motivation -> Job Satisfaction
0.19 0.10 0.49 yes
Inspirational Motivation -> Organisational Commitment
0.40 0.29 0.59 yes
Inspirational Motivation -> Perceived Supervisor Support
0.73 0.57 0.85 yes
Stellenbosch University https://scholar.sun.ac.za

97
Inspirational Motivation -> Individualised Consideration
0.91 0.83 0.99 yes
Inspirational Motivation -> Idealised Influence
1.02 1.00 1.06 no
Inspirational Motivation -> Intellectual Stimulation
1.01 0.96 1.08 no
The results indicated that two subscales from the EI instrument, Social Awareness
and Self-Management, did not attain discriminant validity. In addition, these were the
same two subscales where the AVE was below the suggested value of 0.5. There
are no noticeable conceptual similarities between Self-management (which includes
emotional self-control and adaptability) and Social Awareness (which includes
empathy and organisational awareness). This is in contrast to Leslie (2013), who
reports that the ESCI has convergent, as well as discriminant validity.
The discriminant validity of the TFL subscales raised some concern. From the results
it was clear that Idealised Influence and Individualised Consideration, as well as
Inspirational Motivation and Idealised Influence were shown to not have obtained
discriminant validity. Moreover, the results revealed a further rather concerning
finding in that Intellectual Stimulation did not obtain discriminant validity with any of
the other TFL variables (Individualised Consideration, Idealised Influence and
Inspirational Motivation). However, various studies (e.g. Antonakis, Avolio &
Sivasubramaniam, 2003; Bycio, Hackett & Allen, 1995; Lowe et al., 1996;
Vandenberghe, Stordeur & D’hoore, 2002), have reported that the subscales within
the MLQ measure have shown a lack of discriminant validity, with very high
correlations between the subscales that have been observed. Carless (1998)
reported that there were high intercorrelations (i.e. an average correlation of .93)
between the subscales. It would, therefore, seem that discriminant validity of the TFL
subscales is a weakness of the TFL measure. For example, motivational behaviour
underlies at least two of the subscales. Inspirational Motivation involves the leader
encouraging followers to commit to the vision, and can lead to the follower willingly
putting in extra effort. Idealised Influence involves the leader being a role model to
followers and also has an element of motivational behaviour. There is therefore a
conceptual overlap between these two variables which could explain the lack of
discriminant validity between these two subscales.
Stellenbosch University https://scholar.sun.ac.za
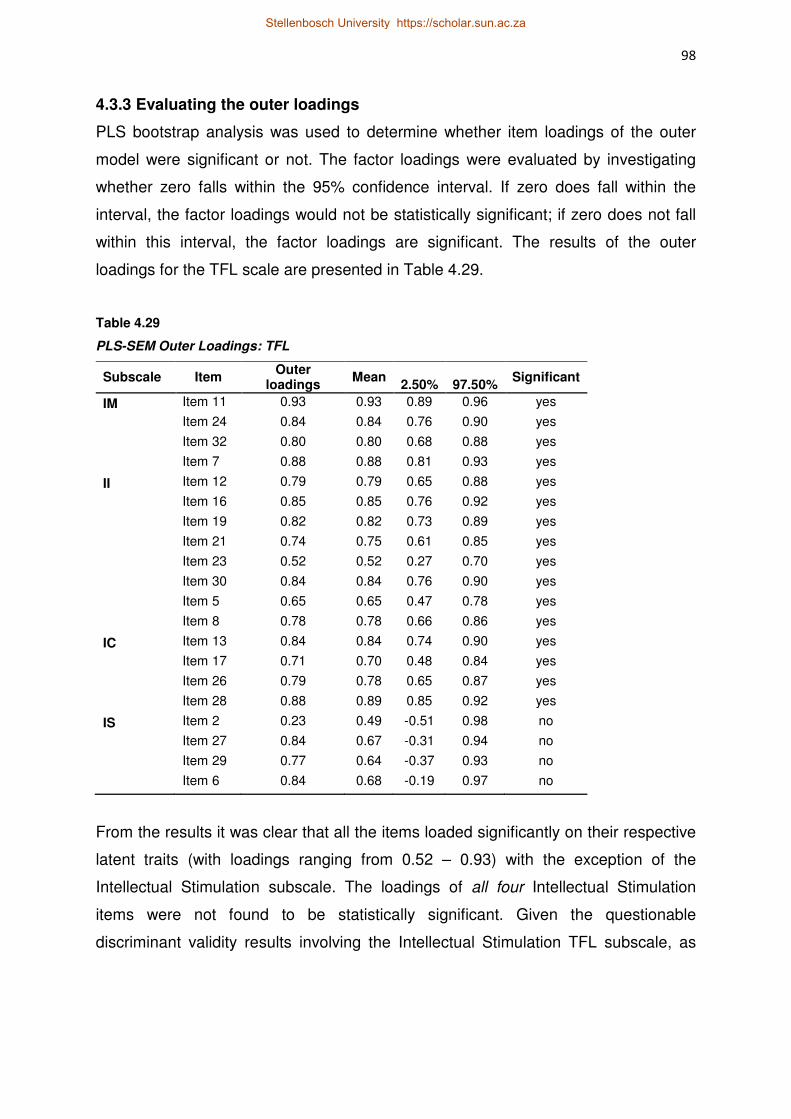
98
4.3.3 Evaluating the outer loadings
PLS bootstrap analysis was used to determine whether item loadings of the outer
model were significant or not. The factor loadings were evaluated by investigating
whether zero falls within the 95% confidence interval. If zero does fall within the
interval, the factor loadings would not be statistically significant; if zero does not fall
within this interval, the factor loadings are significant. The results of the outer
loadings for the TFL scale are presented in Table 4.29.
Table 4.29
PLS-SEM Outer Loadings: TFL
Subscale Item Outer
loadings Mean
2.50% 97.50% Significant
IM Item 11 0.93 0.93 0.89 0.96 yes
Item 24 0.84 0.84 0.76 0.90 yes
Item 32 0.80 0.80 0.68 0.88 yes
Item 7 0.88 0.88 0.81 0.93 yes
II Item 12 0.79 0.79 0.65 0.88 yes
Item 16 0.85 0.85 0.76 0.92 yes
Item 19 0.82 0.82 0.73 0.89 yes
Item 21 0.74 0.75 0.61 0.85 yes
Item 23 0.52 0.52 0.27 0.70 yes
Item 30 0.84 0.84 0.76 0.90 yes
Item 5 0.65 0.65 0.47 0.78 yes
Item 8 0.78 0.78 0.66 0.86 yes
IC Item 13 0.84 0.84 0.74 0.90 yes
Item 17 0.71 0.70 0.48 0.84 yes
Item 26 0.79 0.78 0.65 0.87 yes
Item 28 0.88 0.89 0.85 0.92 yes
IS Item 2 0.23 0.49 -0.51 0.98 no
Item 27 0.84 0.67 -0.31 0.94 no
Item 29 0.77 0.64 -0.37 0.93 no
Item 6 0.84 0.68 -0.19 0.97 no
From the results it was clear that all the items loaded significantly on their respective
latent traits (with loadings ranging from 0.52 – 0.93) with the exception of the
Intellectual Stimulation subscale. The loadings of all four Intellectual Stimulation
items were not found to be statistically significant. Given the questionable
discriminant validity results involving the Intellectual Stimulation TFL subscale, as
Stellenbosch University https://scholar.sun.ac.za

99
well as the results of the factor loadings for this scale, it was it was decided to
remove the Intellectual Stimulation subscale from the model for further analyses4.
The clear lack of reliability of this TFL measure would render the integrity of any
parameters that would be derived for this construct in the model, as highly
questionable. Therefore, hypothesis 13 5 was not included in the final structural
model that was tested. Table 4.30 shows the results of the outer loadings for TFL
after the Intellectual Stimulation variable was removed. All the loadings were found
to be significant. Furthermore, table 4.31 below reflects the discriminant validity
results after the removal of the Intellectual Stimulation dimension of TFL.
Table 4.30
PLS-SEM Outer Loadings: TFL after the deletion of the IS subscale from the analysis
Subscale Item Outer
loadings Mean 2.50% 97.50% Significant
IM Item 11 0.93 0.93 0.9 0.96 yes
Item 24 0.84 0.84 0.75 0.9 yes
Item 32 0.8 0.8 0.7 0.87 yes
Item 7 0.88 0.88 0.81 0.93 yes
II Item 12 0.79 0.79 0.65 0.88 yes
Item 16 0.85 0.85 0.76 0.91 yes
Item 19 0.82 0.82 0.72 0.89 yes
Item 21 0.74 0.74 0.61 0.85 yes
Item 23 0.52 0.52 0.27 0.7 yes
Item 30 0.84 0.84 0.76 0.9 yes
Item 5 0.65 0.65 0.45 0.79 yes
Item 8 0.78 0.78 0.67 0.86 yes
IC Item 13 0.84 0.84 0.74 0.9 yes
Item 17 0.71 0.69 0.48 0.83 yes
Item 26 0.79 0.78 0.64 0.88 yes
Item 28 0.88 0.89 0.84 0.92 yes
4 The composite reliability and discriminant validity analysis were repeated after the TFL’s
Intellectual Stimulation subscale was removed. The results did not change for any of the
other subscales in terms of the composite reliability and discriminant validity.
5 This was the only hypothesis that related to this construct (i.e. Intellectual Stimulation).
Stellenbosch University https://scholar.sun.ac.za

100
Table 4.31
Discriminant Validity (Heterotrait-Monotrait ratio) after the deletion of the IS subscale from the
analysis
Original Sample
(O) 2.50% 97.50% Discriminate
Self-awareness -> Relationship Management
0.807 0.691 0.906 yes
Self-management-> Relationship Management
0.925 0.889 0.955 yes
Self-management-> Self-awareness 0.746 0.628 0.886 yes
Social Awareness -> Relationship Management
0.940 0.888 0.975 yes
Social Awareness -> Self-awareness
0.820 0.734 0.954 yes
Social Awareness -> Self-management
0.922 0.873 1.009 no
Job Satisfaction -> Relationship Management
0.119 0.143 0.369 yes
Job Satisfaction -> Self-awareness 0.215 0.208 0.453 yes
Job Satisfaction -> Self-management
0.176 0.193 0.426 yes
Job Satisfaction -> Social Awareness
0.153 0.151 0.415 yes
Organisational Commitment -> Relationship Management
0.367 0.308 0.582 yes
Organisational Commitment -> Self-awareness
0.392 0.353 0.621 yes
Organisational Commitment -> Self-management
0.382 0.359 0.591 yes
Organisational Commitment -> Social Awareness
0.296 0.283 0.526 yes
Organisational Commitment -> Job Satisfaction
0.509 0.380 0.697 yes
Perceived Supervisor Support -> Relationship Management
0.737 0.551 0.856 yes
Perceived Supervisor Support -> Self-awareness
0.614 0.399 0.791 yes
Perceived Supervisor Support -> Self-management
0.728 0.569 0.839 yes
Perceived Supervisor Support -> Social Awareness
0.726 0.526 0.861 yes
Perceived Supervisor Support -> Job Satisfaction
0.162 0.136 0.424 yes
Perceived Supervisor Support -> Organisational Commitment
0.389 0.301 0.590 yes
Individualised Consideration -> Relationship Management
0.859 0.762 0.941 yes
Individualised Consideration -> Self-awareness
0.674 0.469 0.834 yes
Individualised Consideration -> Self-management
0.749 0.602 0.869 yes
Stellenbosch University https://scholar.sun.ac.za

101
Individualised Consideration -> Social Awareness
0.790 0.671 0.901 yes
Individualised Consideration -> Job Satisfaction
0.127 0.123 0.365 yes
Individualised Consideration -> Organisational Commitment
0.355 0.272 0.587 yes
Individualised Consideration -> Perceived Supervisor Support
0.770 0.615 0.879 yes
Idealised Influence -> Relationship Management
0.914 0.859 0.961 yes
Idealised Influence -> Self-awareness
0.695 0.534 0.844 yes
Idealised Influence -> Self-management
0.854 0.766 0.934 yes
Idealised Influence -> Social Awareness
0.788 0.698 0.885 yes
Idealised Influence -> Job Satisfaction
0.196 0.140 0.449 yes
Idealised Influence -> Organisational Commitment
0.468 0.376 0.646 yes
Idealised Influence -> Perceived Supervisor Support
0.745 0.599 0.849 yes
Idealised Influence -> Individualised Consideration
0.991 0.937 1.052 no
Inspirational Motivation -> Relationship Management
0.925 0.868 0.969 yes
Inspirational Motivation -> Self-awareness
0.705 0.508 0.849 yes
Inspirational Motivation -> Self-management
0.892 0.806 0.961 yes
Inspirational Motivation -> Social Awarenss
0.844 0.756 0.912 yes
Inspirational Motivation -> Job Satisfaction
0.186 0.099 0.479 yes
Inspirational Motivation -> Organisational Commitment
0.400 0.297 0.583 yes
Inspirational Motivation -> Perceived Supervisor Support
0.733 0.581 0.848 yes
Inspirational Motivation -> Individualised Consideration
0.907 0.826 0.997 yes
Inspirational Motivation -> Idealised Influence
1.024 1.000 1.056 no
The results of the outer loadings for the EI measure are presented in table 4.32. Only
reverse scored item 58’s loading was not significant. Although item 58 was flagged
as poor item in the subordinate data, it did not pose a problem in the supervisor data,
and was therefore retained in the pool for further analyses. The rest of the items’
loadings were significant. The outer loadings of the scale ranged between 0.30 and
0.91 with Item 1 obtaining the lowest significant loading (0.30). Forty-one percent of
Stellenbosch University https://scholar.sun.ac.za

102
the loadings were between 0.50 and 0.69; and 50% of the loadings were 0.70 and
higher.
Table 4.32
PLS-SEM Outer Loadings: EI
Subscale Item Outer
loadings Mean 2.50% 97.50% Significant
Relationship Management
Item 1 0.30 0.30 0.11 0.47 yes
Item 13 0.61 0.61 0.47 0.73 yes
Item 16 0.71 0.71 0.52 0.84 yes
Item 2 0.73 0.72 0.53 0.85 yes
Item 22 0.71 0.70 0.55 0.82 yes
Item 3 0.66 0.64 0.45 0.81 yes
Item 30r 0.59 0.58 0.40 0.74 yes
Item 31r 0.43 0.43 0.22 0.62 yes
Item 33 0.79 0.78 0.62 0.88 yes
Item 34 0.84 0.84 0.74 0.90 yes
Item 36 0.76 0.76 0.63 0.86 yes
Item 37 0.88 0.87 0.81 0.92 yes
Item 38 0.80 0.80 0.68 0.88 yes
Item 39 0.82 0.81 0.70 0.89 yes
Item 46 0.65 0.64 0.47 0.78 yes
Item 47 0.88 0.88 0.82 0.92 yes
Item 51r 0.69 0.67 0.46 0.81 yes
Item 54 0.60 0.59 0.35 0.76 yes
Item 56 0.84 0.83 0.72 0.91 yes
Item 57 0.73 0.73 0.59 0.83 yes
Item 59 0.58 0.58 0.40 0.72 yes
Item 5r 0.48 0.47 0.24 0.67 yes
Item 6 0.79 0.78 0.66 0.87 yes
Item 61 0.69 0.69 0.53 0.81 yes
Item 62 0.91 0.91 0.86 0.95 yes
Item 63 0.87 0.88 0.82 0.92 yes
Item 67 0.88 0.87 0.79 0.92 yes
Item 68 0.74 0.75 0.65 0.82 yes
Self-management Item 10 0.70 0.69 0.48 0.83 yes
Item 14 0.53 0.53 0.39 0.65 yes
Item 15r 0.56 0.55 0.32 0.73 yes
Item 18 0.49 0.49 0.21 0.74 yes
Item 19 0.69 0.69 0.46 0.84 yes
Stellenbosch University https://scholar.sun.ac.za

103
Item 21 0.69 0.68 0.48 0.83 yes
Item 23 0.71 0.70 0.53 0.83 yes
Item 24 0.72 0.72 0.59 0.84 yes
Item 26 0.71 0.70 0.51 0.83 yes
Item 32 0.63 0.62 0.29 0.85 yes
Item 35 0.76 0.76 0.63 0.86 yes
Item 4 0.74 0.74 0.63 0.83 yes
Item 40 0.68 0.68 0.50 0.81 yes
Item 41 0.69 0.69 0.50 0.82 yes
Item 43r 0.40 0.39 0.14 0.62 yes
Item 44r 0.59 0.58 0.39 0.72 yes
Item 45 0.52 0.52 0.35 0.67 yes
Item 48 0.64 0.64 0.47 0.78 yes
Item 53 0.67 0.67 0.52 0.79 yes
Item 64r 0.44 0.42 0.14 0.66 yes
Item 65 0.55 0.56 0.27 0.75 yes
Item 66 0.53 0.52 0.23 0.74 yes
Item 7r 0.59 0.59 0.40 0.75 yes
Item 8 0.75 0.75 0.64 0.83 yes
Social wareness Item 11 0.77 0.76 0.57 0.88 yes
Item 12 0.72 0.69 0.44 0.86 yes
Item 20 0.75 0.74 0.54 0.86 yes
Item 25 0.69 0.69 0.50 0.81 yes
Item 27 0.58 0.54 0.16 0.78 yes
Item 28 0.81 0.80 0.66 0.89 yes
Item 49r 0.64 0.62 0.30 0.80 yes
Item 50 0.74 0.74 0.63 0.82 yes
Item 52 0.77 0.75 0.63 0.86 yes
Item 60 0.79 0.79 0.68 0.86 yes
Self-awareness Item 17 0.81 0.80 0.67 0.89 yes
Item 29 0.50 0.50 0.12 0.75 yes
Item 42 0.67 0.68 0.48 0.81 yes
Item 55 0.75 0.74 0.56 0.86 yes
Item 58r 0.42 0.40 -0.01 0.68 no
Item 9 0.66 0.64 0.44 0.79 yes
The results of the outer loadings of Job Satisfaction, Organisational Commitment
and Perceived Supervisor Support are presented in tables 4.33, 4.34 and 4.35
respectively. The only item loading that was not significant was Organisational
Stellenbosch University https://scholar.sun.ac.za

104
Commitment item 3 (“I really feel as if my current employer's/workplace's problems
are my own”). The loadings for Job Satisfaction ranged between 0.58 and 0.89, with
80% of the items obtaining loadings above 0.80. The loadings for Organisational
Commitment ranged between 0.30 and 0.74, with 50% of the items obtaining
loadings above 0.60. The loadings for Perceived Supervisor Support ranged
between 0.66 and 0.90, with 62.5% of the items reflecting loadings above 0.80.
Table 4.33
PLS-SEM Outer Loadings: Job Satisfaction (JS)
Item Outer
loadings Mean
2.50% 97.50% Significant
JS Item 1 0.84 0.83 0.70 0.91 yes
Item 2r 0.80 0.79 0.69 0.88 yes
Item 3 0.81 0.81 0.68 0.89 yes
Item 5 0.58 0.58 0.26 0.78 yes
Item 6 0.89 0.88 0.80 0.94 yes
Table 4.34
PLS-SEM Outer Loadings: Organisational Commitment (OC)
Item Outer
loadings Mean 2.50% 97.50% Significant
OC Item 1 0.55 0.55 0.34 0.71 yes
Item 10 0.70 0.69 0.53 0.8 yes
Item 11r 0.74 0.72 0.53 0.84 yes
Item 12 0.68 0.67 0.5 0.79 yes
Item 13 0.62 0.62 0.44 0.74 yes
Item 14 0.56 0.56 0.38 0.70 yes
Item 15r 0.60 0.59 0.33 0.76 yes
Item 16r 0.49 0.49 0.28 0.66 yes
Item 2r 0.52 0.51 0.23 0.70 yes
Item 3 0.30 0.29 -0.01 0.54 no
Item 4 0.57 0.56 0.30 0.74 yes
Item 5r 0.54 0.53 0.28 0.69 yes
Item 6 0.56 0.55 0.31 0.72 yes
Item 7r 0.70 0.68 0.47 0.81 yes
Item 8 0.72 0.72 0.59 0.82 yes
Item 9 0.71 0.70 0.56 0.80 yes
Stellenbosch University https://scholar.sun.ac.za

105
Table 4.35
PLS-SEM Outer Loadings: Perceived Supervisor Support (PSS)
Item Outer
loadings Mean
2.50% 97.50% Significant
PSS Item 1 0.75 0.73 0.50 0.88 yes
Item 2r 0.85 0.86 0.77 0.92 yes
Item 3r 0.66 0.66 0.44 0.81 yes
Item 4 0.89 0.88 0.79 0.95 yes
Item 5r 0.81 0.81 0.70 0.91 yes
Item 6 0.86 0.85 0.74 0.92 yes
Item 7r 0.76 0.77 0.52 0.92 yes
Item 8 0.90 0.90 0.82 0.95 yes
4.4 PLS Results: Validating the Structural (Inner) Model
Table 4.36 presents the R² values of the endogenous variables in the model. The R²
values ranged between 0.19 and 0.85. The lowest value was that of Organisational
Commitment (0.19), which indicates that the whole model accounted for only 19% of
the reported variance in Organisational Commitment. For the other two outcomes of
effective leadership, Job Satisfaction and Perceived Supervisor Support, the former
also obtained a weak R2 value (0.26), whilst the amount of variance explained for the
latter was moderate (0.51). The highest R² value was that of Relationship
Management (0.85) indicating that the total model explains about 85% of the
variance reported in the EI subscale Relationship Management.
Structural models are assessed by the R² values (in table 4.36) and the path
coefficients (presented in table 4.37). Twenty paths were hypothesised in the study,
however, given the discriminant validity and outer loadings results discussed in
sections 4.3.2 and 4.3.3, it was decided to remove Intellectual Stimulation from the
analyses. The hypothesised path from Intellectual Stimulation to Job Satisfaction
was therefore not included in the model, resulting in only 19 of the hypothesised
paths being tested. As shown in table 4.37, only 9 of the 19 hypothesised paths were
found to be statistically significant. Significant paths are indicated in red in figure 4.1.
Stellenbosch University https://scholar.sun.ac.za

106
Table 4.36
R square values for the PLS Path model
Variable R square
Relationship Management 0.85
Self-management 0.42
Social awareness 0.49
Job Satisfaction 0.26
Organisational Commitment 0.19
Perceived Supervisor Support 0.51
Individualised Consideration 0.47
Idealised Influence 0.75
Inspirational Motivation 0.69
Table 4.37
Path Coefficients
Path Path
coefficient Mean 2.50% 97.50% Significant
Relationship Management -> Idealised Influence
0.69 0.71 0.46 0.97 yes
Self-awareness -> Self-management
0.65 0.67 0.54 0.78 yes
Self-awareness -> Social Awareness
0.7 0.73 0.64 0.82 yes
Self-management -> Relationship Management
0.52 0.54 0.38 0.72 yes
Self-management -> Idealised Influence
0.19 0.18 -0.12 0.44 no
Self-management -> Inspirational Motivation
0.66 0.66 0.37 0.86 yes
Social Awareness -> Relationship Management
0.44 0.42 0.21 0.58 yes
Social Awareness -> Individualised Consideration
0.69 0.69 0.55 0.79 yes
Social Awareness -> Inspirational Motivation
0.19 0.19 -0.03 0.45 no
Organisational Commitment -> Job Satisfaction
0.5 0.53 0.28 0.71 yes
Perceived Supervisor Support -> Job Satisfaction
-0.06 -0.07 -0.46 0.26 no
Perceived Supervisor Support -> Organisational Commitment
0.18 0.2 -0.12 0.51 no
Individualised Consideration -> Job Satisfaction
-0.23 -0.23 -0.65 0.16 no
Individualised Consideration -> Organisational Commitment
-0.29 -0.29 -0.76 0.25 no
Individualised Consideration -> Perceived Supervisor Support
0.25 0.24 -0.05 0.53 no
Stellenbosch University https://scholar.sun.ac.za

107
Idealised Influence -> Job Satisfaction
0.16 0.17 -0.34 0.71 no
Idealised Influence -> Organisational Commitment
0.55 0.55 -0.22 1.21 no
Idealised Influence -> Perceived Supervisor Support
0.48 0.5 0.2 0.77 yes
Inspirational Motivation -> Organisational Commitment
-0.03 -0.04 -0.54 0.49 no
Stellenbosch University https://scholar.sun.ac.za

108
Figure 4.1. PLS results for the Structural Model
Stellenbosch University https://scholar.sun.ac.za
Stellenbosch University https://scholar.sun.ac.za
109
4.5 Interpreting the proposed hypotheses
Hypothesis 1: Self-awareness positively influences Self-management
Hypothesis 2: Self-awareness positively influences Social Awareness
Both hypothesis 1 and hypothesis 2 were supported by the results. Statistically
significant path coefficients of 0.65 (hypothesis 1) and 0.70 (hypothesis 2) emerged.
These significant relationships imply that the more individuals are knowledgeable
about their feelings and are able to recognise their own emotions, the better they will
be able to appropriately manage their emotions. They will also be aware of the
emotions of other individuals and display empathy. These paths support literature
that state Self-awareness is the cornerstone of EI (e.g. Goleman, 1995; Nourollahi,
Nikbakhsk & Esmaeili, 2011) and facilitates the other three EI skills.
Chapter 2 discussed the conceptual overlaps between the EI dimensions (Self-
awareness; Self-management; Social Awareness and Relationship Management)
used in this study, and the EI dimensions used by Beyers (2006). The Self-regulation
and Self-motivation dimensions of EI, utilised in the Beyers’ study has a conceptual
overlap with the Self-management dimension used in this study. In the Beyer’s study
significant positive relationships between Self-awareness and Self-regulation, as well
as between Self-awareness and Self-motivation, was reported. Moreover, Self-
awareness predicted Self-regulation and Self-motivation in the structural model. To
this end, the support for hypothesis 1 reported here, replicates Beyers’ finding of the
effect of Self-awareness on Self-management. In addition, the Empathy dimension
used in the Beyers study has a conceptual overlap with the Social Awareness
dimension used in the present study. Beyers reported a significant positive
relationship between Self-awareness and Empathy, and a significant positive path
was found in the model (i.e. Self-awareness influenced Empathy in the structural
model). Therefore, the support for hypothesis 2 in this study corroborates the result
found by Beyers, highlighting the important role of Self-awareness in Social
Awareness (i.e. expressing empathy).
Hypothesis 3: Self-management positively influences Relationship Management
Hypothesis 4: Self-management positively influences Idealised Influence
Stellenbosch University https://scholar.sun.ac.za
110
Hypothesis 5: Self-management positively influences Inspirational Motivation
Hypotheses 3 and 5 were corroborated by the results. Statistically significant path
coefficients of 0.52 (hypothesis 3) and 0.66 (hypothesis 5) were obtained for the
respective paths. This means that the better individuals are able to manage and
control their own emotions, the better they will be able to relate to others and
positively affect the emotions and/or responses of others. If further indicates that
those who manage and control their own emotions well will be able to motivate and
encourage others, inspiring them to perform beyond expectations.
The Self-regulation dimension in the Beyers (2006) study has a conceptual overlap
with the Self-management dimension used in the present study; and the Social Skills
dimension used in the Beyers (2006) study has a conceptual overlap with the
Relationship Management dimension in the present study. Beyers (2006) reported a
significant positive path between Self-regulation and Social Skills. The significant
path found between the EI dimensions Self-management and Relationship
Management (hypothesis 3) in the present study is therefore consistent with Beyers’
(2006) findings.
In addition, the Beyers’ (2006) Self-motivation EI dimension has a conceptual
overlap with the Self-management dimension used in this study. Beyers (2006)
reported a significant positive path between Self-motivation and the Inspirational
Motivation dimension of TFL in her structural model. The significant path found
between the EI dimension Self-management and TFL’s Inspirational Motivation
dimension in this study (hypothesis 5) is therefore consistent with the findings of
Beyers (2006). The finding also supports the relationship between the ability to
monitor/manage emotions and TFL’s Inspirational Motivation reported by Palmer et
al. (2001). Self-Management involves “managing one’s internal states, impulses and
resources” (Boyatzis, 2009); and also includes achievement orientation. Linked to
this element of achievement orientation, TFL’s Inspirational Motivation involves the
leader encouraging followers to commit to a “vision of the future, providing meaning”
to the work (Cho & Dansereau, 2010, p.411). This therefore demonstrates the
association between the Self-Management EI dimension and TFL’s Inspirational
Motivation.
Stellenbosch University https://scholar.sun.ac.za

111
Hypothesis 4, however, was not supported by the results as the path coefficient
(0.19) obtained was not statistically significant. This implies that the fact that a leader
can manage and control his/her emotions well (Self-management), probably does
not have a significant effect on whether he/she will be perceived to be a role model
to followers (Idealised Influence). This is in contrast to research by Modassir and
Singh (2008) whom have argued that leaders who are self-controlled, and can
manage their own emotions, serve as role models to subordinates (which are
characteristic of Idealised Influence). This finding is also in contrast to Barling et al.’s
(2000) argument that leaders who understand and manage their own emotions, and
who exhibit self-control, may be perceived as a role model by his/her followers. The
Self-regulation and Self-motivation dimensions of EI used by Beyers (2006) have a
conceptual overlap with the Self-management dimension of this study. Beyers (2006)
did not hypothesise any relationships between Self-motivation or Self-regulation with
the TFL dimension of Idealised Influence in her original structural model.
Hypothesis 6: Social Awareness positively influences Relationship Management
Hypothesis 7: Social Awareness positively influences Individualised Consideration
Hypothesis 8: Social Awareness positively influences Inspirational Motivation
Hypotheses 6 and 7 were both supported as statistically significant path coefficients
of 0.44 (hypothesis 6) and 0.69 (hypothesis 7) were evident from the results. These
findings imply that individuals who relate well to others by being able to recognise
others’ emotions and react appropriately (Social Awareness), will have the skill of
positively affecting others’ emotions and/or actions (i.e. Relationship Management;
hypothesis 6). Such individuals will also more likely display Individualised
Consideration behaviours of TFL through treating followers/subordinates as
significant individuals and giving each one personal attention (hypothesis 7). Social
Awareness has to do with the way in which individuals deal with, and manage
relationships. This links to leaders treating subordinates as significant contributors in
the workplace (Sarros & Santora, 2001), which is a characteristic of TFL’s
Individualised Consideration. Social Awareness furthermore involves being aware of
the opinions, feelings and desires of others (Boyatzis, 2009), and this can be
Stellenbosch University https://scholar.sun.ac.za

112
associated with leaders giving personal, individual attention to followers (which is
encompassed in Individualised Consideration) (Hoffman & Frost, 2006).
Empathy, in the Beyers (2006) research has a conceptual overlap with the Social
Awareness dimension of EI used in the present study. Furthermore, the Social Skills
dimension of EI used by Beyers (2006) has a conceptual overlap with the
Relationship Management dimension of EI used in the present study. Beyers (2006)
reported a significant positive path between Empathy and Social Skills, as well as
between Empathy and the TFL dimension of Individualised Consideration in her final
structural model results. These results were replicated in the current study, as
significant paths were found between the variables listed in hypotheses 6 and 7 of
the present study. This replication emphasises the important role of the EI skill of
Social Awareness (which includes empathy, organisational awareness and service
orientation) in the establishment of healthy and productive interpersonal
relationships, as well as in the TFL behaviours of Individualised Consideration.
However, the results revealed no support for hypothesis 8. This suggests that
individuals who are able to relate well to others by being able to recognise others’
emotions and react appropriately will not necessarily provide the motivation or
inspiration required to make followers perform beyond expectations. This is in
contrast to an argument put forth by Naznin (2013) who stated that leaders who have
Social Skills can build strong relationships with subordinates and also inspire them to
work toward a common vision and mission. Beyers (2006), however, did not
hypothesise a relationship between Empathy and Inspirational Motivation. This
finding is also in contrast to Barling et al.’s (2000) report that leaders with high EI,
through understanding the emotions of others, would realise the extent to which
subordinates expectations could be lifted, which is “a hallmark of inspirational
motivation” (p. 157).
Hypothesis 9: Relationship Management positively influences Idealised Influence
This hypothesis was corroborated by the results. A statistically significant path
coefficient of 0.69 emerged indicating a strong association between these variables.
The Social Skills dimension of EI used by Beyers (2006) has a conceptual overlap
Stellenbosch University https://scholar.sun.ac.za

113
with the Relationship Management dimension used in this study. Beyers (2006)
reported a significant positive path between Social Skills and Idealised Influence,
which is consistent with the significant path coefficient of hypothesis 9 in the current
study. This implies that leaders who can positively affect the emotions and actions of
others would be able to be a role model to subordinates. This is done, for example,
by the leader displaying confidence in the abilities of subordinates.
Hypothesis 10: Idealised Influence positively influences Perceived Supervisor
Support
Hypothesis 11: Idealised Influence positively influences Job Satisfaction
Hypothesis 12: Idealised Influence positively influences Organisational Commitment
The results revealed support for hypothesis 10 (significant path coefficient of 0.48).
This can be interpreted to suggest that leaders who are role models to their
subordinates, and are perceived as such by their subordinates, will cause the
subordinates to perceive that there is a good quality relationship between
themselves and their supervisor. The perception of such a relationship is influenced
by how the supervisor values the subordinate’s work and whether or not the
supervisor cares about the subordinate’s well-being (indicative of Positive Perceived
Supervisor Support).
However, no support emerged for hypotheses 11 and 12 (see table 4.37). These
findings suggest that although supervisors that display Idealised Influence TFL
behaviours (for example: giving personal attention to followers and treating each
follower as valuable) and therefore may be role models to their subordinates, this will
not necessarily lead to the subordinates reporting high levels of Job Satisfaction or
commitment to the organisation.
Stellenbosch University https://scholar.sun.ac.za
114
Hypothesis 14 6 : Individualised Consideration positively influences Perceived
Supervisor Support
Hypothesis 15: Individualised Consideration positively influences Job Satisfaction
Hypothesis 16: Individualised Consideration positively influences Organisational
Commitment
No evidence in support of hypotheses 14, 15 and 16, pertaining to the effect of the
TFL dimension of Individualised Consideration on the three outcomes of effective
leadership, emerged (insignificant path coefficients of 0.25, -0.23 and -0.29
respectively). Individualised Consideration includes the leader paying attention to the
individual needs of followers; treating each follower as significant and valuable; and
encouraging individual development. The findings therefore indicate that even
though a supervisor displays these behaviours, this will not necessarily cause higher
levels in the Job Satisfaction experienced by the subordinates. Furthermore, the
results suggest this will also not directly influence the subordinates’ level of
commitment to the organisation nor the subordinates’ perception of a positive,
supportive relationship with their supervisor.
Hypothesis 17: Inspirational Motivation positively influences Organisational
Commitment
The results revealed no support for this hypothesis (table 4.37). This implies that a
supervisor’s ability to inspire and encourage subordinates to perform beyond
expectations will not necessarily affect how committed the subordinate is to the
organization.
Hypothesis 18: Perceived Supervisors Support positively influences Job satisfaction
6 Hypothesis 13 was not tested due to the insignificant factor loadings of all the items for the
Intellectual Stimulation component of the TFL that emerged in the results for the PLS outer
model. It was, therefore, decided to remove this construct (Intellectual Stimulation) from the
analysis, as any PLS structural model results would be deemed unreliable.
Stellenbosch University https://scholar.sun.ac.za
115
Hypothesis 19: Organisational commitment positively influences Job satisfaction
Hypothesis 20: Perceived Supervisor Support positively influences Organisational
Commitment
Only one of the paths between the outcomes of effective leadership was found to be
significant. With a path coefficient of 0.50, hypothesis 19 was supported by the
results. This result implies that subordinates that display higher levels of commitment
to the organisation will also display higher levels of job satisfaction. This is consistent
with research by Pool and Pool (2007) who reported that Organisational
Commitment is a predictor of Job Satisfaction.
Hypotheses 18 and 20 were not supported by the results (path coefficients of -0.06
and 0.18 respectively). This suggests that although a subordinate perceives the
quality of the relationship with the supervisor as good, it will not necessarily cause
the subordinate to report a higher level of Job Satisfaction (hypothesis 18), nor will it
affect the subordinates’ level of commitment to the organisation (hypothesis 20).
4.6 Summary
This chapter reported on the data analyses that were conducted in the study. The
steps taken regarding the validation of the measurement instruments and
measurement model were discussed, as well as the results attained for the structural
model so as to test the proposed hypotheses. In the next chapter, the research
results will be discussed and interpreted. The final chapter also includes practical
implications, limitations of the study and recommendations for future research.
Stellenbosch University https://scholar.sun.ac.za

116
CHAPTER 5: DISCUSSION
5. 1 Introduction
This final chapter discusses and interprets the research results as presented in
chapter 4. Practical implications, the limitations of the study, as well as
recommendations for future research are presented.
5.2 Emotional Intelligence
Various researchers have studied and reported on the significance of EI for
individual success (Goleman, 1995), as well as organisational effectiveness. For
example, EI skills help individuals manage stress more effectively (Görgens-
Ekermans & Brand, 2012), perform better at work (Van Rooy & Viswesvaran, 2004)
and foster good relationships (Nourollahi, Nikbakhsk & Esmaeili, 2011), which in turn
feed into organisational effectiveness.
Key research in EI over the years has suggested that the construct is hierarchical in
nature. For example, in one of the foundational publications regarding the Mayer and
Salovey EI model, it is stated that the EI abilities are positioned from the “basic
psychological process to higher, more psychologically integrated processes” (Mayer
& Salovey, 1997, p.10). Others (e.g. Gardner & Stough 2002) support this viewpoint.
Mayer and Salovey’s (1997) EI model consists of four dimensions that involve
perceiving, using, understanding and managing emotions. Mayer, Roberts and
Barsade (2008) explain that as the skills develop in one basic dimension (for
example, perceiving emotions), so the skills will develop in the other more
psychologically integrated dimensions (for example, understanding and managing
emotions).
The EI model utilised in this research, the ESCI (Boyatzis, 2007), includes the sub-
dimensions of Self-awareness; Self-management, Social Awareness and
Relationship Management. The ESCI therefore does not only include basic
processes of emotional recognition and management skills (as encompassed in Self-
awareness and Self-management), but also the more psychologically integrated
dimensions such as social skills (which falls within the Social Awareness and
Stellenbosch University https://scholar.sun.ac.za

117
Relationship Management dimensions). According to Schutte, Malouff and
Thorsteinsson (2013) social skills as a component of EI, build on the more basic EI
skills. Self-awareness and Self-management are the more basic processes given
that these dimensions involve basic knowledge and skills related to identifying and
managing one’s own emotions. This is in contrast to the Social Awareness and
Relationship Management dimensions, which are the more integrated processes, as
it involves reading the environment and others’ emotional cues. Then, based on this,
it further involves deciding how to react to the situation in such a way that is
contributes to creating and maintaining functional relationships.
The current research provided evidence for the notion of the hierarchical nature of EI
(i.e. basic processes seem to drive high order processes). For example, from the
results it was observed that the R-square value for Relationship Management (0.85)
was the highest of the four EI dimensions. This indicates that the other three EI
dimensions (Self-awareness, Self-management and Social Awareness) account for a
substantial amount of variance in Relationship Management. Therefore, if Self-
awareness, Self-management and/or Social Awareness are increased, this should
ultimately also lead to the improvement in Relationship Management skills.
Furthermore, the results of this study also revealed that Self-awareness affects
Social Awareness, which in turn affects Relationship management. Therefore it could
be argued that if Self-awareness is increased, it will lead to enhanced Relationship
Management through increased Social Awareness. Similarly, the results of this study
indicated that Self-awareness affects Self-management, which in turn affects
Relationship management. Therefore if Self-awareness is increased, it will lead to
enhanced Relationship Management through increased Self-management. The
Relationship Management dimension, being more of an integrated process, is
therefore indirectly affected in two ways by the more basic process of Self-
awareness. Social Awareness and Self-management are mediators in the
association between Self-awareness and Relationship Management. For example,
the more individuals display the basic emotional skills of being aware of their own
emotions (Self-awareness) and are able to manage this and their emotional actions
and behaviours (Self-management), the more effective they should be in manifesting
the integrated process of Relationship Management which involves positively
affecting the emotions of others. Similarly, the more individuals are knowledgeable of
Stellenbosch University https://scholar.sun.ac.za

118
their own feelings (Self-awareness), the better they will be able to display empathy
and be aware of others’ emotions, which is characteristic of Social Awareness (an
integrated EI process). This will lead to them having better Relationship
Management skills which include conflict management and influencing others.
The present study replicated Beyers’ (2006) outcome regarding the hierarchical
nature of the EI dimensions. More specifically, Beyers’ (2006) reported that the Self-
awareness dimension was found to be the cornerstone of EI upon which the other
three dimensions or skills are built. This result, which has been replicated in the
current study, suggests that an “emotionally intelligent leader can keep an eye on his
or her moods though self-awareness, adapt them for the better through self-
management, understand their consequences through empathy, and act in ways that
enhance followers’ moods through social management” (Beyers, 2006, p.45). Hence,
the current study, together with the Beyers (2006) result, provides strong evidence
for the hierarchical process constellation of EI skills that has not received much
empirical attention in the EI literature. Results about inter-correlations of respective
EI dimensions for specific EI models are routinely reported in EI studies. However,
our understanding of the psychological process underlying how different EI skills are
hierarchically ordered (implied by the EI part of the structural model tested in this
study) and how certain basic EI skills influence other more psychologically integrated
EI skills, has been lacking in the literature. To this end, this study aimed to contribute
to the current body of literature regarding the nature of the EI construct.
5.3 EI and TFL
The significance of EI skills for successful leadership has been reported by various
researchers (e.g. Boyatzis, 1982; Duckett & Macfarlane, 2003; Goleman, 1998).
Leaders with high EI are considered by their subordinates to be more effective and
transformational (Sivanathan & Fekken, 2002). For example, it has been shown that
transformational leaders express emotions in such a manner so as to encourage
subordinates to embrace new ideas and visions (Ashkanasy & Tse, 2000).
Batool’s (2013) study reflected the importance of a leader’s EI in reducing stress, as
well as developing the performance and motivation of subordinates in the workplace.
These outcomes, in turn, were shown to influence the organisation’s productivity.
Stellenbosch University https://scholar.sun.ac.za

119
Moreover, Kerr et al. (2006) reported that EI is a key element for leadership
effectiveness. These authors argued that this could be because leaders who
understand and manage emotions well, seems to be perceived as more effective by
subordinates. In the present study, the focus was specifically on the relationship
between EI and the TFL style, which has been shown to be more effective than other
leadership styles (for example, Transactional Leadership). Studies conducted by
Sayeed and Shanker (2009) as well as Hebert (2011) have revealed significant
relationships between EI and TFL.
Building on the argument that leadership is “an emotional process” (Nourollahi, et al.,
2011, p.32) various researchers have explored the relationship between leader EI
and effective leadership. For example, Gardner and Stough (2002) reported that
leaders whom are more emotionally intelligent are more committed and successful in
the workplace. More specifically, Gardner and Stough (2002), using the SUEIT
(Palmer & Stough, 2001), reported a strong positive relationship (r = 0.675, p < 0.01)
between EI and TFL, whereas no relationship was found between EI and
Transactional Leadership. Furthermore, the authors also reported a significant
negative relationship (r = -0.464, p <0.01) between laissez-faire leadership and EI.
The correlation (r = 0.585, p < 0.01) between Individualised Consideration (TFL) and
understanding emotions external (EI) was reported as the strongest. Their results
were consistent with research by Palmer et al. (2001) who reported that an
individuals’ ability to manage their own emotions and those of others is a key skill of
TFL. Similarly, Rahman, Ferdausy and Uddin’s (2012) also reported that leaders with
a higher EI are more likely to be transformational leaders.
The results of all the studies cited above undoubtedly emphasise the importance of
leader EI on TFL behaviours. However, a signature characteristic of most of these
studies is the fact that associations between EI and TFL were mostly investigated
through the calculation of correlations. Although a significant correlation between two
variables implies that an association exists, this does not provide much insight into
the psychological process that underlie this association. It is in this respect that the
current study aimed to contribute to the EI – TFL literature, by proposing a plausible
nomological net of variables that provide insight into the way in which EI skills may
Stellenbosch University https://scholar.sun.ac.za

120
influence TFL behaviours. To this end various hypotheses of paths between EI sub-
dimensions and TFL sub-dimensions were included in the structural model,
emphasising the fact that certain EI skills may be more salient in predicting certain
TFL behaviours, than others. For example, Relationship Management was
hypothesised to influence the TFL dimension of Idealised Influence, but not the other
TFL dimensions. This is due the nature of the Idealised Influence dimension, which
includes inspirational and charismatic behaviour, which overlaps with the
Relationship Management skills (for example: positively affecting others’ emotions)
to a greater extent than the other dimensions of TFL. Ultimately, this study aimed to
add to the body of knowledge regarding the nature of the relationships between EI
and TFL in a way that would create a deeper understanding of which specific EI
skills would influence certain TFL behaviours.
The findings of the present study were consistent with Beyers’ (2006) findings and
confirmed multiple positive significant paths between the EI skills and TFL
characteristics included in the structural model. More specifically, in this study
significant paths were found between Self-management (EI) and Inspirational
Motivation (TFL); Social Awareness (EI) and Individualised Consideration (TFL); as
well as Relationship Management (EI) and Idealised Influence (TFL). However, two
of the five hypothesised paths were not supported by the research.
For example, it was argued that that leaders who exhibit self-control (a component of
Self-management within the ESCI model), may be more aware of, and in tune with,
what others may be feeling (i.e. Social Awareness / Empathy), and therefore may be
perceived as a role model by his/her followers (Idealised Influence), due to the trust
and respect that is developed for the way in which the leader reacts towards the
follower. However this path was found to be non-significant. Similarly, it was argued
that when a leader exhibits emotional Self-awareness, this will impact on the Social
Awareness capability of the leader, which would ultimately impact on the degree to
which the follower perceives the leader to display Inspirational Motivation, as a TFL
behaviour. However, the path from Social Awareness to Inspirational Motivation was
not found to be significant.
Stellenbosch University https://scholar.sun.ac.za
121
However, the results revealed that the Relationship Management dimension of EI
obtained the highest R-square value of all the endogenous variables in the model,
which indicates that the other three EI dimensions account for a large percentage of
the variance in Relationship Management. This result could possibly explain why the
direct path between Self-management and Idealised Influence was not supported in
the current study. In other words, the path from Self-management to Idealised
Influence is mediated by Relationship Management, as a significant path was found
between Self-Management and Relationship Management, as well as between
Relationship Management and Idealised Influence. The results therefore reveal that
Self-management affects Idealised Influence through its effect on Relationship
Management. Relationship Management has to do with the skill of positively
affecting others’ responses and/or emotions. It includes “coach and
mentor…inspirational leadership…influence…conflict management… [and]
teamwork…”(Boyatzis, 2009, p.754). This overlaps with the characteristics of
Idealised Influence which involves leaders behaving in such a way that they are
perceived as being role models to their followers (Sarros & Santora, 2001). Banerji
and Krishnan (2000) suggest that charisma (portrayed through Idealised Influence) is
the most significant element of TFL. It is worth noting that the results of this study
are not only based on the self-perceived behaviours of leaders themselves, but also
their subordinates’ observations of their leaders’ behaviours. This therefore indicates
that subordinates perceive their leaders as displaying Idealised Influence behaviours
when the leader exhibits characteristics of the Relationship Management dimension
of EI.
The present study also revealed a significant path from the Social Awareness
dimension of EI to the Individualised Consideration dimension of TFL. Empathy is a
sub-dimension of the Social Awareness dimension of EI. Individualised
Consideration involves a leader paying personal attention to the each subordinate
(Bass, 1990), which arguably involves a degree of empathy. Social Awareness also
include being aware of others’ feelings and desires which also overlaps with
Individualised Consideration behaviour. This could explain why a positive path from
Social Awareness to Individualised Consideration emerged. A significant path from
the Self-management dimension of EI to the Inspirational Motivation dimension of
TFL also emerged in the present study. This suggests that leaders who exhibit self-
Stellenbosch University https://scholar.sun.ac.za

122
control (a component of Self-management) will likely be perceived to display
Inspirational Motivation behaviour that encourages subordinates to commit to a
vision, and exert extra effort in their work.
Furthermore, the results of the present study replicate Beyers’ (2006) results with
regard to the relationships between specific EI dimensions and the dimensions of
TFL. Two of the paths contained in the Beyer’s (2006) model (i.e. Empathy on
Individualised Consideration, and Social Skills on Idealised Influence) were
replicated in this study. This, therefore, enhances confidence in the notion that EI
and TFL are related in a very specific manner, as evidenced by the empirical results
of these two studies. Hebert (2011) further concluded that TFL characteristics can be
enhanced through the development of EI skills. Self-awareness was revealed as the
cornerstone of EI through the current, as well as previous study (Beyers, 2006).
Therefore, it could be argued that the Self-awareness dimension would be the best
starting point for such a developmental program, as it would impact on the other
three dimensions of EI as shown in the results of the present study, as well as that of
Beyers (2006).
5.4 TFL and outcomes of effective leadership
The popularity of TFL is partially due to its pervasive connection to advanced
performance (Camps & Rodriguez, 2010; Dvir et al., 2002; McColl-Kennedy &
Anderson, 2002). This leadership style has been shown to be positively correlated
with leader effectiveness (r = .66, p < .001) (Hur et al., 2011). Various other
researchers have also shown that TFL is generally more effective than other
leadership styles (Downey et al., 2006; Dubinsky et al., 1995; Limsila & Ogunlana,
2008), and has been associated with increased effort, performance, satisfaction, and
commitment in followers (Barbuto & Burbach, 2006; Leban & Zulauf, 2004; Limsila &
Ogunlana, 2008; Lowe, et al., 1996).
Perceived Supervisor Support, Job Satisfaction and Organisational Commitment
were assessed as outcomes of effective leadership in the present study. In total,
seven direct paths between the different TFL sub-dimensions and the three
outcomes of effective leadership were hypothesised, based on the literature
presented in chapter 2. However, the only significant path that emerged was
Stellenbosch University https://scholar.sun.ac.za
123
between the Idealised Influence dimension of TFL and Perceived Supervisor
Support.
This finding indicates that when a leader exhibits behaviours characteristic of
Idealised Influence, such as instilling confidence in the subordinates’ abilities, and
causing subordinates to view the leader as a role model; this will cause subordinates
to have a positive perception of supervisor support. Perceived Supervisor Support
refers to the extent to which subordinates feel their leaders value their work and are
concerned about their well-being. According to Yoon et al. (2004, p.396) supervisory
support can be described as “the socio-emotional concerns of the supervisor, and
represents the degree to which the supervisor creates a facilitative climate of
psychological support, mutual trust, friendliness, and helpfulness”.
The positive relationship between Idealised Influence and Perceived Supervisor
Support is significant given the positive implications heightened Perceived
Supervisor Support could have for organisations. For example, Eisenberger,
Stinglhamber, Vandenberghe, Sucharski and Rhoades (2002) reported that
employees who reported experiencing positive perceived supervisor support also
reported experiencing enhanced levels of Perceived Organisational Support, which
in turn is associated with a higher retention rate. Other positive outcomes of
Perceived Supervisor Support include enhanced performance, organisational
citizenship behaviours and Job Satisfaction (Harris, et al., 2009). Maertz et al. (2007)
also highlight the significance of this relationship by indicating that Perceived
Supervisor Support has a significant negative correlation with subordinates’ turnover
(Maertz et al., 2007). Therefore it could be argued that the significance of this result
suggests that interventions targeted at increasing Idealised Influence TFL
behaviours, should be effective in creating perceptions of Perceived Supervisor
Support, which could have a whole host of positive organisational outcomes.
The results did not indicate any support for the paths between Idealised Influence
and Job Satisfaction, as well Organisational Commitment. This suggests that
although supervisors that display behaviours characteristic of Idealised Influence (for
example: giving personal attention to followers and treating each follower as
valuable), this will not necessarily lead to the subordinates reporting higher levels of
Stellenbosch University https://scholar.sun.ac.za

124
Job Satisfaction or commitment to the organisation. The results of the analyses
furthermore did not support any other direct relationships between the other
dimensions of TFL and the outcomes of effective leadership (Perceived Supervisor
Support, Job Satisfaction and Organisation Commitment). For example, Muni,
Rahman, Malik and Ma’amor (2012) report a positive relationship between TFL and
Job Satisfaction. The present study hypothesised relationships between Idealised
Influence and Job Satisfaction as well as between Individualised Consideration and
Job Satisfaction. However, none of these were found to be significant. This suggests
that although leaders are perceived as role models (Idealised Influence) and pay
individual attention to the needs of each subordinate (Individualised Consideration);
this will not necessarily positively influence the subordinates’ Job Satisfaction levels.
A possible explanation for this could be that there are other variables that mediate,
and/or moderate the relationships between the TFL dimensions and the outcomes of
effective leadership used in this study. For example, Nielsen, Yarker, Randall and
Munir (2009) reported the team efficacy (referring to the competence to the group in
which the individual works) was found to be a mediator between TFL and Job
Satisfaction.
The current study also investigated whether the three TFL dimensions (Idealised
Influence, Individualised Consideration and Inspirational Motivation) predicted
Organisational Commitment of subordinates. None of those paths were supported by
the results. Once again, it could be argued that the lack of support found for these
direct paths could be because there are important mediators/moderators between
the TFL dimensions and Organisational Commitment, not included in the current
model. For example, in an empirical study, Avolio, Zhu, Koh and Bhatia (2004)
investigated the mediating/moderating roles of psychological empowerment and
structural distance in the relationship between TFL and Organisational Commitment.
Psychological empowerment was defined as “increased intrinsic task motivation
manifested in a set of four cognitions reflecting an individual’s orientation to his or
her work role: competence, impact, meaning, and self-determination” (Spreitzer,
1995, p. 1443). Structural distance refers to whether the reporting relationship
between leader and subordinate is direct or indirect. With a sample of 520 staff
nurses in Singapore, the authors tested the proposed model. The results indicated
Stellenbosch University https://scholar.sun.ac.za
125
that psychological empowerment mediated the path from TFL to Organisational
Commitment. This suggests that the more empowered subordinates feel, as a result
of TFL behaviours, the more committed they will be to the organisation. Furthermore,
the study revealed that structural distance had a moderating effect on the
relationship between TFL and Organisational Commitment. This implies that
transformational behaviour from indirect supervisors had a stronger relationship with
the Organisational Commitment levels of subordinates than the behaviour of direct
supervisors.
Similarly, Whittington, Goodwin and Murray (2004, p. 593) conducted an empirical
study to investigate the role of job enrichment and goal difficulty as moderators
between TFL and the following three outcomes: “performance, affective
organisational commitment, and organisational citizenship behavior.” With a sample
of 140 leaders and 209 followers, the results of the study concluded that goal
difficulty moderates the relationship between TFL and affective Organisational
Commitment. The authors argued that this could be because having goals that are
challenging (which is an aspect of Intellectual Stimulation) are indicative of the
leader’s confidence in the subordinates’ abilities, which, in turn, positively influence
the subordinate’s performance. Furthermore, the resulting positive emotion toward
the leader would “transfer to the organization” (Whittington et al., p.603), which could
increase commitment.
In addition, Pillai and Williams (2004) proposed a model where subordinates’ self-
efficacy and cohesiveness are moderators between TFL and commitment, as well as
performance. After testing the model using a final sample of 271 responses, the
proposed model was supported. More specifically, the authors reported that TFL
affects commitment and performance directly, but also that these paths are mediated
by cohesiveness and self-efficacy. These results imply that subordinates’
commitment levels will be affected by the transformational characteristics of their
leader as well as the degree to which they believe in their own abilities. A further
implication is that subordinates’ commitment levels will be affected by the
transformational characteristics of their leader as well as the extent to which the
group members are attached to the group.
Stellenbosch University https://scholar.sun.ac.za

126
Finally, Wang et al. (2005) explored the role of leader-member exchange as a
mediator between TFL and subordinates’ performance, as well at their OCB. Leader-
member exchange (LMX) refers to the perspective of leadership that focuses on
“how one-on-one reciprocal social exchanges between leader and follower evolve,
nurture, and sustain the dyadic relationship” (Wang, et al., 2005, p. 420). OCB refers
to behaviour that is not usually included in a formal job description, but “supports
task performance by enhancing a social and psychological work environment” (Wang
et al., 2005, p. 421). The results of the study suggested that LMX mediated the
association between TFL and task performance as well as OCB. The implication of
this finding is that the informal bond between a leader and subordinate, and how the
subordinate interprets these interactions, are important in the association between
TFL and subordinates’ OCB. This argument could probably also be extended to the
TFL – Organisational Commitment relationship. Therefore, LMX should be
considered as an important variable in this relationship, and should be considered for
inclusion in future studies.
All of these studies listed above suggest certain mediators and/or moderators that
may have an effect on the TFL and Organisational Commitment relationship. It is
recommended that in future research more variables, such as the ones suggested
above, should be included in a structural model when the effects of TFL on the
outcomes of effective leadership are studied. This should provide a more closely
associated approximation of the reality of the psychological processes that underlie
the outcomes of effective leadership as a function of TFL.
5.5 Relationship between the Outcomes of Effective Leadership
The relationships between the three outcomes variables (Perceived Supervisor
Support, Job Satisfaction and Organisation Commitment) were also analysed in this
study. Research has indicated that Perceived Supervisor Support is an antecedent
of Organisational Commitment (Eisenberger, et al., 1896; Wayne, et al., 1997) as
well as of Job Satisfaction (Graen, et al., 1982). Further to this, research has also
revealed that Organisational Commitment is an antecedent of Job Satisfaction levels
(Pool & Pool, 2007). Direct paths were therefore hypothesised from Perceived
Supervisor Support to Organisational Commitment, as well as to Job Satisfaction. A
path from Organisational Commitment to Job Satisfaction was also proposed in the
Stellenbosch University https://scholar.sun.ac.za
127
current study. The only path that was found to be significant was from Organisational
Commitment to Job Satisfaction. This finding suggests that the more individuals feel
committed to an organisation (as a result of, for example, the quality of perceived
supervisor support), the higher their levels of Job Satisfaction would be. This would
have a positive outcome for an organisation, as high Job Satisfaction levels have
been associated with high employee retention rates (Van Saane et al., 2003) as well
as with organisational citizenship behaviour (Ghazzawi, 2010).
Once again, a literature review revealed some important mediators that could
account for the lack of support of the Perceived Supervisor Support and Job
Satisfaction, as well as Organisational Commitment paths. For example, in a very
recent study Gok et al. (2015) reported that organisational identification (i.e. the
degree to which a member defines him- or herself by the same attributes that he or
she believes define the organisation) partially mediated the relationship between
Perceived Supervisor Support and Job Satisfaction. Moreover, Babin and Boles
(1996) confirmed, through the testing of a structural model, the mediating role of role
stress (defined by both role conflict and role ambiguity) and job performance, in the
Supervisor Support – Job Satisfaction relationship. However, it is interesting to note
that in this study, Supervisor Support also directly predicted Job Satisfaction with a
rather moderate to strong path coefficient of 0.41. In addition, Woo and Chelladurai
(2012) reported that intrinsic motivation (i.e. when employees find the work they do
interesting) moderated the relationship between Perceived Support and affective
commitment.
5.6 Practical Implications
Knowledge on the nature of the relationship between EI and TFL can be useful in
recruitment and selection, as well as in the development of leaders (Mandell &
Pherwani, 2003). With research revealing that Transformational Leaders are more
effective than those with other leadership styles (Gardner & Stough, 2002; Limsila &
Ogunlana, 2008), it would be useful for organisations to include EI testing as part of
the selection process for appointing transformational leaders.
Furthermore, a huge advantage for organisations is that research evidence suggests
that EI skills can be developed (Dulewicz & Higgs, 2004; Fletcher, Leadbetter,
Curran, & O’Sullivan, 2009; Görgens-Ekermans, 2011; Görgens-Ekermans, Delport,
Stellenbosch University https://scholar.sun.ac.za

128
& Du Preez, 2015). For example, acknowledging the importance of EI for health,
performance and relationships, Nelis, Quoidbach, Mikolajczak and Hansenne (2009)
investigated whether EI skills can be developed. The authors used two groups in the
study: one group went through four training sessions; the other group received no
training. The results revealed that the EI skills of those that received training were
developed; and six months later, this development was still evident. No changes
were detected in those that did not receive training. This is in line with the findings of
Fletcher et al. (2009) who, using a group of medical students, investigated whether
EI training could cause development in EI levels/skills. Their results supported the
notion that EI can be developed.
Gardner’s (2005) research focused on the implementation of an EI training
programme with a focus on stress management. The research results revealed that
the EI training was effective, and increased participant’s skills in managing stress.
This replicated the results of a study by Slaski and Cartwright (2003). The authors,
with a sample of 60 managers in the UK, also investigated the role of EI in the stress
process. The results of the study confirmed that EI can be taught, and has
advantages for wellbeing, performance, as well as stress levels. In light of these
research findings, it is argued that workshops/programs could therefore be
implemented to enhance leadership effectiveness through the development of EI
skills.
The results of the study also revealed a positive relationship between TFL and
Perceived Supervisor Support which holds a number of positive implications for
organisations. For example, positive organisational outcomes of positive Perceived
Supervisor Support include enhanced performance, organisational citizenship
behaviours and Job Satisfaction (Harris, et al., 2009). Hence, a practical implication
of this result is that organisations should actively try and find out from employees
what leaders could do to provide supervisory support. This knowledge would
strengthen the capacity of the leader to enhance support behaviours which could
have positive outcomes for the organisation.
Stellenbosch University https://scholar.sun.ac.za

129
5.7 Limitations of the Study
One limitation of this study was the small sample size which only consisted of 85
leader-follower dyads. Another limitation was that most of the responses were from
Higher Education Institutions. This limits the generalisability of the research results.
In addition to this, in the supervisor data, 58.8% of the respondents were white; and
of the subordinate data, the largest percentage (37.9%) were coloured. The other
ethnic groups were very much underrepresented. In the supervisors’ data, only 3.5%
were Black, and 2.4% were Indian, and in the subordinates’ data, 6.6% were Black
and 1.6% was Indian. These statistics further limit the generalisability of the results.
A further limitation of the study has to do with the fact that some of the data were
obtained through self-report questionnaires (i.e. Job Satisfaction, Organisational
Commitment and Perceived Supervisor Support, as well as the supervisor data on EI
and TFL). There’s therefore a concern about self-report bias which could influence
the data’s reliability and validity.
This study was non-experimental by nature. Inferences regarding causality based on
the outcomes of Structural Equation Modelling should be regarded cautiously with
the use of non-experimental designs.
Another limitation of this study was that the conceptual model did not make provision
for moderating variables between the various constructs analysed. For example,
although the literature and previous research suggested that there is a relationship
between TFL and Job Satisfaction, as well as Organisational Commitment, no such
relationships were found in the results of this study. It would therefore make sense
for future studies to consider including more moderators and mediators in these
relationships.
Although previous research indicated a positive relationship between TFL and the
outcomes of effective leadership used in the present study, it should be noted that
these studies analysed these relationships using TFL as a composite construct. In
the present study, the specific sub-dimensions of TFL were considered, in order gain
a deeper understanding of how each one is affected by the different EI dimensions.
This was also done to explore how each TFL sub-dimension related to the outcomes
Stellenbosch University https://scholar.sun.ac.za

130
of effective leadership. The fact that TFL was not studied as a composite construct in
this study could be a reason as to why some of the paths between the TFL sub-
dimensions and some of the outcomes were not found to be significant.
5.8 Recommendations for Future Research
A first recommendation for future research, which stems from the limitations of this
study, would entail using a larger sample and including participants from different
sectors/industries. This would make the results of the research more generalisable.
Secondly, instead of using a composite score of Organisational Commitment, more
accurate results may be yielded from a study that explores the effect of TFL on the
different types of commitment (i.e. Affective, Continuance and Normative
commitment).
Lastly, another recommendation would be to include other mediating, and/or
moderating variables between the TFL dimensions and the three outcomes of
effective leadership used in this study. Together with this it may be helpful to study
other constructs as outcomes of effective leadership, as experienced by the follower
of a leader that exhibits certain TFL behaviours being influenced by various EI
competencies.
5.9 Conclusion
Realising the importance of leadership for an organisation’s success, this study
examined the effect of EI on leadership effectiveness. The study built upon the
Beyers (2006) model of the relationship between EI and TFL. A more recent model
and measurement of EI was used, and three constructs were added to the model as
outcomes of effective leadership: Perceived Supervisor Support, Job Satisfaction
and Organisational Commitment. The research question that was addressed for this
study were as follows: Does the expanded and adapted conceptual model developed
in this study provide a valid account of the psychological processes that determines
the outcomes of effective leadership, defined as Perceived Supervisor Support, Job
Satisfaction and Organisational Commitment, as experienced by the follower of a
particular leader that exhibits certain TFL behaviours being influenced by various EI
competencies?
Stellenbosch University https://scholar.sun.ac.za
131
The findings of this study replicated the results of Beyers (2006) with regard to the
effect of EI on TFL. However, only one path from TFL to the outcomes of effective
leadership was found to be statistically significant ((Idealised Influence to Perceived
Supervisor Support). Paths amongst the three outcomes were also tested, and only
one, from Organisational Commitment to Job Satisfaction, was found to be
significant.
The study provides more insight into the relationship of EI with the TFL style.
However, further research is needed to establish the exact nature of the
relationships between TFL behaviours and the outcomes of effective leadership used
in this study.
Stellenbosch University https://scholar.sun.ac.za

132
REFERENCE LIST
Abbasi, S.M., & Hollman, K.W. (2000). Turnover: The Real Bottom Line. Public Personnel
Management, 29(3), 333-342.
Aibinu A. A., & Al-Lawati A. M. (2010). Using PLS-SEM technique to model construction
organizations’ willingness to participate in e-bidding. Automation in Construction, 19,
714–724.
Allen, N.J., & Meyer, J.P. (1990). The measurement and antecedents of affective,
continuance and normative commitment to the organization. Journal of Occupational
Psychology, 63, 1–18.
Allen, N.J., & Meyer, J.P. (1996). Affective, Continuance, and Normative Commitment to
the Organisation: An Examination of Construct Validity. Journal of Vocational
Behaviour, 49, 252-276.
Amabile, T.M., Schatzel, E.A., Moneta, G.B. & Kramer, S.J. (2004). Leader behaviors and
the work environment for creativity: Perceived leader support. The Leadership
Quarterly, 15, 5 – 32.
Anderson, J.C., & Gerbing, D.W. (1988). Structural Equation Modeling in Practice: A
Review and Recommended Two-Step Approach. Psychological Bulletin, 103(3),
411-423.
Antonakis, J., Avolio, B.J., & Sivasubramaniam, N. (2003). Context and leadership: An
examination of the nine-factor full-range leadership theory using the Multifactor
Leadership Questionnaire. The Leadership Quarterly, 14(3), 261- 295.
Arnold, J., & Davey, K.M. (1999). Graduate’s work experiences as predictors of
organisational commitment, intention to leave, and turnover: which experienced
really matter? Applied Psychology: An International Review, 48(2), 211-238.
Ashkanasy, N. M., & Tse, B. (2000). Transformational leadership as management of
emotion: A conceptual review, in N. Ashkanasy, C.E.J. Härtel, & W.J. Zerbe. (Eds.),
Emotions in the Workplace: Research, Theory, and Practice, (pp. 221-235).
Westport, CT: Quorum Books.
Stellenbosch University https://scholar.sun.ac.za

133
Averill, J.R (2004). A Tale of Two Snarks: Emotional Intelligence and Emotional Creativity
Compared. Psychological Inquiry, 15(3), 228–233.
Avolio, B.J., Bass, B.M., & Jung, D.I. (1999). Re-examining the components of
transformational and transactional leadership using the Mutilfactor Leadership
Quesionnaire. Journal of Occupational and Organizational Psychology, 72, 441-462.
Avolio, B.J., Zhu, W., Koh, W., & Bhatia, P. (2004). Transformational leadership and
organizational commitment: mediating role of psychological empowerment and
moderating role of structural distance. Journal of Organizational Behavior, 25, 951-
968.
Babin, B.J., & Boles, J.S. (1996). The Effects of Peceived Co-Worker Involvement and
Supervisor Support on Service provider Role Stress, Performance and Job
Satisfaction. Journal of Retailing, 72(1), 57-75.
Bachman, J., Stein, S., Campbell, K., & Sitarenios, G. (2000). Emotional Intelligence in the
Collection of Debt. International Journal of Selection and Assessment, 8 (3), 176–
182.
Bagshaw, M. (2000). Emotional inteliigence – training people to be affective so they can be
effective. Industrial and Commercial Training, 32(2), 61– 65.
Banerji, P., & Krishnan, V.R. (2000).Ethical preferences of transformational leaders: an
empirical investigation. Leadership & Organization Development Journal,21(8), 405-
413.
Barbuto, J.E., & Burbach, M.E. (2006). The Emotional Intelligence of transformational
Leaders: A field Study of Elected Officials. The Journal of Social Psychology, 146(1),
51-64.
Barling, J., Slater, F., & Kelloway, E.K. (2000). Transformational leadership and emotional
intelligence: an exploratory study. Leadership and Organizational Development, 21,
157-161.
Bar-On, R. (1997). Emotional Quotient Inventory: technical manual. Toronto: Multi-Health
Systems.
Stellenbosch University https://scholar.sun.ac.za

134
Bar-On, R. (2000). Emotional and social intelligence: insights from the Emotional Quotient
Inventory. In R. Bar-On & J.D.A. Parker (Eds.), The handbook of emotional
intelligence (pp.363 – 388). San Francisco: Jossey-Bass.
Bar-On. R. (2005). The Bar-On Model of Emotional-Social Intelligence (ESI). In P.
Fernandez-Berrocal and N. Extremera (Guest Editors), Special Issue on Emotional
Intelligence: An overview. Psicothema, 173(18), 1-6.
Bar-On. R., Maree, J.G., & Elias, M.J. (2007). Educating People to Be Emotionally
Intelligent. Westport Conneticut, London: Praeger.
Bass, B.M. (1985). Leadership and Performance Beyond Expectations, Free Press, New
York, NY.
Bass, B.M. (1990). Bass and Stogdill's Handbook of Leadership: Theory, Research and
Managerial Applications. New York: Free Press
Bass, B.M. (1999). Two decades of research and development in transformational
leadership. European Journal of Work and Organizational Psychology, 8(1), 9-32.
Bass, B.M., & Avolio, B.J. (1995). Multifactor leadership questionnaire for research. Palo
Alto, CA: Mind Garden.
Bass, B.M., Avolio, J.A., Jung, D.I., & Berson, Y. (2003). Predicting Unit Performance by
Assessing Transformational and Transactional Leadership. Journal of Applied
Psychology, 88(2), 207-218.
Batool, B.F. (2013). Emotional Intelligence and Effective Leadership. Journal of Business
Studies Quarterly, 4(3), 84-94.
Becker, T. (2003). Is emotional intelligence a viable concept? Academy of Management
Review, 28, 192-19.
Beugre, C.D., Acar, W., & Braun, W. (2006). Transformational leadership in organizations:
an environment-induced model. International Journal of Manpower, 27(1), 52-62.
Beyers, W. (2006). The development of a structural model reflecting the impact of
emotional intelligence on transformational leadership. Unpublished master’s thesis.
University of Stellenbosch.
Stellenbosch University https://scholar.sun.ac.za

135
Blau, P. (1964). Exchange and power in social life. New York: John Wiley
Bloom, N., & Van Reenen, J. (2007). Measuring and Explaining Management Practices
Across Firms and Countries. The Quarterly Journal of Economics, 122(4), 1351-
1408.
Bono, J.E., & Ilies, R. (2006). Charisma, positive emotions and mood contagion. The
Leadership Quarterly, 17, 317-334.
Boyatzis, R. (1982). The competent manager. New York: Wiley & Sons.
Boyatzis, R. (2007). The creation of the Emotional and Social Competency Inventory
(ESCI). Retrieved on November 5, 2012 from http://e-
russell.com/images/ESCI_Article.pdf
Boyatzis, R.E. (2009). Competencies as a behavioural approach to emotional intelligence.
Journal of Management Development. 28(9), 749-770.
Boyatzis, R.E., & Goleman, D. (2007). Emotional Competency Inventory (now the
Emotional and Social Competency Inventory). Boston, MA: Hay Group.
Boyatzis, R.E., Goleman, D., & Hay group. (2001). The Emotional Competence Inventory
(ECI). Boston: Hay Group.
Boyatzis, R.E., & Saatcioglu, A. (2008). A 20-year view of trying to develop emotional,
social and cognitive intelligence competencies in graduate management education.
Journal of Management Development, 27(3), 92–108.
Boyatzis, R. E., & Sala, F.(2004). The emotional competence inventory (ECI), in G. Geher
(Ed.), Measuring emotional intelligence: Common ground and controversy (pp. 147–
180). New York, NY: Nova Science Publishers.
Bruch, H., & Walter, F. (2007). Leadership in context: investigating hierarchical impacts on
transformational leadership. Leadership & Organization Development Journal, 28(8),
710-726.
Bryman, A. (1992). Charisma and Leadership in Organizations, Sage, London.
Stellenbosch University https://scholar.sun.ac.za

136
Buckley, M.R., Carraher, S.M., & Cote, J.A. (1992). Measurement issues concerning the
use of inventories of job satisfaction. Educational and Psychological Measurement,
52, 529 – 543.
Burns, J.M. (1978). Leadership, Harper and Row, New York, NY.
Bycio, P., Hackett, R. D., & Allen, J. S. (1995). Further assessments of Bass’ 1985
conceptualization of transactional and transformational leadership. Journal of
Applied Psychology, 80(4), 468–478.
Byrne, J.C. (2003). The role of emotional intelligence in predicting leadership and related
work behavior. Hoboken, NJ: Stevens Institute of Technology, Technology
Management.
Cacioppe, R. (1997). Leadership moment by moment! Leadership & Organization
Development Journal, 18(7), 335–345.
Camps, J., & Rodriguez, H. (2010). Transformational leadership, learning, and
employability. Effects on performance among faculty members. Personnel Review,
40(4), 423-442.
Carless, S. A. (1998). Assessing the discriminant validity of transformational leadership
behaviour as measured by the MLQ. Journal of Occupational and Organizational
Psychology, 71, 353–358.
Carmeli, A. (2003). The relationship between emotional intelligence and work attitudes,
behaviour and outcomes. Journal of Managerial Psychology, 18(8), 788-813.
Carson, K.D., Carson, P.P., & Birkenmeier, B.J. (2000). Measuring emotional intelligence:
Development and validation of an instrument. Journal of Behavioral and Applied
Management, 2(1), 32–44.
Catano, V.M., Pond, M., & Kelloway, E.K. (2001). Exploring commitment and leadership in
volunteer organizations. Leadership & Organization Development Journal, 22(6),
256-263.
Cherniss, C. (2000, April). Emotional Intelligence: What it is and Why it Matters. Paper
presented at the Annual Meeting of the Society for Industrial and Organizational
Psychology, New Orleans, LA.
Stellenbosch University https://scholar.sun.ac.za

137
Cherniss, C. (2001). Emotional intelligence and organizational effectiveness. In C. Cherniss
& D. Goleman (Eds.), The emotionally intelligent workplace (pp. 3 – 12). San
Francisco: Jossey-Bass.
Cherniss, C., & Goleman, D. (2001). The Emotionally Intelligent Workplace, Jossey-Bass,
San Francisco, CA.
Cheung, M.F.Y., & Wong, C. (2011). Transformational leadership, leader support, and
employee creativity. Leadership & Organization Development Journal, 32(7), 656–
672.
Chin, W.W. (1998). The partial least squares approach to structural equation modelling. In
G.A. Marcoulides (Ed.), Modern Methods of Business Research (pp. 295-358).
Mahwah, NJ: Lawrence Erlbaum Associates.
Cho, J., & Dansereau, F. (2010). Are transformational leaders fair? A multi-level study of
transformational leadership, justice perceptions, and organizational citizenship
behaviors. The Leadership Quarterly, 21, 409-421.
Ciarrochi, J.V., Chan, A.Y.C., & Caputi, P. (2000). A critical evaluation of the emotional
intelligence construct. Personality and Individual Differences, 28, 539–561.
Conger, J.A., & Kanungo, R.N. (1994). Charismatic leadership in organizations: perceived
behavioural attributes and their measurement. Journal of Organizational Behavior,
15(5), 439–452.
Conger, J.A., Kanungo, R.N., & Menon, S.T. (2000). Charismatic leadership and follower
effects. Journal of Organizational Behavior, 21(7), 747–767.
Connelly, S., & Ruark, G. (2010). Leadership style and activating potential moderators of
the relationships among leader emotional displays and outcomes. The Leadership
Quarterly, 21, 745-764.
Cooper, R.R. (1997). Applying Emotional Intelligence in the Workplace. Training &
Development (December), 31–38.
Cooper, C.L., & Starbuck, W.H. (Eds.). (2005). Work and Workers. London, California &
New Delhi: SAGE Publications.
Stellenbosch University https://scholar.sun.ac.za

138
Cote, S., Lopes, P.N., Salovey, P., & Miners, C.T.H. (2010). Emotional intelligence and
leadership emergence in small groups. The Leadeship Quarterly, 21, 496-508.
Cote, S., & Miners, C. (2006). Emotional intelligence, cognitive intelligence, and job
performance. Administrative Science Quarterly, 51, 1–28.
Davies, M., Stankov, L., & Roberts, R. D. (1998). Emotional intelligence: In search of an
elusive construct. Journal of Personality and Social Psychology, 75, 989-1015.
Densten, I.L. (2002). Clarifying inspirational motivation and its relationship to extra effort.
Leadership & Organization Development Journal, 23(1), 40-44.
Derue, D.S., Nahrgang, J.D., Wellman, N., & Humphrey, S.E. (2011). Trait and Behavioral
Theories of Leadership: An Integration and Meta-Analytic test of their Relative
Validity. Personnel Psychology, 64, 7-52.
Dincer, H., Gencer, G., Orhan, N., & Sahinbas, K. (2011). The Significance of Emotional
Intelligence on the Innovative Work Behavior of Managers as Strategic Decision-
Makers. Procedia Social and Behavioral Sciences, 24, 909-919.
Downey, L.A., Papageorgiou, V., and Stough, C. (2006). Examining the relationship
between leadership, emotional intelligence and intuition in senior female managers.
Leadership & Organization Development Journal, 27(4), 250-264.
Dubinsky, A.J., Yammarino, F.J., & Jolson, M.A. (1995). An examination of linkages
between personal characteristics and dimensions of transformational leadership.
Journal of Business and Psychology, 9(3), 315-335.
Duckett, H., & Macfarlane, E. (2003). Emotional intelligence and transformational
leadership in retailing. Leadership & Organization Development Journal, 24(6), 309-
317.
Dulewicz, V., & Higgs, M. (2005). Assessing leadership styles and organisational context.
Journal of Managerial Psychology, 20(2), 105-123.
Dunham, R., Grube, J., & Castaneda, M. (1994). Organizational commitment: The utility of
an integrative definition. Journal of Applied Psychology, 79, 370-380.
Stellenbosch University https://scholar.sun.ac.za

139
Dvir, T., Eden, D., Avolio, B.J., & Shamir, B. (2002). Impact of Transformational Leadership
on Follower Development and Performance: A Field Experiment. The Academy of
Management Journal, 45(4), 735-744.
Eisenberger, R., Huntington, R., Hutchison, S., & Sowa, D. (1986). Perceived
organizational support. Journal of Applied Psychology, 71(3), 500-507.
Eisenberger, R., Stinglhamber, F., Vandenberghe, C., Sucharski, I.L., & Rhoades, L.
(2002). Perceived Supervisor Support: Contributions to Perceived Organizational
Support and Employee Retention. Journal of Applied Psychology, 87(3), 565-573.
Ekvall, G., & Arvonen, J. (1991). Change-Centred Leadership: An Extension of the Two
Dimensional Model. Scandinavian Journal of Management, 7(1), 7-26.
Emmerling, R.J., Shanwal, V.K., & Mandal, M.K. (Eds.). (2008). Emotional intelligence:
Theoretical and cultural perspectives. Nova Science Publishers, Hauppauge, NY.
Engelbrecht, A.S., van Aswegen, A.S., & Theron, C.C. (2005). The effect of ethical values
on transformational leadership and ethical climate in organisations. South African
Journal of Business Management, 36(2), 19-26.
Erkutlu, H. (2008). The impact of transformational leadership on organizational and
leadership effectiveness: The Turkish case. The Journal of Management
Development, 27(7), 708-726.
Fletcher, I., Leadbetter, P., Curran, A., & O’Sullivan, H. (2009). A pilot study assessing
emotional intelligence training and communication skills with 3rd year medical
students. Patient Education and Counseling, 76, 376-379.
Fornell, C., & Larcker, D.F. (1981). Structural equation models with observable variables
and measurement error: Algebra and statistics. Journal of Marketing Research,
18(3), 328-388.
Fitzgerald, S., & Schutte, N.S. (2010). Increasing transformational leadership through
enhancing self-efficacy. Journal of Management Development, 29(5), 495–505.
Gardner, L. (2005). Emotional intelligence and occupational stress. PhD dissertation,
Swinburne University of Technology, Melbourne, Australia.
Stellenbosch University https://scholar.sun.ac.za

140
Gardner, L., & Stough, C. (2002). Examining the relationship between leadership and
intelligence in senior level managers. Leadership & Organization Development
Journal, 23(2), 68-78.
Gentry, W.A., Kuhnert, K.W., Mondore, S.P., & Page, E.E. (2007). The influence of
supervisory-support climate and unemployment rates on part-time employee
retention. Journal of Management Development, 26(10), 1005-1022.
George, J.M. (2000). Emotions and Leadership: The Role of Emotional Intelligence. Human
Relations, 53(8), 1027 – 1055.
George, E., Louw, D., & Badenhorst, G. (2008). Job satisfaction among urban secondary-
school teachers in Namibia. South African Journal of Education, 28, 135-154.
Ghazzawi, I. (2010). Gender Role In Job Satisfaction: The Case Of The U.S. Information
Technology Professionals. Journal of Organizational Culture, Communications and
Conflict, 14(2), 1-34.
Giles, S.J.S. (2001). The role of supervisory emotional intelligence in direct report
organizational commitment. Unpublisjed master’s thesis. University of New South
Wales, Sydney, Australia.
Gill, A.S., Flaschner, A.B., & Shacar, M. (2006). Mitigating stress and burnout by
implementing transformational-leadership. International Journal of Contemporary
Hospitality Management, 18(6), 469–481.
Gill, A.S., & Mathur, N. (2007). Research In Brief. Improving employee dedication and pro-
social behaviour. . International Journal of Contemporary Hospitality
Management,19(4), 328 -334.
Glisson, C., & Durick, M. (1988). Predictors of Job Satisfaction and Organisational
Commitment in Human Service OrganisationCs. Administrative Science Quarterly,
33(1), 61-81.
Gok, S., Karatuna, I., & Karaca, P.O. (2015). The Role of Perceived Supervisor Support
and Organizational Identification in Job Satisfaction. Procedia – Social and
Behavioral Sciences, 177, 38-42.
Goleman, D. (1995). Emotional intelligence. New York: Bantam Book.
Stellenbosch University https://scholar.sun.ac.za

141
Goleman, D. (1998). Working with emotional intelligence. New York: Bantam Books.
Goleman, D. (2001). An EI-based theory of performance. In C. Cherniss & D. Goleman
(Eds.), The emotionally intelligent workplace. How to select for, measure, and
improve emotional intelligence in individuals, groups, and organizations, (pp. 27-44).
San-Francisco: Jossey-Bass.
Görgens-Ekermans, G. (2011). Developing Emotional Intelligence for increased stress
management and better psychological and physical health. Paper presented at the
First South African Positive Psychological Sciences Symposium, 14 – 15 April,
Vanderbijlpark, North West University, South Africa.
Görgens-Ekermans, G., & Brand, T. (2012). Emotional intelligence as a moderator in the
stress-burnout relationship: A questionnaire study on nurses. Journal of Clinical
Nursing, 21, 2275–2285.
Görgens-Ekermans, G., Delport, M., & du Preez, R. (2015). Developing Emotional
Intelligence as a key psychological resource reservoir for sustained student success.
SA Journal of Industrial Psychology/SA Tydskrif vir Bedryfsielkunde, 41(1), Art.
#1251, 13 pages. http://dx.doi.org/10.4102/sajip.v41i1.1251
Gowing, M.K. (2001). Measures of individual emotional competencies. In C. Cherniss & D.
Goleman (Eds.), The emotionally intelligent workplace. How to select for, measure,
and improve emotional intelligence in individuals, groups, and organizations (pp. 83-
131). San-Francisco: Jossey-Bass.
Goyal, A., & Akhilesh, K.B. (2007). Interplay among innovativeness, cognitive intelligence,
emotional intelligence and social capital of work teams. Team Performance
Management, 13(7), 206–226.
Graen, G.B., Liden, R.C., & Hoel, W. (1982). Role of leadership in the Employee
Withdrawal Process. Journal of Applied Psychology, 67(6), 868–872.
Graen, G.B., Norvak, M.A., & Sommerkamp, P. (1982). The effects of leader-member
exchange and job design on productivity and satisfaction: testing a dual attachment
model. Organizational Behavior and Human Performance, 30, 109 -131.
Stellenbosch University https://scholar.sun.ac.za

142
Groves, K.S., McEnrue, M.P., & Shen, W. (2008). Developing and measuring the emotional
intelligence of leaders. Journal of Management Development, 27(2), 225-250.
Güleryüz, G., Güney, S., Aydin, E.M., & Asan, O. (2008). The mediating effect of job
satisfaction between emotional intelligence and organisational commitment of
nurses: A questionnaire survey. International Journal of Nursing Studies, article in
Press.
Hackman, J.R., & Oldham, G.R. (1976). Motivation through the Design of Work: Test of a
Theory. Organizational Behavior and Human Performance, 16, 250-279.
Haenlein, M., & Kaplan, A. M. (2004). A beginner's guide to partial least squares analysis.
Understanding Statistics, 3(4), 283-297.
Hair, J.F., Black, W.C., Babin, B.J., & Anderson, R.E. (2010). Multivariate data analysis (7th
ed.). Upper Saddle River, NJ: Prentice Hall.
Harris, K.J., Wheeler, A.R., & Kacmar, K.M. (2009). Leader-member exchange and
empowerment: Direct and interactive effects on job satisfaction, turnover intentions,
and performance. The Leadership Quarterly, 20, 371 -382.
Hebert, E.B. (2011). The Relationship between Emotional Intelligence, Transformational
Leadership, and Effectiveness in School Principals. Dissertation, Georgia State
University.
Henseler, J., Ringle, C.M., & Sarstedt, M. (2015). A new criterion for assessing discriminant
validity in variance-based structural equation modeling. Journal of the Academy of
Marketing Science, 43 (1), 115-135.
Henseler, J., Ringle, C.M., & Sinkovics, R.R. (2009). The use of partial least squares in
international marketing. Advances in International Marketing, 20, 277-319.
Higgs, M., & Aitken, P. (2003). An exploration of the relationship between emotional
intelligence and leadership potential. Journal of Managerial Psychology, 18(8), 814-
823.
Hinkin, T.R., & Tracey, J.B. (1999). The relevance of charisma for transformational
leadership in stable organizations. Journal of Organizational Change Management,
12(2), 105-119.
Stellenbosch University https://scholar.sun.ac.za
143
Hoffman, B.J., & Frost, B.C. (2006). Multiple intelligences of transformational leaders: an
empirical examination. International Journal of Manpower, 27(1), 37-51.
Hogan, R., Curphy, G. J., & Hogan, J. (1994). What we know about leadership:
Effectiveness and personality. American Psychologist, 49, 493-504.
House, R.J., Javidan, M., Hanges, P., and Dorfman, P. (2002). “Understanding Cultures
and Implicit Leadership Theories Across the Globe: An Introduction to Project
GLOBE” Journal of World Business, 37 (1) 3-10.
House, R.J., & Shamir, B. (1993). Toward the intergration of transformational, charismatic
and visionary theories. In M.M, Chemers & R. Ayman (Eds.), Leadership Theory and
Research: Perspectives and Directions, Vol. 193 (pp. 81-107). San Diego: Academic
Press.
House, R.J. (1992). Charismatic Leadership in Service-producing Organizations.
International Journal of Service Industry Management, 3(2), 5-16.
Howell, J.M., & Avolio, B.J. (1993). Transformational Leadership, Transactional Leadership,
Locus of Control, and Support for Innovation: Key Predictors of Consolidated-
Business-Unit Performance. Journal of Applied Psychology, 78(6), 891-902.
Hur, Y., van den Berg, P.T., & Wilderom, C.P.M. (2011). Transformational leadership as a
mediator between emotional intelligence and team outcomes. The Leadership
Quarterly, 22, 591-603.
Ismail, A., Abidin, N.B.N., & Tudin, R. (2009). Relationship Between Transformational
Leadership, Empowerment and Followers’ Performance: An Empirical Study in
Malaysia. Revista Científica Electrónica Ciencias Gerenciales/Scientific e-journal of
Management Science, 13(5), 5-22.
Kaiser, R. B., Hogan, R., & Craig, S. B. (2008). Leadership and the fate of organizations.
American Psychologist, 63, 96–110.
Kalleberg, A.L. (1977). Work Values and Job Rewards: A Theory of Job Satisfaction.
American Sociological Review, 42(1), 124-143.
Keller, L.M., Bouchard, T.J., Arvey, R.D., Segal, N.L., & Dawis, R.V. (1992). Work Values:
Genetic and Environmental Influences. Journal of Applied Psychology, 77(1), 79-88.
Stellenbosch University https://scholar.sun.ac.za
144
Kerr, R., Garvin, J., Heaton, N., & Boyle, E. (2006). Emotional intelligence and leadership
effectiveness. Leadership & Organization Development Journal, 27(4), 265–279.
Kirkman, B.L., & Rosen, B. (1999). Beyond Self-Management: Antecedents and
Consequences of Team Empowerment. Academy of Management Journal, 42 (1),
58-74.
Klein, K.J., & House, R.J. (1995). On Fire: Charismatic Leadership and Levels of Analysis.
Leadership Quarterly, 6(2), 183–198.
Koc, H. (2011). The impact of managers’ leadership behaviors on job satisfaction and
performance of employees. African Journal of Business Management, 5(30), 11836-
11843.
Koman, L. & Wolff, S. (2008). Emotional intelligence competencies in the team and team
leader. Journal of Management Development, 27(1), 55 – 75.
Kotter, J.P. (1995). The New Rules. Eight Business Breakthroughs to Career Success in
the 21st Century. New York, NY: Free Press Paperbacks.
Krishan, V.R. (2004). Impact of transformational leadership on followers’ influence
strategies. The Leadership & Organization Development Journal, 25(1), 58 – 72.
Krishnan, V.R. (2005). Transformational leadership and outcomes: role of relationship
duration. Leadership & Organization Development Journal, 26(6), 442-457.
Kuoppala, J., Lamminpaa, A., Liira, J., & Vainio, H. (2008). Leadership, Job Well-being, and
Health Effects – A Systematic Review and Meta-Analysis, JOEM, 50(8), 904-915.
Landy. F.J. (2005). Some historical and scientific issues related to research on emotional
intelligence. Journal of Organizational Behavior, 26, 411 – 424.
Lam, S.S.K., Chen, X.P., & Schaubroeck, J. (2002). Participative Decision Making and
Employee Performance in Different Cultures. The Moderating Effects of
Allocentrism/Idiocentrism and Efficacy. Academy of Management Journal, 45(5),
905-914.
Stellenbosch University https://scholar.sun.ac.za

145
Leban, W., & Zulauf, C. (2004). Linking emotional intelligence abilities and transformational
leadership styles. The Leadership & Organization Development Journal , 25(7), 554-
564.
Leslie, J.B. (Ed.). (2013). Feedback to Managers: A Guide to Reviewing and Selecting
Multirater Instruments for Leadership Development, 4th Edition, Center for Creative
Leadership.
Li, C., & Hung, C. (2009). The Influence of Transformational Leadership on Workplace
Relationships and Job Performance. Social Behavior and Personality, 37(8), 1129-
1142.
Limsila, K., & Ogunlana, S.O. (2008). Performance and leadership outcome correlates of
leadership styles and subordinate commitment. Engineering, Construction and
Architectural Management, 15(2), 164-184.
Locke, E.A. (1969). What is Job Satisfaction?. Organizational Behavior and Human
Performance, 4, 309-336.
Lok, P., & Crawford, J. (2004) The effect of organisational culture and leadership style on
job satisfaction and organisational commitment. Journal of Management
Development, 23, 321-338.
Lowe, K.B., Kroeck, K.G., & Sivasubramaniam, N. (1996). Effectiveness correlates of
transformational and transactional leadership: A meta-analytic review of the MLQ
literature. Leadership Quarterly, 7, 385–425.
Maertz, C.P.,Jr., Griffeth, R.W., Campbell, N.S., & Allen, D.G. (2007). The effects of
perceived organizational support and perceived supervisor support on employee
turnover. Journal of Organizational Behavior, 28(8), 1059-1075.
Mandell, B., & Pherwani, S. (2003). Relationship between emotional intelligence and
transformational leadership style: A gender comparison. Journal of Business and
Psychology, 17(3), 387-404.
Mardanov, I.T., Heischmidt, K., & Henson, A. (2008). Leader-Member Exchange and Job
Satisfaction Bond and Predicted Employee Turnover. Journal of Leadership &
Organizational Studies, 15(2), 159-175.
Stellenbosch University https://scholar.sun.ac.za

146
Martin, A., & Ernst, C. (2005). Leadership, learning and human resource management.
Exploring leadership in times of paradox and complexity. Corpoate Governance,
5(3), 82-94.
Mast, M.S., Jonas, K., Cronauer, C.K., & Darioly, A. (2011). On the Importance of the
Superior’s Interpersonal Sensitivity for Good Leadership. Journal of Applied Social
Psychology, 1-26.
Mastrangelo, A., Eddy, E.R., & Lorenzet, S.J. (2004). The importance of personal and
professional leadership. The Leadership & Organisation Development Journal, 25,
435-451.
Mayer, J.D., Caruso, D.R., & Salovey, P. (1999). Emotional intelligence meets traditional
standards for an intelligence. Intelligence, 27, 267–298.
Mayer, J.D., Roberts, R.D., & Barsade, S.G. (2008). Human Abilities: Emotional
Intelligence. Annual Review of Psychology, 59, 507-536.
Mayer, J.D., & Salovey, P. (1997). What is emotional intelligence? In P. Salovey & D.
Sluyter (Eds.), Emotional development and emotional intelligence: Implications for
educators (pp. 3 – 31) New York: Basic Books.
Mayer, J. D., Salovey, P., & Caruso, D. R. (2002). Mayer–Salovey–Caruso Emotional
Intelligence Test (MSCEIT) item booklet. Toronto, Ontario, Canada: MHS Publishers.
Mayer, J.D., Salovey, P., & Caruso, D.R. (2004). Emotional Intelligence: Theory, Findings,
and Implications. Psychological Inquiry, 15(3), 197 – 215.
Mc Carthy, J.F. (2008). Short Stories at Work: Storytelling as an Indicator of Orgnizational
Commitment. Group & Orgnization Management, 33(2), 163 – 193.
McColl-Kennedy, J. R., & Anderson, R. D. (2002). Impact of leadership style and emotions
on subordinate performance. Leadership Quarterly, 13, 545–559.
McEnrue, M.P., Groves, K.S., Shen, W. (2009). Emotional intelligence development:
leveraging individual characteristics. Journal of Management Development, 28(2),
150–174.
Stellenbosch University https://scholar.sun.ac.za

147
Meyer, J.P., & Allen, N.J. (1991). A three-component conceptualization of organizational
commitment. Human Resource Management Review, 1(1), 61-89.
Meyer, J.P., & Allen, N.J. (1997). Commitment in the workplace. Theory, Research, and
Application. Thousand Oaks, CA: Sage Publications, Inc.
Miles, S.F., & Mangold, G. (2002). The impact of team leader performance on team
member satisfaction: the subordinate’s perspective. Team Performance
Management: An International Journal, 8(5/6), 113-121.
Modassir, A., & Singh, T. (2008). Relationship of Emotional Intelligence with
Transformational Leadeship and Organizational Citizenship Behavior. International
Journal of Leadership Studies, 4(1), 3-21.
Mohamadali, N. A. K., (2012). Exploring New Factors and the Question of ‘Which’ in User
Acceptance Studies of Healthcare Software. Doctor of Philosophy, University of
Nottingham, Nottingham.
Moshavi, D., Brown, F.W., & Dodd, N.G. (2003). Leader self-awareness and its relationship
to subordinate attitudes and performance. Leadership & Organization Development
Journal, 24(7), 407-418.
Mowday, R.T., Porter, L.W., & Steers, R.M. (1982). Employee-organization linkages. New
York: Academic Press.
Munir, R.I.S., Rahman, R.A., Malik, A.M.A., & Ma’amor, H. (2012). Relationship between
Transformational Leadership and Employees’ Job Satisfaction among the Academic
Staff. Procedia - Social and Behavioral Sciences, 65, 885-890.
Murry, D.M., Sivasubramaniam, N., & Jacques, P.H. (2001). Supervisory support, social
exchange relationships, and sexual harassment consequences. A test of competing
models. The Leadership Quarterly, 12, 1–29.
Naznin, H. (2013). Correlation between Emotional Intelligence and Transformational
Leadership Behaviour. IOSR Journal of Business and Management, 13(2), 64-67.
Nelis, D., Quoidbach, J., Mikolajczak, M., & Hansenne, M. (2009). Increasing emotional
intelligence: (How) is it possible? Personality and Individual Differences, 47, 36-41.
Stellenbosch University https://scholar.sun.ac.za
148
Nemanich, L.A., & Keller, R.T. (2007). Transformational leadership in an acquisition: A field
study of employees. The Leadership Quarterly, 18, 49-68.
Nicholsan, N., Audia, P.G., & Pillutla, M.M. (Eds.), (2005). The Blackwell Encyclopedia Of
Management (2nd ed.). UK: Blackwell Publishing.
Nielsen, K., Yarker, J., Randall. R., & Munir, F. (2009). The mediating effects of team and
self-efficacy on the relationship between transformational leadership, and job
satisfaction and psychological well-being in healthcare professionals: A cross-
sectional questionnaire survey. International Journal of Nursing Studies, 46, 1236–
1244.
Nourollahi, H., Nikbakhsh, R., & Esmaeili, M.R. (2011). The Relationship between
Emotional Intelligence and Transformational Leadership of Female Coaches on
Golestan Province. Researcher in Sport Science Quarterly, 2(1), 31-38.
Nunnally, J.C., & Bernstein, I.H. (1994). Psychometric Theory (3rd ed.), New York: McGraw-
Hill.
Oginska-Bulik, N. (2005). Emotional Intelligence In The WorkplaceL Exploring Its Effects
On Occupational Stress And Health Outcomes In Human Service Workers.
International Journal of Occupational Medicine and Environmental Health, 18(2), 167
– 175.
Olmstead, J.A. (2000). Executive leadership: building world class organizations. Houston,
Tex : Cashman Dudley.
Palmer, B.R., Gardner, L., & Stough, C. ( 2003). The relationship between emotional
intelligence, personality and effective leadership.Paper presented at 5th Australian
Industrial and Organizational Psychology Conference, Melbourne.
Palmer, B., & Stough, C. (2001). SUEIT Interim Technical Manual (Version 2). Swinburne
University: Swinburne Organisational Psychology Unit.
Palmer, B., Walls, M., Burgess, Z., & Stough, C. (2001). Emotional intelligence and
effective leadership. Leadership & Organization Development Journal, 22(1), 5 – 10.
Stellenbosch University https://scholar.sun.ac.za
149
Pazy, A., & Ganzach, Y. (2009). Pay Contingency and the Effects of Perceived
Organizational and Supervisor Support on Performance and Commitment. Journal of
Management, 35(4), 1007-1025.
Piccolo, R.F., & Colquitt, J.A. (2006). Transformational Leadership and Job Behaviors: the
Mediating Role of Core Job Characteristics. Academy of Management Journal,
49(2), 327 – 340.
Pillai, R., Schriesheim, C.A., & Williams, E.S. (1999). Fairness Perceptions and Trust as
Mediators for Transformational and Transactional Leadership: A Two-Sample Study.
Journal of Management, 25(6), 897-933.
Pillai, R., & Williams, E.A. (2004). Transformational leadership, self-efficacy, group
cohesiveness, commitment, and performance. Journal of Organizational Change
Management, 17(2), 144 – 159.
Podsakoff, P.M., Mackenzie, S.B., & Bommer, W.H. (1996). Transformational leadership
behaviors and substitutes for leadership as determinants of employee satisfaction,
commitment, trust, and organizational citizenship behaviors. Journal of Management,
22, 259 -298.
Podsakoff, P. M., Mackenzie, S. B., Moorman, R. H., & Fetter, R. (1990). Transformational
leader behaviors and their effects on followers' trust in leader, satisfaction, and
organizational citizenship behaviors. Leadership Quarterly, 1, 107–142.
Polychroniou, P.V. (2009). Relationship between emotional intelligence and
transformational leadership of supervisors. The impact on team effectiveness. Team
Performance Management, 15(7/8), 343-356.
Pool. S., & Pool, B. (2007). A Management development model. Measuring organizational
commitment and its impact on job satisfaction among executives in a learning
organization. Journal of Management Development, 26(4), 353-369.
Popper. M., & Zakkai, E. (1994). Transactional, Charismatic and Transformational
Leadership: Conditions Conducive to their Predominance. Leadership &
Organization Development Journal, 15(6), 3-7.
Stellenbosch University https://scholar.sun.ac.za

150
Rahim, A., & Psenicka, C. (2002). A model of emotional intelligence and conflict
management strategies. A study in seven countries. The International Journal of
Organizational Analysis, 10(4), 302 – 326.
Rahim, M.A., & Minors, P. (2003). Effects of emotional intelligence on concern for quality
and problem solving. Managerial Auditing Journal, 18(2), 150-155.
Rahim, S.H. (2010). Emotional Intelligence and Stress: An Analytical Study of Pakistan
Banks. International Journal of Trade, Economics and Finance, 1(2), 194-199.
Rahman, M., Ferdausy, S., & Uddin, M. (2012). Examining the relationships between
emotional intelligence and the components of transformational leadership. The
ABAC Journal, 32(1), 45-59.
Roberts, R. D., Zeidner, M., & Matthews, G. (2001). Does emotional intelligence meet
traditional standards for an intelligence? Some new data and conclusions. Emotion,
1, 196-231
Rocha, C., & Chelladurai, P. (2008). Perceived organizational support and employee
performance: The mediating role of organizational commitment and organizational
citizenship behavior. North American Society for Sport Management Conference
(NASSM 2008). 231-232.
Rode, J.C., Mooney, C.H., Arthaud-Day, M.L., Near, J.P., Baldwin, T.T., Rubin, R.R., &
Bommer, W.H. (2007). Emotional intelligence and individual performance: Evidence
of direct and moderated effects. Journal of Organizational Behavior, 28, 399 – 421.
Rosete, D., & Ciarrochi, J. (2005). Emotional intelligence and its relationship to workplace
performance outcomes of leadership effectiveness. Leadership & Organization
Development Journal, 26(5), 388-399.
Salovey, P., & Grewal, D. (2005). The Science of Emotional Intelligence. Current
Directions in Psychological Science, 14(6), 281 – 285.
Salovey, P., & Mayer, J.D. (1990). Emotional Intelligence. Imagination, Cognition and
Personality, 9(3), 185 – 211.
Sarros, J.C., & Santora, J,C. (2001). The transformational-transactional leadership model in
practice. Leadership & Organization Development Journal, 22(8), 383-393.
Stellenbosch University https://scholar.sun.ac.za
151
Sayeed, O. B., & Shanker, M. (2009). Emotionally intelligent managers and
transformational leadership styles.. Indian Journal of Industrial Relations, 44(4), 593-
610.
Schutte, N.S., Malouff, J.M., Hall, L.E., Haggerty, D.J., Cooper, J.T., Golden, C.J., &
Dornheim, L. (1998). Development and validation of a measure of emotional
intelligence. Personality and Individual Differences, 25, 167 -177.
Schutte, N.S, Malouff, J.M., & Thorsteinsson, E.B. (2013). Increasing Emotional Intelligence
through Training: Current Status and Future Directions. The International Journal of
Emotional Education, 5(1), 56-72.
Shi, Y., Olson, D.L. & Stam, A. (2007) Advances in Multiple Criteria Decision Making and
Human Systems Management: Knowledge and Wisdom, IOS Press, Amsterdam.
Sivanathan, N., & Fekken, G.C. (2002). Emotional intelligence, moral reasoning and
transformational leadership. Leadership and Organization Development Journal, 23,
198–204.
Slaski, M., & Cartwright, S. (2002). Health, performance and emotional intelligence: an
exploratory study of retail managers. Stress and Health, 18, 63 – 68.
Slaski, M., & Cartwright, S. (2003). Emotional intelligence training and its implications for
stress, health and performance. Stress and Health, 19, 233-239.
Smith, P.C., Kendall, L.M., & Hullin, C.L. (1969). The measurement of Satisfaction in Work
and Retirement. Chicago: Rand McNally.
Sosik, T.J., & Megerian, L.E. (1999). Understanding Leader Emotional Intelligence and
Performance: The Role of Self-Other Agreement on Transformational Leadership
Perceptions. Group & Organization Management, 24(3), 367 – 390.
Spector, P.E. (1997). Job Satisfaction: Application, Assessment. Causes and
Consequences. USA: SAGE Publications, Inc.
Spielberger, C. (Ed.). (2004). Encyclopedia of Applied Psychology, Oxford, Boston:
Elsevier Academic Press.
Stellenbosch University https://scholar.sun.ac.za

152
Spreitzer, G. M. (1995). Psychological empowerment in the workplace: dimensions,
measurement and validation. Academy of Management Journal, 38, 1442–1465.
Staniforth, D., & West, M. (1995). Leading and managing teams. Team Performance
Management, 1(2), 28 – 33.
StatSoft, Inc. (2012). STATISTICA (data analysis software system), version 11. Retrieved
from www.statsoft.com.
Storey, J. (Ed.). (2004). Leadership in organizations : current issues and key trends.
London: Routledge.
Straub D., Boudreau M. C., & Gefen D. (2004) Validation Guidelines for IS Positivist
Research. Communication of the Association for Information Systems, 14, 380–426.
Sy, T., Tram, S., & O’Hara, L.A. (2006). Relation of employee and manager emotional
intelligence to job satisfaction and performance. Journal of Vocational Behaviour, 68,
461-473.
Thorndike, E.L. (1920). Intelligence and its uses. Harper’s Magazine, 140, 227 – 235.
Urbach, N., and Ahlemann F. (2010). Structural Equation Modeling in Information Systems
Research Using Partial Least Squares. Journal of Information Technology Theory
and Application, 11(2), 5 - 40.
Vandenberghe, C., Stordeur, S., & D’hoore, W. (2002). Transactional and Transformational
Leadership in Nursing: Structural Validity and Substantive Relationships. European
Journal of Psychological Assessment, 18(1), 16-29.
Van Rooy, D.L., & Viswesvaran, C. (2004). Emotional Intelligence: A meta-analystic
investigation of predictive validity and nomological net. Journal of Vocational
Behavior, 65(1), 71-95.
Van Saane, N., Sluiter, J.K., Verbeek, J.H.A.M., & Frings-Dresen, M.H.W. (2003). Reliability
and validity of instruments measuring job satisfaction – a systematic review.
Occupational medicine, 53(3), 191-200.
Vera, D., & Crossan, M. (2004). Strategic Leadership and Organizational Learning.
Academy of Management Journal, 29(2), 222 – 240.
Stellenbosch University https://scholar.sun.ac.za

153
Wang, H., Law, K. S., Hackett, R., Wang, D. X., & Chen, Z. X. (2005). Leader-member
exchange as a mediator of the relationship between transformational leadership and
followers’ performance and organizational citizenship behavior. Academy of
Management Journal, 48(3), 420 – 432.
Wang, Y.S., & Huang, T.C. (2009). The relationship of transformational leadership with
group cohesiveness and emotional intelligence. Social Behavior and Personality, 37,
379-392.
Wayne, S.J., Shore, L.M., & Liden, R.C. (1997). Perceived organizational support and
leader-member exchange: A social exchange perspective. Academy of Management
Journal, 40(1), 82-111.
Wells. J.E., & Peachy, J.W. (2011). Turnover Intentions. Do leadership behaviors and
satisfaction with the leader matter? Team Performance Management, 17(1/2), 23-40.
Wexley, K.N., & Yukl, G.A. (1984). Organizational Behavior and Personnel Psychology.
United States of America: Richard D.Irwin, Inc.
Whittington, J.L., Goodwin, V.L., & Murray, B. (2004). Transformational leadership, goal
difficulty, and job design: Independent and interactive effects on employee
outcomes. The Leadership Quarterly, 15, 593-606.
Wolff, S.B. (2006). Emotional Competence Inventory (ECI), Technical Manual, Hay Group,
McClelland Center for Research and Innovation, Boston, MA.
Woo, B., & Chelladurai, P. (2012). Dynamics of perceived support and work attitudes: The
case of fitness club employees. Human Resource Management Review, 2 (1), 6-18.
Yeo, R.K. (2006). Developing tomorrow's leaders: why their worldviews of today matter?
Industrial and Commercial Training, 38(2), 63 – 69.
Yoon, M.H., Seo, F.H., & Yoon, T.S. (2004). Effects of contact employee supports on
critical employee responses and customer service evaluation. Journal of Services
Marketing, 18(5), 395-412.
Yousef, D.A. (2000). Organizational commitment: a mediator of the relationships of
leadership behaviour with job satisfaction and performance in a non-western country.
Journal of Managerial Psychology, 15(1), 6-28.
Stellenbosch University https://scholar.sun.ac.za

154
Zeidner, M., Matthews, G. ,& Roberts, R.D. (2004). Emotional Intelligence in the Workplace:
A Critical Review. Applied Psychology: An International Review, 53(3), 371 – 399.
Zopiatis, A., & Constanti, P. (2010). Leadership styles and burnout: is there an association?
International Journal of Contemporary Hospitality Management, 22(3), 300 – 320.
Stellenbosch University https://scholar.sun.ac.za

155
APPENDIX ONE: CONSENT FORM
ORGANISATIONAL CONSENT FORM
Hereby I, _____________________ (Name and Surname) give Chené Roux (Master’s
student at the University of Stellenbosch) permission to distribute questionnaires comprising
the relevant measures for the purpose of generating data for her master’s thesis (Modification,
Elaboration and Empirical Evaluation of the Beyers’ Emotional Intelligence and
Transformational Leadership Model) within ___________________(Name of organization).
The purpose of the study has been explained as well as the manner in which the data
generated will be used.
A coding system will be used to ensure the anonymity of the participants.
Managers/Supervisors/Team leaders will be rating themselves with informed consent on the
following constructs:
• Emotional Intelligence
• Transformational Leadership
Managers will also be informed that they will be rated by their subordinates on their emotional
intelligence and transformational leadership behaviours.
Subordinates will be rating the managers/supervisors/team leaders on:
• Emotional Intelligence
• Transformational Leadership
Subordinates will also be rating themselves with regard to:
• Job satisfaction
• Organizational Commitment
• Perceived Supervisor Support
Stellenbosch University https://scholar.sun.ac.za

156
Signed (please print name and sign): _______________________________________
Position in the participating organisation:____________________________________
Date: __________________________
Stellenbosch University https://scholar.sun.ac.za

157
APPENDIX TWO: SUBORDINATES INFORMED CONSENT FORM
STELLENBOSCH UNIVERSITY
CONSENT TO PARTICIPATE IN RESEARCH: SUBORDINATES
MODIFICATION, ELABORATION AND EMPIRICAL EVALUATION OF THE BEYER’S EMOTIONAL
INTELLIGENCE AND TRANSFORMATION LEADERSHIP MODEL
You are asked to participate in a research study conducted by Miss Chené Roux, from the Industrial
Psychology Department at Stellenbosch University. The results obtained will contribute to the
completion of a Masters of Commerce degree in Human Resource Management. The results of this
study will contribute to the completion of the thesis component of this postgraduate programme. You
were selected as a possible participant in this study because you are a subordinate in an organisation
who can give a valuable input to the data gathering process of this study.
1. PURPOSE OF THE STUDY
Research has confirmed the vital role of leadership in organizations. Leaders’ behaviour affects
employees’ attitudes and performance, and therefore also organizational success. It is therefore
critical to identify factors that contribute to leadership effectiveness. It has been argued that leaders
with a higher level of Emotional Intelligence are more effective. In this light, the present study will
therefore analyse the effect of emotional intelligence of the effectiveness of leaders by assessing the
perceived supervisory support of subordinates, as well as their levels of job satisfaction and
organizational commitment.
2. PROCEDURE
If you volunteer to participate in this study, you will be asked to evaluate yourself and the behaviours
of your supervisor / manger by means of filling out a questionnaire. There are no right or wrong
responses; we are merely interested in your personal opinions. The completion of the questionnaires
will take place at a time and location that is convenient to you and the researcher and would require
approximately 35 - 40 minutes of your time.
Stellenbosch University https://scholar.sun.ac.za

158
3. POTENTIAL RISKS AND DISCOMFORTS
Given that you as a subordinate will rate your own perceived supervisory support, job satisfaction and
organisational commitment, as well as the behaviours of your manager / supervisor (emotional
intelligence and leadership) there is a slight risk of discomfort for you due to the knowledge that you
are rating your supervisor / manager. Furthermore, your satisfaction with your manager / supervisor
may be implicitly reflected in your rating of your manager / supervisor. However, please note that
these ratings will be completely confidential and anonymous (a coding system will be used to protect
your identity) and no information will be shared with any decision makers in the participating
company. The data will only the utilised for research purposes and will not in any way inform any
performance management decisions related to yourself or your manager / supervisor.
4. POTENTIAL BENEFITS TO SUBJECTS AND/OR TO SOCIETY
Participation in this study has no direct benefit to the individual participant. Feedback on the results of
the survey will be provided to the organisations in aggregated form, which participated in this study.
The results can show whether the need exists to develop interventions and training programmes in
terms of these constructs. It may prove to be beneficial in terms of the recruitment and retention of
effective employees, as well as serve as a basis for developing leaders.
5. PAYMENT FOR PARTICIPATION
No payment will be made to participants for taking part in this study.
6. CONFIDENTIALITY
Any information that is obtained in connection with this study and that can be identified with you will
remain confidential and will be disclosed only with your permission or as required by law.
Confidentiality will be maintained by means of a coding procedure. The results of this study will be
published in the form of a completed dissertation as well as in an accredited journal, but confidentiality
will be maintained. Participant’s names will not be published.
7. PARTICIPATION AND WITHDRAWAL
You can choose whether to be in this study or not. If you volunteer to be in this study, you may
withdraw at any time without consequences of any kind. You may also refuse to answer any
questions you don’t want to answer and still remain in the study. The investigator may withdraw you
from this research if circumstances arise which warrant doing so.
8. IDENTIFICATION OF INVESTIGATORS
If you have any questions or concerns about the research, please feel free to contact Chené Roux
([email protected] / 071 854 0800) or Dr G Görgens ([email protected] / 021 808 3596).
Stellenbosch University https://scholar.sun.ac.za

159
9. RIGHTS OF RESEARCH SUBJECTS
You may withdraw your consent at any time and discontinue participation without penalty. You are
not waiving any legal claims, rights or remedies because of your participation in this research study.
If you have questions regarding your rights as a research subject, contact Ms Maléne Fouché
[[email protected]; 021 808 4622] at the Division for Research Development, Stellenbosch
University.
CONSENT FORM (please tick the appropriate box):
I hereby consent to voluntarily participate in this study. I agree that my data may
be integrated into a summary of the results of all the questionnaires without
identifying me personally.
I don’t want to participate in this study.
quot
Stellenbosch University https://scholar.sun.ac.za

160
APPENDIX THREE: SUPERVISORS INFORMED CONSENT FORM
STELLENBOSCH UNIVERSITY
CONSENT TO PARTICIPATE IN RESEARCH: MANAGERS / SUPERVISORS
MODIFICATION, ELABORATION AND EMPIRICAL EVALUATION OF THE BEYER’S EMOTIONAL
INTELLIGENCE AND TRANSFORMATION LEADERSHIP MODEL
You are asked to participate in a research study conducted by Miss Chené Roux, from the Industrial
Psychology Department at Stellenbosch University. The results obtained will contribute to the
completion of a Masters of Commerce degree in Human Resource Management. The results of this
study will contribute to the completion of the thesis component of this postgraduate programme. You
were selected as a possible participant in this study because you are a manager / supervisor in an
organisation who can give a valuable input to the data gathering process of this study.
1. PURPOSE OF THE STUDY
Research has confirmed the vital role of leadership in organizations. Leaders’ behaviour affects
employees’ attitudes and performance, and therefore also organizational success. It is therefore
critical to identify factors that contribute to leadership effectiveness. It has been argued that leaders
with a higher level of Emotional Intelligence are more effective. In this light, the present study will
therefore analyse the effect of emotional intelligence on the effectiveness of leaders by assessing the
perceived supervisory support of subordinates, as well as their levels of job satisfaction and
organizational commitment.
2. PROCEDURE
If you volunteer to participate in this study, you will be asked to evaluate yourself by means of filling
out a questionnaire measuring your transformational leadership and emotional intelligence
behaviours. There are no right or wrong responses; we are merely interested in your personal
opinions. The completion of the questionnaires will take place at a time and location that is convenient
to you and the researcher and would require approximately 20 minutes of your time.
Stellenbosch University https://scholar.sun.ac.za
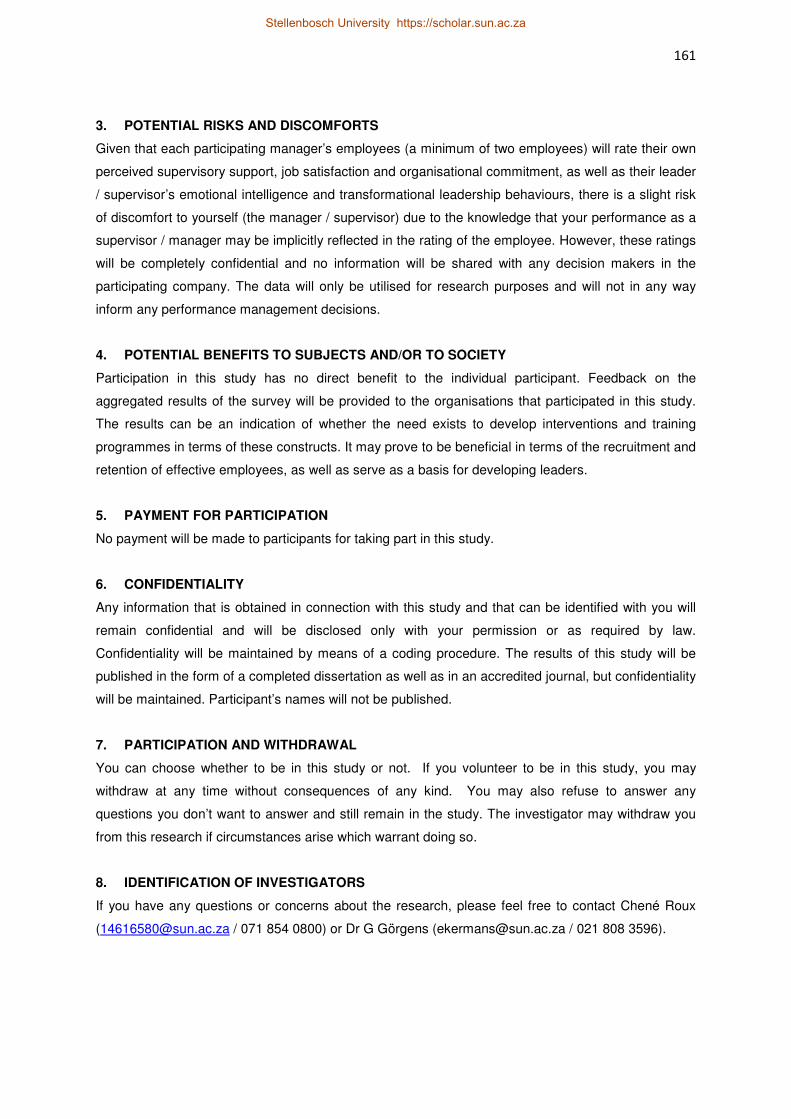
161
3. POTENTIAL RISKS AND DISCOMFORTS
Given that each participating manager’s employees (a minimum of two employees) will rate their own
perceived supervisory support, job satisfaction and organisational commitment, as well as their leader
/ supervisor’s emotional intelligence and transformational leadership behaviours, there is a slight risk
of discomfort to yourself (the manager / supervisor) due to the knowledge that your performance as a
supervisor / manager may be implicitly reflected in the rating of the employee. However, these ratings
will be completely confidential and no information will be shared with any decision makers in the
participating company. The data will only be utilised for research purposes and will not in any way
inform any performance management decisions.
4. POTENTIAL BENEFITS TO SUBJECTS AND/OR TO SOCIETY
Participation in this study has no direct benefit to the individual participant. Feedback on the
aggregated results of the survey will be provided to the organisations that participated in this study.
The results can be an indication of whether the need exists to develop interventions and training
programmes in terms of these constructs. It may prove to be beneficial in terms of the recruitment and
retention of effective employees, as well as serve as a basis for developing leaders.
5. PAYMENT FOR PARTICIPATION
No payment will be made to participants for taking part in this study.
6. CONFIDENTIALITY
Any information that is obtained in connection with this study and that can be identified with you will
remain confidential and will be disclosed only with your permission or as required by law.
Confidentiality will be maintained by means of a coding procedure. The results of this study will be
published in the form of a completed dissertation as well as in an accredited journal, but confidentiality
will be maintained. Participant’s names will not be published.
7. PARTICIPATION AND WITHDRAWAL
You can choose whether to be in this study or not. If you volunteer to be in this study, you may
withdraw at any time without consequences of any kind. You may also refuse to answer any
questions you don’t want to answer and still remain in the study. The investigator may withdraw you
from this research if circumstances arise which warrant doing so.
8. IDENTIFICATION OF INVESTIGATORS
If you have any questions or concerns about the research, please feel free to contact Chené Roux
([email protected] / 071 854 0800) or Dr G Görgens ([email protected] / 021 808 3596).
Stellenbosch University https://scholar.sun.ac.za

162
9. RIGHTS OF RESEARCH SUBJECTS
You may withdraw your consent at any time and discontinue participation without penalty. You are
not waiving any legal claims, rights or remedies because of your participation in this research study.
If you have questions regarding your rights as a research subject, contact Ms Maléne Fouché
[[email protected]; 021 808 4622] at the Division for Research Development, Stellenbosch
University.
CONSENT FORM (please tick the appropriate box):
I hereby consent to voluntarily participate in this study. I agree that my data may
be integrated into a summary of the results of all the questionnaires without
identifying me personally.
I don’t want to participate in this study.
quot
Stellenbosch University https://scholar.sun.ac.za