development and ecological importance of …perso.fundp.ac.be/~jpdescy/descy, gosselain,...
TRANSCRIPT

Hydrohiologia 289: 139-155. 1994.J.-P. Descy, C. S. Reynolds & J. Padisdk (eds), Phytoplankton in Turbid Environments: Rivers and Shallow Lakes.
1994. Kluwer Academic Publishers. Printed in Belgium139
Development and ecological importance of phytoplankton in a large lowlandriver (River Meuse, Belgium)
Jean-Pierre Descy & Vronique GosselainUnit6 d'Ecologie des Eaux Douces, D6partement de Biologie, FUNDP, rue de Bruxelles 61, B-5000, Namur,Belgique
Key words: potamoplankton, regulated river, transport of carbon and nutrients, photosynthesis, respiration, dynam-ics
Abstract
The ecological importance of the River Meuse phytoplankton with regard to carbon and nutrient transport has beenexamined in two reaches of the Belgian course of the river.
Field measurements of total particulate organic carbon (POC), particulate organic nitrogen (PON) and particulatephosphorus (PP) show that the large autochtonous production of organic matter strongly affects the carbon andnutrient budget of the aquatic system. During the growing season, phytoplankton accounts for nearly 60% of thePOC and dominates the PON. Calculations of the carbon and oxygen budget in the upper reach of the BelgianMeuse demonstrates that the ecosystem is autotrophic, i.e. that autochtonous FPOM (fine particulate organicmatter) production is the major carbon input. This suggests that in large lowland rivers, primary production (P)may exceed community respiration (R), i.e. P:R> 1, whereas they are assumed to be heterotrophic (P:R< 1) in theRiver Continuum concept.
The question of maintenance of phytoplankton in turbid mixed water columns is also addressed, and the caseof the River Meuse is treated on the basis of studies of photosynthesis and respiration (ETS measurements). Theresults suggest that the potamoplankton may show some low-light acclimation, through an increase of chlorophyll arelative to biomass, when it comes to deep downstream reaches, and that algal respiration rate may be reduced.A simulation of the longitudinal development of the algal biomass shows the different phases of algal growthand decline along the river and brings support to the 'importation hypothesis' for explaining maintenance ofpotamoplankton in the downstream reaches.
Introduction
When considering phytoplankton dynamics in largelowland rivers, aspects other than specific compositionand the factors involved in longitudinal and temporalcommunity changes must be acknowledged. One ofthese aspects pertains to the effect of the potamoplank-ton development on the carbon and nutrient budget ofthe aquatic ecosystem. In this respect, the term 'largelowland river', which is commonly used for rivers ofquite different size, might be properly defined accord-ing to the River Continuum concept (Vannote et al.,1980) and related considerations (Wetzel, 1983). A'large river' may then be defined as a flowing water
body transporting a large amount of FPOM (fine partic-ulate organic matter), which may include a significantcontribution of autochtonous organic material pro-duced by a well-developed phytoplankton. However,according to this theory (Vannote, 1981), large rivers(of order 9 to 12) are characterised by a tendency to bedominated by heterotrophic processes (R), as the pri-mary production (P) becomes limited by reduced lightpenetration and/or increased water depth. Converse-ly, autotrophy (P/R>1) is supposed to be attained inmid-river reaches (order 3-6, see Billen et al., this vol-ume) dominated by benthic primary producers. Nev-ertheless, when looking more closely at the carbonbudget of large river ecosystems, a phytoplankton-
140
dominated river may be predominantly autotrophic,exporting new, autochtonous organic matter. This hasbeen well shown in eutrophied rivers, either by in situmeasurements (e.g. R. Rhine, Admiraal et al., 1992),or by modelling the balance of carbon fluxes in par-ticular reaches (e.g. R. Meuse, Descy et al., 1987,and below). We present thereafter a dataset containingmeasurements of C, N and P forms in the River Meuse,which tends to confirm the profound changes broughtabout by the phytoplankton development in a lowlandriver ecosystem. These data also allow us to verifythe carbon to chlorophyll ratio often used in primaryproduction models, as well as to approach the nutrientstatus of the potamoplankton through sestonic C:N andC:P ratios.
Another question to be addressed, and one whichis closely connected to the autotrophic production ofFPOM, is directly related to the development of phyto-plankton in a turbid water column undergoing a relent-less turbulent mixing. The problem, already discussedby other authors (e.g. Cole et al., 1991, 1992; Loehr,1987) is 'how to explain the maintenance of a pota-moplankton despite low water transparency and deepmixing ?'. As a matter of fact, if mixing occurs belowthe critical depth (Kirk, 1983), the plankton algae cir-culating in the mixed layer should experience negativenet production rates. A first hypothesis, as stated byCole et al. (1991), explains potamoplankton devel-opment in large rivers and estuaries by physiologi-cal adaptation, i.e. low light acclimation of the algae.A variant, which would account for algal growth inmixed turbid systems without any change in the photo-synthetic efficiency, invokes enhanced photosynthesisof the plankton algae, as they are repeatedly movedin a strong gradient of light, i.e. up from darknessto full subsurface irradiance and down back to lowerlight. However, evidence for strongly increased photo-synthetic rates arises from mathematical calculations(Loehr, 1987; Imboden, 1992) and from field mea-surements, which however yielded variable results inseveral cases (see e.g. Dokulil, this volume). Contra-dictory results may be explained by the difficulty tofind the right experimental design: moving bottles upand down, even by a seemingly elaborated system (i.e.Mallin & Paerl, 1992), may neither reproduce the rightfrequency of vertical entrainment in turbulent eddies(see Reynolds, this volume), nor the complexity of acell's movement in the mixed layer, which entails dis-continuous fluctuations of the light experienced by thephytoplankton (MacIntyre, 1993). Furthermore, theresult of a fluctuating light field in terms of algal pro-
duction could also depend of the extent of the euphoticzone, as the probability of depressed photosynthesisby photoinhibition is greater in a well-lit water col-umn (Gallegos & Platt, 1982) than in a turbid one. Ofcourse, the observed response of the algal communitydepends upon its photoacclimation too.
Other hypotheses put forward to account for thepresence and growth of phytoplankton in the down-stream reaches of a large river are: (i) reduced lossrates, i.e. grazing and sedimentation, and (ii) importa-tion of the biomass from upstream productive reaches.As shown below, some support to the latter idea can beobtained from simulations of the longitudinal develop-ment of the potamoplankton, based on a mathematicalmodel previously designed for the River Meuse (Descyetal., 1987; Descy, 1992).
In addition, we attempt to test the adaptation oracclimation hypothesis by reference to some studiescarried out in the river Meuse during the period 1987-1992. They deal with algal photosynthesis and res-piration, the latter being based on measurements ofthe activity of the respiratory electron transfer sys-tem (ETS; Devol & Packard, 1978; Rai, 1984, 1988).Indeed, algal respiration is a key physiological pro-cess in algal growth, yet it has been seldom directlymeasured in natural samples. If some estimates maybe derived from cultures, usually by measurementsof oxygen consumption by axenic algal strains, therange of values is quite large, varying with the taxaand the physiological state of the cells, and can hardlybe extrapolated to simulations of natural communities.For example, the ratio between the respiration rateper unit chlorophyll a (rchla) and the photosyntheticcapacity (P,,t), varies in the literature between 0.05and 0.5 (Pourriot et al., 1982) or between 0.04 and0.15 in healthy growing cells (Daneri etal., 1992), andit may even reach 0.67 under extreme nutrient lim-itation (Reynolds et al., 1985). As a result, insteadof being determined from measurements on naturalassemblages, the respiratory activity of the phyto-plankton is often 'adjusted' by the routines of math-ematical models, in order to account for a net pho-tosynthesis which matches observed algal biomass orgrowth rate. Such a procedure may lead to errors inestimating the other loss processes.
Description of the sites studied
The data used herein are from the R. Meuse, which hasbeen described previously (e.g. Descy, 1987; Descy
141
THE NETHERLANDS
BELGIUM
F
0 50 km
AMUR
Reach 2
Reach 3
Reach 1
RANCE
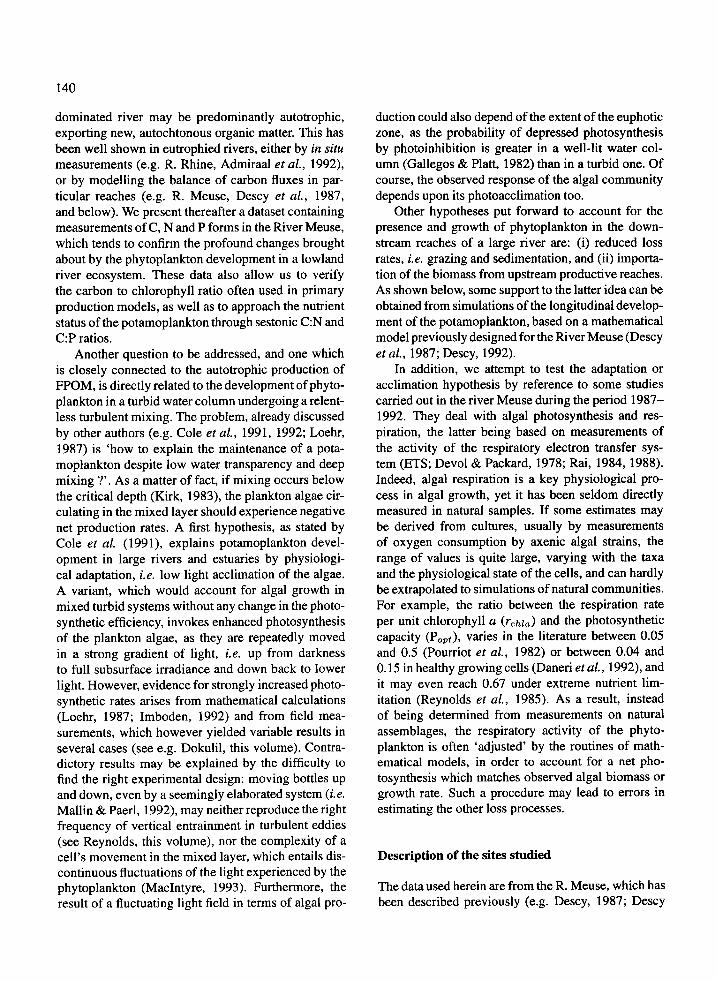
Fig. 1. Map of the River Meuse basin; the grey area is the Belgianpart of the catchment (about 40% of the total area).
et al, 1987, 1988). One of the important features ofthe Belgian part of the R. Meuse (ca 200 km, seeFig. 1) is that it has been heavily regulated for navi-gation. So, the depth of the river channel (3 to 6 m)and the low water transparency (usual range of thevertical extinction coefficient: 1.5-3.5 m - 1) do notallow any significant benthic primary production andthe barely developed benthic vegetation is restricted tothe banks. On the other hand, a large phytoplanktonbiomass develops in favourable weather and flow rateconditions (see Descy, 1987 and Gosselain & Descy,this volume), showing a successional pattern that isdriven mostly by external physical factors.
The data were collected from two main parts ofthe Belgian section (Fig. 1): reach 1, upstream ofNamur, around km 535 from the source, and reach 2,in the vicinity of Liege, between km 580 and km 600.Although being eutrophied, the first site presents arather good water quality by the usual standards,whereas the second reach is subject to heavy inputsof industrial and domestic sewage, particularly fromthe city of Liege. A third site, located slightly down-
stream of reach 1, was sampled in 1992: one of themain features of this 'reach 3' is its increased depth(6 m) relative to reach 1 (3.5 m).
Material and methods
Samples were usually taken with a 3-1 Van Dorn bottleand brought back to the laboratory, in a cooled darkcontainer, within a few hours of collection. Carbon,nitrogen and phosphorus were measured on filteredwater samples (using precombusted Whatman GF/Cfilters; a comparison with Millipore 0.45 /am filtersshowed no significant difference in SRP concentra-tions). Standard analytical procedures were used formeasuring N-NO3, N-NO2, N-NH4+ and SRP (solu-ble reactive phosphorus) on filtered samples. On thesame samples, DOC (dissolved organic carbon) wasmeasured with a Dohrman DC-80 analyser. Analysesof the seston were made after drying the filters carryingthe particulate material overnight at 60 C and usinga persulphate digestion followed by orthophosphatedetermination (Wetzel & Likens, 1979) for particulatephosphorus (PP), and a NA1500 Carlo Erba elementalanalyser for particulate organic carbon (POC) and par-ticulate organic nitrogen (PON). Chlorophyll a mea-surements were also carried out on the seston collectedon GF/C filters, according to the technique describedby P6char (1987), i.e. a hot extraction in a solvent madeof 5:1 acetone 90%-pure methanol, followed by mea-surements of absorbance at 665 nm before and afteracidification with HCI 0.03 M in the extract.
Methods for photosynthesis and respiration mea-surements have been described in detail elsewhere(Descy et al., in press). In short, photosynthesis mea-surements were based on the 14C technique, using, inboth the field and in the laboratory, a simple incubator.This permits exposure of the water samples to a rangeof fixed relative light intensities (6 to 100% of subsur-face irradiance). Irradiance data were obtained in situby monitoring surface PAR with a Licor 190SB sensoror from data of total incident radiation (Royal Meteoro-logical Institute, Belgium). Light in the water columnwas calculated from the vertical extinction coefficientof light, obtained by immersion of a photocell fittedwith red, green and blue filters at various depths; cal-culations of the mean coefficients were made accord-ing to Vollenweider (1974). Photosynthetic parameterswere determined by the fit of the observed values tothe Vollenweider equation.
I

142
Respiration was determined from measurements ofETS activity of the seston retained on GF/C filters, withthe techniques described by Christensen & Packard(1979), Rai (1984), Packard (1985). As the sampleswere prefiltered through a 63 tm plankton net, mostof the zooplankton was excluded from the seston; fur-thermore, water samples preincubated with antibioticsshowed no significant difference from untreated sam-ples. Thus, it was assumed that most of the ETS activi-ty measured resulted from algal respiration. The entireprocedure was first applied to cultures of a diatom(Cyclotella meneghiniana Kutz.) and of a green alga(Dictyosphaerium ehrenbergianum Nag.), both origi-nally isolated from the River Meuse, in order to definethe various analytical steps, which were afterwardsroutinely applied to natural samples. In particular, asonication time of 3 min was applied to the filterscarrying the algal material and immersed in a homog-enization buffer; the homogenates were kept under4 C throughout the sonication. Then, the homogenateswere treated as in Rai (1984) i.e. incubated 10 min withINT at the field temperature, at saturating levels of thesubstrates, NADP and NADPH. Calculations of theETS activity were made from the absorbance of theformazan produced by the reduction of INT, accordingto Rai (1984). The respiration rate was expressed asmg 02 (mg chla)- l h - l, taking a R:ETS ratio of 0.17(Packard, 1985). The data presented here are a syn-thesis of photosynthesis measurements, mostly in theupstream reach of the Belgian Meuse, from 1987 to1992; however, some data from reaches 2 and 3 havebeen included for comparison. The respiration datawere collected in 1991 and 1992, only in the upstreampart of the river (reaches 1 and 3).
The simulations of the longitudinal potamoplank-ton development were calculated by the PEGASEmathematical model, developed at the 'Centre Envi-ronnement', University of Liege, Belgium. The phyto-plankton submodel is largely based on the Meuse eco-logical model presented in Descy et al.. (1987), whichwas also used to calculate the daily phytoplankton pro-duction, integrated over time and depth, from fieldincubations. The PEGASE model takes into accountinputs of C:N:P forms from the watershed and fromdomestic and industrial releases, and simulates the evo-lution of the algal biomass in stationary conditions, i.e.at defined values of temperature, light and dischargeconditions at a reference site. These variables are cal-culated for the whole course of the river, and are usedto determine the physical factors and processes whichcontrol phytoplankton growth and biomass, including
the mean velocity of flow and the dilution rate, depend-ing of the river morphometry and of the watershedstructure. These last characteristics were known withsome detail for the Belgian course but were describedmore simply for the French section.
Results
Effect of the potamoplankton on the C:N:P budget
A fairly complete picture of the fluctuations in theamount and share of the organic carbon in the Meuseis presented in Fig. 2, which shows concentrations anddistributions of DOC and POC. The DOC is only twiceas high as POC (mean DOC:POC ratio 2.2, range 0.93-11.3), which resulted both from the large input ofuntreated sewage, that influenced both dissolved andparticulate carbon, and from the phytoplankton devel-opment. If the contribution of the algal biomass toPOC is estimated using a C:chla ratio of 37 (deter-mined from measurements in the river, see below),an average fraction of 1/3 of the particulate mattercomprised phytoplankton, the remaining being detritalcarbon (Fig. 3). However, the contribution of algal Cwas quite variable over the growing season. Dissolvedinorganic nitrogen forms (concentration range 2-4 mg1-1 mostly nitrate and ammonia, largely dominatedover particulate nitrogen (mean DIN:PON ratio 10,range 3.1-22.1). The situation was more variable forphosphorus, as an important industrial release influ-enced the results, so that SRP (up to 1.6 mg 1-1 !) oftenoverwhelmed particulate phosphorus (PP).
This situation can be compared to that of the upperreach of the Belgian Meuse, which is much less influ-enced by domestic and industrial inputs. In this reach:(i) DOC:POC ratio was 2.3 on average over the grow-
ing season (range 0.9-12.3); DOC was quite con-stant all over the year, which indicates that a largefraction of this dissolved carbon was refractory,originating from soil leaching in the watershed (theconcentrations were similar to that of unpollutedrivers, see Meybeck, 1993); POC was variable andwas mostly dependent on the contribution of livingalgae to particulate carbon, which was even higherthan in the lower Meuse (Fig. 4); the mean percent-age of algal C to total POC was 56.8% (range 12.5-92); of course, the largest amount of algal carboncoincided with the periods of blooms, in April,May, June, depending on weather and hydrody-namic conditions;

143
Organic carbon - Lower Meuse 1991
16
14
. 1212
0.1- 8
- 604
2
0
m 0 0 0 S S 0 0 a 0 0 0 0
yr rC N y 4- -O - 4 -. ~- IC - - -. -. - . v-;$ C* 4 4 rC - 1- 0 0 0 -
Fig. 2. Organic carbon in the lower Belgian Meuse (reach 2 in the text), measured at four sites at each sampling date, during the year 1991;POC: particulate organic carbon; DOC: dissolved organic carbon.
Particulate organic carbon - Lower Meuse 1991
0
5
o0
a.U
I
0
Fig. 3. Particulate organic carbon in the lower Belgian Meuse (reach 2 in the text), measured at four sites at each sampling date, during theyear 1991; POC: particulate organic carbon; algal carbon was calculated from chlorophyll a concentration, using a C:chla ratio =37.
- - - - V- - -Y- %-
N' t Z I V 91a N N 0 CD -;qIn a %-
144
(ii) for nitrogen, the balance between dissolved andparticulate forms was similar to that of the down-stream reach (mean DIN:PON ratio 10.1); nitratewas the main dissolved form, while ammonia andnitrite reached much lower concentrations;
(iii) particulate phosphorus exceeded, most of thetime, dissolved inorganic phosphorus, and thepotamoplankton development strongly affected therelative abundance of the two forms, as a large frac-tion of the PP comprised algae which had taken upthe SRP.The carbon to chlorophyll a ratio, calculated from
a linear regression of POC on chlorophyll a (Fig. 5)varied between 35 (lower Meuse) to 45 (upper Meuse),when the data of the two reaches were analysed sepa-rately. The regression on the data of the two reach-es together gave a ratio of 37 (s.d.=2.6, n=108,r2 = 0.65), despite the variable contribution of the detri-tal carbon, mainly in the downstream polluted reach.This C:chla ratio is quite in the expected range ofeutrophic water bodies (Riemann et al., 1989). Themean detrital carbon concentration, given by the Y-intercept (Fig. 5), is 1.3 mg 1-1.
A similar regression analysis of the POC:PON andPOC:PP data, carried out for the upstream Belgianreach (Fig. 6), gave the following results:(i) a very good correlation between POC and PON
(Fig. 6, A), showing the quite constant N con-tent of the seston, with a C:N ratio of 7.9; thevery low Y-intercept shows that almost all particu-late nitrogen was contained in the phytoplankton;the C:N ratio (6.3) of the phytoplankton can beapproached by regression of algal carbon, calcu-lated from chlorophyll a, on PON; this value, veryclose to the Redfield ratio, is expected for algaegrowing in a N-saturated environment;
(ii) a more variable relationship between POC and PP(Fig. 6, B), which may result from the presenceof variable amounts of phosphorus adsorbed onnon-living suspended material; the regression ofcalculated algal C on particulate P gives a C:P ratioof 82, which is lower than the Redfield ratio andindicates that, most of the time, the phytoplanktonwas not P-limited.
Photosynthesis and respiration of the potamoplankton
A brief summary of the data on temperature, light,phytoplankton biomass and photosynthetic parametersobtained from measurements in the River Meuse dur-ing the period 1988-1992 is presented in Table 1.
The two parameters of the photosynthesis-lightcurve, Popt and Ik, were plotted against temperatureand light in the water column, respectively (Figs 7-8). Popt values varied between 1.7 and 8.1 mg C(mg chla)- l h - 1, over the whole range of watertemperature, but unlike the one previously obtained(Descy et al., 1987), the relation between photosyn-thetic capacity and temperature is not satisfactory. Thelarge scattering may result (i) from the temperatureand light dependence of Popt and (ii) from the vary-ing composition of the phytoplankton community. Forinstance, the P,,opt values of the 'small Stephanodiscus'-dominated community (which occurred mostly below15 °C) reached at times the typical summer values. Asimilarly scattered plot was obtained for the Ik param-eter: its range was large (see Table 1) but most val-ues fell between 50 and 150 E m- 2 s -1 . Becauseof the variability of the weather and light conditions,the plot of Ik vs mean daily light in the water column(calculated assuming continuous mixing down to themean depth of the channel) also showed an impor-tant scattering, but most values were below 100 Em- 2 s- l . Compared to literature data, values for Poptand Ik were in a common range for temperate watersand showed no particular low light adaptation (Harris,1978; Reynolds, 1984). Nevertheless, the initial slopeof the photosynthesis-light curve, a, was on averagein the range of published values for coastal waters andestuaries: Keller (1988, in Cole et al., 1992) reporteda range from 8.5 to 16.7 mg C (mg chla) - 1 E-' m 2 ,with a mean of 12.
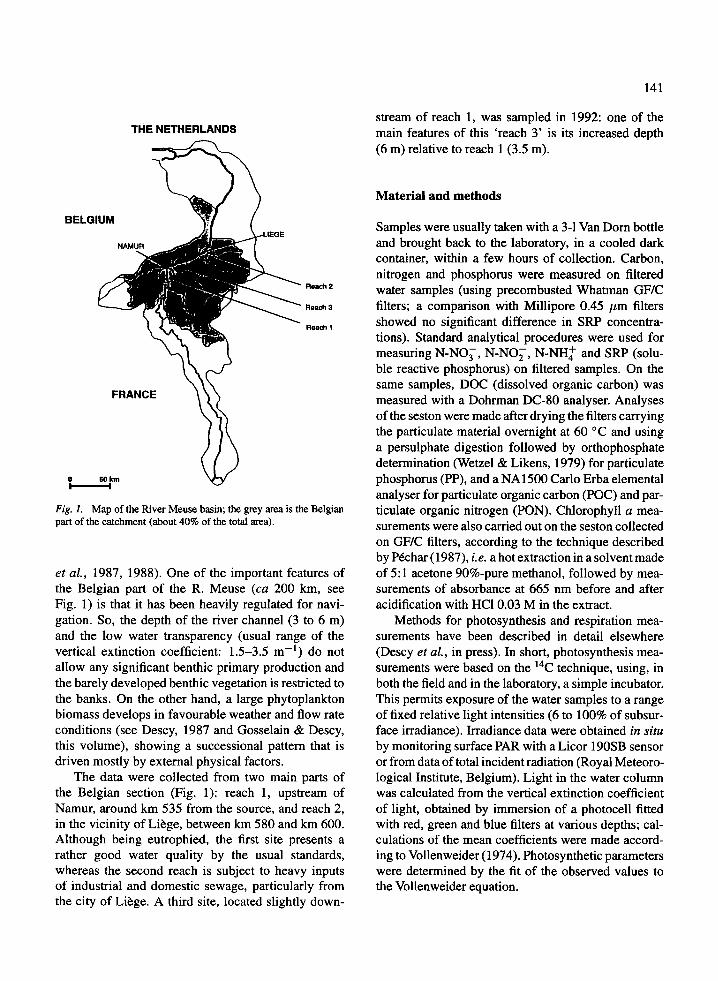
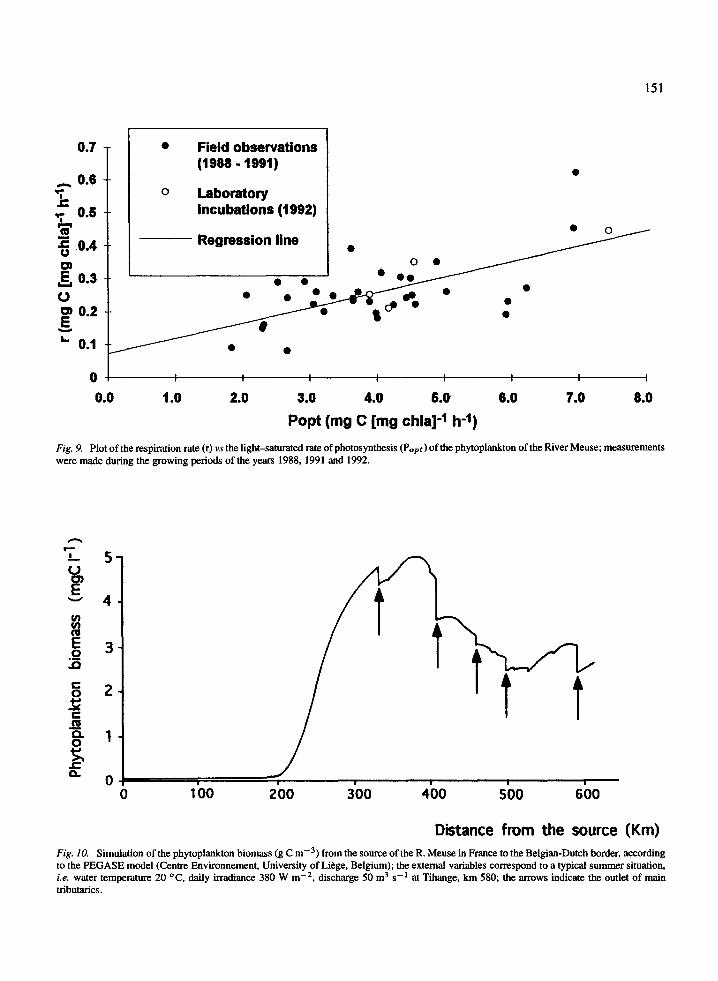
The respiration rate (r,ht ,) of the phytoplankton ofthe R. Meuse, measured by the ETS activity of theseston, was comprised between 0.08 and 0.62 mg C(mg chla)- 1 h - 1 and are only weakly temperature-dependent (Descy et al., in press). On the other hand,respiration rate was rather well correlated with Popt(r=0.65), and the mean rchla:Popt ratio, was 0.066(s.d. = 0.021). This ratio may allow calculations of thealgal respiration rate as a fraction of Popt, as pro-posed by various authors (e.g. Coveney et al., 1977)or, according to Straskraba & Gnauck (1985), bya linear regression equation, where the slope is therchla:Popt ratio, permitting calculation of an 'active',light-dependent, respiration, the Y-intercept being a'passive' component, temperature dependent, actingin the dark. In the present case (Fig. 9), the equationis:
rchla = 0.046 * Popt + 0.073 (r2 = 0.42; n = 39)

145
Carbon (mg 1-1)O O O O O I ) 4CD *C C C C C C
56/819151151915/241915130/91617/916121/916125191
712/91718/91
71111917115/91
4/31916/141915123191
6/4/916112/9161261917116191
414/914117191
613/9151131915122/91
6151916113/916124/917116191
2151922/13/922127192
3/419231111923/27/92
413192419/92
41171924/27192
5/7192511519251211925129192
6/51926/111926/28/92
711192711719271241927/3119281221921013192
NnO> -VIf 0a 0n
'O
C.
a.O
a
03
'I
CD0
(0
(0
Fig. 4. Particulate organic carbon in the upper Belgian Meuse (reach I in the text), measured at one site at each sampling date, during thegrowing seasons 1991 and 1992; POC: particulate organic carbon; algal carbon was calculated from chlorophyll a concentration, using a C:chlaratio = 37.

146
POC - Chlorophyll a relationship - Upper andlower Meuse
7000
6000
5000
c 4000
0 30000C 2000
1000
00.0
U
.
.
1
.E
.
20.0 40.0 60.0 80.0
Chlorophyll a (pLg -i)
100.0 120.0 140.0
Fig. 5 a. Plot of POC (particulate organic carbon) vs chlorophyll a concentrations in the River Meuse, from measurements during the growing
seasons of the period 1990-1992; A: all data included; B: data from the upper Belgian Meuse (reach I in the text) only.
POC - Chlorophyll a relationship - Upper Meuse
7000
6000
5 000
24000
8 3000
2000
1000
00.0 20.0 40.0 60.0 80.0 100.0 120.0
Chlorophyll a (g I-1)
Fig. 5 b.
140.0
I

147
POC - PON relationship - Upper Meuse
.
. .
10.0 20.0 30.0 40.0 50.0 60.0 70.0
PON (pM)
Fig. 6 a Plot of POC (particulate organic carbon) vs PON (particulate organic nitrogen, A) and vs PP (particulate phosphorus. B) concentrationsin the River Meuse, from measurements during the growing seasons of the period 1990-1992; data from the upper Belgian Meuse (reach 1 inthe text).
POC - PP relationship - Upper Meuse
DUU.U
500.0
400.0
300.0
200.0
100.0
0,00.0
a
.
.
* I
U
s
a
.
l ~I I .I I
1.0 2.0 3.0
PP (M)Fig. 6b.
4.0 5.0 6.0
bUU.U
500.0
400.0 -
300.0
200.0
100.0
u-u
* E
.
.
s (1990-
ne
0.0 80.0
* Measurements (1990-1992)
Rearession line
I
L
dn&A _
_
dA A
%
.
I

148
Table 1. Summary of the data of temperature, phytoplankton biomass, photosynthetic parameters and light, obtainedfrom measurements in the River Meuse during the period 1988-1992 (n = 66). In each column, in descending order,mean, standard deviation, minimum, maximum; k is the vertical attenuation coefficient of light and PAR is the meandaily photosynthetically active radiation.
Temperature Chla Ik Pot a k PAR
°C mg m- 3 ILE m- 2s- mg C (mg chla)-' mg C (mg chla)-' m-1 E m- 2 s- 1h-I E-X m-2
16.7 53.7 97.8 4.1 15.4 2.35 391
4.2 35.2 52.3 1.4 9.4 0.62 245
8.0 7.2 26.0 1.7 2.7 1.46 77
24.7 153.5 245 8.1 49.6 3.89 1175
where rchl a is the respiration rate of the algae and Ppttheir photosynthetic capacity, both expressed as mg C(mg chla)-l h - '.
The photosynthesis and respiration data alsoallowed us to calculate the net production and potentialmaximal growth rate of the algae, taking into accountfull mixing of the water column and assuming thatshort 14C incubations measured gross photosynthesis.The results are given in Table 2, for reaches 1 and 3,which differ by their mean depth (3.5 m vs 6 m). Theyshow the effect of increased depth on the daily netproduction (NP), equivalent to potential growth rate,of the algae. In the shallowest reach, the phytoplank-ton experienced NP>O.1 d- l five times over the 11series, while in the deepest reach, they reached thislevel only once, despite the lower respiration rate ofthe algal community. There was indeed a differencein the respiration activity between the two sites: therchl a:Popt ratios were significantly different at the 0.95probability level.
Development of the phytoplankton along the river andecosystem P:R ratio of the Belgian Meuse
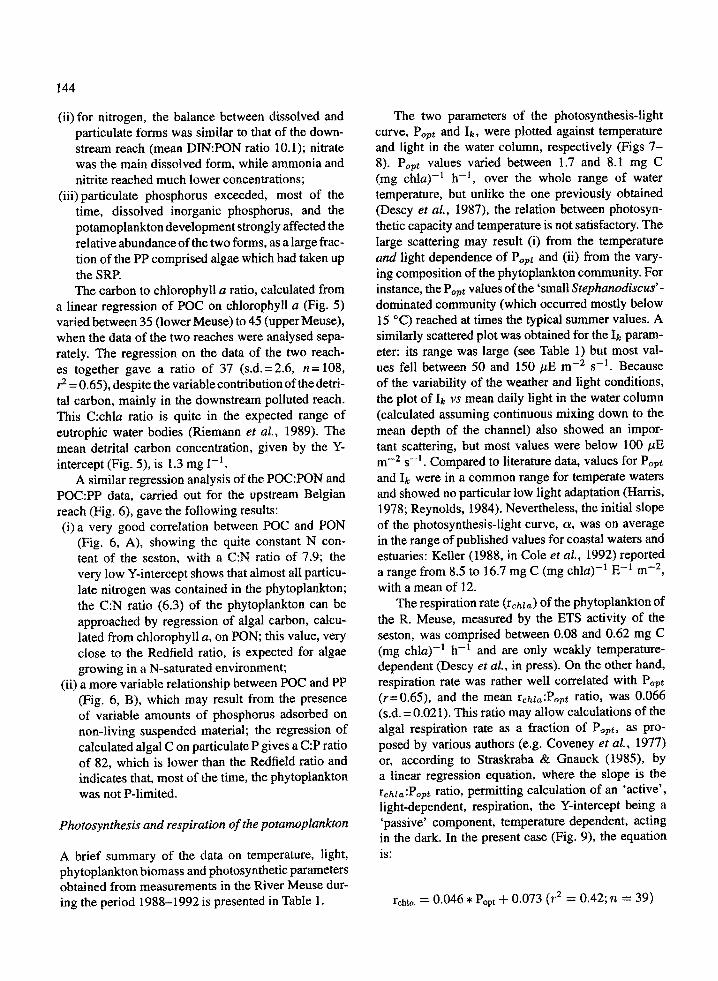
Figure 10 presents the simulated phytoplanktonbiomass along the French and Belgian course of theriver. In the simulated conditions, which are typicalof a summer situation, i.e. high irradiance and lowdischarge, the phytoplankton algae begin to developa significant biomass from about 200 km from thesource. Then, they achieve their full growth, peakingat 5 g C m-3 (135 jtg chla 1-'l ) within less than 200 km.Downstream, the potamoplankton decline to about halfof their maximum biomass, by the combined action of(i) dilution by lateral water inputs (i.e. tributaries) and(ii) reduced growth due to increasing depth. Whether or
not such a profile might characterise other large riversis discussed below, yet it can be mentioned that a sim-ilar longitudinal pattern of growth and decline of thepotamoplankton has been already reported by Welch(1952, p. 429-430) for several rivers in the world butthe loss processes involved were not identified.
The oxygen budget of the River Meuse in the upper-most Belgian section has been calculated for the years1983-1984 (Billen et al,, 1985; Descy et al., 1987)and is summarised in Table 3. According to these cal-culations, the P:R ratio of the river in its upper Belgianreach characterised a fully autotrophic status (P:R = 1.2on a yearly basis, 1.5 over the growing season). Thisalso implies that a large fraction of the primary pro-duction is exported downstream, which accounts for amajor part of the algal biomass found in the lower deepreaches of the river.
Discussion and conclusions
The data collected in the Belgian Meuse on the C:N:Pconcentrations in the particulate and dissolved phaseconfirms the observations on other large eutrophiedrivers, reviewed by Admiraal et al. (1992). In partic-ular, the contribution of the potamoplankton to par-ticulate carbon and nitrogen was very high, at leastin the upstream reach of the R. Meuse. The averagevalue of 58% of algal carbon in the total POC (range12.5-92, over the growing season) can be comparedto the 15-65% for the lower Rhine (The Netherlands),the estimated 55% for the R. St. Laurent (Canada)and for the R. Ebro (Spain), the 50% for the R. Loire(France). As for the R. Rhine, such data can be used forassessing the transformations of elements along a riverand the inputs to the sea, but they also demonstrate

149
Popt - temperature relationship
0
0
0 0 0o O oO o $ a a a~~~~~~1
0 0 ]
0 0 1 11EP 00 Oo ··0cl 00 % 0 00
10.0
25-
20
E 105
0
15.0
Temperature (C)
Popt frequency diagram
4
2 3 4 6 6 7 8
20.0 25.0
Popt (mg C [mg chla]-I h-1)
Fig. 7. Photosynthetic parameters of the River Meuse phytoplankton. A: plot of Ppt, the light-saturated rate of inorganic carbon uptake, vstemperature, for the data of the upper Belgian Meuse (squares) and of the lower Belgian Meuse (black dots); the curve is the relationship foundfor the years 1983-1984, used in the Meuse ecological model (Descy et al., 1987); the frequency plot of the Popt values is also presented.
that the theoretical view of the heterotrophic largeriver according to River Continuum concept shouldbe somewhat amended. Clearly, many large lowlandrivers produce an amount of FPOM which exceeds theinput from upstream, as far as hydrodynamics and mor-phometry allow a planktonic net primary productionto take place. So, these rivers are actually autotroph-ic systems in a part of their course, and only become
heterotrophic (i.e. receive their FPOM mostly fromupstream) where net primary production is offset byincreased depth and turbidity. So, there is indeed acontinuous variation from the autotrophic, non light-limited midreaches to the heterotrophic, strongly light-limited downstream reaches, the transition betweenthese two extremes being the lowland river supportingan important phytoplankton production. Such a transi-
0.25 -
0.20 -
0.15 -
0.10 -
0.05
n nn
5.0
Tf.
l luvevv

150
Ik - light relationship
200
e 1
L 100:y
50 -
0
0
0·
0'3
0 0 0
0
0
0
0
o110
00
0[0
0
0.** @00
0
I I I I I I
0 20 40 60 80 100 120Mean daily PAR in the water column (E m-2 s-1)
140 160
Ik frequency diagram
LI0
EI
( r- - - N
(jLE m -2 s - 1)
Fig. 8. Photosynthetic parameters of the River Meuse phytoplankton. A: plot of Ik, the irradiance at the onset of light saturation, vs mean dailylight in the water column, for the data of the upper Belgian Meuse (squares) and of the lower Belgian Meuse (black dots); the frequency plot ofthe Ik values is also presented.
tion from benthic primary production (in macrophytes-dominated rivers) to planktonic primary production(phytoplankton-dominated rivers) is consistent withthe view of a river continuum, yet it depends less on thestream order and related attributes than on local prop-erties of the channel (turbidity, depth, slope, pattern ofdischarge and flow velocity).
As mentioned above, an autotrophic status has beenwell demonstrated for the upper Belgian Meuse whereP:R>1, thanks to a gross primary production (GP)which is in the range of 500-600 g C m - 2 y- 1. Sucha high productivity is encountered in other large rivers(see e.g. Descy et al., 1988, for European rivers), butcontrasts with the much lower values found in estuar-ies, where GP is lower than 100 g C m- 2 y-1 (Cole
O Upper Belgian Meuse
* Lower Belgian Meuse
OB
---ZoU -
0 0
00@0
0 -0
· ·•~*. I I I I Il l
2.0 3.0 4.0 5.0' 6.0 7.0
Popt (mg C [mg chla]-1 h-1)
Fig. 9. Plot of the respiration rate (r) vs the light-saturated rate of photosynthesis (Popt) of the phytoplankton of the River Meuse; measurementswere made during the growing periods of the years 1988, 1991 and 1992.
5
4
3
2
1
00 200 500 600
Distance from the source (Km)Fig. 10. Simulation of the phytoplankton biomass (g C m
- 3) from the source of the R. Meuse in France to the Belgian-Dutch border, according
to the PEGASE model (Centre Environnement, University of Liege, Belgium); the external variables correspond to a typical summer situation,i.e. water temperature 20 C, daily irradiance 380 W m
- 2, discharge 50 m
3s
- 1at Tihange, km 580; the arrows indicate the outlet of main
tributaries.
151
* Field observations(1988 - 1991)
o LaboratoryIncubations (1992)
Regression line
U., I
na
0.4.E 0.5
0
- 0.2E
0.1
00.0 1.0 8.0
L-U
9
WU)
E.g
or--a0.C
a.00
A,
F
t

152
Table 2. Measurements and calculations of biomass, respiratory activity and daily production of the phytoplankton of theRiver Meuse, at two sites of the Belgian course; rchla was determined by ETS measurements and Ra is daily respiration ofthe algae, assuming constant respiration over 24 h; growth rate is equivalent to the net production rate, regardless of theloss processes.
Reach 1 Chi a r Ra Resp. GP GP growth
rate rate rate
(mean depth =3.5 m) zgl- l mgC gCm-2 d - l - l gCm-2d - ' d-l d- l
(mg Chla)- 1 h-
13-Sep-90 64.1 0.390 2.099 0.27 1.991 0.25 -0.01
19-Oct-90 135.2 0.080 0.909 0.05 1.354 0.08 0.03
3-Apr-91 47.6 0.221 0.884 0.15 2.442 0.42 0.27
16-Apr-91 70.1 0.160 0.942 0.11 1.196 0.14 0.03
30-Apr-91 66.9 0.241 1.354 0.17 0.893 0.11 -0.06
14-May-91 54.1 0.250 1.136 0.17 1.456 0.22 0.05
23-May-91 59.3 0.290 1.445 0.20 2.251 0.31 0.11
4-Jun-91 79.1 0.350 2.326 0.24 3.851 0.40 0.16
12-Jun-91 80.1 0.270 1.817 0.19 3.457 0.35 0.17
26-Jun-91 41.6 0.620 2.167 0.43 3.594 0.710 0.28
15-Jul-91 35.8 0.450 1.353 0.31 0.978 0.22 -0.09
Reach 2(mean depth = 6 m)
14-Sep-90 39.0 0.230 1.292 0.16 1.758 0.21 0.06
10-Oct-90 117.7 0.090 1.525 0.06 0.743 0.03 -0.03
4-Apr-91 48.4 0.300 2.091 0.21 2.41 0.24 0.03
17-Apr-91 71.4 0.220 2.262 0.15 1.201 0.08 -0.07
3-May-91 54.6 0.150 1.179 0.10 0.605 0.05 -0.05
13-May-91 41.4 0.230 1.371 0.16 2.09 0.24 0.08
22-May-91 46.9 0.260 1.756 0.18 3.472 0.35 0.17
5-Jun-91 77.9 0.240 2.692 0.16 3.844 0.23 0.07
13-Jun-91 81.7 0.200 2.353 0.14 1.732 0.10 -0.04
24-Jun-91 54.3 0.180 1.407 0.12 0.969 0.08 -0.04
16-Jul-91 41.9 0.190 1.146 0.13 1.298 0.15 0.02
et al., 1991; Lara-Lara et al., 1992). To some extent,river regulation and management, as well as nutri-ent inputs, have favoured potamoplankton develop-ment. However, potamoplankton is not restricted toregulated rivers, as shown by some examples, e.g. inFrench (e.g. River Loire, see Meybeck etal., 1988) andBritish rivers (e.g. River Severn, Reynolds & Glaister,1993) but changes of morphometry and regulation offlow certainly have profound influences on the phy-toplankton dynamics and the metabolism of the riversystem. Accordingly, Vannote et al. (1980) predictedthat 'unnatural disturbances' (including impoundmentand nutrient enrichment) could be regarded as 'resetmechanisms which cause the continuum response tobe shifted (either) toward the headwaters or seaward'.
The analysis of the photosynthetic and respiratoryresponse of the whole algal community leads to thefollowing conclusions:
(i) the current river models which treat the phy-toplankton as an homogenous community needimprovement, in order to take into account thediverse ecophysiological responses and require-ments of some important components of the com-munity; for instance, more attention should bedevoted to cell-specific rates of photosynthesis,growth and losses;
(ii) the potamoplankton of the R. Meuse does not seemto show a particular low light acclimation, as far asthe parameters of photosynthesis are considered;however, distinct values of the C:chla ratio were

153
Table 3. Oxygen budget in the River Meuse inthe upper Belgian reach (around km 500), for theyears 1983-1984 (from Billen et al., 1985). Unitsare kg 02 m - l y-l
Gross primary production 206.6Reaeration -37.7Respiration of phytoplankton -30.9
Respiration of zooplankton -44.6Consumption by bacterioplankton -72.0Benthic consumption -24.0
Total consumptions -171.5P:R 1.2
obtained in the two studied reaches of the Meuse,which may indicate an increase of the cell-specificchlorophyll content related to the deepening chan-nel as going downstream; similarly, a significantreduction of the algal respiration rate with increas-ing depth was found, which was likely the resultof a stronger light limitation; this interpretation issupported by the coupling between photosynthesisand respiration, as respiration rates adjust to therate of substrate supply by photosynthetic carbonfixation (Falkowski & LaRoche, 1991); according-ly, Daneri et al. (1992) found a control of respira-tion by growth irradiance in marine phytoplankton,and a corresponding decrease of rchla:Popt withdecreasing growth irradiance; moreover, the mech-anistic explanation of reduced respiration at lowlight may be found in Reynolds et al. (1985) whointerpret enhanced respiratory losses as a regulato-ry process depending on the size of the fixed carbonpool which is not used for growth: for instance,phytoplankton going down the River Meuse andcoming to our 'reach 3' (see Table 2) could notobtain much excess carbon from their photosyn-thesis!
These observations, coupled to mathematical mod-els simulations (see Fig. 10) help to understand thedevelopment of potamoplankton in a river system:
- so far as no nutrient limitation occurs, growth takesplace in the upstream, shallow part of the river,as soon as growth rate exceeds dilution rate (seeDescy et al., 1987 and Billen et al., this volume);
- the biomass produced is exported toward the low-er deepening reaches; growth of this biomass ismaintained until increasing depth, together withdecreasing light availability, prevents positive net
production; the maximal attainable biomass levelin given river is strongly dependent of turbidityand depth, which explains differences of maxi-mal chlorophyll a concentrations observed amongrivers of similar carrying capacity (Descy et al.,1988);
-further downstream, the biomass declines, as aresult of dilution by tributaries and of several lossprocesses: grazing, mortality, sedimentation.Dead zones or better 'storage zones' in river chan-
nels (Reynolds, 1988; Reynolds et al., 1991; Reynolds& Glaister, 1993) can play a role in these dynamics,as far as they act as 'nurseries' and may be sources ofphytoplankton which will develop in productive reach-es. As a matter of fact, the above 'model' is based onan experience of a regulated river, that has a sufficient'retentivity' through the flow regulation. Moreover,the above reasoning does not account for the inoculumof algal populations, which, as so nicely demonstrat-ed by Reynolds & Glaister (1993), originates withinthe river. Similarly, new inocula or renewed develop-ment of some populations may occur in shallow armslocated in the main river channel, which can explainincreases of biomass and diversity of potamoplanktonin downstream sections of large rivers (Stoyneva, thisvolume).
Then, coming back to the discussion by Cole et al.(1991) about how to explain the presence of a largephytoplankton biomass in the lower R. Hudson, wewould retain primarily the 'importation hypothesis',i.e. an origin of the biomass from upstream produc-tive reaches. The 'production hypothesis' does notreceive much support, as there is little experimentalevidence for photosynthetic acclimation by improve-ment of the photosynthetic efficiency of algal cells, atleast when rates are expressed per unit chlorophyll a.Also, the possibility of enhanced photosynthesis inchanging light (Loehr, 1987; Imboden, 1992) cannotpresently be ruled out, but it should be investigated fur-ther, as it has not yet received convincing experimentalsupport, at least in turbid systems.
The 'removal hypothesis', based on the reductionof losses by grazing and sedimentation, should be fur-ther examined, particularly for zooplankton grazing.As stated by Reynolds et al. (1990) and Reynolds(1992), sedimentation is certainly reduced in well-mixed and sufficiently deep water columns. Reduc-tion of settling losses as depth increases in rivers mayaccount for maintaining in suspension algae suscepti-ble to this process. Concerning grazing by zooplank-ton or benthic animals, the common assumption is that

154
the process is negligible in rivers, as the developmentof the most efficient grazers, the large crustaceans,is limited by the short residence times. Nevertheless,evidence arises, both from observations and models,that grazing may be a significant loss factor duringthe low flow periods. For instance, as shown by othercontributors (Billen et al., this volume), most modelsfail to represent rapid biomass declines often encoun-tered in summer conditions: an explanation might bethat the effect of biotic interactions on the phytoplank-ton dynamics in large lowland rivers have been so farlargely overlooked. As a matter of fact, some obser-vations (Descy, 1993; Gosselain et al., this volume)seem to show that in rather stable physical conditions,which are usually occurring in the summer period inmost temperate large rivers, biotic interactions mayexert some influence on the phytoplankton biomassand composition. Information, based on in situ mea-surements, on such a 'biotic control' of potamoplank-ton is still relatively scarce, but experimental evidencemay be provided by data from ongoing studies.
Acknowledgments
We wish to thank the referees, as well as ColinReynolds and Judit Padisdk, for their helpful commentson the manuscript. We are also indebted to variousmembers (former and present) of the Unit of Fresh-water Ecology for their collaboration to the field andlaboratory work. Part of this research was supportedby a grant of the 'Fonds de la Recherche FondamentaleCollective', Belgium.
References
Admiraal, W., D. M. Jacobs, P. Breugem & E. D. de Ruyter vanSteveninck, 1992. Effects of phytoplankton on the elementalcomposition (C, N, P) of suspended particulate material in thelower River Rhine. Hydrobiologia 235-236: 479-489.
Billen, G., J.-P. Descy, P. Servais & J. S. Smitz, 1985. Etude6cologique de la haute Meuse et mod6lisation du fonctionnementde l'6cosysteme aquatique. Rapport final, Ministere de la RegionWallonne pour l'eau, l'environnement et la vie rurale, 250 pp.
Billen. G.. J. Garnier & Ph. Hanset, 1994. Modelling phytoplank-ton development in whole drainage networks: the RIVER-STRAHLER Model applied to the Seine river system. Hydro-biologia 289: 119-137.
Christensen, J. P. & T. T. Packard, 1979. Respiratory electron trans-port activities in phytoplankton and bacteria: Comparison ofmethods. Limnol. Oceanogr. 24: 576-583.
Cole, J. J., N. F. Caraco & B. Peierls, 1991. Phytoplankton primaryproduction in the tidal, freshwater Hudson River, New York(USA). Verh. int. Ver. Limnol. 24: 1715-1719.
Cole, J. J., N. F. Caraco & B. Peierls, 1992. Can phytoplanktonmaintain a positive balance in a turbid, freshwater, tidal estuary?Limnol. Oceanogr. 37: 1608-1617.
Coveney, M. E, G. Cronberg, M. Enell, K. Larsson & L. Olof-son, 1977. Phytoplankton, zooplankton and bacteria-standingcrop relationships in a eutrophic lake. Oikos 29: 5-21.
Daneri, G., A. Iriarte, V. M. Garcia, D. A. Purdie & D. W. Crawford,1992. Growth irradiance as a factor controlling the dark respira-tion rates of marine phytoplankton. J. mar. biol. Ass. U.K. 72:723-726.
Descy, J.-P., 1987. Phytoplankton composition and dynamics in theRiver Meuse (Belgium). Arch. Hydrobiol., suppl. 78, Algol. Stud.47: 225-245.
Descy, J.-P., 1992. Eutrophication in the River Meuse. InD. W. Suttcliffe & J. G. Jones (eds), Eutrophication: researchand application to water supply. Freshwater Biological Associa-tion, Ambleside: 132-142.
Descy, J.-P., 1993. Ecology of the phytoplankton of the RiverMoselle: effects of disturbances on community structure anddiversity. Hydrobiologia 249: 111-116.
Descy, J.-P., E. Everbecq & J. S. Smitz, 1988. Primary productionin the River Meuse (Belgium). Verh. int. Ver. Limnol. 23: 1287-1293.
Descy, J.-P., P. Servais, J. S. Smitz, G. Billen & E. Everbecq, 1987.Phytoplankton biomass and production in the river Meuse (Bel-gium). Wat. Res. 21: 1557-1566.
Descy, J.-P., V. Gosselain & F. Evrard, in press. Photosynthesis andrespiration of river phytoplankton. Verh. int. Ver. Limnol. 25.
Devol, A. H. & T. T. Packard, 1978. Seasonal changes in res-piratory enzyme activity and productivity in Lake Washingtonmicroplankton. Limnol. Oceanogr. 23: 104-111.
Falkowski, P. G. & J. LaRoche, 1991. Acclimation to spectral irra-diance in algae. J. Phycol. 27: 8-14.
Gallegos, C. L. & T. Platt, 1982. Phytoplankton production andwater motion in surface mixed layers. Deep-Sea Res. 29: 65-76.
Gosselain V., J.-P. Descy & E. Everberg, 1994. The phytoplanktoncommunity of the River Meuse, Belgium: seasonal dynamics(year 1992) and the possible incidence of zooplankton grazing.Hydrobiologia 289: 179-191.
Harris, G. P., 1978. Photosynthesis, productivity and growth: thephysiological ecology of phytoplankton. Arch. Hydrobiol. Beih.,Ergebn. Limnol. 10, 171 pp.
Imboden, D. M., 1992. The impact of physical processes on algalgrowth. In D. W. Sutcliffe & J. G. Jones (eds.), Eutrophication:Research and application to water supply. Freshwater BiologicalAssociation, Ambleside: 30-43.
Kirk, T. O. J., 1983. Light and photosynthesis in aquatic ecosystems.Cambridge Univ. Press, Cambridge, 401 pp.
Lara-Lara, J. R., B. E. Frey & L. F. Small, 1990. Primary productionin the Columbia River estuary. I. Spatial and temporal variabilityof properties. Pacific Science 44: 17-37.
Loehr, J., 1987. Impact of the hydrodynamic conditions on the pri-mary production in an impounded river. Ecological Modelling39: 227-245.
Maclntyre, S., 1993. Vertical mixing in a shallow, eutrophic lake:Possible consequences for the light climate of phytoplankton.Limnol. Oceanogr. 38: 798-817.
Mallin, M. A. & H. W. Paerl, 1992. Effects of variable irradi-ance on phytoplankton productivity in shallow estuaries. Limnol.Oceanogr. 37: 54-62.

155
Meybeck, M., 1993. C, N, P and S in rivers: from sources to globalinputs. In R. Wollast, F. T. Mackenzie & L. Chou (eds.), Interac-tions of C, N, P and S Biogeochemical Cycles and Global Change.NATO ASI series 14, Springer Verlag, Berlin: 163-193.
Meybeck, M., G. Cauwet, S. Dessery, M. Somville, D. Gouleau &G. Billen, 1988. Nutrients (Organic C, P, N, Si) in the eutrophicRiver Loire (France) and its estuary. Estuar. Coast. Shelf Sci. 27:595-624.
Packard, T. T., 1985. Measurement of electron transport activity ofmicroplankton. Adv. aquat. Microbiol. 3: 207-261.
P6char, L., 1987. Use of acetone: methanol mixture for extractionand spectrophotometric determination of chlorophyll a in phyto-plankton. Arch. Hydrobiol. Suppl. 78, Algol. Stud. 46: 99-117.
Pourriot, R., J. Capblancq, P. Champ & J. A. Meyer, 1982. Ecologiedu Plancton des Eaux Continentales. Masson, Paris, 198 pp.
Rai, H., 1984. Size-dependent respiratory-enzyme activity and pri-mary production of microplankton in Sch6hsee (a North GermanBaltic lake). Arch. Hydrobiol. 102: 239-253.
Rai, H., 1988. Activity of respiratory electron transport system (ETS)in different size particles as a measure of carbon losses fromprimary producers. Verh. int. Ver. Limnol. 23: 617-625.
Reynolds, C. S., 1984. The ecology of freshwater phytoplankton.Cambridge University Press, Cambridge, 384 pp.
Reynolds, C. S., 1988. Potamoplankton: paradigms, paradoxes andprognoses. In F. E. Round (ed.), Algae and the Aquatic Environ-ment. Biopress Ltd., Bristol: 285-311.
Reynolds, C. S., 1992. 9: Algae. In P. Calow & G. E. Petts (eds.),The Rivers Handbook. Hydrological and Ecological Principles.Blackwell Scient. Publ., Oxford: 195-215.
Reynolds, C. S., P. A. Carling & K. J. Beven, 1991. Flow in riverchannels: new insights into hydraulic retention. Arch. Hydrobiol.121: 171-179.
Reynolds, C. S. & M. S. Glaister, 1993. Spatial and temporal changesin phytoplankton abundance in the upper and middle reaches ofthe River Severn. Arch. Hydrobiol. suppl. 101, Large Rivers 9:1-22.
Reynolds, C. S., G. P. Harris & D. N. Gouldney, 1985. Comparisonof carbon-specific growth rates and rates of cellular increase ofphytoplankton in large limnetic enclosures. J. Plankton Res. 7:791-820.
Reynolds, C. S., M. L. White, R. T. Clarke & A. F Marker, 1990.Suspension and settlement of particles in flowing water: com-parison of the effects of varying water depth and velocity incirculating channels. Freshwater Biol. 24: 23-34.
Riemann, B., P. Simonsen & L. Stensgaard, 1989. The carbonand chlorophyll content of phytoplankton from various nutrientregimes. J. Plankton Res. 11: 1037-1045.
Straskraba, M. & A. Gnauck, 1985. Freshwater ecosystems mod-elling and simulation. Developments in Ecological Modelling 8,Elsevier, Amsterdam, 309 pp.
Stoyneva, M. P., 1994. Shallows of the lower Danube as additionalsources of potamoplankton. Hydrobiologia 289: 171-178.
Vannote, R. L., 1981. The River Continuum: a theoretical constructfor analysis of river ecosystems. Proceedings of the national sym-posium of freshwater inflow to estuaries, Fish & Wildlife Service,U.S. Department of the Interior, 289-304.
Vannote, R. L., G. W. Minshall, K. W. Cummins, J. R. Sedell &C. E. Cushing, 1980. The River Continuum concept. Can. J. Fish.aquat. Sci. 37: 130-137.
Vollenweider, R. A., 1965. Calculation models of photosynthesis-depth curves and some implications regarding day rate estimatesin primary production measurements. Mem. Ist. ital. Idrobiol.suppl. 18: 425-457.
Vollenweider, R. A., 1974. A Manual on Methods for MeasuringPrimary Production in Aquatic Environments. IBP Handbook12, Blackwell Scientific Publications, Oxford, 225 pp.
Welch, P. S., 1952. Limnology. Mc Graw Hill Book Cy, NY, 538 pp.Wetzel, R. G., 1983. Limnology. 2d ed., Saunders Coill. Publ.,
Philadelphia, 767 pp.Wetzel, R. G. & G. E. Likens, 1979. Limnological analyses. Saunders
Coll. Publ., Philadelphia, 357 pp.