crcp mechanistic - empirical pavement design · pdf filecrcp mechanistic - empirical pavement...
TRANSCRIPT

CRCP MECHANISTIC- EMPIRICAL PAVEMENT DESIGN Hua Chen, P.E Andy Naranjo, P.E Rigid Pavements and Concrete Materials Branch Construction Division, TxDOT 2015 Short Course

Table of Contents
2
7-9
10-16
17-32
33-38
3-6 Background
Current Empirical Concrete Pavement Design
Development of Mechanistic-Empirical CRCP Design
TxCRCP-ME Design Program
TxCRCP-ME vs. AASHTO 1993 Design
1
2
3
4
5
39-40 Summary 6

Background
3
Longitudinal Joint
Longitudinal Steel
Transverse Steel Tie Bars
4” ACP Base
CRCP after Concrete Paving

4
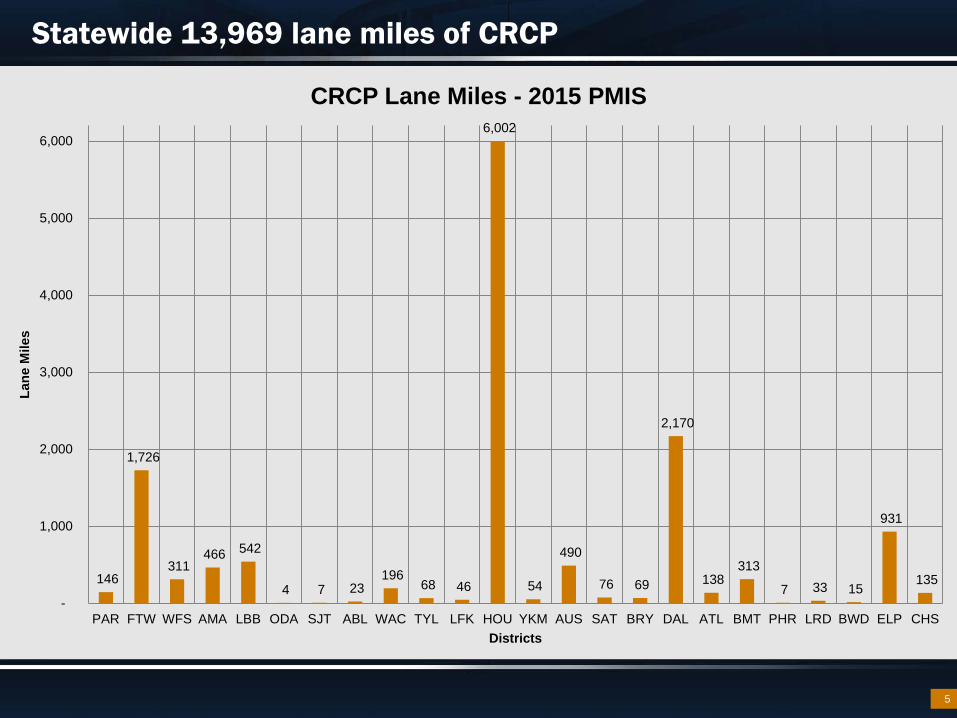
Statewide 13,969 lane miles of CRCP
5
146
1,726
311 466 542
4 7 23 196
68 46
6,002
54
490
76 69
2,170
138 313
7 33 15
931
135
-
1,000
2,000
3,000
4,000
5,000
6,000
PAR FTW WFS AMA LBB ODA SJT ABL WAC TYL LFK HOU YKM AUS SAT BRY DAL ATL BMT PHR LRD BWD ELP CHS
Lane
Mile
s
Districts
CRCP Lane Miles - 2015 PMIS

6
Statewide 3,681 lane miles of CPCD
122 41 73
3 1 8 1 86
35 20
482
5 4 28
1,890
95
713
3 14 57
-
200
400
600
800
1,000
1,200
1,400
1,600
1,800
2,000
PAR FTW WFS AMA LBB ODA SJT WAC TYL LFK HOU YKM SAT BRY DAL ATL BMT PHR LRD CHS
Lane
Mile
s
Districts
CPCD Lane Miles - 2015 PMIS

Current Empirical Concrete Pavement Design
AASHTO 93 Design Method – Based on empirical data for AASHTO Road Test built in Illinois during the
late 50’s – Consisted of 7 miles of two-lane pavements in the form of six loops and a
tangent, half concrete, half asphalt – Most of the concrete sections were JCP not CRCP
7

8
Δ Serviceability Index
Load Transfer Coefficient
Design ESALs
Reliability
Standard Deviation
Modulus of Rupture Drainage Coefficient
Modulus of Elasticity
Subgrade Reaction
Pavement Thickness
Terminal Serviceability Index

Darwin 3.1
9

Development of Mechanistic-Empirical CRCP Design
TxDOT has used the AASHTO 93 Guide for the design of CRCP, and it has served TxDOT well for the design of CRCP despite its limitations. In March 2004, NCHRP 1-37 report and the mechanistic-
empirical pavement design guide software (MEPDG) were released. In 2005, TxDOT initiated Research 0-4714 to evaluate the
MEPDG for potential implementation. The study recommended, for various reasons, not to implement the MEPDG as a replacement for the design methods currently being used.
10

Development of Mechanistic-Empirical CRCP Design
In 2007, TxDOT initiated Research 0-5832, to develop a mechanistic-empirical CRCP design procedures that would model the performance of TxDOT’s typical concrete pavement structure and performance. Three-dimensional analysis was conducted for in-depth analysis
of mechanistic behavior of CRCP, including the interactions between longitudinal steel and concrete.
11

Development of Mechanistic-Empirical CRCP Design
Over the past decade, there has been a push to make pavement design less of an art and more of a science
12
• Modulus of Rupture
• Elastic Modulus
• K-Value of Subgrade
• Serviceability Index
• Load Transfer Coeff.
• Drainage Coeff.
• Standard Deviation
• Reliability
• Traffic
Empirical Design Inputs
Pavement Thickness
• Modulus of Rupture
• Elastic Modulus
• K-Value of Subgrade
• Drying Shrinkage
• CoTE of Concrete
• Setting Temperature
• Construction Info
• Traffic
• Pavement Thickness
• Performance Criteria
Mechanistic Design Inputs
Performance Prediction

Development of Mechanistic-Empirical CRCP Design
13
Input Critical
Concrete Stress
Transfer function 1. Concrete strength 2. Fatigue life 3. Loading applications
Damage Distress
1. Cumulative damage 2. Distress

Critical Stresses
14

Pavement Distress Types
15
Large Surface Defects46.6%
Real Punchouts14.2%
Repair Joints 20.7%
Construction Joints18.5%
Pavement Distresses
Distress Issues Large Surface Defects are primary a result of high CTE aggregates. No longer an issue! 40% of the distresses in concrete pavements occur at joints. 40% of the punch-outs were located at transverse joints.
Punch-Outs are Primary Structural
Distress Type on CRCP
Pavements

Transfer Function
TXCRCP-ME Transfer Function
16
𝑃𝑃 = 18.985
1 + 5𝐷1.1

17
TxCRCP-ME Design Program

Program Structure
18
Instructions
Spreadsheet Tabs

“Tabs”
Inputs Temperature Soil Classification K-Table Composite K S-Table Stress Analysis Result Final Result Time vs. Punchout
19

TXCRCP-ME Inputs
Project Identification Design Parameters Design Traffic Concrete Layer Information Support Layer Information
20

21
Several of the TxCRCP-ME inputs are hard coded into the spreadsheet. These inputs include: • drying shrinkage • setting temperature • month of construction • COTE value It was decided that these inputs will not be known at the time of designing the pavement and therefore typical or specification values of for each input were set and not allowed to be changed in the spreadsheet.

Design Parameters
22
TxDOT design life for CRCP is 30 yrs
10 punchouts/mile is recommended. Lower values maybe warranted for interstate highways

Design Traffic
23
Input the total # of lanes in one direction.
Input Design Traffic in one Direction. Program will internally calculate the reduced design traffic.

Concrete Layer Information
24
Input trial slab thickness
570 psi is new flexural strength requirement.

Support Layer Information
25
Select AASHTO or USCS System of Soil Classification.
Composite K value will be calculated based on inputted values above.
Select Base Type, and Input Base Thickness and Modulus
Select Soil Classification of subgrade from dropdown list

Temperature
26
Average Weather Data for Each District

Composite K
27

Stress
28

Concrete Stresses
29
Concrete Stress Due to Traffic
Concrete Stress Due to Environmental Loading
Concrete Stress of Combined Traffic and Environmental Loading

Analysis Result
30

Final Result
31
Predicted # of Punchouts
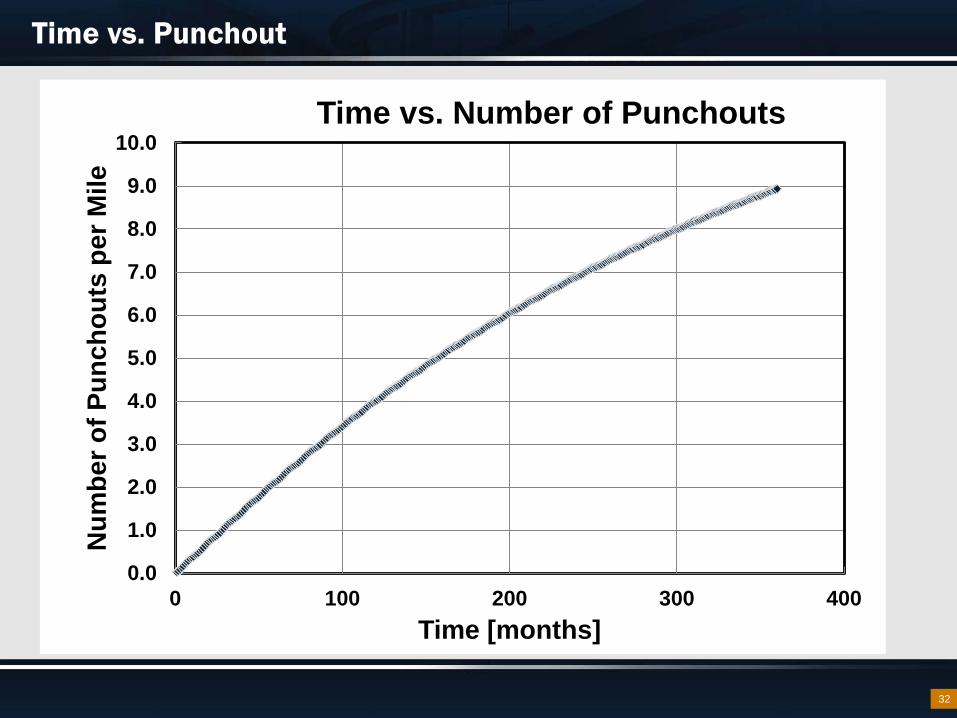
Time vs. Punchout
32
0.0
1.0
2.0
3.0
4.0
5.0
6.0
7.0
8.0
9.0
10.0
0 100 200 300 400
Num
ber o
f Pun
chou
ts p
er M
ile
Time [months]
Time vs. Number of Punchouts

TxCRCP-ME vs. AASHTO 1993 Design
33
An analysis of pavement design thickness was completed for six districts that commonly construct concrete pavement (HOU, ALT, DAL, FTW, ELP, WAC).
The pavement design thickness was determined for 26
traffic levels (1 million to 200 millions) and composite K-values of 300 pci, 500 pci, 800 pci, and 1,000 pci. Total 624 design thicknesses for each design procedure.

TxCRCP-ME vs. AASHTO 1993 Design
34
AASHTO '93 Design Inputs TxCRCP-ME Design Inputs
Input Value Input Value
30 yr Traffic Varies 30 yr Traffic Varies
K-value Varies K-value Varies
Modulus of Rupture 620 psi Modulus of Rupture 570 psi
Modulus of Elasticity 5,000, ksi Modulus of Base Varies to set K-value
Serviceability Index 2.5 Base Thickness 6 inches
Load Transfer Coeff. 2.6 Subgrade Class Varies to set K-value
Drainage Coeff. Varies with District Punch-outs per mile 10
Standard Deviation 0.39
Reliability 95%

Atlanta District CRCP Thickness Comparison
35
5
6
7
8
9
10
11
12
13
14
15
161 3 5 10 20 30 40 50 60 70 80 90 100
150
200 1 3 5 10 20 30 40 50 60 70 80 90 100
150
200 1 3 5 10 20 30 40 50 60 70 80 90 100
150
200 1 3 5 10 20 30 40 50 60 70 80 90 100
150
200
Des
ign
Slab
Thi
ckne
ss (i
nch)
ESAL (million)
AASHTO 93TxCRCP-ME
Composite K300 psi/in
Composite K500 psi/in
Composite K800 psi/in
Composite K1000 psi/in

Houston District CRCP Thickness Comparison
36
5
6
7
8
9
10
11
12
13
14
15
161 3 5 10 20 30 40 50 60 70 80 90 100
150
200 1 3 5 10 20 30 40 50 60 70 80 90 100
150
200 1 3 5 10 20 30 40 50 60 70 80 90 100
150
200 1 3 5 10 20 30 40 50 60 70 80 90 100
150
200
Des
ign
Slab
Thi
ckne
ss (i
nch)
ESAL (million)
AASHTO 93TxCRCP-ME
Composite K300 psi/in
Composite K500 psi/in
Composite K800 psi/in
Composite K1000 psi/in

TxCRCP-ME vs. AASHTO 1993 Design
37
TxCRCP-ME method is slightly more sensitive to support conditions as indicated by the thinner pavements at higher composite K-values. K-value of 300 psi/in, the TxCRCP-ME resulted
the same or slightly thicker pavement K-value of 500 psi/in, the TxCRCP-ME resulted
slightly thinner pavement

TxCRCP-ME vs. AASHTO 1993 Design
38
K-value of 800 psi/in and at low traffic volumes, the TxCRCP-ME resulted up to 1” thinner pavement. At higher traffic volumes, the pavement thickness was similar between the two methods.
K-value of 1000 psi/in and at low traffic volumes, the TxCRCP-ME method resulted in pavements that were up to 1.5” thinner pavement. At higher traffic volumes, the pavement thickness was up to 1/2” thinner compared to AASHTO ‘93.

Summary
TxCRCP-ME program is a simple MS Excel spreadsheet to perform the design. The TxCRCP-ME spreadsheet has been thoroughly testing and
compared to the current design method. The implementation includes
– Revise Pavement Design Guide – Obtain FHWA approval – Conduct Statewide trainings
For CPCD pavement design, use Darwin3.1, AASHTO 1993 Method till the TXCPCD-ME program developed.
39

Rigid Pavement and Concrete Materials Branch Construction Division, TxDOT
Andy Naranjo, P.E. Branch Manager (512) 506-5858 Hua Chen, P.E. (512) 506-5846
40