mechanistic-empirical pavement design guide … · mechanistic-empirical pavement design guide...
TRANSCRIPT

R E S E A R C H P R O G R A M S
MECHANISTIC-EMPIRICAL PAVEMENT DESIGN GUIDE FLEXIBLE PAVEMENT PERFORMANCE PREDICTION MODELS FOR MONTANA: VOLUME III FIELD GUIDE
Final Report
prepared forTHE STATE OF MONTANADEPARTMENT OF TRANSPORTATION
in cooperation withTHE U.S. DEPARTMENT OF TRANSPORTATIONFEDERAL HIGHWAY ADMINISTRATION
August 2007
prepared byHarold L. VonQuintus, PEApplied Research Associates, Inc.
James S. Moulthrop, PEFugro Consultants, Inc.
FHWA/MT-07-008/8158-3

You are free to copy, distribute, display, and perform the work; make derivative works; make commercial use of the work under the condition that you give the original author and sponsor credit. For any reuse or distribution, you must make clear to others the license terms of this work. Any of these conditions can be waived if you get permission from the sponsor. Your fair use and other rights are in no way affected by the above.

Mechanistic-Empirical Pavement Design Guide Flexible Pavement Performance Prediction Models
for Montana
Volume III Field Guide
Calibration and User’s Guide for the Mechanistic-Empirical Pavement Design Guide
Prepared for: Research Programs
Montana Department of Transportation 2701 Prospect Avenue
Helena, Montana 59620
Prepared by: Harold L. Von Quintus, PE, Applied Research Associates, Inc.
James S. Moulthrop, PE, Fugro Consultants, Inc. Fugro Consultants, Inc. 8613 Cross Park Drive Austin, Texas 78754 Project 1101-3074
August 2007

III-ii
Technical Report Documentation Page
1. Report No. FHWA/MT-07-008/8158-3
2. Government Accession No.
3. Recipient's Catalog No.
5. Report Date August 2007
4. Title and Subtitle Mechanistic-Empirical Pavement Design Guide Flexible Pavement Performance Prediction Models Volume III Field Guide – Calibration and User’s Guide for the Mechanistic-Empirical Pavement Design Guide
6. Performing Organization Code
7. Author(s) Harold L. Von Quintus, PE, Applied Research Assoc. Inc. James S. Moulthrop, PE, Fugro Consultants, Inc.
8. Performing Organization Report No.
10. Work Unit No. (TRAIS)
9. Performing Organization Name and Address Fugro Consultants, Inc. 8613 Cross Park Drive Austin TX 78754
11. Contract or Grant No. Montana Department of Transportation Contract HWY-30604-DT, Project #8158 13. Type of Report and Period Covered Final Report 2001 – 2007
12. Sponsoring Agency Name and Address Research Programs Montana Department of Transportation 2701 Prospect Avenue PO Box 201001 Helena MT 59620-1001
14. Sponsoring Agency Code 5401
15. Supplementary Notes
Research performed in cooperation with the Montana Department of Transportation and the United States Department of Transportation, Federal Highway Administration. This report can be found at http://www.mdt.mt.gov/research/projects/pave/pave_model.shtml.
16. Abstract The objective of this research study was to develop performance characteristics or variables (e.g., ride quality, rutting, fatigue cracking, transverse cracking) of flexible pavements in Montana, and to use these characteristics in the implementation of the distress prediction models or transfer functions included in the Mechanistic-Empirical Pavement Design Guide (MEPDG) software that was developed under NCHRP Project 1-37A. Reliable distress prediction models will enable the Montana Department of Transportation (MDT) to use Mechanistic-Empirical (ME) based principles for flexible pavement design and in managing their highway network. The work conducted within this study included using the MEPDG software to develop local calibration factors in the use of that software for Montana climate, structures, and materials for flexible pavements. The report is comprised of three volumes: Volume I – Executive Research Summary; Volume II – Reference Manual (which includes Selection of Distress Prediction Models, Traffic Characterization and Analyses, and Database for Calibration of ME Distress Prediction Models); and Volume III – Field Guide – Calibration and User’s Guide for the Mechanistic-Empirical Pavement Design Guide 17. Key Words Flexible Pavements, Pavement Design, Mechanistic-Empirical, Fatigue Cracking, Rutting, Thermal Cracking, IRI, Smoothness, Surface Initiated Cracks, Bottom Initiated Cracks, Calibration, Transfer Functions, Distress Prediction Models.
18. Distribution Statement Unrestricted. This document is available through the National Technical Information Service, Springfield, VA 21161.
19. Security Classif. (of this report) Unclassified.
20. Security Classif. (of this page) Unclassified.
21. No. of Pages 54
22. Price

Montana Department of Transportation Fugro Consultants, Inc. Performance Prediction Models, Contract 65A0151 Fugro 1101-3074 Volume III: Field Guide – Calibration and User’s Guide for the MEPDG
III- iii
DISCLAIMER STATEMENT (MDT)
This document is disseminated under the sponsorship of the Montana Department of Transportation and the United States Department of Transportation in the interest of information exchange. The State of Montana and the United States Government assume no liability of its contents or use thereof. The contents of this report reflect the views of the authors, who are responsible for the facts and accuracy of the data presented herein. The contents do not necessarily reflect the official policies of the Montana Department of Transportation or the United States Department of Transportation. The State of Montana and the United States Government do not endorse products of manufacturers. Trademarks or manufacturers' names appear herein only because they are considered essential to the object of this document. This report does not constitute a standard, specification, or regulation.
ALTERNATIVE FORMAT STATEMENT (MDT)
MDT attempts to provide accommodations for any known disability that may interfere with a person participating in any service, program, or activity of the Department. Alternative accessible formats of this information will be provided upon request. For further information, call (406) 444-7693, TTY (800) 335-7592, or Montana Relay at 711.
ACKNOWLEDGEMENTS This report was prepared under sponsorship of the Montana Department of Transportation. The project team recognizes and appreciates the services provided by the Montana Department of Transportation. These services included profile and deflection basins measurements, materials sampling, traffic control, and assistance with project activities to recover construction properties from selected project segments. Other individuals and organizations involved in the work and in preparation and review of the report are listed below.
Dragos Andrei, PhD, PE Weng-On Tam, PhD, PE Brian Killingsworth, PE Amy Simpson, PhD, PE Matthew Witczak, PhD Mark Hallenbeck, PhD

Montana Department of Transportation Fugro Consultants, Inc. Performance Prediction Models, Contract 65A0151 Fugro 1101-3074 Volume III: Field Guide – Calibration and User’s Guide for the MEPDG
III-iv
APPROXIMATE CONVERSIONS FROM SI UNITS Symbol When You Know Multiply By To Find Symbol
LENGTH mm millimeters 0.039 inches in m meters 3.28 feet ft m meters 1.090 yards yd km kilometers 0.621 miles mi AREA mm2 square millimeters 0.0016 square inches in2
m2 square meters 10.764 square feet ft2
m2 square meters 1.195 square yards yd2
ha hectares 2.47 acres ac km2 square kilometers 0.386 square miles mi2
VOLUME mL Milliliters 0.034 fluid ounces fl oz L liters 0.264 gallons gal m3 cubic meters 35.314 cubic feet ft3
m3 cubic meters 1.307 cubic yards yd3
MASS g grams 0.035 ounces oz kg kilograms 2.202 pounds lb Mg (or t) megagrams (metric tons) 1.103 short tons (2000 lb) T TEMPERATURE (exact degrees) oC Celsius 1.8C+32 Fahrenheit oF ILLUMINATION lx lux 0.0929 foot-candles fc cd/m2 candela/m2 0.2919 foot-Lamberts fl FORCE and PRESSURE or STRESS N Newtons 0.225 pounds lbf kPa kiloPascals 0.145 pounds per square inch lbf/in2 (psi) MPa megaPascals 0.145 kips per square inch k/in2 (ksi) DENSITY
kg/m3 pounds per cubic foot 0.062 kilograms per cubic meter lb/ft3 (pcf) *SI is the symbol for the International System of Units. Appropriate rounding should be made to comply with Section 4 of ASTM E 380. (Revised March 2003)
SI* (MODERN METRIC) CONVERSION FACTORS APPROXIMATE CONVERSIONS TO SI UNITS
Symbol When You Know Multiply By To Find Symbol LENGTH in inches 25.4 millimeters mm ft feet 0.305 meters m yd yards 0.914 meters m mi miles 1.61 kilometers km AREA in2 square inches 645.2 square millimeters mm2 ft2 square feet 0.093 square meters m2 yd2 square yard 0.836 square meters m2 ac acres 0.405 hectares ha mi2 square miles 2.59 square kilometers km2 VOLUME fl oz fluid ounces 29.57 milliliters mL gal gallons 3.785 liters L ft3 cubic feet 0.028 cubic meters m3
yd3 cubic yards 0.765 cubic meters m3
[NOTE: volumes greater than 1,000 shall be shown in m3] MASS oz ounces 28.35 grams g lb pounds 0.454 kilograms kg T short tons (2000 lb) 0.907 megagrams (metric tons) Mg (or t) TEMPERATURE (exact degrees) oF Fahrenheit 5 (F-32)/9 Celsius oC or (F-32)/1.8 ILLUMINATION fc foot-candles 10.76 lux lx fl foot-Lamberts 3.426 candela/m2 cd/m2
FORCE and PRESSURE or STRESS lbf pounds 4.45 Newtons N lbf/in2 (psi) pounds per square inch 6.89 kiloPascals kPa k/in2 (ksi) kips per square inch 6.89 megaPascals MPa DENSITY lb/ft3 (pcf) pounds per cubic foot 16.02 kilograms per cubic meter kg/m3

Montana Department of Transportation Fugro Consultants, Inc. Performance Prediction Models, Contract 65A0151 Fugro 1101-3074 Volume III: Field Guide – Calibration and User’s Guide for the MEPDG
III-v
TABLE OF CONTENTS
PREFACE TO THE MEPDG CALIBRATION AND USER’S GUIDE.............................................1 CHAPTER III-1 INTRODUCTION TO VOLUME III ......................................................................2 CHAPTER III-2 OVERVIEW OF THE NEW MECHANISTIC-EMPIRICAL PAVEMENT DESIGN GUIDE .......................................................................................................................4
III-2.1 INTRODUCTION............................................................................................................4 III-2.2 PAVEMENT DESIGN STEPS USING THE MEPDG – AN OVERVIEW........................4 III-2.3 HIERARCHICAL APPROACH FOR DETERMINING THE INPUT PARAMETERS – AN INPUT PROCEDURE ADOPTED TO FACILITATE IMPLEMENTATION.................................9
CHAPTER III-3 USER’S GUIDE FOR THE MEPDG .................................................................11 III-3.1 GENERAL PROJECT INFORMATION ........................................................................11
III-3.1.1 Project File/Name .................................................................................................11 III-3.1.2 Design Life ............................................................................................................11 III-3.1.3 Construction & Traffic Opening Dates ..................................................................11 III-3.1.4 Type of Design Strategy: New/Reconstructed Pavement and HMA Overlays......11 III-3.1.5 Site/Project Identification ......................................................................................13 III-3.1.6 Initial International Roughness Index....................................................................13
III-3.2 DESIGN CRITERIA FOR JUDGING THE ADEQUACY OF A DESIGN STRATEGY ..13 III-3.2.1 Design Criteria ......................................................................................................13 III-3.2.2 Design Reliability ..................................................................................................13
III-3.3 TRUCK TRAFFIC INPUTS ..........................................................................................14 III-3.4 CLIMATIC INFORMATION AND INPUTS....................................................................16 III-3.5 STRUCTURE ...............................................................................................................17
III-3.5.1 Depth to Water Table............................................................................................17 III-3.5.2 Interface Friction ...................................................................................................17 III-3.5.3 Condition of the Existing HMA Surface.................................................................17 III.3.5.4 Layer Material Properties ......................................................................................18
III-3.6 UNBOUND AGGREGATE BASE MATERIALS AND SOILS .......................................18 III-3.6.1 General Physical and Volumetric Properties.........................................................18 III-3.6.2 Resilient Modulus..................................................................................................18 III-3.6.3 Poisson’s Ratio .....................................................................................................20 III-3.6.4 Hydraulic Properties..............................................................................................20
III-3.7 CEMENT AGGREGATE BASE MIXTURES ................................................................21 III-3.8 HOT MIX ASPHALT MIXTURES .............................................................................21
III-3.9 AGENCY SPECIFIC CALIBRATION FACTORS .........................................................24 III-3.9.1 Rut Depth Transfer Function.................................................................................24 III-3.9.2 Load Related Fatigue Cracking Transfer Functions..............................................29 III-3.9.3 Load Related Fatigue Cracking Transfer Functions for CAM Mixtures.................32 III-3.9.4 Non-Load Related Cracking Transfer Function – Transverse Cracking ...............33
III-3.10 PERFORMANCE INDICATOR OUTPUTS OR CALCULATED DISTRESSES .........33 CHAPTER III-4 CALIBRATION GUIDE FOR THE MEPDG ......................................................35
III-4.1 WHAT DISTRESS TRANSFER FUNCTIONS REQUIRE PERIODIC CALIBRATION UPDATES / REFINEMENTS?.................................................................................................35

Montana Department of Transportation Fugro Consultants, Inc. Performance Prediction Models, Contract 65A0151 Fugro 1101-3074 Volume III: Field Guide – Calibration and User’s Guide for the MEPDG
III-vi
III-4.2 WHEN TO COMPLETE THE REGIONAL CALIBRATION UPDATE TO CONFIRM THE AGENCY SPECIFIC CALIBRATION FACTORS RECOMMENDED FOR USE IN CHAPTER III-3.9? .....................................................................................................................................36 III-4.3 HOW MUCH PERFORMANCE INDICATOR (DISTRESS) DATA IS NEEDED? HOW FREQUENTLY SHOULD THE DATA COLLECTION EFFORT BE SCHEDULED? ...............36 III-4.4 WHAT DATA ARE NEEDED FOR THE REGIONAL CALIBRATION UPDATES? ......36 III-4.5 SHOULD MORE TEST SECTIONS BE ADDED TO THE MDT CALIBRATION DATABASE? ...........................................................................................................................37 III-4.6 WHAT ARE THE BASIC STEPS INVOLVED IN THE CALIBRATION REFINEMENT PROCESS?.............................................................................................................................37 III-4.7 TEST SECTIONS ADDED TO THE CALIBRATION DATABASE.........................38
III-4.7.1 Identification of Sampling and Testing Locations..................................................39 III-4.7.2 Materials Sampling ...............................................................................................39 III-4.7.3 Materials Characterization ....................................................................................40 III-4.7.4 Pavement Profile Measurements..........................................................................43 III-4.7.5 Manual Distress Surveys ......................................................................................43 III-4.7.6 Deflection Basin Measurements with the FWD – Structural Response ................43 III-4.7.7 Laboratory Testing ................................................................................................43
III-4.8 PERFORMANCE MONITORING OF NON-LTPP TEST SECTIONS ..........................45 CHAPTER III-5 REFERENCES .................................................................................................46
Montana Department of Transportation Fugro Consultants, Inc. Performance Prediction Models, Contract 65A0151 Fugro 1101-3074 Volume III: Field Guide – Calibration and User’s Guide for the MEPDG
III-vii
LIST OF TABLES Table III-1 Hierarchical Input Levels Included in the MEPDG....................................................10 Table III-2 Primary Truck Type Normalized Volume Distribution Factors Recommended for
Montana..........................................................................................................................15 Table III-3 Monthly Distribution Factors Recommended for Montana........................................15 Table III-4 Number of Axles per Truck Type Recommended for Montana.................................16 Table III-5 Weather Stations Available in the MEPDG Software for Montana ...........................17 Table III-6 Resilient Modulus Values Derived for Selected Base Materials and Subgrade Soils
Typical for Montana ........................................................................................................19 Table III-7 Summary of the Adjustment Factors Recommended for Use in Montana to Convert
Backcalculated Layer Modulus Values to Laboratory Equivalent Modulus Values ........20 Table III-8 Maximum Density Line Gradations Using the FHWA 0.45 Power Gradation Analysis
........................................................................................................................................26 Table III-9 Fine aggregate angularity index used to adjust permanent deformation parameters,
FIndex................................................................................................................................28 Table III-10 Coarse aggregate angularity index used to adjust permanent deformation
parameters, CIndex. ..........................................................................................................28
LIST OF FIGURES Figure III-1 Conceptual flowchart of the three-stage design/analysis process for the MEPDG. ..5 Figure III-2 MEPDG program input and output layout..................................................................7 Figure III-3 Color-coded inputs to assist user in input accuracy. .................................................7 Figure III-4 Context Sensitive Help: A brief description of the input parameter. ..........................8 Figure III-5 Tool Tip Help: Provides typical ranges for each input parameter. .............................9 Figure III-6 Relationship between the elastic modulus and the tensile strength of the HMA
mixtures recovered from the non-LTPP test sections in Montana..................................22 Figure III-7 Relationship between the IDT elastic modulus and the tensile creep compliance
measured at 4°C for different loading times of the HMA mixtures recovered from the non-LTPP test sections in Montana................................................................................23
Figure III-8 Relationship between the IDT elastic modulus measured at 68°F and the tensile creep compliance measured at 14°F for different loading times of the HMA mixtures recovered from the non-LTPP test sections in Montana. ...............................................23
Figure III-9 Estimate of the Kr1 intercept parameter from VFA and gradation. ...........................27 Figure III-10 Determination of the kf1 parameter from the VFA of the lower dense graded HMA
layer................................................................................................................................30 Figure III-11 Determination of the kf3 parameter from the kf1 parameter of the lower dense
graded HMA layer...........................................................................................................31 Figure III-12 Determination of the C2 parameter from the VFA of the lower dense graded HMA
layers. .............................................................................................................................31 Figure III-13 Illustration of MEPDG output showing rutting over the design life of the pavement.
........................................................................................................................................34

Montana Department of Transportation Fugro Consultants, Inc. Performance Prediction Models, Contract 65A0151 Fugro 1101-3074 Volume III: Field Guide – Calibration and User’s Guide for the MEPDG
III-1
PREFACE TO THE MEPDG CALIBRATION AND USER’S GUIDE This document describes a methodology for pavement design that considers basic engineering (i.e., mechanistic) principles that have been validated with extensive road test performance data. This methodology is based on Mechanistic-Empirical (ME) principles for pavement design that were developed under the National Cooperative Highway Research Program (NCHRP) Project 1-37A, Development of the 2002 Guide for Design of New and Rehabilitated Pavement Structures (ARA 2004a,b,c,d), to develop an ME pavement analysis procedure using state-of-the-art distress prediction models. From the early 1960’s to 1993, all versions of the American Association of State Highway and Transportation Officials (AASHTO) Design Guide were based on limited empirical performance equations developed at the American Association of State Highway Officials (AASHO) Road Test in the late 1950’s (AASHTO 1993). The need for and benefits of a mechanistically based pavement design procedure were recognized at the time when the 1986 Design Guide was adopted (AASHTO 1986). To meet that need, the AASHTO Joint Task Force on Pavements – in cooperation with NCHRP and the Federal Highway Association (FHWA) – sponsored the development of an AASHTO ME pavement design procedure. NCHRP Project 1-37A (ARA 2004a,b,c,d) produced a guide that utilized existing mechanistic-based models and databases reflecting current state-of-the-art pavement design procedures. The Mechanistic-Empirical Pavement Design Guide (MEPDG) was completed in 2004 and released to the public for review and evaluation. A formal review has been underway by the NCHRP and has resulted in a number of improvements. Many States, including the Montana Department of Transportation (MDT), have already begun implementation activities. Version 0.9 of the software was submitted to NCHRP in July 2006 (NCHRP 2006), and Version 1.0 will be submitted near the end of 2006 to NCHRP, FHWA, and AASHTO for further consideration as an AASHTO Standard Practice. Version 0.9 was used to regionally validate and refine the calibration coefficients of each distress transfer function included in the MEPDG for flexible pavements and hot mix asphalt (HMA) overlays constructed in Montana. This report, Volume III: Field Guide, Calibration and User’s Guide, overviews and presents the information necessary for pavement design engineers in Montana to begin to use the MEPDG design and analysis method, and provides recommendations for making future updates to the calibration coefficients for the distress transfer functions for flexible pavements and HMA overlays. The FHWA has a web site for knowledge exchange for the MEPDG (http://knowledge.fhwa.dot.gov).

Montana Department of Transportation Fugro Consultants, Inc. Performance Prediction Models, Contract 65A0151 Fugro 1101-3074 Volume III: Field Guide – Calibration and User’s Guide for the MEPDG
III-2
CHAPTER III-1 INTRODUCTION TO VOLUME III An ME based design method is a rational engineering approach that has been used by some agencies to replace the empirical AASHTO design procedure (AASHTO 1993). Illinois, Kentucky, Texas, and Washington (State) Departments of Transportation (DOTs) are all agencies that use an ME based approach for pavement design. The primary advantage of an ME based design system is that it is based on pavement fatigue and deformation characteristics of all layers, rather than solely on the pavement’s surface condition (ride quality). The concepts of ME based methods allow the pavement design engineer to quantify the effect of changes in materials, load, climate, age, pavement geometry, and construction practices on pavement performance. Such a rational engineering design approach provides a more accurate and cost effective method of diagnosing pavement problems, as well as forecasting maintenance, repair, and rehabilitation needs. MDT recognized the benefits and advantages of using an ME based design method and began the process of identifying the modeling tools (e.g., pavement response model, climatic model, distress prediction models) and developing a pavement performance database for storing standard inputs. The distress prediction models, or transfer functions, provide a benefit for optimizing rehabilitation strategies and the predictions inherent in a pavement management system involving the forecasting of maintenance, repair, rehabilitation, and reconstruction costs. The pavement performance database can be used to determine the robustness and accuracy of the transfer functions to Montana’s materials and local conditions. The objective of this project was to develop performance characteristics (i.e., ride quality, rutting, fatigue cracking, transverse cracking) for flexible pavements in Montana, and to use these characteristics in the verification and calibration of the distress prediction models included in the MEPDG software developed under NCHRP Project 1-37A (ARA 2004a,b,c,d). The MEPDG software includes a uniform and comprehensive set of procedures for the design of new and rehabilitated flexible pavements. Reliable distress prediction models will enable the MDT to use ME principles for flexible pavement design and to manage their highway network. Results from this research project are contained in a three-volume report. Following is a list that describes each report volume from this project:
• Volume I is the Executive Research Summary for the overall project and summarizes all work completed under this project, Phases I and II, (Von Quintus and Moulthrop 2007a). Volume I is divided into eight chapters.
o Chapter I-1 is the introduction to the project report. o Chapter I-2 presents the experimental plan and matrix that was used to ensure
that a sufficient number of test sections were selected to cover the range of conditions encountered in Montana.
o Chapter I-3 presents the performance indicators and the prediction models selected for pavement design and management purposes.
o Chapter I-4 establishes the climatic and environmental inputs and default values needed for predicting all distresses.

Montana Department of Transportation Fugro Consultants, Inc. Performance Prediction Models, Contract 65A0151 Fugro 1101-3074 Volume III: Field Guide – Calibration and User’s Guide for the MEPDG
III-3
o Chapter I-5 summarizes the traffic analyses to determine the inputs for the load related distress prediction models.
o Chapter I-6 summarizes the materials testing and characterization to determine the inputs for each prediction model.
o Chapter I-7 summarizes the verification and calibration procedure for each distress prediction model.
o Chapter I-8 provides the conclusions and recommendations from this research project.
o Chapter I-9 is the reference section for Volume I.
• Volume II is a Reference Manual that documents some of the Supplemental Research Studies and Products that resulted from this project (Von Quintus and Moulthrop 2007b). Volume II is divided into five parts – each part summarizing a specific product from this study.
o Part I of Volume II is an introduction to Volume II. o Part II of Volume II summarizes the literature review (Task 1 of Phase I) of ME
based distress prediction models and recommends specific equations to be used for each distress.
o Part III of Volume II was prepared by the University of Washington, Washington State Transportation Center (TRAC), and discusses the analyses completed on the traffic data provided by the MDT and summarizes the input values recommended for use in pavement design in Montana.
o Part IV of Volume II discusses the ME database created for Montana. This part provides an overview of the database and defines the format for each data field and category. Part IV also lists the tests sections, both within and outside of Montana, that were used to populate the database with data used in the local calibration process.
o Part V of Volume II is the reference section for Volume II.
• Volume III (included herein) is the Field Guide (Calibration and User Guide) presenting standard practices for updating and enhancing the distress prediction models that were calibrated under this research project. This volume is divided into five chapters.
o Chapter III-1 is the introduction to Volume III. o Chapter III-2 provides an overview of the MEPDG. o Chapter III-3 is a user manual for the MEPDG. o Chapter III-4 presents the local calibration factors that were determined from this
research project for immediate use by the MDT for designing pavements and managing their highway network.
o Chapter III-5 is the reference section for Volume III.

Montana Department of Transportation Fugro Consultants, Inc. Performance Prediction Models, Contract 65A0151 Fugro 1101-3074 Volume III: Field Guide – Calibration and User’s Guide for the MEPDG
III-4
CHAPTER III-2 OVERVIEW OF THE NEW MECHANISTIC-EMPIRICAL PAVEMENT DESIGN GUIDE III-2.1 INTRODUCTION
The Calibration and User’s Guide provides information to assist MDT pavement design engineers in the use of the new MEPDG. This document provides guidance for making future refinements to either the regional or local MDT calibration factors for predicting the performance of HMA surfaced pavements and overlays. The MEPDG is based on ME design concepts. This means that the design procedure calculates pavement responses such as stresses, strains, and deflections, and then accumulates the incremental damage over time. The procedure empirically relates damage over time to pavement distresses chosen by the pavement designer. This ME based procedure is shown in flowchart form in Figure III-1.
III-2.2 PAVEMENT DESIGN STEPS USING THE MEPDG – AN OVERVIEW
Pavement design using the MEPDG is an iterative process and includes the following steps, which are the same as any other ME based design procedure:
Step 1: Select a trial design strategy, for both new pavement and rehabilitation designs. To begin with, the MDT pavement designer can use the current 1993 AASHTO Design Guide (AASHTO 1993) to determine the trial design cross section as a starting point.
Step 2: Select the appropriate distress or performance indicator criteria and design reliability level for the project. Design criteria can include alligator cracking, longitudinal cracking in the wheel paths, rut depth, transverse cracking, and smoothness. The performance indicator criteria can be obtained from MDT policies for triggering major rehabilitation or reconstruction.
Step 3: Obtain all inputs for the pavement trial design under consideration. This step can be a time consuming effort, but separates the MEPDG from most other design procedures. The MEPDG allows the designer to determine the inputs based on the importance of the project. The inputs required to run the software can be obtained using one of three levels of effort. The hierarchical input levels are defined in the Chapter III-2.3 of this document. The inputs include general project information, design criteria, traffic, climate, structure layering, and material properties. Chapter III-3 of this document is the User’s Guide for determining those inputs, and for the initial implementation of the MEPDG in Montana.

Montana Department of Transportation Fugro Consultants, Inc. Performance Prediction Models, Contract 65A0151 Fugro 1101-3074 Volume III: Field Guide – Calibration and User’s Guide for the MEPDG
III-5
Figure III-1 Conceptual flowchart of the three-stage design/analysis
process for the MEPDG.
New Pavement Design & Analyses
Rehabilitation D esign & Analyses
Climate/Environment Analysis Temperature Moisture
Traffic Analysis Truck Classification & Volume Axle Load Distribution Forecasting
New Materials Analysis Hot Mix Asphalt Portland Cement Concrete Cementitous Materials Unbound Granular Materials Soils/Embankment Materials
INPUTS FOR DESIGN
Site Investigations : Borings & Field Testing Soils Testing in Laboratory Drainage Volume Change Frost Heave Paving Materials
Select Trial Pavement Design Strategies
Pavement Evaluation : Distress Surveys Nondestructive Testing Ride Quality Testing Borings & Cores Materials Testing
Design/Failure Criteria
Design/Failure Criteria
PART 1 - EVALUATION
Pavement Response Model Calculate Stresses, Strains, Deflections
Calculate Incremental Damage
Distress Transfer Functions &
Pavement Performance Models
Reliability Analysis
Has Failure Criteria Been
Met?
NO
YES
PART 2 - ANALYSIS
Viable Design Alternative Life Cycle
Cost Analysis Engineering &
Constructability Analysis
Select Strategy
PART 3 – STRATEGY SELECTION
Policy Issues & Decisions
Modify Design Features or Materials
Alligator Cracking Longitudinal Cracking
Rutting Transverse Cracking
Smoothness
Select Strategy

Montana Department of Transportation Fugro Consultants, Inc. Performance Prediction Models, Contract 65A0151 Fugro 1101-3074 Volume III: Field Guide – Calibration and User’s Guide for the MEPDG
III-6
Step 4: Run the MEPDG software and examine the inputs and outputs for engineering reasonableness. The software estimates the damage, key distresses, and the International Roughness Index (IRI) over the design life. Examine the input summary to ensure the inputs are correct and what the designer intended. This step should be completed after each run, until the designer becomes more familiar with the program and its inputs.
Examine the outputs, also known as calculated performance indicators (pavement distresses), and IRI. In addition, the designer should review the layer modulus values over time to determine their reasonableness.
Assess if the trial design has met each of the performance indicator criteria at the design reliability level chosen for the project.
If any of the criteria has not been met, determine how this deficiency can be remedied by altering the materials used, the layering of materials, layer thickness, or other design features.
Step 5: Revise the trial design, as needed. If the trial design has either input errors, material output anomalies, or has exceeded the performance criteria at the given level of reliability, revise the inputs/trial design and rerun the program. Iterate until the performance criteria have been met. When they have been met, the trial design is a feasible design.
The inputs to the program are grouped into four categories: General Project Information (including the design criteria), Traffic, Climate, and Structure (including material properties), as shown in Figure III-2. All inputs for the software program are color coded as shown in Figure III-3. Input screens that require user entry of data are coded “Red.” Those that have default values (but not yet verified and accepted by the user) are coded “Yellow.” Default inputs that have been verified and accepted by the user when the user enters design-specific inputs, change to color code “Green.” The program will not run until all input screens are either yellow or green. After all inputs are provided for the trial design, the user starts the analysis by clicking on the “Run Analysis” button, shown in Figure III-2. When this is done, the software begins by running the traffic and climatic modules to determine the loading patterns and material properties with time. It then executes the damage analysis and the performance prediction engines for the trial design input. The program includes an “Analysis Status” window on the screen, shown in Figure III-2. This window shows the percentage complete of each computational module and estimates the amount of time remaining to complete the analysis of the trial design. The program typically takes at least 20 minutes, but less than 45 minutes, to run a 20-year flexible pavement design. When the run is complete, the user can view input and output summaries created by the program. The program creates a summary of all inputs of the trial design and provides an output summary of the distress and performance prediction in both tabular and graphical

Montana Department of Transportation Fugro Consultants, Inc. Performance Prediction Models, Contract 65A0151 Fugro 1101-3074 Volume III: Field Guide – Calibration and User’s Guide for the MEPDG
III-7
formats. All charts are plotted in Microsoft Excel and can be easily incorporated into electronic documents and reports.
General Information
Inputs•Traffic•Climate•Structure
View Results and Outputs
Status and Summary
RunAnalysis
General Information
General Information
Inputs•Traffic•Climate•Structure
Inputs•Traffic•Climate•Structure
View Results and Outputs
Status and Summary
Status and Summary
RunAnalysis
Figure III-2 MEPDG program input and output layout.
Green to indicate completed inputs
Yellow to indicate that default values will be used for the design
Red to indicate that these inputs are still needed for the design process
Green to indicate completed inputs
Yellow to indicate that default values will be used for the design
Red to indicate that these inputs are still needed for the design process
Figure III-3 Color-coded inputs to assist user in input accuracy.
Montana Department of Transportation Fugro Consultants, Inc. Performance Prediction Models, Contract 65A0151 Fugro 1101-3074 Volume III: Field Guide – Calibration and User’s Guide for the MEPDG
III-8
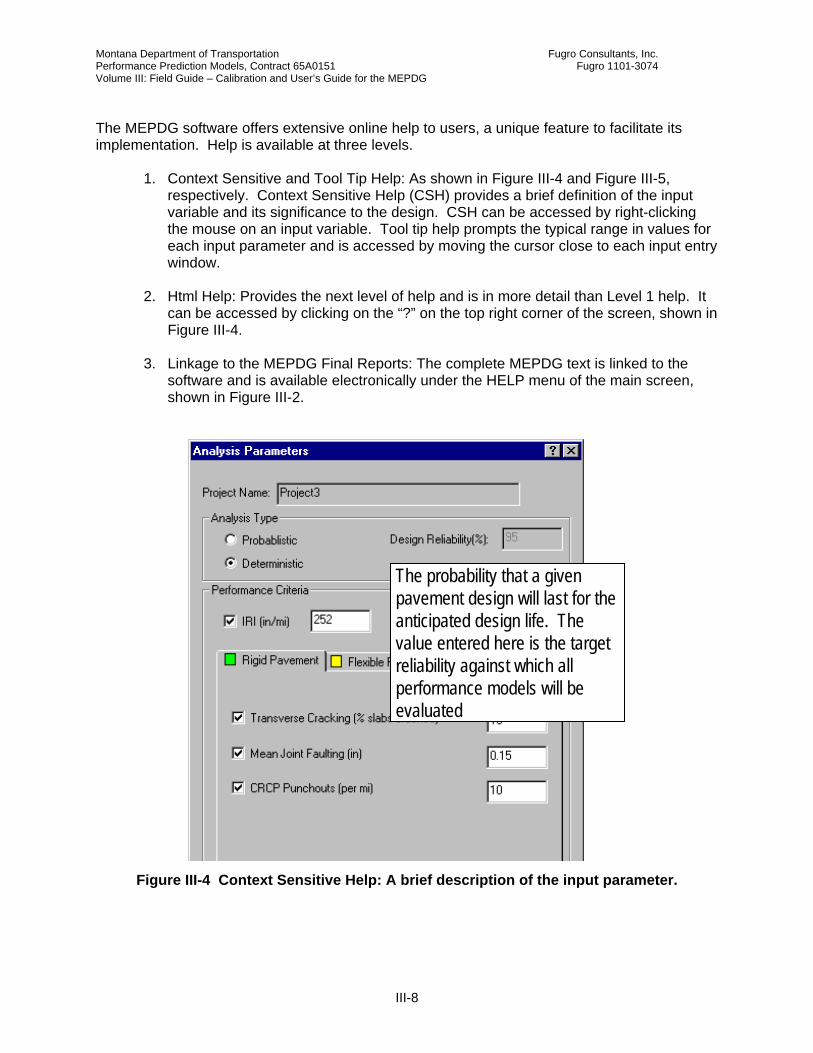
The MEPDG software offers extensive online help to users, a unique feature to facilitate its implementation. Help is available at three levels.
1. Context Sensitive and Tool Tip Help: As shown in Figure III-4 and Figure III-5, respectively. Context Sensitive Help (CSH) provides a brief definition of the input variable and its significance to the design. CSH can be accessed by right-clicking the mouse on an input variable. Tool tip help prompts the typical range in values for each input parameter and is accessed by moving the cursor close to each input entry window.
2. Html Help: Provides the next level of help and is in more detail than Level 1 help. It
can be accessed by clicking on the “?” on the top right corner of the screen, shown in Figure III-4.
3. Linkage to the MEPDG Final Reports: The complete MEPDG text is linked to the
software and is available electronically under the HELP menu of the main screen, shown in Figure III-2.
The probability that a given pavement design will last for the anticipated design life. The value entered here is the target reliability against which all performance models will be evaluated
The probability that a given pavement design will last for the anticipated design life. The value entered here is the target reliability against which all performance models will be evaluated
Figure III-4 Context Sensitive Help: A brief description of the input parameter.

Montana Department of Transportation Fugro Consultants, Inc. Performance Prediction Models, Contract 65A0151 Fugro 1101-3074 Volume III: Field Guide – Calibration and User’s Guide for the MEPDG
III-9
Figure III-5 Tool Tip Help: Provides typical ranges for each input parameter.
III-2.3 HIERARCHICAL APPROACH FOR DETERMINING THE INPUT PARAMETERS – AN INPUT PROCEDURE ADOPTED TO FACILITATE IMPLEMENTATION
The hierarchical approach for determining the input parameters needed by the MEPDG is a feature not found in existing versions of the AASHTO Guide (AASHTO 1986,1993). For the MEPDG, input level has no effect other than knowledge of the input parameter (which is important for critical inputs). This approach provides the designer with a great deal of flexibility to obtain the inputs for a project based on the importance of that project and available resources. The hierarchical approach is employed with regard to traffic, materials, and condition of existing pavement inputs. Three levels for each input group are available to the designer. These levels allow State agencies and users with minimal experience in ME based procedures and no advanced materials test equipment to use the method with little initial investment. In general, one of three levels of inputs can be used to estimate the input values. However, the highest level of input available was used in calibrating the MEPDG, both at the global and regional levels. For a given design project, inputs can be obtained using a mix of levels, such as dynamic modulus of HMA mixtures from Level 1, traffic load spectra from Level 2, and subgrade resilient
Ranges from 50 to 200
Move cursor to input box for typical input range to appear
Ranges from 50 to 200
Move cursor to input box for typical input range to appear

Montana Department of Transportation Fugro Consultants, Inc. Performance Prediction Models, Contract 65A0151 Fugro 1101-3074 Volume III: Field Guide – Calibration and User’s Guide for the MEPDG
III-10
modulus from Level 3. It is important to realize that no matter what input design levels are used, the computational algorithm for damage and distress is exactly the same. The same models and procedures are used to predict distress and smoothness no matter what input levels are used. Table III-1 defines each input level. As noted above, the input level of the current MEPDG has no other effect than accuracy of the input itself (which is important for critical inputs). A notable exception to this general rule is the thermal fracture model which has three different formulations of the design reliability equation corresponding to each of the three input levels. Future versions of the MEPDG (after Version 1.0) will attempt to link input accuracy level to design reliability for the other prediction models. This will provide a powerful tool to show the advantages of good engineering design (using Level 1 inputs) for improving the reliability of a design and the possibility to reduce pavement construction and rehabilitation costs.
Table III-1 Hierarchical Input Levels Included in the MEPDG Input Level Definition of the Level
1
Input parameter based on site specific data and information. Level 1 represents the greatest knowledge about the input parameter for the specific project. This input level would be limited to designs having usual site features, materials, or traffic conditions, and it has the highest testing (data collection costs) for determining the input value.
2 Regression equations are used to determine the input value. The data collection and testing for this input level is much simpler and less costly. This level would be used for the more routine pavement designs.
3
Level 3 inputs are based on “best-guessed” (default) values. The Level 3 inputs are based on global or regional default values. This input level has the least knowledge about the input parameter for the specific project. Initially, it is expected that this level will be the one more commonly used until agencies become familiar with the MEPDG and its multiple inputs.

Montana Department of Transportation Fugro Consultants, Inc. Performance Prediction Models, Contract 65A0151 Fugro 1101-3074 Volume III: Field Guide – Calibration and User’s Guide for the MEPDG
III-11
CHAPTER III-3 USER’S GUIDE FOR THE MEPDG As noted in Chapter III-2, the input parameters are grouped into four categories: General Project Information, Traffic, Climate, and Structure. This chapter provides guidance on determining the input parameters required to execute the MEPDG software for designing and analyzing flexible pavement and HMA overlay in Montana.
III-3.1 GENERAL PROJECT INFORMATION
III-3.1.1 Project File/Name
Once the designer starts the program and clicks on new file, the first window shown is the project file name. The designer should use a simple but descriptive name for the analysis run that can be easily identified in the projects files created by the MEPDG software.
III-3.1.2 Design Life The design life of a newly reconstructed pavement is the time from initial construction until the pavement has structurally deteriorated to the point when significant rehabilitation/reconstruction is needed. The design life of a particular trial design is defined by the initial pavement construction until a specified critical pavement condition has been reached. The software can handle design lives from 1 year (e.g., detour) to over 50 years. The design life should be a policy decision set by MDT for different types of roadways.
III-3.1.3 Construction & Traffic Opening Dates Construction completion and traffic opening dates are site construction features. These dates are keyed to the monthly traffic loadings, monthly climatic inputs (which affect all monthly layers), and subgrade modulus values. Different construction months can affect performance due to climatic conditions for that month. For most larger projects, these dates are difficult to define. The designer should select the most likely month for construction and opening the roadway to traffic. For large projects that extend into different paving seasons, each paving season should be evaluated separately. If this is unknown, then different months can be tried and the most critical selected.
III-3.1.4 Type of Design Strategy: New/Reconstructed Pavement and HMA Overlays The new and reconstructed HMA surfaced pavements, as well as HMA overlays, that were included in the calibration refinement process for Montana are listed below.

Montana Department of Transportation Fugro Consultants, Inc. Performance Prediction Models, Contract 65A0151 Fugro 1101-3074 Volume III: Field Guide – Calibration and User’s Guide for the MEPDG
III-12
1. Conventional flexible pavements: relatively thin HMA surfaces (less than 6 inches in thickness) and thick aggregate base layers (crushed gravel and soil-aggregate mixtures), greater than 10 inches in thickness. Stabilized subgrades were not included in the regional calibration refinement process for Montana. Thus, the user or designer must use experience and judgment in considering the use of stabilized subgrades with lime or lime-fly ash materials. It must also be assumed that the same calibration coefficients apply to flexible pavements with stabilized subgrade as for pavements without stabilized subgrades. The NCHRP Project 1-37A (ARA 2004a,b,c,d) found no significant difference in IRI or other distresses predicted with and without the use of stabilized subgrade soils, so that assumption is believed to be a reasonable one.
2. Deep strength flexible pavements: relatively thick HMA surface and a dense-graded
HMA base mixtures placed over an aggregate base material. Stabilized subgrades were not included in the regional calibration refinement process for Montana.
3. Semi-Rigid pavements: HMA mixtures placed over Cement Treated Base (CTB),
Cement Aggregate Mixtures (CAM), and lime-fly ash stabilized base layers with or without aggregate subbase layers. Semi-rigid pavements were not included in the original calibration completed under NCHRP Projects 1-37A (ARA 2004a,b,c,d) and 1-40D (NCHRP 2006). However, these types of pavements were included in the regional calibration refinement process for Montana. The issues and limitations in analyzing this type of structure (design strategy) is discussed in more detail under the material property inputs for the CAM layers and MDT agency specific calibration coefficients for fatigue cracking.
4. Full-Depth HMA pavements: HMA layers placed directly on the prepared embankment
or foundation soil. The only full-depth pavement included in the calibration refinement process for Montana was from the Long Term Pavement Performance (LTPP) Specific Pavement Studies (SPS)-1 (SHRP 1990) experiment located along I-15 near Great Falls. Stabilized subgrades were not included in the regional calibration refinement process for Montana.
5. In-Place pulverization of conventional flexible pavements: Cold, in-place recycling of
the HMA and existing aggregate base layers. These types of pavements were not included in the original calibration of the MEPDG. However, this rehabilitation strategy was included in the regional calibration refinement process for Montana. This type of rehabilitation strategy is considered reconstruction under the MEPDG and would be defined as a new flexible pavement.
6. HMA Overlays of all types of flexible and semi-rigid pavements.
It should be noted that pavement preservation treatments applied to the surface of HMA layers early in their life have an impact of the performance and regional calibration factors established for Montana. The designer should consider whether pavement preservation treatments will be used as part of the pavement rehabilitation design strategy. This pavement preservation issue is discussed in more detail in Chapter III-3.9, which discusses the determination of regional or agency specific calibration factors.

Montana Department of Transportation Fugro Consultants, Inc. Performance Prediction Models, Contract 65A0151 Fugro 1101-3074 Volume III: Field Guide – Calibration and User’s Guide for the MEPDG
III-13
III-3.1.5 Site/Project Identification Enter appropriate information to identify the project for pavement design purposes and future reference. The amount of detail is up to the designer.
III-3.1.6 Initial International Roughness Index The initial IRI value measured after construction is entered into the input screen for the performance indicator design criteria. This initial value should be determined from construction records of previously placed HMA surfaces. If this parameter is unknown in some areas of Montana (for example, rural routes), a value of 65 inches/mile is recommended for use for new construction. A value of 75 inches/mile is recommended for use for overlays of badly deteriorated flexible pavements.
III-3.2 DESIGN CRITERIA FOR JUDGING THE ADEQUACY OF A DESIGN STRATEGY
III-3.2.1 Design Criteria Performance criteria (or Analysis Parameters on the software window) are used to ensure that a pavement design will perform satisfactorily over its design life. Critical limits are selected and used by the designer to judge the adequacy of a design. These values should represent MDT policies regarding the condition of pavements that trigger some type of major rehabilitation/reconstruction activity. These criteria are similar to the current AASHTO Design Guide (AASHTO 1993) with the use of only the initial and terminal serviceability index levels. These distress specific design criteria should be a policy decision of MDT and can be estimated from evaluating information included in MDT pavement management database. The consequences of a project exceeding a performance criterion limit should require earlier than programmed maintenance rehabilitation.
III-3.2.2 Design Reliability The design reliability is similar, in concept, to that in the current AASHTO Design Guide (AASHTO 1993) as the probability that the pavement will not exceed performance criterion limits over the design period. For example, for rutting, a design reliability of 90 percent represents the probability (9 out of 10 projects) that the mean rutting for the project will not exceed the rut depth criteria. Design reliability must be selected for each performance indicator and different values can be entered for different distresses. It is recommended, however, that the same reliability level be used for all performance indicators. The design reliability should be selected in balance with the performance criteria. For example, the selection of a high design reliability level (e.g., 99 percent) and a very low performance criterion (3 percent alligator cracking) might make it almost impossible (i.e., very costly) to obtain an adequate design. The selection of a very high level of design reliability (e.g., > 96

Montana Department of Transportation Fugro Consultants, Inc. Performance Prediction Models, Contract 65A0151 Fugro 1101-3074 Volume III: Field Guide – Calibration and User’s Guide for the MEPDG
III-14
percent) is not recommended at the present time, because this may significantly increase construction costs.
III-3.3 TRUCK TRAFFIC INPUTS
This section summarizes the truck traffic inputs used for evaluating the adequacy of a design strategy. The following input parameters are considered site specific, and can be obtained from the Rail, Transit, and Planning Division within MDT.
• Initial two-way average annual daily truck traffic (AADTT). AADTT is a weighted average between weekday and weekend truck traffic.
• Percent trucks in design lane. Defined by the primary truck class for the roadway,
discussed below. • Percent trucks in design direction. Defined by the primary truck class for the roadway. • Operational speed. This parameter is usually taken as the posted speed limit. Lower
speeds result in higher incremental damage values calculated by the MEPDG. It is suggested that MDT define the operational speeds used to evaluate trial designs in the MDT pavement design manual.
• Growth of truck traffic. Estimate the amount of increase in truck traffic over time. The
growth of truck traffic is difficult to accurately estimate because there are many site and social-economic factors that cannot be predicted 20+ years into the future.
The truck traffic study (Part 3 of Volume II) found that a significant number of double-bottom trailers use Montana roadways. These multi-trailer trucks should be tracked and considered separately in pavement design. It is recommended that MDT use three truck categories for design evaluations: single unit trucks, combination trucks, and multi-trailer trucks. These three categories were used to verify and calibrate the distress transfer functions in the MEPDG to Montana conditions. Table III-2 summarizes the different loading groups and the Truck Traffic Classification (TTC) groups that were used in the calibration refinement completed for Montana. These TTC groups are recommended for use when actual truck traffic data are unavailable for use in design (i.e., use the TTC group number when data is not available).

Montana Department of Transportation Fugro Consultants, Inc. Performance Prediction Models, Contract 65A0151 Fugro 1101-3074 Volume III: Field Guide – Calibration and User’s Guide for the MEPDG
III-15
Table III-2 Primary Truck Type Normalized Volume Distribution Factors Recommended for Montana
Roadway Description Primary Truck Class
Percentage of Trucks in That Class
Applicable TTC Group
9 75 13 15 Interstate Highways & Primary
Arterials; Heavier Volumes 10 5 TTC-11
9 65 13 20 Primary & Secondary Arterials;
Moderate Volumes 10 10 TTC-5
9 45 13 15 Secondary Arterials; Lower
Volumes 5,6 5 TTC-8
6, 5 55 9 30 Local Routes with Low Truck
Volumes 13 5 TTC-15
Many truck traffic input parameters are required for predicting the distresses of flexible pavements and HMA overlays, but are difficult to determine and are not readily available. Thus, the following default values are recommended. These values were used in the regional calibration refinement performed for Montana:
• Monthly distribution factors: Table III-3. • Hot tire inflation pressure: 120 psi. • Number of axles per truck type: Table III-4. • Tandem axle spacing: 51.6 inches. • Tridem axle spacing: 49.2 inches. • Quad axle spacing: 49.2 inches. • Dual tire spacing: 13 inches. • Truck traffic wander standard deviation: 10 in. • Normalized axle load distribution for each type of axle: the normalized axle load
distributions included in the MEPDG were used for the calibration refinement in Montana.
Table III-3 Monthly Distribution Factors Recommended for Montana
Month Single Unit Trucks (Truck Class 5 or 6)
Combination Trucks (Truck Class 9 or 10)
Multi-Trailer Trucks (Truck Class 13)
January 0.84 0.91 0.99 February 0.79 0.92 0.89 March 0.76 0.94 0.88 April 0.86 0.99 0.999 May 1.10 1.06 1.03 June 1.30 1.09 0.96 July 1.43 1.02 0.92 August 1.39 1.06 1.11 September 1.14 1.00 1.09 October 1.06 1.15 1.12 November 0.87 1.00 1.00 December 0.76 0.84 0.87
Montana Department of Transportation Fugro Consultants, Inc. Performance Prediction Models, Contract 65A0151 Fugro 1101-3074 Volume III: Field Guide – Calibration and User’s Guide for the MEPDG
III-16
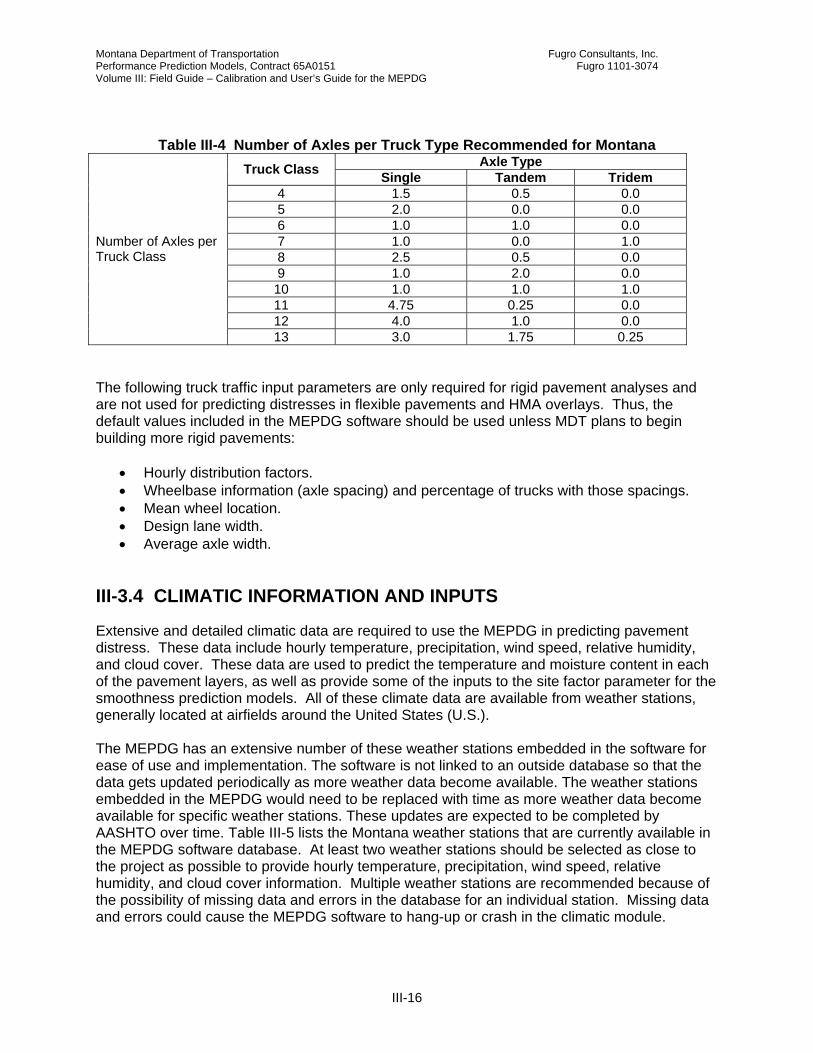
Table III-4 Number of Axles per Truck Type Recommended for Montana
Axle Type Truck Class Single Tandem Tridem 4 1.5 0.5 0.0 5 2.0 0.0 0.0 6 1.0 1.0 0.0 7 1.0 0.0 1.0 8 2.5 0.5 0.0 9 1.0 2.0 0.0 10 1.0 1.0 1.0 11 4.75 0.25 0.0 12 4.0 1.0 0.0
Number of Axles per Truck Class
13 3.0 1.75 0.25 The following truck traffic input parameters are only required for rigid pavement analyses and are not used for predicting distresses in flexible pavements and HMA overlays. Thus, the default values included in the MEPDG software should be used unless MDT plans to begin building more rigid pavements:
• Hourly distribution factors. • Wheelbase information (axle spacing) and percentage of trucks with those spacings. • Mean wheel location. • Design lane width. • Average axle width.
III-3.4 CLIMATIC INFORMATION AND INPUTS
Extensive and detailed climatic data are required to use the MEPDG in predicting pavement distress. These data include hourly temperature, precipitation, wind speed, relative humidity, and cloud cover. These data are used to predict the temperature and moisture content in each of the pavement layers, as well as provide some of the inputs to the site factor parameter for the smoothness prediction models. All of these climate data are available from weather stations, generally located at airfields around the United States (U.S.). The MEPDG has an extensive number of these weather stations embedded in the software for ease of use and implementation. The software is not linked to an outside database so that the data gets updated periodically as more weather data become available. The weather stations embedded in the MEPDG would need to be replaced with time as more weather data become available for specific weather stations. These updates are expected to be completed by AASHTO over time. Table III-5 lists the Montana weather stations that are currently available in the MEPDG software database. At least two weather stations should be selected as close to the project as possible to provide hourly temperature, precipitation, wind speed, relative humidity, and cloud cover information. Multiple weather stations are recommended because of the possibility of missing data and errors in the database for an individual station. Missing data and errors could cause the MEPDG software to hang-up or crash in the climatic module.

Montana Department of Transportation Fugro Consultants, Inc. Performance Prediction Models, Contract 65A0151 Fugro 1101-3074 Volume III: Field Guide – Calibration and User’s Guide for the MEPDG
III-17
Table III-5 Weather Stations Available in the MEPDG Software for Montana City Latitude
(Degrees.Minutes) Longitude
(Degrees.Minutes) Elevation, ft. Number of Months Available
Baker 46.22 -104.15 2963 97* Billings 45.49 -108.32 3582 116 Bozeman 45.47 -111.09 4468 116 Butte 45.58 -112.30 5539 64 Cut Bank 48.37 -112.23 3855 62 Dillon 45.16 -112.33 5221 105 Glasgow 48.13 -106.37 2271 116 Great Falls 47.28 -111.23 3673 116 Havre 48.34 -109.47 2584 116 Helena 46.37 -111.58 3867 116 Lewistown 47.03 -109.28 4146 63 Livingston 45.42 -110.27 4655 65 Miles City 46.26 -105.53 2630 64 Missoula 46.55 -114.05 3202 114 Wolf Point 48.05 -105.34 1984 90 *Weather station has missing month within the database.
III-3.5 STRUCTURE
The inputs to define the structure are straightforward and include the material type and thickness of each layer included in the design strategy. The material properties needed for each layer are discussed in separate parts of this document. The only other structure-related input parameters needed are the depth to a water table, interface friction between two adjacent layers, and condition of the existing surface in the case of rehabilitation designs.
III-3.5.1 Depth to Water Table The depth to a water table is measured from borings taken along the project location. The depth should be measured as close as practical because the depth has an effect on the moisture content of the unbound layers above the water table.
III-3.5.2 Interface Friction The layer interface friction input parameter is difficult to define and measure. All of the global and regional calibration studies have been completed assuming full friction between each layer; an interface friction value of 1.0 in the MEPDG. It is suggested that this value be used for all designs completed in Montana unless debonding is expected (e.g., not including a tack coat between an existing HMA surface and HMA overlay). Interface friction values less than 1.0 will increase HMA rutting and fatigue cracking of the surface layer.
III-3.5.3 Condition of the Existing HMA Surface The condition of the existing surface is estimated from the distress measurements (condition surveys) or can be determined from backcalculated elastic modulus. Although each can be

Montana Department of Transportation Fugro Consultants, Inc. Performance Prediction Models, Contract 65A0151 Fugro 1101-3074 Volume III: Field Guide – Calibration and User’s Guide for the MEPDG
III-18
used, it is suggested that the results from condition survey measurements be used to quantify the condition of the existing surface – in other words, an input Level 3 is used. During the regional calibration refinement it was found that the backcalculated layer modulus values were generally higher than those measured in the laboratory, which implies that the layer has no damage. Obviously, this observation does not meet the criteria of engineering reasonableness.
III.3.5.4 Layer Material Properties It should be remembered that all material properties entered into the program for each layer represent the values that exist at construction. Obviously, the in-place properties will be unavailable to the designer because the project has yet to be built. Thus, input Levels 2 or 3 will need to be used for design. The remaining parts of this chapter provide recommendations for estimating the critical properties of the paving layers.
III-3.6 UNBOUND AGGREGATE BASE MATERIALS AND SOILS
III-3.6.1 General Physical and Volumetric Properties The following unbound layer and embankment soil properties are site specific and easily determined from laboratory tests that MDT does on a day to day basis.
• Gradation of the material. • Atterberg limits tests. • Maximum dry density or the in-place density at the time of construction. • Optimum water content or the in-place water content at the time of construction.
A subsurface investigation and field test program should be planned to determine the above inputs for the project. If a field investigation is not completed prior to design, the geotechnical engineer can provide values for these inputs based on historical information. The geotechnical engineer should be consulted to determine representative values for each design segment along the project. For the crushed gravel and other aggregate base materials used in Montana, the mid-range of the specifications or construction data from previous projects can be used to determine the input values.
III-3.6.2 Resilient Modulus For new alignments or new designs, the default resilient modulus values included in the MEPDG (Level 3 inputs) can be used, or the modulus can be estimated from physical properties of the material (Level 2 inputs). Table III-6 provides the suggested mean value and the range of those values for the different unbound materials that were used in the calibration refinement for Montana.
Montana Department of Transportation Fugro Consultants, Inc. Performance Prediction Models, Contract 65A0151 Fugro 1101-3074 Volume III: Field Guide – Calibration and User’s Guide for the MEPDG
III-19
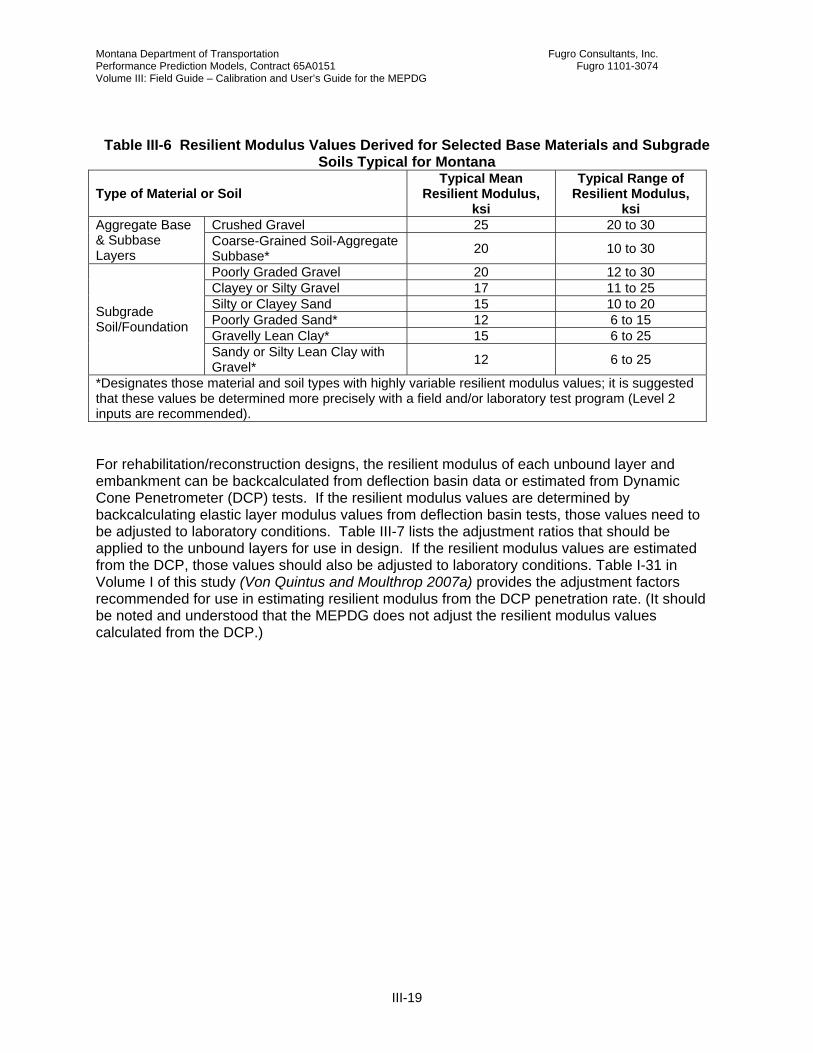
Table III-6 Resilient Modulus Values Derived for Selected Base Materials and Subgrade
Soils Typical for Montana
Type of Material or Soil Typical Mean
Resilient Modulus, ksi
Typical Range of Resilient Modulus,
ksi Crushed Gravel 25 20 to 30 Aggregate Base
& Subbase Layers
Coarse-Grained Soil-Aggregate Subbase* 20 10 to 30
Poorly Graded Gravel 20 12 to 30 Clayey or Silty Gravel 17 11 to 25 Silty or Clayey Sand 15 10 to 20 Poorly Graded Sand* 12 6 to 15 Gravelly Lean Clay* 15 6 to 25
Subgrade Soil/Foundation
Sandy or Silty Lean Clay with Gravel* 12 6 to 25
*Designates those material and soil types with highly variable resilient modulus values; it is suggested that these values be determined more precisely with a field and/or laboratory test program (Level 2 inputs are recommended). For rehabilitation/reconstruction designs, the resilient modulus of each unbound layer and embankment can be backcalculated from deflection basin data or estimated from Dynamic Cone Penetrometer (DCP) tests. If the resilient modulus values are determined by backcalculating elastic layer modulus values from deflection basin tests, those values need to be adjusted to laboratory conditions. Table III-7 lists the adjustment ratios that should be applied to the unbound layers for use in design. If the resilient modulus values are estimated from the DCP, those values should also be adjusted to laboratory conditions. Table I-31 in Volume I of this study (Von Quintus and Moulthrop 2007a) provides the adjustment factors recommended for use in estimating resilient modulus from the DCP penetration rate. (It should be noted and understood that the MEPDG does not adjust the resilient modulus values calculated from the DCP.)

Montana Department of Transportation Fugro Consultants, Inc. Performance Prediction Models, Contract 65A0151 Fugro 1101-3074 Volume III: Field Guide – Calibration and User’s Guide for the MEPDG
III-20
Table III-7 Summary of the Adjustment Factors Recommended for Use in Montana to
Convert Backcalculated Layer Modulus Values to Laboratory Equivalent Modulus Values Adjustment Factor, (MR/E) Layer & Material
Type Layer Description FHWA Pamphlet
Montana Sites
Granular base under a Portland Cement Concrete (PCC) surface
1.32 ---
Granular base under a CAM layer, semi-rigid pavement
--- 0.75
Granular base above a stabilized material (a Sandwich Section)
1.43 ---
Aggregate Base Layers
Granular base under an HMA surface or base 0.62 0.60 Soil under a CAM layer, no granular base --- 1.00 Soil under a semi-rigid pavement with a granular base/subbase
--- 0.50
Soil Under a Stabilized Subgrade 0.75 --- Soil under a full-depth HMA pavement 0.52 ---
Subgrade Soil/Foundation
Soil under flexible pavement with a granular base/subbase
0.35 0.50
Cement Aggregate Base Layer
Cement stabilized or treated aggregate layers --- 1.50
HMA surface and base layers, 41 °F 1.00 0.9 HMA surface and base layers, 77 °F 0.36 0.6
HMA Mixtures
HMA surface and base layers, 104 °F 0.25 0.5
III-3.6.3 Poisson’s Ratio Poisson’s ratio is another input parameter needed for the unbound materials and soils. The following provides the values that were used during the regional calibration refinement effort and are recommended for use in future design runs.
• Low plasticity to high plasticity fine-grained soils with moisture contents higher than the optimum value, 0.45.
• Low plasticity to high plasticity fine-grained soils with moisture contents below the plastic limit, 0.35.
• Fine-grained soil or coarse-grained soil with more than 35 percent fines or material passing the number 200 sieve, 0.40.
• Soil-Aggregate base materials which are predominately coarse-grained, 0.35. • Crushed gravel or crushed stone base materials, 0.30.
III-3.6.4 Hydraulic Properties The other input parameters for the unbound layers are more difficult to measure and were not readily available for use in the regional calibration refinement effort. For these inputs, the default values recommended for use in the MEPDG were used to predict the distresses. Therefore, the MEPDG default values also are recommended for use in Montana for the following properties.

Montana Department of Transportation Fugro Consultants, Inc. Performance Prediction Models, Contract 65A0151 Fugro 1101-3074 Volume III: Field Guide – Calibration and User’s Guide for the MEPDG
III-21
• Soil saturated hydraulic conductivity. • Soil-water characteristics curves.
III-3.7 CEMENT AGGREGATE BASE MIXTURES
The compressive strength (modulus of rupture), elastic modulus, and density are required inputs to the MEPDG for any cementitious or pozzolonic stabilized material. However, any changes made to the default values are not saved by the MEPDG software. The values entered always divert back to the default values when the software is run. As a result, the regional calibration refinement factors were used to reflect different quality CAM materials for the semi-rigid pavement structures used in Montana. In summary, the input parameters for the CAM materials should not be changed for analyzing semi-rigid pavements. The agency specific calibration factors are determined based on the quality of the CAM material. The recommended values are discussed under the Agency Specific Calibration Adjustment Factors (see Chapter III-3.9.3).
III-3.8 HOT MIX ASPHALT MIXTURES Like the other layers, both volumetric and engineering properties are required for each HMA layer to execute the MEPDG. The volumetric properties include air voids, effective asphalt content by volume, aggregate gradation, mix density, and asphalt grade. The volumetric properties entered into the program should be representative of the mixture after compaction at the completion of construction. Obviously, the project specific values will be unavailable to the designer because the project has yet to be built. However, these parameters should be available from previous construction records. The following volumetric equations (Equations III-1 through III-5) can be used to estimate the input parameters. Air Voids, Va:
100*1 ⎟⎟⎠
⎞⎜⎜⎝
⎛−=
mm
mba G
GV (III-1)
and Void In Mineral Aggregate, VMA:
( )
⎟⎟⎠
⎞⎜⎜⎝
⎛−=
sb
smb
GPGVMA 100 (III-2)
and Effective Asphalt Content by Volume, Vbe: abe VVMAV −= (III-3) and Voids Filled with Asphalt, VFA:
100*⎟⎠⎞
⎜⎝⎛ −
=VMA
VVMAVFA a (III-4)
and

Montana Department of Transportation Fugro Consultants, Inc. Performance Prediction Models, Contract 65A0151 Fugro 1101-3074 Volume III: Field Guide – Calibration and User’s Guide for the MEPDG
III-22
Effective Specific Gravity of the Combined Aggregate Blend, Gse:
b
b
mm
bse
GP
G
PG−
−= 100
100 (III-5)
Where: Va = Air voids. VMA = Voids in mineral aggregate. Vbe = Effective asphalt content by volume. VFA = Voids filled with asphalt. Gmb = Bulk specific gravity of the HMA mixture. Gmm = Maximum theoretical specific gravity of the HMA mixture. Gb = Specific gravity of the asphalt. Gsb = Bulk specific gravity of the combined aggregate blend. Ps = Percentage of aggregate in mix by weight, % (Ps=100-Pb). Pb = Percentage of total asphalt in mix by weight, %. The dynamic modulus, creep compliance, and indirect tensile strength are required engineering properties that are unavailable for most mixtures. It is recommended that the Level 2 or 3 inputs be used to estimate these properties. Mixtures were tested within the regional calibration refinement study and used to predict fracture and permanent deformation of the HMA mixtures. Figures III-6 through III-8 are examples of the correlations used.
Figure III-6 Relationship between the elastic modulus and the tensile strength of the HMA mixtures recovered from the non-LTPP test sections in Montana
0
100
200
300
400
500
600
700
800
0 500 1000 1500 2000 2500 3000
IDT Elastic Modulus, ksi
Tens
ile S
treng
th, p
si
Expon. (Series1)
Roundup Surface Mix

Montana Department of Transportation Fugro Consultants, Inc. Performance Prediction Models, Contract 65A0151 Fugro 1101-3074 Volume III: Field Guide – Calibration and User’s Guide for the MEPDG
III-23
05
101520253035404550
1000 1500 2000 2500 3000
Elastic Modulus, at 32F, ksi
Cre
ep C
ompl
ianc
e at
32F
, E-
07Load Time = 1- sec. Load Time = 32 sec.Load Time = 100 sec. Log. (Load Time = 1- sec.)Log. (Load Time = 32 sec.) Log. (Load Time = 100 sec.)
Figure III-7 Relationship between the IDT elastic modulus and the tensile creep
compliance measured at 4°C for different loading times of the HMA mixtures recovered from the non-LTPP test sections in Montana.
02468
101214
400 600 800 1000 1200 1400
IDT Elastic Modulus at 68F, ksi
Cre
ep C
ompl
ianc
e at
14F
, E-0
7
Loading Time = 10 sec. Loading Time = 32 sec.Loading Time = 100 sec. Log. (Loading Time = 100 sec.)Log. (Loading Time = 32 sec.) Log. (Loading Time = 10 sec.)
Figure III-8 Relationship between the IDT elastic modulus measured at 68°F and the
tensile creep compliance measured at 14°F for different loading times of the HMA mixtures recovered from the non-LTPP test sections in Montana.

Montana Department of Transportation Fugro Consultants, Inc. Performance Prediction Models, Contract 65A0151 Fugro 1101-3074 Volume III: Field Guide – Calibration and User’s Guide for the MEPDG
III-24
The following summarizes the recommended input parameters and values for the HMA mixtures.
• Aggregate gradation: Use either the values that are near the mid-range of the project specifications or the average values from previous construction records for a particular type of mix.
• Air voids, effective asphalt content by volume, density: Use the average values from
previous construction records for a particular type of HMA mixture.
• Poisson’s ratio: Use the temperature calculated values within the MEPDG – check the box to use the predictive model to calculate Poisson’s ratio from the pavement temperatures.
• Dynamic modulus, creep compliance, indirect tensile strength: Use Level 2 or 3 inputs.
These include gradation, which is either the asphalt grade or the test results from the Dynamic Shear Rheometer (DSR).
• Surface shortwave absorptivity: Use default value set in MEPDG (0.85).
• Coefficient of thermal contraction of the mix: Use default values set in MEPDG for
different mixtures and aggregates.
• Reference temperature: Use 70°F.
• Thermal conductivity of asphalt: Use default value set in program (0.67 BTU/ft*h*°F).
• Heat capacity of asphalt: Use default value set in program (0.23 BTU/lb*°F).
III-3.9 AGENCY SPECIFIC CALIBRATION FACTORS
The following provides guidance on estimating the regional or agency specific calibration adjustment factors that can be used in the MEPDG. The designer should click on the tools feature of the entry screen for the MEPDG software, as shown in Figure III-2. A drop-down list of items will appear. The designer then clicks on the calibration item. The agency specific calibration values can then be viewed and entered for each distress transfer function. These are provided on a distress transfer function basis for each distress.
III-3.9.1 Rut Depth Transfer Function Rut depths are predicted within each unbound and HMA layer within the pavement structure. The following provides the agency specific calibration factors suggested for use for the unbound layers.
• Bs1 = 0.2 for coarse-grained soils (onscreen: subgrade rutting tab). • Bs2 = 0.2 for fine-grained soils (onscreen: subgrade rutting tab).

Montana Department of Transportation Fugro Consultants, Inc. Performance Prediction Models, Contract 65A0151 Fugro 1101-3074 Volume III: Field Guide – Calibration and User’s Guide for the MEPDG
III-25
It is suggested, but not mandatory, that the Corp of Engineers method be used to ensure that there is sufficient cover to protect the unbound materials and soils. This check is not included in the MEPDG software and would need to be completed external to the MEPDG using Equation III-6 (Equation I-13 in Volume I [Von Quintus and Moulthrop 2007a]: ( ) ( ) 082.4955.01110259.1 −−= vRf MxN ε (III-6) Where:
Nf = Number of load applications. MR = Resilient modulus of the unbound layer or soil. εv = Vertical strain computed at the surface of the unbound layer or soil.
A step-by-step basis is provided for estimating the agency specific kr1, kr2, and kr3 calibration factors – noted in Equation III-7 below (Equation I-11 in Volume I [Von Quintus and Moulthrop 2007a]) – for the HMA mixtures for predicting rut depth. The following coefficients are the values from the global calibration effort from NCHRP Project 1-40D (NCHRP 2006) and are the exponents in Equation III-7. kr1 = -3.35412. kr2 = 0.4791 (the exponent above the N term). kr3 = 1.5606 (the exponent above the T term). rr TNkh HMArzrHMAHMApHMAp
32 *5606.1*4791.035412.3)(1)()( 10 ββεβε −==Δ (III-7)
Where: Δp(HMA) = Accumulated permanent or plastic vertical deformation in the HMA
layer/sublayer, in. εp(HMA) = Accumulated permanent strain, in/in. h(HMA) = Total HMA thickness, in. εr(HMA) = Resilient strain, in/in. βr, β2r, β3r, = Local or mixture field calibration constants; all of these constants were set to
1.0 for the global calibration efforts completed under NCHRP Projects 1-37A (ARA 2004a,b,c,d) and 1-40D (NCHRP 2006).
kz = Depth confinement factor. ( ) D
z DCCk 328196.021 +=
( ) 342.174868.21039.0 21 −+−= HMAHMA HHC
( ) 428.277331.10172.0 22 +−= HMAHMA HHC
D = Depth below the surface, in. HHMA =Total HMA thickness, in. N = Number of load repetitions. T = Mixing temperature, °F.
Step 1: Determine the gradation index for each HMA mixture. The gradation index is defined as the absolute difference between the actual gradation and the maximum density line (FHWA 0.45 power gradation chart) using sieve sizes 3/8, #4, #8, #16, #30, and #50. The gradation index is used to refine the adjustment factors for rutting predictions (see Equation III-8):

Montana Department of Transportation Fugro Consultants, Inc. Performance Prediction Models, Contract 65A0151 Fugro 1101-3074 Volume III: Field Guide – Calibration and User’s Guide for the MEPDG
III-26
∑=
−=50#
8/3)45.0(
iii PPGI (III-8)
Where: GI = Gradation Index. Pi = Percent passing sieve i, %. Pi(0.45) = Percent passing sieve i for the FHWA 0.45 maximum density line (refer to
Table III-8), %.
Table III-8 lists the percent passing for these sieve sizes that follow the maximum density line as defined by the FHWA 0.45 power gradation curves for different size mixtures.
Table III-8 Maximum Density Line Gradations Using the FHWA 0.45 Power
Gradation Analysis Percent Passing for Mixtures with Different Top Sieve Sizes Sieve Size, in. 3/8 ½ ¾ 1 1 ½ 1 ¾
1 ¾ --- --- --- --- --- 100 1 ½ --- --- --- --- 100 93 1 --- --- --- 100 83 78 ¾ --- --- 100 88 73 68.5 ½ 100 83.5 73.5 61 57 3/8 100 88 73.5 64.5 53.5 50
No. 4 74 64.5 54 47 39 36.3 No. 8 54.5 47 39 34 28.5 26.5
No. 16 39.5 34 28.5 25.5 20.5 18.5 No. 30 29 25.5 21 18 15.5 14 No. 50 20.5 18 15 13.5 11 10
Step 2: Determine the design air voids for each HMA mixture. The design air void level used within an agency is a policy decision that does not vary by mixture type. The design air void level is usually 4 percent for most all dense-graded HMA mixtures, and is obtained from the mix design method. Some agencies vary this value between surface and base mixtures.
Step 3: Determine the saturation (optimum) effective asphalt content by weight for each HMA mixture. The saturation asphalt content is dependent on the surface area and other surface characteristics of the aggregate. Surface area and texture are difficult to define, so a specific compaction effort has been used in previous work.
In the Marshall mixture design method, the saturation asphalt content was defined as 75-blows per face for all dense-graded mixtures, which is used for most high volume roadways. For the Superpave mix design method, there is insufficient data to determine this value, and only one compaction effort is generally available for a specific mixture. For simplicity and ease of use, this value is defined at N-design. Step 4: Make an adjustment to the kr1 parameter based on volumetric properties and gradation for each HMA layer by using Equation III-9.
( )( ) ( )[ ] 4488.3105093.1 0057.15213.0
13
1 −= −bearr VVKxLogk (III-9)
Where: kr1 = Agency-specific calibration factor.

Montana Department of Transportation Fugro Consultants, Inc. Performance Prediction Models, Contract 65A0151 Fugro 1101-3074 Volume III: Field Guide – Calibration and User’s Guide for the MEPDG
III-27
Kr1 = Intercept coefficient, from Figure III-9. Va = Air voids after construction, %.
Vbe = Effective asphalt content by volume at construction (the in place value), %. NOTE: The Voids Filled with Asphalt (VFA) in Figure III-9 represent the in-place mixture
after construction.
Figure III-9 Estimate of the Kr1 intercept parameter from VFA and gradation.
NOTE: For maximum nominal size aggregates greater than 19mm, the #4 sieve size constitutes the break between the course and fine aggregate. For maximum size aggregates less than 19mm, the #8 sieve is the break point.
Step 5: Make an adjustment to the kr2 parameter (exponent of temperature) based on volumetric properties and gradation for each HMA layer by using Equation III-10.
( )( )IndexIndexoptb
b
designa
ar CF
PP
VVk
25.1
)(
25.0
)(2 5606.1 ⎟
⎟⎠
⎞⎜⎜⎝
⎛⎟⎟⎠
⎞⎜⎜⎝
⎛= (III-10)
Where: kr2 = Intercept coefficient, from Figure III-9. Va = Air voids after construction. Va(design) = Design air voids used to select the design asphalt content, %. Pb = Asphalt content by weight at construction (the in place value), %. Pb(opt) = Saturation asphalt content by weight, %. FIndex = Fine aggregate angularity index, refer to Table III-9. CIndex = Coarse aggregate angularity index, refer to Table III-10.
22.22.42.62.8
33.23.43.63.8
4
30 32 34 36 38 40 42 44 46 48 50 52 54 56 58 60 62 64 66 68 70 72 74 76 78 80 82 84
Voids Filled with Asphalt (VFA), %
Fine Gradation Coarse Gradation
Log
Kr1
Coe
ffici
ent

Montana Department of Transportation Fugro Consultants, Inc. Performance Prediction Models, Contract 65A0151 Fugro 1101-3074 Volume III: Field Guide – Calibration and User’s Guide for the MEPDG
III-28
Table III-9 Fine aggregate angularity index used to adjust permanent deformation parameters, FIndex
Fine Aggregate Angularity Gradation – External to restricted zone. < 45 > 45 Dense Grading – External to Restricted Zone 1.00 0.90 Dense Grading – Through Restricted Zone 1.05 1.0
Table III-10 Coarse aggregate angularity index used to adjust permanent deformation parameters, CIndex.
Percent Crushed Material with Two Faces Type of Gradation 0 25 50 75 100
Well Graded 1.1 1.05 1.0 1.0 0.9 Gap Graded 1.2 1.1 1.05 1.0 0.9
Step 6: Make an adjustment to the kr3 parameter based on volumetric properties and gradation for each HMA layer by using Equation III-11.
( ) ⎟⎟⎠
⎞⎜⎜⎝
⎛=
)(33 4791.0
optb
brr P
PKk (III-11)
Where: kr3 = Agency-specific calibration factor. Kr3 = Slope coefficient; for fine-graded mixtures and coarse-graded aggregate
blends with a GI<20, Kr3=0.40; for coarse-graded mixtures with a GI between 20 and 40, Kr3=0.70; and for coarse-graded aggregate blends with a GI>40, Kr3=0.80.
Pb = Asphalt content by weight at construction (the in place value), %. Pb(opt) = Saturation or optimum asphalt content by weight, %.
There is insufficient data to determine or even estimate the Kr3 coefficient for coarse, gap-graded aggregate blends and fine-graded blends with a high gradation index. In the interim, it is recommended that a Kr3 value of 0.80 be used for the gap-graded aggregate blends and a value of 0.40 be used for all fine-graded blends.
Step 7: Most flexible pavements and HMA overlays consist of multiple HMA layers, each with different volumetric properties. The k coefficients are determined for each HMA layer. However, only one set of permanent deformation constants (coefficients) can be used as inputs to the MEPDG software for all HMA mixtures within the pavement structure. Determination of the adjustment coefficients should be based on the HMA mixtures that make up the upper 8 inches by calculating a weighted adjustment based on layer thickness. The following guidelines are provided to determine the k coefficients for a specific run.
• Calculate the k coefficients for each HMA layer and use a weighted value based on thickness for the HMA mixtures that compose the top 8 inches. It should be noted that a depth of 8 inches is based on previous experience and engineering judgment. This thickness guideline needs to be verified and confirmed in future studies.

Montana Department of Transportation Fugro Consultants, Inc. Performance Prediction Models, Contract 65A0151 Fugro 1101-3074 Volume III: Field Guide – Calibration and User’s Guide for the MEPDG
III-29
• HMA surface layers that are less than 1.0 inches in thickness and underlain by 3 inches of dense graded HMA mixtures should be ignored in calculating the k values.
• Asphalt Treated Open-Graded Drainage Layers:
o Asphalt treated open-graded drainage layers that are 8 inches or greater below dense-graded HMA mixtures should be ignored in making these calculations.
o Asphalt treated open-graded drainage layers that are within 8 inches of the
surface should be included in calculating the k values. It should be noted that a thickness of 8 inches of dense graded mixtures above any drainage layer is based on previous experience and engineering judgment. This guideline needs to be verified and confirmed in future studies.
III-3.9.2 Load Related Fatigue Cracking Transfer Functions The following provides a step-by-step basis for estimating the agency specific kf1, kf2, and kf3 calibration factors for the load related cracking equations.
Step 1: Most flexible pavements and HMA overlays consist of multiple HMA layers, each with different fracture and volumetric properties. The kf coefficients for the bottom-up fatigue cracking are determined for the lower dense-graded HMA layers, because it is assumed that this cracking initiates at the bottom of the dense graded layers.
Step 2: Calculate the VFA for each dense graded HMA layer. Step 3: Determine the kf1 parameter based on VFA for the lower HMA layers, refer to Figure III-10. When multiple HMA layers have been placed, a weighed average value based on thickness is determined for the lower HMA layers. This value is used to replace the global calibration factor included in the MEPDG software. Step 4: Determine the kf3 parameter from the kf1 parameter for the lower HMA layer, refer to Figure III-11. This value is used to replace the global calibration factor included in the MEPDG software. Step 5: No adjustments are made to the kf2 parameter. Step 6: Determine the C2 coefficient for the bottom up cracking mechanism based on VFA for the lower HMA layer, refer to Figure III-12. The C1 and C4 regression coefficients derived from the NCHRP Project 1-40D (NCHRP 2006) recalibration effort remain unchanged. Bottom-up cracking is the area of alligator cracking predicted by the MEPDG. This value is used to replace the global calibration factor included in the MEPDG software. For the top-down cracking mechanism (longitudinal cracks in the wheel path), the C2 parameter is left unchanged. The MEPDG did not accurately predict the test sections with longitudinal cracking in the wheel path and predicted this type of cracking for those sections that have

Montana Department of Transportation Fugro Consultants, Inc. Performance Prediction Models, Contract 65A0151 Fugro 1101-3074 Volume III: Field Guide – Calibration and User’s Guide for the MEPDG
III-30
not exhibited this type of cracking. As a result, there is little confidence in the predictive capability of the MEPDG for this type of cracking. If the designer elects to consider this type of cracking, the evaluation of the design strategy and HMA mixture should be carefully considered.
Figure III-10 Determination of the kf1 parameter from the VFA of the lower dense
graded HMA layer.
-3.2-3
-2.8-2.6-2.4-2.2
-2-1.8-1.6-1.4-1.2
-1-0.8-0.6-0.4-0.2
00.20.40.60.8
11.2
30 32 34 36 38 40 42 44 46 48 50 52 54 56 58 60 62 64 66 68 70 72 74 76 78 80Voids Filled with Asphalt (VFA), %
Fine-Graded Mixtures Coarse-Graded Mixtures
Log
Kf1
Frac
ture
Coe
ffici
ent

Montana Department of Transportation Fugro Consultants, Inc. Performance Prediction Models, Contract 65A0151 Fugro 1101-3074 Volume III: Field Guide – Calibration and User’s Guide for the MEPDG
III-31
0.81
1.21.41.61.8
22.22.42.62.8
33.23.43.63.8
44.2
30 32 34 36 38 40 42 44 46 48 50 52 54 56 58 60 62 64 66 68 70 72 74 76 78 80
Voids Filled with Asphalt (VFA), %
C2 C
oeff
icie
nt fo
r Bot
tom
Up
Fatig
ue C
rack
ing
Without Preservation Activities Preservation Program
Figure III-11 Determination of the kf3 parameter from the kf1 parameter of the lower dense graded HMA layer.
Figure III-12 Determination of the C2 parameter from the VFA of the lower dense graded HMA layers.
0.60.70.80.9
11.11.21.31.41.51.61.71.81.9
-3 -2.5 -2 -1.5 -1 -0.5 0 0.5 1
Log kf1 Fracture Coefficient
f3
Fine-Graded Coarse-Graded
kf3
Frac
ture
Coe
ffici
ent

Montana Department of Transportation Fugro Consultants, Inc. Performance Prediction Models, Contract 65A0151 Fugro 1101-3074 Volume III: Field Guide – Calibration and User’s Guide for the MEPDG
III-32
Step 7: If an asphalt treated open-graded drainage layer is present in the pavement structure, this layer should be treated as a good quality crushed stone base material. The high air voids in this layer will result in premature or accelerated fatigue cracking, even for thick HMA layers, which is inconsistent with previous experience and those test sections with Permeable Asphalt Treated Base (PATB) layers included in the LTPP SPS-1 experiment (SHRP 1990).
III-3.9.3 Load Related Fatigue Cracking Transfer Functions for CAM Mixtures
Very few of the test sections included in the calibration refinement study had any appreciable fatigue cracking to accurately calibrate this prediction model. The fatigue cracking model for semi-rigid pavements was never calibrated under the original calibration work completed under NCHRP Projects 1-37A (ARA 2004a,b,c,d) and 1-40D (NCHRP 2006). Sites were selected in Montana and adjacent States to calibrate this model. Unfortunately most of these sites exhibited little load related cracking, as reported in the LTPP database. Only one of the Montana sections had any fatigue cracking recorded on the semi-rigid pavement structures. Based on the data available for regional calibration refinement, the following are the State agency values recommended for use in predicting the fatigue cracking of semi-rigid pavements.
• For High Strength CAM Mixtures (intact cores can be recovered and mixture has cement contents greater than 6 percent, with compressive strengths generally greater than 1,000 psi):
o Bc1 = 0.85. o Bc2 = 1.10.
• For CAM Mixtures with moderate levels of cement (intact cores can be recovered and mixture has cement contents greater than 4 percent but less than 6 percent, with compressive strengths generally greater than 300 psi but less than 1,000 psi):
o Bc1 = 0.75. o Bc2 = 1.10.
• For Low Strength CAM Mixtures (intact cores cannot be recovered and mixture has cement contents generally less than 4 percent, with compressive strengths less than 300 psi):
o Bc1 = 0.65. o Bc2 = 1.10.

Montana Department of Transportation Fugro Consultants, Inc. Performance Prediction Models, Contract 65A0151 Fugro 1101-3074 Volume III: Field Guide – Calibration and User’s Guide for the MEPDG
III-33
III-3.9.4 Non-Load Related Cracking Transfer Function – Transverse Cracking
The distress transfer function using Level 3 inputs was included in the regional calibration refinement for Montana HMA mixtures because the creep compliance and indirect tensile strengths were unavailable for all of the LTPP test sections. The local calibration factor recommended for use in Montana is listed below for all three input levels, which should be confirmed as more data become available with time.
• Distress transfer function: o Bt3 = 0.25 (Thermal Cracking Tab).
• Local calibration factors:
o Bt1 = 0.25. o Bt2 = 0.25. o Bt3 = 0.25.
III-3.10 PERFORMANCE INDICATOR OUTPUTS OR CALCULATED DISTRESSES
The MEPDG software analyzes a given trial design that is input and predicts its performance in terms of key distress types and smoothness. In addition, materials properties and other factors are output on a month by month basis over the design period. The designer should examine the output materials properties and other factors to assess their reasonableness. For flexible pavements, the output provides the HMA Dynamic Modulus (E*) and the resilient modulus (Mr) for unbound layers for each month over the design period. Moisture content and frost condition greatly affects the unbound materials Mr. The designer should examine the key distress type outputs and smoothness to see if they are meeting the performance criteria. The distress and IRI are output at the end of each month over the design period. The number of cumulative Heavy Trucks (Class 4 and above) are shown in the design traffic lane. The predicted distresses are presented graphically in the Results portion of the screen, as shown in Figure III-2. Figure III-13 shows an output for rutting for an HMA pavement. The horizontal line represents the limiting performance criteria at a given level of reliability. If total rutting at the specified reliability is less than the red line over the entire design period, then the design is acceptable from that standpoint.

Montana Department of Transportation Fugro Consultants, Inc. Performance Prediction Models, Contract 65A0151 Fugro 1101-3074 Volume III: Field Guide – Calibration and User’s Guide for the MEPDG
III-34
Figure III-13 Illustration of MEPDG output showing rutting over the design life of the pavement.
Another important output is the Reliability assessment which can be seen under the Reliability Tab. The Distress Target and its corresponding Reliability Target are the first right hand columns listed followed by the Distress Predicted and the Reliability Predicted. If the Reliability Predicted is greater than the Reliability Target then the pavement passes. If the reverse is true then the pavement fails. If any key distress fails, the designer must alter the trial design to correct the problem. This “trial and error” process allows the pavement designer to essentially “build the pavement in his/her computer” prior to building it in the field to see if it will perform. If there is a problem with the design and materials for the given subgrade, climate, and traffic, it can be corrected and an early failure avoided.
Permanant Deformation: Rutting
0.00
0.10
0.20
0.30
0.40
0.50
0.60
0 18 36 54 72 90 108 126 144 162 180 198
Pavement Age (month)
Rut
ting
Dep
th (i
n)
AC Rutting Design Value = 0.25Total Rutting Design Limit = 0.5
Permanant Deformation: Rutting
Rut
ting
Dep
th (i
n)
Pavement Age (month)
SubTotalACSubTotalBaseSubTotalSG
Total RuttingTotalRutReliabilityTotal Rutting Design Limit

Montana Department of Transportation Fugro Consultants, Inc. Performance Prediction Models, Contract 65A0151 Fugro 1101-3074 Volume III: Field Guide – Calibration and User’s Guide for the MEPDG
III-35
CHAPTER III-4 CALIBRATION GUIDE FOR THE MEPDG Chapter III-4 provides guidance and a listing of questions or steps for completing future updates for evaluating and revising, if needed, the agency specific calibration factors suggested for use for each distress transfer function.
III-4.1 WHAT DISTRESS TRANSFER FUNCTIONS REQUIRE PERIODIC CALIBRATION UPDATES / REFINEMENTS?
The MEPDG distress transfer functions have been validated for use in Montana. The area of alligator cracking (bottom-up cracking mechanism), HMA rut depth, transverse cracking, and smoothness prediction models are believed to be adequate for use in Montana. It is recommended that MDT move forward with using these distress prediction models in analyzing and designing flexible pavements and HMA overlays. Chapter III-3 of this document provides the regional or agency specific calibration factors for these prediction models. Agency specific calibration factors were developed for the fatigue cracking of semi-rigid pavements and rutting in the unbound layers and embankment soils. However, few of the calibration test sections had any appreciable rutting below the HMA layers, and all of the semi-rigid pavements located in Montana have yet to exhibit levels of fatigue cracking considered high enough to trigger some type of rehabilitation activity. As a result, it is suggested that MDT conduct future calibration updates to confirm the agency specific calibration factors for using these prediction models in Montana; fatigue cracking of semi-rigid pavements and rutting in the unbound paving layers of the conventional HMA pavements. The longitudinal cracking within the wheel paths (top-down cracking mechanism) was found to be inadequate. Significant lengths of longitudinal cracking were predicted for sections with minimal longitudinal cracks, whereas no cracking was predicted for the sections with significant longitudinal cracking. Most of the calibration test sections with the higher lengths of longitudinal cracks were located in adjacent States and Canadian provinces. No changes were made to the global calibration factors for the longitudinal cracking model. It is recommended that MDT postpone future updates to this prediction model until the distress mechanism included in the MEPDG has been revised or confirmed. The remainder of Chapter III-4 focuses on the steps to conduct future calibration refinement updates for the fatigue cracking of semi-rigid pavements and rutting in the unbound paving layers and embankment soils.

Montana Department of Transportation Fugro Consultants, Inc. Performance Prediction Models, Contract 65A0151 Fugro 1101-3074 Volume III: Field Guide – Calibration and User’s Guide for the MEPDG
III-36
III-4.2 WHEN TO COMPLETE THE REGIONAL CALIBRATION UPDATE TO CONFIRM THE AGENCY SPECIFIC CALIBRATION FACTORS RECOMMENDED FOR USE IN CHAPTER III-3.9?
A calibration update should be scheduled after five percent or greater fatigue cracking is observed on about half of the semi-rigid pavements located in Montana and established within the MDT MEPDG calibration database. In 2005, none of the 8 semi-rigid pavement test sections have exhibited any fatigue cracking, and only 4 of the 11 semi-rigid sections located in adjacent States exhibited fatigue cracking in excess of 1 percent. Even all of those sections still have less than four percent fatigue cracking. Based on the performance of the LTPP semi-rigid sites located in adjacent States, the Montana semi-rigid sections are not expected to exhibit this amount of fatigue cracking until after five more years (2010).
III-4.3 HOW MUCH PERFORMANCE INDICATOR (DISTRESS) DATA IS NEEDED? HOW FREQUENTLY SHOULD THE DATA COLLECTION EFFORT BE SCHEDULED?
MDT should continue to collect distress data on all non-LTPP test sections established for calibration refinement use in Montana. The condition surveys should be made annually to ensure that the time can be determined when cracking starts to occur. Profile measurements should be made every other year. The rut depths measured in 2005 at all of the sites were less than 0.20 inches, with the exception of one test section, the Lavina West site. All of these sites are still considered smooth because little distress has occurred along these sections.
III-4.4 WHAT DATA ARE NEEDED FOR THE REGIONAL CALIBRATION UPDATES?
The answer to this question depends on the time at which fatigue cracking starts to occur along the semi-rigid pavements. Certainly, condition surveys and profile measurements will be needed to establish the performance trends for each test section. Construction and Falling Weight Deflectometer (FWD) deflection basin data have been measured at each of these sites and need not be measured at the frequencies recommended for the condition surveys and profile measurements. It is recommended that the deflection basin data be measured along each non-LTPP test section after the fatigue cracking exceeds about 5 percent on four of these semi-rigid sections.

Montana Department of Transportation Fugro Consultants, Inc. Performance Prediction Models, Contract 65A0151 Fugro 1101-3074 Volume III: Field Guide – Calibration and User’s Guide for the MEPDG
III-37
III-4.5 SHOULD MORE TEST SECTIONS BE ADDED TO THE MDT CALIBRATION DATABASE?
With time, MDT may decide to add some projects to evaluate some unique design strategy or feature. Any new section that is added to the calibration database will need to contain the same information and data collected for the non-LTPP test sections. This information and data are summarized at the end of this chapter.
III-4.6 WHAT ARE THE BASIC STEPS INVOLVED IN THE CALIBRATION REFINEMENT PROCESS?
Following is a list of the basic steps that need to be considered within the calibration refinement process.
1. Continue to collect traffic, distress, and profile (smoothness and rut depths) on the non-LTPP test sections (see Chapter III-4.3). All data should be entered into the MDT MEPDG calibration database. After the calibration refinement process has been scheduled (see Chapter III-4.2), extract additional distress and performance data from the LTPP database for those sections located in Montana and in adjacent States and Canadian provinces. These data should also be entered into the MDT MEPDG database (see Chapter III-4.4). All data should be checked for accuracy and reasonableness prior to entering it into the database. Trends in the measured distress data should be checked. Any potential data anomalies (irrational trends, significantly decreasing areas of alligator cracking, or rut depths with time) should be checked and confirmed. If irrational trends have been influenced by some confounding factor that can not be considered by the MEPDG, those sections should be considered for removal from the calibration refinement.
2. For those test sections with load related cracking, cores should be taken through the
cracks to determine where the cracks initiated or to confirm the direction of crack propagation. In addition, blocks of HMA should be sawed from the pavement in order that the rutting can be measured in the individual layers. Blocks were not recovered from any of the non-LTPP test sections, because the total rutting measured at the surface was minimal and would have been difficult to measure below the surface after sample recovery. This future activity will be important to segregate surface-initiated cracks from bottom-initiated cracks. Cores were taken during the field work for this study, but no load-related fatigue cracks were found in the non-LTPP test sections. Forensic studies were planned within the LTPP program to answer such questions as: a) where did the cracks initiate, b) what portion of the total rutting measured at the surface can be attributed to the individual layers, and c) did any construction anomalies contribute to the occurrence of distresses measured at the surface?
3. Predict the performance of the individual test sections that are added to the MDT
database with time using the inputs established for the initial runs and the User Guide provided in Chapter III-3 and in III-4.5. The initial inputs should be reviewed to ensure that they have not changed (e.g., back-casting the air voids at construction).

Montana Department of Transportation Fugro Consultants, Inc. Performance Prediction Models, Contract 65A0151 Fugro 1101-3074 Volume III: Field Guide – Calibration and User’s Guide for the MEPDG
III-38
4. Copy all of the predictions of distress into an Excel spreadsheet for ease of use and analysis. The 50 percentile distress predictions should be used in the data analyses and in determining whether local calibration adjustments need to be revised. In addition, copy all of the distress measurements into the same spreadsheet for comparative analyses to the predicted values.
5. Compare the predictions for each performance indicator to the measurements, and
compute the residual error, bias, and standard error for each distress prediction model. 6. If significant bias exists, adjust the coefficients and/or exponents (agency specific
values) for the distress transfer functions to eliminate the bias. It is suggested that MDT initially revise the coefficients of each prediction model for simplicity. A fitting process of the model constants are evaluated based on a goodness of fit criteria on the best set of values for the coefficients of the model. The methods of evaluation make use of either the analytical process for models that suggest a linear relationship or make use of a numerical optimization for models that suggest non-linear relationship. The analytical approach is based on least squares using multiple regression analysis, stepwise regression analysis, principal components analysis, and/or principal component regression analysis. The numerical optimization includes methods such as the steepest descent or pattern search. It is suggested that the analytical approach be used because this was used in the calibration refinement conducted for Montana under this study.
7. After any bias has been eliminated, compute the standard error and compare that error
to the global standard error reported under NCHRP Project 1-40D (NCHRP 2006), as well as the standard error reported for the Montana agency specific calibration factors. These are given in Volume I. Assuming that the standard errors are significantly different, MDT will need to decide whether the updated calibration coefficients are to be used with the existing standard error terms, or whether to use the refined calibration coefficients and standard errors determined from the updated calibration refinement study. Both values can be entered into the MEPDG.
III-4.7 TEST SECTIONS ADDED TO THE CALIBRATION DATABASE
Data collected at additional sites should be entered into the MDT database. For consistency between the data collected for the LTPP sections and any additional section, LTPP procedures should be followed. The primary reference documents for adding test sections to the calibration database are publications available from FHWA, the Strategic Highway Research Program (SHRP), and MDT:
• LTPP Field Guide (SHRP 1992). • LTPP Data Collection Guide (FHWA 1993a). • LTPP Laboratory Guide (SHRP 1993). • LTPP Profile Measurements Manual (FHWA 2004). • LTPP Distress Identification Manual (FHWA 1993b). • LTPP FWD Measurements Manual (FHWA 2005). • MDT Standard Specifications (MDT 2006).
Montana Department of Transportation Fugro Consultants, Inc. Performance Prediction Models, Contract 65A0151 Fugro 1101-3074 Volume III: Field Guide – Calibration and User’s Guide for the MEPDG
III-39
III-4.7.1 Identification of Sampling and Testing Locations Typical pavement sections should be laid out according to the LTPP Field Guide (SHRP 1992).
III-4.7.2 Materials Sampling Pavement materials from additional projects should be recovered according to the procedures outlined in the LTPP Field Guide (SHRP 1992), “Section 3 Field Operations” and “Appendix B Field Material Sampling and Testing Program and Detailed Sampling Plans by GPS Experiment Type.” Trenches or test pits are recommended so that individual pavement layer rutting can be measured. Trenches/test pits are not needed for new projects because no rutting or cracking will have occurred at the time of construction. Trenches/test pits are only needed for forensic evaluations or investigations of older projects that have exhibited high levels of rutting or cracking. Use of the MDT Standard Specifications for Road and Bridge Construction (MDT 2006), “Section 207 Culvert Excavation and Trench Excavation,” is recommended for digging and recovering material from trenches. For test pits, the procedures to be followed are detailed in the LTPP Field Guide (SHRP 1992), “Section 3.5 Test Pit Excavation and Sampling” and “Appendix D Operational Guidelines on Test Pits.”
• Additional sections that contain HMA above an unbound granular base (or a pulverized base that has not been stabilized with PCC) will have the test pits dug at the locations noted for the test pits for GPS-1 sections.
• Additional sections that contain HMA above a bound base (or a pulverized base that has
been stabilized with PCC) will have the test pits dug at the locations noted for the test pits for GPS-2 sections.
Cores and auguring at the additional sections will be taken in accordance with the LTPP Field Guide (SHRP 1992),“Section 3.3 Coring of Pavement Surface and Bound (Treated) Layers,” “Section 3.4 Auguring of Subsurface Layers for Bulk Sampling,” and “Appendix B Field Material Sampling and Testing Program and Detailed Sampling Plans by GPS Experiment Type.”
• Additional sections that contain HMA above an unbound granular base (or a pulverized base that has not been stabilized with PCC) will have the cores and samples taken at the locations noted for the test pits for GPS-1 sections.
• Additional sections that contain HMA above a bound base (or a pulverized base that has
been stabilized with PCC) will have the cores and samples taken at the locations noted for the test pits for GPS-2 sections.
To determine the percentage of load-related cracks that start at the top of the pavement and propagate downward (as opposed to the classical assumption of bottom-up cracking), 6-in diameter cores should be taken directly on top of load-related cracks. Six random locations on top of load-related cracks outside the test section (but within the sampling areas) should be identified and full depth cores extracted. Crack initiation and propagation direction should be

Montana Department of Transportation Fugro Consultants, Inc. Performance Prediction Models, Contract 65A0151 Fugro 1101-3074 Volume III: Field Guide – Calibration and User’s Guide for the MEPDG
III-40
reported for each core. Crack width at the initiation point and depth of crack from the initiation point should also be reported. In addition, 6-in diameter cores will be taken for use in determining the low-temperature creep compliance and tensile strength for the thermal cracking model. Six random locations will be identified outside the test section (but within the sampling areas) and full depth cores extracted.
III-4.7.3 Materials Characterization Establishing the baseline conditions of additional calibration sections is an important step towards collecting usable data for the calibration analysis. The data that must be collected includes initial construction data, current (and historical if available) deflection data, current (and historical) ride quality data, transverse profiles, and detailed distress surveys. Initial construction information is critical to the overall calibration process. This information includes quality assurance data from the initial construction such as, but not limited to:
1. Laboratory determined volumetric properties (at the time of construction). 2. Gradation of the aggregate blend, determined from bulk HMA mixture, if available. 3. Effective asphalt content by volume. 4. Asphalt binder properties, not just the performance grade used. 5. In place density of each layer (HMA and unbound paving layers). 6. In place moisture content of each unbound paving layer and the embankment soil. 7. Thickness of each layer. 8. Initial smoothness values, if recorded.
The availability of data will be dependent upon the individual pavement layer. The important part to recognize is that as much information as possible should be collected on each layer to assist in fully characterizing the pavement. The data will be collected in accordance with the LTPP Data Collection Guide (FHWA 1993a), “Chapter 2 Inventory Data Collection.” Following is a listing of the current laboratory and field test protocols for different paving materials, recommended practices, and other documents needed for using the MEPDG. The user needs to execute only those for the hierarchical input levels selected (see Chapter III-2.3 of this report). Laboratory Materials Characterization
Unbound Materials and Soils AASHTO T 88 Particle Size Analysis of Soils AASHTO T 89 Determining the Liquid Limits of Soils AASHTO T 90 Determining the Plastic Limit and Plasticity Index of Soils AASHTO T 99 The Moisture-Density Relations of Soils Using a 5.5 lb Rammer
and a 12 in Drop AASHTO T 100 Specific Gravity of Soils AASHTO T 180 Moisture-Density Relations of Soils Using a 10 lb Rammer and an
18 in Drop AASHTO T 190 Resistance R-Value and Expansion Pressure of Compacted Soils AASHTO T 193 California Bearing Ratio

Montana Department of Transportation Fugro Consultants, Inc. Performance Prediction Models, Contract 65A0151 Fugro 1101-3074 Volume III: Field Guide – Calibration and User’s Guide for the MEPDG
III-41
AASHTO T 203 Soil Investigation and Sampling by Auger Borings AASHTO T 206 Penetration Test and Split-Barrel Sampling of Soils AASHTO T 207 Thin-Walled Tube Sampling of Soils AASHTO T 215 Permeability of Granular Soils (Constant Head); Saturated
Hydraulic Conductivity AASHTO T 258 Determining Expansive Soils AASHTO T 265 Laboratory Determination of Moisture Content of Soils AASHTO T 307 Resilient Modulus of Unbound Granular Base/Subbase Materials
and Subgrade Soils ASTM D 2487 Classification of Soils for Engineering Purposes Treated & Stabilized Materials/Soils ASTM C 593 Unconfined Compressive Strength of Lime-Cement-Fly Ash
Stabilized Soils ASTM D 1633 Compressive Strength of Molded Soil-Cement Cylinders ASTM D 5102 Unconfined Compressive Strength of Compacted Soil-Lime
Mixtures Asphalt Binder AASHTO T 49 Penetration of Bituminous Materials AASHTO T 53 Softening Point of Bitumen (Ring and Ball Apparatus) AASHTO T 201 Kinematic Viscosity of Asphalts AASHTO T 202 Viscosity of Asphalts by Vacuum Capillary Viscometer AASHTO T 228 Specific Gravity of Semi-Solid Bituminous Materials AASHTO T 315 Determining the Rheological Properties of Asphalt Binder Using a
Dynamic Shear Rheometer (DSR) AASHTO T 316 Brookfield Viscosity ASTM D 5404 Recovery of Asphalt from Solution Using the Rotavapor Apparatus Hot Mix Asphalt & Asphalt Treated/Stabilized Mixtures AASHTO T 27 Sieve Analysis of Fine and Coarse Aggregate AASHTO T 84 Specific Gravity and Absorption of Fine Aggregate AASHTO T 85 Specific Gravity and Absorption of Coarse Aggregate AASHTO T 164 Quantitative Extraction of Bitumen from Bituminous Paving
Mixtures AASHTO T 166 Bulk Specific Gravity of Compacted Bituminous Mixtures Using
Saturated Surface-Dry Specimens AASHTO T 209 Maximum Specific Gravity of Bituminous Paving Mixtures AASHTO T 269 Percent Air Voids in Compacted Dense and Open Bituminous
Paving Mixtures AASHTO T 304 Uncompacted Void Content of Fine Aggregate AASHTO T 308 Asphalt Content AASHTO T 312 Preparing and Determining the Density of Hot-Mix (HMA)
Specimens by Means of the Superpave Gyratory Compactor AASHTO T 322 Determining the Creep Compliance and Strength of Hot Mix
Asphalt (HMA) Using the Indirect Tensile Test Device AASHTO TP 61 Determining the Percentage of Fracture in Coarse Aggregate AASHTO TP 62 Dynamic Modulus ASTM D 6307 Asphalt Content of Hot-Mix Asphalt by Ignition Method

Montana Department of Transportation Fugro Consultants, Inc. Performance Prediction Models, Contract 65A0151 Fugro 1101-3074 Volume III: Field Guide – Calibration and User’s Guide for the MEPDG
III-42
ASTM D 6925 Preparation and Determination of the Relative Density of Hot Mix Asphalt (HMA) Specimens by Means of the Superpave Gyratory Compactor
Cement Treated/Stabilized Base Mixtures AASHTO T 22 Compressive Strength of Cylindrical Concrete Specimens AASHTO T 97 Flexural Strength of Concrete (Using Simple Beam with Third-
Point Loading) AASHTO T 121 Weight per Cubic Foot, Yield, and Air Content (Gravimetric) of
Concrete AASHTO T 152 Air Content of Freshly Mixed Concrete by the Pressure Method AASHTO T 196 Air Content of Freshly Mixed Concrete by the Volumetric Method AASHTO T 198 Splitting Tensile Strength of Cylindrical Concrete Specimens AASHTO TP 60 Coefficient of Thermal Expansion ASTM C 469 Elastic Modulus Thermal Properties of Paving Materials ASTM D 2766 Determination of Heat Capacity ASTM E 1952 Determination of Thermal Conductivity
In-Place Materials/Pavement Layer Characterization
ASTM D 4694 Deflections with a Falling Weight Type Impulse Load Device ASTM D 4748 Determining the Thickness of Bound Pavement Layers Using
Short-Pulse Radar ASTM D 5858 Guide for Calculating In Situ Equivalent Elastic Moduli of
Pavement Materials Using Elastic Theory ASTM D 6951 Standard Test Method for Use of the Dynamic Cone Penetrometer
in Shallow Pavement Applications Material Specifications
AASHTO M 320 Specification for Performance Graded Asphalt Binder AASHTO M 323 Superpave Volumetric Mixture Design
Recommended Practices and Terminology
AASHTO PP 37 Standard Practice for Determination of International Roughness Index for Quantifying Roughness of Pavements
AASHTO PP 40 Standard Practice for Application of Ground Penetrating Radar (GPR) to Highways
AASHTO PP 46 Recommended Practice for Geosynthetic Reinforcement of the Aggregate Base Course of Flexible Pavement Structures
AASHTO R 13 Standard Recommended Practice for Conducting Geotechnical Subsurface Investigations
ASTM D 3282 Classification of Soils and Soil-Aggregate Mixtures for Highway Construction Purposes
ASTM D 5434 Field Logging of Subsurface Explorations of Soil and Rock ASTM E 1778 Pavement Distress ASTM E 1926 Computing International Roughness Index of Roads from
Longitudinal Profile Measurements

Montana Department of Transportation Fugro Consultants, Inc. Performance Prediction Models, Contract 65A0151 Fugro 1101-3074 Volume III: Field Guide – Calibration and User’s Guide for the MEPDG
III-43
NCHRP 1-40B Standard Practice for Conducting Local or Regional Calibration Parameters for the M-E PDG (Draft to be submitted in 2007)
III-4.7.4 Pavement Profile Measurements Two profiles will be taken of the additional sections, which include longitudinal for ride quality or smoothness and transverse for rutting. In addition to rutting measured on the surface with a profile device at various locations along the test section, individual pavement layer rutting should be measured either from trenches or test pits dug during the field data collection at each end of the section for those test sections that have not been recently constructed. Ride quality is determined from longitudinal profile measurements with the vehicle-based Profilometer®. Measurements will be made in accordance with the latest version of the LTPP Profile Measurements Manual (FHWA 2004) and the LTPP Data Collection Guide (FHWA 1993a), “Section 3.1 Profile Measurement.” It is recommended that the automatic data acquisition system be utilized; specifically, the photocell event marker (reflective tape) should be used to initiate data collection at the same spot on recursive measurements. Rutting will be measured within the test section limits utilizing the Dipstick transversely across the section at 50-ft increments (or using current MDT procedures). The procedures for transverse Dipstick® measurements are found in the LTPP Profile Measurements Manual (FHWA 2004), “Section 3 Profile Measurements Using the FACE Dipstick®.
III-4.7.5 Manual Distress Surveys Detailed distress surveys should be conducted on the additional sections utilizing the procedures for HMA or flexible pavements outlined in the LTPP Distress Identification Manual (FHWA 1993b).
III-4.7.6 Deflection Basin Measurements with the FWD – Structural Response
Deflection data should be collected to establish the baseline structural response using a Falling Weight Deflectometer (FWD). The procedures to be followed are detailed in the LTPP FWD Measurements Manual (FHWA 2005) and in the LTPP Data Collection Guide (FHWA 1993a), “Section 3.4 Deflection Data.”
III-4.7.7 Laboratory Testing The laboratory test procedures to be followed are described in the current version of the LTPP Laboratory Guide (SHRP 1993). In addition to the tests required in the LTPP Laboratory Guide, other laboratory material characterization tests should be conducted to support the requirements of the MEPDG. These tests are conducted primarily on the HMA pavement layers.

Montana Department of Transportation Fugro Consultants, Inc. Performance Prediction Models, Contract 65A0151 Fugro 1101-3074 Volume III: Field Guide – Calibration and User’s Guide for the MEPDG
III-44
III-4.7.7.1 HMA Mixtures
The testing of HMA samples will follow the requirements set forth in the LTPP Laboratory Guide (SHRP 1993), “Section 3.4 Laboratory Testing of Asphalt Concrete” and “Appendix B.1 Laboratory Material Testing Program by GPS Experiment Type.”. There are some tests that are not part of the LTPP testing program that need to be run on the HMA materials to support the inputs to the MEPDG procedure. Following are the tests required and the appropriate test methods. Conventional Binder Tests (for Viscosity Temperature Susceptibility [VTS]). This testing should be conducted on extracted asphalt, if asphalt samples are unavailable.
• Extraction of Bitumen (with gradation analysis), AASHTO T 164. • Abson Recovery, AASHTO T 170. • Kinematic Viscosity, AASHTO T 201. • Rotational Viscometer (in place of Kin. Vis.), AASHTO T 316. • Specific Gravity of Asphalt Cement, AASHTO T 228 or AASHTO T 227.
Extracted Aggregate
• Bulk Specific Gravity, AASHTO T 85 and AASHTO T 84. Materials Characterization
• Indirect Tensile Strength and Creep: This testing should be completed on the six-inch diameter cores recovered from each test sections.
• Dynamic Modulus: This testing should be completed on bulk mixtures sampled during
construction, because of the height to diameter minimum requirements. If bulk mixture is unavailable, six-inch diameter cores can be used for measuring the dynamic modulus using the indirect tensile test.
III-4.7.7.2 Asphalt Treated Base Mixtures
Asphalt treated layers should be tested in accordance with the LTPP Laboratory Guide (SHRP 1993), “Section 3.5 Laboratory Testing of Treated Materials” and “Appendix B.1 Laboratory Material Testing Program by GPS Experiment Type.” The same laboratory tests planned for HMA mixtures should be completed for the asphalt treated base mixtures. In-place recycled HMA or pulverized layers that have been stabilized or treated with asphalt should be characterized as an asphalt treated base layer.
III-4.7.7.3 Cement Aggregate Mixtures
Pulverized materials that are bound by the addition of cement should be tested as a treated layer. The testing that should be completed for these mixtures includes density, elastic modulus, and compressive or indirect tensile strength. Pulverized layers that do not have

Montana Department of Transportation Fugro Consultants, Inc. Performance Prediction Models, Contract 65A0151 Fugro 1101-3074 Volume III: Field Guide – Calibration and User’s Guide for the MEPDG
III-45
cement added should be characterized as an unbound granular material unless the passage of time and pavement stress has caused the materials to become bound.
III-4.7.7.4 Unbound Aggregate Base Layers and Embankment Soils
Unbound Granular and Subgrade Materials should be tested in accordance with the LTPP Laboratory Guide (SHRP 1993), “Section 3.6 Laboratory Testing of Unbound Granular Base and Subbase, and Untreated Subgrade Materials” and “Appendix B.1: Laboratory Material Testing Program by GPS Experiment Type.”
III-4.8 PERFORMANCE MONITORING OF NON-LTPP TEST SECTIONS
The annual monitoring program should be consistent with the LTPP program except a higher frequency of data collection needs to be implemented. The annual monitoring program should include condition surveys to identify and measure the types and extents of distress at the site, ride quality, and rut depths (determined from the transverse profiles). FWD deflection basin tests should be performed during different seasons for each test section, but need not be completed on an annual basis. Traffic counts should be made over selected time periods at each test section, if those values currently do not exist. It should be noted that the there might be a need to survey some sections more frequently than established at the beginning of each year. Specifically, as sections begin to fail (or develop significant amounts of distress) they will have to be surveyed more frequently to define the failure curve. Each year sections should be identified and the testing frequency determined for that year. In addition, measurements should be taken on a section that is scheduled for rehabilitation or significant maintenance prior to these activities.

Montana Department of Transportation Fugro Consultants, Inc. Performance Prediction Models, Contract 65A0151 Fugro 1101-3074 Volume III: Field Guide – Calibration and User’s Guide for the MEPDG
III-46
CHAPTER III-5 REFERENCES American Association of State Highway and Transportation Officials (AASHTO). (1986)
AASHTO Guide for Design of Pavement Structures. Washington, DC. American Association of State Highway and Transportation Officials (AASHTO). (1993)
AASHTO Guide for Design of Pavement Structures. Washington, DC. Applied Research Associates, Inc. (ARA). ERES Consultants Division. (2004a) Guide for
Mechanistic-Empirical Design of New and Rehabilitated Pavement Structures: Part 1-Introduction and Part 2-Design Inputs. Final Report. NCHRP Project 1-37A. National Cooperative Highway Research Program. Transportation Research Board. National Research Council. Washington, DC.
Applied Research Associates, Inc. (ARA). ERES Consultants Division. (2004b) Guide for
Mechanistic-Empirical Design of New and Rehabilitated Pavement Structures: Part 3-Design Analysis and Part 4-Low Volume Roads. Final Report, NCHRP Project 1-37A. National Cooperative Highway Research Program. Transportation Research Board. National Research Council. Washington, DC.
Applied Research Associates, Inc. (ARA). ERES Consultants Division. (2004c) Guide for
Mechanistic-Empirical Design of New and Rehabilitated Pavement Structures: Appendices A to C. Final Report. NCHRP Project 1-37A. National Cooperative Highway Research Program. Transportation Research Board. National Research Council. Washington, DC.
Applied Research Associates, Inc. (ARA). ERES Consultants Division. (2004d) Guide for
Mechanistic-Empirical Design of New and Rehabilitated Pavement Structures: Appendix D – User’s Guide. Final Report. NCHRP Project 1-37A. National Cooperative Highway Research Program. Transportation Research Board. National Research Council. Washington, DC.
Federal Highway Administration (FHWA). (1993a) Data Collection Guide for the Long Term
Pavement Performance Studies. McLean VA. Federal Highway Administration (FHWA). (1993b) Distress Identification Manual for the Long-
Term Pavement Performance Program. Publication No. FHWA-RD-03-031. McLean VA. Federal Highway Administration (FHWA). (2004) LTPP Manual for Profile Measurements and
Processing Version 4.1. United States Department of Transportation. Washington, DC. Federal Highway Administration (FHWA). (2005) LTPP Manual for Falling Weight Deflectometer
Measurements Version 4.0. Long-Term Pavement Performance Program. McLean VA. Montana Department of Transportation (MDT). (2006) Standard Specifications for Road and
Bridge Construction. Pavement Analysis and Research Section. Helena, MT. National Cooperative Highway Research Program (NCHRP). (2006) Changes to the
Mechanistic-Empirical Pavement Design Guide Software Through Version 0.900. NCHRP

Montana Department of Transportation Fugro Consultants, Inc. Performance Prediction Models, Contract 65A0151 Fugro 1101-3074 Volume III: Field Guide – Calibration and User’s Guide for the MEPDG
III-47
Research Results Digest 308. NCHRP Project 1-40D. Transportation Research Board. National Research Council. Washington, DC.
Strategic Highway Research Program (SHRP). (1990) Specific Pavement Studies for Flexible
Pavements (SPS-1). Long-Term Pavement Performance Program. Federal Highway Administration. Washington DC.
Strategic Highway Research Program (SHRP). (1992) SHRP-LTPP Guide for Field Materials
Sampling, Testing, and Handling. Operational Guide No. SHRP-LTPP-OG 006 Revised Version 2.0. Long-Term Pavement Performance Program. Federal Highway Administration. Washington DC.
Strategic Highway Research Program (SHRP). (1993) SHRP-LTPP Interim Guide for
Laboratory Material Handling and Testing (PCC, Bituminous Materials, Aggregates and Soils). Operational Guide No. SHRP-LTPP-OG 004 Revised Version 2.0. Long-Term Pavement Performance Program. Federal Highway Administration. Washington DC.
Von Quintus, H.L. and Moulthrop, J.S. (2007a) Performance Prediction Models: Volume I
Executive Research Summary. No. FHWA/MT-07-008/8158-1. Montana Department of Transportation. Research Programs. Helena, MT.
Von Quintus, H.L. and Moulthrop, J.S. (2007b) Performance Prediction Models: Volume II
Reference Manual. No. FHWA/MT-07-008/8158-2. Montana Department of Transportation. Research Programs. Helena, MT.

150 copies of this public document were produced at an
estimated cost of $1.99 each, for a total cost of $298.66. This includes $153.36 for postage and $145.30 for printing.