crackle sounds and lung recruitment - doktori.bibl.u...
TRANSCRIPT
Crackle sounds and lung recruitment
PhD Thesis
József Tolnai
Department of Medical Physics and Informatics
University of Szeged, Hungary
2012
i
List of papers included in this thesis
I. Hantos, Z., J. Tolnai, T. Asztalos, F. Peták, Á. Adamicza, A. M. Alencar, A.
Majumdar, B. Suki: Acoustic evidence of airway opening during recruitment in
excised dog lungs. J. Appl. Physiol. 97: 592-598 (2004)
II. Peták, F., W. Habre, B. Babik, J. Tolnai, Z. Hantos: Crackle sound recording to
monitor airway closure and recruitment in ventilated pigs. Eur. Respir. J. 27: 808-
816 (2006)
III. Hantos, Z., Á. Adamicza, T. Janosi, M. V. Szabari, J. Tolnai, B. Suki: Lung volumes
and respiratory mechanics in elastase-induced emphysema in mice. J. Appl.
Physiol. 105: 1864-1872 (2008)
IV. Tolnai, J., M. V. Szabari, G. Albu, B. A. Maár, H. Parameswaran, E. Bartolák-Suki, B.
Suki and Z. Hantos: Functional and morphological assessment of early
impairment of airway function in a rat model of emphysema. J. Appl. Physiol. 22.
Mar 2012 [Epub ahead of print] PMID: 22442024
List of papers related to the subject of this thesis
V. Alencar, A. M., Z. Hantos, F. Peták, J. Tolnai, T. Asztalos, S. Zapperi, J. S. Andrade,
Jr., H. E. Stanley, B. Suki: Scaling behavior in crackle sound during lung inflation.
Phys. Rev. E 60: 4659-4663 (1999)
VI. Suki, B., A. M. Alencar, J. Tolnai, T. Asztalos, F. Peták, M. K. Sujeer, K. Patel, J.
Patel, H. E. Stanley, Z. Hantos: Size distribution of recruited alveolar volumes in
airway reopening. J. Appl. Physiol. 89: 2030-2040 (2000)
VII. Majumdar, A., Z. Hantos, J. Tolnai, H. Parameswaran, R. S. Tepper, B. Suki:
Estimating the diameter of airways susceptible for collapse using crackle sound.
J. Appl. Physiol. 107: 1504-1512 (2009)
ii
Table of contents
1. Introduction ............................................................................................................................ 1
1.1. Crackles ........................................................................................................................... 1
1.2. Lung recruitment and the P−V relationship ..................................................................... 2
1.3. Airway and parenchymal determinants of recruitment ................................................... 4
2. Aims and hypotheses of the present thesis ............................................................................. 6
3. Methods .................................................................................................................................. 7
3.1. General methodology ....................................................................................................... 7
3.1.1. Impedance measurements ......................................................................................... 7
3.1.2. Recording of tracheal sounds .................................................................................... 7
3.1.3. Identification of crackles ........................................................................................... 8
3.2. Study-specific methods .................................................................................................. 10
3.2.1. Acoustic evidence of airway opening during recruitment (Study 1) ...................... 10
3.2.2. Crackle recording to monitor recruitment in bronchoconstriction (Study 2) .......... 13
3.2.3. Crackles and airway function in emphysematous mice (Study 3) .......................... 16
3.2.4. Crackles and airway structure/function in emphysematous rats (Study 4) ............. 18
4. Results .................................................................................................................................. 21
4.1. Acoustic evidence of airway opening during recruitment (Study 1) ............................. 21
4.2. Crackle recording to monitor recruitment in bronchoconstriction (Study 2) ................ 25
4.3. Crackles and airway function in emphysematous mice (Study 3) ................................. 27
4.4. Crackles and airway structure/function in emphysematous rats (Study 4) .................... 29
5. Discussion ............................................................................................................................. 32
5.1. Acoustic evidence of airway opening during recruitment (Study 1) ............................. 32
5.2. Crackle recording to monitor recruitment in bronchoconstriction (Study 2) ................ 34
5.3. Crackles and airway function in emphysematous mice (Study 3) ................................. 36
5.4. Crackles and airway structure/function in emphysematous rats (Study 4) .................... 37
Summary and conclusions ........................................................................................................ 40
Acknowledgements .................................................................................................................. 42
References ................................................................................................................................ 43
iii
List of figures and tables
Fig. 1: A short segment of a crackle sound P recording in an isolated dog lung lobe............ 2
Fig. 2: A 10-s sound recording during inflation from the degassed state before and
after 2-kHz high-pass filtering. The large-amplitude ringings and the high-
frequency crackle transients are visualized by the expansion of the highlighted 0.3-s
segment ........................................................................................................................ 9
Fig. 3: A short segment of a sound recording with superimposing crackles to illustrate the
method of identification of the location and amplitude of crackles .......................... 10
Fig. 4: A short segment of a crackle sound pressure recording, its HF and LF components,
and the LF sound intensity with the corresponding flow signal to illustrate the
calculation of discrete V increments and associated crackle energy ......................... 12
Fig. 5: Experimental set-up for the measurement of pulmonary input impedance and
crackles in pigs .......................................................................................................... 14
Fig. 6: Tracings of the original and the high-pass-filtered crackle sound pressure, with the
inspired V and PL during the inflation of a lung after a Mch challenge .................... 15
Fig. 7: Schematic arrangement for the measurement of the TGV and oscillatory mechanics.
Inset: modified setup for the sound recording during VC manoeuvres..................... 18
Fig. 8: Recordings of crackle sound pressure, inflation flow and Ptl during the first 35 s of
the first inflation and second reinflation of a lobe ..................................................... 21
Fig. 9: Dependences of inflation volume, sound energy and cumulated sound energy
calculated for successive 0.25-s intervals, all normalized by the corresponding
maximum value, on the Ptl in a lobe during the first and second inflation ............... 22
Fig. 10: A segment of a crackle and �̇� recording during reinflation of a lobe. HF and LF
sound energy data were computed from high-pass-filtered and low-pass-filtered
sound intensity, respectively ..................................................................................... 23
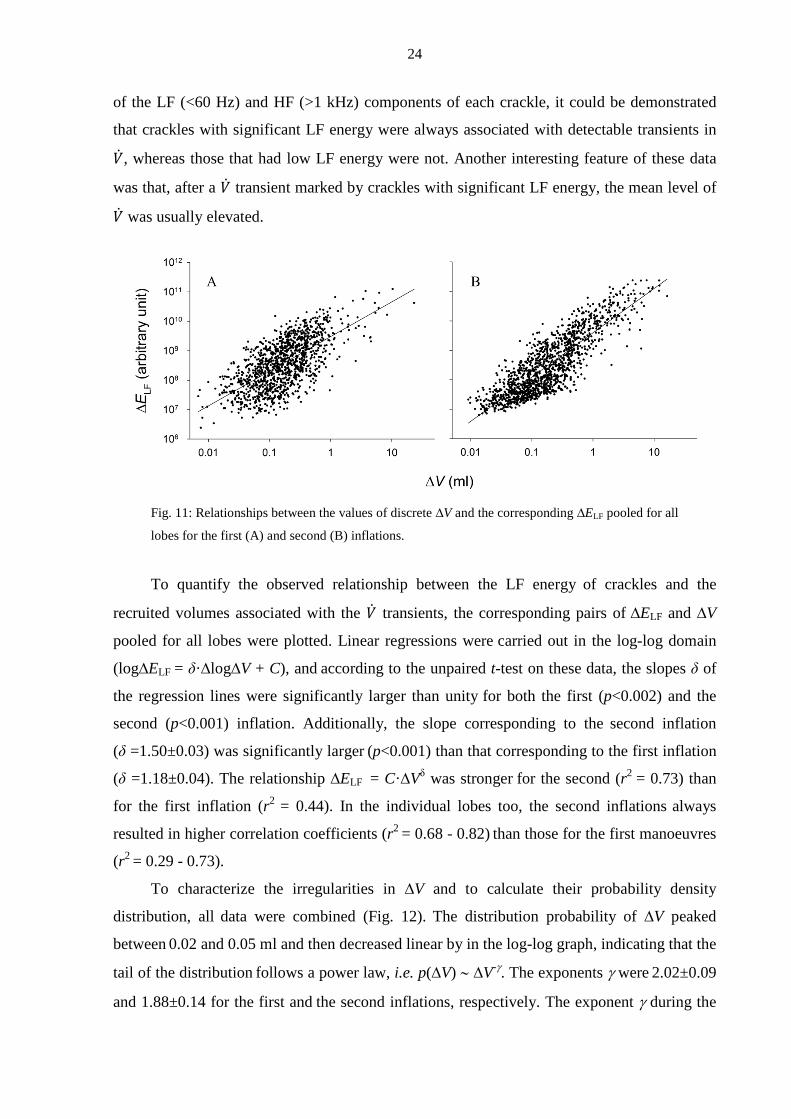
Fig. 11: Relationships between the values of discrete ∆ V and the corresponding ∆ELF pooled
for all lobes for the first and second inflations .......................................................... 24
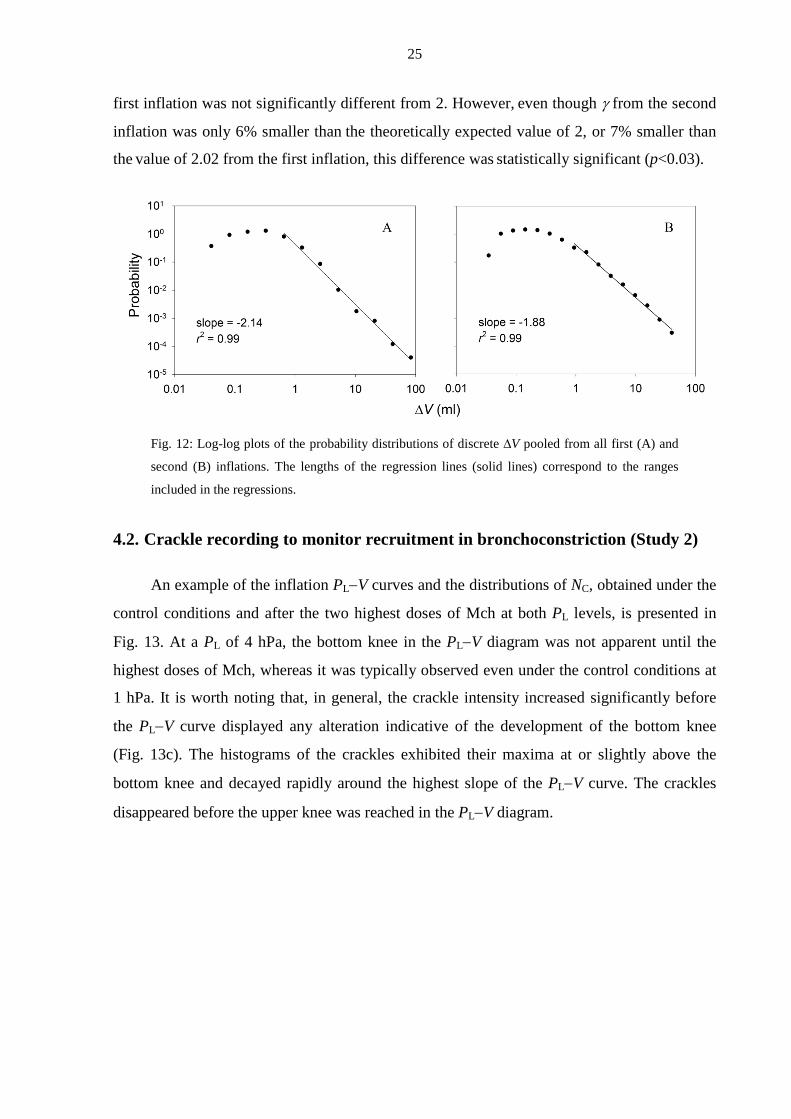
Fig. 12: Log-log plots of the probability distributions of discrete ∆ V pooled from all first and
second inflations ........................................................................................................ 25
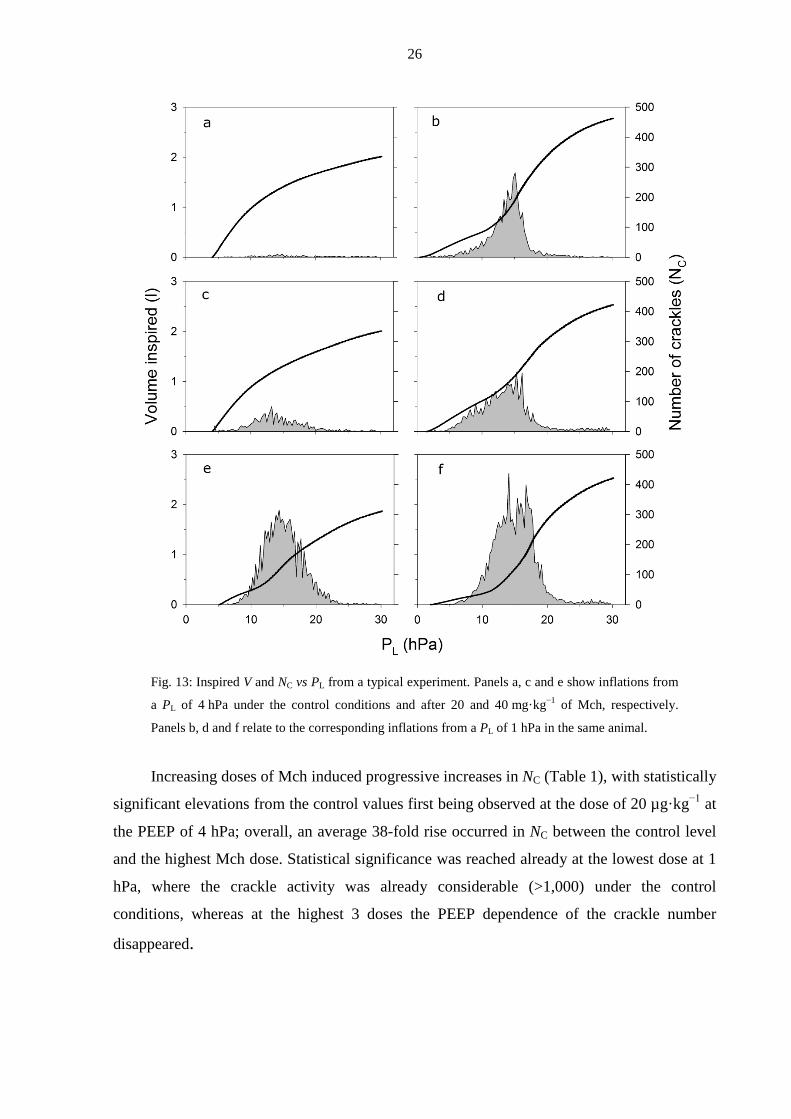
Fig. 13: Inspired V and NC vs PL from a typical experiment .................................................. 26
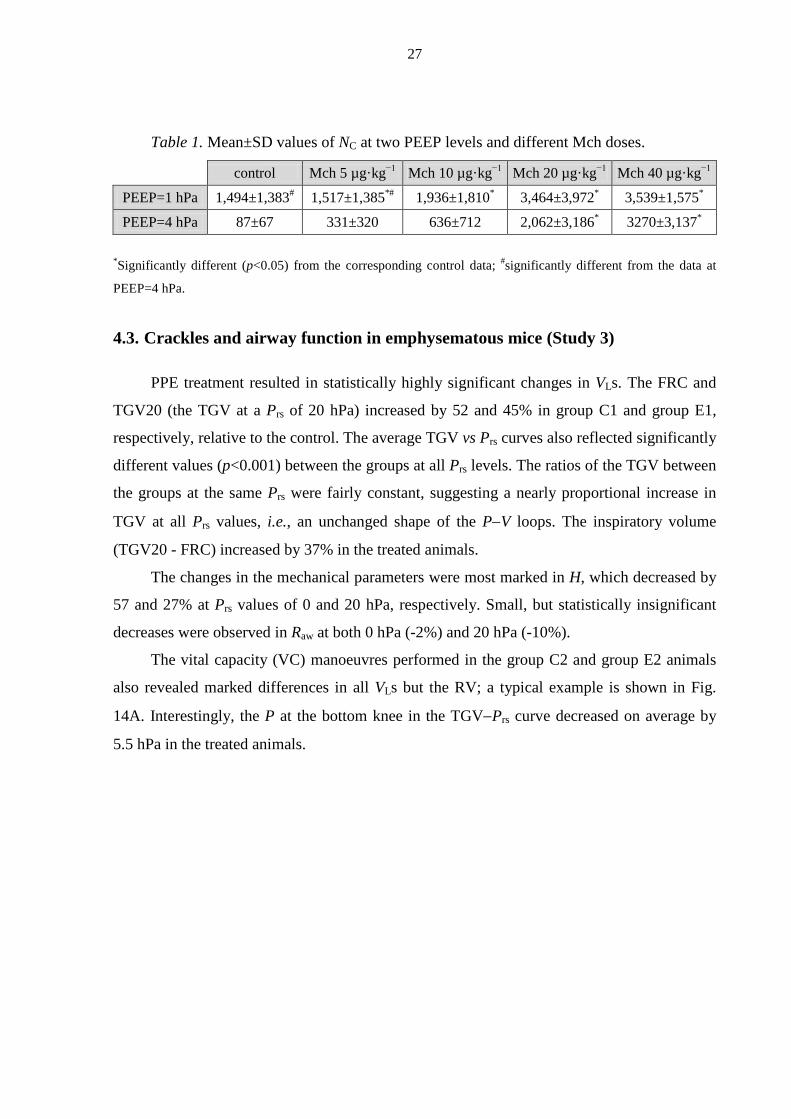
Table 1: Mean±SD values of NC at two PEEP levels and different Mch doses ...................... 27
iv
Fig. 14: Thoracic gas volume (TGV) vs transrespiratory pressure (Prs) curves recorded
during VC manoeuvres in a control (group C2) and a PPE-treated (group E2)
mouse. ........................................................................................................................ 28
Fig. 15: Log-log plots of the probability distributions of the crackle amplitude recorded
during inflations from the RV to TLC in the control (group C2) and the PPE-treated
(group E2) mice. ........................................................................................................ 29
Fig. 16: Comparison of the inflation P−V curves of control and PPE groups from the
degassed state ............................................................................................................ 30
Fig. 17: Relative frequencies of crackles in the control and PPE groups as a function of P on
a lin-lin scale and V on a lin-log scale ....................................................................... 31
v
Glossary of abbreviations
∆V . . . volume increment
∆T . . . time interval
∆E . . . sound energy changes
η . . . tissue hysteresivity
ARDS . . acute respiratory distress syndrome
COPD . . chronic obstructive pulmonary
disease
Db . . . bronchial diameter
ERV . . . expiratory reserve volume
FOT . . . forced oscillation technique
FRC . . . functional residual capacity
G . . . constant-phase tissue damping
H . . . constant-phase tissue elastance
HF . . . high-frequency
I . . . inertance
Iaw . . . airway inertance
IC . . . inspiratory capacity
IU . . . international unit
iv . . . intravenous
LF . . . low-frequency
LFOT . . . low-frequency forced oscillation
technique
Mch . . . methacholine
NC . . . number of crackles
NS . . . number of septal attachments
P1 . . . lateral pressure at the outlet of
the tube
P2 . . . lateral pressure at the inlet of
the tube
Pb . . . bronchial perimeter
Pbox . . . plethysmograph (box) pressure
PL . . . transpulmonary pressure
Prs . . . transrespiratory pressure
Ptl . . . translobar pressure
Ptr . . . tracheal pressure
PEEP . . . positive end-expiratory pressure
PPE . . . porcine pancreatic elastase
P−V . . . pressure−volume
RV . . . residual volume
Raw . . . airway resistance
TGV . . . thoracic gas volume
TLC . . . total lung capacity
Tw . . . wall thickness
V . . . volume
VL . . . lung volume
V(t) . . . inflation volume
�̇� . . . flow
Z . . . input mechanical impedance
ZL . . . pulmonary input impedance
Zrs . . . impedance of the total respiratory
system
1
1. Introduction
In various respiratory diseases, but also in the normal lung, respiration can be associated
with acoustic phenomena. Depending on their dominant acoustic properties, the lung sounds
are conventionally classified into the main categories of discontinuous (rales or crackles) and
continuous sounds (wheezes and rhonchi); depending on the anatomical locus of the sound
generation, tracheal, bronchial, bronchovesicular and vesicular sounds are distinguished
[8, 9]. Lung sounds are usually detected by auscultation on the chest surface; hence, the
acoustic events occurring in the adjacent peripheral region and passing through the local
pulmonary and chest wall tissues of highly variable acoustic attenuation are preferentially
sensed. Indeed, in clinical practice, the expression “breath sounds” usually means the
respiratory noise heard through the stethoscope on the chest wall [10]. These sounds therefore
relate to the specific peripheral area, in contrast with the sounds that can be recorded at the
airway opening and are transmitted from the source through a gaseous medium of high,
uniform acoustic conductance to the entrance of the airway tree. Apart from some studies on
turbulent noises generated in the large airways [10], the latter measurement approach has not
been utilized in investigations of lung sounds; moreover, crackles are rarely considered
audible at the mouth. The present thesis includes measurements made in experimental animals
with sound recordings at the airway opening, and concentrates on a single type of acoustic
event, crackles. Special emphasis is placed on the association of crackles with the
development of the pressure−volume (P−V) characteristics of the lungs.
1.1. Crackles
Investigations on crackling sounds date back to the invention of the stethoscope by
Laënnec in 1819 [11]. Forgacs [8] proposed that crackles are associated with the sudden
opening of closed airways. Crackles can be of low or high pitch and loud or faint (depending
on the properties of the individual oscillatory waveform) and profuse or scanty (as they
appear sequentially); other characteristics, such as the timing and appearance in the breathing
cycle are also of clinical significance [9]. Crackles are associated with a number of pulmonary
diseases, such as fibrosis, asbestosis, bronchiectasis, chronic obstructive pulmonary disease
(COPD), pneumonia and sarcoidosis [10, 12-15], and their above-mentioned acoustic
properties can be widely different and qualitatively characteristic of the disease. However, the
2
mechanisms involved in the generation of crackles may simply concern the separation of the
adhering walls of the bronchi of different size and liquid layer thickness.
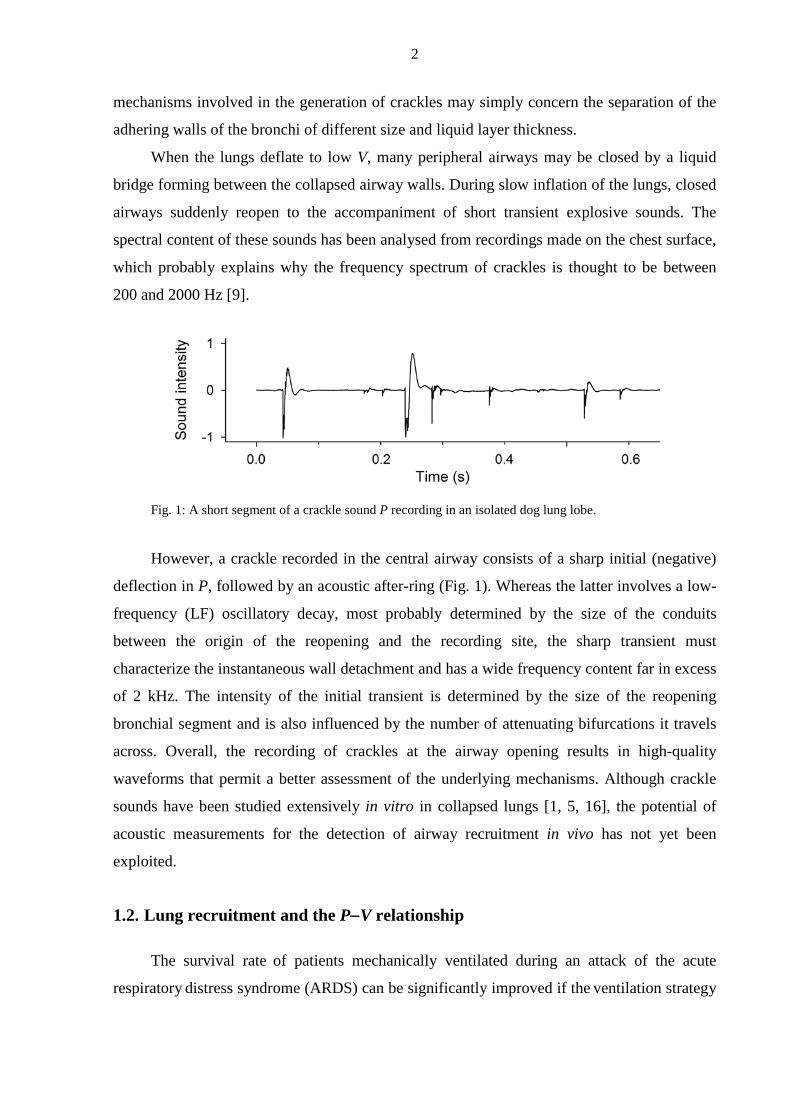
When the lungs deflate to low V, many peripheral airways may be closed by a liquid
bridge forming between the collapsed airway walls. During slow inflation of the lungs, closed
airways suddenly reopen to the accompaniment of short transient explosive sounds. The
spectral content of these sounds has been analysed from recordings made on the chest surface,
which probably explains why the frequency spectrum of crackles is thought to be between
200 and 2000 Hz [9].
Fig. 1: A short segment of a crackle sound P recording in an isolated dog lung lobe.
However, a crackle recorded in the central airway consists of a sharp initial (negative)
deflection in P, followed by an acoustic after-ring (Fig. 1). Whereas the latter involves a low-
frequency (LF) oscillatory decay, most probably determined by the size of the conduits
between the origin of the reopening and the recording site, the sharp transient must
characterize the instantaneous wall detachment and has a wide frequency content far in excess
of 2 kHz. The intensity of the initial transient is determined by the size of the reopening
bronchial segment and is also influenced by the number of attenuating bifurcations it travels
across. Overall, the recording of crackles at the airway opening results in high-quality
waveforms that permit a better assessment of the underlying mechanisms. Although crackle
sounds have been studied extensively in vitro in collapsed lungs [1, 5, 16], the potential of
acoustic measurements for the detection of airway recruitment in vivo has not yet been
exploited.
1.2. Lung recruitment and the P−V relationship
The survival rate of patients mechanically ventilated during an attack of the acute
respiratory distress syndrome (ARDS) can be significantly improved if the ventilation strategy
3
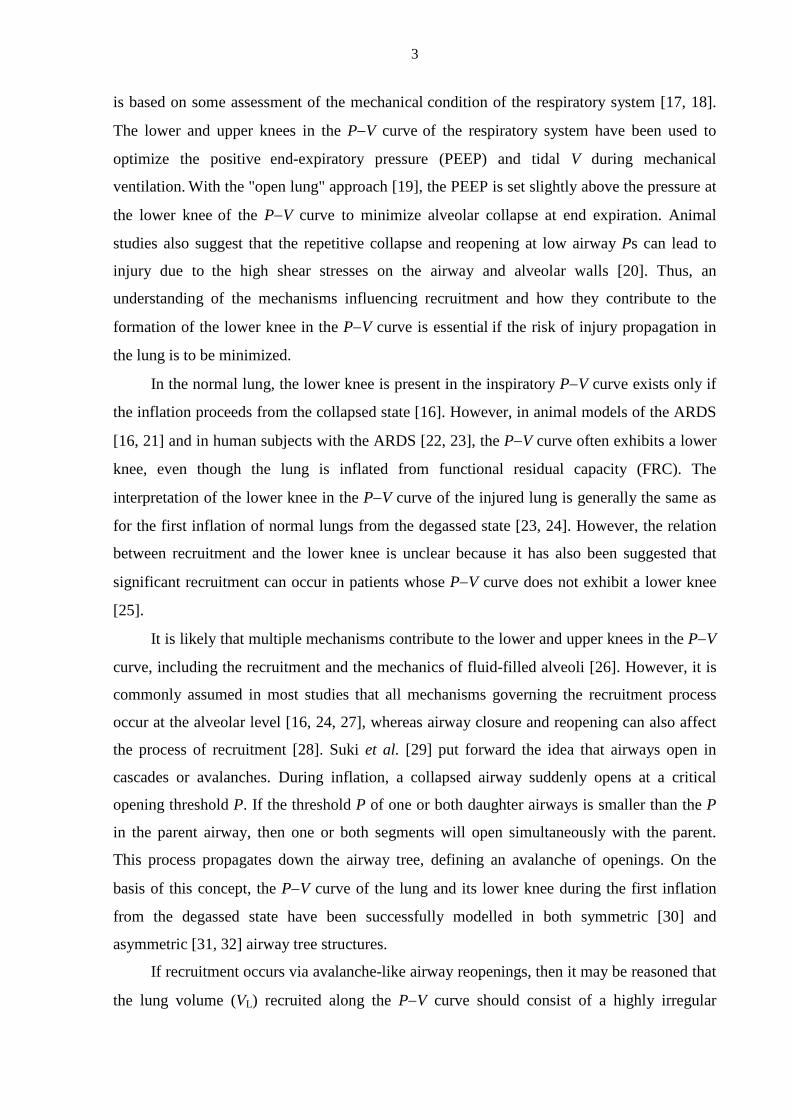
is based on some assessment of the mechanical condition of the respiratory system [17, 18].
The lower and upper knees in the P−V curve of the respiratory system have been used to
optimize the positive end-expiratory pressure (PEEP) and tidal V during mechanical
ventilation. With the "open lung" approach [19], the PEEP is set slightly above the pressure at
the lower knee of the P−V curve to minimize alveolar collapse at end expiration. Animal
studies also suggest that the repetitive collapse and reopening at low airway Ps can lead to
injury due to the high shear stresses on the airway and alveolar walls [20]. Thus, an
understanding of the mechanisms influencing recruitment and how they contribute to the
formation of the lower knee in the P−V curve is essential if the risk of injury propagation in
the lung is to be minimized.
In the normal lung, the lower knee is present in the inspiratory P−V curve exists only if
the inflation proceeds from the collapsed state [16]. However, in animal models of the ARDS
[16, 21] and in human subjects with the ARDS [22, 23], the P−V curve often exhibits a lower
knee, even though the lung is inflated from functional residual capacity (FRC). The
interpretation of the lower knee in the P−V curve of the injured lung is generally the same as
for the first inflation of normal lungs from the degassed state [23, 24]. However, the relation
between recruitment and the lower knee is unclear because it has also been suggested that
significant recruitment can occur in patients whose P−V curve does not exhibit a lower knee
[25].
It is likely that multiple mechanisms contribute to the lower and upper knees in the P−V
curve, including the recruitment and the mechanics of fluid-filled alveoli [26]. However, it is
commonly assumed in most studies that all mechanisms governing the recruitment process
occur at the alveolar level [16, 24, 27], whereas airway closure and reopening can also affect
the process of recruitment [28]. Suki et al. [29] put forward the idea that airways open in
cascades or avalanches. During inflation, a collapsed airway suddenly opens at a critical
opening threshold P. If the threshold P of one or both daughter airways is smaller than the P
in the parent airway, then one or both segments will open simultaneously with the parent.
This process propagates down the airway tree, defining an avalanche of openings. On the
basis of this concept, the P−V curve of the lung and its lower knee during the first inflation
from the degassed state have been successfully modelled in both symmetric [30] and
asymmetric [31, 32] airway tree structures.
If recruitment occurs via avalanche-like airway reopenings, then it may be reasoned that
the lung volume (VL) recruited along the P−V curve should consist of a highly irregular
4
sequence of discrete volume increments (∆V). The distribution of these ∆Vs, which
correspond to avalanches reaching the alveoli, should follow a power law [6, 33].
Additionally, as the airway opening is also associated with crackle sound generation [5, 8, 12,
16, 28, 34] it may be expected that the density of crackles is highest near the lower knee in the
P−V curve.
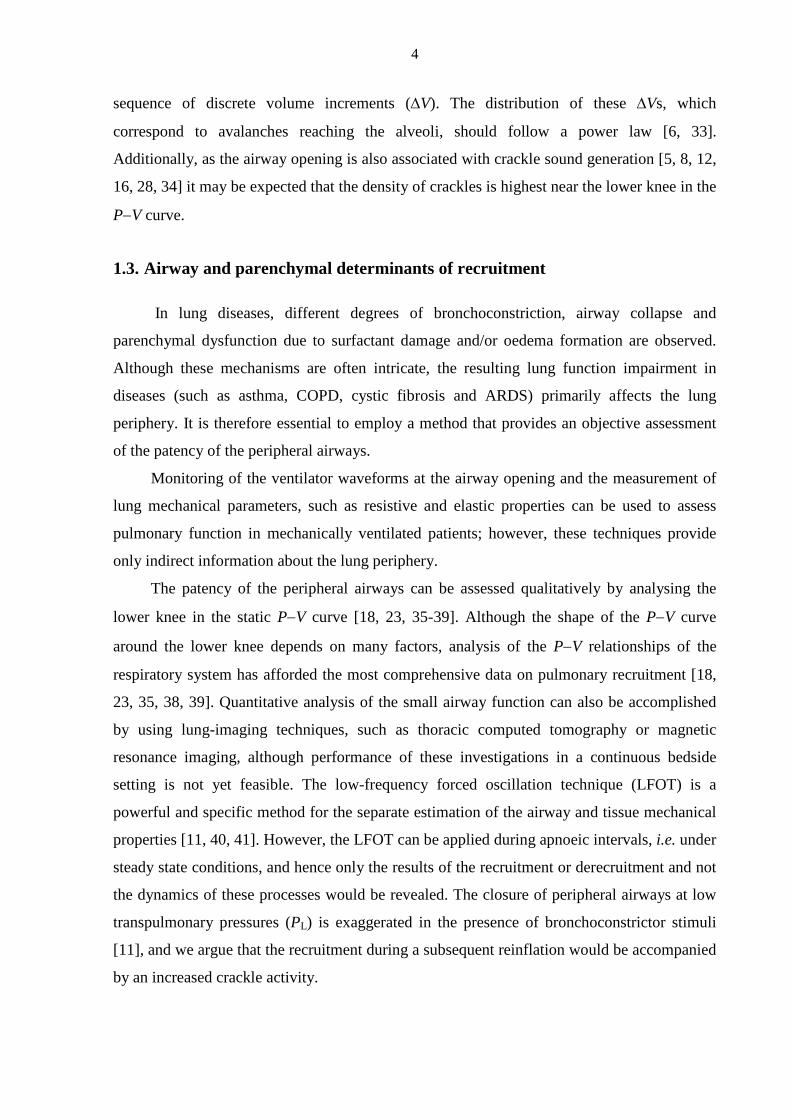
1.3. Airway and parenchymal determinants of recruitment
In lung diseases, different degrees of bronchoconstriction, airway collapse and
parenchymal dysfunction due to surfactant damage and/or oedema formation are observed.
Although these mechanisms are often intricate, the resulting lung function impairment in
diseases (such as asthma, COPD, cystic fibrosis and ARDS) primarily affects the lung
periphery. It is therefore essential to employ a method that provides an objective assessment
of the patency of the peripheral airways.
Monitoring of the ventilator waveforms at the airway opening and the measurement of
lung mechanical parameters, such as resistive and elastic properties can be used to assess
pulmonary function in mechanically ventilated patients; however, these techniques provide
only indirect information about the lung periphery.
The patency of the peripheral airways can be assessed qualitatively by analysing the
lower knee in the static P−V curve [18, 23, 35-39]. Although the shape of the P−V curve
around the lower knee depends on many factors, analysis of the P−V relationships of the
respiratory system has afforded the most comprehensive data on pulmonary recruitment [18,
23, 35, 38, 39]. Quantitative analysis of the small airway function can also be accomplished
by using lung-imaging techniques, such as thoracic computed tomography or magnetic
resonance imaging, although performance of these investigations in a continuous bedside
setting is not yet feasible. The low-frequency forced oscillation technique (LFOT) is a
powerful and specific method for the separate estimation of the airway and tissue mechanical
properties [11, 40, 41]. However, the LFOT can be applied during apnoeic intervals, i.e. under
steady state conditions, and hence only the results of the recruitment or derecruitment and not
the dynamics of these processes would be revealed. The closure of peripheral airways at low
transpulmonary pressures (PL) is exaggerated in the presence of bronchoconstrictor stimuli
[11], and we argue that the recruitment during a subsequent reinflation would be accompanied
by an increased crackle activity.
5
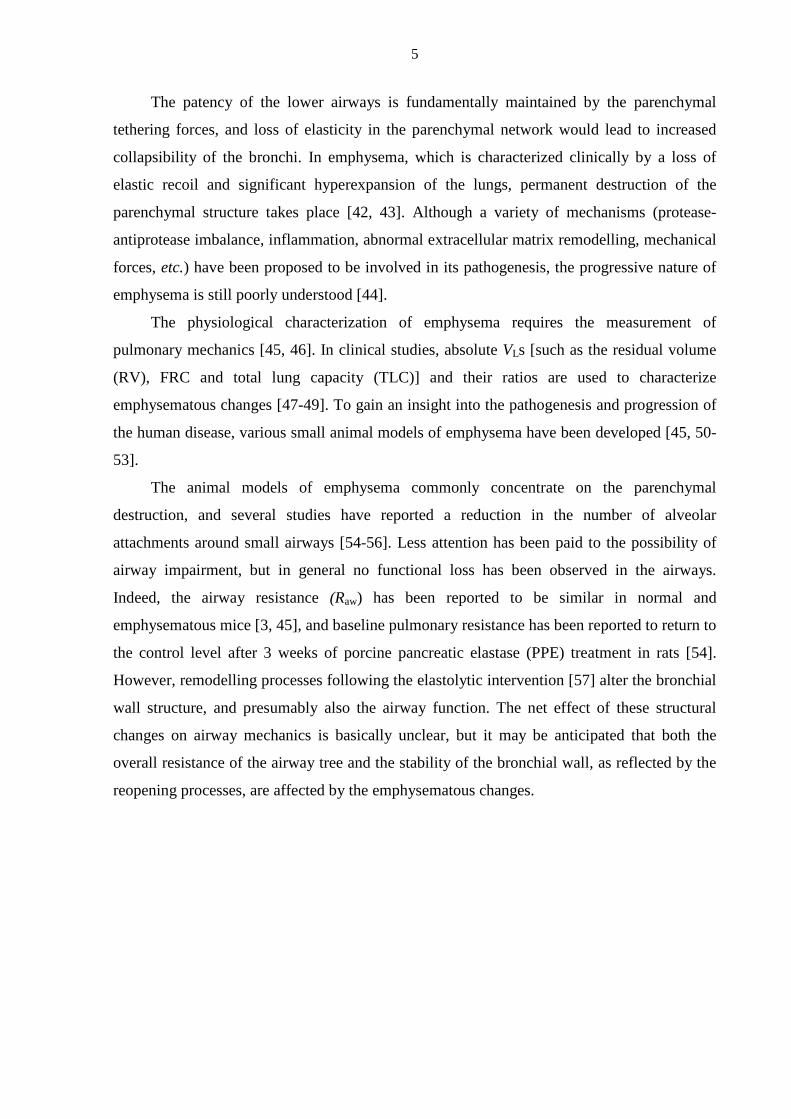
The patency of the lower airways is fundamentally maintained by the parenchymal
tethering forces, and loss of elasticity in the parenchymal network would lead to increased
collapsibility of the bronchi. In emphysema, which is characterized clinically by a loss of
elastic recoil and significant hyperexpansion of the lungs, permanent destruction of the
parenchymal structure takes place [42, 43]. Although a variety of mechanisms (protease-
antiprotease imbalance, inflammation, abnormal extracellular matrix remodelling, mechanical
forces, etc.) have been proposed to be involved in its pathogenesis, the progressive nature of
emphysema is still poorly understood [44].
The physiological characterization of emphysema requires the measurement of
pulmonary mechanics [45, 46]. In clinical studies, absolute VLs [such as the residual volume
(RV), FRC and total lung capacity (TLC)] and their ratios are used to characterize
emphysematous changes [47-49]. To gain an insight into the pathogenesis and progression of
the human disease, various small animal models of emphysema have been developed [45, 50-
53].
The animal models of emphysema commonly concentrate on the parenchymal
destruction, and several studies have reported a reduction in the number of alveolar
attachments around small airways [54-56]. Less attention has been paid to the possibility of
airway impairment, but in general no functional loss has been observed in the airways.
Indeed, the airway resistance (Raw) has been reported to be similar in normal and
emphysematous mice [3, 45], and baseline pulmonary resistance has been reported to return to
the control level after 3 weeks of porcine pancreatic elastase (PPE) treatment in rats [54].
However, remodelling processes following the elastolytic intervention [57] alter the bronchial
wall structure, and presumably also the airway function. The net effect of these structural
changes on airway mechanics is basically unclear, but it may be anticipated that both the
overall resistance of the airway tree and the stability of the bronchial wall, as reflected by the
reopening processes, are affected by the emphysematous changes.
6
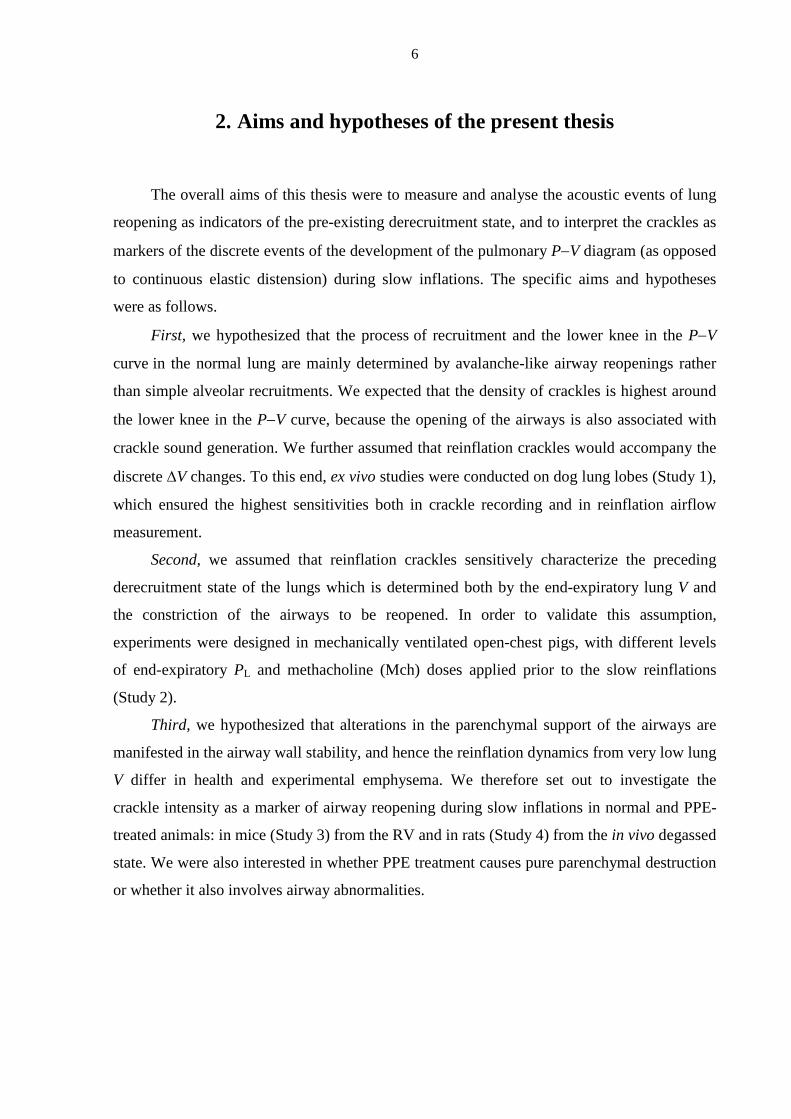
2. Aims and hypotheses of the present thesis
The overall aims of this thesis were to measure and analyse the acoustic events of lung
reopening as indicators of the pre-existing derecruitment state, and to interpret the crackles as
markers of the discrete events of the development of the pulmonary P−V diagram (as opposed
to continuous elastic distension) during slow inflations. The specific aims and hypotheses
were as follows.
First, we hypothesized that the process of recruitment and the lower knee in the P−V
curve in the normal lung are mainly determined by avalanche-like airway reopenings rather
than simple alveolar recruitments. We expected that the density of crackles is highest around
the lower knee in the P−V curve, because the opening of the airways is also associated with
crackle sound generation. We further assumed that reinflation crackles would accompany the
discrete ∆V changes. To this end, ex vivo studies were conducted on dog lung lobes (Study 1),
which ensured the highest sensitivities both in crackle recording and in reinflation airflow
measurement.
Second, we assumed that reinflation crackles sensitively characterize the preceding
derecruitment state of the lungs which is determined both by the end-expiratory lung V and
the constriction of the airways to be reopened. In order to validate this assumption,
experiments were designed in mechanically ventilated open-chest pigs, with different levels
of end-expiratory PL and methacholine (Mch) doses applied prior to the slow reinflations
(Study 2).
Third, we hypothesized that alterations in the parenchymal support of the airways are
manifested in the airway wall stability, and hence the reinflation dynamics from very low lung
V differ in health and experimental emphysema. We therefore set out to investigate the
crackle intensity as a marker of airway reopening during slow inflations in normal and PPE-
treated animals: in mice (Study 3) from the RV and in rats (Study 4) from the in vivo degassed
state. We were also interested in whether PPE treatment causes pure parenchymal destruction
or whether it also involves airway abnormalities.
7
3. Methods
3.1. General methodology
3.1.1. Impedance measurements
The input mechanical impedance (Z) of the lungs (ZL) or the respiratory system (Zrs)
was measured with the LFOT. Because of the small size of the animals in Study 3 and Study
4, the wave tube technique (which is more accurate in the estimation of the input impedance
of small structures) was selected. Z was calculated as
Z=Z0sh(γL)/[(P1/P2)-ch(γL)]
where Z0 and γ are the characteristic impedance and wave number of the tube, respectively, L
is the tube length, and P1 and P2 are the lateral pressures at the outlet and inlet of the tube,
respectively [58, 59].
The airway and parenchymal mechanical properties were separated by fitting the
constant-phase model [40] to the Z spectra. The model consists of an airway compartment
containing Raw and Iaw (airway inertance), and a constant-phase tissue unit characterized by
damping (G) and elastance (H):
Z= Raw+jωIaw+(G-jH)/ωα
where j is the imaginary unit, ω is the angular frequency (2πf) and α is (2/π) arctan (H/G). Raw
includes all Newtonian (i.e. frequency-independent) resistance components.
3.1.2. Recording of tracheal sounds
A commercial miniature microphone (5×5 mm) was suspended in the lobar bronchus in
dogs and in the tracheal tube in pigs (Study 1 and Study 2). In mice and rats, a metal tube (a
truncated 16G or 18G needle) was attached to the microphone and positioned in front of the
tracheal cannula (Study 3 and Study 4).
The electrical signal of the microphone was preamplified with a low-noise custom-made
amplifier and led to the sound card of the computer used for the acquisition of the other
physiological signals. The sound signal was digitized with 16-bit resolution and a sampling
rate of 22.050 Hz. The recordings were made during slow inflations from the collapsed state
in excised dog lung lobes (Study 1), from PEEP levels of 1 and 4 hPa in pigs (Study 2), from
8
the RV in mice (Study 3) and from the in vivo degassed state in rats (Study 4) to the TLC (30-
35 hPa). In dog lobes, mice and rats, the inflations were performed with negative pressure
ramps generated by a vacuum source or membrane pump in the plethysmograph; the pig lungs
were reinflated via the trachea from a compressed air source. Acoustic filters were employed
in the vacuum or pressure line to minimize the fluctuations in the reinflation. In order to
collect more acoustic events and assess the reproducibility of the reopenings, the manoeuvres
were repeated usually 2 or more times in the same condition in each animal. The duration of
inflation [~20-45 s (60-120 s in dog lobes)] was selected so that the temporal resolution was
sufficiently high for the identification of the individual crackles. The signals of the
transrespiratory (or translobar) P and central flow (�̇�) were recorded, and the inflation volume
[V(t)] was obtained by integration of �̇�.
3.1.3. Identification of crackles
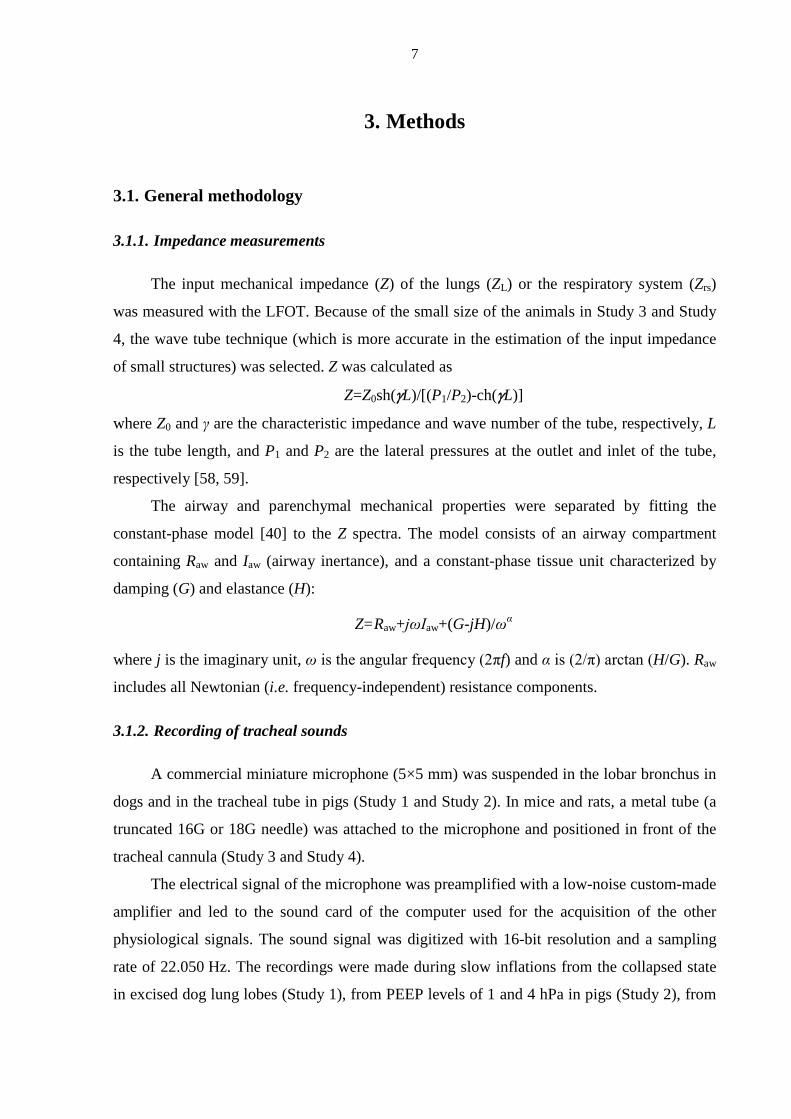
The in vivo raw sound recordings were first high-pass-filtered at 2 kHz with a sound
editor (GoldWave™ v5.12, St. John's, NFLD, Canada), in order to suppress the strong
cardiogenic sound and enhance the sharp initial transients of the crackles (the ex vivo
recordings were processed differently; see section 3.2.1). The high-frequency (HF)
waveforms provided an increased temporal resolution for identification of the successive
crackles, which often overlapped and hence were inseparable in the unfiltered signals. As
shown in Fig. 2, although the cardiac signal largely masked the crackles in the raw recording,
the high-pass filtering diminished this noise.
9
Fig. 2: A 10-s sound recording during inflation from the degassed state before and after 2-kHz
high-pass filtering (top). The large-amplitude ringings and the high-frequency crackle transients
are visualized by the expansion of the highlighted 0.3-s segment (bottom).
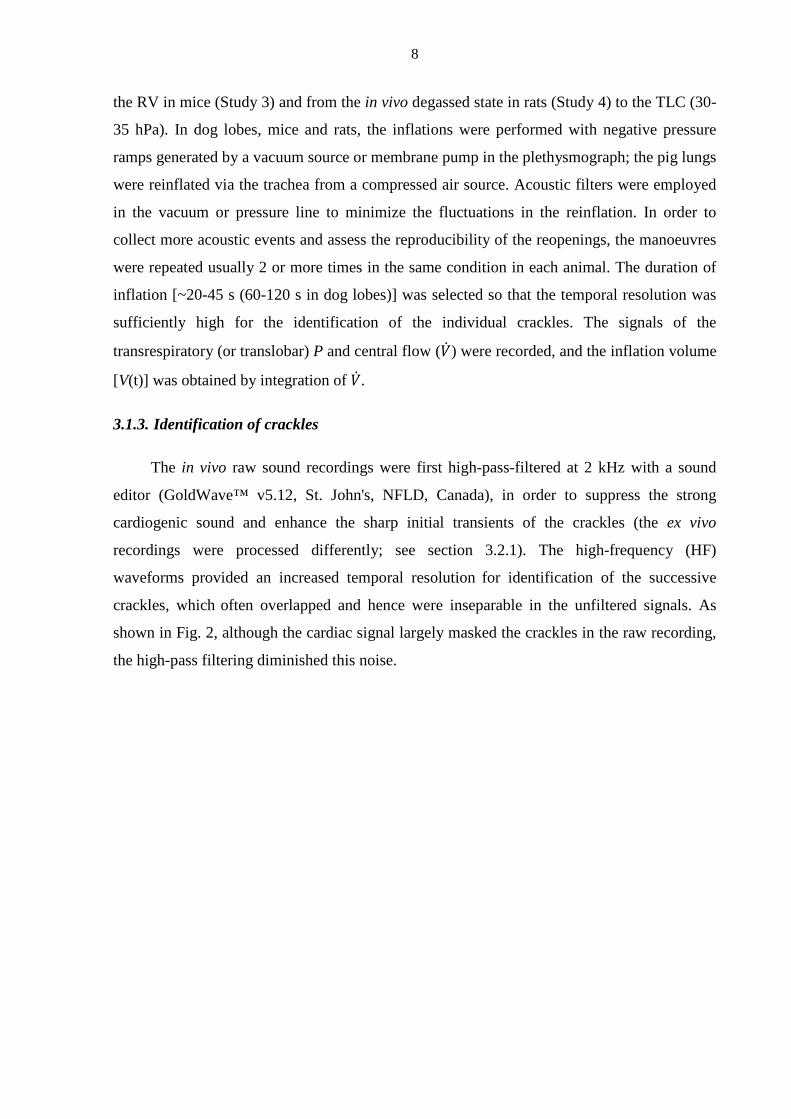
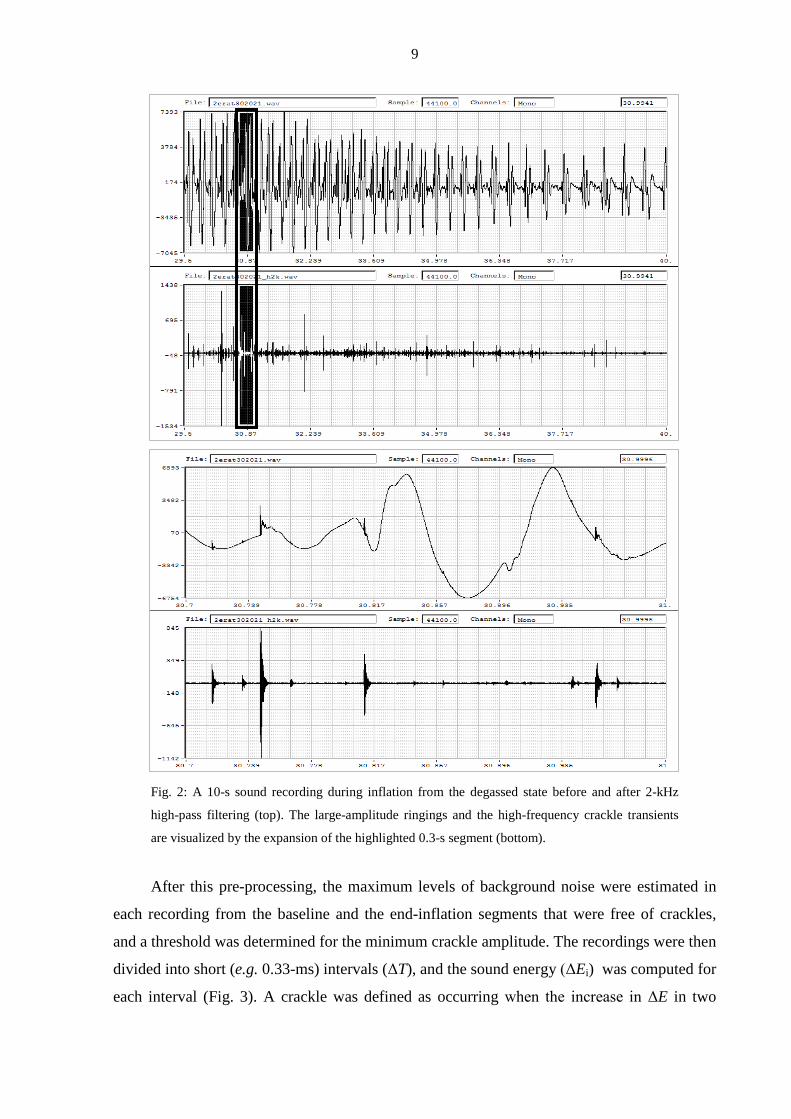
After this pre-processing, the maximum levels of background noise were estimated in
each recording from the baseline and the end-inflation segments that were free of crackles,
and a threshold was determined for the minimum crackle amplitude. The recordings were then
divided into short (e.g. 0.33-ms) intervals (ΔT), and the sound energy (ΔEi) was computed for
each interval (Fig. 3). A crackle was defined as occurring when the increase in ΔE in two
10
successive intervals exceeded a preset value Λ = ΔEi+1/ΔEi; any further increase in ΔE was
then checked (ΔEi+2>ΔEi+1, etc.) and the crackle amplitude was identified as the highest-
magnitude sample in the last interval of the increasing ΔE sequence. On the basis of
preliminary identification trials with auditory controls of the unfiltered recordings, the settings
ΔT = 0.33 ms and Λ = 3 were found to provide the most reliable crackle identification results,
i.e. the lowest numbers of missed and falsely identified acoustic events.
Fig. 3: A short segment of a sound recording with superimposing crackles to illustrate the method
of identification of the location and amplitude of crackles. Top: sound intensity; bottom: sound
energy (ΔE) calculated for successive 0.33-ms intervals. A crackle is identified when the increase
in ΔE between two successive intervals exceeds a predetermined value (a); if there is a further
increase, the crackle amplitude is taken as the extreme value in the next interval (b).
3.2. Study-specific methods
3.2.1. Acoustic evidence of airway opening during recruitment (Study 1)
Diaphragmatic lung lobes (n=12) were isolated from 6 mongrel dogs. The animals were
anaesthetized with pentobarbital sodium (30 mg·kg-1), heparinized (5,000 U) and
exsanguinated through a femoral artery catheter. The procedure was approved by the
Institutional Animal Care and Use Committees of the University of Szeged and Boston
University. After thoracotomy, the lungs were removed, and the diaphragmatic lobes were
separated and cannulated in the main bronchus. Prior to the inflation manoeuvre, the lobe was
suspended in a 30-l glass box, with the bronchial cannula led to the atmosphere through a
11
high-resistance (6.5 hPa·l–1·s) screen pneumotachograph measuring �̇� with high precision by
means of a Validyne MP-45 (±2 hPa) differential pressure transducer.
The translobar pressure Ptl (the difference between the airway opening and box
pressures), was measured with another Validyne MP-45 (±30 hPa) transducer (Validyne Inc.,
Northridge, CA, USA). During the measurement, pressure was slowly increased from 0 to 30
hPa in 60-120 s by decreasing the box pressure (Pbox) with a membrane pump (model MP
03Ez, Otto Huber, Germany). The signals of �̇� and P were low-pass filtered at 50 Hz and
sampled at a rate of 256 Hz by the analogue-digital board of a personal computer.
A 5-mm diameter microphone was introduced through the sidearm of the cannula in the
main bronchus. The main techniques of sound recording and processing are described in
detail in sections 3.1.2 and 3.1.3. The LF energy content of the crackles was obtained by
digital low-pass filtering at 60 Hz and squaring the sound pressure amplitude. After the first
inflation from the collapsed state, the box was opened to atmosphere, and the lobe was kept at
Ptl = 0 for at least 5 min. The first inflation was followed by a second inflation of those lobes
(n = 7) which did not leak during the first manoeuvre, i.e., �̇� approached zero at high P values.
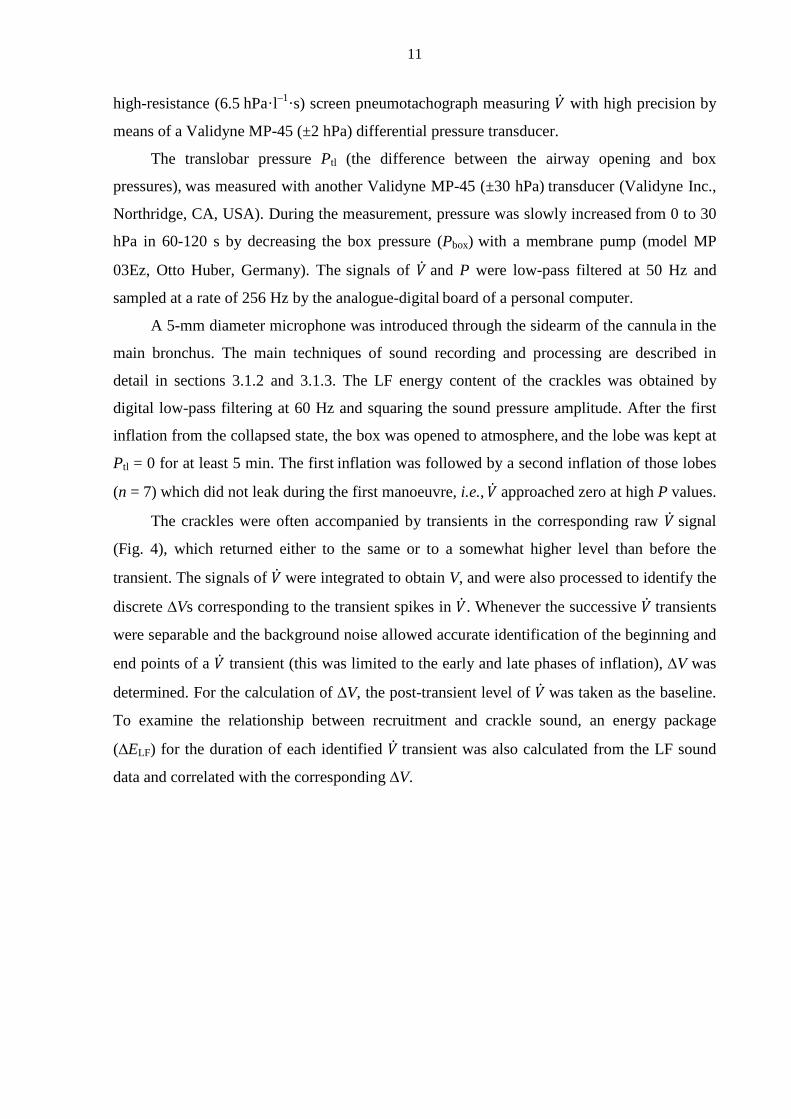
The crackles were often accompanied by transients in the corresponding raw �̇� signal
(Fig. 4), which returned either to the same or to a somewhat higher level than before the
transient. The signals of �̇� were integrated to obtain V, and were also processed to identify the
discrete ∆Vs corresponding to the transient spikes in �̇�. Whenever the successive �̇� transients
were separable and the background noise allowed accurate identification of the beginning and
end points of a �̇� transient (this was limited to the early and late phases of inflation), ∆V was
determined. For the calculation of ∆V, the post-transient level of �̇� was taken as the baseline.
To examine the relationship between recruitment and crackle sound, an energy package
(∆ELF) for the duration of each identified �̇� transient was also calculated from the LF sound
data and correlated with the corresponding ∆V.
12
Fig. 4: A short segment of a crackle sound pressure recording, its HF (>1 kHz) and LF (<60 Hz)
components, and the LF sound intensity with the corresponding flow signal (�̇�) (top to bottom,
respectively) to illustrate the calculation of discrete V increments (ΔV) and associated crackle
energy (ΔE). The beginning and end points of a �̇� transient (vertical lines) and the end-transient
level of flow (dashed lines) were determined visually. The shaded areas between two consecutive
beginning and end points indicate the cumulated LF crackle energy (ΔELF), whereas the shaded
areas above the end-transient �̇� provide the cumulated �̇� (ΔV). ΔELF1 and ΔV1 correspond to a
single crackle, whereas ΔELF2 and ΔV2 cover several crackles whose �̇� transients superimpose and
are difficult to separate.
13
3.2.2. Crackle recording to monitor recruitment in bronchoconstriction (Study 2)
After approval had been granted by the Ethics and the Animal Care Committees of the
Canton of Geneva (Geneva, Switzerland), 6 adult mini-pigs (17-25 kg) were studied in the
supine position. The animals were anaesthetized by the inhalation of sevoflurane (up to 5%)
until an intravenous (iv) line was secured into the ear; thiopentone (10 mg·kg−1) was then
injected iv. The mini-pigs were next tracheotomized with a polyethylene cannula (6.5 mm
internal diameter (ID); Portex, Hythe, UK) and mechanically ventilated (Model 900C;
Siemens-Elema, Solna, Sweden) with a tidal volume of 7-10 ml·kg−1 at a frequency of
15 min−1 and an inspired O2 fraction of 0.3 in air. A continuous infusion of fentanyl (10
µg·kg−1·h−1) via the ear vein was maintained throughout the study to ensure adequate
analgesia. Anaesthesia was maintained by the iv injection of thiopentone (5 mg·kg−1) every
45-60 min. The carotid artery was prepared surgically in a sterile manner and cannulated (28-
gauge catheter; Braun, Melsungen, Germany) for blood sampling and continuous arterial
blood pressure monitoring with a calibrated pressure transducer (model 156 PC 06-GW2;
Honeywell, Zürich, Switzerland). The jugular vein was prepared in the same way as the
femoral artery and cannulated for delivery of the constrictor agonist. Muscle relaxation was
achieved by the iv administration of pancuronium (0.2 mg·kg−1). The thorax was opened by
means of a midline thoracotomy following an additional iv bolus of fentanyl (25 µg·kg−1) and
the ribs were widely retracted. Following chest opening, a PEEP of 4 hPa was applied.
The airway P was measured continuously with a calibrated transducer (Validyne DP 45,
Validyne Inc., Northridge, CA, USA). The rectal temperature, monitored with a temperature
sensor (Thermalert, model TH-8; Physitemp, Clifton, NJ, USA), was maintained at 37±0.5 °C
with a heating pad (Miostar, Zürich, Switzerland). Arterial blood samples were analysed
radiometrically (model 505; Acid Base Laboratory, Copenhagen, Denmark) and, if necessary,
the mechanical ventilation parameters were adjusted to maintain normal gas exchange. The
concentrations of O2 and CO2 were monitored throughout the study (UltimaTM;
Datex/Instrumentarium, Helsinki, Finland).
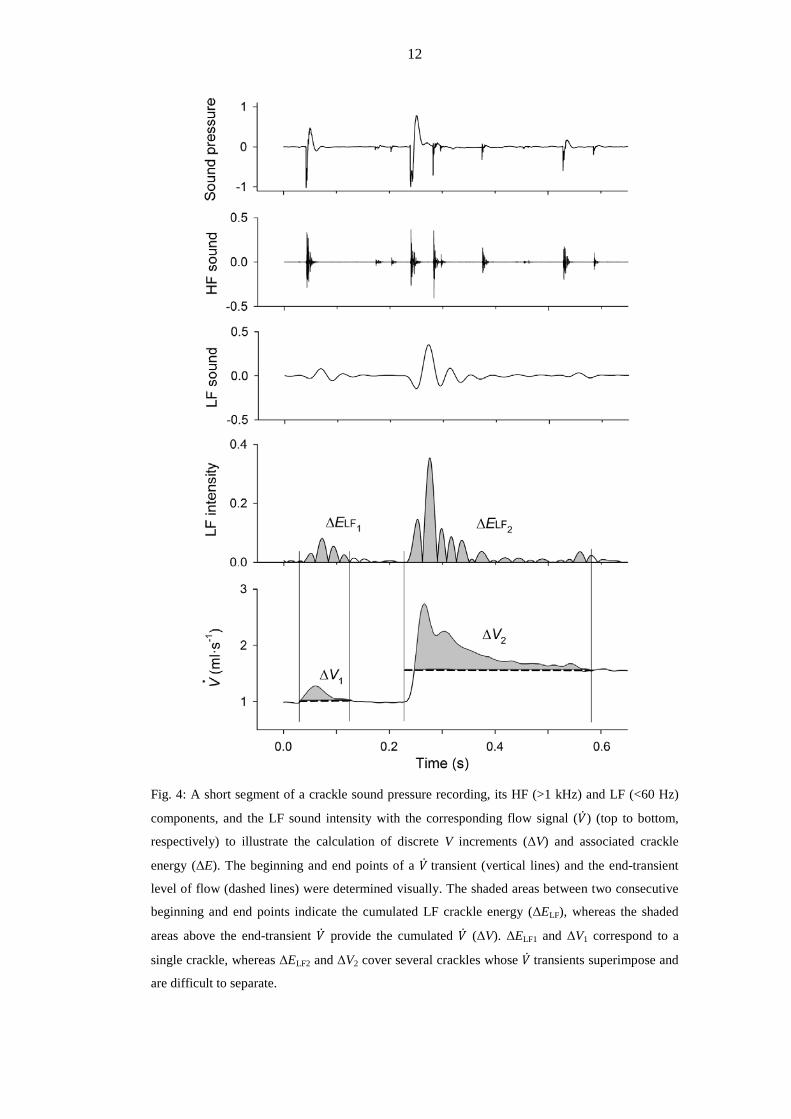
The measurement system (Fig. 5) for recordings of crackles, PL and �̇� during slow deep
reinflations, and collection of the ZL spectra of the lungs (the latter data are not included in the
present thesis) in the mini-pigs were similar to that used previously in other mammals [1, 40].
A screen pneumotachograph (11 mm ID) was used to measure �̇� with a differential P
transducer (model 33NA002D; ICSensors, Malpitas, CA, USA). An identical P transducer
was used to measure the Ptr with reference to atmosphere (PL) via a catheter positioned 1-2
14
cm beyond the end of the endotracheal tube. The tracheal cannula was detached from the
respirator at end expiration (at a PEEP of 1 or 4 hPa) and connected to a buffered compressed
air source. A water column was employed for limitation of PL to 30 hPa at the end of the
reinflation.
Fig. 5: Experimental set-up for the measurement of pulmonary input impedance and crackles in
pigs. Taps A, B and C were adjusted according to the phases of ventilation, forced oscillation or
slow inflation. PL: transpulmonary pressure; �̇�: gas flow.
The PL and �̇� signals were low-pass filtered at 25 Hz and sampled with an analogue-
digital board of a microcomputer at a rate of 256 Hz. The inspired V(t) was obtained by
numerical integration of �̇�.
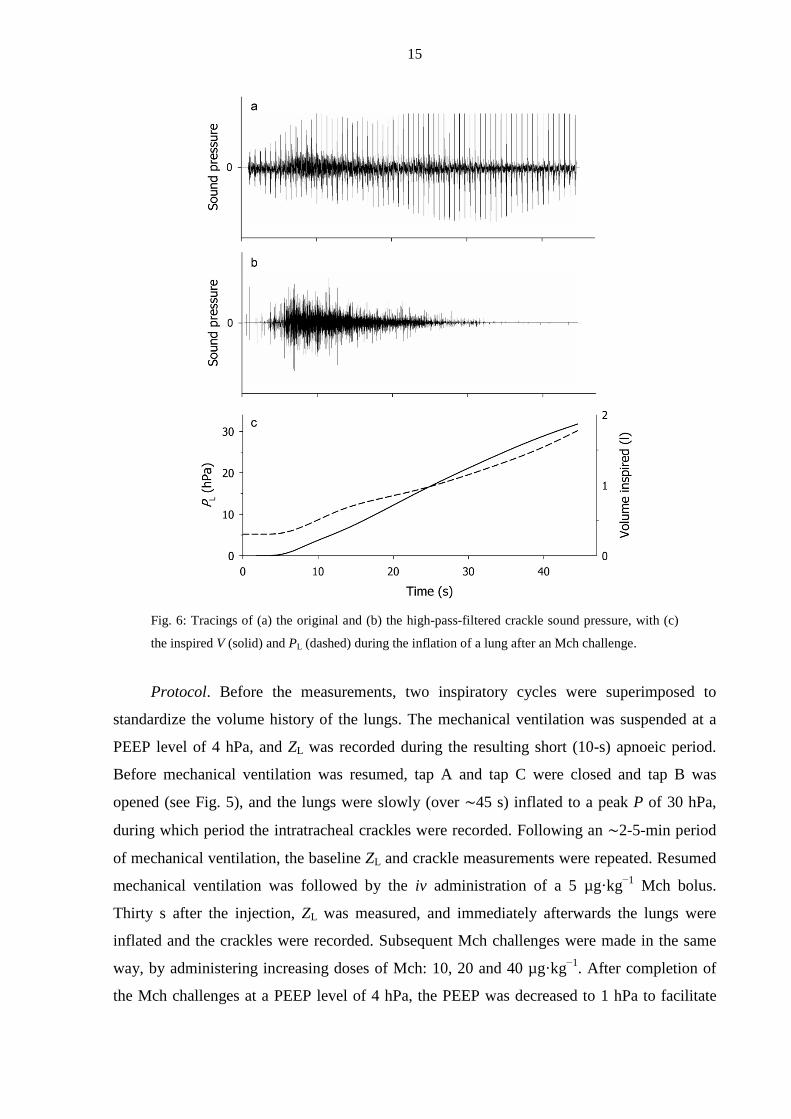
The measurement and the identification of crackles were carried out as described in
detail in sections 3.1.2 and 3.1.3. Figure 6 presents an example of the original sound, the high-
pass-filtered sound, and the lung inflation P and V following the iv injection of a 40 µg·kg−1
Mch bolus when a PEEP of 4 hPa was maintained. It can be seen that, although the cardiac
noise largely masked the crackles in the raw recording, the high-pass filtering diminished the
cardiac noise in the tracheal sound recording. The majority of the crackles, including the most
intense ones, appeared in the first third of the inflation.
15
Fig. 6: Tracings of (a) the original and (b) the high-pass-filtered crackle sound pressure, with (c)
the inspired V (solid) and PL (dashed) during the inflation of a lung after an Mch challenge.
Protocol. Before the measurements, two inspiratory cycles were superimposed to
standardize the volume history of the lungs. The mechanical ventilation was suspended at a
PEEP level of 4 hPa, and ZL was recorded during the resulting short (10-s) apnoeic period.
Before mechanical ventilation was resumed, tap A and tap C were closed and tap B was
opened (see Fig. 5), and the lungs were slowly (over ∼45 s) inflated to a peak P of 30 hPa,
during which period the intratracheal crackles were recorded. Following an ∼2-5-min period
of mechanical ventilation, the baseline ZL and crackle measurements were repeated. Resumed
mechanical ventilation was followed by the iv administration of a 5 µg·kg−1 Mch bolus.
Thirty s after the injection, ZL was measured, and immediately afterwards the lungs were
inflated and the crackles were recorded. Subsequent Mch challenges were made in the same
way, by administering increasing doses of Mch: 10, 20 and 40 µg·kg−1. After completion of
the Mch challenges at a PEEP level of 4 hPa, the PEEP was decreased to 1 hPa to facilitate
16
lung derecruitment. The experimental procedure was then repeated while this P level was
maintained during the ZL recordings, and the subsequent inflation was also started from 1 hPa.
The number of crackles (NC) data obtained in the two baseline recordings were
averaged. The lack of mechanical ventilation between the ZL measurement and the crackle
recording guaranteed that these measurements reflected the same lung condition.
The precision of the parameters is expressed as mean±SEM. The Kolmogorov–Smirnov
test was used to test data for normality. Two-way repeated measures ANOVA using a linear
mixed model was used to test significance with two within-subject factors: the Mch dose and
the PEEP level. In the mixed model, a composite covariance model with separate covariance
structures was specified for each of the repeat factors: equal correlations were assumed for the
PEEP, and a first-order autoregressive covariance structure was applied for the Mch dose. The
choice of these covariance models was verified with likelihood ratio tests. For pairwise
comparisons, 95% confidence intervals for the differences were computed by taking into
account the significant interactions between the factors. Since NC was not normally
distributed, the changes in this parameter were tested after logarithmic transformation. The
significance level was set at p<0.05.
3.2.3. Crackles and airway function in emphysematous mice (Study 3)
Female CBA/Ca mice were anaesthetized with an intraperitoneal injection of
pentobarbital sodium (75 mg·kg–1) and intubated with a 20-mm-long, 0.8-mm inner diameter
polyethylene cannula under the guidance of a cold light source (model FLQ85E, Helmuth
Hund, Wetzlar, Germany), according to the technique described in detail previously [60]. The
PPE-treated animals received PPE (Sigma-Aldrich Hungary, Budapest, Hungary) in 50 µl of
saline in one or other of two doses: 0.3 IU (n=15) and 0.6 IU (n=4) via intratracheal
instillation. The control animals (n=19) received 50 µl of saline only. Three weeks thereafter,
the mice were anaesthetized with an intraperitoneal injection of pentobarbital sodium (75
mg·kg–1), tracheotomized, and cannulated with a 0.8-mm ID polyethylene tube. The animals
were placed in the supine position in a custom-built 160-ml body plethysmograph and
ventilated transmurally with a small-animal respirator (Harvard Apparatus, South Natick,
MA) at a rate of 160 min–1, a tidal V of 0.25 ml, and a PEEP of 2 hPa. Supplementary doses
of pentobarbital sodium (15 mg·kg–1) were administered as needed, generally at the beginning
of the measurements. The study protocol was approved by the Institutional Animal Care and
Use Committees of the University of Szeged and Boston University.
17
Nineteen treated animals received PPE in 50 µl of saline in one or other of two doses:
0.3 IU (n=15) and 0.6 IU (n=4) via intratracheal instillation, and 19 control mice received
saline only. Three weeks thereafter, the animals were anaesthetized, tracheotomized,
cannulated with a polyethylene tube, placed in the supine position in a custom-built body
plethysmograph and ventilated transmurally with a small-animal respirator with a tidal
volume of 0.25 ml, and a PEEP of 2 hPa (Fig. 7).
The TGV at end expiration at zero transrespiratory pressure (FRC) was measured with
the plethysmographic technique [61], modified recently for the measurement of TGV in
anaesthetized mice that have a weak or no respiratory effort [62]. Pbox and tracheal pressure
(Ptr) were measured with miniature pressure transducers (model 8507C-2, Endevco, San Juan
Capistrano, CA) during stimulation of the intercostal muscles. The FRC was estimated from
the Pbox vs Ptr relationship on the basis of Boyle's principle, as detailed previously [62].
Following the measurement of the FRC, 14 control (group C1) and 14 elastase-treated
mice (group E1) were used to obtain V(t) and the TGV as a function of time
[TGV(t) = FRC + V(t)]. Transrespiratory pressure (Prs) was calculated as Ptr - Pbox. In 5
control (group C2) and 5 treated mice (group E2), the measurement of the FRC was followed
by deflation to the RV, which was accomplished by elevating Pbox to 20 hPa; subsequently,
Pbox was lowered to -35 hPa to allow an estimate of the TLC. The box was then opened to
atmosphere via a resistor to permit passive deflation. During this deflation-inflation-deflation
manoeuvre, �̇� was measured. The expiratory reserve volume (ERV) was determined by
integration, and the RV was obtained as FRC - ERV.
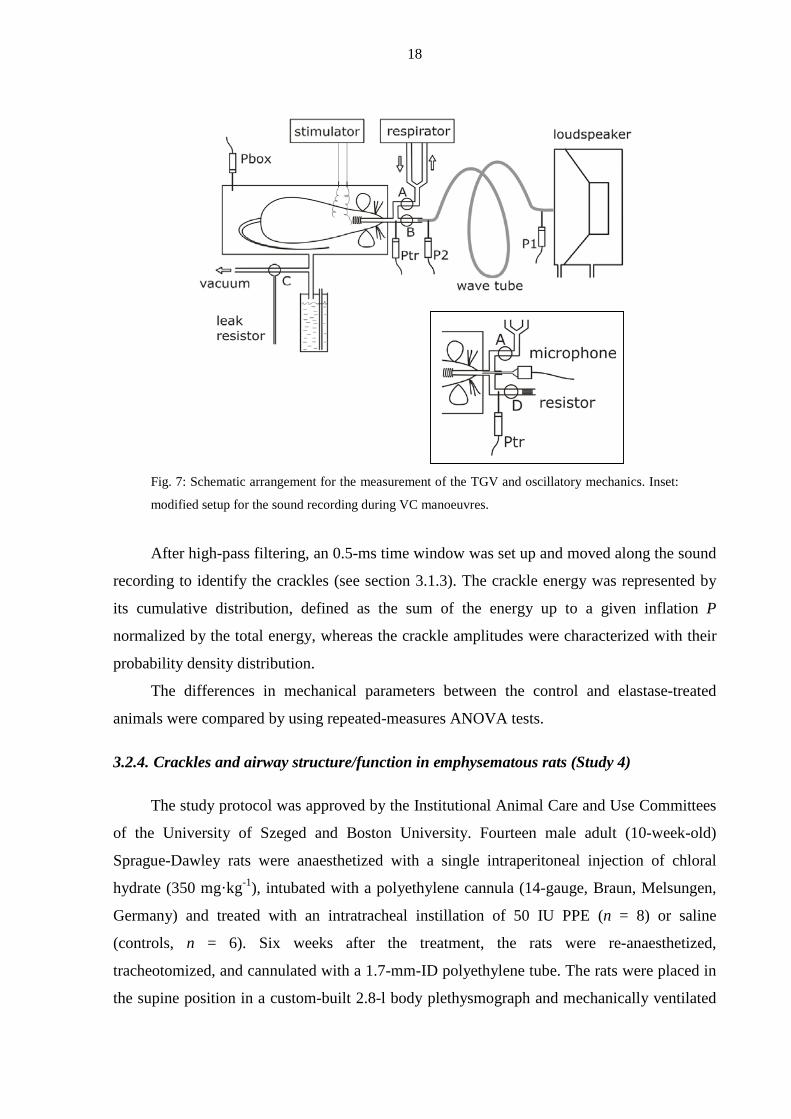
For the measurements in groups C2 and E2, the setup was modified so that a
microphone ending in a 15-mm-long, 0.7-mm outer diameter metal tube was connected to the
tracheal tube adaptor of the plethysmograph (Fig. 7, inset). Tracheal sound was recorded
during reinflation from the RV (Pbox = 20 hPa) to TLC (Pbox = -35 hPa) at a sampling rate of
44 kHz and 16-bit resolution. With stopper A closed and stopper B open, the tracheal �̇� was
measured as the pressure drop (Ptr) across a capillary bundle resistor while the microphone
recorded the sound.
18
Fig. 7: Schematic arrangement for the measurement of the TGV and oscillatory mechanics. Inset:
modified setup for the sound recording during VC manoeuvres.
After high-pass filtering, an 0.5-ms time window was set up and moved along the sound
recording to identify the crackles (see section 3.1.3). The crackle energy was represented by
its cumulative distribution, defined as the sum of the energy up to a given inflation P
normalized by the total energy, whereas the crackle amplitudes were characterized with their
probability density distribution.
The differences in mechanical parameters between the control and elastase-treated
animals were compared by using repeated-measures ANOVA tests.
3.2.4. Crackles and airway structure/function in emphysematous rats (Study 4)
The study protocol was approved by the Institutional Animal Care and Use Committees
of the University of Szeged and Boston University. Fourteen male adult (10-week-old)
Sprague-Dawley rats were anaesthetized with a single intraperitoneal injection of chloral
hydrate (350 mg·kg-1), intubated with a polyethylene cannula (14-gauge, Braun, Melsungen,
Germany) and treated with an intratracheal instillation of 50 IU PPE (n = 8) or saline
(controls, n = 6). Six weeks after the treatment, the rats were re-anaesthetized,
tracheotomized, and cannulated with a 1.7-mm-ID polyethylene tube. The rats were placed in
the supine position in a custom-built 2.8-l body plethysmograph and mechanically ventilated
19
with a small-animal respirator (Harvard Apparatus, South Natick, MA) at a rate of 80 min–1
and a tidal V of 8 ml·kg-1. Following the measurements, the animals were killed with an
overdose of anaesthetics and the lungs were removed for histopathological evaluation.
The FRC was measured with the body plethysmographic technique [61, 62]. The
inspiratory capacity (IC) and the ERV, respectively, were defined as the V changes resulting
from decreasing Pbox to -35 hPa and increasing it to 20 hPa, respectively. The TLC and RV
were calculated as TLC = FRC + IC and RV = FRC - ERV.
Zrs was measured with the wave tube pseudorandom forced oscillation method [59, 63],
between 0.5 and 16 Hz at the FRC, during 6-s interruptions of mechanical ventilation.
Constant-phase model parameters (Raw, H, G and I) were estimated from 5-6 successive
recordings.
Intratracheal sounds were recorded during slow (~20-s) inflations from the degassed
state of the lungs to the TLC. Degassing was accomplished by 10-min ventilation with 100%
O2 and the subsequent ERV manoeuvre, followed by tracheal occlusion for 10 s; the
degassing-reinflation manoeuvre was repeated 2 more times in each animal. A 15-mm metal
tube (0.7-mm OD) attached to the microphone was positioned in the tracheal cannula. Sound
was recorded at a sampling rate of 44 kHz with 16-bit resolution, and was high-pass filtered at
2 kHz. Individual crackle events were identified in 0.33-ms time windows. The sound
recording and processing are described in detail in sections 3.1.2 and 3.1.3.
After the measurements, the rats were euthanized with an overdose of anaesthetics. The
heart and lungs were removed en bloc, and stored in formaldehyde for 7 days before
embedding in paraffin. Three transversal sections were made at 25, 50 and 75% lung height
and stained for standard morphometry (haematoxylin-eosin staining; data not reported in this
thesis), and with elastin and collagen.
The whole sections were scanned for the identification of bronchi suitable for further
analyses with a circularity >50%. From the readings of bronchial perimeter (Pb) the diameter
of an equivalent circular cross-section (Db) was calculated. The mean wall thickness (Tw) was
established from 3-4 measurements, and the number of septal attachments (Ns) was
determined for each airway. The septal attachment density was calculated as Ns/Pb.
To visualize the elastin and collagen contents in the airway wall, the reliable method of
Verhoeff−Van Gieson and Mason’s trichrome staining were used. Quantitative analysis of the
elastin and collagen densities was performed on randomly selected lung sections, using
custom-made software.

20
The differences in lung V and mechanical parameters between the control and PPE-
treated rats were compared by using Student's t-test. All the results were expressed as
mean±SD. Distributions were compared by using the Kolmogorov−Smirnov test. The
dependences of Tw on Db in the two groups were tested by analysis of co-variance. A p value
of less than 0.05 was considered statistically significant.
21
4. Results
4.1. Acoustic evidence of airway opening during recruitment (Study 1)
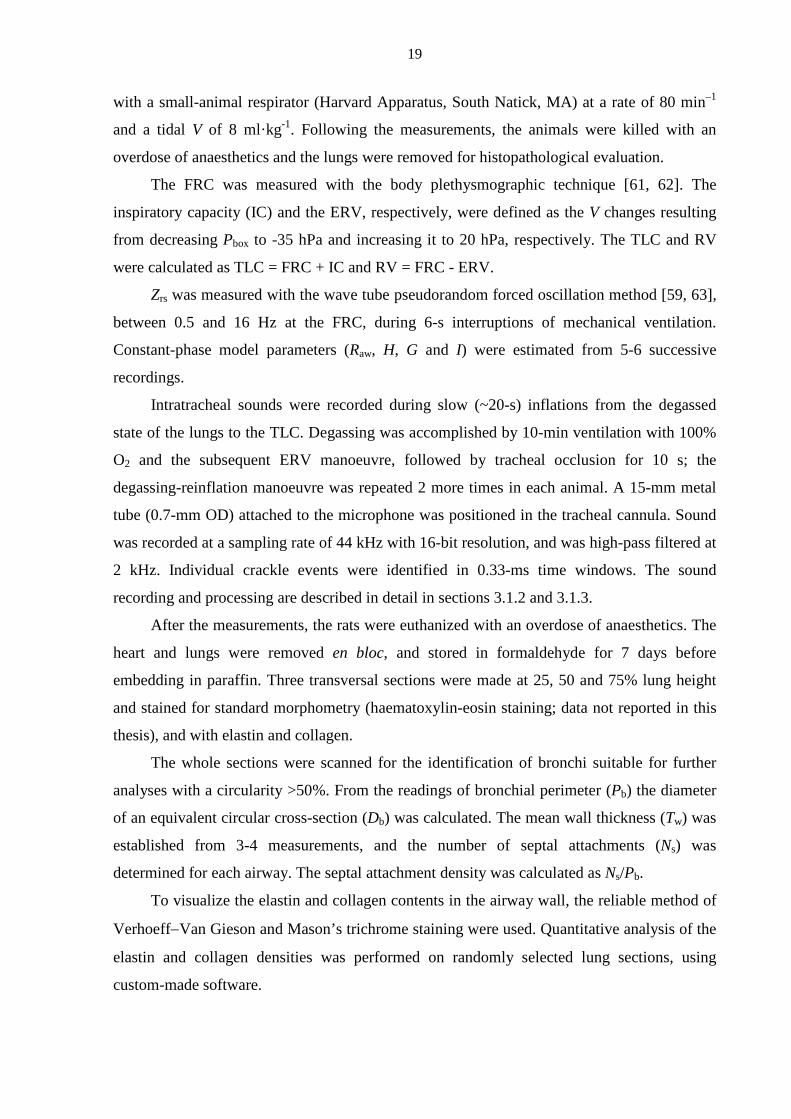
Representative traces of crackle sound, Ptl and central �̇� during the entire recordings are
shown in Fig. 8 for both the first and second inflations. In the early phase of inflation, the
crackles possessed large amplitudes and were well separated from each other. As inflation
continued, the density of acoustic events increased, to the accompaniment of a decrease in
crackle amplitudes. In these dense intervals, the crackles became inseparable from each other
in the raw recordings. Ptl steadily increased throughout the course of the entire inflation. The
�̇� traces consisted of a series of spikes superimposed on a slowly varying mean �̇� level.
During the first inflation, the mean �̇� exhibited a single maximum, whereas the second
inflation was characteristically biphasic, with two distinct maxima: the first rise in the mean �̇�
included massive �̇� transients accompanied by a significant crackle activity. The mean �̇� then
decreased temporarily before a second rise, which was similar in character to that during the
first inflation at the same VL.
Fig. 8: Recordings of crackle sound pressure (top), inflation flow (bottom, solid lines) and Ptl
(bottom, dashed lines) during the first 35 s of the first inflation (left) and second reinflation (right)
of a lobe. Note the biphasic pattern and greater �̇� transients during the second manoeuvre.
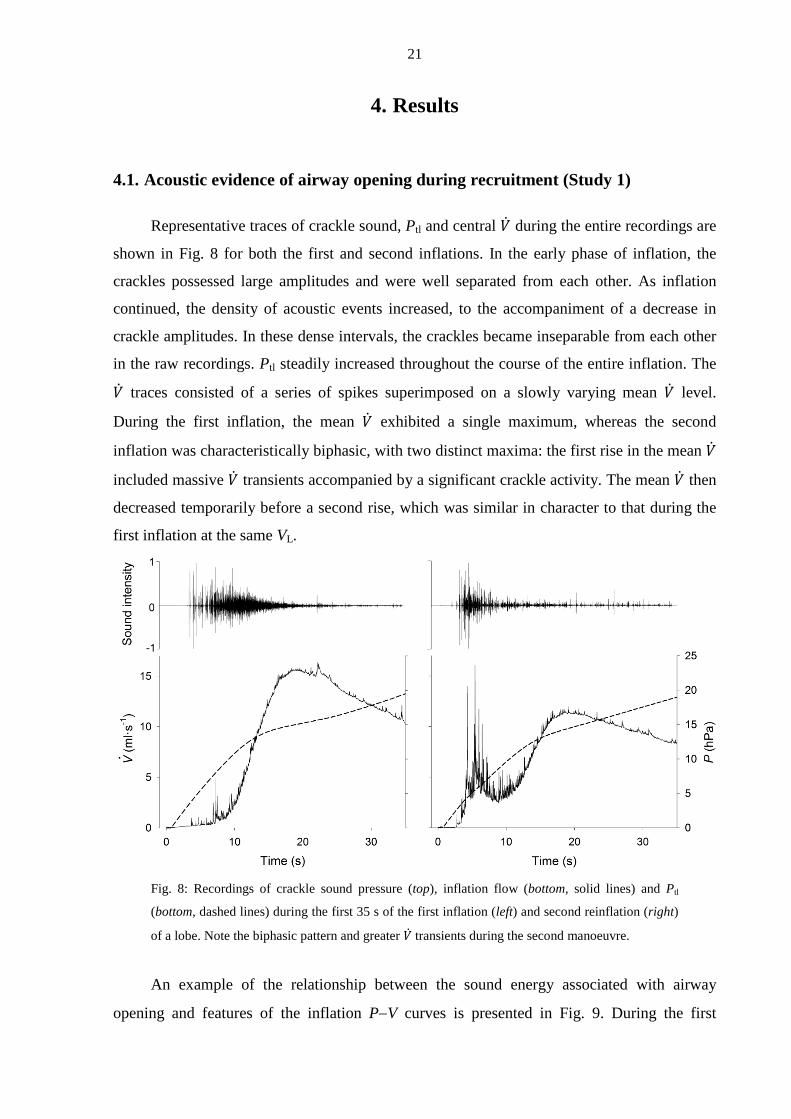
An example of the relationship between the sound energy associated with airway
opening and features of the inflation P−V curves is presented in Fig. 9. During the first
22
inflation, the P−V curves always exhibited a single characteristic lower knee. The
corresponding acoustic activity, as characterized by the values of ∆E, increased quickly and
irregularly and remained high until a Ptl ~10 hPa was attained. The acoustic activity then
decreased very regularly by 4 to 5 orders of magnitude, which coincided with the steep rise in
V until the P reached the upper knee in the P−V curve. This was followed by another irregular
pattern, during which epochs of large values of ∆E emerged from the low acoustic activity,
indicating the occurrence of sparse, but still relatively large crackles. Although crackles were
detected throughout the entire inflation process, the cumulated energy as a function of Ptl had
reached 94-98% of its final value by the lower knee. During the second inflations, the P−V
curves always exhibited two distinct lower knees, corresponding to the two maxima observed
in the mean �̇�. The large values of ∆E during its fast rise occurred around the first knee in the
P−V curve, and the increase in energy was even steeper, reaching its plateau value at much
lower values of P than during the first inflation.
Fig. 9: Dependences of inflation volume (V; thick lines), sound energy calculated for successive
0.25-s intervals (∆E; dots), and cumulated sound energy (E; thin lines), all normalized by the
corresponding maximum value (Vmax, ∆Emax, and Emax, respectively), on the Ptl in a lobe during the
first (left) and second (right) inflation. Note the log scale for ∆E.
23
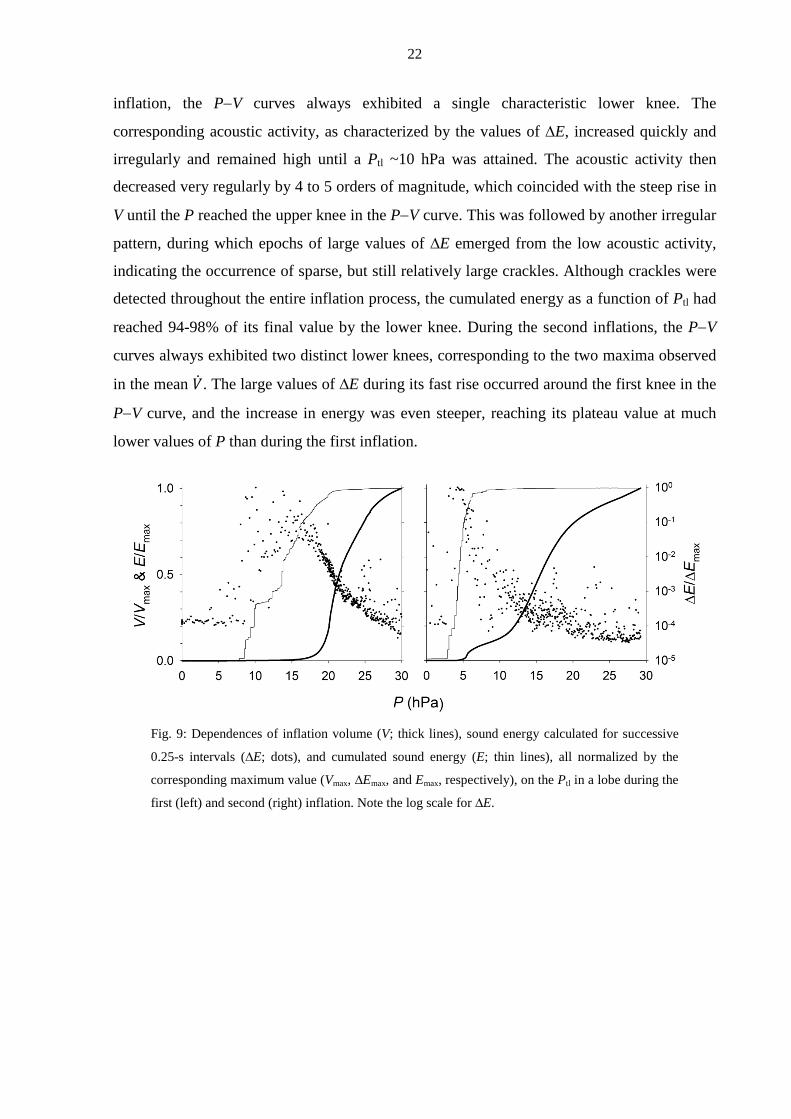
Fig. 10: A segment of a crackle (top) and �̇� recording (bottom) during reinflation of a lobe. HF
and LF sound energy data (in arbitrary units) were computed from high-pass-filtered (>1 kHz) and
low-pass-filtered (<60 Hz) sound intensity, respectively. The individual crackles have different
HF/LF energy contents, and the size of a transient may correlate with the HF energy (a) or the LF
energy (b). Some transients are followed by increased mean flow (d), whereas others (c) are not.
When a short segment of a recording from an early phase of inflation was taken, where
crackles were relatively rare and the transients were well separated (Fig. 10), the relation
between crackles and transients could be examined. Every �̇� transient was clearly marked by
a crackle or a burst of crackles, whereas not every acoustic event was accompanied by a
detectable transient in �̇�. It was also clear, however, that crackles of similar amplitude may
correspond to either a relatively large or a much smaller �̇� transient. Through determination
24
of the LF (<60 Hz) and HF (>1 kHz) components of each crackle, it could be demonstrated
that crackles with significant LF energy were always associated with detectable transients in
�̇�, whereas those that had low LF energy were not. Another interesting feature of these data
was that, after a �̇� transient marked by crackles with significant LF energy, the mean level of
�̇� was usually elevated.
Fig. 11: Relationships between the values of discrete ∆V and the corresponding ∆ELF pooled for all
lobes for the first (A) and second (B) inflations.
To quantify the observed relationship between the LF energy of crackles and the
recruited volumes associated with the �̇� transients, the corresponding pairs of ∆ELF and ∆V
pooled for all lobes were plotted. Linear regressions were carried out in the log-log domain
(log∆ELF = δ·∆log∆V + C), and according to the unpaired t-test on these data, the slopes δ of
the regression lines were significantly larger than unity for both the first (p<0.002) and the
second (p<0.001) inflation. Additionally, the slope corresponding to the second inflation
(δ =1.50±0.03) was significantly larger (p<0.001) than that corresponding to the first inflation
(δ =1.18±0.04). The relationship ∆ELF = C·∆Vδ was stronger for the second (r2 = 0.73) than
for the first inflation (r2 = 0.44). In the individual lobes too, the second inflations always
resulted in higher correlation coefficients (r2 = 0.68 - 0.82) than those for the first manoeuvres
(r2 = 0.29 - 0.73).
To characterize the irregularities in ∆V and to calculate their probability density
distribution, all data were combined (Fig. 12). The distribution probability of ∆V peaked
between 0.02 and 0.05 ml and then decreased linear by in the log-log graph, indicating that the
tail of the distribution follows a power law, i.e. p(∆V) ∼ ∆V-γ. The exponents γ were 2.02±0.09
and 1.88±0.14 for the first and the second inflations, respectively. The exponent γ during the
25
first inflation was not significantly different from 2. However, even though γ from the second
inflation was only 6% smaller than the theoretically expected value of 2, or 7% smaller than
the value of 2.02 from the first inflation, this difference was statistically significant (p<0.03).
Fig. 12: Log-log plots of the probability distributions of discrete ∆V pooled from all first (A) and
second (B) inflations. The lengths of the regression lines (solid lines) correspond to the ranges
included in the regressions.
4.2. Crackle recording to monitor recruitment in bronchoconstriction (Study 2)
An example of the inflation PL−V curves and the distributions of NC, obtained under the
control conditions and after the two highest doses of Mch at both PL levels, is presented in
Fig. 13. At a PL of 4 hPa, the bottom knee in the PL−V diagram was not apparent until the
highest doses of Mch, whereas it was typically observed even under the control conditions at
1 hPa. It is worth noting that, in general, the crackle intensity increased significantly before
the PL−V curve displayed any alteration indicative of the development of the bottom knee
(Fig. 13c). The histograms of the crackles exhibited their maxima at or slightly above the
bottom knee and decayed rapidly around the highest slope of the PL−V curve. The crackles
disappeared before the upper knee was reached in the PL−V diagram.
26
Fig. 13: Inspired V and NC vs PL from a typical experiment. Panels a, c and e show inflations from
a PL of 4 hPa under the control conditions and after 20 and 40 mg·kg−1 of Mch, respectively.
Panels b, d and f relate to the corresponding inflations from a PL of 1 hPa in the same animal.
Increasing doses of Mch induced progressive increases in NC (Table 1), with statistically
significant elevations from the control values first being observed at the dose of 20 µg·kg−1 at
the PEEP of 4 hPa; overall, an average 38-fold rise occurred in NC between the control level
and the highest Mch dose. Statistical significance was reached already at the lowest dose at 1
hPa, where the crackle activity was already considerable (>1,000) under the control
conditions, whereas at the highest 3 doses the PEEP dependence of the crackle number
disappeared.
27
Table 1. Mean±SD values of NC at two PEEP levels and different Mch doses.
control Mch 5 µg·kg−1 Mch 10 µg·kg−1 Mch 20 µg·kg−1 Mch 40 µg·kg−1
PEEP=1 hPa 1,494±1,383# 1,517±1,385*# 1,936±1,810* 3,464±3,972* 3,539±1,575*
PEEP=4 hPa 87±67 331±320 636±712 2,062±3,186* 3270±3,137*
*Significantly different (p<0.05) from the corresponding control data; #significantly different from the data at
PEEP=4 hPa.
4.3. Crackles and airway function in emphysematous mice (Study 3)
PPE treatment resulted in statistically highly significant changes in VLs. The FRC and
TGV20 (the TGV at a Prs of 20 hPa) increased by 52 and 45% in group C1 and group E1,
respectively, relative to the control. The average TGV vs Prs curves also reflected significantly
different values (p<0.001) between the groups at all Prs levels. The ratios of the TGV between
the groups at the same Prs were fairly constant, suggesting a nearly proportional increase in
TGV at all Prs values, i.e., an unchanged shape of the P−V loops. The inspiratory volume
(TGV20 - FRC) increased by 37% in the treated animals.
The changes in the mechanical parameters were most marked in H, which decreased by
57 and 27% at Prs values of 0 and 20 hPa, respectively. Small, but statistically insignificant
decreases were observed in Raw at both 0 hPa (-2%) and 20 hPa (-10%).
The vital capacity (VC) manoeuvres performed in the group C2 and group E2 animals
also revealed marked differences in all VLs but the RV; a typical example is shown in Fig.
14A. Interestingly, the P at the bottom knee in the TGV−Prs curve decreased on average by
5.5 hPa in the treated animals.
28
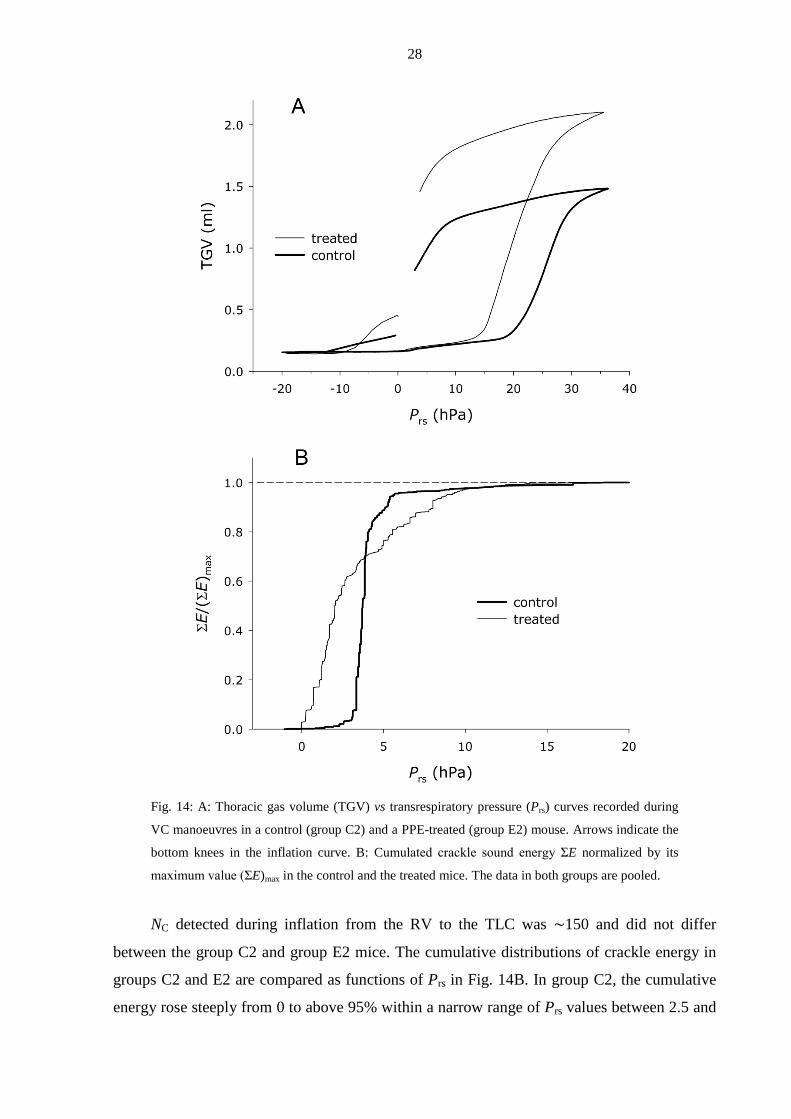
Fig. 14: A: Thoracic gas volume (TGV) vs transrespiratory pressure (Prs) curves recorded during
VC manoeuvres in a control (group C2) and a PPE-treated (group E2) mouse. Arrows indicate the
bottom knees in the inflation curve. B: Cumulated crackle sound energy ΣE normalized by its
maximum value (ΣE)max in the control and the treated mice. The data in both groups are pooled.
NC detected during inflation from the RV to the TLC was ∼150 and did not differ
between the group C2 and group E2 mice. The cumulative distributions of crackle energy in
groups C2 and E2 are compared as functions of Prs in Fig. 14B. In group C2, the cumulative
energy rose steeply from 0 to above 95% within a narrow range of Prs values between 2.5 and
29
∼5 hPa. In contrast, the cumulative energy in the group E2 rose almost immediately at the
start of inflation, but reached 95% only by a Prs of ∼9 hPa. Despite the grossly different rates
of crackle energy release during inflation, the probability distributions (Π) of the crackle
amplitudes in the two groups were very similar (Fig. 15).
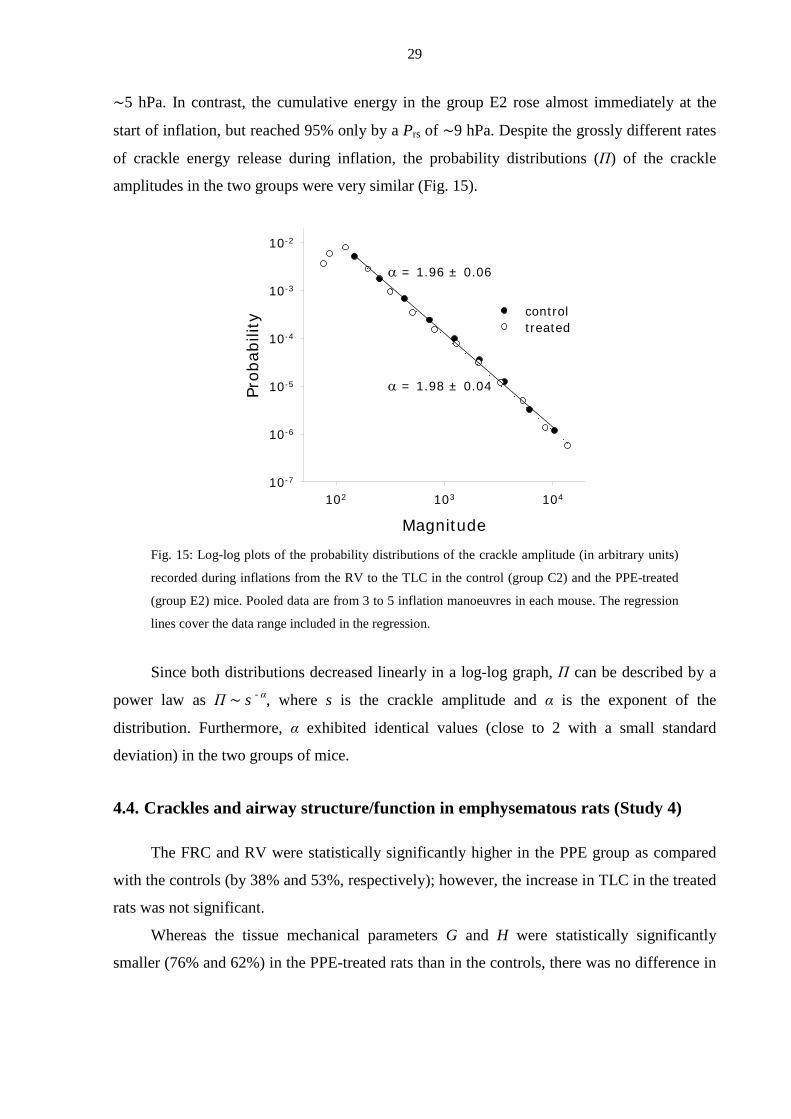
Fig. 15: Log-log plots of the probability distributions of the crackle amplitude (in arbitrary units)
recorded during inflations from the RV to the TLC in the control (group C2) and the PPE-treated
(group E2) mice. Pooled data are from 3 to 5 inflation manoeuvres in each mouse. The regression
lines cover the data range included in the regression.
Since both distributions decreased linearly in a log-log graph, Π can be described by a
power law as Π ∼ s - α, where s is the crackle amplitude and α is the exponent of the
distribution. Furthermore, α exhibited identical values (close to 2 with a small standard
deviation) in the two groups of mice.
4.4. Crackles and airway structure/function in emphysematous rats (Study 4)
The FRC and RV were statistically significantly higher in the PPE group as compared
with the controls (by 38% and 53%, respectively); however, the increase in TLC in the treated
rats was not significant.
Whereas the tissue mechanical parameters G and H were statistically significantly
smaller (76% and 62%) in the PPE-treated rats than in the controls, there was no difference in
Magnitude102 103 104
Prob
abili
ty
10-7
10-6
10-5
10-4
10-3
10-2
controltreated
α = 1.96 ± 0.06
α = 1.98 ± 0.04
30
Raw between the groups. Because of the larger differences in H, tissue hysteresivity
(η = G/H) was elevated (129%) in the treated rats.
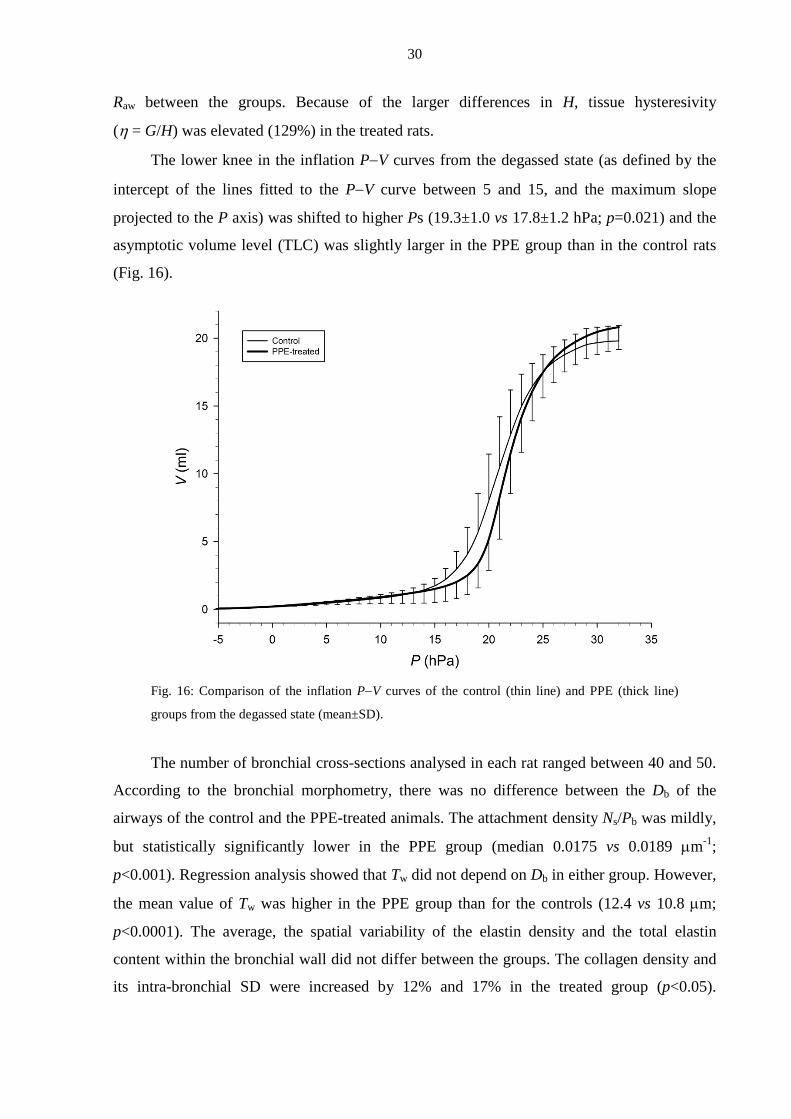
The lower knee in the inflation P−V curves from the degassed state (as defined by the
intercept of the lines fitted to the P−V curve between 5 and 15, and the maximum slope
projected to the P axis) was shifted to higher Ps (19.3±1.0 vs 17.8±1.2 hPa; p=0.021) and the
asymptotic volume level (TLC) was slightly larger in the PPE group than in the control rats
(Fig. 16).
Fig. 16: Comparison of the inflation P−V curves of the control (thin line) and PPE (thick line)
groups from the degassed state (mean±SD).
The number of bronchial cross-sections analysed in each rat ranged between 40 and 50.
According to the bronchial morphometry, there was no difference between the Db of the
airways of the control and the PPE-treated animals. The attachment density Ns/Pb was mildly,
but statistically significantly lower in the PPE group (median 0.0175 vs 0.0189 µm-1;
p<0.001). Regression analysis showed that Tw did not depend on Db in either group. However,
the mean value of Tw was higher in the PPE group than for the controls (12.4 vs 10.8 µm;
p<0.0001). The average, the spatial variability of the elastin density and the total elastin
content within the bronchial wall did not differ between the groups. The collagen density and
its intra-bronchial SD were increased by 12% and 17% in the treated group (p<0.05).
31
Furthermore, the inter-airway variance of the collagen density was substantially higher (67%,
p<0.01) in the treated animals. The densities of elastin and collagen did not correlate with Db.
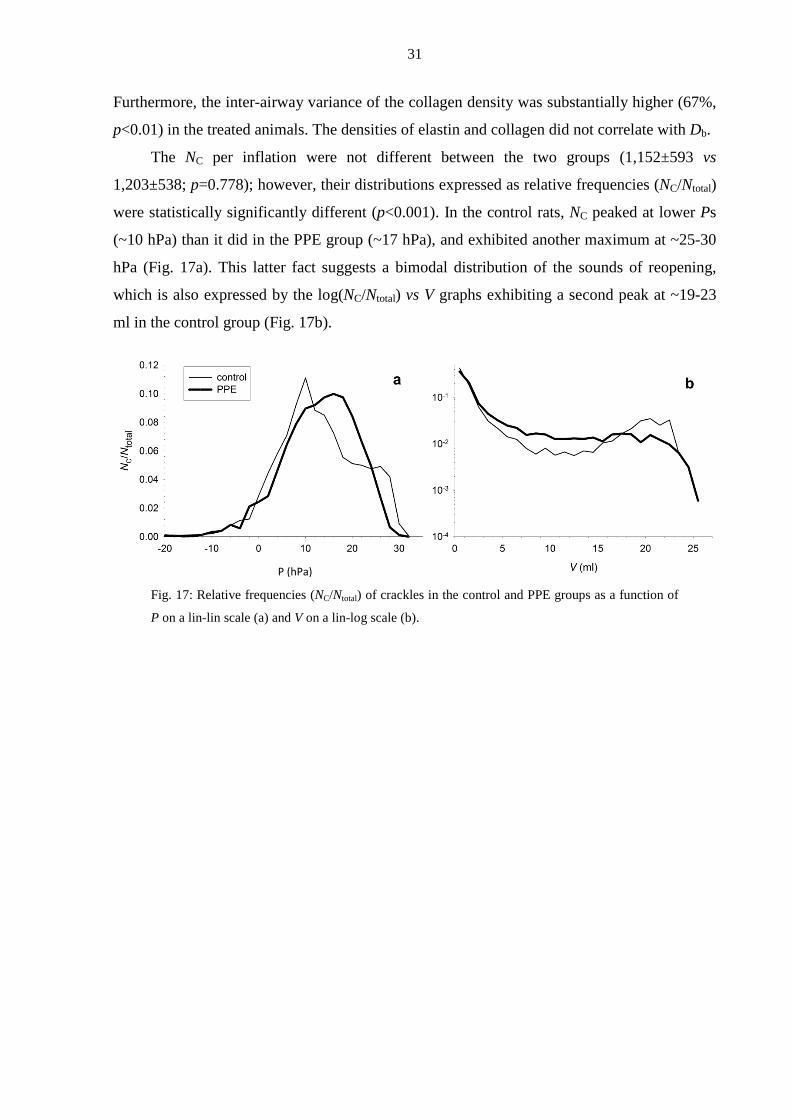
The NC per inflation were not different between the two groups (1,152±593 vs
1,203±538; p=0.778); however, their distributions expressed as relative frequencies (NC/Ntotal)
were statistically significantly different (p<0.001). In the control rats, NC peaked at lower Ps
(~10 hPa) than it did in the PPE group (~17 hPa), and exhibited another maximum at ~25-30
hPa (Fig. 17a). This latter fact suggests a bimodal distribution of the sounds of reopening,
which is also expressed by the log(NC/Ntotal) vs V graphs exhibiting a second peak at ~19-23
ml in the control group (Fig. 17b).
Fig. 17: Relative frequencies (NC/Ntotal) of crackles in the control and PPE groups as a function of
P on a lin-lin scale (a) and V on a lin-log scale (b).
P (hPa)
32
5. Discussion
5.1. Acoustic evidence of airway opening during recruitment (Study 1)
In this study, we investigated the possibility that the process of airway opening
contributes to alveolar recruitment and the lower knee in the P−V curve of the lung. We
employed an experimental setup in which the P−V curve and crackles, as indicators of airway
opening, were simultaneously recorded in isolated dog lung lobes. The main findings were
that 1) recruitments occurred in discrete ∆Vs; 2) the discrete ∆Vs were accompanied by
crackles carrying LF energy; 3) in the presence of trapped air, the inflation exhibited a
biphasic behaviour resulting in two distinguishable lower knees in the P−V curve; and 4) the
distribution of ∆V followed a power law.
A characteristic feature of the results was that, for both the first and second inflations,
the vast majority of the crackles occurred before �̇� reached its maximum value (Fig. 8). Since
crackles are successively attenuated at every bifurcation as they propagate from the site of
generation towards the trachea [5], this pattern suggests that the opening phenomena
progressed from the central to the peripheral airways. The attenuation factor can be calculated
from the ratio of cross-sectional areas at bifurcations, and it has been reported to be ~0.65 for
the airway tree of the dog [5]. As every bifurcation attenuates the crackle amplitude by 0.65
on average, crackles that were generated deeper in the lung became significantly attenuated
once they passed >10 bifurcations. Indeed, as shown in Fig. 9, the sound energy decreased by
several orders of magnitude when the inflation reached the lower knee in the P−V curve, and
this is consistent with the decreasing envelope of the crackle time series.
During the second inflation, the cumulative sound energy reached its 95% level at a
lower inflation P as compared with the first inflation, which was accompanied by a biphasic
shape of the �̇� vs time curve (Fig. 8) and two separate lower knees in the P−V curve (Fig. 9).
We explain the biphasic process in the second inflations as follows. Since the lobes were not
degassed after the first inflation, increased air trapping occurred, as indicated by an apparently
greater lobe size before the second inflation was started. The airways leading to the trapped
air regions opened first in the inflation process, and this resulted in transients in �̇� greater than
those observed in the first inflation; in view of the fact that the subtended clusters of open
alveoli were ready to accommodate a higher �̇� at the moment of the airway opening, the
elevation in V can be sudden (Fig. 9) and associated with a halt in the P increase, even leading
33
to an unstable P−V relationship [64]. Subsequently, the reopened trapped regions became
distended, causing a fall in the central �̇�, due to the rest of the collapsed lobe still being in an
early phase of recruitment. As the open regions continued to inflate, P increased further,
which in turn resulted in a gradual opening of the remaining collapsed regions. The biphasic
pattern of reopening was characteristic of any subsequent inflations occasionally performed
(results not shown). Although such a behaviour may also occur during the inflation of in vivo
lungs under conditions where regions of trapped air and atelectasis coexist, caution is
demanded in the extrapolation of these results to the inflation of the ARDS lung, where the
situation is further complicated by a surfactant dysfunction and/or flooding of the alveoli [26].
Crackles can be regarded as direct signatures of individual airway openings, which can
be considered “microscopic” events contributing to the “macroscopic” P−V curve of the lung
[32]. The mechanism by which a crackle sound is generated is not well understood, but
several concepts have been proposed [8, 24, 32]. We believe that the mechanism that is most
likely in the excised lungs that we studied is that crackles are a consequence of the rapid
break-up of the fluid meniscus inside a closed airway, with a small amount of air behind the
closure [32]. In terms of temporal properties, we argue that crackles of short duration,
consisting of the initial sharp sound of the break-up of the fluid meniscus alone, may mark the
opening of a single airway segment without a noticeable increase in lung V, whereas crackles
that also include an elongated ringing with a significant LF energy mark the entry of �̇� into a
larger peripheral region. This latter crackle type indicates the sudden recruitment of lung V,
which we have termed a discrete ∆V, to distinguish it from the continuous V change
corresponding to the elastic expansion of the recruited airspaces. Intuitively, for the whole
lung, the sequence of opening events (at least those that trigger a change in mean �̇� as
illustrated by the type c openings in Fig. 10) can be associated with the discrete incremental
component of the P−V curve as opposed to the continuous component reflecting the elastic
expansion of the lung. If all �̇� transients could be detected and the corresponding discrete V
increments ∆V cumulated, we would be able to reconstruct that part of the P−V curve that is
formed by the discrete V recruitments. There are fundamental limitations in the detection of
each ∆V, however, imposed by both the sensitivity and the temporal resolution of the
measurement of �̇�, especially in the middle part of the inflation, where the densely
overlapping �̇� transients cannot be separated. The number of ∆Vs estimated by the manual
determination of the time limits of the transients of �̇� ranged from 54 to 310 in an inflation,
which contrasts with the much larger NC (ranging from 3,800 to 14,800), which were
34
identified automatically by exploiting the finer temporal resolution and the higher signal-to-
noise level in the high-pass-filtered sound recordings.
The distribution of the recruited ∆Vs has been predicted to be a power law with an
exponent of 2 [21] and has recently been measured indirectly [6]. Our data reflect a direct
assessment of the distribution of alveolar recruited ∆Vs. During both the first and second
inflations, the distribution displays a plateau-like region for small ∆V, followed by a region of
about two decades over which the distribution decreases linearly in the log-log graph, i.e. it
follows a power law form. The plateau region is obviously due to the limitation of the
measurement: even though the flow meter is able to measure very small �̇�s corresponding to
∆Vs of 0.1 ml, below this limit the data are not reliable. It is also possible that two or more
small ∆Vs occur simultaneously which results in a lower number of small ∆V values.
Nevertheless, for the first inflation, the data were in excellent agreement with the model
prediction [21] since the theoretical value of the exponent is 2, whereas the estimated average
one was 2.02. The distribution obtained from the second inflation had an exponent of 1.88,
which is also close to the theoretical value of 2. The reason for this small discrepancy is
unclear, but it may be due to the fact that the presence of significant trapped air terminates the
avalanches in larger alveolar regions than in the fully collapsed lung. As a consequence,
slightly more larger ∆V values would be recorded than during the first inflation, which in turn
leads to a longer tail of the distribution. Nevertheless, the power law distribution implies that,
even in the presence of trapped air, each phase of the biphasic recruitment process
corresponding to the two lower knees in the P−V curve is likely to involve predominantly
avalanche-like airway openings.
5.2. Crackle recording to monitor recruitment in bronchoconstriction (Study 2)
In order to characterize the recruitment processes during an acute pulmonary
constriction in mechanically ventilated animals, intratracheal recordings of crackles during
slow inflations were made in open-chest pigs. Airway closure was generated by lowering the
lung V and/or inducing lung constriction with Mch.
The results of the experiments revealed that: 1) the development of the lower knee in
the PL−V curve was always associated with a significant increase in crackle activity; 2) the NC
increased with the dose of Mch administered before the reinflation from the PEEP level and
3) while the PEEP level (1 vs 4 hPa) was an important determinant of the crackle activity in
35
the control group and at low doses of Mch, at high Mch doses the bronchoactive factor
predominated.
In order to quantify the reopening of lung units during obstructive disorders in
mechanically ventilated mini-pigs, a crackle measurement technique was adopted that was
previously employed in excised dog lungs (Study 1, [1]). Although it has been proposed that
crackles are generated by the abrupt reopening of lung units [8, 14, 65], evidence has been
presented only recently that lung crackles originate from the sudden reopening of the
conducting airways (Study 1, [1, 16]). Since the acoustic events identified in these in vivo pig
experiments were very similar to those described previously (Study 1, [1, 16]), it is assumed
that they also originate from the opening of small lung structures.
The fact that NC plateaued with increasing doses of Mch may reflect the limit set by the
noise to the sensitivity of crackle detection, and explain why the progression of reopenings
towards the periphery could be followed until NC reached a value of ∼4,000 (corresponding to
the 11th airway generation). Although the acoustic tracking of the recruitment process may
have been incomplete, it is important to note that, to the best of our knowledge, this is the first
in vivo study in which the development of the full inspiratory P−V curve was accompanied by
the recording of reopening sounds. Whilst the crackles were hardly recognizable (either
acoustically or visually) in the original sound recordings because of the strong cardiogenic
sounds, simple but appropriate high-pass filtering revealed the abundant crackles
accompanying the reopening process. On the other hand, elimination of the LF content of the
crackles precluded the possibility of assessing the V increments on the basis of the crackle
after-rings; likewise, the cardiogenic component of �̇� completely masked the ∆Vs associated
with the reopenings.
The use of an open-chest preparation made it possible to lower the lung V below the
closing V, thereby facilitating closure of the airways even without a bronchoconstrictor
challenge. Indeed, re-inflation from a PL of 1 hPa under control conditions resulted in a
reopening activity comparable in NC to that reached at the third dose of Mch at the higher PL
level.
The aim of this study was to quantify the lung recruitment via the crackle activity
recorded during the subsequent slow inflations at different mean lung Vs and degrees of
bronchoconstriction. The experimental model was therefore chosen to mimic situations
characterized by airway obstruction, such as in anaphylactic reactions, the exacerbation of
asthma or COPD, and was not intended to include capillary filtration/resorption abnormalities
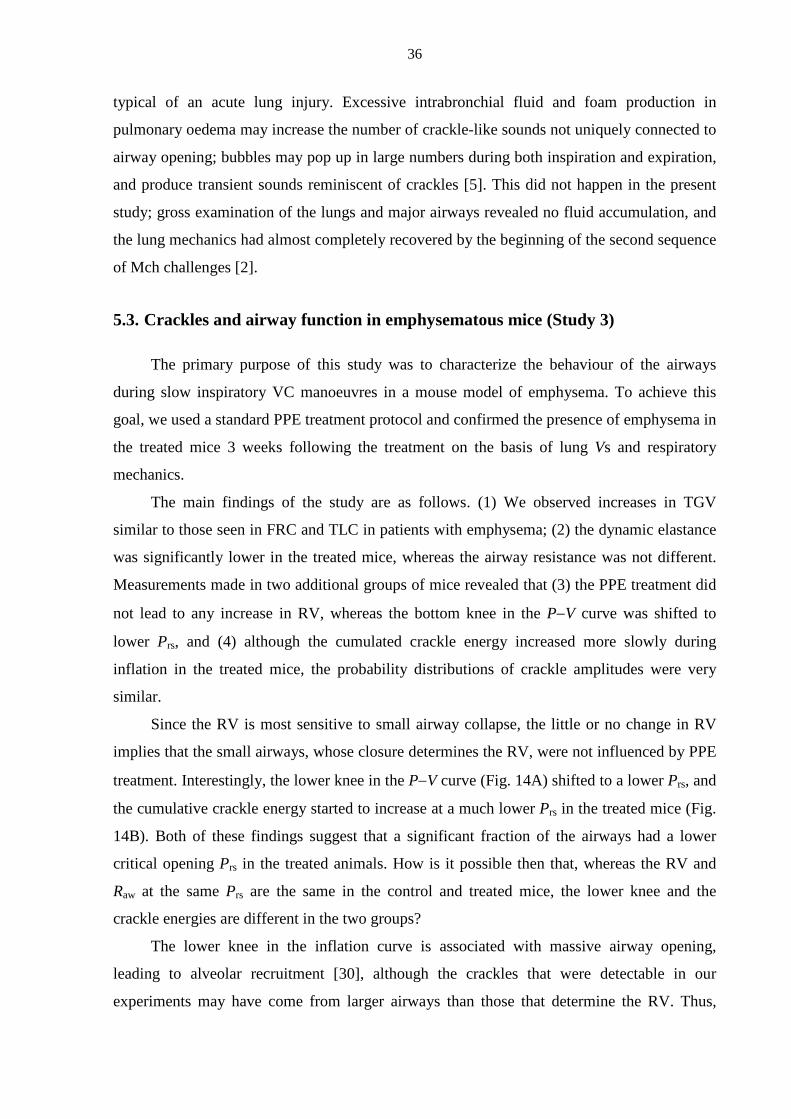
36
typical of an acute lung injury. Excessive intrabronchial fluid and foam production in
pulmonary oedema may increase the number of crackle-like sounds not uniquely connected to
airway opening; bubbles may pop up in large numbers during both inspiration and expiration,
and produce transient sounds reminiscent of crackles [5]. This did not happen in the present
study; gross examination of the lungs and major airways revealed no fluid accumulation, and
the lung mechanics had almost completely recovered by the beginning of the second sequence
of Mch challenges [2].
5.3. Crackles and airway function in emphysematous mice (Study 3)
The primary purpose of this study was to characterize the behaviour of the airways
during slow inspiratory VC manoeuvres in a mouse model of emphysema. To achieve this
goal, we used a standard PPE treatment protocol and confirmed the presence of emphysema in
the treated mice 3 weeks following the treatment on the basis of lung Vs and respiratory
mechanics.
The main findings of the study are as follows. (1) We observed increases in TGV
similar to those seen in FRC and TLC in patients with emphysema; (2) the dynamic elastance
was significantly lower in the treated mice, whereas the airway resistance was not different.
Measurements made in two additional groups of mice revealed that (3) the PPE treatment did
not lead to any increase in RV, whereas the bottom knee in the P−V curve was shifted to
lower Prs, and (4) although the cumulated crackle energy increased more slowly during
inflation in the treated mice, the probability distributions of crackle amplitudes were very
similar.
Since the RV is most sensitive to small airway collapse, the little or no change in RV
implies that the small airways, whose closure determines the RV, were not influenced by PPE
treatment. Interestingly, the lower knee in the P−V curve (Fig. 14A) shifted to a lower Prs, and
the cumulative crackle energy started to increase at a much lower Prs in the treated mice (Fig.
14B). Both of these findings suggest that a significant fraction of the airways had a lower
critical opening Prs in the treated animals. How is it possible then that, whereas the RV and
Raw at the same Prs are the same in the control and treated mice, the lower knee and the
crackle energies are different in the two groups?
The lower knee in the inflation curve is associated with massive airway opening,
leading to alveolar recruitment [30], although the crackles that were detectable in our
experiments may have come from larger airways than those that determine the RV. Thus,
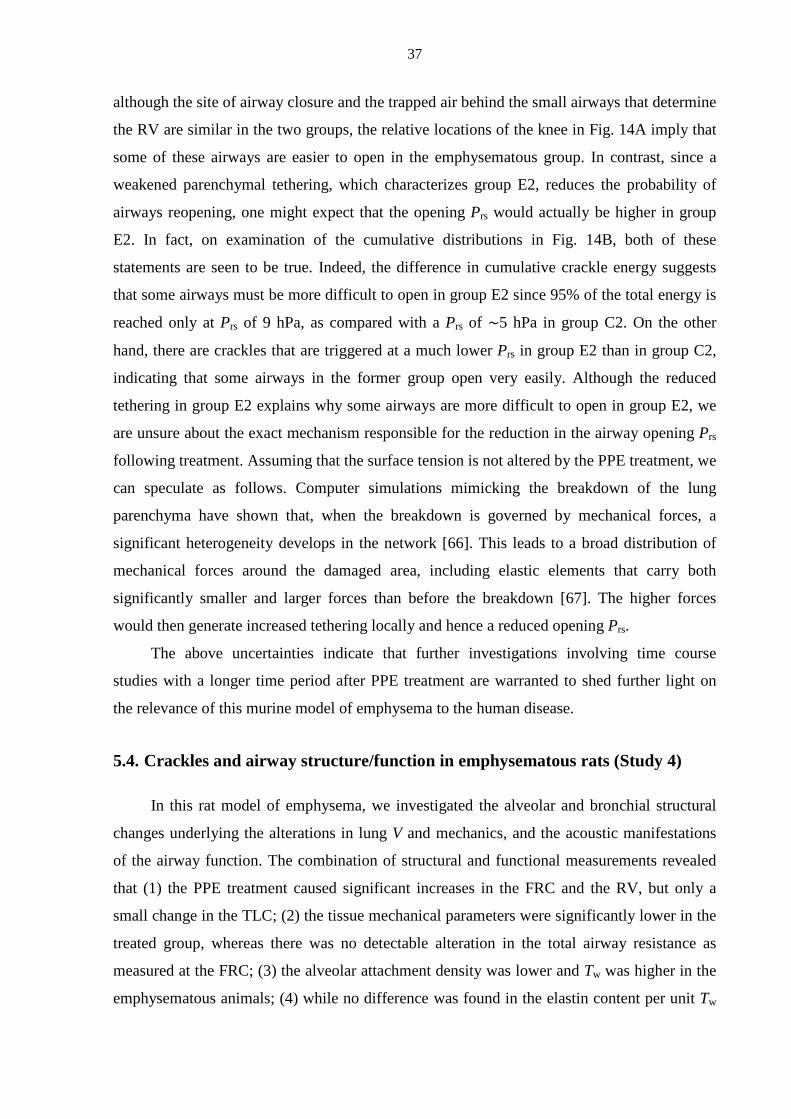
37
although the site of airway closure and the trapped air behind the small airways that determine
the RV are similar in the two groups, the relative locations of the knee in Fig. 14A imply that
some of these airways are easier to open in the emphysematous group. In contrast, since a
weakened parenchymal tethering, which characterizes group E2, reduces the probability of
airways reopening, one might expect that the opening Prs would actually be higher in group
E2. In fact, on examination of the cumulative distributions in Fig. 14B, both of these
statements are seen to be true. Indeed, the difference in cumulative crackle energy suggests
that some airways must be more difficult to open in group E2 since 95% of the total energy is
reached only at Prs of 9 hPa, as compared with a Prs of ∼5 hPa in group C2. On the other
hand, there are crackles that are triggered at a much lower Prs in group E2 than in group C2,
indicating that some airways in the former group open very easily. Although the reduced
tethering in group E2 explains why some airways are more difficult to open in group E2, we
are unsure about the exact mechanism responsible for the reduction in the airway opening Prs
following treatment. Assuming that the surface tension is not altered by the PPE treatment, we
can speculate as follows. Computer simulations mimicking the breakdown of the lung
parenchyma have shown that, when the breakdown is governed by mechanical forces, a
significant heterogeneity develops in the network [66]. This leads to a broad distribution of
mechanical forces around the damaged area, including elastic elements that carry both
significantly smaller and larger forces than before the breakdown [67]. The higher forces
would then generate increased tethering locally and hence a reduced opening Prs.
The above uncertainties indicate that further investigations involving time course
studies with a longer time period after PPE treatment are warranted to shed further light on
the relevance of this murine model of emphysema to the human disease.
5.4. Crackles and airway structure/function in emphysematous rats (Study 4)
In this rat model of emphysema, we investigated the alveolar and bronchial structural
changes underlying the alterations in lung V and mechanics, and the acoustic manifestations
of the airway function. The combination of structural and functional measurements revealed
that (1) the PPE treatment caused significant increases in the FRC and the RV, but only a
small change in the TLC; (2) the tissue mechanical parameters were significantly lower in the
treated group, whereas there was no detectable alteration in the total airway resistance as
measured at the FRC; (3) the alveolar attachment density was lower and Tw was higher in the
emphysematous animals; (4) while no difference was found in the elastin content per unit Tw
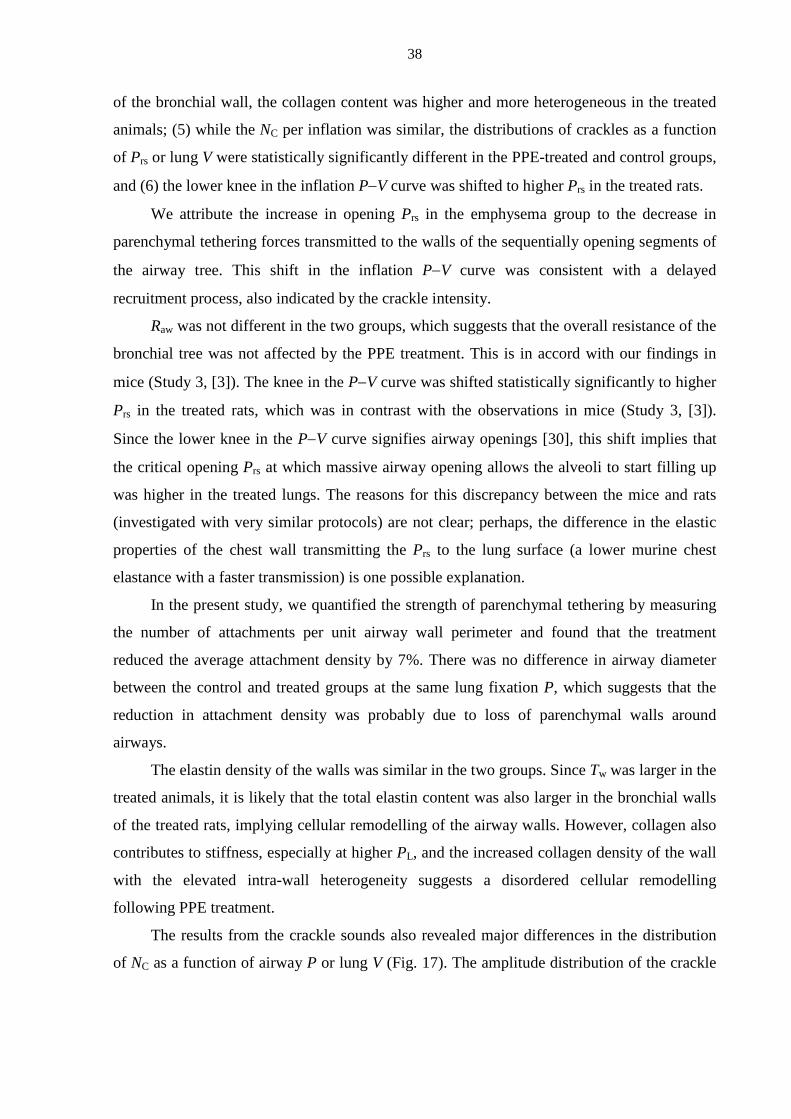
38
of the bronchial wall, the collagen content was higher and more heterogeneous in the treated
animals; (5) while the NC per inflation was similar, the distributions of crackles as a function
of Prs or lung V were statistically significantly different in the PPE-treated and control groups,
and (6) the lower knee in the inflation P−V curve was shifted to higher Prs in the treated rats.
We attribute the increase in opening Prs in the emphysema group to the decrease in
parenchymal tethering forces transmitted to the walls of the sequentially opening segments of
the airway tree. This shift in the inflation P−V curve was consistent with a delayed
recruitment process, also indicated by the crackle intensity.
Raw was not different in the two groups, which suggests that the overall resistance of the
bronchial tree was not affected by the PPE treatment. This is in accord with our findings in
mice (Study 3, [3]). The knee in the P−V curve was shifted statistically significantly to higher
Prs in the treated rats, which was in contrast with the observations in mice (Study 3, [3]).
Since the lower knee in the P−V curve signifies airway openings [30], this shift implies that
the critical opening Prs at which massive airway opening allows the alveoli to start filling up
was higher in the treated lungs. The reasons for this discrepancy between the mice and rats
(investigated with very similar protocols) are not clear; perhaps, the difference in the elastic
properties of the chest wall transmitting the Prs to the lung surface (a lower murine chest
elastance with a faster transmission) is one possible explanation.
In the present study, we quantified the strength of parenchymal tethering by measuring
the number of attachments per unit airway wall perimeter and found that the treatment
reduced the average attachment density by 7%. There was no difference in airway diameter
between the control and treated groups at the same lung fixation P, which suggests that the
reduction in attachment density was probably due to loss of parenchymal walls around
airways.
The elastin density of the walls was similar in the two groups. Since Tw was larger in the
treated animals, it is likely that the total elastin content was also larger in the bronchial walls
of the treated rats, implying cellular remodelling of the airway walls. However, collagen also
contributes to stiffness, especially at higher PL, and the increased collagen density of the wall
with the elevated intra-wall heterogeneity suggests a disordered cellular remodelling
following PPE treatment.
The results from the crackle sounds also revealed major differences in the distribution
of NC as a function of airway P or lung V (Fig. 17). The amplitude distribution of the crackle
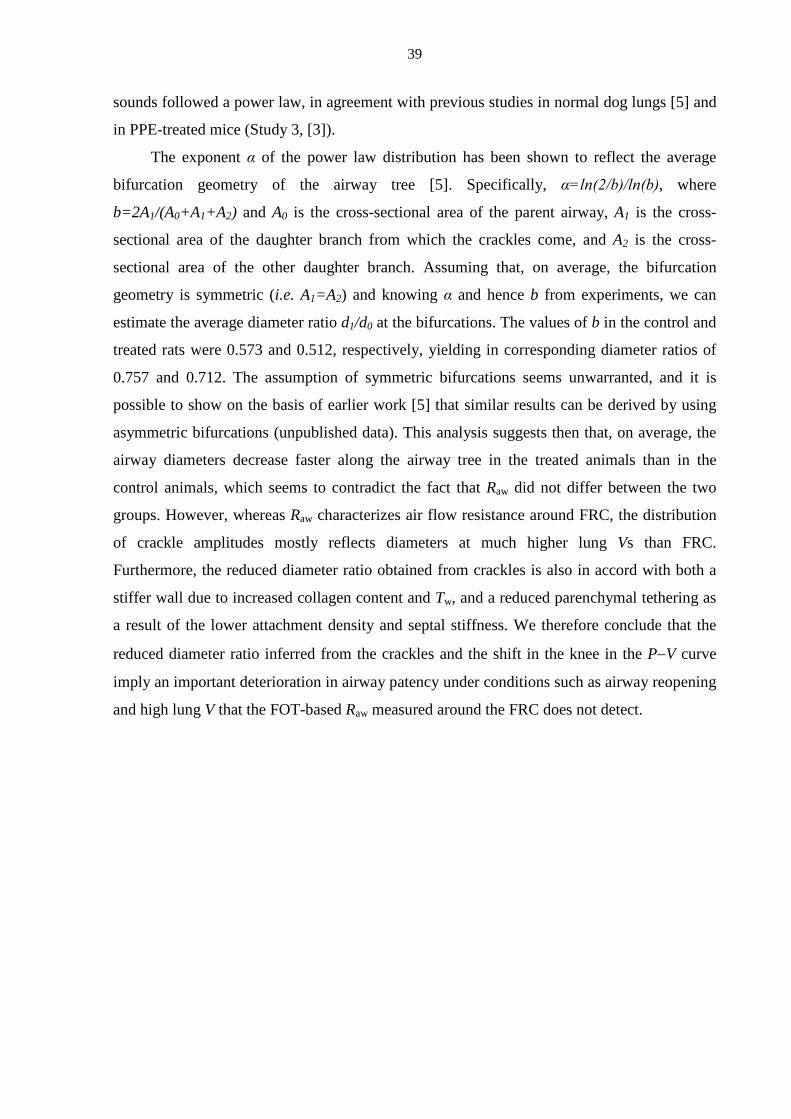
39
sounds followed a power law, in agreement with previous studies in normal dog lungs [5] and
in PPE-treated mice (Study 3, [3]).
The exponent α of the power law distribution has been shown to reflect the average
bifurcation geometry of the airway tree [5]. Specifically, α=ln(2/b)/ln(b), where
b=2A1/(A0+A1+A2) and A0 is the cross-sectional area of the parent airway, A1 is the cross-
sectional area of the daughter branch from which the crackles come, and A2 is the cross-
sectional area of the other daughter branch. Assuming that, on average, the bifurcation
geometry is symmetric (i.e. A1=A2) and knowing α and hence b from experiments, we can
estimate the average diameter ratio d1/d0 at the bifurcations. The values of b in the control and
treated rats were 0.573 and 0.512, respectively, yielding in corresponding diameter ratios of
0.757 and 0.712. The assumption of symmetric bifurcations seems unwarranted, and it is
possible to show on the basis of earlier work [5] that similar results can be derived by using
asymmetric bifurcations (unpublished data). This analysis suggests then that, on average, the
airway diameters decrease faster along the airway tree in the treated animals than in the
control animals, which seems to contradict the fact that Raw did not differ between the two
groups. However, whereas Raw characterizes air flow resistance around FRC, the distribution
of crackle amplitudes mostly reflects diameters at much higher lung Vs than FRC.
Furthermore, the reduced diameter ratio obtained from crackles is also in accord with both a
stiffer wall due to increased collagen content and Tw, and a reduced parenchymal tethering as
a result of the lower attachment density and septal stiffness. We therefore conclude that the
reduced diameter ratio inferred from the crackles and the shift in the knee in the P−V curve
imply an important deterioration in airway patency under conditions such as airway reopening
and high lung V that the FOT-based Raw measured around the FRC does not detect.
40
Summary and conclusions
1. We have observed that in the reinflation of isolated collapsed lungs the elastic expansion
of the alveoli is intermittently interrupted by discrete volume increments, which are
accompanied by acoustic events. The majority of crackles were detected near the lower
knee in the inspiratory pressure−volume curve. Hence, in contrast with the prevailing
view that recruitment occurs at the alveolar level, our data provide strong evidence that
the recruitment of alveolar regions is a highly irregular process triggered by avalanche-
like airway openings. We also found that the lower knee in the pressure−volume curve
shifts to lower pressures, in the presence of trapped air, but the knee is still dominated by
airway openings. Thus, airway opening is an important determinant of the recruitment
process of the partially collapsed and also fluid-filled lung in ARDS.
2. We have demonstrated that the quantification of airway closure on the basis of subsequent
recruitment is feasible by recording and processing intratracheal crackle sounds in vivo.
The measurements revealed the importance of airway closure and reopening in the
development of the pressure−volume characteristics following the administration of
methacholine at a normal lung volume, and especially at a lung volume below the closing
volume. Lung sound recording appears to be a sensitive tool with which to indicate early
impairments in the mechanics of the lung periphery. Thus, crackle recordings may have
the potential to serve as a bedside monitoring tool for detection of the cyclic recruitment-
derecruitment of the airways during mechanical ventilation, and hence contribute to the
guidance of the optimum ventilation strategy.
3. We have investigated the effects of elastase treatment on the airway function in
established rodent models of human emphysema exhibiting enlarged airspaces, in order to
ascertain whether or not the treatment also leads to enhanced collapsibility and hindered
reopening of the airways, as a result of weakened parenchymal tethering. While the
treatment resulted in marked changes in lung volumes, the airway resistance measured at
the level of the FRC did not change either in mice or in rats. There was no alteration in
the size distribution of crackles between the control and treated animals; however, subtle
changes in recruitment dynamics and airway morphometry were observed. We conclude

41
that the reduced parenchymal tethering and an increased stiffness of the remodelled
bronchial wall acted oppositely, and these rodent models therefore need to be refined and
followed on a longer time scale in order to mimic the human disease to a better extent.
42
Acknowledgements
First and foremost, I wish to express my grateful thanks and appreciation to my
supervisor, Professor Zoltán Hantos, for his invaluable help towards the preparation of my
thesis. I greatly appreciate his excellent and indispensable guidance in the experimental work,
data analysis and interpretation.
I also wish to thank Professor Béla Suki for his continuous active support, his highly
effective tutoring and the stimulating discussions, which have helped me so much throughout
the years of my research.
I would also like to thank Dr. Ágnes Adamicza and Dr. Margit Szabari for the
possibility to work with them in the laboratory and for their introducing me to the basic skills
of animal experimentation.
I further express my deep gratitude to all the co-workers and the laboratory staff who
have supported my research at the Department of Medical Physics and Informatics, the
Institute for Surgical Research, University of Szeged, and the Department of Biomedical
Engineering, Boston University.
***
The work presented in this thesis was supported by Hungarian Scientific Research Fund
grants OTKA T30670, F038340, T37810, T42971 and 67700, National Science Foundation
grants BES-0114538, BES-0402530, National Institutes of Health grant HL090757 and Swiss
National Science Foundation grant 3200-064899.01/1.
43
References
1. Hantos, Z., J. Tolnai, T. Asztalos, F. Petak, A. Adamicza, A.M. Alencar, A. Majumdar, and B.
Suki, Acoustic evidence of airway opening during recruitment in excised dog lungs. Journal of
Applied Physiology, 2004. 97(2): p. 592-8.
2. Petak, F., W. Habre, B. Babik, J. Tolnai, and Z. Hantos, Crackle-sound recording to monitor
airway closure and recruitment in ventilated pigs. Eur Respir J, 2006. 27(4): p. 808-16.
3. Hantos, Z., A. Adamicza, T.Z. Janosi, M.V. Szabari, J. Tolnai, and B. Suki, Lung volumes and
respiratory mechanics in elastase-induced emphysema in mice. Journal of Applied
Physiology, 2008. 105(6): p. 1864-72.
4. Tolnai, J., M.V. Szabari, G. Albu, B.A. Maar, H. Parameswaran, E. Bartolak-Suki, B. Suki,
and Z. Hantos, Functional and morphological assessment of early impairment of airway
function in a rat model of emphysema. Journal of Applied Physiology, 2012. [Epub ahead of
print] PMID: 22442024.
5. Alencar, A.M., Z. Hantos, F. Petak, J. Tolnai, T. Asztalos, S. Zapperi, J.S. Andrade, Jr., S.V.
Buldyrev, H.E. Stanley, and B. Suki, Scaling behavior in crackle sound during lung inflation.
Phys Rev E Stat Phys Plasmas Fluids Relat Interdiscip Topics, 1999. 60(4 Pt B): p. 4659-63.
6. Suki, B., A.M. Alencar, J. Tolnai, T. Asztalos, F. Petak, M.K. Sujeer, K. Patel, J. Patel, H.E.
Stanley, and Z. Hantos, Size distribution of recruited alveolar volumes in airway reopening.
Journal of Applied Physiology, 2000. 89(5): p. 2030-40.
7. Majumdar, A., Z. Hantos, J. Tolnai, H. Parameswaran, R. Tepper, and B. Suki, Estimating the
diameter of airways susceptible for collapse using crackle sound. Journal of Applied
Physiology, 2009. 107(5): p. 1504-12.
8. Forgacs, P., Crackles and wheezes. Lancet, 1967. 2(7508): p. 203-5.
9. Forgacs, P., Functional Basis of Pulmonary Sounds. Chest, 1978. 73(3): p. 399-405.
10. Forgacs, P., A.R. Nathoo, and H.D. Richardson, Breath sounds. Thorax, 1971. 26(3): p. 288-
95.
11. Shinozuka, N., T. Nemoto, and J.H.T. Bates, Isovolume bronchoconstriction by vagal
stimulation in dogs: Effects of lung inflation pressure. Respiration Physiology, 1998. 111(1):
p. 79-88.
12. Piirila, P., A.R. Sovijarvi, T. Kaisla, H.M. Rajala, and T. Katila, Crackles in patients with
fibrosing alveolitis, bronchiectasis, COPD, and heart failure. Chest, 1991. 99(5): p. 1076-83.
13. Piirila, P. and A.R.A. Sovijarvi, Crackles: Recording, analysis and clinical significance.
European Respiratory Journal, 1995. 8(12): p. 2139-2148.
44
14. Nath, A.R. and L.H. Capel, Inspiratory crackles and mechanical events of breathing. Thorax,
1974. 29(6): p. 695-8.
15. Piirila, P., Changes in crackle characteristics during the clinical course of pneumonia. Chest,
1992. 102(1): p. 176-83.
16. Cheng, W., D.S. DeLong, G.N. Franz, E.L. Petsonk, and D.G. Frazer, Discountinuous lung
sounds and hysteresis in control and Tween 20-rinsed excised rat lungs. Respir Physiol, 1999.
117(2-3): p. 131-40.
17. Amato, M.B., C.S. Barbas, D.M. Medeiros, R.B. Magaldi, G.P. Schettino, G. Lorenzi-Filho,
R.A. Kairalla, D. Deheinzelin, C. Munoz, R. Oliveira, T.Y. Takagaki, and C.R. Carvalho,
Effect of a protective-ventilation strategy on mortality in the acute respiratory distress
syndrome. N Engl J Med, 1998. 338(6): p. 347-54.
18. Jonson, B., J.C. Richard, C. Straus, J. Mancebo, F. Lemaire, and L. Brochard, Pressure-
volume curves and compliance in acute lung injury: evidence of recruitment above the lower
inflection point. Am J Respir Crit Care Med, 1999. 159(4 Pt 1): p. 1172-8.
19. Lachmann, B., Open up the lung and keep the lung open. Intensive Care Med, 1992. 18(6): p.
319-21.
20. Muscedere, J.G., J.B. Mullen, K. Gan, and A.S. Slutsky, Tidal ventilation at low airway
pressures can augment lung injury. Am J Respir Crit Care Med, 1994. 149(5): p. 1327-34.
21. Smaldone, G.C., W. Mitzner, and H. Itoh, Role of alveolar recruitment in lung inflation:
influence on pressure-volume hysteresis. Journal of Applied Physiology, 1983. 55(4): p. 1321-
32.
22. Crotti, S., D. Mascheroni, P. Caironi, P. Pelosi, G. Ronzoni, M. Mondino, J.J. Marini, and L.
Gattinoni, Recruitment and derecruitment during acute respiratory failure: a clinical study.
Am J Respir Crit Care Med, 2001. 164(1): p. 131-40.
23. Hickling, K.G., The pressure-volume curve is greatly modified by recruitment. A
mathematical model of ARDS lungs. Am J Respir Crit Care Med, 1998. 158(1): p. 194-202.
24. Fredberg, J.J. and S.K. Holford, Discrete lung sounds: crackles (rales) as stress-relaxation
quadrupoles. J Acoust Soc Am, 1983. 73(3): p. 1036-46.
25. Mergoni, M., A. Volpi, C. Bricchi, and A. Rossi, Lower inflection point and recruitment with
PEEP in ventilated patients with acute respiratory failure. Journal of Applied Physiology,
2001. 91(1): p. 441-50.
26. Hubmayr, R.D., Perspective on lung injury and recruitment: a skeptical look at the opening
and collapse story. Am J Respir Crit Care Med, 2002. 165(12): p. 1647-53.
27. Cheng, W., D.S. DeLong, G.N. Franz, E.L. Petsonk, and D.G. Frazer, Contribution of opening
and closing of lung units to lung hysteresis. Respir Physiol, 1995. 102(2-3): p. 205-15.
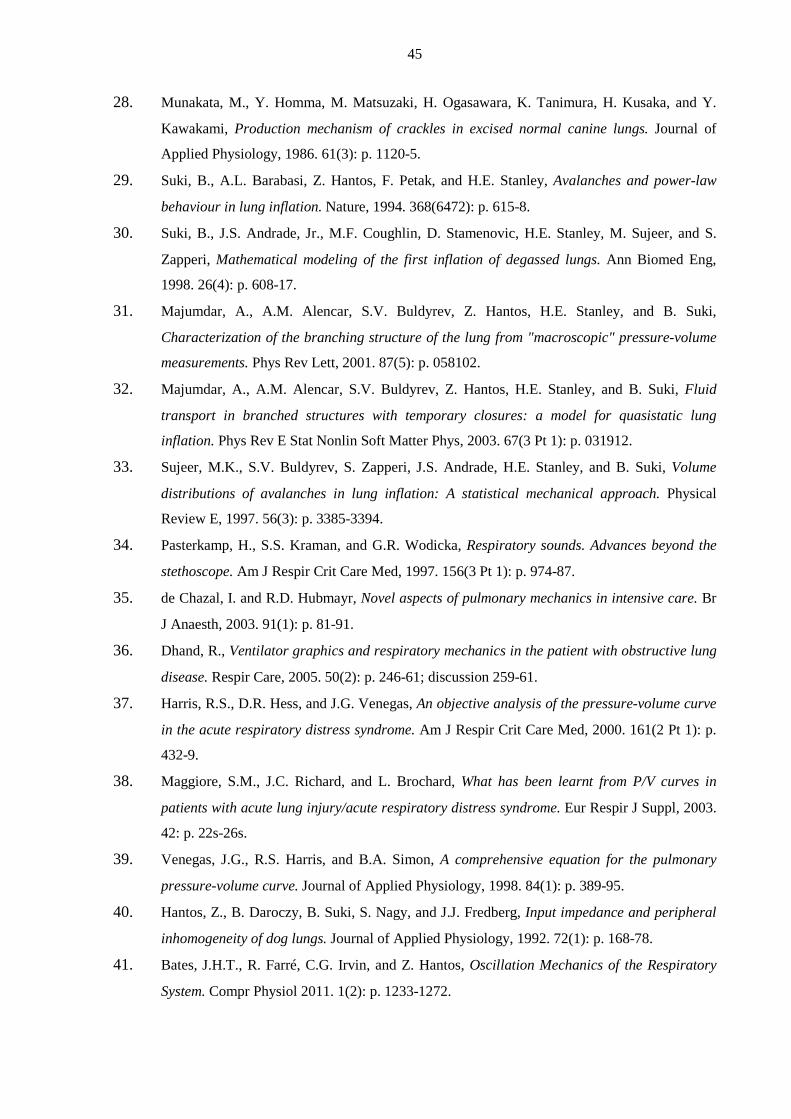
45
28. Munakata, M., Y. Homma, M. Matsuzaki, H. Ogasawara, K. Tanimura, H. Kusaka, and Y.
Kawakami, Production mechanism of crackles in excised normal canine lungs. Journal of
Applied Physiology, 1986. 61(3): p. 1120-5.
29. Suki, B., A.L. Barabasi, Z. Hantos, F. Petak, and H.E. Stanley, Avalanches and power-law
behaviour in lung inflation. Nature, 1994. 368(6472): p. 615-8.
30. Suki, B., J.S. Andrade, Jr., M.F. Coughlin, D. Stamenovic, H.E. Stanley, M. Sujeer, and S.
Zapperi, Mathematical modeling of the first inflation of degassed lungs. Ann Biomed Eng,
1998. 26(4): p. 608-17.
31. Majumdar, A., A.M. Alencar, S.V. Buldyrev, Z. Hantos, H.E. Stanley, and B. Suki,
Characterization of the branching structure of the lung from "macroscopic" pressure-volume
measurements. Phys Rev Lett, 2001. 87(5): p. 058102.
32. Majumdar, A., A.M. Alencar, S.V. Buldyrev, Z. Hantos, H.E. Stanley, and B. Suki, Fluid
transport in branched structures with temporary closures: a model for quasistatic lung
inflation. Phys Rev E Stat Nonlin Soft Matter Phys, 2003. 67(3 Pt 1): p. 031912.
33. Sujeer, M.K., S.V. Buldyrev, S. Zapperi, J.S. Andrade, H.E. Stanley, and B. Suki, Volume
distributions of avalanches in lung inflation: A statistical mechanical approach. Physical
Review E, 1997. 56(3): p. 3385-3394.
34. Pasterkamp, H., S.S. Kraman, and G.R. Wodicka, Respiratory sounds. Advances beyond the
stethoscope. Am J Respir Crit Care Med, 1997. 156(3 Pt 1): p. 974-87.
35. de Chazal, I. and R.D. Hubmayr, Novel aspects of pulmonary mechanics in intensive care. Br
J Anaesth, 2003. 91(1): p. 81-91.
36. Dhand, R., Ventilator graphics and respiratory mechanics in the patient with obstructive lung
disease. Respir Care, 2005. 50(2): p. 246-61; discussion 259-61.
37. Harris, R.S., D.R. Hess, and J.G. Venegas, An objective analysis of the pressure-volume curve
in the acute respiratory distress syndrome. Am J Respir Crit Care Med, 2000. 161(2 Pt 1): p.
432-9.
38. Maggiore, S.M., J.C. Richard, and L. Brochard, What has been learnt from P/V curves in
patients with acute lung injury/acute respiratory distress syndrome. Eur Respir J Suppl, 2003.
42: p. 22s-26s.
39. Venegas, J.G., R.S. Harris, and B.A. Simon, A comprehensive equation for the pulmonary
pressure-volume curve. Journal of Applied Physiology, 1998. 84(1): p. 389-95.
40. Hantos, Z., B. Daroczy, B. Suki, S. Nagy, and J.J. Fredberg, Input impedance and peripheral
inhomogeneity of dog lungs. Journal of Applied Physiology, 1992. 72(1): p. 168-78.
41. Bates, J.H.T., R. Farré, C.G. Irvin, and Z. Hantos, Oscillation Mechanics of the Respiratory
System. Compr Physiol 2011. 1(2): p. 1233-1272.
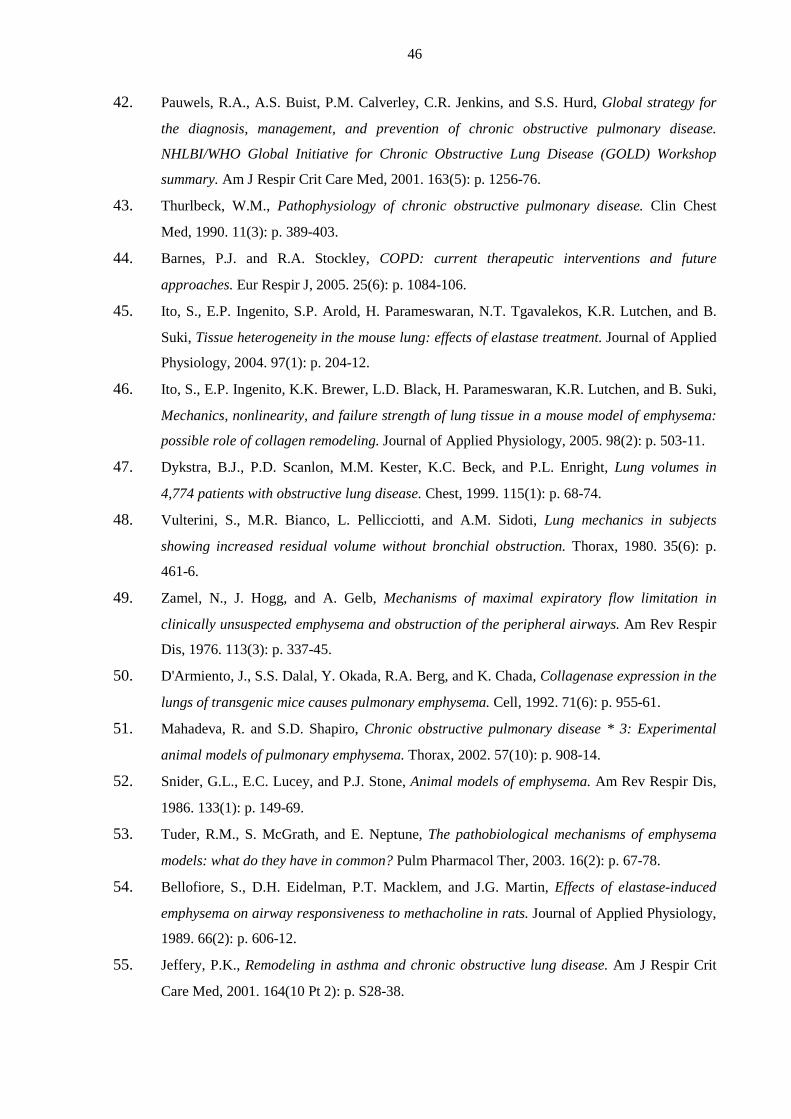
46
42. Pauwels, R.A., A.S. Buist, P.M. Calverley, C.R. Jenkins, and S.S. Hurd, Global strategy for
the diagnosis, management, and prevention of chronic obstructive pulmonary disease.
NHLBI/WHO Global Initiative for Chronic Obstructive Lung Disease (GOLD) Workshop
summary. Am J Respir Crit Care Med, 2001. 163(5): p. 1256-76.
43. Thurlbeck, W.M., Pathophysiology of chronic obstructive pulmonary disease. Clin Chest
Med, 1990. 11(3): p. 389-403.
44. Barnes, P.J. and R.A. Stockley, COPD: current therapeutic interventions and future
approaches. Eur Respir J, 2005. 25(6): p. 1084-106.
45. Ito, S., E.P. Ingenito, S.P. Arold, H. Parameswaran, N.T. Tgavalekos, K.R. Lutchen, and B.
Suki, Tissue heterogeneity in the mouse lung: effects of elastase treatment. Journal of Applied
Physiology, 2004. 97(1): p. 204-12.
46. Ito, S., E.P. Ingenito, K.K. Brewer, L.D. Black, H. Parameswaran, K.R. Lutchen, and B. Suki,
Mechanics, nonlinearity, and failure strength of lung tissue in a mouse model of emphysema:
possible role of collagen remodeling. Journal of Applied Physiology, 2005. 98(2): p. 503-11.
47. Dykstra, B.J., P.D. Scanlon, M.M. Kester, K.C. Beck, and P.L. Enright, Lung volumes in
4,774 patients with obstructive lung disease. Chest, 1999. 115(1): p. 68-74.
48. Vulterini, S., M.R. Bianco, L. Pellicciotti, and A.M. Sidoti, Lung mechanics in subjects
showing increased residual volume without bronchial obstruction. Thorax, 1980. 35(6): p.
461-6.
49. Zamel, N., J. Hogg, and A. Gelb, Mechanisms of maximal expiratory flow limitation in
clinically unsuspected emphysema and obstruction of the peripheral airways. Am Rev Respir
Dis, 1976. 113(3): p. 337-45.
50. D'Armiento, J., S.S. Dalal, Y. Okada, R.A. Berg, and K. Chada, Collagenase expression in the
lungs of transgenic mice causes pulmonary emphysema. Cell, 1992. 71(6): p. 955-61.
51. Mahadeva, R. and S.D. Shapiro, Chronic obstructive pulmonary disease * 3: Experimental
animal models of pulmonary emphysema. Thorax, 2002. 57(10): p. 908-14.
52. Snider, G.L., E.C. Lucey, and P.J. Stone, Animal models of emphysema. Am Rev Respir Dis,
1986. 133(1): p. 149-69.
53. Tuder, R.M., S. McGrath, and E. Neptune, The pathobiological mechanisms of emphysema
models: what do they have in common? Pulm Pharmacol Ther, 2003. 16(2): p. 67-78.
54. Bellofiore, S., D.H. Eidelman, P.T. Macklem, and J.G. Martin, Effects of elastase-induced
emphysema on airway responsiveness to methacholine in rats. Journal of Applied Physiology,
1989. 66(2): p. 606-12.
55. Jeffery, P.K., Remodeling in asthma and chronic obstructive lung disease. Am J Respir Crit
Care Med, 2001. 164(10 Pt 2): p. S28-38.
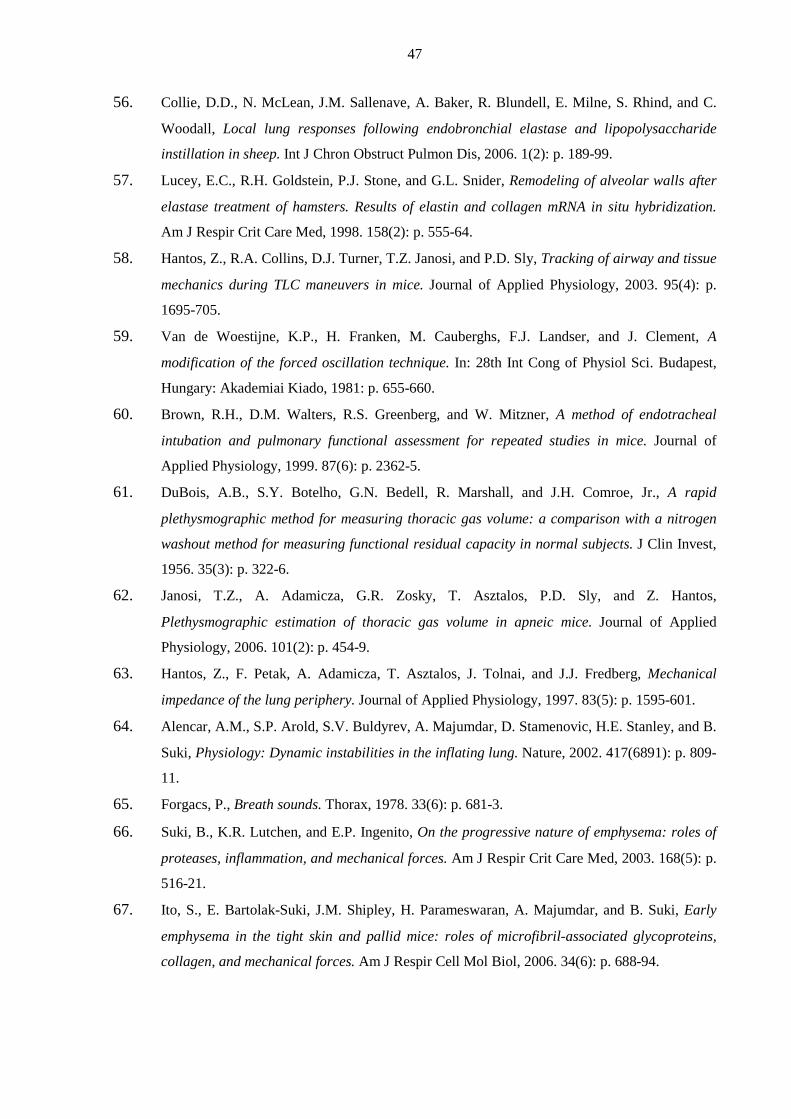
47
56. Collie, D.D., N. McLean, J.M. Sallenave, A. Baker, R. Blundell, E. Milne, S. Rhind, and C.
Woodall, Local lung responses following endobronchial elastase and lipopolysaccharide
instillation in sheep. Int J Chron Obstruct Pulmon Dis, 2006. 1(2): p. 189-99.
57. Lucey, E.C., R.H. Goldstein, P.J. Stone, and G.L. Snider, Remodeling of alveolar walls after
elastase treatment of hamsters. Results of elastin and collagen mRNA in situ hybridization.
Am J Respir Crit Care Med, 1998. 158(2): p. 555-64.
58. Hantos, Z., R.A. Collins, D.J. Turner, T.Z. Janosi, and P.D. Sly, Tracking of airway and tissue
mechanics during TLC maneuvers in mice. Journal of Applied Physiology, 2003. 95(4): p.
1695-705.
59. Van de Woestijne, K.P., H. Franken, M. Cauberghs, F.J. Landser, and J. Clement, A
modification of the forced oscillation technique. In: 28th Int Cong of Physiol Sci. Budapest,
Hungary: Akademiai Kiado, 1981: p. 655-660.
60. Brown, R.H., D.M. Walters, R.S. Greenberg, and W. Mitzner, A method of endotracheal
intubation and pulmonary functional assessment for repeated studies in mice. Journal of
Applied Physiology, 1999. 87(6): p. 2362-5.
61. DuBois, A.B., S.Y. Botelho, G.N. Bedell, R. Marshall, and J.H. Comroe, Jr., A rapid
plethysmographic method for measuring thoracic gas volume: a comparison with a nitrogen
washout method for measuring functional residual capacity in normal subjects. J Clin Invest,
1956. 35(3): p. 322-6.
62. Janosi, T.Z., A. Adamicza, G.R. Zosky, T. Asztalos, P.D. Sly, and Z. Hantos,
Plethysmographic estimation of thoracic gas volume in apneic mice. Journal of Applied
Physiology, 2006. 101(2): p. 454-9.
63. Hantos, Z., F. Petak, A. Adamicza, T. Asztalos, J. Tolnai, and J.J. Fredberg, Mechanical
impedance of the lung periphery. Journal of Applied Physiology, 1997. 83(5): p. 1595-601.
64. Alencar, A.M., S.P. Arold, S.V. Buldyrev, A. Majumdar, D. Stamenovic, H.E. Stanley, and B.
Suki, Physiology: Dynamic instabilities in the inflating lung. Nature, 2002. 417(6891): p. 809-
11.
65. Forgacs, P., Breath sounds. Thorax, 1978. 33(6): p. 681-3.
66. Suki, B., K.R. Lutchen, and E.P. Ingenito, On the progressive nature of emphysema: roles of
proteases, inflammation, and mechanical forces. Am J Respir Crit Care Med, 2003. 168(5): p.
516-21.
67. Ito, S., E. Bartolak-Suki, J.M. Shipley, H. Parameswaran, A. Majumdar, and B. Suki, Early
emphysema in the tight skin and pallid mice: roles of microfibril-associated glycoproteins,
collagen, and mechanical forces. Am J Respir Cell Mol Biol, 2006. 34(6): p. 688-94.