cover crops and soil health - montana state university
TRANSCRIPT
MSU Soil Fertility Extension
Clain Jones [email protected] 994-6076Clain Jones [email protected] 994-6076
COVER CROPS AND SOIL HEALTH
Growers’ Workshop
Sheridan and Helena
Feb 2, 2016

Today I plan to present:
• Management practices to benefit soils
• Potential benefits of cover crops
• Cover crop effects on Nitrogen
Soil organic matter
Temperature, aggregate stability, microbial activity
Following crop yield and protein
Economics
• Management considerations with cover crops
Mineral ~ 45%
Air ~ 25%
Water ~ 25%
Organic matter ~ 5%
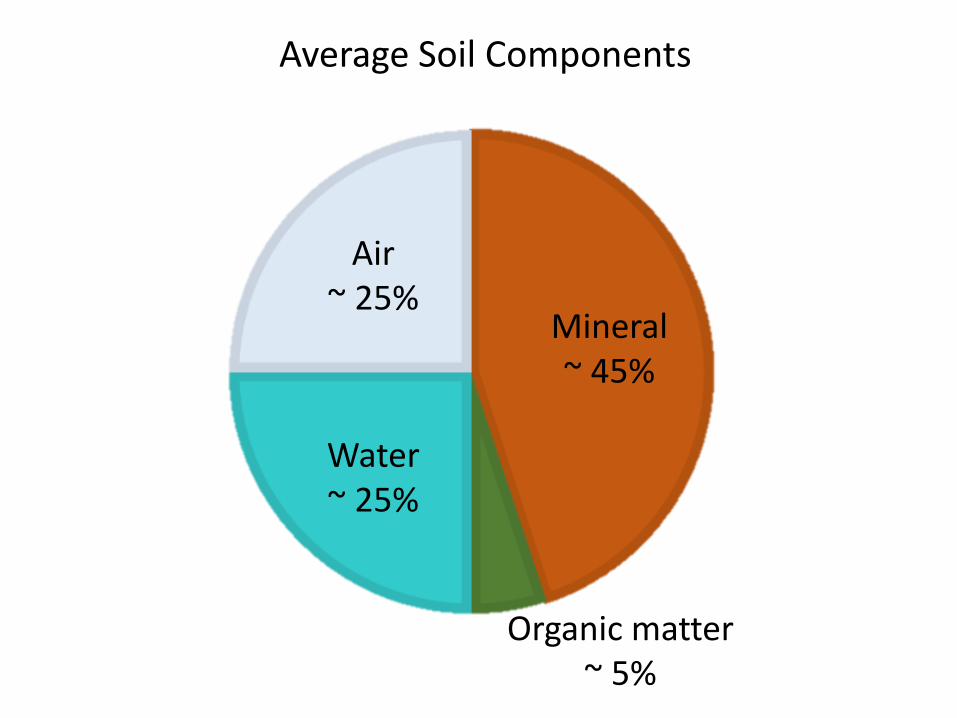
Average Soil Components

Mineral ~ 45%
Air ~ 25%
Water ~ 25%
Organic matter ~ 5%
Practices to benefit soil
• Minimize disturbance
• Keep soil surface covered
• Nutrient mgt(soil test; 4Rs)
• Increase diversity
• Keep living root in soil

Practices to benefit soil
• Minimize disturbance
• Keep soil surface covered
• Nutrient mgt(soil test; 4Rs)
• Increase diversity
• Keep living root in soil
Perennial >> annual
Perennial pasture/forage
production
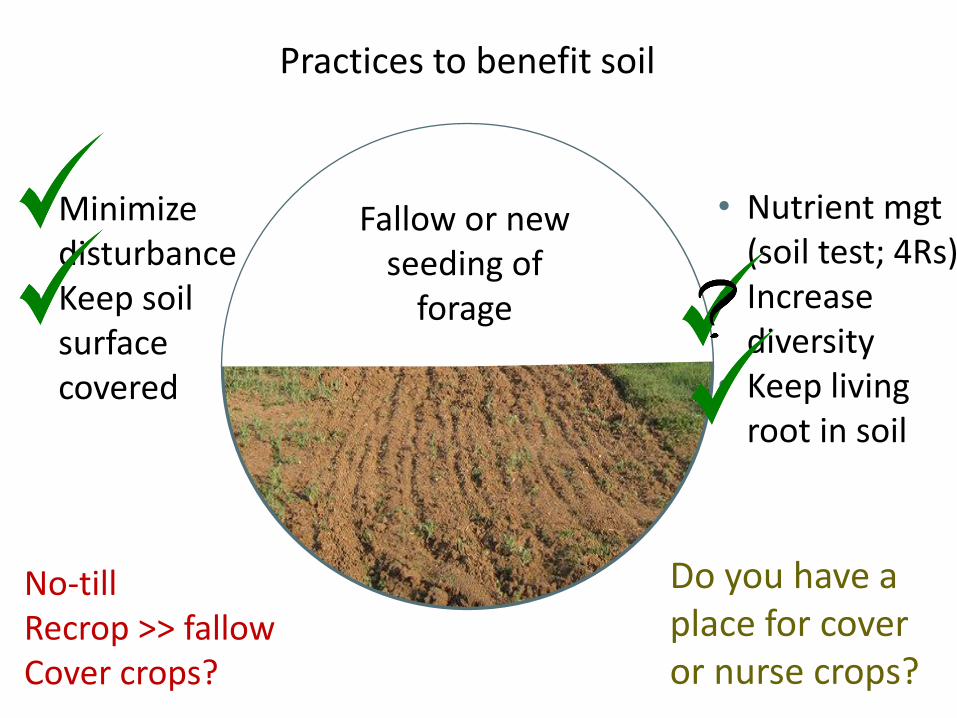
Practices to benefit soil
• Minimize disturbance
• Keep soil surface covered
• Nutrient mgt(soil test; 4Rs)
• Increase diversity
• Keep living root in soil
No-tillRecrop >> fallowCover crops?
Fallow or new seeding of
forage
Do you have a place for cover or nurse crops?

What we have found with MT research trials
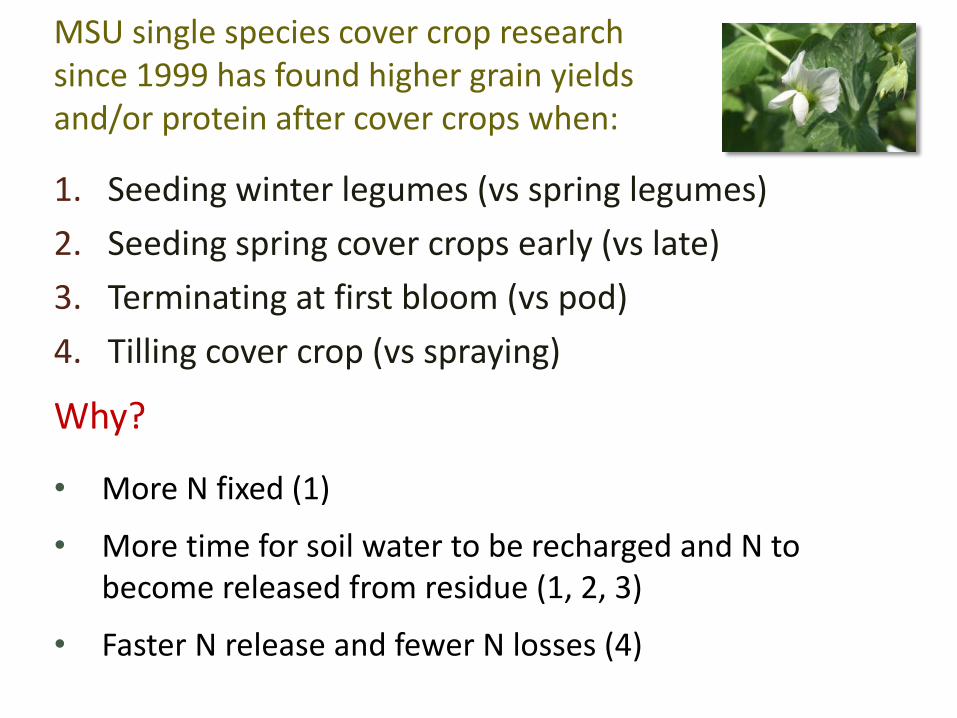
MSU single species cover crop research since 1999 has found higher grain yields and/or protein after cover crops when:
1. Seeding winter legumes (vs spring legumes)
2. Seeding spring cover crops early (vs late)
3. Terminating at first bloom (vs pod)
4. Tilling cover crop (vs spraying)
Why?
• More N fixed (1)
• More time for soil water to be recharged and N to become released from residue (1, 2, 3)
• Faster N release and fewer N losses (4)
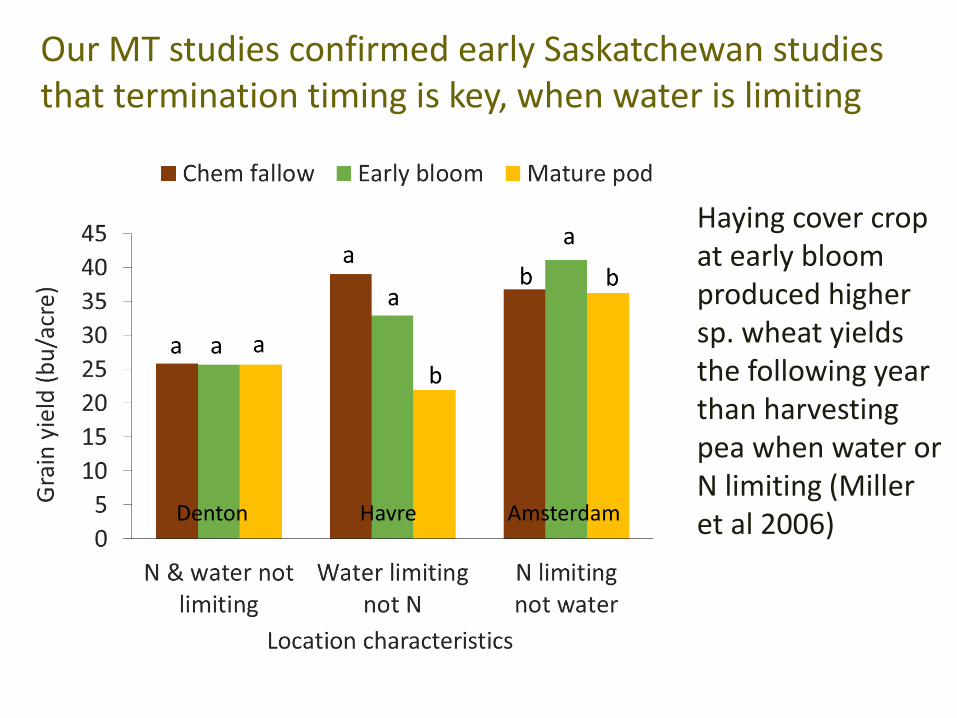
Haying cover crop at early bloom produced higher sp. wheat yields the following year than harvesting pea when water or N limiting (Miller et al 2006)
Our MT studies confirmed early Saskatchewan studies that termination timing is key, when water is limiting
Denton Havre Amsterdam
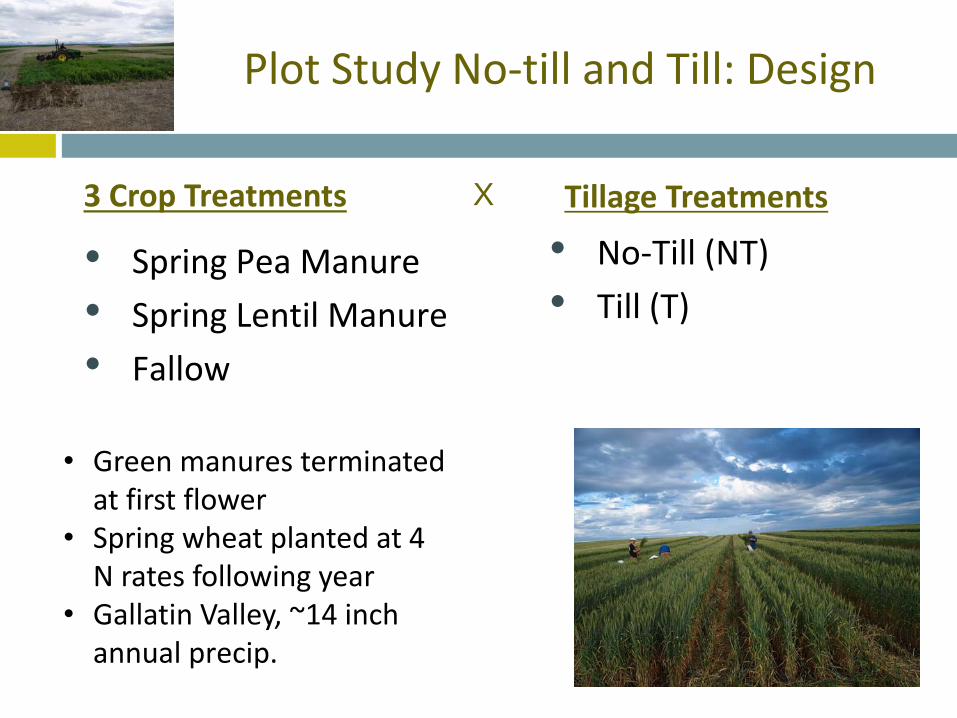
Tillage Treatments3 Crop Treatments
Plot Study No-till and Till: Design
X
• Green manures terminated at first flower
• Spring wheat planted at 4 N rates following year
• Gallatin Valley, ~14 inch annual precip.
• Spring Pea Manure
• Spring Lentil Manure
• Fallow
• No-Till (NT)
• Till (T)

Effect of lentil and pea cover crop on spring wheat yield & protein
Take home: • Early-terminated spring cover
crop did not hurt wheat yield or protein.
• Pea cover crop only increased yield at low N rates when tilled.
• Pea increased grain protein at all N rates for both NT and T.
• Lentil cover crop did not benefit yield or protein (likely N contribution too low)

Questions?

Cover Crop Cocktails Plot Study
• Cover crop and wheat: Biomass, biomass quality, yield • Soil:
1. Compare crop and soil response to fallow, single species pea CC, and multi-species mixtures
2. Determine the specific effects of 4 plant functional groups
3. 2 sites in Triangle, 2 in Gallatin Valley
Microbial biomass Soil enzyme activity Soil temperature Aggregate stability Compaction
Soil water, nitrate, and Olsen P Mycorrhizal colonization Potentially mineralizable nitrogen

Species diversity: does it increase benefits?
Potential disease control
Increase nitrogen
Tap RootPurple top turnipSafflower
Fibrous RootOatsItalian ryegrassProso millet
Nitrogen FixersSpring Pea Common VetchLentil
BrassicaDaikon radishWinter canolaCamelina
Add soil carbon
Reduce compaction, move nutrients upward

Lessons learned about plantings
• Early weed control essential
• Common vetch difficult to terminate w/ glyphosate
• Camelina, Italian ryegrass, and lentil not competitive
• Millet not competitive in mid-spring mix
• Possible biological control benefits of wheat-stem sawfly with oat and radish
Photo: Susan Tallman

2013 Cover Crop Biomass – wet year
Bozeman
0
1
2
3
4
PEA FULL NF FR TR BC MNF MFR MTR MBC
<<
p<0.001
Ton/a
cre
1.8
0.9
0
1
2
3
4
PEA FULL NF FR TR BC MNF MFR MTR MBC
Dutton p=0.81
Ton/a
cre
1.8
0.9

Effect of cover crop treatment on spring wheat grain yield at Dutton (2014)
No legumes100% legumes
Averaged over 0, 60, 120 lb N/acre
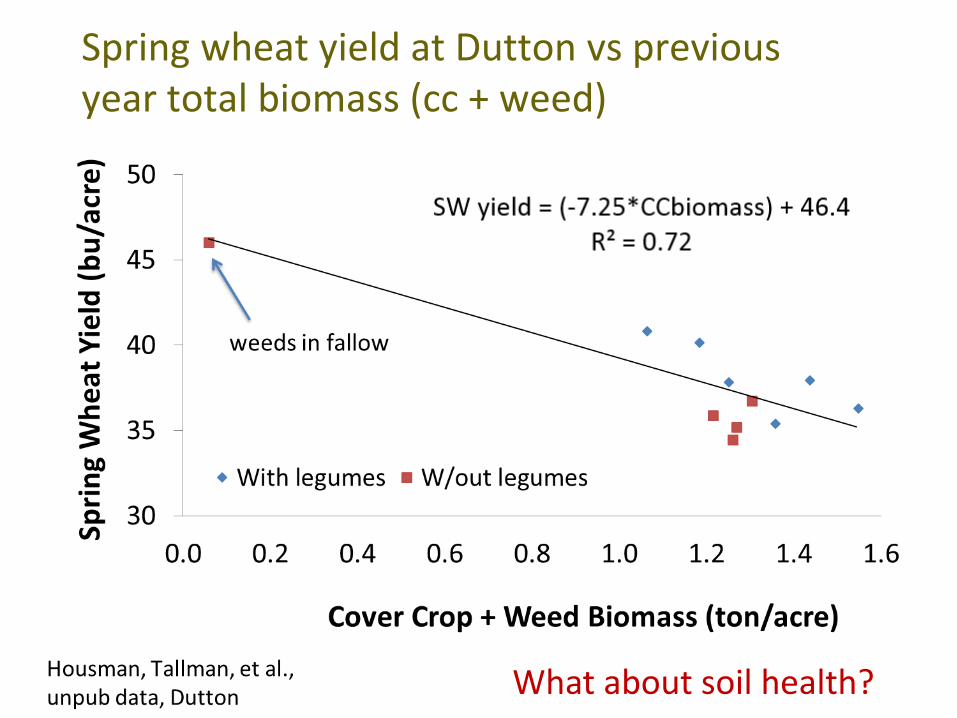
What about soil health?
Spring wheat yield at Dutton vs previous year total biomass (cc + weed)

Amsterdam Conrad Dutton Bozeman
Olsen P ns ns ns ns
Temp at 2” -- -- CC<fallow CC<fallow
Aggregate stability
ns ns ns ns
Summary after FIRST full rotation
Amsterdam Conrad Dutton Bozeman
MicrobialBiomass
ns ns CC>fallow CC>fallow
PMN CC>fallow Pea>6 spec CC>fallow ns
Amsterdam Conrad Dutton Bozeman
CC Biomass ns ns ns ns
Biomass C:N 8 spec>Pea ns 8 spec>Pea ns
ns – no significant difference (95% confidence) among treatments* - penetration resistance less for fallow than CCs at Dutton and Conrad, likely due to higher water content, not less compaction so only CCs compared.
Amsterdam Conrad
Olsen P ns ns
Temp at 2” CC<fallow CC<fallow
Aggregate stability ns ns
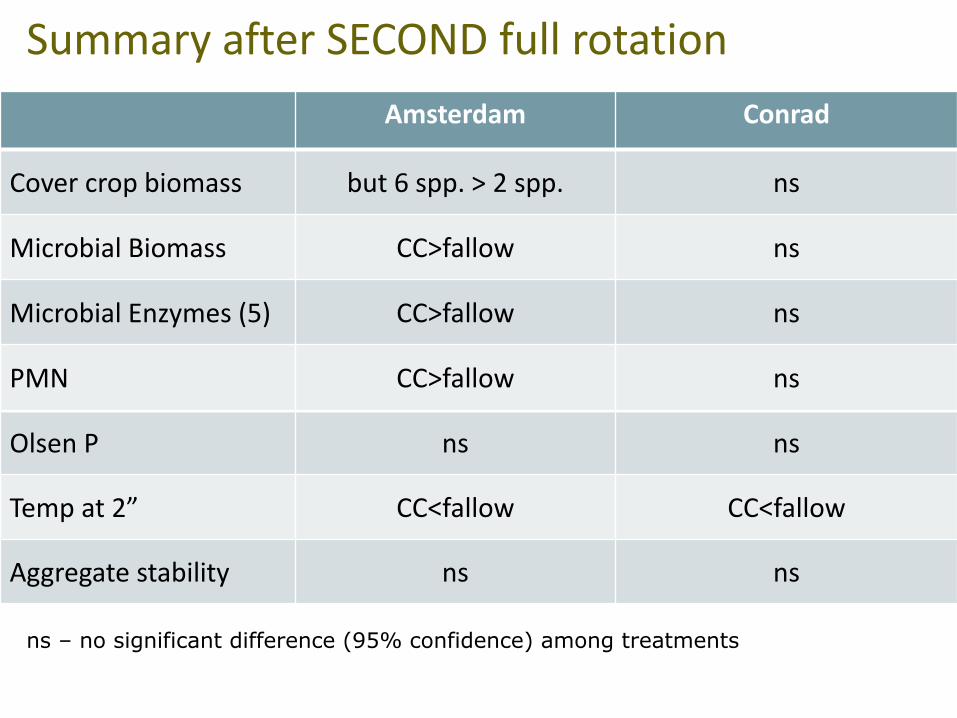
Summary after SECOND full rotation
Amsterdam Conrad
Cover crop biomass but 6 spp. > 2 spp. ns
Microbial Biomass CC>fallow ns
Microbial Enzymes (5) CC>fallow ns
PMN CC>fallow ns
ns – no significant difference (95% confidence) among treatments

Cover Crop Cocktails Plot Study: Take home messages on yield and soil quality
• After one cycle, spring wheat grain yields higher after pea and N fixers than most other mixes.
• Higher cover crop biomass correlated with lower spring wheat yield, likely b/c of more water and N use.
• Relatively few soil health differences between pea and 8-species mix after one cycle; not unexpected.
• After two cycles, no soil health differences between pea and 8-species mix, but CCs increased microbial activity.

Questions?

Cover Crop Cocktail Farm Study: 1 rotation of mixed CC reduced grain yield in 4 of 6 production years
* Signif difference with 90% probability
Yield less after mixed cover crops on farmers’ fields, likely due to late termination and high water & N use by CCrop
P. Miller unpub data
6 site average yield loss after ccrop than fallow
= 15 bu/acre
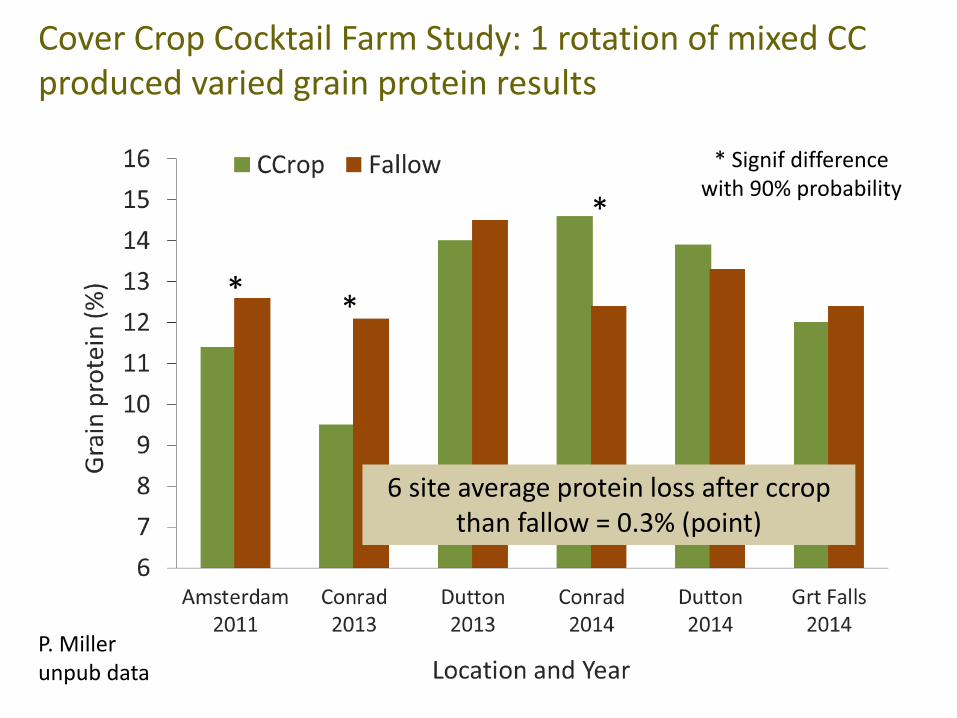
Cover Crop Cocktail Farm Study: 1 rotation of mixed CC produced varied grain protein results
* Signif difference with 90% probability
P. Miller unpub data
6 site average protein loss after ccropthan fallow = 0.3% (point)

Cover Crop Cocktails Farm Study: Take home messages on yield and protein
• Spring wheat grain yield was lower after CC than fallow in four of six field-scale studies, and protein results were mixed.
• High water use from late termination was likely cause of yield differences.

Not a stellar outlook for cover crops in short term, what about long term?
Legume or fallow year
Wheat year
8-year plot study
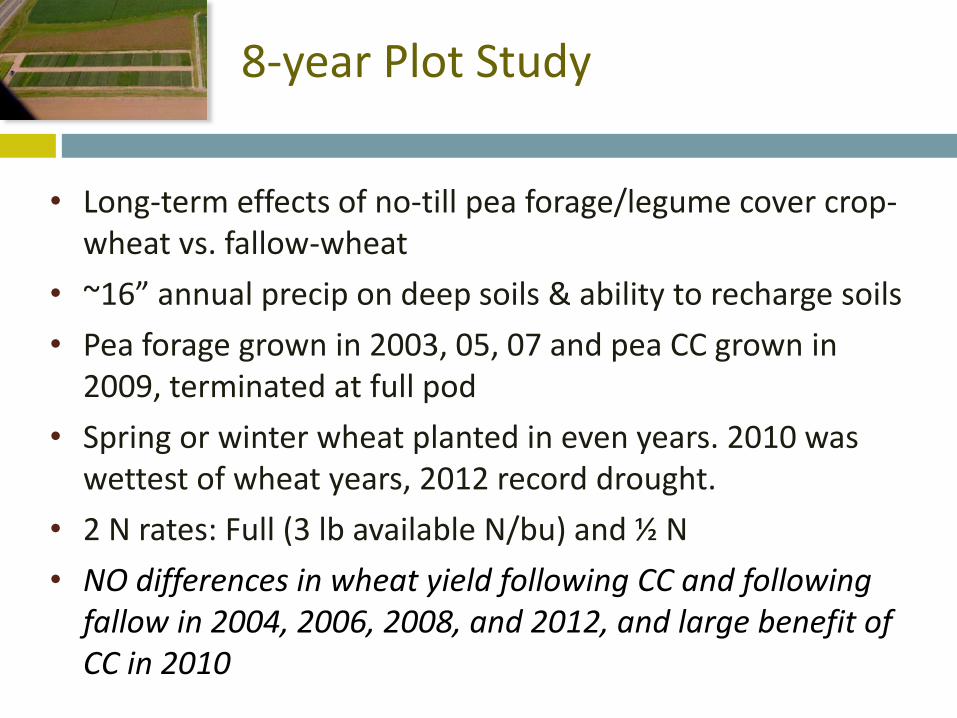
8-year Plot Study
• Long-term effects of no-till pea forage/legume cover crop-wheat vs. fallow-wheat
• ~16” annual precip on deep soils & ability to recharge soils
• Pea forage grown in 2003, 05, 07 and pea CC grown in 2009, terminated at full pod
• Spring or winter wheat planted in even years. 2010 was wettest of wheat years, 2012 record drought.
• 2 N rates: Full (3 lb available N/bu) and ½ N
• NO differences in wheat yield following CC and following fallow in 2004, 2006, 2008, and 2012, and large benefit of CC in 2010

8 Year Plot Study: Grain yield in 8th year (2010)
@ 12% moist

SOM can be built with recrop and CRP
Engel, unpub data, MSU Post Farm, 2012
SOM in 2002
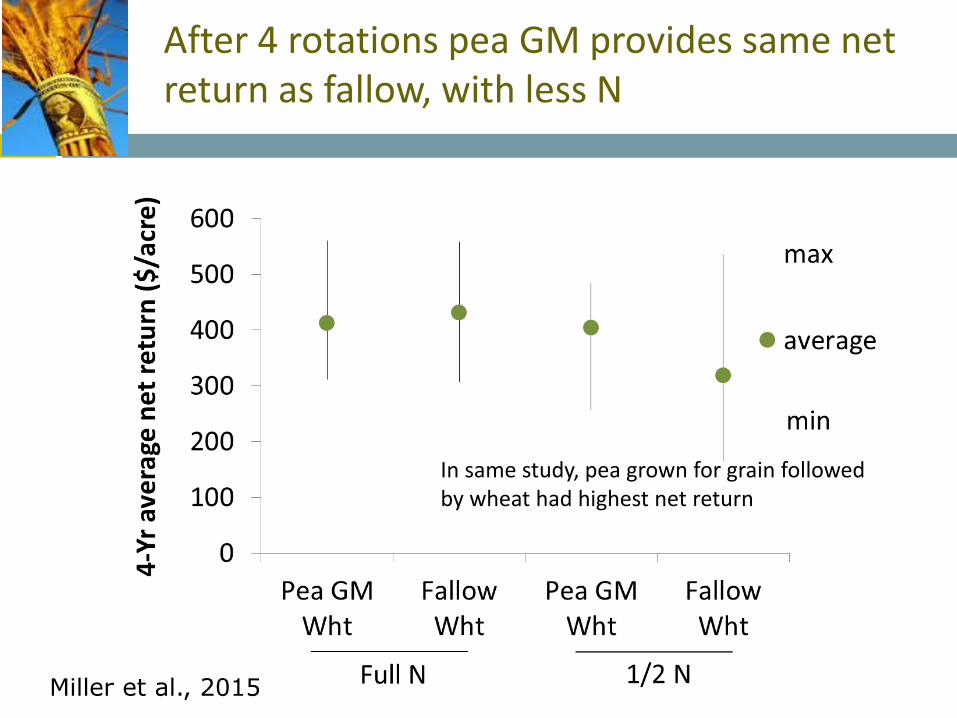
After 4 rotations pea GM provides same net return as fallow, with less N
Miller et al., 2015
In same study, pea grown for grain followed by wheat had highest net return
8-year Plot Study: Take home messages
• In the first 3 cycles, wheat grain yield was not higher after legume than after fallow.
• After 4 two-year cycles, wheat grain yield and protein were higher after legume CC than after fallow.
• Higher than normal precipitation in 2010 likely 1) increased release of available N from an increased organic N pool, and 2) made N limiting to growth.
• Over 100 lb N/ac was saved in 2010 following legume cover crop compared to fallow!
• Economic returns were more stable with cover crop (less dependent on N rate)

Questions?

• NRCS provides incentives for growing cover crops
Economic options
• Grazing may provide more immediate economic return and increase the rate of change in soil health. Currently under study at MSU-Northern and Bozeman (next talk).

Conclusions
• In short term (1 CC-cycle studies), grain yield is generally equal or less than after fallow.
• Early termination (by ~ first pea bloom) is key to preventing yield and protein losses.
• In short term studies, there does not appear to be yield or soil quality advantages of mixes over pea.
• In long term (4+ cycles), yield, protein, and net revenue can be higher after cover crops than fallow, especially at low N rates, likely from more available N.
• Cover crops provide resilience to uncontrollable factors such as weather and markets
• Cover crop value to soil health, subsequent crops, and possibly land value is expected to increase over time.
QUESTIONS?
For additional information on soil fertility topics including information on cover crops, and results from a MT survey on cover crops, see http://landresources.montana.edu/soilfertility