soil nutrient fundamentals, cover crops,...
TRANSCRIPT
SOIL NUTRIENT FUNDAMENTALS, COVER CROPS, and LEACHING
MSU Soil Fertility Extension
Clain [email protected] 994-6076
Golden Triangle Cropping SeminarJanuary 11 to 14, 2016
Objectives
• Present soil properties and how they interact with plant nutrients
• Illustrate the soil nutrient cycles of N, P, K, S and some micronutrients
• Discuss potential effect of cover crops on soil productivity
• Present management to minimize nitrate leaching
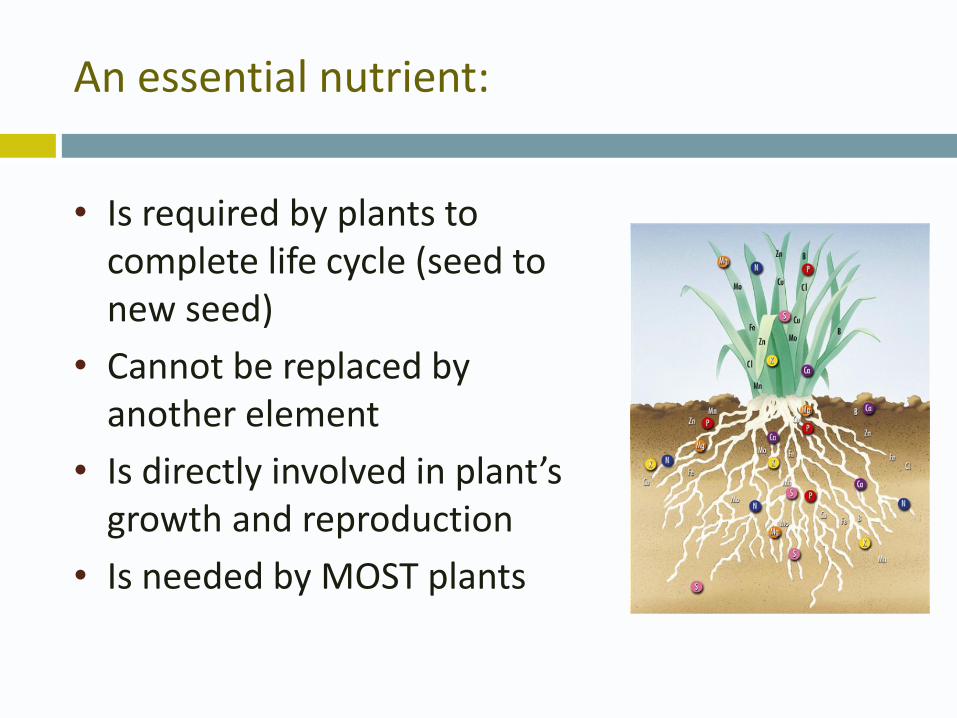
An essential nutrient:
• Is required by plants to complete life cycle (seed to new seed)
• Cannot be replaced by another element
• Is directly involved in plant’s growth and reproduction
• Is needed by MOST plants
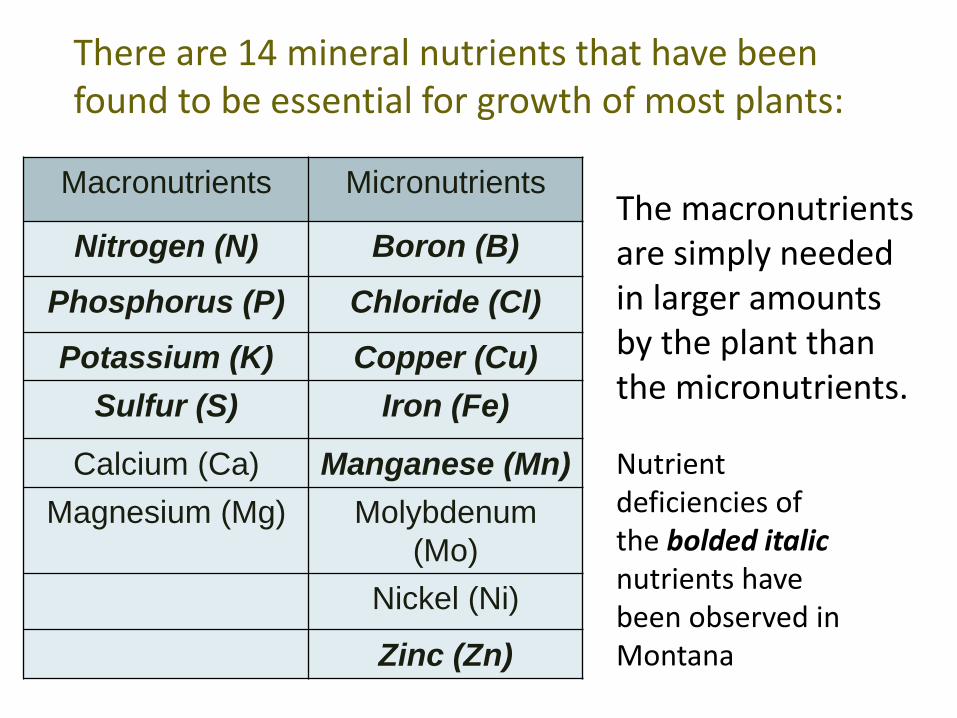
Macronutrients Micronutrients
Nitrogen (N) Boron (B)
Phosphorus (P) Chloride (Cl)
Potassium (K) Copper (Cu)
Sulfur (S) Iron (Fe)
Calcium (Ca) Manganese (Mn)
Magnesium (Mg) Molybdenum
(Mo)
Nickel (Ni)
Zinc (Zn)
The macronutrients are simply needed in larger amounts by the plant than the micronutrients.
Nutrient deficiencies of the bolded italic nutrients have been observed in Montana
There are 14 mineral nutrients that have been found to be essential for growth of most plants:
Soil properties that influence nutrient availability
• Texture/surface area
• CEC (cation exchange capacity) and AEC (anion exchange capacity)
• SOM (soil organic matter)
• pH
CEC and AEC
• Cation Exchange Capacity (CEC) - Total negative charge on a soil
• A measure of the soil’s ability to hold onto and supply positive ions (e.g. NH4
+) to a crop.
• Anion Exchange Capacity (AEC) – Total positive charge to hold onto nutrient anions such as SO4
-2
• Generally weak bonds that release as concentration of nutrient in solution drops
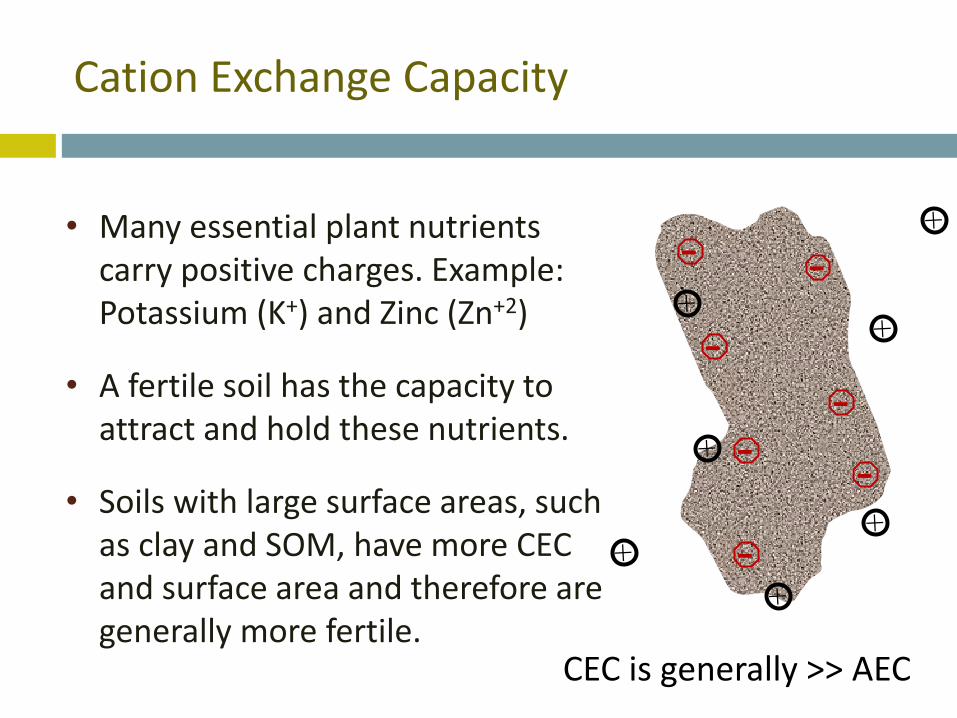
Cation Exchange Capacity
• Many essential plant nutrients carry positive charges. Example: Potassium (K+) and Zinc (Zn+2)
• A fertile soil has the capacity to attract and hold these nutrients.
• Soils with large surface areas, such as clay and SOM, have more CEC and surface area and therefore are generally more fertile.
--
-
-
-
--
CEC is generally >> AEC
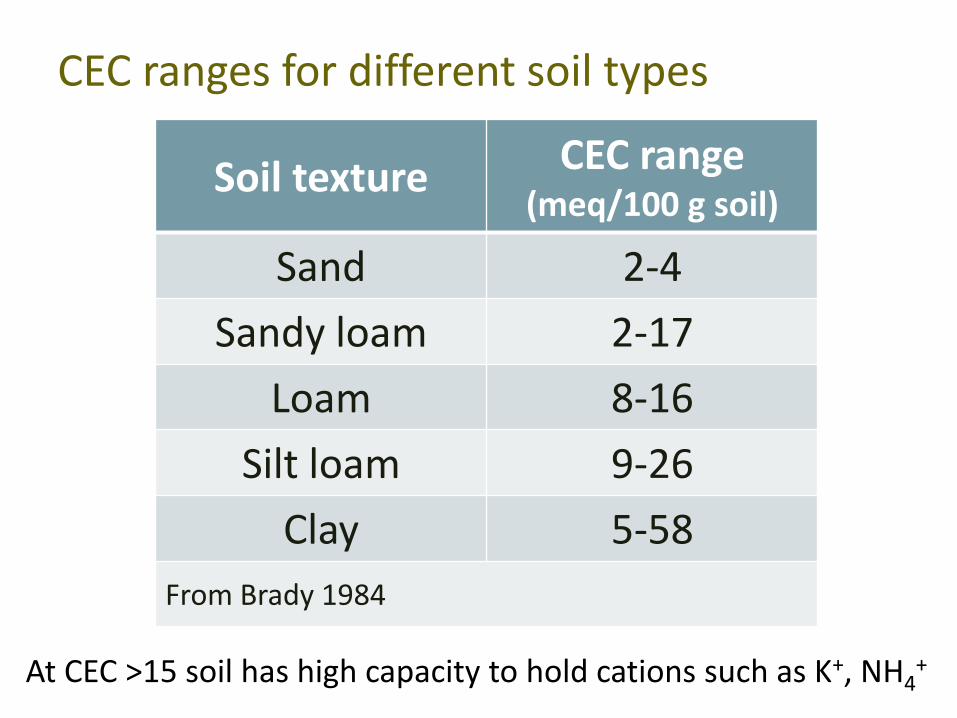
At CEC >15 soil has high capacity to hold cations such as K+, NH4+
Soil texture CEC range (meq/100 g soil)
Sand 2-4
Sandy loam 2-17
Loam 8-16
Silt loam 9-26
Clay 5-58
From Brady 1984
CEC ranges for different soil types
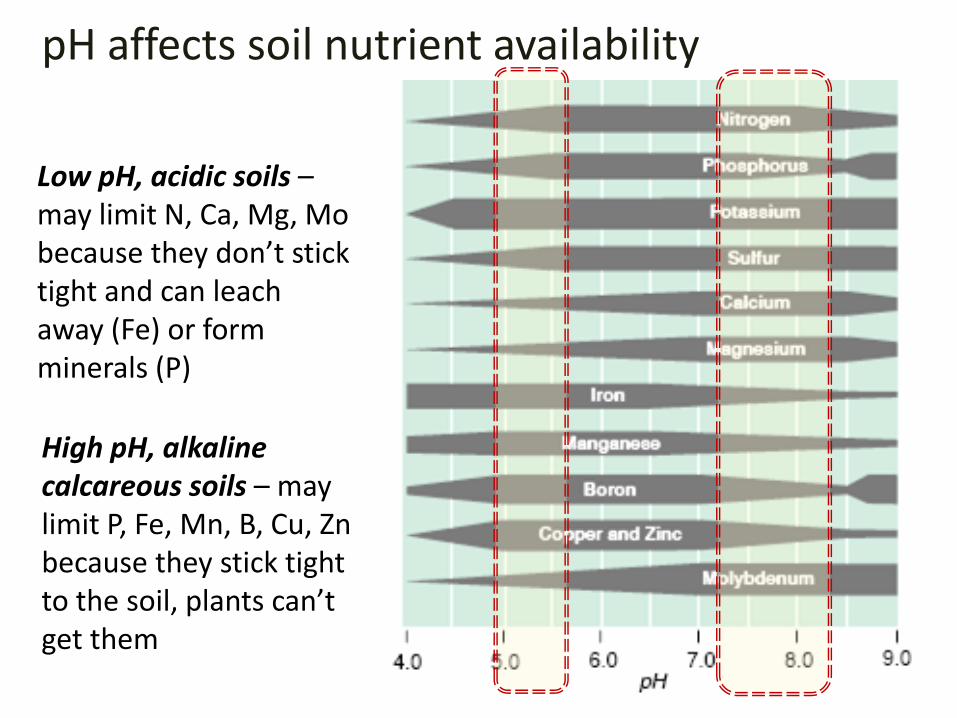
pH affects soil nutrient availability
High pH, alkaline calcareous soils – may limit P, Fe, Mn, B, Cu, Zn because they stick tight to the soil, plants can’t get them
Low pH, acidic soils –may limit N, Ca, Mg, Mo because they don’t stick tight and can leach away (Fe) or form minerals (P)
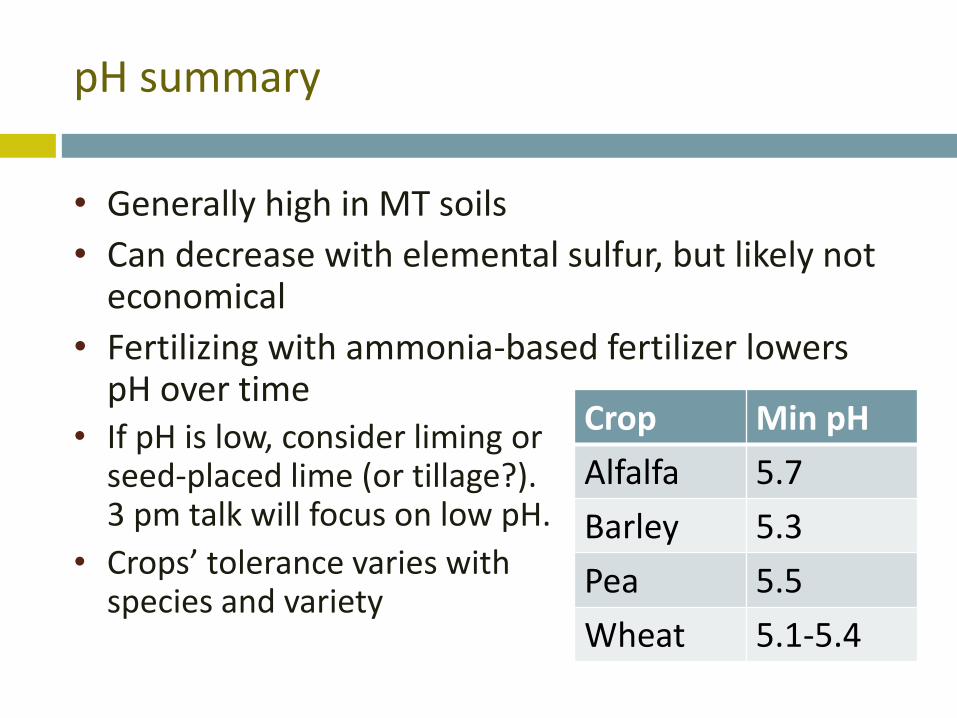
pH summary
• If pH is low, consider liming or seed-placed lime (or tillage?). 3 pm talk will focus on low pH.
• Crops’ tolerance varies with species and variety
Crop Min pH
Alfalfa 5.7
Barley 5.3
Pea 5.5
Wheat 5.1-5.4
• Generally high in MT soils
• Can decrease with elemental sulfur, but likely not economical
• Fertilizing with ammonia-based fertilizer lowers pH over time
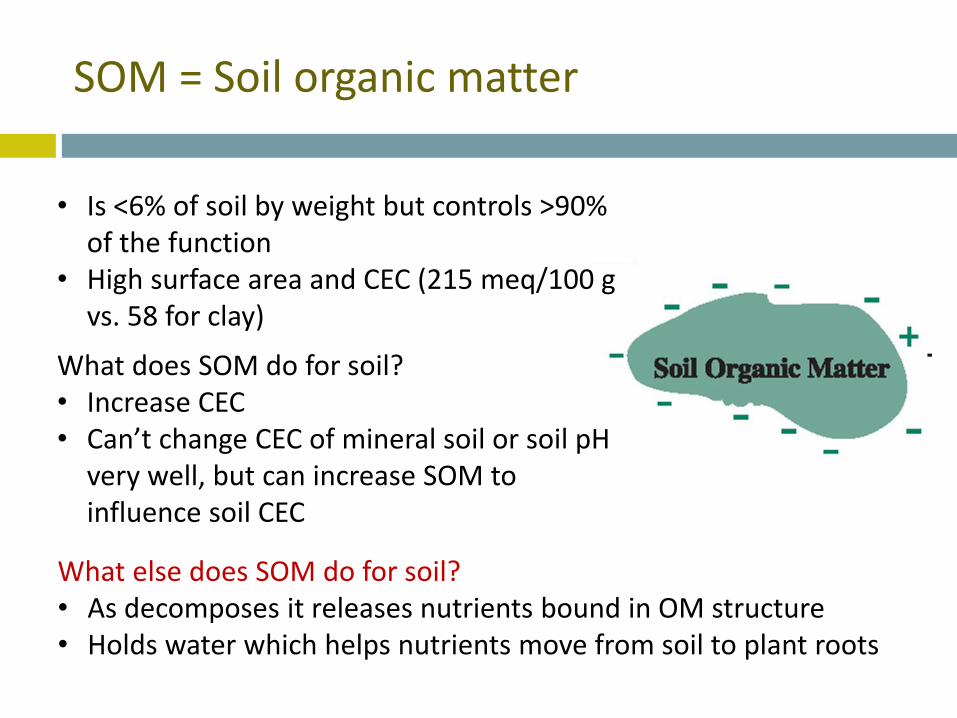
• Is <6% of soil by weight but controls >90% of the function
• High surface area and CEC (215 meq/100 g vs. 58 for clay)
What does SOM do for soil?• Increase CEC• Can’t change CEC of mineral soil or soil pH
very well, but can increase SOM to influence soil CEC
SOM = Soil organic matter
What else does SOM do for soil?• As decomposes it releases nutrients bound in OM structure• Holds water which helps nutrients move from soil to plant roots
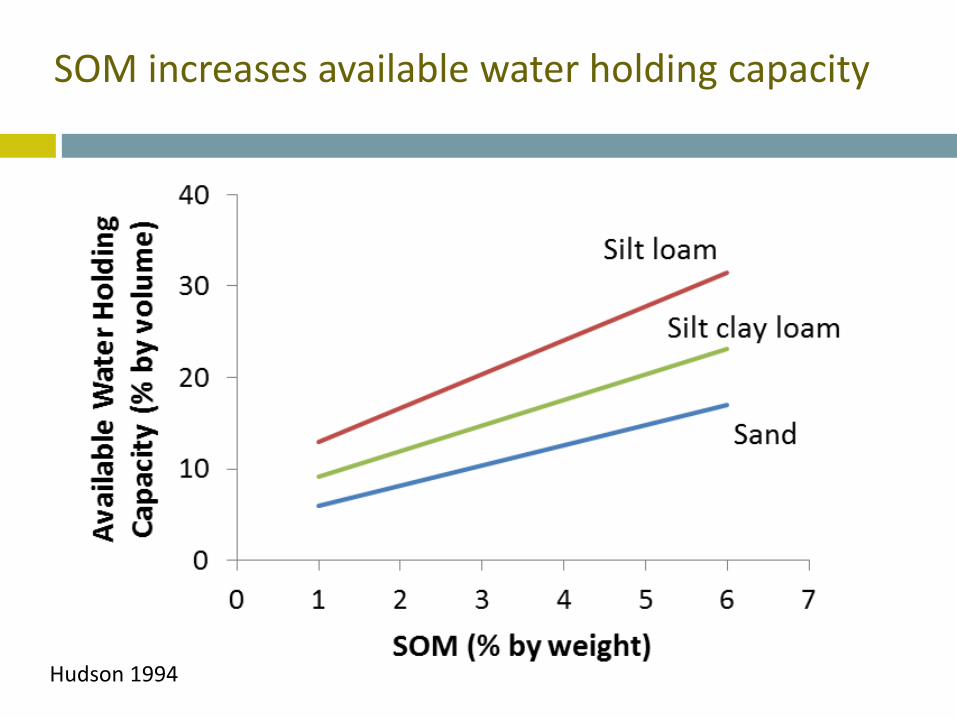
SOM increases available water holding capacity
Hudson 1994
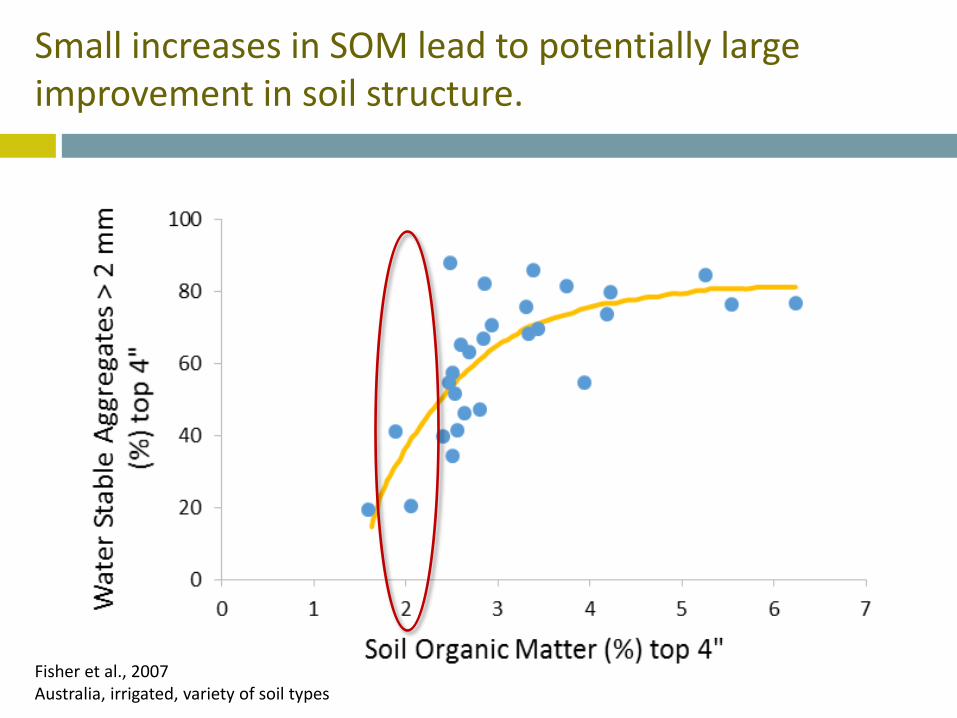
Small increases in SOM lead to potentially large improvement in soil structure.
Fisher et al., 2007Australia, irrigated, variety of soil types
Questions?
Now on to nutrient cycling
Some knowledge helps understanding of the whys of source, rate, timing and placement.
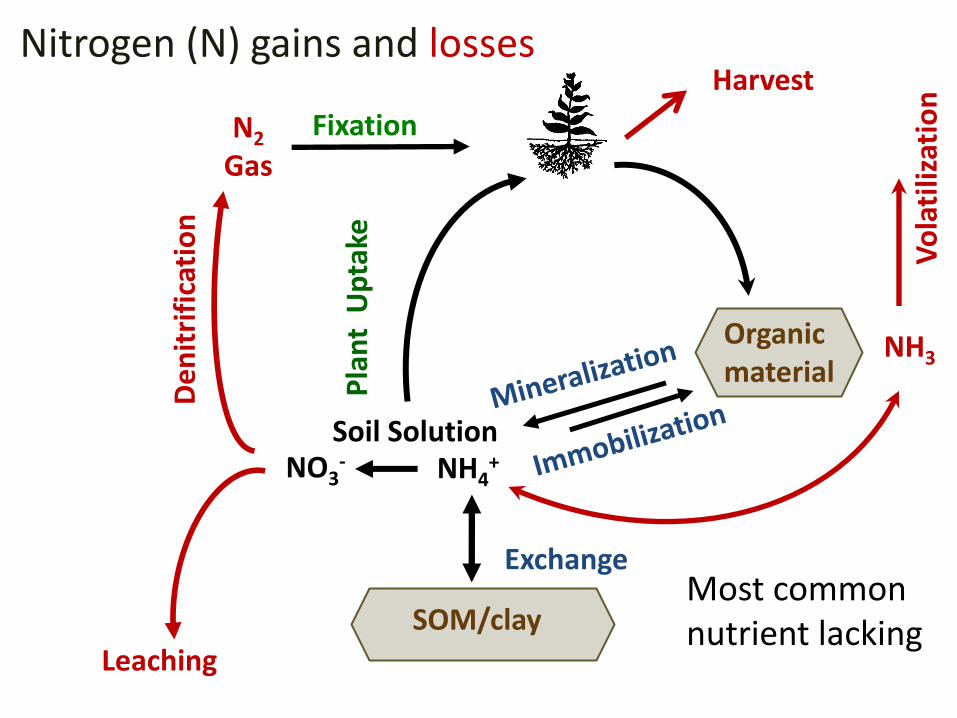
Soil Solution
Exchange
Harvest
Pla
nt
Up
take
Leaching
Organic material
SOM/clayMost common nutrient lacking
Nitrogen (N) gains and losses
NH4+NO3
-
N2
GasD
en
itri
fica
tio
n
Fixation
NH3
Vo
lati
lizat
ion
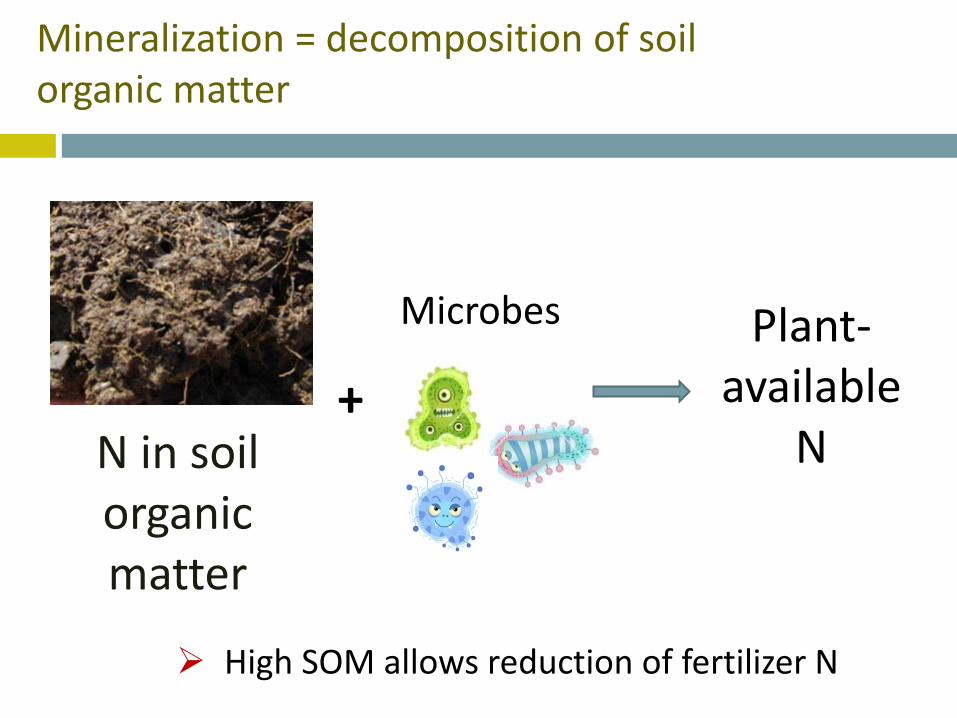
Mineralization = decomposition of soil organic matter
+N in soil organic matter
Plant-available
N
Microbes
High SOM allows reduction of fertilizer N
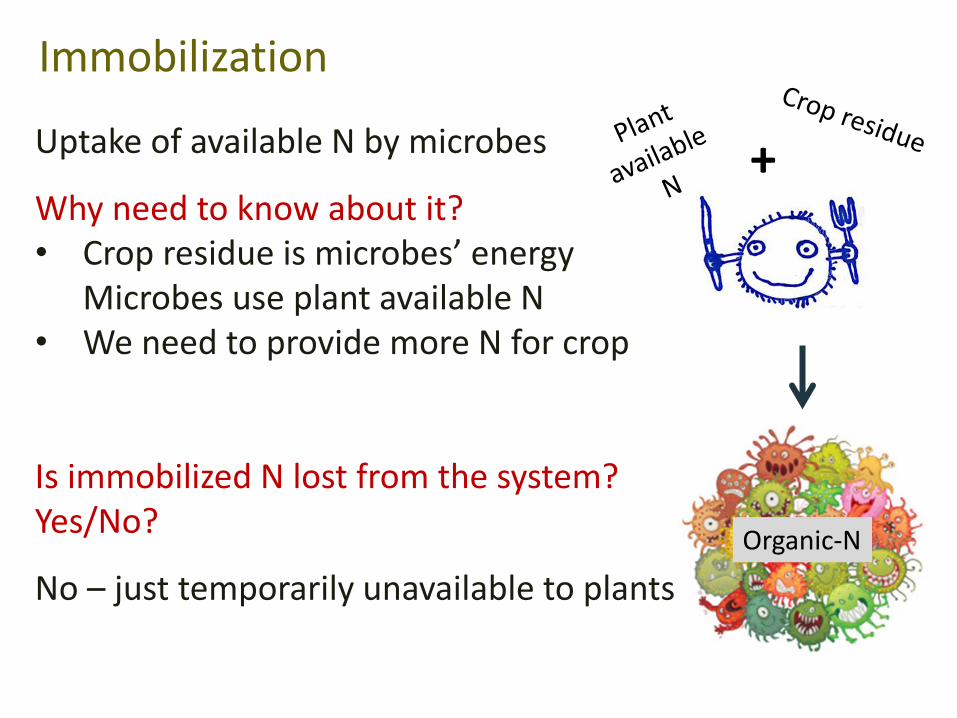
Uptake of available N by microbes
Why need to know about it?• Crop residue is microbes’ energy
Microbes use plant available N• We need to provide more N for crop
Is immobilized N lost from the system? Yes/No?
No – just temporarily unavailable to plants
Immobilization
Organic-N
+

References for more information are provided at end of this ppt.
Questions on N cycle?
Soil Solution
Exchange
Harvest
Pla
nt
Up
take
Leaching
Organic material
Mineral
Fe or Al oxide/clay
Erosion & Runoff
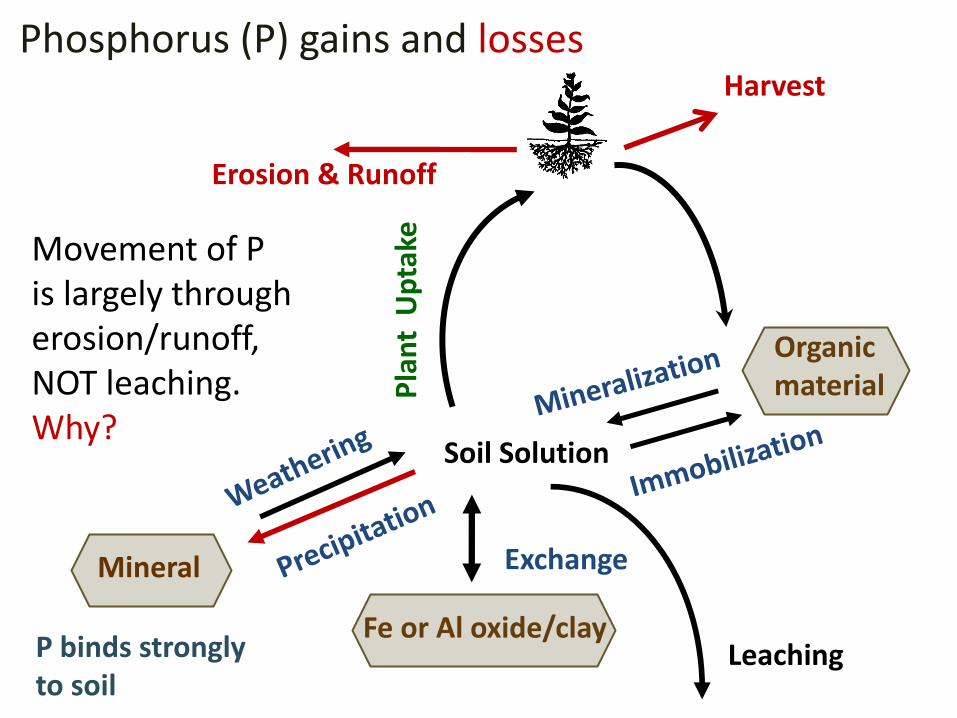
Movement of P is largely througherosion/runoff,NOT leaching. Why?
P binds strongly to soil
Phosphorus (P) gains and losses
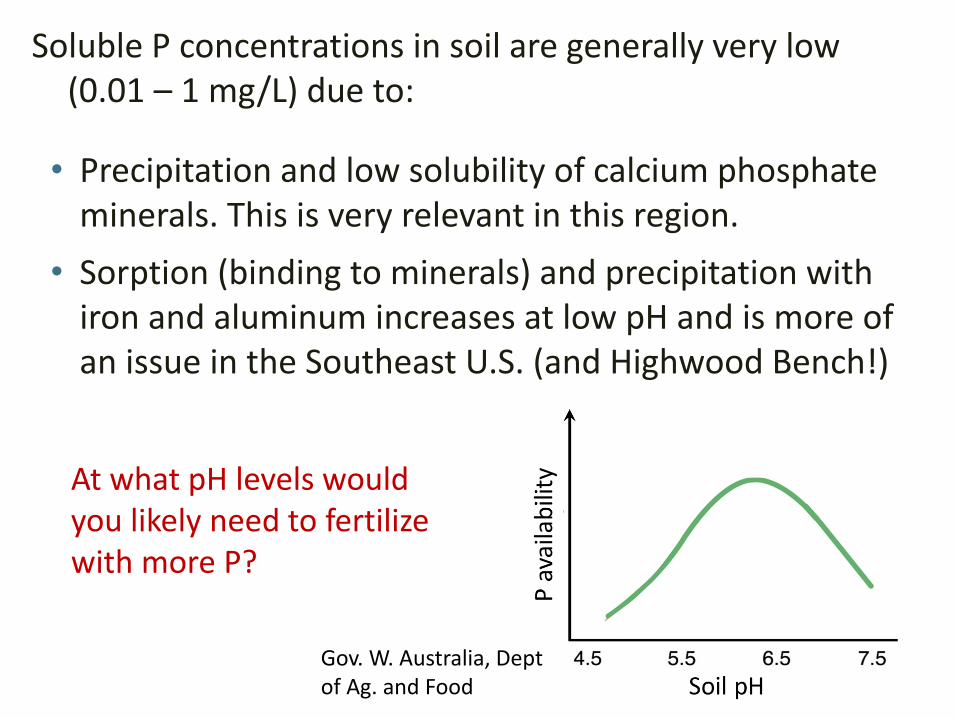
Soluble P concentrations in soil are generally very low (0.01 – 1 mg/L) due to:
• Precipitation and low solubility of calcium phosphate minerals. This is very relevant in this region.
• Sorption (binding to minerals) and precipitation with iron and aluminum increases at low pH and is more of an issue in the Southeast U.S. (and Highwood Bench!)
At what pH levels would you likely need to fertilize with more P?
Gov. W. Australia, Deptof Ag. and Food
Soil Solution
Exchange
Harvest
Pla
nt
Up
take
Leaching
Vo
lati
lizat
ion
Atm
osp
he
ric
De
po
siti
on
Organic material
Mineral
Fe or Al oxide/clay
Erosion & Runoff
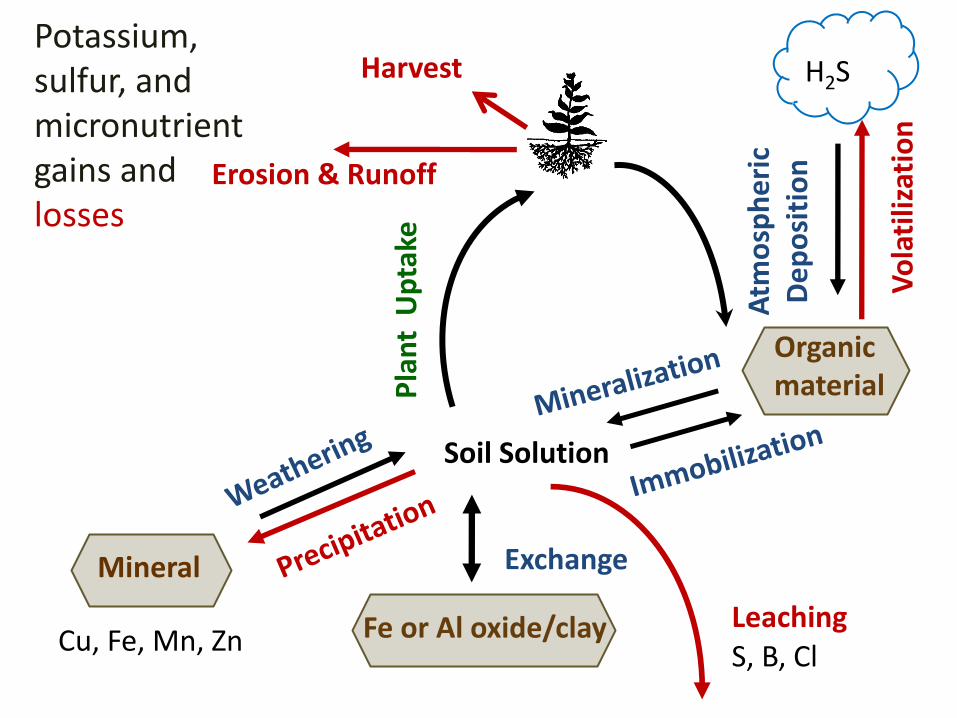
Potassium, sulfur, and micronutrient gains and losses
H2S
S, B, ClCu, Fe, Mn, Zn
Questions?
And now for something completely different: Cover Crops
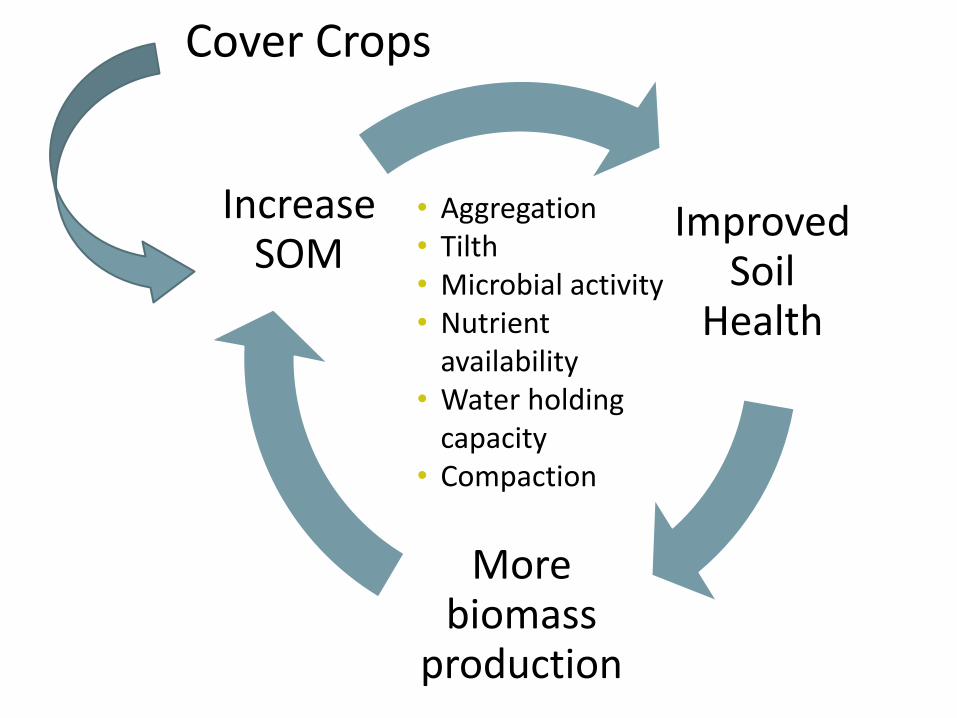
Improved Soil
Health
More biomass
production
Increase SOM
Cover Crops
• Aggregation• Tilth• Microbial activity• Nutrient
availability• Water holding
capacity• Compaction
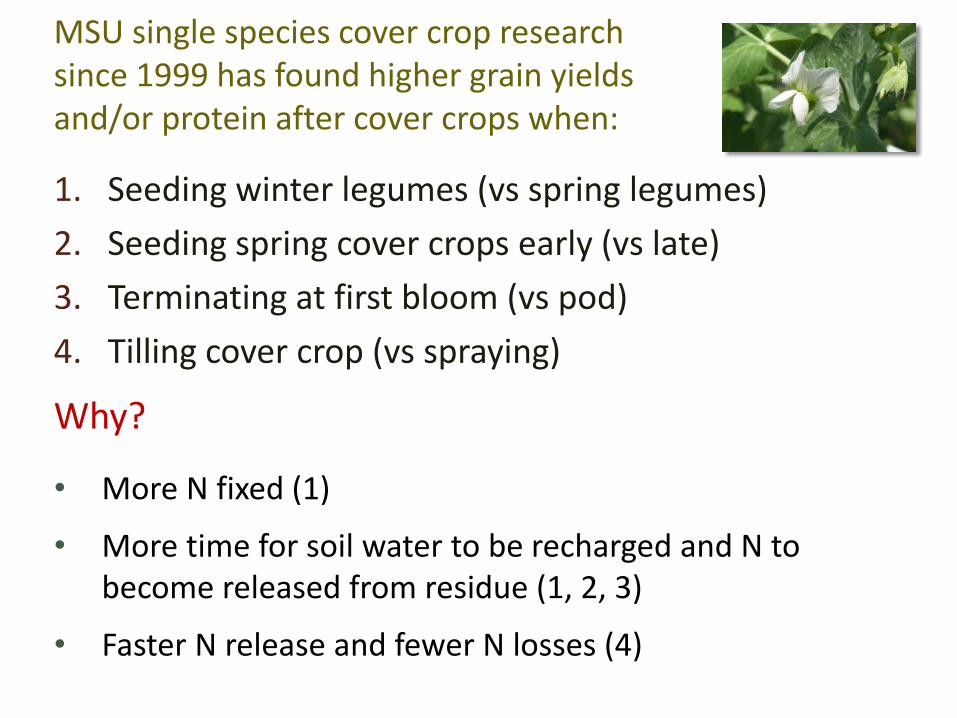
MSU single species cover crop research since 1999 has found higher grain yields and/or protein after cover crops when:
1. Seeding winter legumes (vs spring legumes)
2. Seeding spring cover crops early (vs late)
3. Terminating at first bloom (vs pod)
4. Tilling cover crop (vs spraying)
Why?
• More N fixed (1)
• More time for soil water to be recharged and N to become released from residue (1, 2, 3)
• Faster N release and fewer N losses (4)
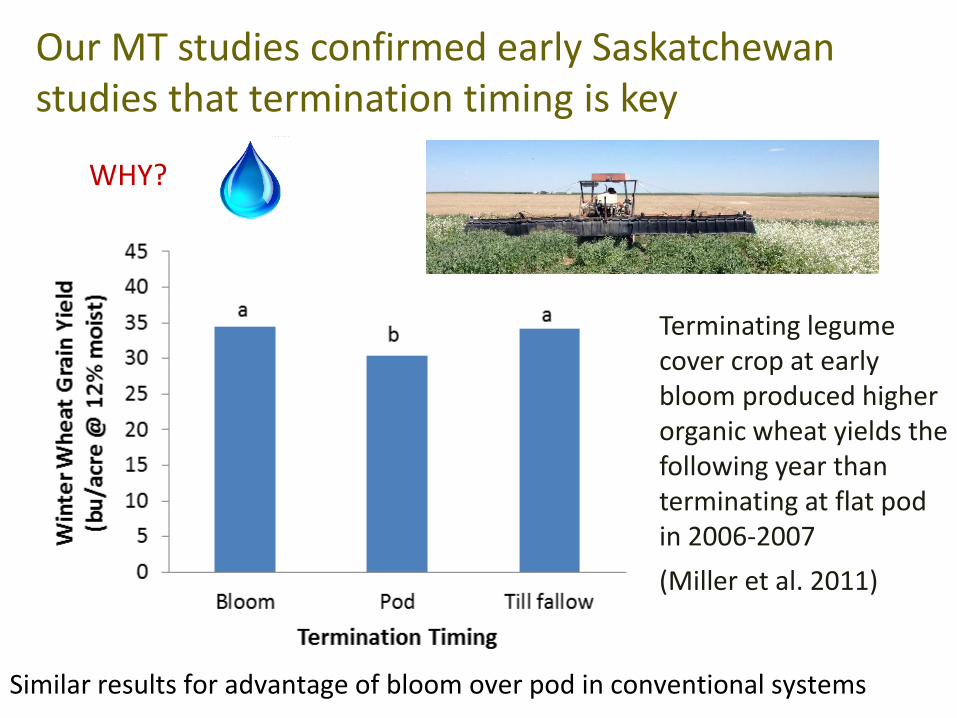
Terminating legume cover crop at early bloom produced higher organic wheat yields the following year than terminating at flat pod in 2006-2007
(Miller et al. 2011)
Our MT studies confirmed early Saskatchewan studies that termination timing is key
Similar results for advantage of bloom over pod in conventional systems
WHY?
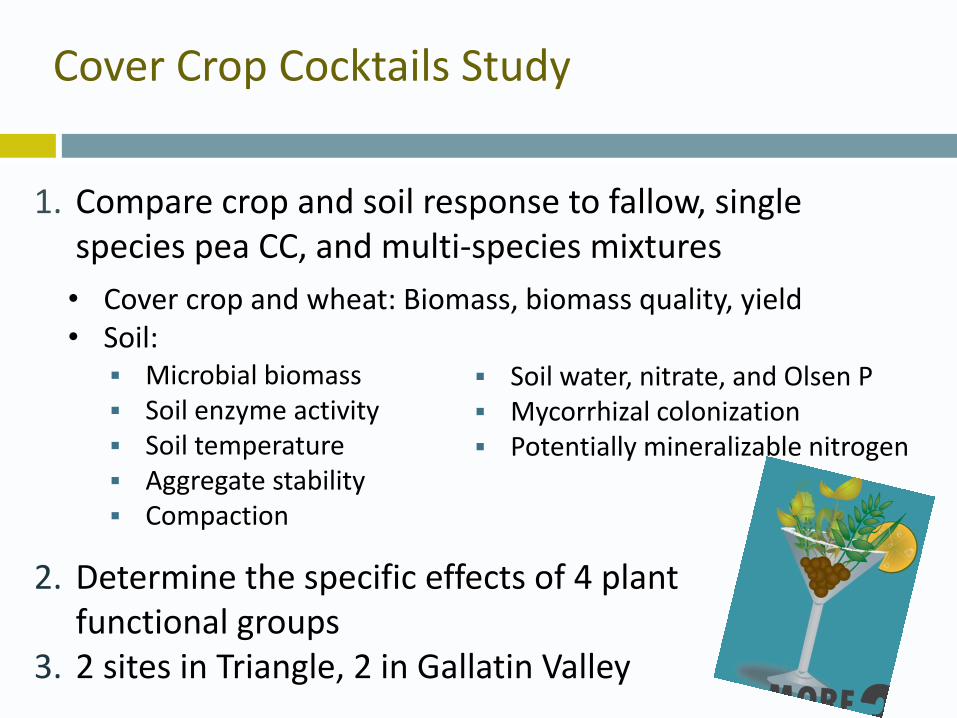
Cover Crop Cocktails Study
• Cover crop and wheat: Biomass, biomass quality, yield • Soil:
1. Compare crop and soil response to fallow, single species pea CC, and multi-species mixtures
2. Determine the specific effects of 4 plant functional groups
3. 2 sites in Triangle, 2 in Gallatin Valley
Microbial biomass Soil enzyme activity Soil temperature Aggregate stability Compaction
Soil water, nitrate, and Olsen P Mycorrhizal colonization Potentially mineralizable nitrogen
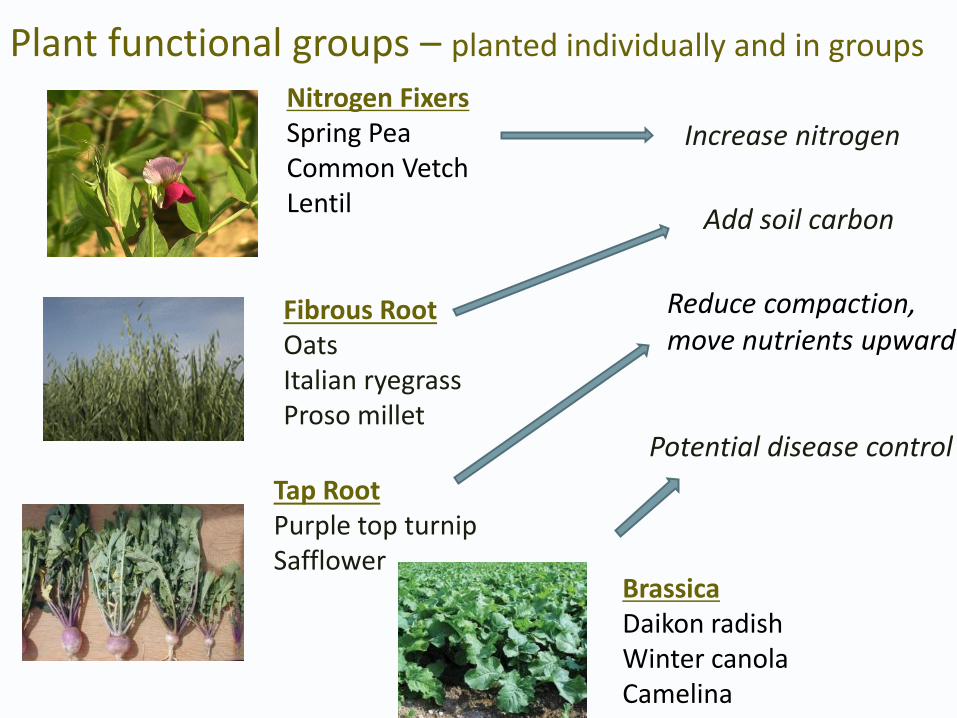
Plant functional groups – planted individually and in groups
Potential disease control
Increase nitrogen
Tap RootPurple top turnipSafflower
Fibrous RootOatsItalian ryegrassProso millet
Nitrogen FixersSpring Pea Common VetchLentil
BrassicaDaikon radishWinter canolaCamelina
Add soil carbon
Reduce compaction, move nutrients upward
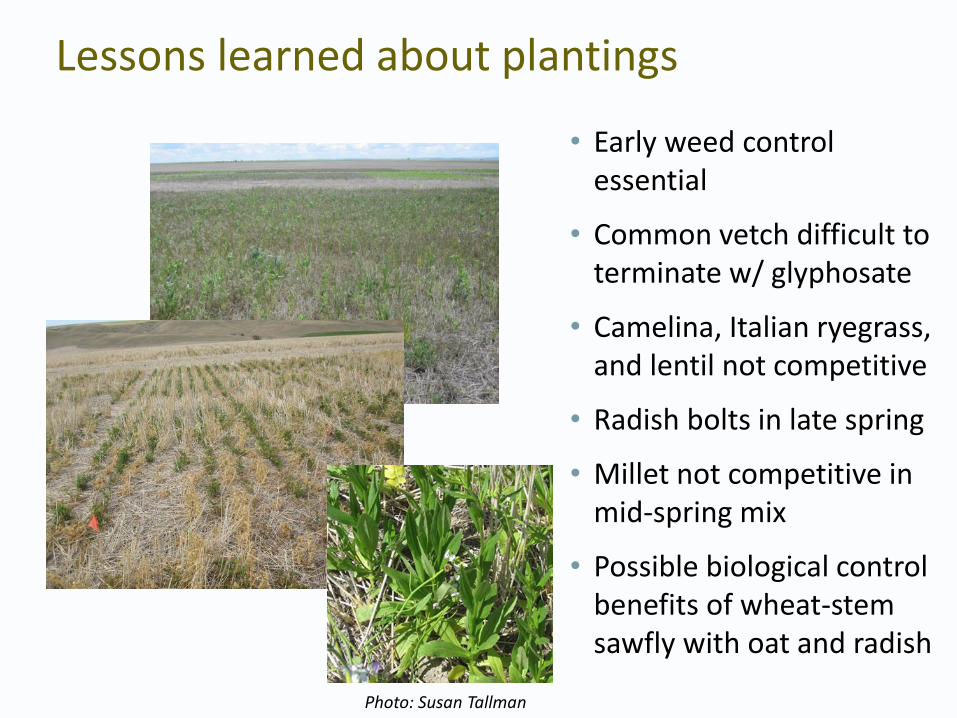
Lessons learned about plantings
• Early weed control essential
• Common vetch difficult to terminate w/ glyphosate
• Camelina, Italian ryegrass, and lentil not competitive
• Radish bolts in late spring
• Millet not competitive in mid-spring mix
• Possible biological control benefits of wheat-stem sawfly with oat and radish
Photo: Susan Tallman
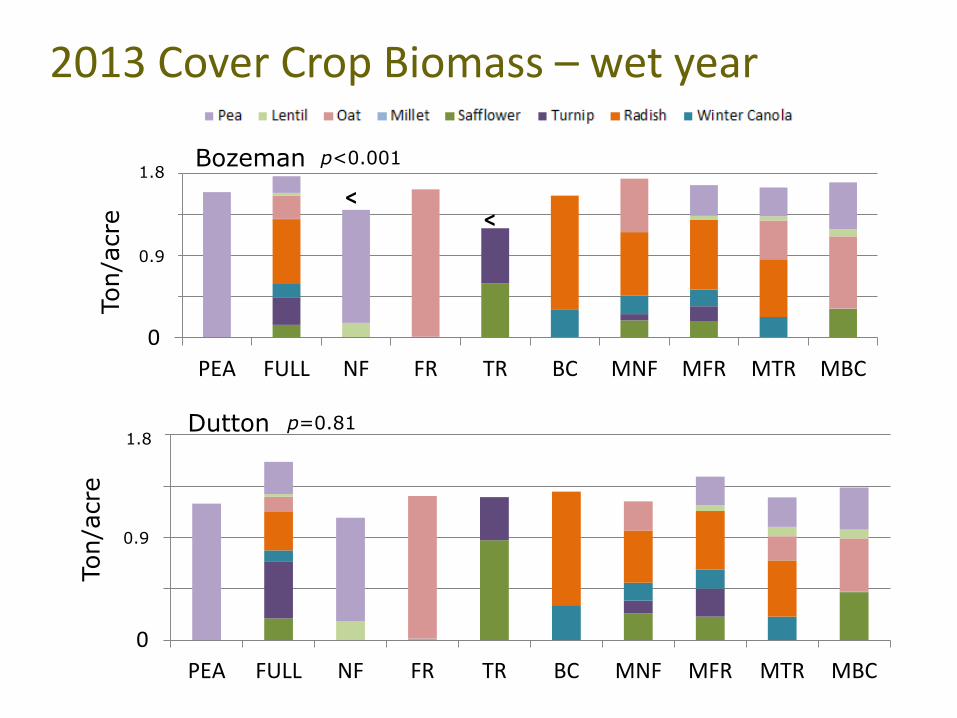
2013 Cover Crop Biomass – wet year
Bozeman
0
1
2
3
4
PEA FULL NF FR TR BC MNF MFR MTR MBC
<<
p<0.001
Ton/a
cre
1.8
0.9
0
1
2
3
4
PEA FULL NF FR TR BC MNF MFR MTR MBC
Dutton p=0.81
Ton/a
cre
1.8
0.9
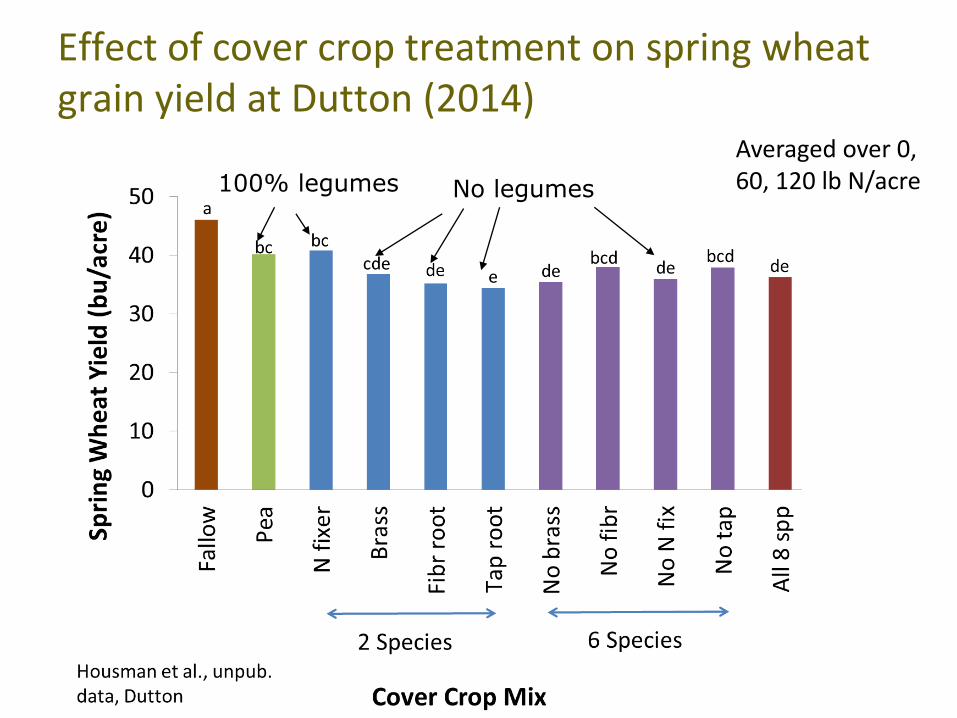
Effect of cover crop treatment on spring wheat grain yield at Dutton (2014)
No legumes100% legumes
Averaged over 0, 60, 120 lb N/acre
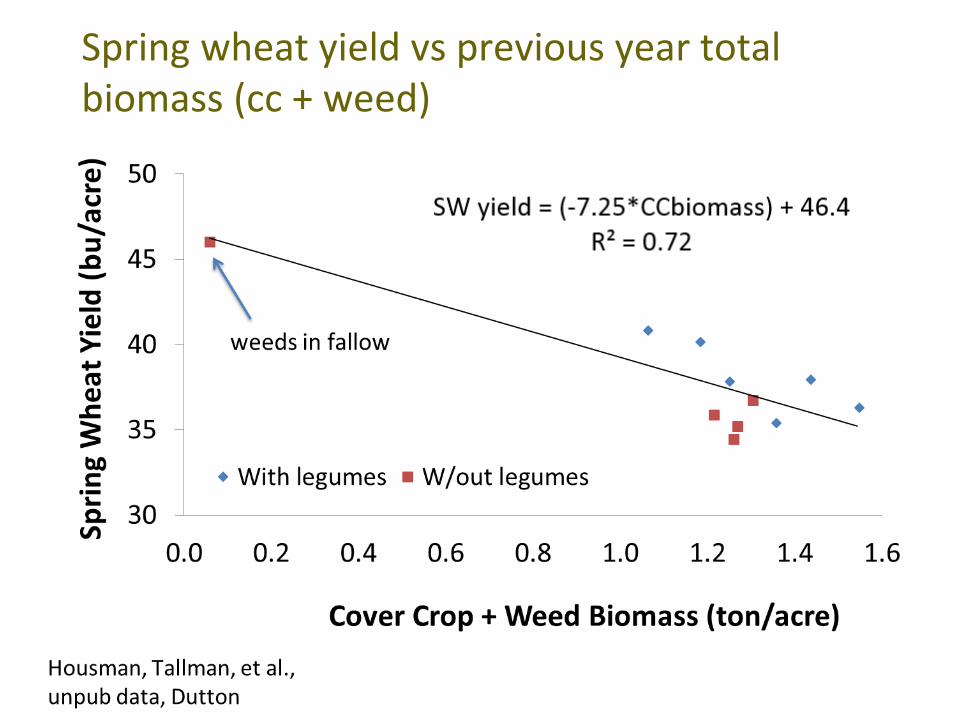
Spring wheat yield vs previous year total biomass (cc + weed)
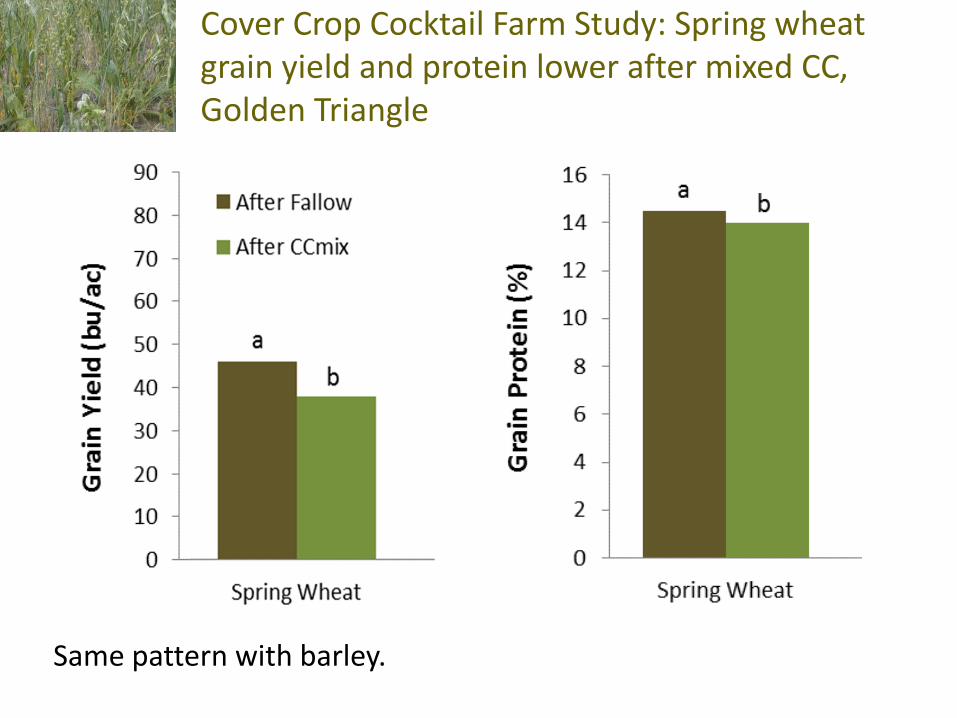
Cover Crop Cocktail Farm Study: Spring wheat grain yield and protein lower after mixed CC, Golden Triangle
Same pattern with barley.
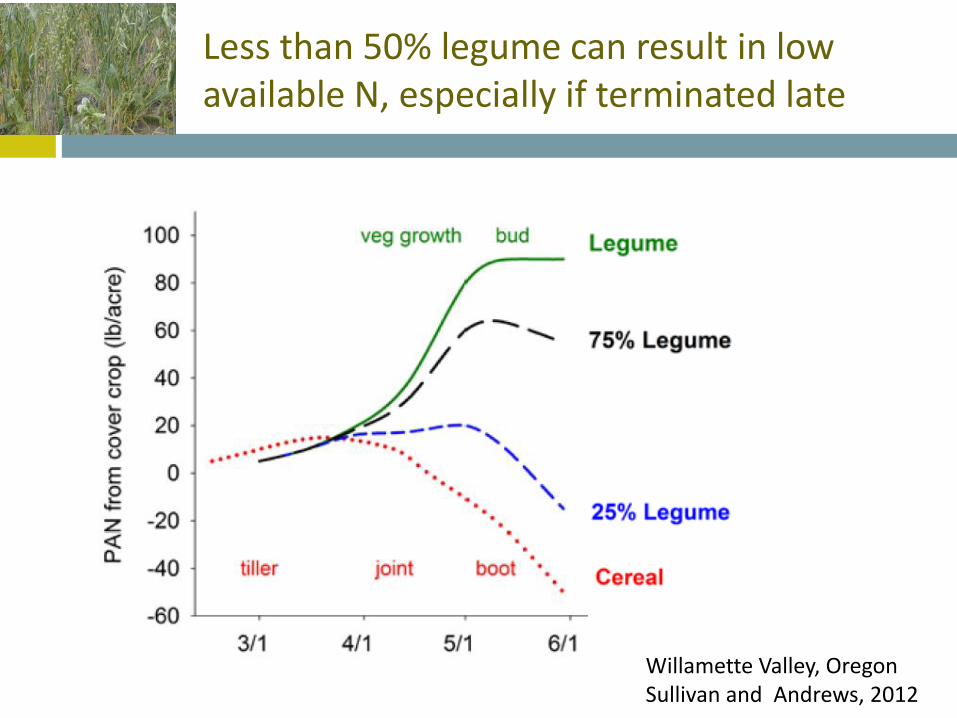
Less than 50% legume can result in low available N, especially if terminated late
Willamette Valley, OregonSullivan and Andrews, 2012
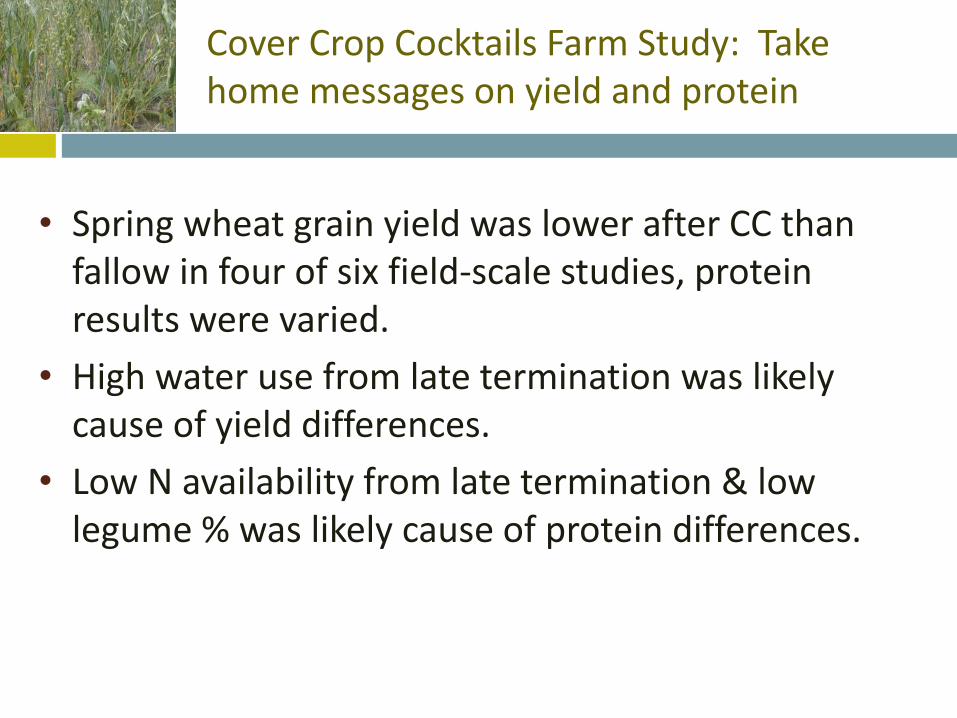
Cover Crop Cocktails Farm Study: Take home messages on yield and protein
• Spring wheat grain yield was lower after CC than fallow in four of six field-scale studies, protein results were varied.
• High water use from late termination was likely cause of yield differences.
• Low N availability from late termination & low legume % was likely cause of protein differences.
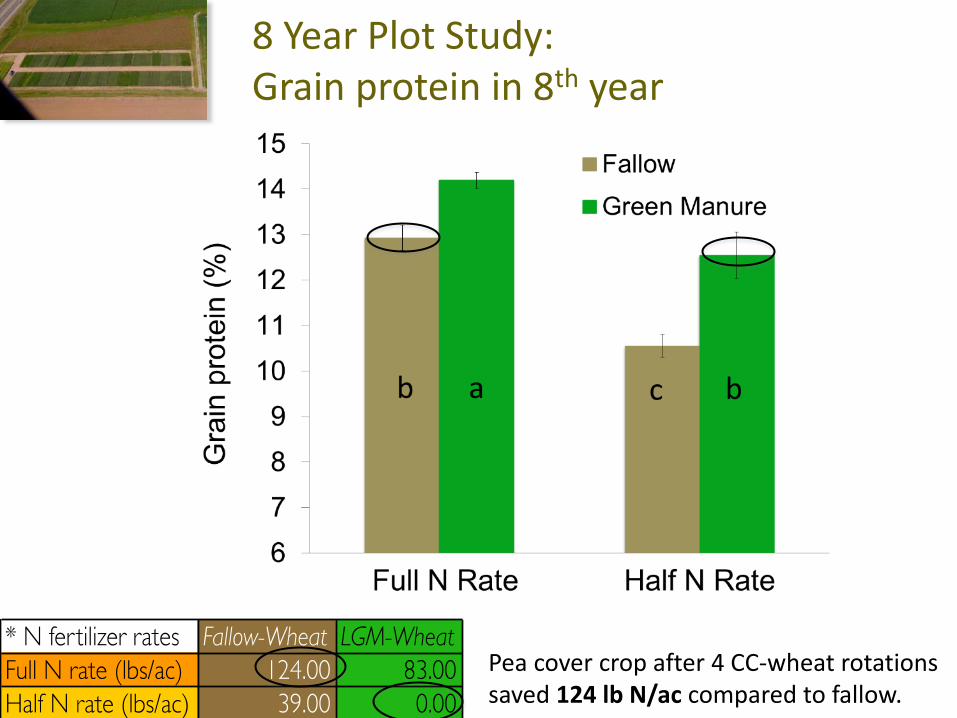
8 Year Plot Study:Grain protein in 8th year
Pea cover crop after 4 CC-wheat rotations saved 124 lb N/ac compared to fallow.
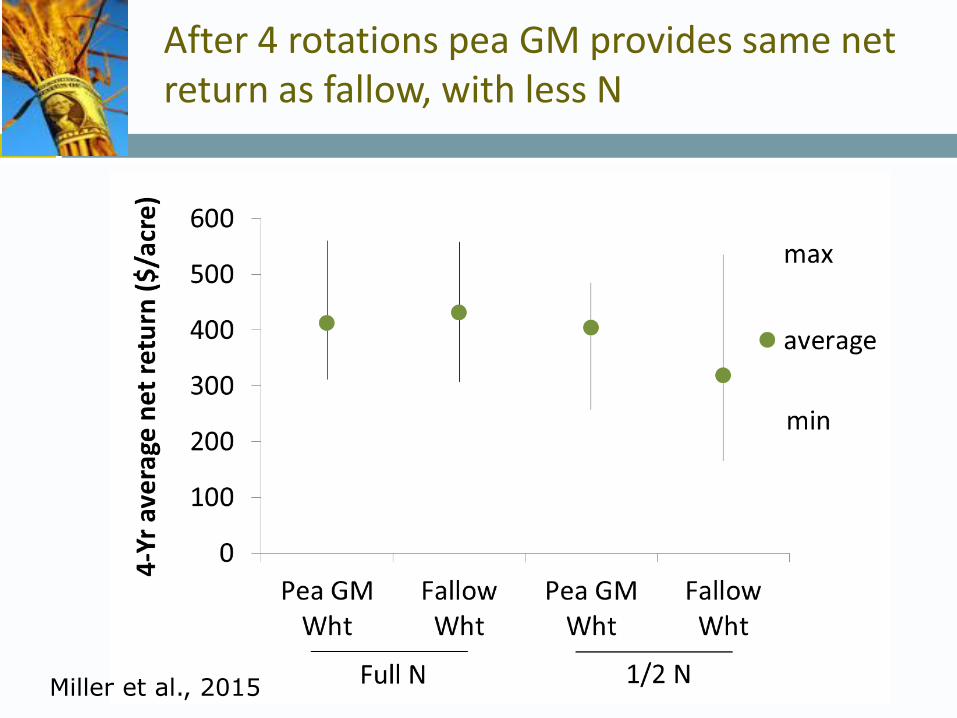
After 4 rotations pea GM provides same net return as fallow, with less N
Miller et al., 2015

Questions?
Now on to nitrate leaching
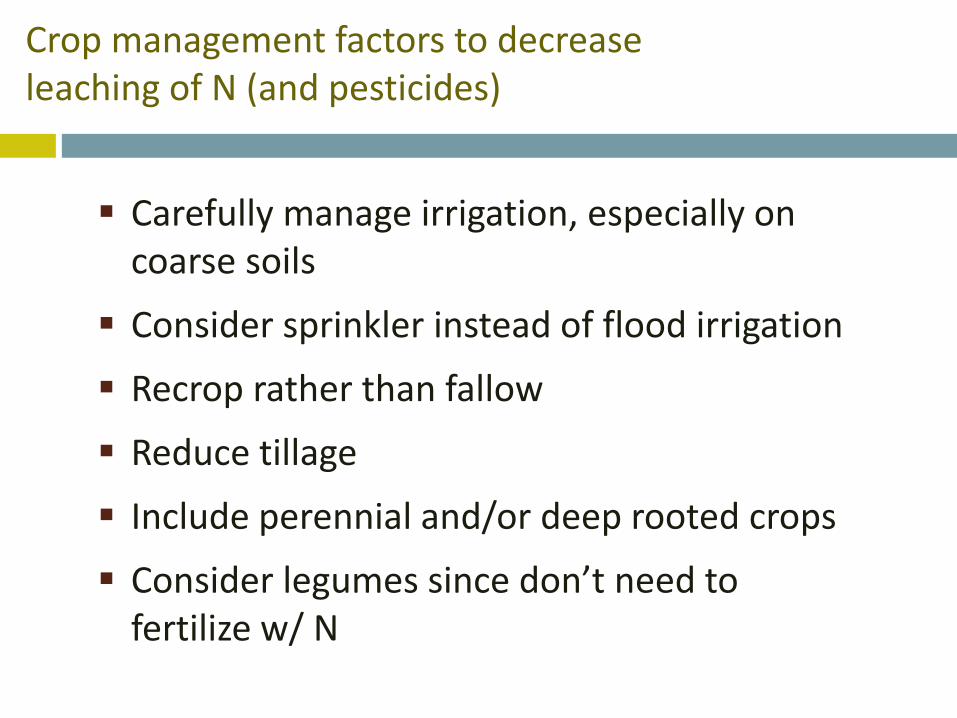
Crop management factors to decrease leaching of N (and pesticides)
Carefully manage irrigation, especially on coarse soils
Consider sprinkler instead of flood irrigation
Recrop rather than fallow
Reduce tillage
Include perennial and/or deep rooted crops
Consider legumes since don’t need to fertilize w/ N
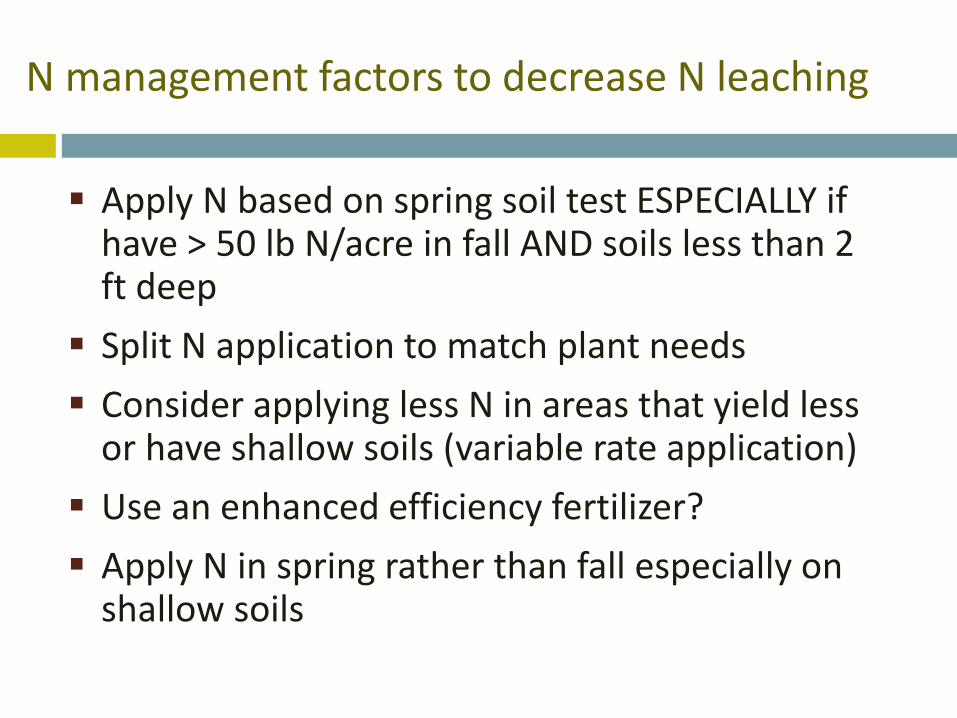
N management factors to decrease N leaching
Apply N based on spring soil test ESPECIALLY if have > 50 lb N/acre in fall AND soils less than 2 ft deep
Split N application to match plant needs
Consider applying less N in areas that yield less or have shallow soils (variable rate application)
Use an enhanced efficiency fertilizer?
Apply N in spring rather than fall especially on shallow soils
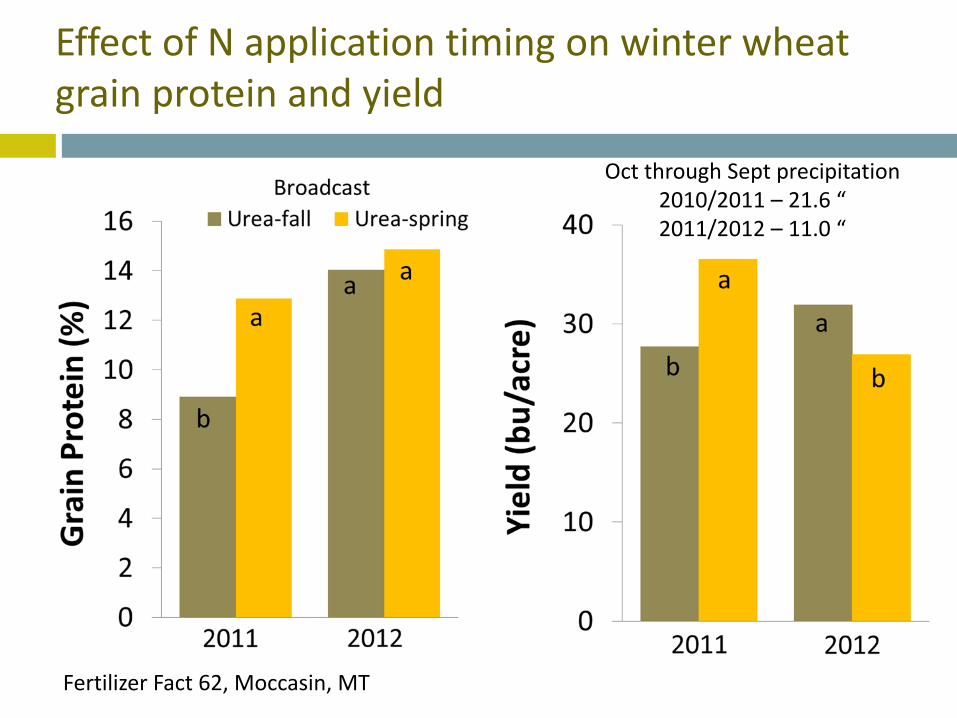
Effect of N application timing on winter wheat grain protein and yield
Oct through Sept precipitation2010/2011 – 21.6 “2011/2012 – 11.0 “
Fertilizer Fact 62, Moccasin, MT
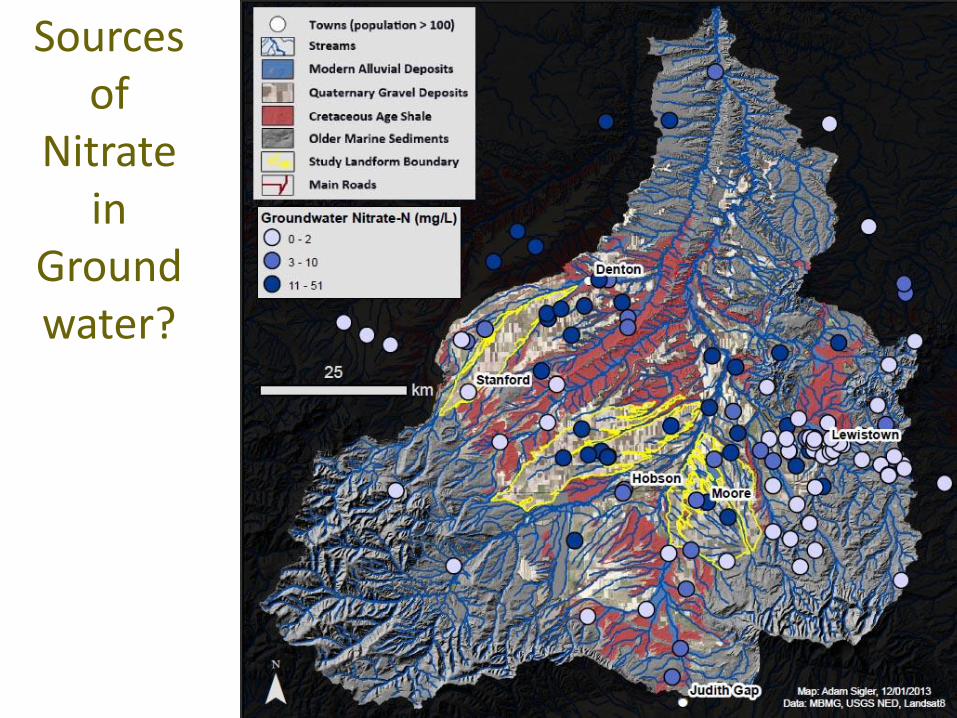
Sources of
Nitrate in
Groundwater?

Adam Sigler presents a section on nitrate leaching – contact Adam at [email protected] for his slides
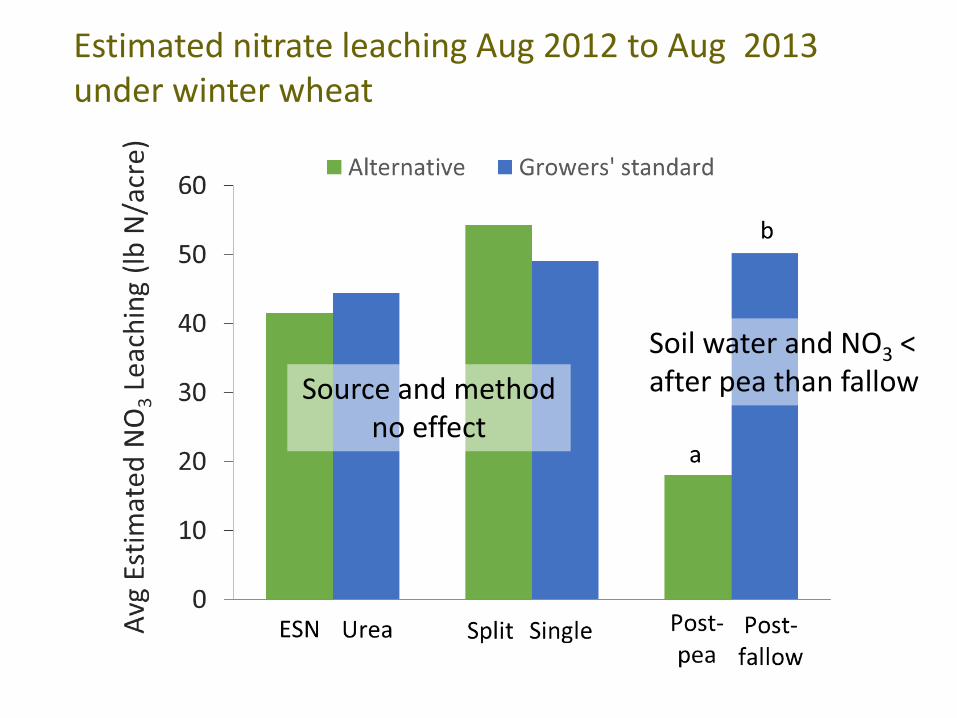
Estimated nitrate leaching Aug 2012 to Aug 2013 under winter wheat
Soil water and NO3 < after pea than fallowSource and method
no effect
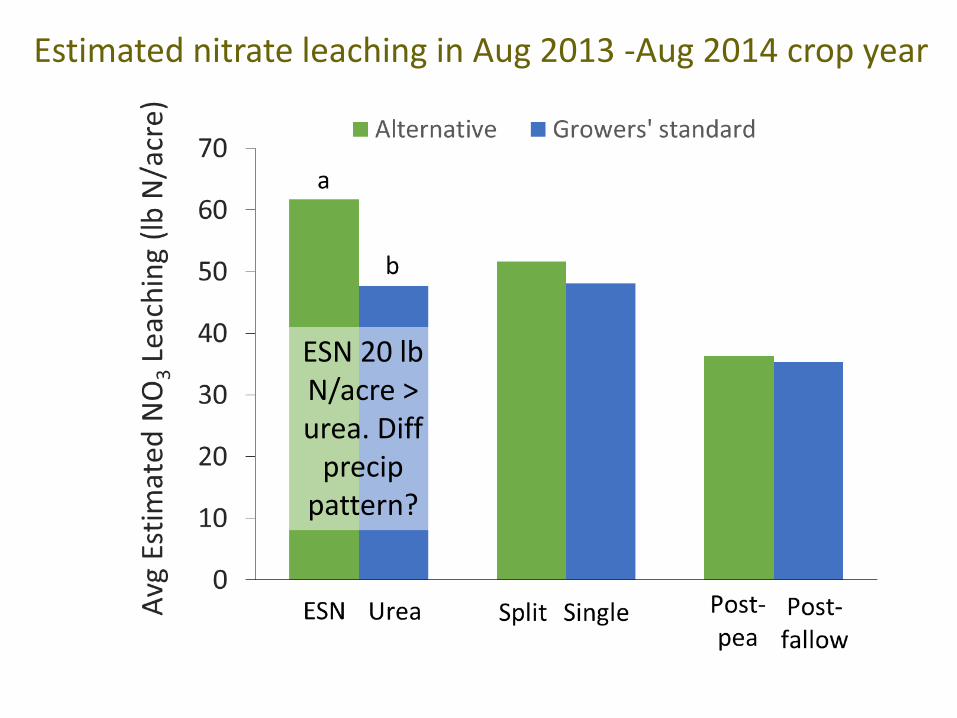
Estimated nitrate leaching in Aug 2013 -Aug 2014 crop year
ESN 20 lb N/acre > urea. Diff
precippattern?
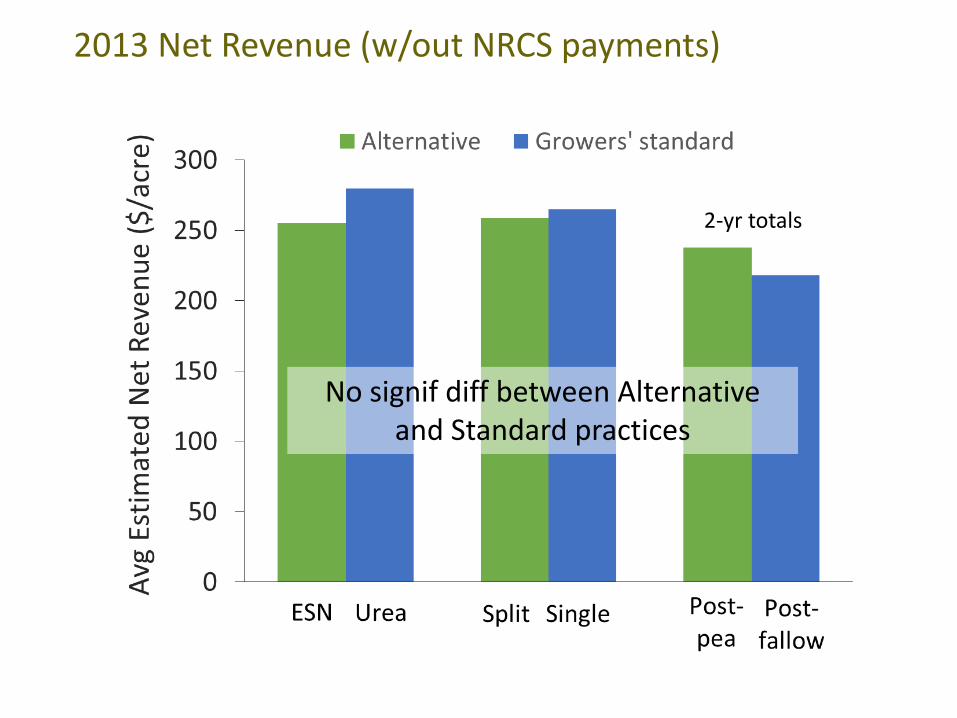
2013 Net Revenue (w/out NRCS payments)
No signif diff between Alternative and Standard practices
2-yr totals
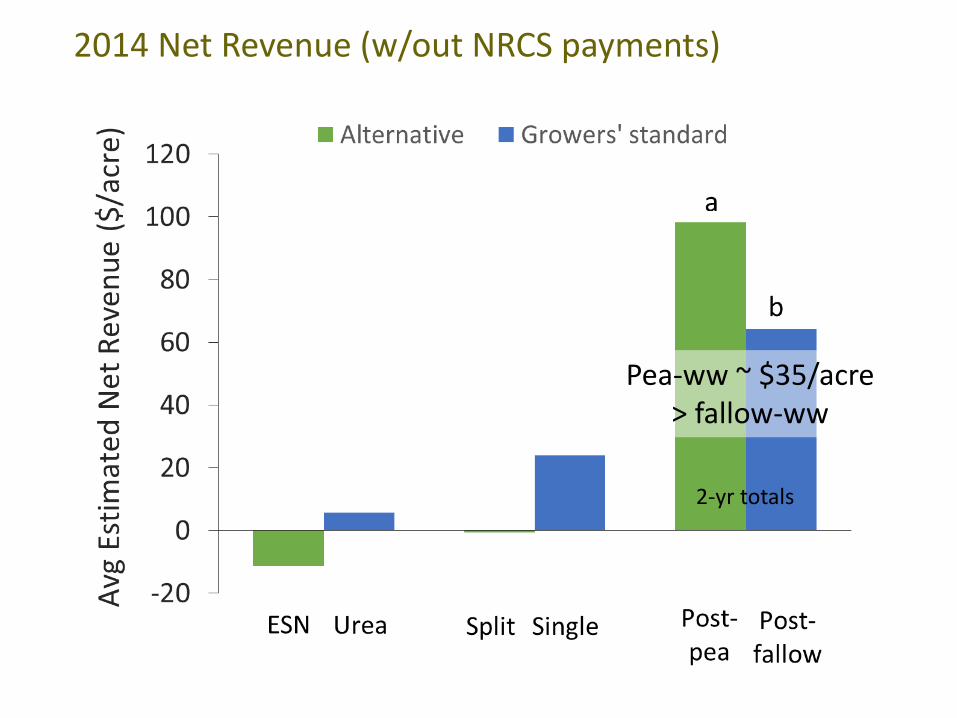
2014 Net Revenue (w/out NRCS payments)
Pea-ww ~ $35/acre > fallow-ww
2-yr totals
Summary
• Nutrients need to be in the right form to be plant available
• Soil characteristics influence nutrient availability and most cannot readily be changed by management
• Soil organic matter is one that can be changed and has large impact on soil nutrient availability
• Crop rotation and fertilizer source and timing can help reduce leaching loss

Questions?For more information see MSU Extension’s
Nutrient Management Modules: http://landresources.montana.edu/nm/
Soil & Water Management Modules:http://landresources.montana.edu/SWM
Crop & Fertilizer Management Practices to Minimize Nitrate Leaching
http://landresources.montana.edu/soilfertility/publications.html
Cover Crop Researchhttp://landresources.montana.edu/soilfertility/covercrops.html
Judith River Watershed Project http://waterquality.montana.edu/judith/index.html