nutrient recommendations for field crops in …...4 nutrient recommendations for field crops in...
TRANSCRIPT
Nutrient Recommendations for Field Crops in Michigan
Extension Bulletin E2904 • Revised August 2009
Darryl Warncke, Jon Dahl and Lee JacobsDepartment of Crop and Soil Sciences
Michigan State University
Extension Bulletin E2904, Revised, August 2009
Nutrient Recommendationsfor Field Crops in Michigan
Basis for Recommendations . . . . . . . . . . . . . . 3
Development of Nutrient Management Programs . . . . . . . . . . . . . . . . . . 4
Soil Sampling . . . . . . . . . . . . . . . . . . . . . . . 4 Soil Test Procedures . . . . . . . . . . . . . . . . . . 5 Soil pH Management . . . . . . . . . . . . . . . . . . 6 Liming Soils . . . . . . . . . . . . . . . . . . . . . . . . 6
Nitrogen Recommendations . . . . . . . . . . . . . . 7
Nutrient Recommendation for Corn . . . . . 10
Phosphorus and Potassium Recommendations . . . . . . . . . . . . . . . . . . . . 12
Nutrient Use Options . . . . . . . . . . . . . . . . 13
Calcium . . . . . . . . . . . . . . . . . . . . . . . . . . . . . 16
Magnesium . . . . . . . . . . . . . . . . . . . . . . . . . . 18
Sulfur . . . . . . . . . . . . . . . . . . . . . . . . . . . . . . 18
Micronutrient Recommendations . . . . . . . . 19
Boron . . . . . . . . . . . . . . . . . . . . . . . . . . . . 19 Manganese . . . . . . . . . . . . . . . . . . . . . . . . 19 Zinc . . . . . . . . . . . . . . . . . . . . . . . . . . . . . 21 Copper . . . . . . . . . . . . . . . . . . . . . . . . . . . 21
Managing Nutrient Inputs . . . . . . . . . . . . . . 21
Environmental Considerations . . . . . . . . . . 22
Phosphorus Management . . . . . . . . . . . . . 22 Nitrogen Management . . . . . . . . . . . . . . . . 22
Suggested Nutrient ManagementPractices for Individual Crops . . . . . . . . . . . 26
Corn Grain and Corn Silage . . . . . . . . . . . 26 Soybeans . . . . . . . . . . . . . . . . . . . . . . . . . . 26 Dry Edible Beans . . . . . . . . . . . . . . . . . . . 27 Small Grains . . . . . . . . . . . . . . . . . . . . . . . 29 Sugar Beets . . . . . . . . . . . . . . . . . . . . . . . . 30 Forage Crops . . . . . . . . . . . . . . . . . . . . . . 31 Grass Waterways and Critical Areas . . . . . 34 Conservation Reserve . . . . . . . . . . . . . . . . 34 Potato . . . . . . . . . . . . . . . . . . . . . . . . . . . . 34
Table of ContentsPage
3
Nutrient Recommendations for Field Crops in Michigan
Nutrient recommendations for field crops grown in Michigan have evolved over the years on the basis of observations and controlled field stud-
ies (circular bulletin No . 53, Extension bulletin 159 and Extension bulletin E-550) . During the 1920s and 1930s, recommendations given for various amounts of various fertilizer grades were based on the crop grown and the management practices being used . The three manage-ment practice categories were: no manure or leguminous green manure in the past two years, clover or alfalfa grown within the past two years and manured within the past two years . In the 1940s, recommendations for the grade of fertilizer to use considered soil texture (sandy or loamy or clayey soil) and whether manure had been applied within the previous two years .
Soil test results began to be considered in making fertil-izer recommendations in the early 1950s . Phosphorus (P) and potassium (K) test values were classified as low or high on the basis of the Spurway “reserve” soil test (0 .13 N HCl) . For phosphorus, a soil test value below 50 lb P/a (per acre) was considered low and above 50 lb P/a was considered high . For soils with a pH above 7 .5, the separating value was 100 lb P/a . For potassium, the separating soil test value was 150 lb K/a . When rock phosphate had been applied to the soil, the “active” test (0 .018 N acetic acid) was used . The separating soil test values for the “active” test were 25 lb P/a on acid soils, 50 lb P/a on soils with pH above 7 .5, and 80 lb K/a . Even when the soil test was high, some fertilizer was recommended because even in the high-testing soils, an economical response usually would occur when a bal-anced fertilizer was applied .
In the early 1960s, the Bray P1 test for phosphorus and the ammonium acetate test for potassium began to be used . Soil test values were divided into very low, low, medium, high and very high categories . In 1963, recommendations for crops grown on mineral soils were given in pounds of P2O5 and K2O/a in relation to these soil test categories . For crops grown on organic soils, recommendations were given in pounds of P2O5 and K2O/a on a graded scale, according to the actual soil test value . Soon thereafter, all nutrient recommendations for all crops grown on mineral and organic soils followed the same format based on soil test values . These tabular
recommendations were converted into recommendation equations in 1981 .
During the mid-1990s, soil fertility specialists from Michigan, Ohio and Indiana developed a set of common nutrient recommendations for corn, soybeans, wheat and alfalfa (Extension bulletin E-2567) . The conceptual model used for those recommendations is now followed for the phosphorus and potassium recommendations given in this bulletin for all field crops .
Basis for RecommendationsLevels of essential elements (nutrients) available in the soil can influence the growth and development of field crops . Field studies at various locations in Michigan have provided the data for describing growth and yield responses of crops to nutrient additions when available soil levels are less than adequate . Soil testing procedures have been developed to relate extractable nutrient levels to crop growth and yield .
Nitrogen, phosphorus and potassium are the nutrients most likely to be limiting crop growth . The nitrogen status in the soil is quite dynamic, and predicting its availability over time is difficult . The availability of phos-phorus and potassium in the soil is fairly stable over time unless major additions are made . Soils in Michigan are naturally quite low in available levels of phosphorus and potassium . Additions of these two elements over time in manures and commercial fertilizers have caused significant increases in the available levels in the soil . In 1962, the median soil test value (Bray-Kurtz P1) for phosphorus in Michigan soils was 12 ppm . This gradu-ally increased over time . Since the early 1980s, the median value has fluctuated around 53 ppm . Similar values for potassium soil test values (1 N neutral ammo-nium acetate) are 56 ppm in 1962 and around 91 ppm since the 1980s . Buildup occurs when the amount of P or K applied exceeds the amount removed by the crop (crop removal) . The phosphorus soil test increases on average 1 ppm for each 20 lb P2O5/a added above crop removal, although the range is from 10 to 36 lb/a . Avail-able P levels increase more quickly in sandy soils than in clay soils . Similarly, the potassium soil test will increase about 1 ppm for each 8 to 20 lb K2O/a added beyond crop removal .
4
Nutrient Recommendations for Field Crops in Michigan
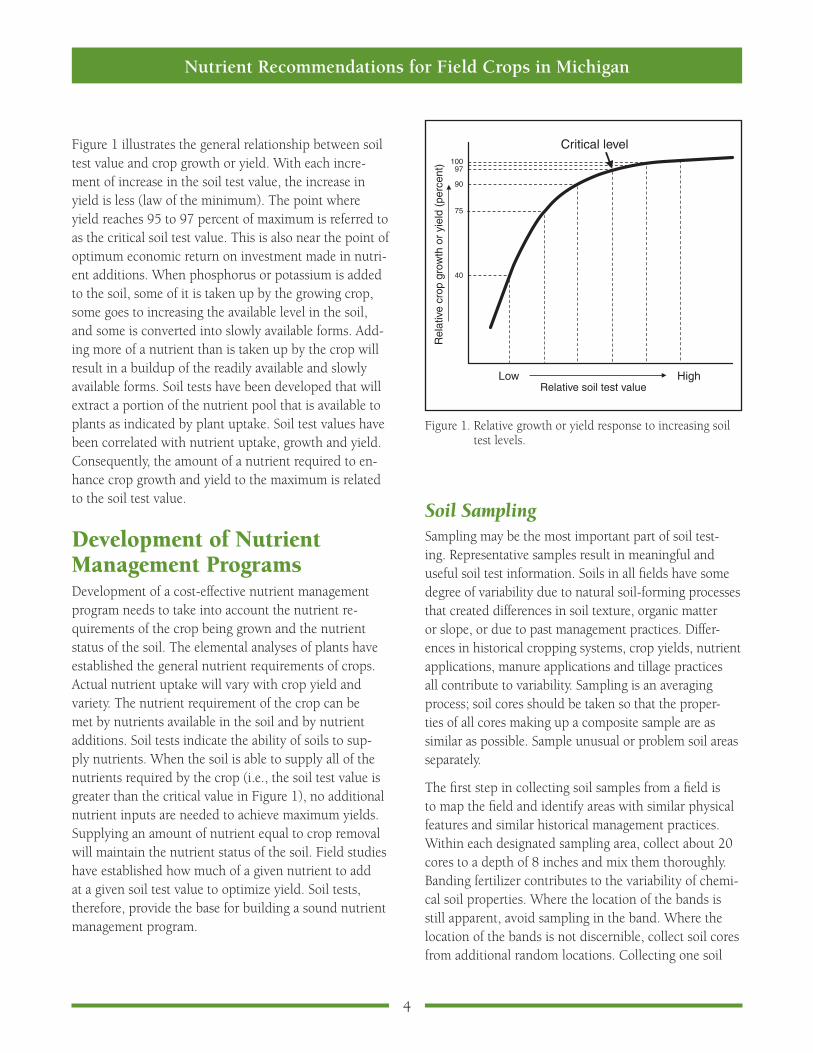
Figure 1 illustrates the general relationship between soil test value and crop growth or yield . With each incre-ment of increase in the soil test value, the increase in yield is less (law of the minimum) . The point where yield reaches 95 to 97 percent of maximum is referred to as the critical soil test value . This is also near the point of optimum economic return on investment made in nutri-ent additions . When phosphorus or potassium is added to the soil, some of it is taken up by the growing crop, some goes to increasing the available level in the soil, and some is converted into slowly available forms . Add-ing more of a nutrient than is taken up by the crop will result in a buildup of the readily available and slowly available forms . Soil tests have been developed that will extract a portion of the nutrient pool that is available to plants as indicated by plant uptake . Soil test values have been correlated with nutrient uptake, growth and yield . Consequently, the amount of a nutrient required to en-hance crop growth and yield to the maximum is related to the soil test value .
Development of Nutrient Management ProgramsDevelopment of a cost-effective nutrient management program needs to take into account the nutrient re-quirements of the crop being grown and the nutrient status of the soil . The elemental analyses of plants have established the general nutrient requirements of crops . Actual nutrient uptake will vary with crop yield and variety . The nutrient requirement of the crop can be met by nutrients available in the soil and by nutrient additions . Soil tests indicate the ability of soils to sup-ply nutrients . When the soil is able to supply all of the nutrients required by the crop (i .e ., the soil test value is greater than the critical value in Figure 1), no additional nutrient inputs are needed to achieve maximum yields . Supplying an amount of nutrient equal to crop removal will maintain the nutrient status of the soil . Field studies have established how much of a given nutrient to add at a given soil test value to optimize yield . Soil tests, therefore, provide the base for building a sound nutrient management program .
Soil Sampling Sampling may be the most important part of soil test-ing . Representative samples result in meaningful and useful soil test information . Soils in all fields have some degree of variability due to natural soil-forming processes that created differences in soil texture, organic matter or slope, or due to past management practices . Differ-ences in historical cropping systems, crop yields, nutrient applications, manure applications and tillage practices all contribute to variability . Sampling is an averaging process; soil cores should be taken so that the proper-ties of all cores making up a composite sample are as similar as possible . Sample unusual or problem soil areas separately .
The first step in collecting soil samples from a field is to map the field and identify areas with similar physical features and similar historical management practices . Within each designated sampling area, collect about 20 cores to a depth of 8 inches and mix them thoroughly . Banding fertilizer contributes to the variability of chemi-cal soil properties . Where the location of the bands is still apparent, avoid sampling in the band . Where the location of the bands is not discernible, collect soil cores from additional random locations . Collecting one soil
Figure 1 . Relative growth or yield response to increasing soil test levels .
Critical level100
97
40
90
75
Low HighRelative soil test value
Rel
ativ
e cr
op g
row
th o
r yi
eld
(per
cent
)
5
Nutrient Recommendations for Field Crops in Michigan
sample for at least every 15 to 20 acres will provide good information about the nutrient status of fields . More in-tense sampling will provide more information about the variability in a field . As the number of acres represented by one composite sample increases, the probability that the sample is truly representative of the sampled area de-creases . Therefore, limiting the area represented by one sample to no more than 20 acres will result in samples and test results representative of the designated field areas . When only shallow tillage (less than 4 inches) or no tillage is used, collect an additional sample from the 0 to 3-inch depth to assess the acidity of the surface soil . Surface soil pH is critical to the efficacy of some herbi-cides . (More information on soil sampling is available in MSU bulletins E-498, E-498S and E-1616, and North Central Multistate Report 348 .) Send 1½ to 2 cups of soil to a reliable soil test lab for analysis .
Fall and spring tend to be the best and most practical times to collect soil samples . Available nutrient levels are usually increased before or at planting by nutrient ad-ditions and then gradually decrease during the growing period because of plant uptake and conversion to slowly available forms . By fall, the nutrient status is more stable . For long-term nutrient management planning, it is best to take soil samples at the same time of year each time a field is sampled . Sampling while the crop is grow-ing is most appropriate for checking available nitrogen levels; one such test is the presidedress soil nitrate test (PSNT) . For most field crop production systems, sam-pling and testing the soil every three years is adequate . In more intense cropping systems or where the whole aboveground portion of a crop is removed, such as with forages and silage corn, available nutrient levels will change more rapidly . For these situations, sample and test at least every two years . On organic soils, consider-able amounts of potassium may leach from the soil over winter, especially when the spring thaw occurs, so soil test potassium levels for organic soils will usually be lower for samples taken in the spring than in the fall .
Soil Test Procedures The Michigan State University Soil and Plant Nutri-ent Lab uses soil testing procedures recommended by the North Central Region Committee on Soil Test-ing and Plant Analyses (see NCR Pub . 221) . Soil pH
is determined on a 1:1 soil:water slurry, and the lime requirement is determined by adding SMP (Shoemaker, McLean, Pratt) buffer solution to this slurry and mea-suring the resulting pH . The SMP buffer solution pH is reported as the lime index . An index of available phosphorus (P) is determined according to the Bray-Kurtz P1 (weak acid) test . On soils with free calcium carbonates, the Bray-Kurtz P1 extraction is less effective . The Olsen test (0 .5 N sodium bicarbonate) provides a better indication of P availability on calcareous soils with pH above 7 .2 and a Bray-Kurtz P1 test of less than 10 ppm . An index of available potassium (K), calcium (Ca) and magnesium (Mg) is determined by extraction with 1 N neutral ammonium acetate . Recommendations for phosphorus, potassium and magnesium are based on these soil test values .
An index of iron (Fe), manganese (Mn) and zinc (Zn) availability is determined by extraction with 0 .1 N hydrochloric acid; 1 .0 N HCl is used for copper (Cu) . DTPA is used as an alternative extracting solution for Cu, Fe, Mn and Zn, especially for calcareous soils . The hot water extraction procedure is used for boron (B) . Sulfur (S) is determined by extraction with a calcium phosphate solution .
Laboratories with inductively coupled plasma (ICP) spectrophotometers are using the Mehlich III “universal” extracting solution for determining the availability indi-ces of P, K, Ca, Mg and other plant-essential elements .
Soil test results are expressed as parts per million (ppm) of P, K, Ca, Mg, Mn and Zn . For mineral soils, 1 ppm is equal to approximately 2 pounds per acre of soil to a depth of 6 2/3 inches . For organic soils with a bulk density of 0 .66, 1 ppm equals 1 lb/a .
Conversion Factors
Most soil testing labs report soil test values in terms of ppm P and K . Recommendations are usually given as lb/a of P2O5 and K2O because fertilizer grades are expressed as percent N - P2O5 - K2O . Following are the factors for converting from one to the other:
ppm x 2 .0 = lb/a at a depth of 6 2/3 inchesppm x 3 .6 = lb/a at a depth of 1 footP x 2 .3 = P2O5 or P2O5 x 0 .43 = PK x 1 .2 = K2O or K2O x 0 .83 = K

6
Nutrient Recommendations for Field Crops in Michigan
Soil pH ManagementSoil pH provides an indication of the acidity or alkalin-ity of a soil . A pH of 7 .0 is neutral, neither acid nor alkaline . Values below 7 .0 indicate acid soils, and values above 7 .0 indicate alkaline soils . Soil with a pH of 6 .0 is mildly acidic, a pH of 5 .0 is strongly acidic, and a pH of 8 .0 is mildly alkaline .
Nitrogen, phosphorus, potassium, calcium, magnesium, boron and molybdenum are most available in mineral soils when the pH is between 6 .0 and 7 .0 . Zinc, man-ganese, iron and copper tend to be most available when the soil pH is below 6 .5 . Therefore, it is desirable to maintain the pH of mineral soils between 6 .0 and 6 .5 . As mineral soils become more acid, especially below 5 .5, available aluminum levels increase . Increasing the soluble aluminum concentration contributes to further acidification of the soil and aluminum toxicity, which inhibits root growth . The optimum pH varies by crop . Table 1 lists the target pH values for most field crops grown in Michigan . For organic soils, the target pH ranges from 5 .3 to 5 .8, depending on the crop . Lower pHs are acceptable in organic soils because aluminum levels are very low . A lime recommendation is given to raise the soil pH to the target pH for the crop being grown . If the subsoil of a mineral soil has a pH below 6 .0, increase the target pH by 0 .2 pH unit . In organic soils, increase the target pH by 0 .2 pH unit when the subsoil pH is less than 4 .8 . When crops with different target pH’s are being grown in rotation, lime the soil for the crop with the highest target pH.
Liming SoilsSoils contain soluble and insoluble sources of acidity . The soil pH indicates the soluble or active hydrogen ion concentration in the soil . Changing the pH of acid soils requires neutralizing the insoluble or bound sources of acidity, usually aluminum and iron compounds . The amount of this reserve acidity is determined with the SMP buffer and is reported as the lime index . Table 2 shows how much lime is needed to raise the soil pH to 6 .0, 6 .5 or 6 .8 in mineral soils when mixed with the top 9 inches of soil according to the lime index . Clayey soils tend to be more resistant to pH change (i .e ., lower lime
Table 1. Target soil pH values for field crops grown on mineral and organic soils.1, 2
Crop Mineral soils Organic soils
Alfalfa seeding 6 .8 6 .0Alfalfa hay 6 .8 6 .0Barley 6 .5 5 .8Barley/legume seeding 6 .5 5 .8Beans, dry edible 6 .5 5 .8Brassica forage 6 .5 5 .3Bromegrass hay 6 .5 5 .3Buckwheat 6 .5 5 .3Canola 6 .5 5 .3Clover seeding 6 .5 6 .0Clover hay 6 .5 6 .0Clover-grass hay 6 .5 6 .0Corn grain 6 .5 5 .3Corn silage 6 .5 5 .3Corn, seed3 6 .5 5 .33
Grass, warm-season (CRP) 6 .0 5 .3Grass, cool-season (CRP) 6 .0 5 .3Millet 6 .5 5 .3Oats 6 .5 5 .3Oats/legume seeding 6 .5 5 .3Oats for cover 6 .5 5 .3Orchardgrass hay 6 .5 5 .3Pasture, intensive grazing 6 .5 5 .3Pasture, extensive grazing 6 .5 5 .3Peppermint 6 .5 5 .5Potato 6 .0 5 .3Rye grain 6 .5 5 .3Rye for cover 6 .5 5 .3Sorghum grain 6 .5 5 .3Sorghum-Sudangrass hay 6 .5 5 .3Sorghum-Sudangrass haylage 6 .5 5 .3Soybean 6 .5 5 .8Spearmint 6 .5 5 .5Spelt 6 .5 5 .3Sugar beet3 6 .5 5 .53
Sunflower 6 .5 5 .3Timothy hay 6 .5 5 .3Trefoil hay 6 .0 5 .8Trefoil seed production1 6 .0 5 .81
Wheat grain 6 .5 5 .8Wheat/legume seeding 6 .5 5 .8
1 Liming the soil above the target pH would not be expected to improve crop yield unless the subsoil pH is less than 6 .0 for mineral soils and less than 4 .8 for organic soils .
2 When crops with different target pHs are being grown in ro-tation, lime the soil for the crop with the highest target pH .
3 Though a target pH is provided for organic soils, this crop is not recommended to be grown on organic soils .

7
Nutrient Recommendations for Field Crops in Michigan
index) than sandy soils and require more lime to bring about a given change in soil pH . Recommended lime rates are based on agricultural lime with a neutralizing value (NV) of 90 percent . Adjust lime rate on the basis of the NV of the liming material . Do this by multiplying the recommended amount of lime by 90 and dividing by the NV of the liming material being used — i .e ., (lime rate x 90) ÷ NV of liming material .
The lime rate must also be adjusted if the depth of incor-poration is different from 9 inches . For fields being farmed with minimal tillage, apply lime at a rate
to neutralize the acidity in the top 3 or 4 inches of soil. For example, if the lime recommendation is 3 tons per acre-9 inches, then the lime recommendation for 3 inches equals [3 x (3/9)] or 1 ton . The reactivity of lim-ing materials also varies with the particle size and may influence the rate of material to apply . (MSU Extension bulletin E-471 provides more details about liming mate-rials and liming soils .)
On weakly buffered soils, usually sandy soils, the SMP buffer may underestimate the lime need . The soil pH may be sufficiently low to warrant a lime application, but the lime index indicates little or no lime is needed . If the soil pH is 0.3 to 0.5 pH unit below the target pH and the lime index indicates that the lime need is less than 1 ton per acre, then apply 1 ton lime per acre. Similarly, if the soil pH is 0.6 unit or more below the target pH and the lime recommendation is less than 2 tons per acre, apply 2 tons lime per acre.
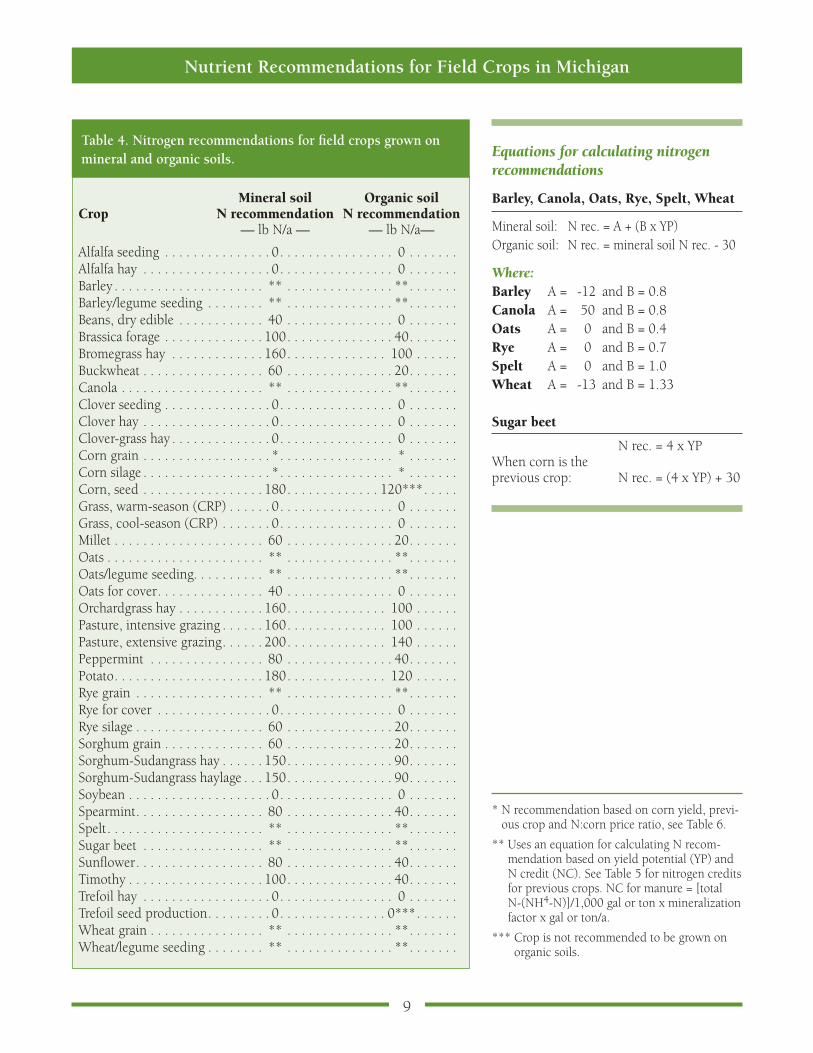
Nitrogen RecommendationsApplying the correct amount of nitrogen (N) is impor-tant for profitable crop production, water quality and energy conservation . Nitrogen recommendations are based on crop N utilization and response to applied N rates . Table 3 indicates an average amount of N removed in the harvested portion of various field crops . Nitrogen recommendations for field crops, except corn, grown on mineral and organic soils are listed in Table 4 . Because of additional mineralization of N in organic soils, the N recommendations for most crops grown on organic soils are 40 to 60 lb/a less than those for mineral soils . For the more responsive crops, such as the cereal grains, canola and sugar beets, the amount of N recommended varies according to the yield expected . It is very impor-tant that the expected yield used in this calculation be realistic, based on past yields under favorable growing conditions . Use a five- year running average, omitting unusually low and high yields . Unrealistically high yield goals will result in excess N being applied that might increase the risk to groundwater quality, increase lodging of cereal grains, delay maturity or adversely affect crop quality . Other crops showing less response to applied N receive a static N recommendation .
Table 2. Tons of limestone needed to raise the pH of mineral soils to 6.0, 6.5 or 6.8 on the basis of the lime index, and to raise the pH of organic soils to 5.3 on the basis of the initial soil pH.
Mineral soils Organic soils
Lime Raise soil pH to: Initial Raise pH to:index 6.0 6.5 6.8 soil pH 5.3 — tons/a — — tons/a —
70 0 .0 0 .0 0 .0 5 .3 0 .0
69 0 .0 0 .6 0 .8 5 .2 0 .7
68 1 .2 1 .6 1 .8 5 .1 1 .4
67 1 .9 2 .5 2 .9 5 .0 2 .1
66 2 .7 3 .5 3 .9 4 .9 2 .8
65 3 .5 4 .4 4 .9 4 .8 3 .5
64 4 .3 5 .3 5 .9 4 .7 4 .2
63 5 .1 6 .3 6 .9 4 .6 5 .0
62 5 .8 7 .2 8 .0 4 .5 5 .6
61 6 .6 8 .2 9 .0 4 .4 6 .3
60 7 .4 9 .1 10 .0 4 .3 7 .1
Recommendations are based on the following equations:
Mineral soils: Liming to pH 6 .0: XL = 54 .2 – (0 .78 x LI) Liming to pH 6 .5: XL = 65 .5 – (0 .94 x LI) Liming to pH 6 .8: XL = 71 .2 – (1 .02 x LI)
Organic soils: Liming to pH 5 .3: XL = 37 .6 – (7 .1 x pH) Target pH >5 .3 XL = [37 .6 – (7 .1 x pH)] + [(target pH – 5 .3) x 5 .0] where: XL = lime recommendation in tons/acre LI = lime index pH = soil pH
8
Nutrient Recommendations for Field Crops in Michigan
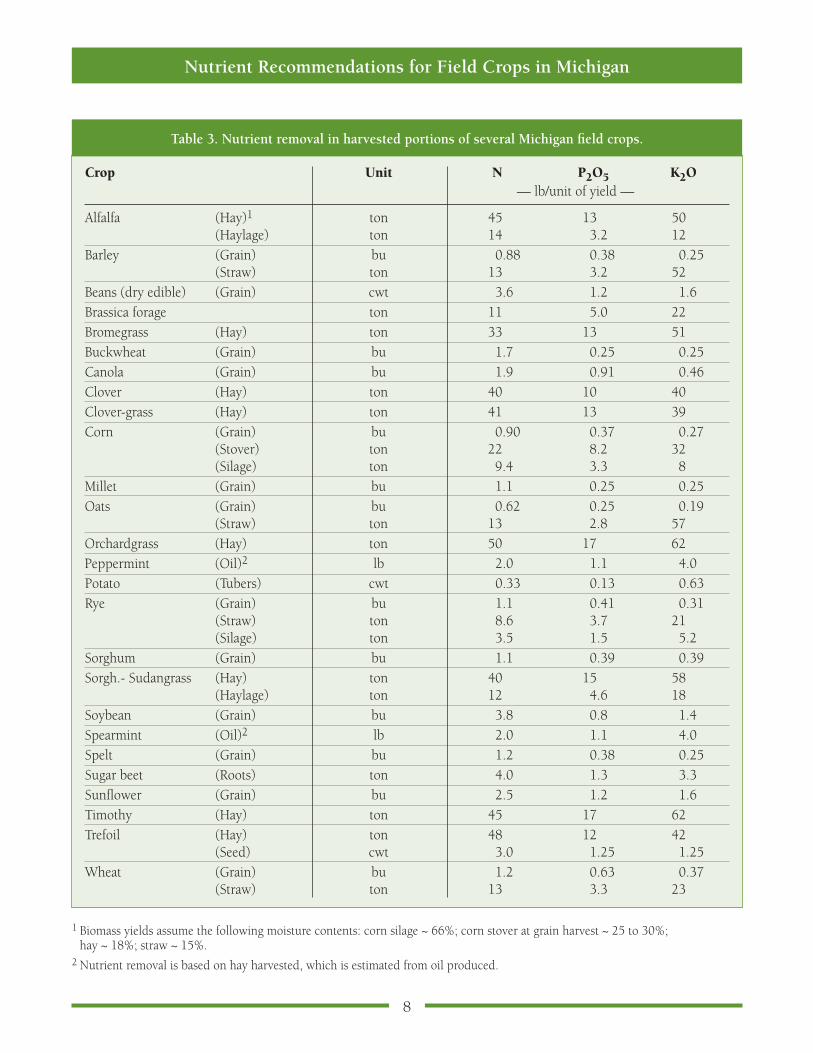
Table 3. Nutrient removal in harvested portions of several Michigan field crops.
Crop Unit N P2O5 K2O — lb/unit of yield —
Alfalfa (Hay)1 ton 45 13 50 (Haylage) ton 14 3 .2 12Barley (Grain) bu 0 .88 0 .38 0 .25 (Straw) ton 13 3 .2 52Beans (dry edible) (Grain) cwt 3 .6 1 .2 1 .6 Brassica forage ton 11 5 .0 22Bromegrass (Hay) ton 33 13 51Buckwheat (Grain) bu 1 .7 0 .25 0 .25Canola (Grain) bu 1 .9 0 .91 0 .46Clover (Hay) ton 40 10 40Clover-grass (Hay) ton 41 13 39Corn (Grain) bu 0 .90 0 .37 0 .27 (Stover) ton 22 8 .2 32 (Silage) ton 9 .4 3 .3 8Millet (Grain) bu 1 .1 0 .25 0 .25Oats (Grain) bu 0 .62 0 .25 0 .19 (Straw) ton 13 2 .8 57 Orchardgrass (Hay) ton 50 17 62Peppermint (Oil)2 lb 2 .0 1 .1 4 .0Potato (Tubers) cwt 0 .33 0 .13 0 .63Rye (Grain) bu 1 .1 0 .41 0 .31 (Straw) ton 8 .6 3 .7 21 (Silage) ton 3 .5 1 .5 5 .2Sorghum (Grain) bu 1 .1 0 .39 0 .39Sorgh .- Sudangrass (Hay) ton 40 15 58 (Haylage) ton 12 4 .6 18Soybean (Grain) bu 3 .8 0 .8 1 .4Spearmint (Oil)2 lb 2 .0 1 .1 4 .0Spelt (Grain) bu 1 .2 0 .38 0 .25Sugar beet (Roots) ton 4 .0 1 .3 3 .3Sunflower (Grain) bu 2 .5 1 .2 1 .6Timothy (Hay) ton 45 17 62Trefoil (Hay) ton 48 12 42 (Seed) cwt 3 .0 1 .25 1 .25Wheat (Grain) bu 1 .2 0 .63 0 .37 (Straw) ton 13 3 .3 23
1 Biomass yields assume the following moisture contents: corn silage ~ 66%; corn stover at grain harvest ~ 25 to 30%; hay ~ 18%; straw ~ 15% .
2 Nutrient removal is based on hay harvested, which is estimated from oil produced .
9
Nutrient Recommendations for Field Crops in Michigan
Mineral soil Organic soilCrop N recommendation N recommendation — lb N/a — — lb N/a—
Alfalfa seeding . . . . . . . . . . . . . . . 0 . . . . . . . . . . . . . . . . 0 . . . . . . .Alfalfa hay . . . . . . . . . . . . . . . . . . 0 . . . . . . . . . . . . . . . . 0 . . . . . . .Barley . . . . . . . . . . . . . . . . . . . . . ** . . . . . . . . . . . . . . . ** . . . . . . .Barley/legume seeding . . . . . . . . ** . . . . . . . . . . . . . . . ** . . . . . . .Beans, dry edible . . . . . . . . . . . . 40 . . . . . . . . . . . . . . . 0 . . . . . . .Brassica forage . . . . . . . . . . . . . . 100 . . . . . . . . . . . . . . . 40 . . . . . . .Bromegrass hay . . . . . . . . . . . . . 160 . . . . . . . . . . . . . . 100 . . . . . .Buckwheat . . . . . . . . . . . . . . . . . 60 . . . . . . . . . . . . . . . 20 . . . . . . .Canola . . . . . . . . . . . . . . . . . . . . ** . . . . . . . . . . . . . . . ** . . . . . . .Clover seeding . . . . . . . . . . . . . . . 0 . . . . . . . . . . . . . . . . 0 . . . . . . .Clover hay . . . . . . . . . . . . . . . . . . 0 . . . . . . . . . . . . . . . . 0 . . . . . . .Clover-grass hay . . . . . . . . . . . . . . 0 . . . . . . . . . . . . . . . . 0 . . . . . . .Corn grain . . . . . . . . . . . . . . . . . . * . . . . . . . . . . . . . . . . * . . . . . . .Corn silage . . . . . . . . . . . . . . . . . . * . . . . . . . . . . . . . . . . * . . . . . . .Corn, seed . . . . . . . . . . . . . . . . . 180 . . . . . . . . . . . . . 120*** . . . . .Grass, warm-season (CRP) . . . . . . 0 . . . . . . . . . . . . . . . . 0 . . . . . . .Grass, cool-season (CRP) . . . . . . . 0 . . . . . . . . . . . . . . . . 0 . . . . . . .Millet . . . . . . . . . . . . . . . . . . . . . 60 . . . . . . . . . . . . . . . 20 . . . . . . .Oats . . . . . . . . . . . . . . . . . . . . . . ** . . . . . . . . . . . . . . . ** . . . . . . .Oats/legume seeding . . . . . . . . . . ** . . . . . . . . . . . . . . . ** . . . . . . .Oats for cover . . . . . . . . . . . . . . . 40 . . . . . . . . . . . . . . . 0 . . . . . . .Orchardgrass hay . . . . . . . . . . . . 160 . . . . . . . . . . . . . . 100 . . . . . .Pasture, intensive grazing . . . . . . 160 . . . . . . . . . . . . . . 100 . . . . . .Pasture, extensive grazing . . . . . . 200 . . . . . . . . . . . . . . 140 . . . . . .Peppermint . . . . . . . . . . . . . . . . 80 . . . . . . . . . . . . . . . 40 . . . . . . .Potato . . . . . . . . . . . . . . . . . . . . . 180 . . . . . . . . . . . . . . 120 . . . . . .Rye grain . . . . . . . . . . . . . . . . . . ** . . . . . . . . . . . . . . . ** . . . . . . .Rye for cover . . . . . . . . . . . . . . . . 0 . . . . . . . . . . . . . . . . 0 . . . . . . .Rye silage . . . . . . . . . . . . . . . . . . 60 . . . . . . . . . . . . . . . 20 . . . . . . .Sorghum grain . . . . . . . . . . . . . . 60 . . . . . . . . . . . . . . . 20 . . . . . . .Sorghum-Sudangrass hay . . . . . . 150 . . . . . . . . . . . . . . . 90 . . . . . . .Sorghum-Sudangrass haylage . . . 150 . . . . . . . . . . . . . . . 90 . . . . . . .Soybean . . . . . . . . . . . . . . . . . . . . 0 . . . . . . . . . . . . . . . . 0 . . . . . . .Spearmint . . . . . . . . . . . . . . . . . . 80 . . . . . . . . . . . . . . . 40 . . . . . . .Spelt . . . . . . . . . . . . . . . . . . . . . . ** . . . . . . . . . . . . . . . ** . . . . . . .Sugar beet . . . . . . . . . . . . . . . . . ** . . . . . . . . . . . . . . . ** . . . . . . .Sunflower . . . . . . . . . . . . . . . . . . 80 . . . . . . . . . . . . . . . 40 . . . . . . .Timothy . . . . . . . . . . . . . . . . . . . 100 . . . . . . . . . . . . . . . 40 . . . . . . .Trefoil hay . . . . . . . . . . . . . . . . . . 0 . . . . . . . . . . . . . . . . 0 . . . . . . .Trefoil seed production . . . . . . . . . 0 . . . . . . . . . . . . . . . 0*** . . . . . .Wheat grain . . . . . . . . . . . . . . . . ** . . . . . . . . . . . . . . . ** . . . . . . .Wheat/legume seeding . . . . . . . . ** . . . . . . . . . . . . . . . ** . . . . . . .
Table 4. Nitrogen recommendations for field crops grown on mineral and organic soils.
* N recommendation based on corn yield, previ-ous crop and N:corn price ratio, see Table 6 .
** Uses an equation for calculating N recom-mendation based on yield potential (YP) and N credit (NC) . See Table 5 for nitrogen credits for previous crops . NC for manure = [total N-(NH4-N)]/1,000 gal or ton x mineralization factor x gal or ton/a .
*** Crop is not recommended to be grown on organic soils .
Equations for calculating nitrogen recommendations
Barley, Canola, Oats, Rye, Spelt, Wheat
Mineral soil: N rec . = A + (B x YP) Organic soil: N rec . = mineral soil N rec . - 30
Where:Barley A = -12 and B = 0 .8Canola A = 50 and B = 0 .8Oats A = 0 and B = 0 .4Rye A = 0 and B = 0 .7Spelt A = 0 and B = 1 .0Wheat A = -13 and B = 1 .33
Sugar beet
N rec . = 4 x YPWhen corn is the previous crop: N rec . = (4 x YP) + 30
10
Nutrient Recommendations for Field Crops in Michigan
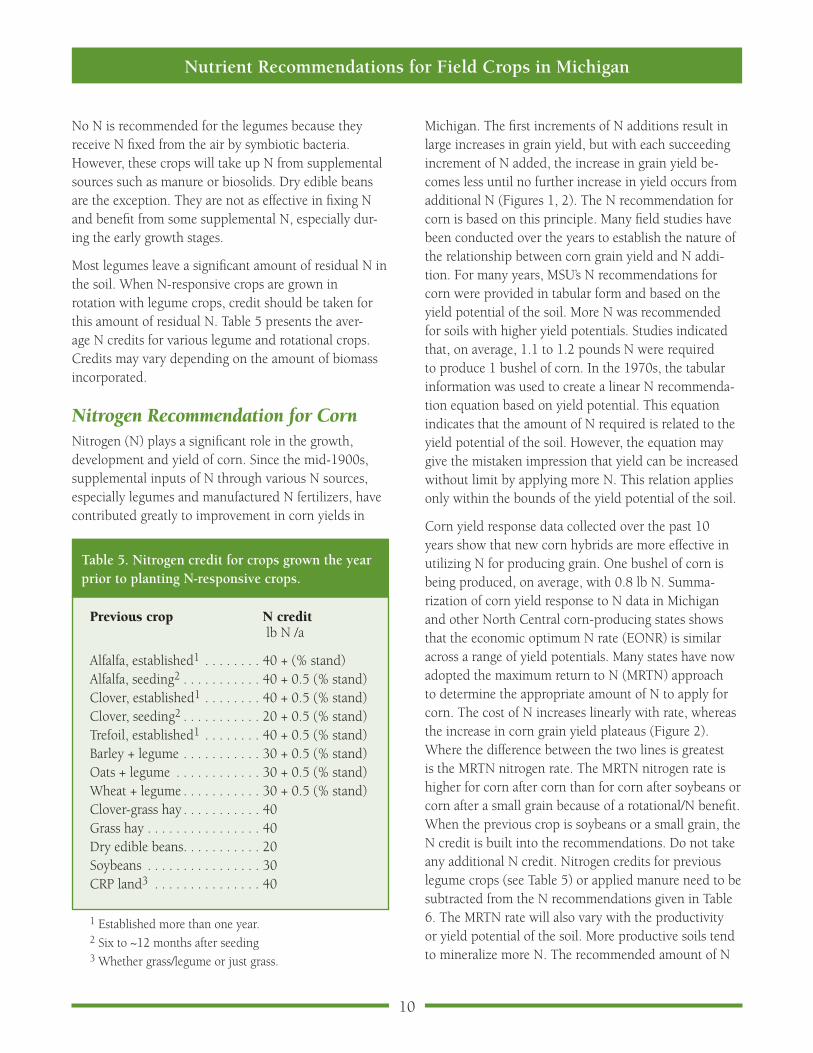
No N is recommended for the legumes because they receive N fixed from the air by symbiotic bacteria . However, these crops will take up N from supplemental sources such as manure or biosolids . Dry edible beans are the exception . They are not as effective in fixing N and benefit from some supplemental N, especially dur-ing the early growth stages .
Most legumes leave a significant amount of residual N in the soil . When N-responsive crops are grown in rotation with legume crops, credit should be taken for this amount of residual N . Table 5 presents the aver-age N credits for various legume and rotational crops . Credits may vary depending on the amount of biomass incorporated .
Nitrogen Recommendation for CornNitrogen (N) plays a significant role in the growth, development and yield of corn . Since the mid-1900s, supplemental inputs of N through various N sources, especially legumes and manufactured N fertilizers, have contributed greatly to improvement in corn yields in
Table 5. Nitrogen credit for crops grown the year prior to planting N-responsive crops.
Previous crop N credit lb N /a
Alfalfa, established1 . . . . . . . . 40 + (% stand)Alfalfa, seeding2 . . . . . . . . . . . 40 + 0 .5 (% stand)Clover, established1 . . . . . . . . 40 + 0 .5 (% stand)Clover, seeding2 . . . . . . . . . . . 20 + 0 .5 (% stand)Trefoil, established1 . . . . . . . . 40 + 0 .5 (% stand)Barley + legume . . . . . . . . . . . 30 + 0 .5 (% stand)Oats + legume . . . . . . . . . . . . 30 + 0 .5 (% stand)Wheat + legume . . . . . . . . . . . 30 + 0 .5 (% stand)Clover-grass hay . . . . . . . . . . . 40Grass hay . . . . . . . . . . . . . . . . 40Dry edible beans . . . . . . . . . . . 20Soybeans . . . . . . . . . . . . . . . . 30CRP land3 . . . . . . . . . . . . . . . 40
1 Established more than one year . 2 Six to ~12 months after seeding3 Whether grass/legume or just grass .
Michigan . The first increments of N additions result in large increases in grain yield, but with each succeeding increment of N added, the increase in grain yield be-comes less until no further increase in yield occurs from additional N (Figures 1, 2) . The N recommendation for corn is based on this principle . Many field studies have been conducted over the years to establish the nature of the relationship between corn grain yield and N addi-tion . For many years, MSU’s N recommendations for corn were provided in tabular form and based on the yield potential of the soil . More N was recommended for soils with higher yield potentials . Studies indicated that, on average, 1 .1 to 1 .2 pounds N were required to produce 1 bushel of corn . In the 1970s, the tabular information was used to create a linear N recommenda-tion equation based on yield potential . This equation indicates that the amount of N required is related to the yield potential of the soil . However, the equation may give the mistaken impression that yield can be increased without limit by applying more N . This relation applies only within the bounds of the yield potential of the soil .
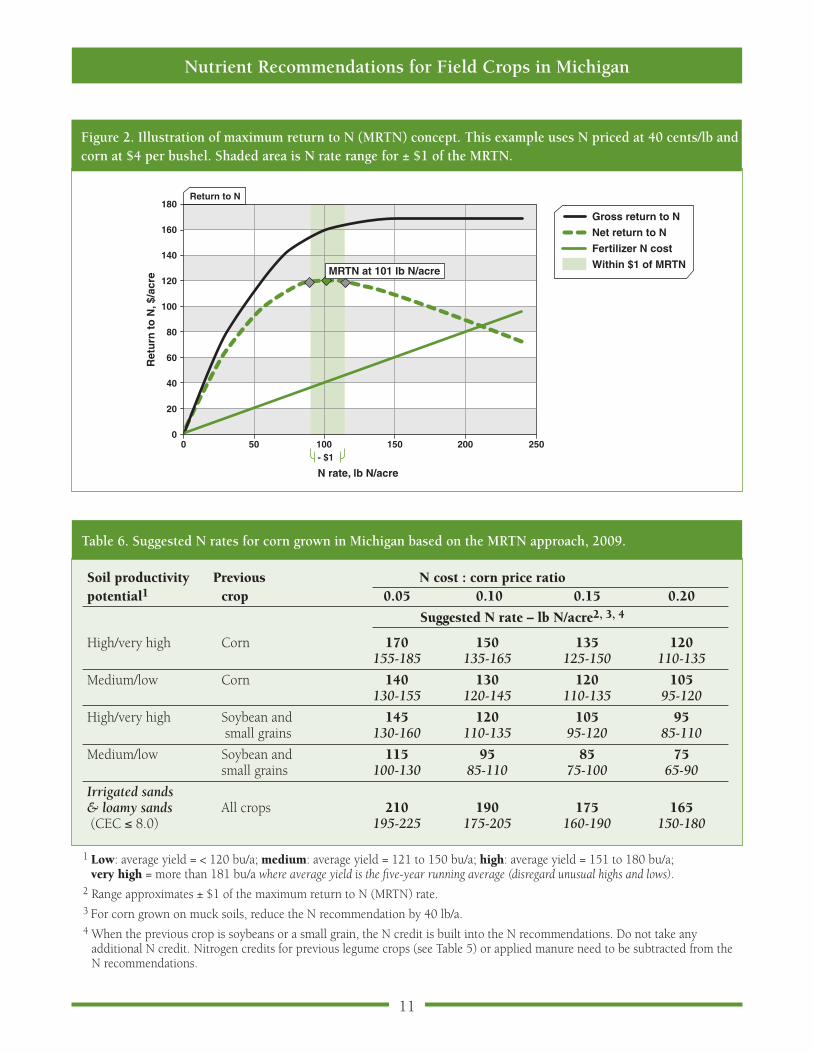
Corn yield response data collected over the past 10 years show that new corn hybrids are more effective in utilizing N for producing grain . One bushel of corn is being produced, on average, with 0 .8 lb N . Summa-rization of corn yield response to N data in Michigan and other North Central corn-producing states shows that the economic optimum N rate (EONR) is similar across a range of yield potentials . Many states have now adopted the maximum return to N (MRTN) approach to determine the appropriate amount of N to apply for corn . The cost of N increases linearly with rate, whereas the increase in corn grain yield plateaus (Figure 2) . Where the difference between the two lines is greatest is the MRTN nitrogen rate . The MRTN nitrogen rate is higher for corn after corn than for corn after soybeans or corn after a small grain because of a rotational/N benefit . When the previous crop is soybeans or a small grain, the N credit is built into the recommendations . Do not take any additional N credit . Nitrogen credits for previous legume crops (see Table 5) or applied manure need to be subtracted from the N recommendations given in Table 6 . The MRTN rate will also vary with the productivity or yield potential of the soil . More productive soils tend to mineralize more N . The recommended amount of N
11
Nutrient Recommendations for Field Crops in Michigan
180
160
140
120
100
80
60
40
20
0
Ret
urn
to
N, $
/acr
e
Return to N
0 50 100 150 200 250- $1
N rate, lb N/acre
Gross return to N
Net return to N
Fertilizer N cost
Within $1 of MRTNMRTN at 101 lb N/acre
Figure 2. Illustration of maximum return to N (MRTN) concept. This example uses N priced at 40 cents/lb and corn at $4 per bushel. Shaded area is N rate range for ± $1 of the MRTN.
Table 6. Suggested N rates for corn grown in Michigan based on the MRTN approach, 2009.
Soil productivity Previous N cost : corn price ratiopotential1 crop 0.05 0.10 0.15 0.20
Suggested N rate – lb N/acre2, 3, 4
High/very high Corn 170 150 135 120 155-185 135-165 125-150 110-135
Medium/low Corn 140 130 120 105 130-155 120-145 110-135 95-120
High/very high Soybean and 145 120 105 95 small grains 130-160 110-135 95-120 85-110
Medium/low Soybean and 115 95 85 75 small grains 100-130 85-110 75-100 65-90
Irrigated sands& loamy sands All crops 210 190 175 165 (CEC ≤ 8 .0) 195-225 175-205 160-190 150-180
1 Low: average yield = < 120 bu/a; medium: average yield = 121 to 150 bu/a; high: average yield = 151 to 180 bu/a; very high = more than 181 bu/a where average yield is the five-year running average (disregard unusual highs and lows) .
2 Range approximates ± $1 of the maximum return to N (MRTN) rate . 3 For corn grown on muck soils, reduce the N recommendation by 40 lb/a .4 When the previous crop is soybeans or a small grain, the N credit is built into the N recommendations . Do not take any
additional N credit . Nitrogen credits for previous legume crops (see Table 5) or applied manure need to be subtracted from the N recommendations .

12
Nutrient Recommendations for Field Crops in Michigan
also varies with the N cost:corn price ratio ($/lb N:$/bu corn) . Suggested N rates for corn grown in Michigan based on recent N response data and using the MRTN approach are given in Table 6 . More productive soils have soil conditions that are more favorable for miner-alization of N, root development and N uptake . There-fore, higher yields can be attained in high productivity soils with only slightly more N fertilizer than in low to medium productivity soils . For corn following corn with an N:corn price ratio of 0 .10, the N recommendations are near 130 and 150 lb N/a for low/medium and high/very high productivity soils, respectively . The range of N recommendation for ± $1 of the MRTN is approximately ± 10 to 15 lb N/a . Hence, the range for recommended N will be 120 to 145 and 135 to 165 lb N/a for the previous listed example . As the N cost: corn price ratio increases (i .e ., N cost increases relative to the price of corn), the MRTN-recommended N rate decreases .
These recommendations are significantly lower than previous N recommendations . Therefore, farmers may be hesitant to make a complete shift to these recommen-dations . To test the MRTN recommendations, farmers should put in strips with the MRTN-recommended rate as a comparison to their standard rate and then compare yields and economic return . Research data indicate that the new recommendations will provide the best econom-ic return on investment in N .
For corn silage, having ade-quate N available to the crop is very important for silage yield and quality . Nitrogen recom-mendations for corn silage are for an equivalent N cost: corn grain price ratio of 0 .10 and vary primarily with yield poten-tial and previous crop . When the previous crop is soybean or a small grain, the N recom-mendation ranges from 85 to 110 lb/a for yields equal to or less than 19 t/a, and from 110 to 135 lb/a for yields of 20 t/a or greater . When the previous
crop is corn, the N recommendations range from 120 to 145 and 135 to 165 lb/a for yields of 19 t/a or less and for 20 tons/a or more, respectively . For irrigated silage corn grown on sandy soils (CEC ≤ 8 .0), the N recom-mendation ranges from 175 to 205 lb/a .
Phosphorus (P) and Potassium (K) Recommendations Response of crops to additions of P and K is a continu-ous function . When inadequate amounts are present in the soil, crops respond to P and K additions with increases in biomass and/or grain production according to the general response curve shown in Figures 1 and 3 . Recommendations given in this bulletin follow the buildup, maintenance and drawdown philosophy presented in “Tri-State Fertilizer Recommendations,” bulletin E-2567 . Figure 3 illustrates this philosophy in combination with a typical response curve . These recommendations provide for buildup of available P and K levels when the soil test level is below the critical soil test level (CL) (Figure 3) . At the critical soil test level (CL), crop yield will be near 95 to 97 percent of maxi-mum . The buildup zone is also the zone of response or zone of deficiency, where the amount of P or K ap-
ResponseZone
AdequateZone
BuildupRange
MaintenanceRange
DrawdownRange
Soil test level
Critical Level Maintenance Limit
95% Yield
% Y
ield
App
lied
Nut
rient
Rat
e
Figure 3 . Nutrient recommendation scheme for phosphorus and potassium .
13
Nutrient Recommendations for Field Crops in Michigan
plied to the soil will greatly affect crop growth and yield . When soil test levels are in this zone, the probability of an economic benefit from applied P or K is very good .
Maintenance recommendations (an amount equal to P and K crop removal) are given to keep the available soil P and K levels in the adequate zone or maintenance range (CL to ML) . Having soil levels in this range provides insurance against variations due to field and soil sampling variability and usually provides long-term economic benefit . Though some current-season econom-ic benefit from applied P or K fertilizer is possible when soil test values are in the lower end of the maintenance range, the probability is low . When soil test values are near the critical level, economic benefit is more likely to occur from band-applied P and/or K than from broad-cast application . Applying amounts of P and K equal to the amounts removed by a crop is expected to maintain the current soil test levels .
Soil test levels in the drawdown range (soil test >ML) are more than adequate for top crop production . No additional P or K is needed, and no response to applied P or K should be expected . However, some is recom-mended to slow the rate of drawdown and allow for field variation . The recommendation goes to zero when the soil test value for P is 10 ppm above the ML and the value for K is 20 ppm above the ML for most field crops .
Crop yield plays an important role in these recom-mendations . In the buildup zone, the amount of P or K recommended is a combination of the amount required to build up the level in the soil toward the optimum range (CL) plus the amount that will be removed in the harvested portion of the crop . Providing realistic yield goals to the MSU Soil and Plant Nutrient Lab is very important so that you receive nutrient recommenda-tions that are economically and environmentally sound . Table 3 provides a guide for average amounts of nitrogen (N), phosphate (P2O5) and potash (K2O) removed in the harvested portion of major agronomic crops grown in Michigan . The exact amounts may vary with stage of maturity, environmental conditions, and crop type or variety .
Nutrient Use Options Having available soil P and K levels in the adequate zone (Figure 3) provides the opportunity for excellent yields when growing conditions are favorable . As described previously, applying sufficient P or K to build toward and/or maintain a soil nutrient level in the adequate zone is a preferred management option . Other nutrient management options, however, can result in top yields and better short-term economics of crop production .
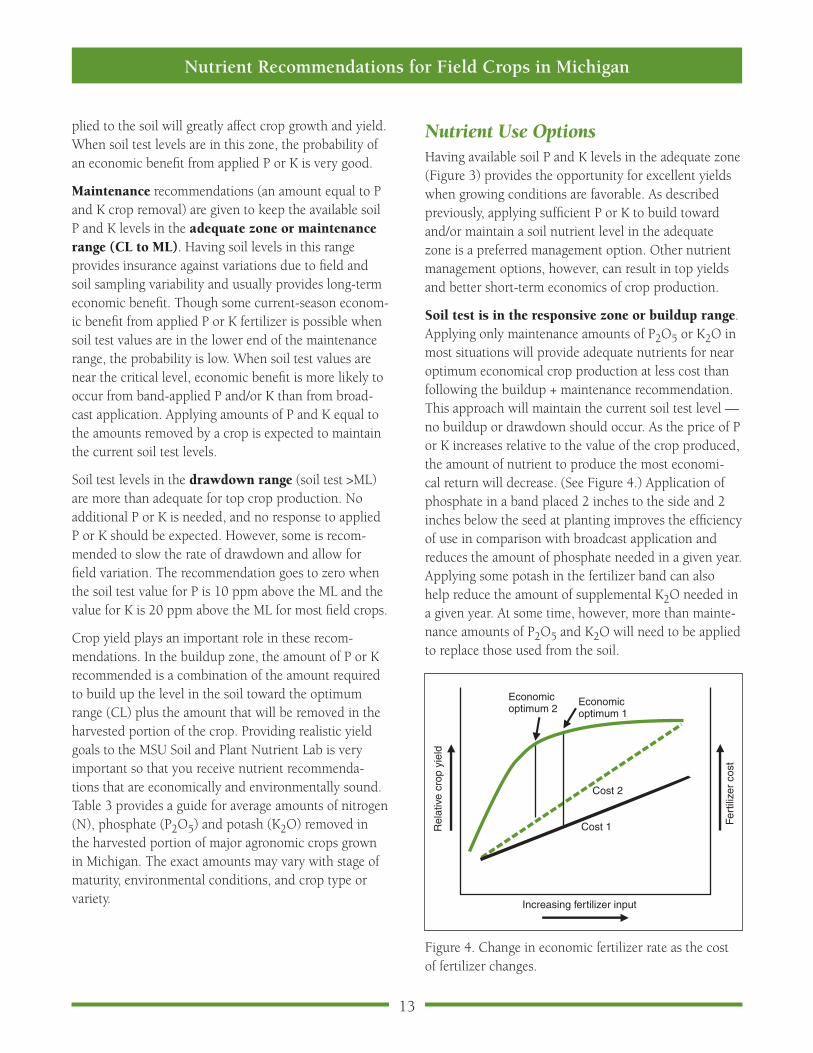
Soil test is in the responsive zone or buildup range . Applying only maintenance amounts of P2O5 or K2O in most situations will provide adequate nutrients for near optimum economical crop production at less cost than following the buildup + maintenance recommendation . This approach will maintain the current soil test level — no buildup or drawdown should occur . As the price of P or K increases relative to the value of the crop produced, the amount of nutrient to produce the most economi-cal return will decrease . (See Figure 4 .) Application of phosphate in a band placed 2 inches to the side and 2 inches below the seed at planting improves the efficiency of use in comparison with broadcast application and reduces the amount of phosphate needed in a given year . Applying some potash in the fertilizer band can also help reduce the amount of supplemental K2O needed in a given year . At some time, however, more than mainte-nance amounts of P2O5 and K2O will need to be applied to replace those used from the soil .
Figure 4 . Change in economic fertilizer rate as the cost of fertilizer changes .
Economicoptimum 2
Economicoptimum 1
Cost 2
Cost 1
Increasing fertilizer input
Rel
ativ
e cr
op y
ield
Fer
tiliz
er c
ost

14
Nutrient Recommendations for Field Crops in Michigan
Soil test is in the adequate zone or maintenance range . Soil nutrient levels in this range provide flexibil-ity in nutrient management . For the long term, it is good to maintain available nutrients in this range, if finan-cial resources permit . Applying less than maintenance amounts of P2O5 or K2O will result in some decrease in available P or K levels in the soil . For many soils, apply-ing 50 percent of maintenance will result in the soil test value decreasing 2 to 4 ppm P and 5 to 10 ppm K per year, depending on the crop and soil texture . Available nutrient levels will change more quickly in sandy soils than in clayey soils . Depending on the actual soil test level, it may be possible to apply less than a mainte-nance amount for four to five years without an impact on crop productivity .
Soil test is greater than adequate . There is no yield benefit to applying P and K when the available soil level is greater than adequate . In the drawdown range (10 ppm P and 20 ppm K beyond adequate), some P and K is recommended to slow the rate of drawdown in the soil test value . Also, putting a small amount of P2O5 or K2O in the starter fertilizer band may help stimulate early growth . However, it is perfectly acceptable to apply no P or K and take advantage of the nutrients stored in the soil bank through previous applications of fertilizer, manures or other materials .
As indicated, P recommendations take into consider-ation the soil test level and the crop yield . The buildup portion of the recommendation is intended to build the soil up to the critical value or level (CL), where yield is 95 to 97 percent of maximum . Buildup assumes that, on average, it takes 20 pounds of P2O5 to increase the soil test 1 ppm P or 5 lb/a/yr over a four-year period . The P buildup recommendations are given in Table 7 . The critical level varies with the crop and its response to P (Table 8) . The maintenance plateau for most field crops is 15 ppm on mineral soils . Maintaining the soil test P value in this maintenance zone helps ensure that P will not limit crop yield . When the soil test P value is above the maintenance zone, the soil P level should be drawn down, so the recommendation is less than crop removal . The phosphorus critical levels (CL), maintenance pla-teau length (PL) and drawdown length (DDL) are given in Table 8 for field crops grown on mineral and organic soils . The maximum annual phosphorus recom-
mendation for any crop or soil test level is 200 lb P2O5/a .
Equations used to calculate the recommended amount of P2O5, in pounds per acre, when the soil test is in each zone.
Mineral soils:
Buildup zone: lb P2O5 /a = ((CL – ST) x 5) + (YP x CR) when ST is < CLMaintenance zone: lb P2O5 /a = (YP x CR) when ST is ≥ CL and ≤ MLDrawdown zone: lb P2O5 /a = {YP x CR} x {[(CL + PL + DDL) – ST] ÷DDL} when ST > ML and < (ML + DDL)
Organic soils:
Buildup zone: lb P2O5 /a = ((CL – ST) x 2) + (YP x CR) when ST is < CLMaintenance zone: lb P2O5 /a = (YP x CR) when ST is ≥ CL and ≤ MLDrawdown zone: lb P2O5 /a = {YP x CR} x {[(CL + PL + DDL) – ST] ÷DDL} when ST > ML and < (ML + DDL)
where: CL = critical soil test value (ppm) ML = maintenance limit ST = soil test value (ppm) YP = yield potential or goal CR = nutrient removal in harvested
portion of crop (lb/unit of yield) PL = maintenance plateau length DDL = drawdown length; recommendation
is phased to zero
Table 7. Phosphorus buildup recommendations for crops grown on mineral soils.
P soil test CL 15 20 25 30 Buildup recommendations ppm lb P2O5/a
5 50 75 100 125 10 25 50 75 100 15 0 25 50 75 20 0 0 25 50 25 0 0 0 25 30 0 0 0 0
CL = critical soil test value (ppm)

15
Nutrient Recommendations for Field Crops in Michigan
Table 8. Values for key factors used in calculating the phosphorus recommendations for field crops grown on mineral and organic soils.
Mineral soil Organic soilCrop CL1 PL2 DDL3 CL1 PL2 DDL3 —— ppm —— —— ppm ——
Alfalfa seeding . . . . . . . . . . . . . . . . . . . . . . . 25 . . . . . . . . 15 . . . . . . . 10 . . . . . . . . . . . 30 . . . . . . . 15 . . . . . . 10Alfalfa hay . . . . . . . . . . . . . . . . . . . . . . . . . . 25 . . . . . . . . 15 . . . . . . . 10 . . . . . . . . . . . 30 . . . . . . . 15 . . . . . . 10Barley . . . . . . . . . . . . . . . . . . . . . . . . . . . . . 15 . . . . . . . . 15 . . . . . . . 10 . . . . . . . . . . . 40 . . . . . . . 15 . . . . . . 10Barley/legume seeding . . . . . . . . . . . . . . . . . 25 . . . . . . . . 15 . . . . . . . 10 . . . . . . . . . . . 40 . . . . . . . 15 . . . . . . 10Beans, dry edible . . . . . . . . . . . . . . . . . . . . . 15 . . . . . . . . 25 . . . . . . 10 . . . . . . . . . . . 40 . . . . . . . 15 . . . . . . 10Brassica forage . . . . . . . . . . . . . . . . . . . . . . . 15 . . . . . . . 15 . . . . . . . 10 . . . . . . . . . . . 40 . . . . . . . 15 . . . . . . 10Bromegrass hay . . . . . . . . . . . . . . . . . . . . . . 15 . . . . . . . 15 . . . . . . . 10 . . . . . . . . . . . 40 . . . . . . . 15 . . . . . . 10Buckwheat . . . . . . . . . . . . . . . . . . . . . . . . . . 15 . . . . . . . 15 . . . . . . . 10 . . . . . . . . . . . 40 . . . . . . . 15 . . . . . . 10Canola . . . . . . . . . . . . . . . . . . . . . . . . . . . . . 25 . . . . . . . 20 . . . . . . . 10 . . . . . . . . . . . 55 . . . . . . . 15 . . . . . . 10Clover seeding . . . . . . . . . . . . . . . . . . . . . . . 20 . . . . . . . 15 . . . . . . . 10 . . . . . . . . . . . 30 . . . . . . . 15 . . . . . . 10Clover hay . . . . . . . . . . . . . . . . . . . . . . . . . . 20 . . . . . . . 15 . . . . . . . 10 . . . . . . . . . . . 30 . . . . . . . 15 . . . . . . 10Clover-grass hay . . . . . . . . . . . . . . . . . . . . . 20 . . . . . . . . 15 . . . . . . 10 . . . . . . . . . . . 30 . . . . . . . 15 . . . . . . 10Corn grain . . . . . . . . . . . . . . . . . . . . . . . . . . 15 . . . . . . . . 15 . . . . . . . 10 . . . . . . . . . . . 55 . . . . . . . 15 . . . . . . 10Corn silage . . . . . . . . . . . . . . . . . . . . . . . . . 15 . . . . . . . 15 . . . . . . . 10 . . . . . . . . . . . 55 . . . . . . . 15 . . . . . . 10Corn, seed . . . . . . . . . . . . . . . . . . . . . . . . . . 20 . . . . . . . 20 . . . . . . . 10 . . . . . . . . . . . 55 . . . . . . . 15 . . . . . . 104
Grass, warm-season (CRP) . . . . . . . . . . . . . . 10 . . . . . . . 15 . . . . . . . 10 . . . . . . . . . . . 20 . . . . . . . 15 . . . . . . 10Grass, cool-season (CRP) . . . . . . . . . . . . . . . 10 . . . . . . . 15 . . . . . . . 10 . . . . . . . . . . . 20 . . . . . . . 15 . . . . . . 10Millet . . . . . . . . . . . . . . . . . . . . . . . . . . . . . . 15 . . . . . . . 15 . . . . . . . 10 . . . . . . . . . . . 40 . . . . . . . 15 . . . . . . 10Oats . . . . . . . . . . . . . . . . . . . . . . . . . . . . . . . 15 . . . . . . . 15 . . . . . . . 10 . . . . . . . . . . . 30 . . . . . . . 15 . . . . . . 10Oats/ legume seeding . . . . . . . . . . . . . . . . . . 25 . . . . . . . 15 . . . . . . . 10 . . . . . . . . . . . 30 . . . . . . . 15 . . . . . . 10Oats for cover . . . . . . . . . . . . . . . . . . . . . . . 25 . . . . . . . 15 . . . . . . . 10 . . . . . . . . . . . 30 . . . . . . . 15 . . . . . . 10Orchardgrass hay . . . . . . . . . . . . . . . . . . . . . 15 . . . . . . . 15 . . . . . . . 10 . . . . . . . . . . . 30 . . . . . . . 15 . . . . . . 10Pasture, intensive grazing . . . . . . . . . . . . . . . 20 . . . . . . . 15 . . . . . . . 10 . . . . . . . . . . . 30 . . . . . . . 15 . . . . . . 10Pasture,extensive grazing . . . . . . . . . . . . . . . 15 . . . . . . . . 15 . . . . . . . 10 . . . . . . . . . . . 30 . . . . . . . 15 . . . . . . 10Peppermint . . . . . . . . . . . . . . . . . . . . . . . . . 40 . . . . . . . 30 . . . . . . . 10 . . . . . . . . . . . 70 . . . . . . . 15 . . . . . . 15Potato . . . . . . . . . . . . . . . . . . . . . . . . . . . . . 75 . . . . . . . 75 . . . . . . . 50 . . . . . . . . . . 120 . . . . . . . 50 . . . . . . 20Rye grain . . . . . . . . . . . . . . . . . . . . . . . . . . . 15 . . . . . . . 15 . . . . . . . 10 . . . . . . . . . . . 40 . . . . . . . 15 . . . . . . 10Rye cover . . . . . . . . . . . . . . . . . . . . . . . . . . . 15 . . . . . . . 15 . . . . . . . 10 . . . . . . . . . . . 40 . . . . . . . 15 . . . . . . 10Rye silage . . . . . . . . . . . . . . . . . . . . . . . . . . . 15 . . . . . . . 15 . . . . . . . 10 . . . . . . . . . . . 40 . . . . . . . 15 . . . . . . 10Sorghum grain . . . . . . . . . . . . . . . . . . . . . . . 15 . . . . . . . 15 . . . . . . . 10 . . . . . . . . . . . 40 . . . . . . . 15 . . . . . . 10Sorghum-Sudangrass hay . . . . . . . . . . . . . . . 15 . . . . . . . 15 . . . . . . . 10 . . . . . . . . . . . 30 . . . . . . . 15 . . . . . . 10Sorg .-Sudangrass haylage . . . . . . . . . . . . . . . 15 . . . . . . . 15 . . . . . . . 10 . . . . . . . . . . . 30 . . . . . . . 15 . . . . . . 10Soybean . . . . . . . . . . . . . . . . . . . . . . . . . . . . 15 . . . . . . . 15 . . . . . . . 10 . . . . . . . . . . . 35 . . . . . . . 15 . . . . . . 10Spearmint . . . . . . . . . . . . . . . . . . . . . . . . . . 40 . . . . . . . 30 . . . . . . . 10 . . . . . . . . . . . 70 . . . . . . . 15 . . . . . . 15Spelt . . . . . . . . . . . . . . . . . . . . . . . . . . . . . . 15 . . . . . . . 15 . . . . . . . 10 . . . . . . . . . . . 40 . . . . . . . 15 . . . . . . 10Sugar beet . . . . . . . . . . . . . . . . . . . . . . . . . . 25 . . . . . . . 15 . . . . . . . 10 . . . . . . . . . . . 55 . . . . . . . 15 . . . . . . 104
Sunflower . . . . . . . . . . . . . . . . . . . . . . . . . . 15 . . . . . . . 15 . . . . . . . 10 . . . . . . . . . . . 40 . . . . . . . 15 . . . . . . 10Timothy hay . . . . . . . . . . . . . . . . . . . . . . . . 15 . . . . . . . 15 . . . . . . . 10 . . . . . . . . . . . 55 . . . . . . . 15 . . . . . . 104
Trefoil hay . . . . . . . . . . . . . . . . . . . . . . . . . . 20 . . . . . . . 20 . . . . . . . 10 . . . . . . . . . . . 40 . . . . . . . 15 . . . . . . 10Trefoil seed production . . . . . . . . . . . . . . . . 20 . . . . . . . 20 . . . . . . . 10 . . . . . . . . . . . 55 . . . . . . . 15 . . . . . . 104
Wheat grain . . . . . . . . . . . . . . . . . . . . . . . . . 25 . . . . . . . 15 . . . . . . . 10 . . . . . . . . . . . 55 . . . . . . . 15 . . . . . . 10Wheat/legume seeding . . . . . . . . . . . . . . . . . 25 . . . . . . . 15 . . . . . . . 10 . . . . . . . . . . . 55 . . . . . . . 15 . . . . . . 10
1CL = critical P soil test value 2PL = maintenance plateau length 3DDL= drawdown length4Though values are provided for organic soils, this crop is not recommended to be grown on organic soils .

16
Nutrient Recommendations for Field Crops in Michigan
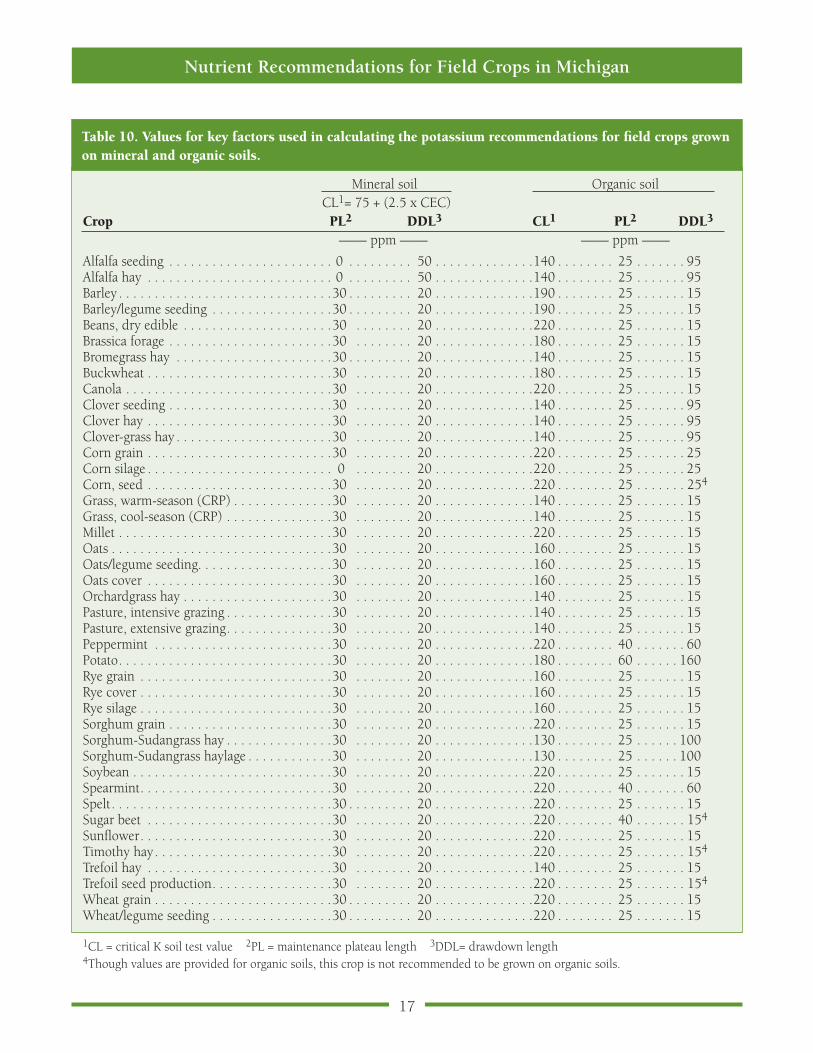
Potassium (K) recommendations take into consider-ation the soil test level and the crop yield . The buildup portion of the recommendation also takes into account the cation exchange capacity (CEC) of the soil . The amount of potassium required to increase the available soil potassium level and reach the critical level (where yield is 95 to 97 percent of maximum) varies with the CEC . The buildup portion of the K recommendation is given in Table 9 . The maintenance plateau for most field crops is 30 ppm for mineral soils and 25 ppm for organic soils . In the maintenance zone, the potassium recommendation equals crop removal . When the soil test K value is above the maintenance zone, crops should be allowed to use residual soil K and draw down the soil K level, so the K2O recommendation is less than crop removal . For most crops grown in mineral soils, the K2O recommendation goes to zero when the soil test level is 15 ppm beyond the upper maintenance soil test value . The critical levels (CL), maintenance plateau length (PL) and drawdown length (DDL) for field crops are given in Table 10 . The maximum annual K recommendation for any crop or soil test level is 300 lb K2O/a.
Equations used to calculate the amount of K2O, in pounds per acre, when the soil test is in each zone.
Mineral soils:
Buildup: lb K2O /a = {(CL – ST) x [(1 + (0 .05 x CEC)]} + (YP x CR) when ST is < CLMaintenance: lb K2O /a = (YP x CR) when ST is ≥ CL and ≤ MLDrawdown: lb K2O /a = {YP x CR} x {[(CL + PL + DDL) – ST] ÷DDL} when ST > ML and < (ML + DDL)
Organic soils:
Buildup: lb K2O /a = [(CL – ST) x 1 .5] + (YP x CR) when ST is < CLMaintenance: lb K2O /a = (YP x CR) when ST is ≥ CL and ≤ MLDrawdown: lb K2O /a = {YP x CR} x {[(CL + PL + DDL) – ST] ÷DDL} when ST > ML and < (ML + DDL)
where: CL = critical soil test (ppm); for mineral soils, CL = 75 + (2 .5 x CEC)
CEC = cation exchange capacity (me/100g soil) ML = maintenance limit ST = soil test value (ppm) YP = yield potential or goal CR = nutrient removal in harvested portion of
crop (lb/ unit of yield) PL = maintenance plateau length DDL = drawdown length; recommendation is
phased to zero
Organic soils . Soil test P and K values for organic soils are handled and calculated on a volume basis . Organic soils have much lower bulk densities than mineral soils, which may have a bulk density of 1 to 1 .8 g/cm3 . On average, organic soils will have field bulk densi-ties between 0 .65 and 0 .70 g/cm3, but they may vary considerably and may be as low as 0 .2 g/cm3 . In general, multiplying the soil test value in ppm by 1 .5 will ap-proximate pounds per acre to a depth of 6 2/3 inches . Hence, the critical soil test values are higher for organic soils than for mineral soils .
Calcium (Ca)Michigan soils generally developed from calcareous parent material and therefore contain sufficient available calcium (Ca) for production of field crops . Soils of the western Upper Peninsula, which developed from acidic
Table 9. Potassium buildup recommendations for crops grown on mineral soils.
CEC, me/100 g 4 8 12 16 K soil test CL 85 95 105 115 Buildup recommendations
ppm lb K2O/a
10 90 119 152 189 20 78 105 136 171 30 66 91 120 153 40 54 77 104 135 50 42 63 88 117 60 30 49 72 99 70 18 35 56 81 80 6 21 40 63 85 0 14 32 54 95 0 0 16 36 105 0 0 0 18 115 0 0 0 0
CL = 75 + (2 .5 x CEC)
17
Nutrient Recommendations for Field Crops in Michigan
Table 10. Values for key factors used in calculating the potassium recommendations for field crops grown on mineral and organic soils.
Mineral soil Organic soil CL1= 75 + (2 .5 x CEC) Crop PL2 DDL3 CL1 PL2 DDL3
—— ppm —— —— ppm ——
Alfalfa seeding . . . . . . . . . . . . . . . . . . . . . . . 0 . . . . . . . . . 50 . . . . . . . . . . . . . .140 . . . . . . . . 25 . . . . . . . 95Alfalfa hay . . . . . . . . . . . . . . . . . . . . . . . . . . 0 . . . . . . . . . 50 . . . . . . . . . . . . . .140 . . . . . . . . 25 . . . . . . . 95Barley . . . . . . . . . . . . . . . . . . . . . . . . . . . . . .30 . . . . . . . . . 20 . . . . . . . . . . . . . .190 . . . . . . . . 25 . . . . . . . 15Barley/legume seeding . . . . . . . . . . . . . . . . .30 . . . . . . . . . 20 . . . . . . . . . . . . . .190 . . . . . . . . 25 . . . . . . . 15Beans, dry edible . . . . . . . . . . . . . . . . . . . . .30 . . . . . . . . 20 . . . . . . . . . . . . . .220 . . . . . . . . 25 . . . . . . . 15Brassica forage . . . . . . . . . . . . . . . . . . . . . . .30 . . . . . . . . 20 . . . . . . . . . . . . . .180 . . . . . . . . 25 . . . . . . . 15Bromegrass hay . . . . . . . . . . . . . . . . . . . . . .30 . . . . . . . . . 20 . . . . . . . . . . . . . .140 . . . . . . . . 25 . . . . . . . 15Buckwheat . . . . . . . . . . . . . . . . . . . . . . . . . .30 . . . . . . . . 20 . . . . . . . . . . . . . .180 . . . . . . . . 25 . . . . . . . 15Canola . . . . . . . . . . . . . . . . . . . . . . . . . . . . .30 . . . . . . . . 20 . . . . . . . . . . . . . .220 . . . . . . . . 25 . . . . . . . 15Clover seeding . . . . . . . . . . . . . . . . . . . . . . .30 . . . . . . . . 20 . . . . . . . . . . . . . .140 . . . . . . . . 25 . . . . . . . 95Clover hay . . . . . . . . . . . . . . . . . . . . . . . . . .30 . . . . . . . . 20 . . . . . . . . . . . . . .140 . . . . . . . . 25 . . . . . . . 95Clover-grass hay . . . . . . . . . . . . . . . . . . . . . .30 . . . . . . . . 20 . . . . . . . . . . . . . .140 . . . . . . . . 25 . . . . . . . 95Corn grain . . . . . . . . . . . . . . . . . . . . . . . . . .30 . . . . . . . . 20 . . . . . . . . . . . . . .220 . . . . . . . . 25 . . . . . . . 25Corn silage . . . . . . . . . . . . . . . . . . . . . . . . . . 0 . . . . . . . . 20 . . . . . . . . . . . . . .220 . . . . . . . . 25 . . . . . . . 25Corn, seed . . . . . . . . . . . . . . . . . . . . . . . . . .30 . . . . . . . . 20 . . . . . . . . . . . . . .220 . . . . . . . . 25 . . . . . . . 254
Grass, warm-season (CRP) . . . . . . . . . . . . . .30 . . . . . . . . 20 . . . . . . . . . . . . . .140 . . . . . . . . 25 . . . . . . . 15Grass, cool-season (CRP) . . . . . . . . . . . . . . .30 . . . . . . . . 20 . . . . . . . . . . . . . .140 . . . . . . . . 25 . . . . . . . 15Millet . . . . . . . . . . . . . . . . . . . . . . . . . . . . . .30 . . . . . . . . 20 . . . . . . . . . . . . . .220 . . . . . . . . 25 . . . . . . . 15Oats . . . . . . . . . . . . . . . . . . . . . . . . . . . . . . .30 . . . . . . . . 20 . . . . . . . . . . . . . .160 . . . . . . . . 25 . . . . . . . 15Oats/legume seeding . . . . . . . . . . . . . . . . . . .30 . . . . . . . . 20 . . . . . . . . . . . . . .160 . . . . . . . . 25 . . . . . . . 15Oats cover . . . . . . . . . . . . . . . . . . . . . . . . . .30 . . . . . . . . 20 . . . . . . . . . . . . . .160 . . . . . . . . 25 . . . . . . . 15Orchardgrass hay . . . . . . . . . . . . . . . . . . . . .30 . . . . . . . . 20 . . . . . . . . . . . . . .140 . . . . . . . . 25 . . . . . . . 15Pasture, intensive grazing . . . . . . . . . . . . . . .30 . . . . . . . . 20 . . . . . . . . . . . . . .140 . . . . . . . . 25 . . . . . . . 15Pasture, extensive grazing . . . . . . . . . . . . . . .30 . . . . . . . . 20 . . . . . . . . . . . . . .140 . . . . . . . . 25 . . . . . . . 15Peppermint . . . . . . . . . . . . . . . . . . . . . . . . .30 . . . . . . . . 20 . . . . . . . . . . . . . .220 . . . . . . . . 40 . . . . . . . 60Potato . . . . . . . . . . . . . . . . . . . . . . . . . . . . . .30 . . . . . . . . 20 . . . . . . . . . . . . . .180 . . . . . . . . 60 . . . . . . 160Rye grain . . . . . . . . . . . . . . . . . . . . . . . . . . .30 . . . . . . . . 20 . . . . . . . . . . . . . .160 . . . . . . . . 25 . . . . . . . 15Rye cover . . . . . . . . . . . . . . . . . . . . . . . . . . .30 . . . . . . . . 20 . . . . . . . . . . . . . .160 . . . . . . . . 25 . . . . . . . 15Rye silage . . . . . . . . . . . . . . . . . . . . . . . . . . .30 . . . . . . . . 20 . . . . . . . . . . . . . .160 . . . . . . . . 25 . . . . . . . 15Sorghum grain . . . . . . . . . . . . . . . . . . . . . . .30 . . . . . . . . 20 . . . . . . . . . . . . . .220 . . . . . . . . 25 . . . . . . . 15Sorghum-Sudangrass hay . . . . . . . . . . . . . . .30 . . . . . . . . 20 . . . . . . . . . . . . . .130 . . . . . . . . 25 . . . . . . 100Sorghum-Sudangrass haylage . . . . . . . . . . . .30 . . . . . . . . 20 . . . . . . . . . . . . . .130 . . . . . . . . 25 . . . . . . 100Soybean . . . . . . . . . . . . . . . . . . . . . . . . . . . .30 . . . . . . . . 20 . . . . . . . . . . . . . .220 . . . . . . . . 25 . . . . . . . 15Spearmint . . . . . . . . . . . . . . . . . . . . . . . . . . .30 . . . . . . . . 20 . . . . . . . . . . . . . .220 . . . . . . . . 40 . . . . . . . 60Spelt . . . . . . . . . . . . . . . . . . . . . . . . . . . . . . .30 . . . . . . . . . 20 . . . . . . . . . . . . . .220 . . . . . . . . 25 . . . . . . . 15Sugar beet . . . . . . . . . . . . . . . . . . . . . . . . . .30 . . . . . . . . 20 . . . . . . . . . . . . . .220 . . . . . . . . 40 . . . . . . . 154
Sunflower . . . . . . . . . . . . . . . . . . . . . . . . . . .30 . . . . . . . . 20 . . . . . . . . . . . . . .220 . . . . . . . . 25 . . . . . . . 15Timothy hay . . . . . . . . . . . . . . . . . . . . . . . . .30 . . . . . . . . 20 . . . . . . . . . . . . . .220 . . . . . . . . 25 . . . . . . . 154
Trefoil hay . . . . . . . . . . . . . . . . . . . . . . . . . .30 . . . . . . . . 20 . . . . . . . . . . . . . .140 . . . . . . . . 25 . . . . . . . 15Trefoil seed production . . . . . . . . . . . . . . . . .30 . . . . . . . . 20 . . . . . . . . . . . . . .220 . . . . . . . . 25 . . . . . . . 154
Wheat grain . . . . . . . . . . . . . . . . . . . . . . . . .30 . . . . . . . . . 20 . . . . . . . . . . . . . .220 . . . . . . . . 25 . . . . . . . 15Wheat/legume seeding . . . . . . . . . . . . . . . . .30 . . . . . . . . . 20 . . . . . . . . . . . . . .220 . . . . . . . . 25 . . . . . . . 15
1CL = critical K soil test value 2PL = maintenance plateau length 3DDL= drawdown length4Though values are provided for organic soils, this crop is not recommended to be grown on organic soils .
18
Nutrient Recommendations for Field Crops in Michigan
parent materials, are the only major exception . Even soils that have become acidic and need lime generally contain sufficient Ca to meet the needs of field crops . Poor plant growth in acid soils is usually due to the ex-cess uptake of aluminum and/or manganese rather than Ca deficiency . The best way to be sure that soils contain adequate Ca is to soil test regularly and apply lime as needed . Supplemental Ca may improve tuber quality of potatoes grown on sandy soils containing less than 300 ppm exchangeable Ca . Maintaining adequate soil mois-ture is important for adequate Ca uptake .
Studies in Michigan, Indiana, Ohio and Wisconsin have shown alfalfa and corn to yield equally well over a wide range of calcium to magnesium (Ca:Mg) ratios . Adding Ca to improve the Ca:Mg ratio is not necessary unless the amount of Mg equals or exceeds Ca on an equiva-lence basis (milliequivalents per 100 grams soil) . Adding Ca to modify the Ca:Mg ratio may actually induce a Mg deficiency in sandy soils . The Ca:Mg ratio may be help-ful in determining whether to use calcitic (contains Ca) or dolomitic (contains both Ca and Mg) limestone when lime is needed .
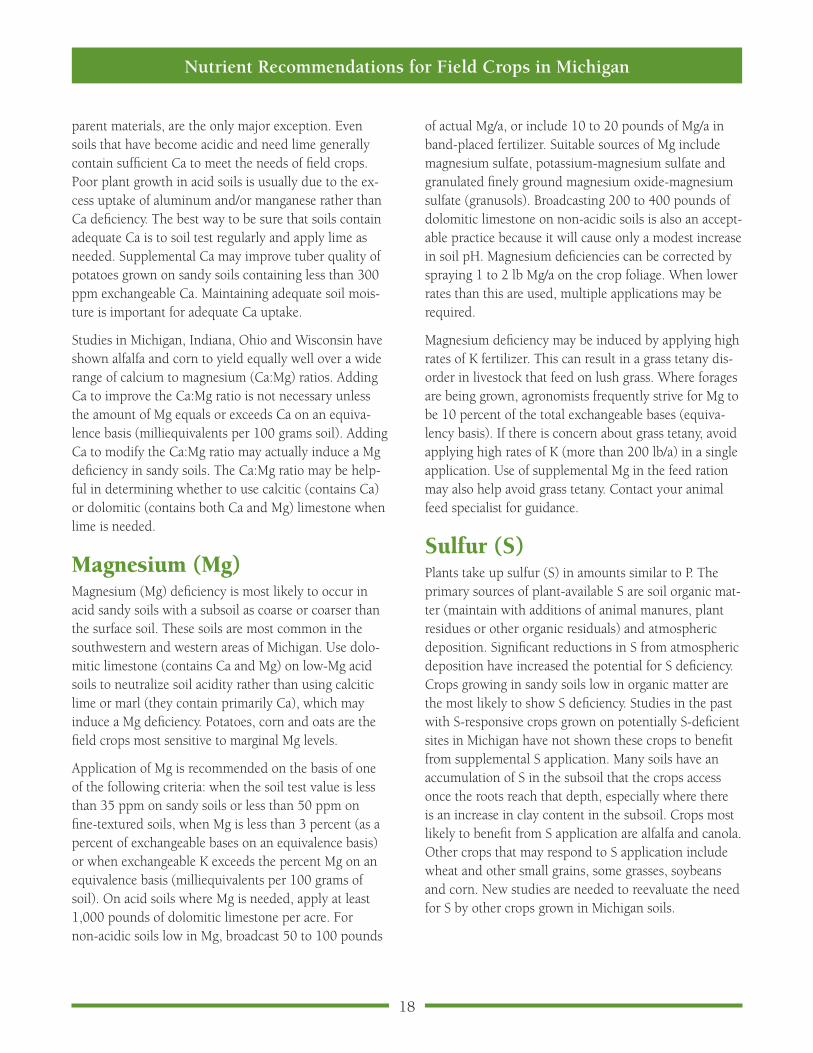
Magnesium (Mg)Magnesium (Mg) deficiency is most likely to occur in acid sandy soils with a subsoil as coarse or coarser than the surface soil . These soils are most common in the southwestern and western areas of Michigan . Use dolo-mitic limestone (contains Ca and Mg) on low-Mg acid soils to neutralize soil acidity rather than using calcitic lime or marl (they contain primarily Ca), which may induce a Mg deficiency . Potatoes, corn and oats are the field crops most sensitive to marginal Mg levels .
Application of Mg is recommended on the basis of one of the following criteria: when the soil test value is less than 35 ppm on sandy soils or less than 50 ppm on fine-textured soils, when Mg is less than 3 percent (as a percent of exchangeable bases on an equivalence basis) or when exchangeable K exceeds the percent Mg on an equivalence basis (milliequivalents per 100 grams of soil) . On acid soils where Mg is needed, apply at least 1,000 pounds of dolomitic limestone per acre . For non-acidic soils low in Mg, broadcast 50 to 100 pounds
of actual Mg/a, or include 10 to 20 pounds of Mg/a in band-placed fertilizer . Suitable sources of Mg include magnesium sulfate, potassium-magnesium sulfate and granulated finely ground magnesium oxide-magnesium sulfate (granusols) . Broadcasting 200 to 400 pounds of dolomitic limestone on non-acidic soils is also an accept-able practice because it will cause only a modest increase in soil pH . Magnesium deficiencies can be corrected by spraying 1 to 2 lb Mg/a on the crop foliage . When lower rates than this are used, multiple applications may be required .
Magnesium deficiency may be induced by applying high rates of K fertilizer . This can result in a grass tetany dis-order in livestock that feed on lush grass . Where forages are being grown, agronomists frequently strive for Mg to be 10 percent of the total exchangeable bases (equiva-lency basis) . If there is concern about grass tetany, avoid applying high rates of K (more than 200 lb/a) in a single application . Use of supplemental Mg in the feed ration may also help avoid grass tetany . Contact your animal feed specialist for guidance .
Sulfur (S)Plants take up sulfur (S) in amounts similar to P . The primary sources of plant-available S are soil organic mat-ter (maintain with additions of animal manures, plant residues or other organic residuals) and atmospheric deposition . Significant reductions in S from atmospheric deposition have increased the potential for S deficiency . Crops growing in sandy soils low in organic matter are the most likely to show S deficiency . Studies in the past with S-responsive crops grown on potentially S-deficient sites in Michigan have not shown these crops to benefit from supplemental S application . Many soils have an accumulation of S in the subsoil that the crops access once the roots reach that depth, especially where there is an increase in clay content in the subsoil . Crops most likely to benefit from S application are alfalfa and canola . Other crops that may respond to S application include wheat and other small grains, some grasses, soybeans and corn . New studies are needed to reevaluate the need for S by other crops grown in Michigan soils .
19
Nutrient Recommendations for Field Crops in Michigan
Micronutrient RecommendationsMicronutrient recommendations are based on soil test, soil pH and crop responsiveness . The responsiveness of selected field crops is given in Table 11 . Equations used to calculate the recommended amounts to apply are given at the beginning of each section .
Boron (B)Boron (B) recommendations are based on crop response, not on soil tests . A boron soil test (hot-water soluble) can provide a general guide to whether the status is low (<0 .7 ppm), marginal or adequate (>1 ppm) . Boron oc-curs in the soil primarily as a water-soluble anion that is subject to leaching, so the available B status may change over time, especially in sandy soils . Boron readily leaches out of sandy soils over the winter and early spring months when precipitation exceeds evapotranspiration . Some leaching may also occur in fine-textured soils but to a lesser degree . For responsive crops such as alfalfa, B deficiency may occur when soil moisture is marginal even though the soil contains adequate B . This frequent-ly occurs during the growth period of the second and/or third cutting . Application of 2 lb B/a per year is rec-ommended for alfalfa grown on sandy soils (CEC <8 .0 me/100 grams soil) . On fine-textured soils, B application is usually not beneficial except for high-yielding estab-lished alfalfa fields, where a topdress B application (0 .5 to 1 lb/a) is suggested .
Depending on variety grown, sugar beets may benefit from B application . Sugar beet varieties used to be quite responsive to supplemental B . More recently (over the past 10 or so years), research with newer sugar beet varieties showed supplemental boron was not necessary when beets were grown in the fine-textured soils of the Thumb and Saginaw Valley areas . Within the past two years, some boron deficiency has been observed in sugar beets grown in these same fine-textured soils . Therefore, application of 1 lb B/a may again be beneficial . On loamy sands and sandy loams, 2 lb B/a is suggested . Field beans, soybeans and small grains are sensitive to B appli-cation . For these crops, avoid using B in the starter fertil-izer . The residual B level from a previous year’s applica-tion should not be of concern for these sensitive crops unless higher than recommended rates were applied .
Manganese (Mn)For responsive crops, recommended amounts of man-ganese (Mn) are based on the (0 .1 N HCl) soil test (ST) value and soil pH according to the following equations:
Mineral soils: Mn rec . = [(6 .2 x pH) – (0 .35 x ST)] –36Organic soils: Mn rec . = [(8 .38 x pH) – (0 .31 x ST)] –46where: Mn recommendation is lb Mn/a (band application only) ST is soil test value (ppm Mn)
Manganese availability decreases markedly as soil pH increases . In mineral soils, the critical soil test value is 6 ppm at pH 6 .3 and 12 ppm at pH 6 .7 . In organic soils, the critical soil test value is 4 ppm at pH 5 .8 and 16 ppm at pH 6 .2 . Liming acid soils may induce a Mn deficiency . Manganese deficiency is most likely to occur on organic soils with a pH above 5 .8 and on dark-colored mineral soils in lake-bed and glacial outwash areas with a pH above 6 .5 . Recommended rates of Mn are for band ap-plication because Mn is readily bound into unavailable forms when mixed (broadcast and incorporated) with the soil . Flooding and fumigation temporarily increase Mn availability, but it readily decreases once the soil dries and microbial populations are reestablished . Manganese sulfate has proven to be the most suitable carrier for soil application, though granulated finely ground manganous oxide-sulfate mixtures (granusols) and some chelates are also acceptable sources when banded in mineral soils . Manganese chelates are not recommended for application in organic soils . Building up the available Mn status of soils is difficult . Therefore, if a Mn deficiency occurs in a field one year, it will likely reoccur each year, especially when sensitive crops are grown .
Oats, dry edible (field) beans, potatoes, soybeans, sor-ghum-Sudangrass, sugar beets and wheat are the crops most responsive to Mn . Under high pH conditions, barley may also respond to Mn application . On organic soils, corn may respond . Manganese deficiency in these crops can be alleviated by spraying the crop foliage with 1 to 2 lb Mn/a . When the deficiency is severe and lower rates are used, multiple applications may be necessary . If symptoms persist or appear on the new foliage 10 days after application, make another application . Some Mn carriers have been shown to reduce the efficacy of

20
Nutrient Recommendations for Field Crops in Michigan
Table 11. Micronutrient responsiveness level for selected field crops.
Crop Boron Copper Manganese Zinc
Alfalfa seeding . . . . . . . . . . . . . . . . . . . . . . . . . . . M . . . . . . . . . . . . .M . . . . . . . . . . . . L . . . . . . . . . . L Alfalfa hay . . . . . . . . . . . . . . . . . . . . . . . . . . . . . . H . . . . . . . . . . . .M . . . . . . . . . . . . L . . . . . . . . . . LBarley . . . . . . . . . . . . . . . . . . . . . . . . . . . . . . . . . . .L . . . . . . . . . . . . .M . . . . . . . . . . . . M . . . . . . . . . . LBarley/legume seeding . . . . . . . . . . . . . . . . . . . . . M . . . . . . . . . . . . .M . . . . . . . . . . . . M . . . . . . . . . . LBeans, dry edible . . . . . . . . . . . . . . . . . . . . . . . . . .L . . . . . . . . . . . . . L . . . . . . . . . . . . . H . . . . . . . . . .HBrassica forage . . . . . . . . . . . . . . . . . . . . . . . . . . . M . . . . . . . . . . . . .M . . . . . . . . . . . . M . . . . . . . . . . LBromegrass hay . . . . . . . . . . . . . . . . . . . . . . . . . . .L . . . . . . . . . . . . . L . . . . . . . . . . . . . M . . . . . . . . . . LBuckwheat . . . . . . . . . . . . . . . . . . . . . . . . . . . . . . .L . . . . . . . . . . . . . L . . . . . . . . . . . . . M . . . . . . . . . . LCanola . . . . . . . . . . . . . . . . . . . . . . . . . . . . . . . . . .L . . . . . . . . . . . . . H . . . . . . . . . . . . H . . . . . . . . . . LClover seeding . . . . . . . . . . . . . . . . . . . . . . . . . . . M . . . . . . . . . . . . .M . . . . . . . . . . . . M . . . . . . . . . . LClover hay . . . . . . . . . . . . . . . . . . . . . . . . . . . . . . M . . . . . . . . . . . . .M . . . . . . . . . . . . M . . . . . . . . . . LClover-grass hay . . . . . . . . . . . . . . . . . . . . . . . . . . M . . . . . . . . . . . . .M . . . . . . . . . . . . M . . . . . . . . . . LCorn grain . . . . . . . . . . . . . . . . . . . . . . . . . . . . . . .L . . . . . . . . . . . . .M . . . . . . . . . . . . M . . . . . . . . . .HCorn silage . . . . . . . . . . . . . . . . . . . . . . . . . . . . . . .L . . . . . . . . . . . . .M . . . . . . . . . . . . M . . . . . . . . . .H Corn, seed . . . . . . . . . . . . . . . . . . . . . . . . . . . . . . .L . . . . . . . . . . . . .M . . . . . . . . . . . . M . . . . . . . . . .H Grass, cool-season (CRP) . . . . . . . . . . . . . . . . . . . .L . . . . . . . . . . . . . L . . . . . . . . . . . . . M . . . . . . . . . . LGrass, warm-season (CRP) . . . . . . . . . . . . . . . . . . .L . . . . . . . . . . . . . L . . . . . . . . . . . . . M . . . . . . . . . . L Millet . . . . . . . . . . . . . . . . . . . . . . . . . . . . . . . . . . .L . . . . . . . . . . . . .M . . . . . . . . . . . . H . . . . . . . . . .H Oats . . . . . . . . . . . . . . . . . . . . . . . . . . . . . . . . . . . .L . . . . . . . . . . . . . H . . . . . . . . . . . . H . . . . . . . . . . L Oats/legume seeding . . . . . . . . . . . . . . . . . . . . . . . M . . . . . . . . . . . . . H . . . . . . . . . . . . H . . . . . . . . . . LOats for cover . . . . . . . . . . . . . . . . . . . . . . . . . . . . .L . . . . . . . . . . . . .M . . . . . . . . . . . . M . . . . . . . . . . L Orchardgrass hay . . . . . . . . . . . . . . . . . . . . . . . . . .L . . . . . . . . . . . . . L . . . . . . . . . . . . . M . . . . . . . . . . L Pasture, extensive grazing . . . . . . . . . . . . . . . . . . . .L . . . . . . . . . . . . . L . . . . . . . . . . . . . M . . . . . . . . . . LPasture, intensive grazing . . . . . . . . . . . . . . . . . . . .L . . . . . . . . . . . . . L . . . . . . . . . . . . . M . . . . . . . . . . L Peppermint . . . . . . . . . . . . . . . . . . . . . . . . . . . . . .L . . . . . . . . . . . . . L . . . . . . . . . . . . . M . . . . . . . . . . L Potato . . . . . . . . . . . . . . . . . . . . . . . . . . . . . . . . . . .L . . . . . . . . . . . . . L . . . . . . . . . . . . . H . . . . . . . . . .M Rye grain . . . . . . . . . . . . . . . . . . . . . . . . . . . . . . . .L . . . . . . . . . . . . . L . . . . . . . . . . . . . L . . . . . . . . . . L Rye cover . . . . . . . . . . . . . . . . . . . . . . . . . . . . . . . .L . . . . . . . . . . . . . L . . . . . . . . . . . . . L . . . . . . . . . . L Rye silage . . . . . . . . . . . . . . . . . . . . . . . . . . . . . . . .L . . . . . . . . . . . . . L . . . . . . . . . . . . . L . . . . . . . . . . LSorghum grain . . . . . . . . . . . . . . . . . . . . . . . . . . . .L . . . . . . . . . . . . .M . . . . . . . . . . . . H . . . . . . . . . .HSorghum-Sudangrass hay . . . . . . . . . . . . . . . . . . . .L . . . . . . . . . . . . .M . . . . . . . . . . . . H . . . . . . . . . .M Sorghum-Sudangrass haylage . . . . . . . . . . . . . . . . .L . . . . . . . . . . . . .M . . . . . . . . . . . . H . . . . . . . . . .M Soybean . . . . . . . . . . . . . . . . . . . . . . . . . . . . . . . . .L . . . . . . . . . . . . . L . . . . . . . . . . . . . H . . . . . . . . . .M Spearmint . . . . . . . . . . . . . . . . . . . . . . . . . . . . . . . .L . . . . . . . . . . . . . L . . . . . . . . . . . . . M . . . . . . . . . . L Spelt . . . . . . . . . . . . . . . . . . . . . . . . . . . . . . . . . . . .L . . . . . . . . . . . . .M . . . . . . . . . . . . M . . . . . . . . . . L Sugar beet . . . . . . . . . . . . . . . . . . . . . . . . . . . . . . M . . . . . . . . . . . . .M . . . . . . . . . . . . H . . . . . . . . . .M Sunflower . . . . . . . . . . . . . . . . . . . . . . . . . . . . . . . M . . . . . . . . . . . . .M . . . . . . . . . . . . M . . . . . . . . . .M Timothy hay . . . . . . . . . . . . . . . . . . . . . . . . . . . . . .L . . . . . . . . . . . . . L . . . . . . . . . . . . . M . . . . . . . . . . L Trefoil hay . . . . . . . . . . . . . . . . . . . . . . . . . . . . . . M . . . . . . . . . . . . .M . . . . . . . . . . . . M . . . . . . . . . . L Trefoil seed production . . . . . . . . . . . . . . . . . . . . . M . . . . . . . . . . . . .M . . . . . . . . . . . . M . . . . . . . . . . L Wheat grain . . . . . . . . . . . . . . . . . . . . . . . . . . . . . .L . . . . . . . . . . . . . H . . . . . . . . . . . . H . . . . . . . . . . L Wheat/legume seeding . . . . . . . . . . . . . . . . . . . . . .L . . . . . . . . . . . . . H . . . . . . . . . . . . H . . . . . . . . . . L
Responsiveness is relative to when the soil contains low available levels of the micronutrient . H = highly responsive; M = medium; L = low .
21
Nutrient Recommendations for Field Crops in Michigan
glyphosate when the two are tank mixed together or sprayed sequentially within 48 hours . Manganese EDTA (ethylenediaminetetraacetic acid) has shown minimal adverse effect .
Zinc (Zn)For responsive crops, recommended amounts of zinc (Zn) are based on the (0 .1 N HCL) soil test (ST) value and soil pH, according to the following equations:
Mineral and organic soils: Zn rec . = [(5 .0 x pH) – (0 .4 x ST)] – 32where: Zn recommendation is lb Zn/a ST is soil test value (ppm Zn)
Michigan soils with a pH below 6 .5 generally contain adequate Zn to meet the needs of field crops . At pH 6 .6, the critical soil test value is 2 ppm; at pH 7 .0, it is 7 ppm . Zinc deficiency is most likely to occur on the alkaline mineral soils of the lake-bed regions of eastern Michigan and on near neutral to alkaline organic soils . Deficiencies are also likely to occur on spoil-bank areas and areas where tiles were trenched into calcareous sub-soil . High rates of P may enhance the occurrence of a Zn deficiency when the available soil Zn status is marginal . Dry edible beans, corn and sorghum-Sudangrass are the field crops most sensitive to low levels of available Zn . Band application of the recommended Zn rate is preferred, but broadcast application of 10 lb/a or more is effective in meeting the need of the crop and building up the soil level . Annual band applications will gradu-ally build up available Zn levels and eliminate the need for further applications . Zinc sulfate, granulated finely ground zinc oxide-sulfate mixtures and chelates are good sources of Zn for soil application . Chelates are ac-tually more effective than the inorganic salts in improv-ing the Zn availability for a given growing season . The recommended rate for Zn chelates is one-fifth the rate calculated above for the inorganic salts .
Copper (Cu)Copper (Cu) is recommended for organic soils based on the 1 N HCl soil test .
Cu rec . = 6 – (0 .22 x ST)where: Cu recommendation is lb/a ST is soil test value (ppm Cu)
The mineral soils of Michigan generally contain ad-equate amounts of Cu . Soil test values greater than 0 .5 ppm (1N HCl extractable) indicate adequate Cu avail-ability . Acid sandy soils that have been heavily cropped are the most likely of the mineral soils to show a Cu deficiency . Organic soils are naturally low in available copper, and many field crops will respond to Cu appli-cation when grown on these soils . Once applied to the soil, Cu remains available . Therefore, Cu levels may have been improved by past applications to the soil or by Cu fungicide sprays in fields that have been in production for a long time . The 1N HCl soil test is a good indica-tor of copper availability in organic soils . No further Cu is needed for most field crops once a total of 20 lb Cu/a have been applied to an organic soil or the soil test exceeds 20 ppm . Alfalfa, sorghum-Sudangrass, oats and wheat are the crops most sensitive to low soil Cu . When grown on high organic matter sandy soils, these crops may benefit from the application of 2 to 4 lb Cu/a . Cop-per sulfate and copper oxide are both effective sources of copper applied either broadcast or in a band . Copper chelates are also good sources of Cu and may actually be slightly more effective than the inorganic salts .
Managing Nutrient InputsCommercial fertilizers supply nutrients in forms that are concentrated, easily handled and applied, readily soluble and available for plant uptake .
Manures, biosolids and composts are also good sources of plant nutrients . The inorganic fertilizer salts of N, P and K are readily available . Some nutrients in organic forms are gradually released over time as they are de-composed by microorganisms . On average, 50 percent of the N in manures will be released during the year of application, and 80 percent of the P and 100 percent of the K are available . The numbers for biosolids will vary with type and treatment, but usually N release will be near 25 to 30 percent, P about 50 percent and K 100 percent the year of application . The composting process tends to stabilize the N components so that only about 10 percent of the N in compost becomes available dur-ing the application year . Injection or immediate incor-poration of manures or biosolids is necessary not only to reduce odor concerns but also to minimize volatile N loss, primarily as ammonia . The nutrient content of
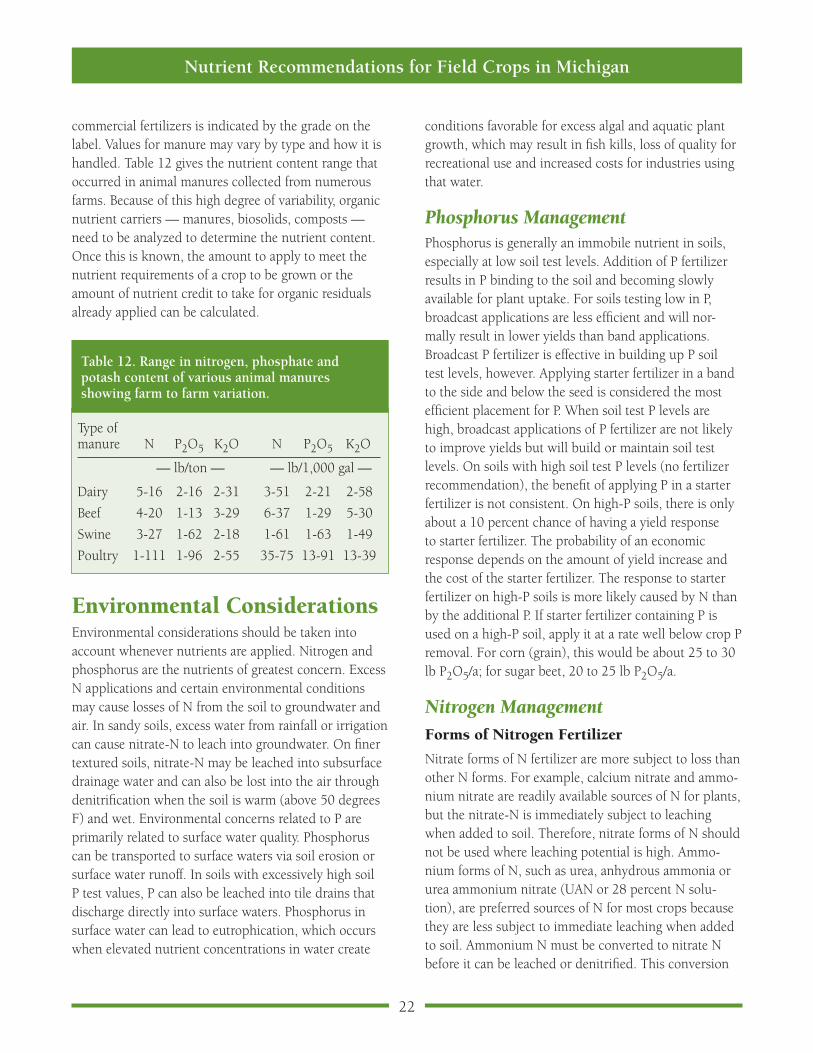
22
Nutrient Recommendations for Field Crops in Michigan
Table 12. Range in nitrogen, phosphate and potash content of various animal manures showing farm to farm variation.
Type of manure N P2O5 K2O N P2O5 K2O
— lb/ton — — lb/1,000 gal —
Dairy 5-16 2-16 2-31 3-51 2-21 2-58
Beef 4-20 1-13 3-29 6-37 1-29 5-30
Swine 3-27 1-62 2-18 1-61 1-63 1-49
Poultry 1-111 1-96 2-55 35-75 13-91 13-39
commercial fertilizers is indicated by the grade on the label . Values for manure may vary by type and how it is handled . Table 12 gives the nutrient content range that occurred in animal manures collected from numerous farms . Because of this high degree of variability, organic nutrient carriers — manures, biosolids, composts — need to be analyzed to determine the nutrient content . Once this is known, the amount to apply to meet the nutrient requirements of a crop to be grown or the amount of nutrient credit to take for organic residuals already applied can be calculated .
Environmental ConsiderationsEnvironmental considerations should be taken into account whenever nutrients are applied . Nitrogen and phosphorus are the nutrients of greatest concern . Excess N applications and certain environmental conditions may cause losses of N from the soil to groundwater and air . In sandy soils, excess water from rainfall or irrigation can cause nitrate-N to leach into groundwater . On finer textured soils, nitrate-N may be leached into subsurface drainage water and can also be lost into the air through denitrification when the soil is warm (above 50 degrees F) and wet . Environmental concerns related to P are primarily related to surface water quality . Phosphorus can be transported to surface waters via soil erosion or surface water runoff . In soils with excessively high soil P test values, P can also be leached into tile drains that discharge directly into surface waters . Phosphorus in surface water can lead to eutrophication, which occurs when elevated nutrient concentrations in water create
conditions favorable for excess algal and aquatic plant growth, which may result in fish kills, loss of quality for recreational use and increased costs for industries using that water .
Phosphorus ManagementPhosphorus is generally an immobile nutrient in soils, especially at low soil test levels . Addition of P fertilizer results in P binding to the soil and becoming slowly available for plant uptake . For soils testing low in P, broadcast applications are less efficient and will nor-mally result in lower yields than band applications . Broadcast P fertilizer is effective in building up P soil test levels, however . Applying starter fertilizer in a band to the side and below the seed is considered the most efficient placement for P . When soil test P levels are high, broadcast applications of P fertilizer are not likely to improve yields but will build or maintain soil test levels . On soils with high soil test P levels (no fertilizer recommendation), the benefit of applying P in a starter fertilizer is not consistent . On high-P soils, there is only about a 10 percent chance of having a yield response to starter fertilizer . The probability of an economic response depends on the amount of yield increase and the cost of the starter fertilizer . The response to starter fertilizer on high-P soils is more likely caused by N than by the additional P . If starter fertilizer containing P is used on a high-P soil, apply it at a rate well below crop P removal . For corn (grain), this would be about 25 to 30 lb P2O5/a; for sugar beet, 20 to 25 lb P2O5/a .
Nitrogen ManagementForms of Nitrogen Fertilizer
Nitrate forms of N fertilizer are more subject to loss than other N forms . For example, calcium nitrate and ammo-nium nitrate are readily available sources of N for plants, but the nitrate-N is immediately subject to leaching when added to soil . Therefore, nitrate forms of N should not be used where leaching potential is high . Ammo-nium forms of N, such as urea, anhydrous ammonia or urea ammonium nitrate (UAN or 28 percent N solu-tion), are preferred sources of N for most crops because they are less subject to immediate leaching when added to soil . Ammonium N must be converted to nitrate N before it can be leached or denitrified . This conversion
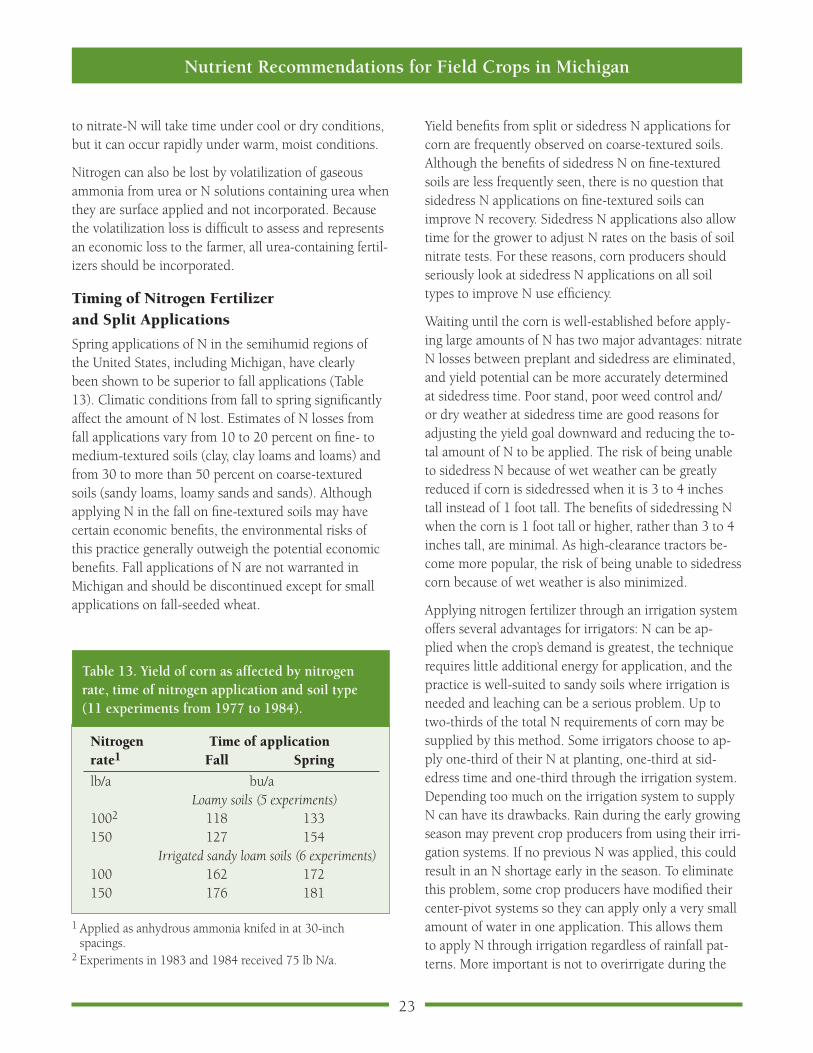
23
Nutrient Recommendations for Field Crops in Michigan
to nitrate-N will take time under cool or dry conditions, but it can occur rapidly under warm, moist conditions .
Nitrogen can also be lost by volatilization of gaseous ammonia from urea or N solutions containing urea when they are surface applied and not incorporated . Because the volatilization loss is difficult to assess and represents an economic loss to the farmer, all urea-containing fertil-izers should be incorporated .
Timing of Nitrogen Fertilizer and Split Applications
Spring applications of N in the semihumid regions of the United States, including Michigan, have clearly been shown to be superior to fall applications (Table 13) . Climatic conditions from fall to spring significantly affect the amount of N lost . Estimates of N losses from fall applications vary from 10 to 20 percent on fine- to medium-textured soils (clay, clay loams and loams) and from 30 to more than 50 percent on coarse-textured soils (sandy loams, loamy sands and sands) . Although applying N in the fall on fine-textured soils may have certain economic benefits, the environmental risks of this practice generally outweigh the potential economic benefits . Fall applications of N are not warranted in Michigan and should be discontinued except for small applications on fall-seeded wheat .
Yield benefits from split or sidedress N applications for corn are frequently observed on coarse-textured soils . Although the benefits of sidedress N on fine-textured soils are less frequently seen, there is no question that sidedress N applications on fine-textured soils can improve N recovery . Sidedress N applications also allow time for the grower to adjust N rates on the basis of soil nitrate tests . For these reasons, corn producers should seriously look at sidedress N applications on all soil types to improve N use efficiency .
Waiting until the corn is well-established before apply-ing large amounts of N has two major advantages: nitrate N losses between preplant and sidedress are eliminated, and yield potential can be more accurately determined at sidedress time . Poor stand, poor weed control and/or dry weather at sidedress time are good reasons for adjusting the yield goal downward and reducing the to-tal amount of N to be applied . The risk of being unable to sidedress N because of wet weather can be greatly reduced if corn is sidedressed when it is 3 to 4 inches tall instead of 1 foot tall . The benefits of sidedressing N when the corn is 1 foot tall or higher, rather than 3 to 4 inches tall, are minimal . As high-clearance tractors be-come more popular, the risk of being unable to sidedress corn because of wet weather is also minimized .
Applying nitrogen fertilizer through an irrigation system offers several advantages for irrigators: N can be ap-plied when the crop’s demand is greatest, the technique requires little additional energy for application, and the practice is well-suited to sandy soils where irrigation is needed and leaching can be a serious problem . Up to two-thirds of the total N requirements of corn may be supplied by this method . Some irrigators choose to ap-ply one-third of their N at planting, one-third at sid-edress time and one-third through the irrigation system . Depending too much on the irrigation system to supply N can have its drawbacks . Rain during the early growing season may prevent crop producers from using their irri-gation systems . If no previous N was applied, this could result in an N shortage early in the season . To eliminate this problem, some crop producers have modified their center-pivot systems so they can apply only a very small amount of water in one application . This allows them to apply N through irrigation regardless of rainfall pat-terns . More important is not to overirrigate during the
Table 13. Yield of corn as affected by nitrogen rate, time of nitrogen application and soil type (11 experiments from 1977 to 1984).
Nitrogen Time of application rate1 Fall Spring
lb/a bu/a Loamy soils (5 experiments) 1002 118 133 150 127 154 Irrigated sandy loam soils (6 experiments) 100 162 172 150 176 181
1 Applied as anhydrous ammonia knifed in at 30-inch spacings .
2 Experiments in 1983 and 1984 received 75 lb N/a .

24
Nutrient Recommendations for Field Crops in Michigan
early part of the growing period, June and July, because nitrate-N concentrations, which are most subject to leaching loss, are highest during this time .
Nitrification Inhibitors
Crop producers in many states have successfully used nitrification inhibitors to delay the conversion of am-monium-N to nitrate-N . Preventing rapid conversion of ammonium to nitrate can reduce the amount of nitrate-N that is available for denitrification or leaching early in the growing season .
Crop producers should consider using nitrification in-hibitors when it is not feasible to use delayed N applica-tions such as sidedressing or applying through an irriga-tion system . Nitrification inhibitors can be beneficial if N applications are made in early spring and leaching or denitrifying conditions exist . Nitrification inhibitors are designed to improve N use efficiency and minimize N loss . The amount of N used is very crucial to meeting this goal . Nitrification inhibitors are best applied with slightly less than the recommended N amount . If the rate of N fertilizer applied is adequate or exces-sive, no economic benefits can be expected . Nitrification inhibitors can improve N recovery when used appro-priately, but they should not be used as a substitute for following other recommended management practices .
Urease Inhibitors
When urea is applied on the soil surface, N can be lost as volatile ammonia as urea is converted into inorganic N forms by the enzyme urease . This is of most con-cern when dry urea (46 percent N) or urea-ammonium nitrate (UAN) solution (which contains 50 percent urea) is applied to no-till fields either preplant or as a top-dress . Urease inhibitors slow the conversion process and provide more time for rain or irrigation to move the urea into the soil, where the released ammonia is adsorbed to the soil . Volatile N loss from urea is of most concern at higher soil and air temperatures, especially above 60 de-grees F . Therefore, the potential for loss would be greater for topdress than for preplant-applied urea . When urea is incorporated into the soil, volatile N loss is not a concern . Placing urea or UAN into the soil with a disc opener or knife or by tillage will eliminate the concern about volatile N loss .
Soil Nitrate Testing
Nitrate is the form of N that is most available to plants . Soil type, rainfall and temperature greatly affect the seasonal availability of N to plants . Under wet condi-tions, N losses can occur by leaching from the rooting zone and/or by denitrification from the soil . Denitrifica-tion is a microbial process that occurs rapidly when soils become water-saturated and temperatures are warm (above 50 degrees F) . Denitrification is the conversion of nitrate to some form of nitrous oxide . Nitrate leaching can occur at any soil temperature . Denitrification losses are greatest on fine-textured soils with poor internal drainage; leaching losses are greatest on coarse-textured sandy soils with good internal drainage . The seasonal availability of nitrate-N should be assessed each year and matched to crop needs .
Soil nitrate testing is an excellent and inexpensive way of evaluating the available N status of your soil . Michi-gan State University research and demonstration stud-ies have shown that corn producers can reduce their N fertilizer application rate without the risk of reducing yields if they use the soil nitrate test . Nitrate testing can also help to prevent overapplication of N fertilizers . The soil nitrate test measures only nitrate-N — it does not measure ammonium-N or organic N .
Although soil samples may be taken anytime to estab-lish the available N status, the best time to take samples is in late May and early June after the soil has warmed up and before sidedressing . The soil usually contains the greatest amount of nitrate-N during this time . The presidedress nitrate test (PSNT) measures both residual nitrate N from the previous year and N that has min-eralized (become available) from organic matter, crop residues and manures during the spring . Soil samples taken in early spring (April or May) will contain primar-ily residual nitrate . Although testing in early spring may still be helpful in assessing how much additional N is needed, samples taken just before sidedress time provide the greatest advantage in determining the appropriate rate of sidedress N .
Manured fields and fields where the previous crop was a legume will likely contain the most nitrate-N . Early sampling of these fields will not result in the maximum
25
Nutrient Recommendations for Field Crops in Michigan
N credit because ammonium-N and easily decomposed organic N will not yet have been converted to nitrate-N and will not be measured by the test . Therefore, only the PSNT is recommended for these fields .
Other fields that show high nitrate-N levels are fields with medium- and fine-textured soils (loam, clay loam and clay) that have been heavily fertilized in previous years . Sandy soils, even though heavily fertilized the previous year, may not show much N carryover because nitrate N can easily be lost by leaching .
PSNT soil samples are best taken shortly before side-dressing (when the corn is anywhere from 3 to 12 inches tall) . At least 15, 1-foot-deep soil cores should taken across no more than 20 acres and mixed together to make a sample . Samples should be dried immediately before sending or kept cold until delivered to a labora-tory . Nitrogen credits are assigned on the basis of the outcome of the nitrate test . The PSNT results will be more accurate if less than 40 lb N/a is applied at or before planting .
Stalk Nitrate Testing
The nitrate concentration in the lower part of the corn-stalk after black layer formation in the grain can provide an indication of the efficiency of the N management program . Concentrations between 450 and 2,000 ppm generally indicate good nitrogen use efficiency with op-timum yields and limited residual soil N . Values below 450 ppm may indicate very efficient N use and optimum yields or a corn crop that ran short on N with some reduction in yield . Values above 2,000 ppm indicate more N was available than was necessary . Maintaining a database of stalk nitrate values from field to field and from year to year will enable appropriate adjustment of N rates .
Crop Rotations, Forages and Cover Crops
Crop rotations can be very beneficial in a successful crop production system . For example, a corn-soybean rotation is preferable to a continuous corn rotation because continuous corn requires more N fertilizer to obtain the optimum yield . Some of the yield improve-ment may be due to the rotational effect — i .e ., better
disease, insect and weed control, and improved soil tilth — and some to N fixation by soybeans . Rotation with other non-legume crops has also been shown to produce better yields of corn with less N fertilizer, especially corn following wheat and other small grains . Including wheat in the rotation has been found to increase corn yields by at least 10 percent . In Michigan studies, when wheat was followed by a cover crop, such as frost-seeded red clover, corn yields were always increased by at least 15 percent over those of continuous corn .
Cover crops such as oats, barley or rye, seeded after crop harvest, can be very beneficial in taking up residual soil N and in preventing wind and water erosion . They protect the soil surface from erosion and thereby reduce the risk of nutrient losses by runoff as soluble nutrients or erosion as sediment . Cover crops may also be used as green manure crops to take up nitrate-N and prevent it from being leached to groundwater . Oilseed radish is quite effective at this but must be seeded in August or early September . This practice is well-suited to many soils in Michigan and could be used more effectively than it is now . One of the keys to utilizing cover crops successfully is to get them established in early fall so that they have a chance to take up excess nitrate-N before winter dormancy and excessive precipitation occur .
Calibration of Equipment
Evidence of uneven fertilizer distribution due to improp-erly adjusted fertilizer spreaders can be seen almost every year, particularly on winter wheat . Uneven distribution of fertilizer results in overfertilization in some areas of the field and underfertilization in others . The result is less than optimum whole-field yields and potential loss of excess nutrients to surface water and groundwater .
All fertilizer applicators need to be accurately calibrated . If crop producers are unsure whether the equipment they are using is properly calibrated, they should recali-brate the equipment to avoid crop yield loss and poten-tial risk to the environment . Improving the calibration of fertilizer applicators will result in more uniform distribu-tion of the fertilizer at the proper rate .
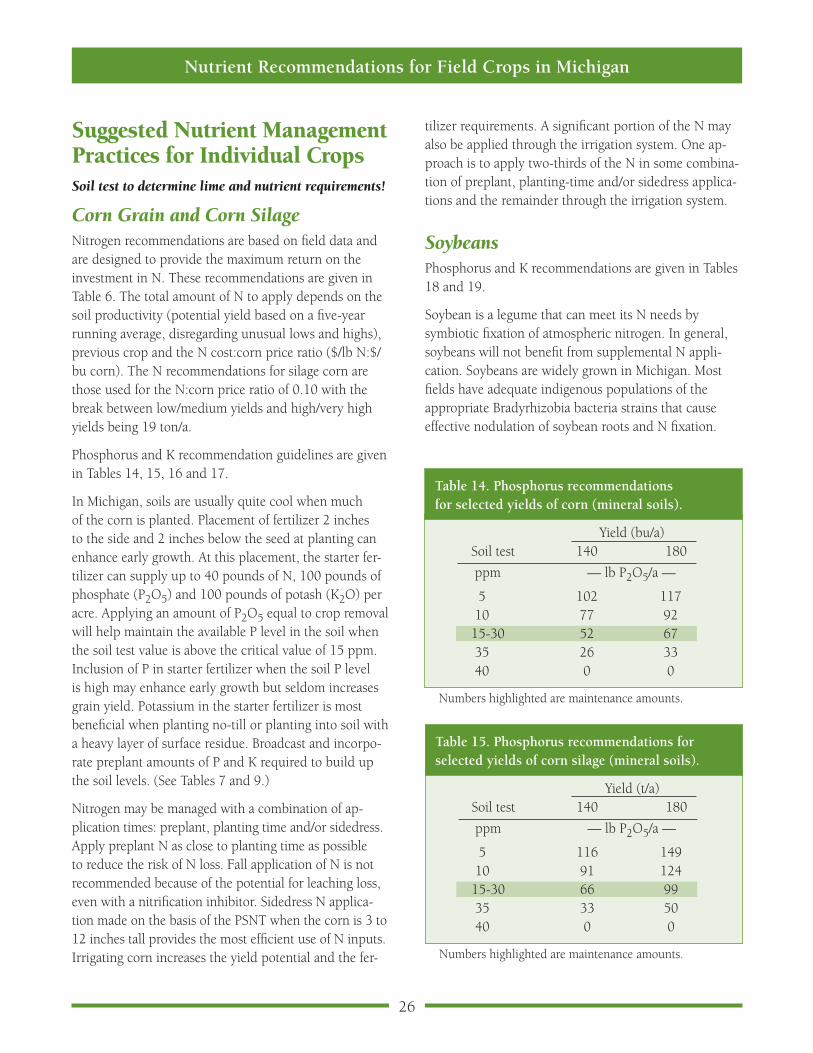
26
Nutrient Recommendations for Field Crops in Michigan
Suggested Nutrient Management Practices for Individual CropsSoil test to determine lime and nutrient requirements!
Corn Grain and Corn SilageNitrogen recommendations are based on field data and are designed to provide the maximum return on the investment in N . These recommendations are given in Table 6 . The total amount of N to apply depends on the soil productivity (potential yield based on a five-year running average, disregarding unusual lows and highs), previous crop and the N cost:corn price ratio ($/lb N:$/bu corn) . The N recommendations for silage corn are those used for the N:corn price ratio of 0 .10 with the break between low/medium yields and high/very high yields being 19 ton/a .
Phosphorus and K recommendation guidelines are given in Tables 14, 15, 16 and 17 .
In Michigan, soils are usually quite cool when much of the corn is planted . Placement of fertilizer 2 inches to the side and 2 inches below the seed at planting can enhance early growth . At this placement, the starter fer-tilizer can supply up to 40 pounds of N, 100 pounds of phosphate (P2O5) and 100 pounds of potash (K2O) per acre . Applying an amount of P2O5 equal to crop removal will help maintain the available P level in the soil when the soil test value is above the critical value of 15 ppm . Inclusion of P in starter fertilizer when the soil P level is high may enhance early growth but seldom increases grain yield . Potassium in the starter fertilizer is most beneficial when planting no-till or planting into soil with a heavy layer of surface residue . Broadcast and incorpo-rate preplant amounts of P and K required to build up the soil levels . (See Tables 7 and 9 .)
Nitrogen may be managed with a combination of ap-plication times: preplant, planting time and/or sidedress . Apply preplant N as close to planting time as possible to reduce the risk of N loss . Fall application of N is not recommended because of the potential for leaching loss, even with a nitrification inhibitor . Sidedress N applica-tion made on the basis of the PSNT when the corn is 3 to 12 inches tall provides the most efficient use of N inputs . Irrigating corn increases the yield potential and the fer-
tilizer requirements . A significant portion of the N may also be applied through the irrigation system . One ap-proach is to apply two-thirds of the N in some combina-tion of preplant, planting-time and/or sidedress applica-tions and the remainder through the irrigation system .
SoybeansPhosphorus and K recommendations are given in Tables 18 and 19 .
Soybean is a legume that can meet its N needs by symbiotic fixation of atmospheric nitrogen . In general, soybeans will not benefit from supplemental N appli-cation . Soybeans are widely grown in Michigan . Most fields have adequate indigenous populations of the appropriate Bradyrhizobia bacteria strains that cause effective nodulation of soybean roots and N fixation .
Table 14. Phosphorus recommendations for selected yields of corn (mineral soils).
Yield (bu/a) Soil test 140 180
ppm — lb P2O5/a —
5 102 117 10 77 92 15-30 52 67 35 26 33 40 0 0
Numbers highlighted are maintenance amounts .
Table 15. Phosphorus recommendations forselected yields of corn silage (mineral soils).
Yield (t/a) Soil test 140 180
ppm — lb P2O5/a —
5 116 149 10 91 124 15-30 66 99 35 33 50 40 0 0
Numbers highlighted are maintenance amounts .
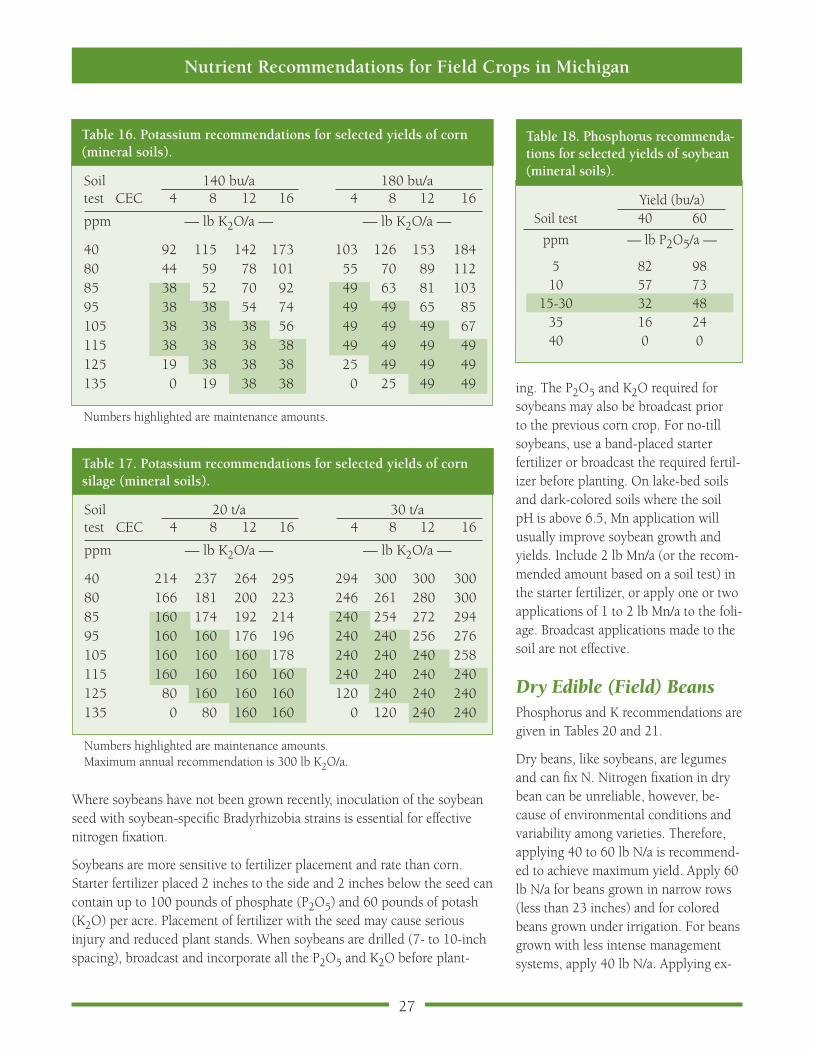
27
Nutrient Recommendations for Field Crops in Michigan
Table 16. Potassium recommendations for selected yields of corn (mineral soils).
Soil 140 bu/a 180 bu/a test CEC 4 8 12 16 4 8 12 16
ppm — lb K2O/a — — lb K2O/a —
40 92 115 142 173 103 126 153 184 80 44 59 78 101 55 70 89 112 85 38 52 70 92 49 63 81 103 95 38 38 54 74 49 49 65 85 105 38 38 38 56 49 49 49 67 115 38 38 38 38 49 49 49 49 125 19 38 38 38 25 49 49 49 135 0 19 38 38 0 25 49 49
Numbers highlighted are maintenance amounts .
Table 17. Potassium recommendations for selected yields of corn silage (mineral soils).
Soil 20 t/a 30 t/a test CEC 4 8 12 16 4 8 12 16
ppm — lb K2O/a — — lb K2O/a —
40 214 237 264 295 294 300 300 300 80 166 181 200 223 246 261 280 300 85 160 174 192 214 240 254 272 294 95 160 160 176 196 240 240 256 276 105 160 160 160 178 240 240 240 258 115 160 160 160 160 240 240 240 240 125 80 160 160 160 120 240 240 240 135 0 80 160 160 0 120 240 240
Numbers highlighted are maintenance amounts .Maximum annual recommendation is 300 lb K2O/a .
Table 18. Phosphorus recommenda-tions for selected yields of soybean (mineral soils).
Yield (bu/a) Soil test 40 60
ppm — lb P2O5/a —
5 82 98 10 57 73 15-30 32 48 35 16 24 40 0 0
Where soybeans have not been grown recently, inoculation of the soybean seed with soybean-specific Bradyrhizobia strains is essential for effective nitrogen fixation .
Soybeans are more sensitive to fertilizer placement and rate than corn . Starter fertilizer placed 2 inches to the side and 2 inches below the seed can contain up to 100 pounds of phosphate (P2O5) and 60 pounds of potash (K2O) per acre . Placement of fertilizer with the seed may cause serious injury and reduced plant stands . When soybeans are drilled (7- to 10-inch spacing), broadcast and incorporate all the P2O5 and K2O before plant-
ing . The P2O5 and K2O required for soybeans may also be broadcast prior to the previous corn crop . For no-till soybeans, use a band-placed starter fertilizer or broadcast the required fertil-izer before planting . On lake-bed soils and dark-colored soils where the soil pH is above 6 .5, Mn application will usually improve soybean growth and yields . Include 2 lb Mn/a (or the recom-mended amount based on a soil test) in the starter fertilizer, or apply one or two applications of 1 to 2 lb Mn/a to the foli-age . Broadcast applications made to the soil are not effective .
Dry Edible (Field) BeansPhosphorus and K recommendations are given in Tables 20 and 21 .
Dry beans, like soybeans, are legumes and can fix N . Nitrogen fixation in dry bean can be unreliable, however, be-cause of environmental conditions and variability among varieties . Therefore, applying 40 to 60 lb N/a is recommend-ed to achieve maximum yield . Apply 60 lb N/a for beans grown in narrow rows (less than 23 inches) and for colored beans grown under irrigation . For beans grown with less intense management systems, apply 40 lb N/a . Applying ex-
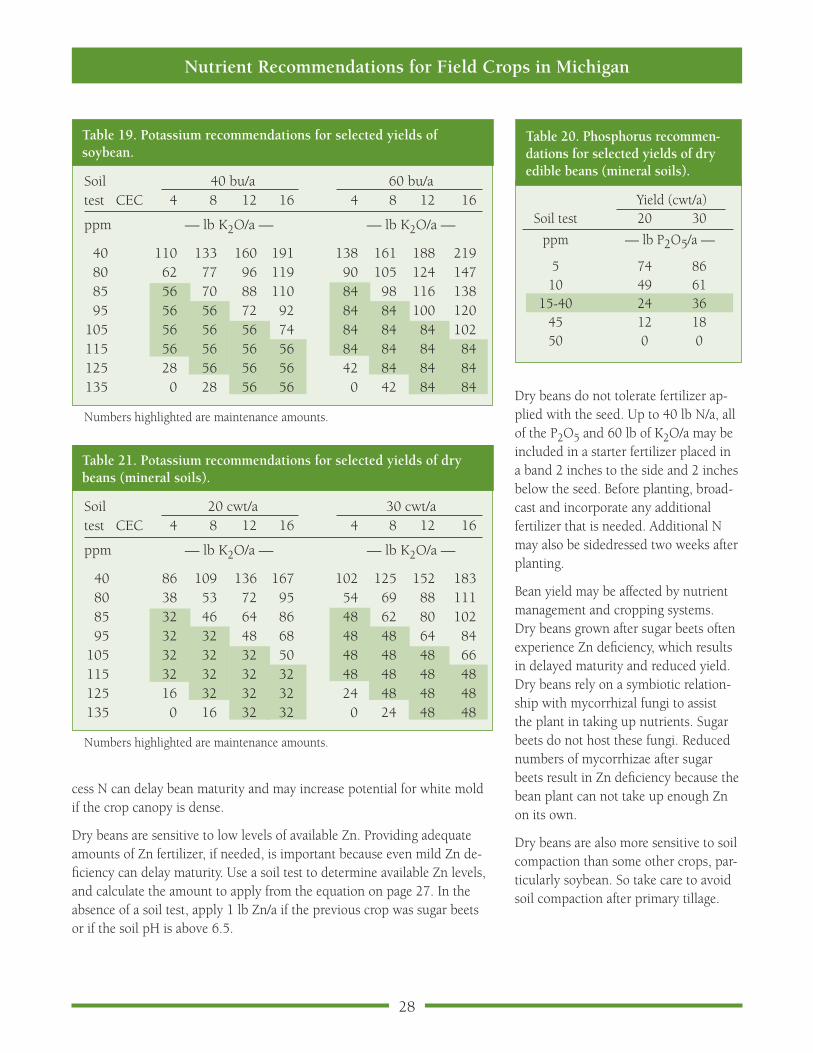
28
Nutrient Recommendations for Field Crops in Michigan
Table 19. Potassium recommendations for selected yields of soybean.
Soil 40 bu/a 60 bu/a test CEC 4 8 12 16 4 8 12 16
ppm — lb K2O/a — — lb K2O/a —
40 110 133 160 191 138 161 188 219 80 62 77 96 119 90 105 124 147 85 56 70 88 110 84 98 116 138 95 56 56 72 92 84 84 100 120 105 56 56 56 74 84 84 84 102 115 56 56 56 56 84 84 84 84 125 28 56 56 56 42 84 84 84 135 0 28 56 56 0 42 84 84
Numbers highlighted are maintenance amounts .
Table 20. Phosphorus recommen-dations for selected yields of dry edible beans (mineral soils).
Yield (cwt/a) Soil test 20 30
ppm — lb P2O5/a —
5 74 86 10 49 61 15-40 24 36 45 12 18 50 0 0
Table 21. Potassium recommendations for selected yields of dry beans (mineral soils).
Soil 20 cwt/a 30 cwt/a test CEC 4 8 12 16 4 8 12 16
ppm — lb K2O/a — — lb K2O/a —
40 86 109 136 167 102 125 152 183 80 38 53 72 95 54 69 88 111 85 32 46 64 86 48 62 80 102 95 32 32 48 68 48 48 64 84 105 32 32 32 50 48 48 48 66 115 32 32 32 32 48 48 48 48 125 16 32 32 32 24 48 48 48 135 0 16 32 32 0 24 48 48
Numbers highlighted are maintenance amounts .
cess N can delay bean maturity and may increase potential for white mold if the crop canopy is dense .
Dry beans are sensitive to low levels of available Zn . Providing adequate amounts of Zn fertilizer, if needed, is important because even mild Zn de-ficiency can delay maturity . Use a soil test to determine available Zn levels, and calculate the amount to apply from the equation on page 27 . In the absence of a soil test, apply 1 lb Zn/a if the previous crop was sugar beets or if the soil pH is above 6 .5 .
Dry beans do not tolerate fertilizer ap-plied with the seed . Up to 40 lb N/a, all of the P2O5 and 60 lb of K2O/a may be included in a starter fertilizer placed in a band 2 inches to the side and 2 inches below the seed . Before planting, broad-cast and incorporate any additional fertilizer that is needed . Additional N may also be sidedressed two weeks after planting .
Bean yield may be affected by nutrient management and cropping systems . Dry beans grown after sugar beets often experience Zn deficiency, which results in delayed maturity and reduced yield . Dry beans rely on a symbiotic relation-ship with mycorrhizal fungi to assist the plant in taking up nutrients . Sugar beets do not host these fungi . Reduced numbers of mycorrhizae after sugar beets result in Zn deficiency because the bean plant can not take up enough Zn on its own .
Dry beans are also more sensitive to soil compaction than some other crops, par-ticularly soybean . So take care to avoid soil compaction after primary tillage .
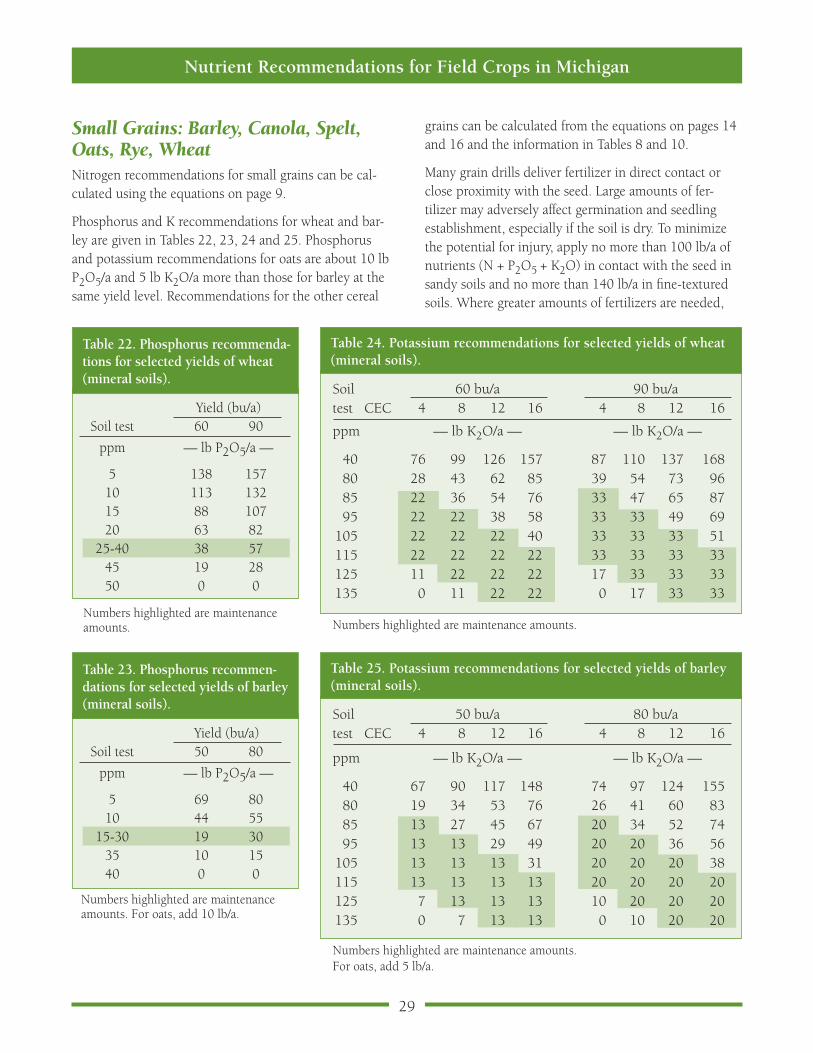
29
Nutrient Recommendations for Field Crops in Michigan
Small Grains: Barley, Canola, Spelt, Oats, Rye, WheatNitrogen recommendations for small grains can be cal-culated using the equations on page 9 .
Phosphorus and K recommendations for wheat and bar-ley are given in Tables 22, 23, 24 and 25 . Phosphorus and potassium recommendations for oats are about 10 lb P2O5/a and 5 lb K2O/a more than those for barley at the same yield level . Recommendations for the other cereal
grains can be calculated from the equations on pages 14 and 16 and the information in Tables 8 and 10 .
Many grain drills deliver fertilizer in direct contact or close proximity with the seed . Large amounts of fer-tilizer may adversely affect germination and seedling establishment, especially if the soil is dry . To minimize the potential for injury, apply no more than 100 lb/a of nutrients (N + P2O5 + K2O) in contact with the seed in sandy soils and no more than 140 lb/a in fine-textured soils . Where greater amounts of fertilizers are needed,
Table 22. Phosphorus recommenda-tions for selected yields of wheat (mineral soils).
Yield (bu/a) Soil test 60 90
ppm — lb P2O5/a —
5 138 157 10 113 132 15 88 107 20 63 82 25-40 38 57 45 19 28 50 0 0
Table 23. Phosphorus recommen-dations for selected yields of barley (mineral soils).
Yield (bu/a) Soil test 50 80
ppm — lb P2O5/a —
5 69 80 10 44 55 15-30 19 30 35 10 15 40 0 0
Numbers highlighted are maintenance amounts .
Numbers highlighted are maintenance amounts . For oats, add 10 lb/a .
Table 24. Potassium recommendations for selected yields of wheat(mineral soils).
Soil 60 bu/a 90 bu/a test CEC 4 8 12 16 4 8 12 16
ppm — lb K2O/a — — lb K2O/a —
40 76 99 126 157 87 110 137 168 80 28 43 62 85 39 54 73 96 85 22 36 54 76 33 47 65 87 95 22 22 38 58 33 33 49 69 105 22 22 22 40 33 33 33 51 115 22 22 22 22 33 33 33 33 125 11 22 22 22 17 33 33 33 135 0 11 22 22 0 17 33 33
Numbers highlighted are maintenance amounts .
Table 25. Potassium recommendations for selected yields of barley(mineral soils).
Soil 50 bu/a 80 bu/a test CEC 4 8 12 16 4 8 12 16
ppm — lb K2O/a — — lb K2O/a —
40 67 90 117 148 74 97 124 155 80 19 34 53 76 26 41 60 83 85 13 27 45 67 20 34 52 74 95 13 13 29 49 20 20 36 56 105 13 13 13 31 20 20 20 38 115 13 13 13 13 20 20 20 20 125 7 13 13 13 10 20 20 20 135 0 7 13 13 0 10 20 20
Numbers highlighted are maintenance amounts .For oats, add 5 lb/a .
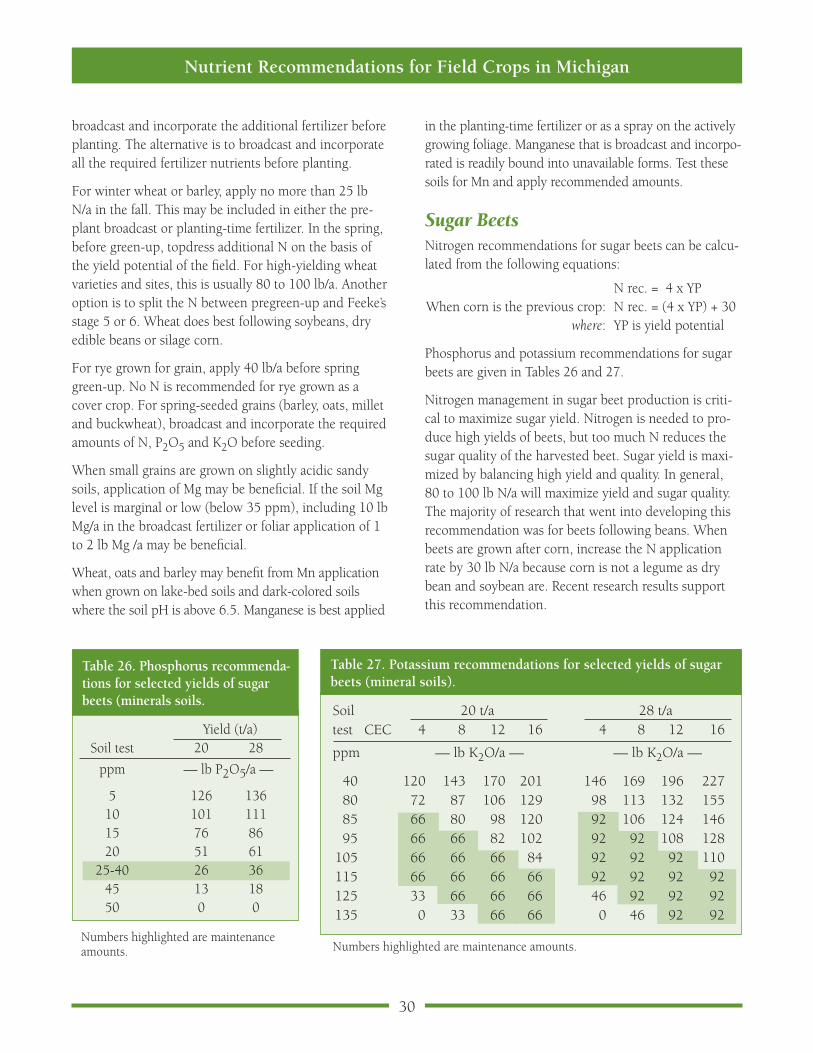
30
Nutrient Recommendations for Field Crops in Michigan
broadcast and incorporate the additional fertilizer before planting . The alternative is to broadcast and incorporate all the required fertilizer nutrients before planting .
For winter wheat or barley, apply no more than 25 lb N/a in the fall . This may be included in either the pre-plant broadcast or planting-time fertilizer . In the spring, before green-up, topdress additional N on the basis of the yield potential of the field . For high-yielding wheat varieties and sites, this is usually 80 to 100 lb/a . Another option is to split the N between pregreen-up and Feeke’s stage 5 or 6 . Wheat does best following soybeans, dry edible beans or silage corn .
For rye grown for grain, apply 40 lb/a before spring green-up . No N is recommended for rye grown as a cover crop . For spring-seeded grains (barley, oats, millet and buckwheat), broadcast and incorporate the required amounts of N, P2O5 and K2O before seeding .
When small grains are grown on slightly acidic sandy soils, application of Mg may be beneficial . If the soil Mg level is marginal or low (below 35 ppm), including 10 lb Mg/a in the broadcast fertilizer or foliar application of 1 to 2 lb Mg /a may be beneficial .
Wheat, oats and barley may benefit from Mn application when grown on lake-bed soils and dark-colored soils where the soil pH is above 6 .5 . Manganese is best applied
in the planting-time fertilizer or as a spray on the actively growing foliage . Manganese that is broadcast and incorpo-rated is readily bound into unavailable forms . Test these soils for Mn and apply recommended amounts .
Sugar BeetsNitrogen recommendations for sugar beets can be calcu-lated from the following equations:
N rec . = 4 x YP When corn is the previous crop: N rec . = (4 x YP) + 30 where: YP is yield potential
Phosphorus and potassium recommendations for sugar beets are given in Tables 26 and 27 .
Nitrogen management in sugar beet production is criti-cal to maximize sugar yield . Nitrogen is needed to pro-duce high yields of beets, but too much N reduces the sugar quality of the harvested beet . Sugar yield is maxi-mized by balancing high yield and quality . In general, 80 to 100 lb N/a will maximize yield and sugar quality . The majority of research that went into developing this recommendation was for beets following beans . When beets are grown after corn, increase the N application rate by 30 lb N/a because corn is not a legume as dry bean and soybean are . Recent research results support this recommendation .
Table 26. Phosphorus recommenda-tions for selected yields of sugar beets (minerals soils.
Yield (t/a) Soil test 20 28
ppm — lb P2O5/a —
5 126 136 10 101 111 15 76 86 20 51 61 25-40 26 36 45 13 18 50 0 0
Numbers highlighted are maintenance amounts .
Table 27. Potassium recommendations for selected yields of sugar beets (mineral soils).
Soil 20 t/a 28 t/a test CEC 4 8 12 16 4 8 12 16
ppm — lb K2O/a — — lb K2O/a —
40 120 143 170 201 146 169 196 227 80 72 87 106 129 98 113 132 155 85 66 80 98 120 92 106 124 146 95 66 66 82 102 92 92 108 128 105 66 66 66 84 92 92 92 110 115 66 66 66 66 92 92 92 92 125 33 66 66 66 46 92 92 92 135 0 33 66 66 0 46 92 92
Numbers highlighted are maintenance amounts .
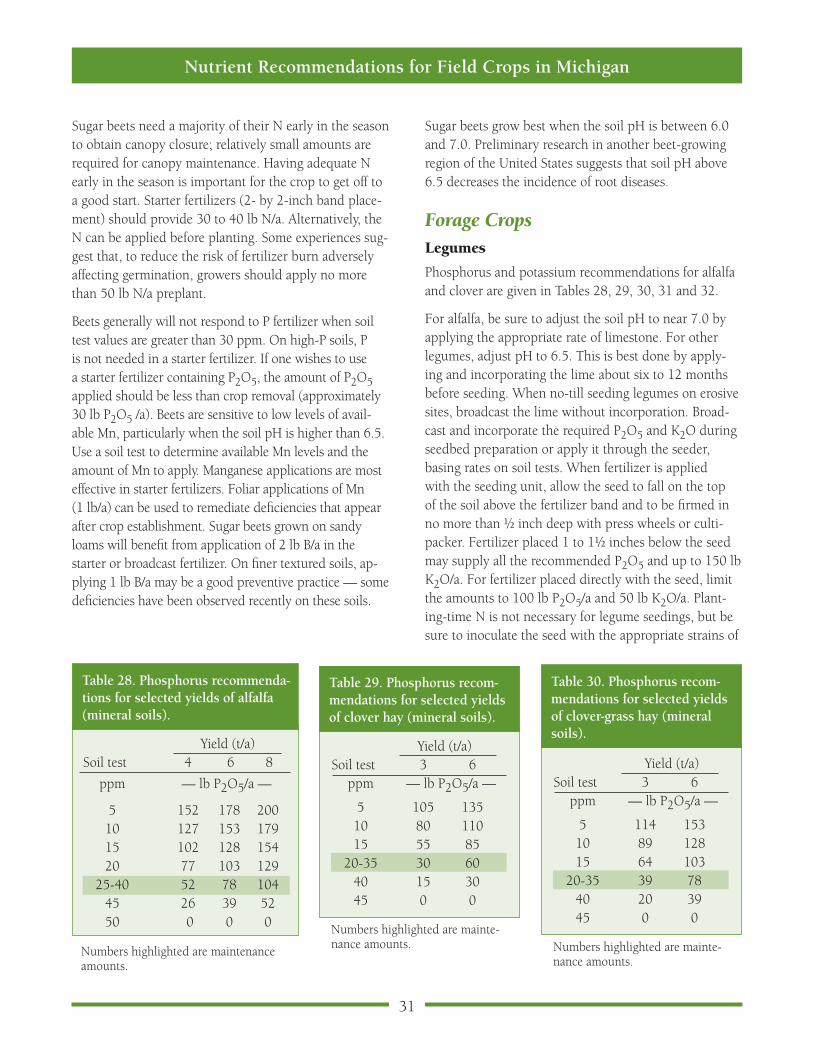
31
Nutrient Recommendations for Field Crops in Michigan
Sugar beets need a majority of their N early in the season to obtain canopy closure; relatively small amounts are required for canopy maintenance . Having adequate N early in the season is important for the crop to get off to a good start . Starter fertilizers (2- by 2-inch band place-ment) should provide 30 to 40 lb N/a . Alternatively, the N can be applied before planting . Some experiences sug-gest that, to reduce the risk of fertilizer burn adversely affecting germination, growers should apply no more than 50 lb N/a preplant .
Beets generally will not respond to P fertilizer when soil test values are greater than 30 ppm . On high-P soils, P is not needed in a starter fertilizer . If one wishes to use a starter fertilizer containing P2O5, the amount of P2O5 applied should be less than crop removal (approximately 30 lb P2O5 /a) . Beets are sensitive to low levels of avail-able Mn, particularly when the soil pH is higher than 6 .5 . Use a soil test to determine available Mn levels and the amount of Mn to apply . Manganese applications are most effective in starter fertilizers . Foliar applications of Mn (1 lb/a) can be used to remediate deficiencies that appear after crop establishment . Sugar beets grown on sandy loams will benefit from application of 2 lb B/a in the starter or broadcast fertilizer . On finer textured soils, ap-plying 1 lb B/a may be a good preventive practice — some deficiencies have been observed recently on these soils .
Sugar beets grow best when the soil pH is between 6 .0 and 7 .0 . Preliminary research in another beet-growing region of the United States suggests that soil pH above 6 .5 decreases the incidence of root diseases .
Forage CropsLegumes Phosphorus and potassium recommendations for alfalfa and clover are given in Tables 28, 29, 30, 31 and 32 .
For alfalfa, be sure to adjust the soil pH to near 7 .0 by applying the appropriate rate of limestone . For other legumes, adjust pH to 6 .5 . This is best done by apply-ing and incorporating the lime about six to 12 months before seeding . When no-till seeding legumes on erosive sites, broadcast the lime without incorporation . Broad-cast and incorporate the required P2O5 and K2O during seedbed preparation or apply it through the seeder, basing rates on soil tests . When fertilizer is applied with the seeding unit, allow the seed to fall on the top of the soil above the fertilizer band and to be firmed in no more than ½ inch deep with press wheels or culti-packer . Fertilizer placed 1 to 1½ inches below the seed may supply all the recommended P2O5 and up to 150 lb K2O/a . For fertilizer placed directly with the seed, limit the amounts to 100 lb P2O5/a and 50 lb K2O/a . Plant-ing-time N is not necessary for legume seedings, but be sure to inoculate the seed with the appropriate strains of
Table 28. Phosphorus recommenda-tions for selected yields of alfalfa (mineral soils).
Yield (t/a) Soil test 4 6 8
ppm — lb P2O5/a —
5 152 178 200 10 127 153 179 15 102 128 154 20 77 103 129 25-40 52 78 104 45 26 39 52 50 0 0 0
Numbers highlighted are maintenance amounts .
Table 29. Phosphorus recom-mendations for selected yields of clover hay (mineral soils).
Yield (t/a)Soil test 3 6 ppm — lb P2O5/a —
5 105 135 10 80 110 15 55 85 20-35 30 60 40 15 30 45 0 0
Numbers highlighted are mainte-nance amounts .
Table 30. Phosphorus recom-mendations for selected yields of clover-grass hay (mineral soils).
Yield (t/a)Soil test 3 6 ppm — lb P2O5/a —
5 114 153 10 89 128 15 64 103 20-35 39 78 40 20 39 45 0 0
Numbers highlighted are mainte-nance amounts .

32
Nutrient Recommendations for Field Crops in Michigan
Table 31. Potassium recommendations for selected yields of alfalfa hay (mineral soils).
Soil 4 t/a 8 t/a test CEC 4 8 12 16 4 8 12 16
ppm — lb K2O/a — — lb K2O/a —
40 254 277 300 300 300 300 300 300 80 206 221 240 263 300 300 300 300 85 200 214 232 254 300 300 300 300 95 160 200 216 236 300 300 300 300 105 120 160 200 218 240 300 300 300 115 80 120 160 200 160 240 300 300 125 40 80 120 160 80 160 240 300 135 0 40 80 120 0 80 160 240
Numbers highlighted are maintenance amounts .Maximum annual recommendation is 300 lb K2O/a .
Table 32. Potassium recommendations for selected yields of clover and clover-grass hay (mineral soils).
Soil 3 t/a 6 t/a test CEC 4 8 12 16 4 8 12 16
ppm — lb K2O/a — — lb K2O/a —
40 174 197 224 255 294 300 300 300 80 126 141 160 183 246 261 280 300 85 120 134 152 174 240 254 272 294 95 120 120 136 156 240 240 256 276 105 120 120 120 138 240 240 240 258 115 120 120 120 120 240 240 240 240 125 60 120 120 120 120 240 240 240 135 0 60 120 120 0 120 240 240
Numbers highlighted are maintenance amounts .
Rhizobia before planting . Including 20 lb N/a in the broadcast or planting-time fertilizer may improve seedling establishment in cool soils but gener-ally provides little benefit .
Legumes are more difficult to establish when using a small grain as a nurse crop rather than by clear seeding, although frost seeding red clover can be done successfully . The small grain nurse crop is best harvested early as silage to reduce competition with the new legume seeding . The P and K fertilizer applied for the small grain is usually sufficient to carry the legume through the first season . If a cutting is taken off, apply amounts of
P2O5 and K2O equal to crop removal . Legumes remove large amounts of K2O (45 to 60 lb/ ton) from the soil . Weath-ering of the soil minerals releases potash in the soil over the winter . To minimize luxury consumption of K by alfalfa, it is best to wait and make the first applica-tion of K2O after the first cutting . To replace potassium removed by the crop, topdress K2O after the first and third or fourth cutting . Needed P can be applied along with the K2O when it is spread . On loamy sands and sands, where sig-nificant leaching may occur, do not ap-ply K2O in the late fall . It is suggested to limit single applications to no more than 200 lb K2O/a and yearly applications to 300 lb K2O/a .
Boron is needed annually on sandy soils (CEC < 8 .0) at a rate of 2 lb/a per year . Fine-textured soils can usually sup-ply adequate B, so B applications have seldom proven beneficial . Where B is needed, apply it in the topdress fertil-izer . Boron deficiency sometimes occurs during the growth period of the second or third cutting . When this occurs, spray the foliage with 0 .25 lb B/a .
Grass Hay or Pasture
The N recommendation for a grass hay and for an intensively grazed (rotational grazing) grass pasture is 160 to 200 lb N/a . Nitrogen should be applied in split applications of 40 to 50 lb N/a at green-up, June 1, August 1 and September 1 . Phosphorus and potassium recom-mendations are presented in Tables 33 and 34 for bromegrass . Phosphorus recommendations for other grasses are similar to those of bromegrass, but K recommendations are different because the various grasses take up different amounts of K . (See Table 3 .)
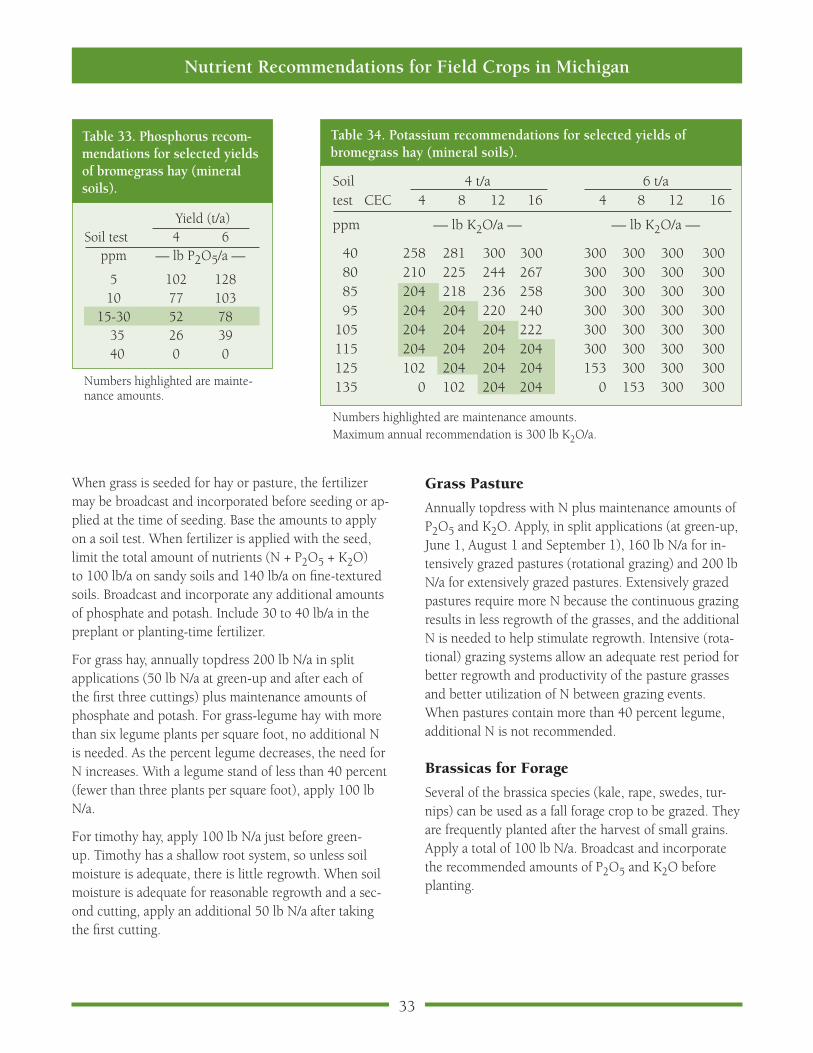
33
Nutrient Recommendations for Field Crops in Michigan
When grass is seeded for hay or pasture, the fertilizer may be broadcast and incorporated before seeding or ap-plied at the time of seeding . Base the amounts to apply on a soil test . When fertilizer is applied with the seed, limit the total amount of nutrients (N + P2O5 + K2O) to 100 lb/a on sandy soils and 140 lb/a on fine-textured soils . Broadcast and incorporate any additional amounts of phosphate and potash . Include 30 to 40 lb/a in the preplant or planting-time fertilizer .
For grass hay, annually topdress 200 lb N/a in split applications (50 lb N/a at green-up and after each of the first three cuttings) plus maintenance amounts of phosphate and potash . For grass-legume hay with more than six legume plants per square foot, no additional N is needed . As the percent legume decreases, the need for N increases . With a legume stand of less than 40 percent (fewer than three plants per square foot), apply 100 lb N/a .
For timothy hay, apply 100 lb N/a just before green-up . Timothy has a shallow root system, so unless soil moisture is adequate, there is little regrowth . When soil moisture is adequate for reasonable regrowth and a sec-ond cutting, apply an additional 50 lb N/a after taking the first cutting .
Table 33. Phosphorus recom-mendations for selected yields of bromegrass hay (mineral soils).
Yield (t/a)Soil test 4 6 ppm — lb P2O5/a —
5 102 128 10 77 103 15-30 52 78 35 26 39 40 0 0
Numbers highlighted are mainte-nance amounts .
Table 34. Potassium recommendations for selected yields of bromegrass hay (mineral soils).
Soil 4 t/a 6 t/a test CEC 4 8 12 16 4 8 12 16
ppm — lb K2O/a — — lb K2O/a —
40 258 281 300 300 300 300 300 300 80 210 225 244 267 300 300 300 300 85 204 218 236 258 300 300 300 300 95 204 204 220 240 300 300 300 300 105 204 204 204 222 300 300 300 300 115 204 204 204 204 300 300 300 300 125 102 204 204 204 153 300 300 300 135 0 102 204 204 0 153 300 300
Numbers highlighted are maintenance amounts .Maximum annual recommendation is 300 lb K2O/a .
Grass Pasture
Annually topdress with N plus maintenance amounts of P2O5 and K2O . Apply, in split applications (at green-up, June 1, August 1 and September 1), 160 lb N/a for in-tensively grazed pastures (rotational grazing) and 200 lb N/a for extensively grazed pastures . Extensively grazed pastures require more N because the continuous grazing results in less regrowth of the grasses, and the additional N is needed to help stimulate regrowth . Intensive (rota-tional) grazing systems allow an adequate rest period for better regrowth and productivity of the pasture grasses and better utilization of N between grazing events . When pastures contain more than 40 percent legume, additional N is not recommended .
Brassicas for Forage
Several of the brassica species (kale, rape, swedes, tur-nips) can be used as a fall forage crop to be grazed . They are frequently planted after the harvest of small grains . Apply a total of 100 lb N/a . Broadcast and incorporate the recommended amounts of P2O5 and K2O before planting .
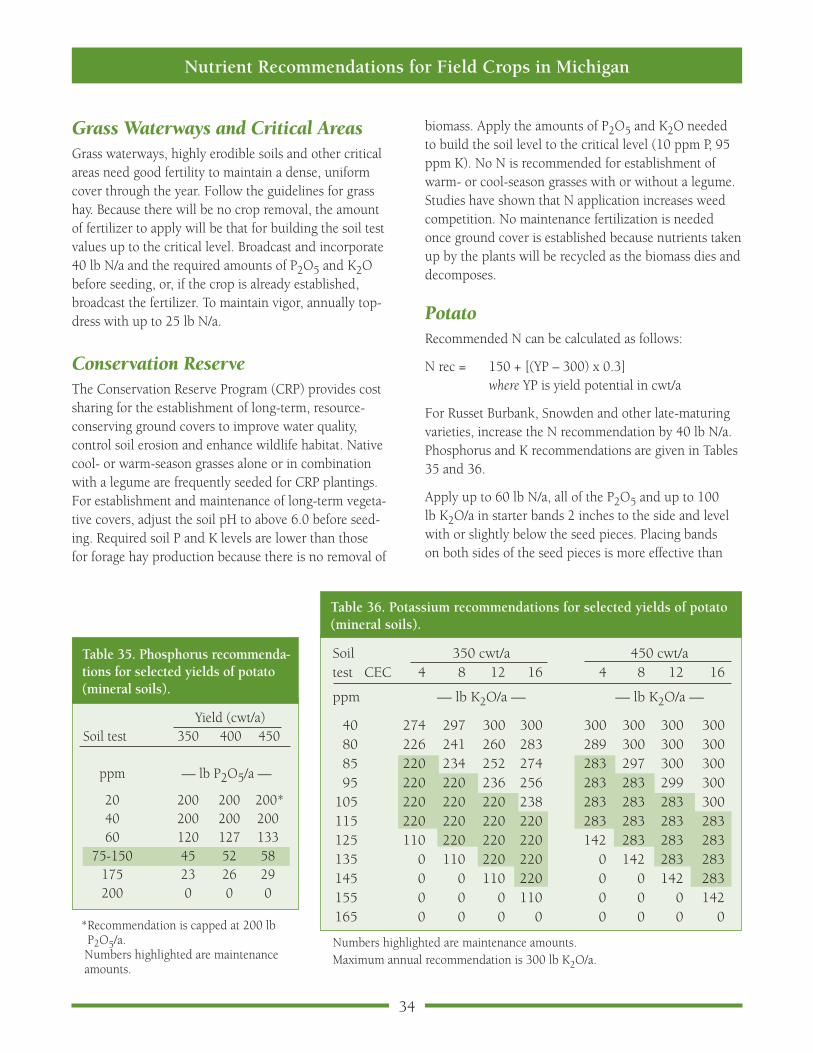
34
Nutrient Recommendations for Field Crops in Michigan
Grass Waterways and Critical AreasGrass waterways, highly erodible soils and other critical areas need good fertility to maintain a dense, uniform cover through the year . Follow the guidelines for grass hay . Because there will be no crop removal, the amount of fertilizer to apply will be that for building the soil test values up to the critical level . Broadcast and incorporate 40 lb N/a and the required amounts of P2O5 and K2O before seeding, or, if the crop is already established, broadcast the fertilizer . To maintain vigor, annually top-dress with up to 25 lb N/a .
Conservation Reserve The Conservation Reserve Program (CRP) provides cost sharing for the establishment of long-term, resource-conserving ground covers to improve water quality, control soil erosion and enhance wildlife habitat . Native cool- or warm-season grasses alone or in combination with a legume are frequently seeded for CRP plantings . For establishment and maintenance of long-term vegeta-tive covers, adjust the soil pH to above 6 .0 before seed-ing . Required soil P and K levels are lower than those for forage hay production because there is no removal of
biomass . Apply the amounts of P2O5 and K2O needed to build the soil level to the critical level (10 ppm P, 95 ppm K) . No N is recommended for establishment of warm- or cool-season grasses with or without a legume . Studies have shown that N application increases weed competition . No maintenance fertilization is needed once ground cover is established because nutrients taken up by the plants will be recycled as the biomass dies and decomposes .
PotatoRecommended N can be calculated as follows:
N rec = 150 + [(YP – 300) x 0 .3] where YP is yield potential in cwt/a
For Russet Burbank, Snowden and other late-maturing varieties, increase the N recommendation by 40 lb N/a . Phosphorus and K recommendations are given in Tables 35 and 36 .
Apply up to 60 lb N/a, all of the P2O5 and up to 100 lb K2O/a in starter bands 2 inches to the side and level with or slightly below the seed pieces . Placing bands on both sides of the seed pieces is more effective than
Table 36. Potassium recommendations for selected yields of potato(mineral soils).
Soil 350 cwt/a 450 cwt/a test CEC 4 8 12 16 4 8 12 16
ppm — lb K2O/a — — lb K2O/a —
40 274 297 300 300 300 300 300 300 80 226 241 260 283 289 300 300 300 85 220 234 252 274 283 297 300 300 95 220 220 236 256 283 283 299 300 105 220 220 220 238 283 283 283 300 115 220 220 220 220 283 283 283 283 125 110 220 220 220 142 283 283 283 135 0 110 220 220 0 142 283 283 145 0 0 110 220 0 0 142 283 155 0 0 0 110 0 0 0 142 165 0 0 0 0 0 0 0 0
Numbers highlighted are maintenance amounts .Maximum annual recommendation is 300 lb K2O/a .
Table 35. Phosphorus recommenda-tions for selected yields of potato (mineral soils).
Yield (cwt/a) Soil test 350 400 450 ppm — lb P2O5/a —
20 200 200 200* 40 200 200 200 60 120 127 133 75-150 45 52 58 175 23 26 29 200 0 0 0
* Recommendation is capped at 200 lb P2O5/a .
Numbers highlighted are maintenance amounts .
35
Nutrient Recommendations for Field Crops in Michigan
banding on just one side . Before planting, broadcast and incorporate needed K2O in excess of the amount applied in the fertilizer bands . Fall application of K on sandy and organic soils is not recommended because of the potential for leaching loss . Incorporating a legume cover crop or animal manure can significantly reduce the amount of supplemental N needed . Nitrogen broadcast before planting has an increased risk of loss by leaching . Nitrogen applied after planting is used more efficiently than N applied preplant . For best N management, sup-ply needed N through a combination of applications at planting time, hilling and topdressing, or through irriga-
tion . (For more information on nutrient management of potatoes, see MSU Extension bulletin E-2779 .) After harvest, establish a cover crop to take up any residual N and to protect against wind erosion .
Manganese may be needed when the soil pH is above 6 .5 on mineral soils and above 5 .8 on organic soils . Use a soil test to determine the amount of Mn needed . In-clude the required amount of Mn in the starter fertilizer and/or spray the foliage with 1 to 2 lb Mn/a at least twice during active growth . On organic soils, foliage applica-tion is essential .

MSU is an affirmative-action, equal-opportunity employer . Michigan State University Extension programs and materials are open to all without regard to race, color, national origin, gender, gender identity, religion, age, height, weight, disability, political beliefs, sexual orientation, marital status, family status or veteran status . Issued in furtherance of MSU Extension work, acts of May 8 and June 30, 1914, in cooperation with the U .S . Department of Agriculture . Thomas G . Coon, Direc-tor, MSU Extension, East Lansing, MI 48824 . This information is for educational purposes only . Reference to commercial products or trade names does not imply endorsement by MSU Extension or bias against those not mentioned .