nutrient uptake timing by crops to assist with fertilizing...
TRANSCRIPT
NutrientUptake Timing by Cropsby Clain Jones, Extension Soil Fertility Specialist/Assistant Professor,Kathrin Olson-Rutz, Research Associate, and Courtney Pariera Dinkins, former Research Associate,Department of Land Resources and Environmental Sciences
EB0191 reprinted October 2015
to assist with fertilizing decisions
INTRODUCTIONAll plants require the same mineral elements; however,
the quantity, rate and timing of uptake vary with crop, variety, climate, soil characteristics and management. These combined factors influence the nutritional need, nutrient content, and overall yield of a crop. When fertilizer prices represent a large portion of a producer’s costs, it is very important to maximize fertilizer nutrient use efficiency (the percentage of applied nutrient removed by the crop). Timing fertilizer applications so that nutrients are available when plants need them should increase nutrient use efficiency and reduce potential adverse environmental effects.
Plants require a balanced supply of nutrients throughout their development. Generally, they have accumulated most of their nutrients by sometime between flowering and ripening stages. Approximately 50 to 90 percent of N and P in the plant at flowering moves from the leaves and stem to the developing seed (1). Therefore, low nutrient uptake early in a plant’s growth lowers nutrient quantity for the seed, affecting both yield and quality.
Knowing how nutrient needs change during the growing season is essential for matching nutrient supply with plant needs, especially for producers who can apply nutrients in-season or for those considering controlled- and slow-release fertilizers. Because nutrient uptake varies among regions and growing seasons, the results presented in this guide should be considered as general guidelines only.
1
<24 DAE 28-42 DAE 42-63 DAE 63-84 DAE >84 DAE
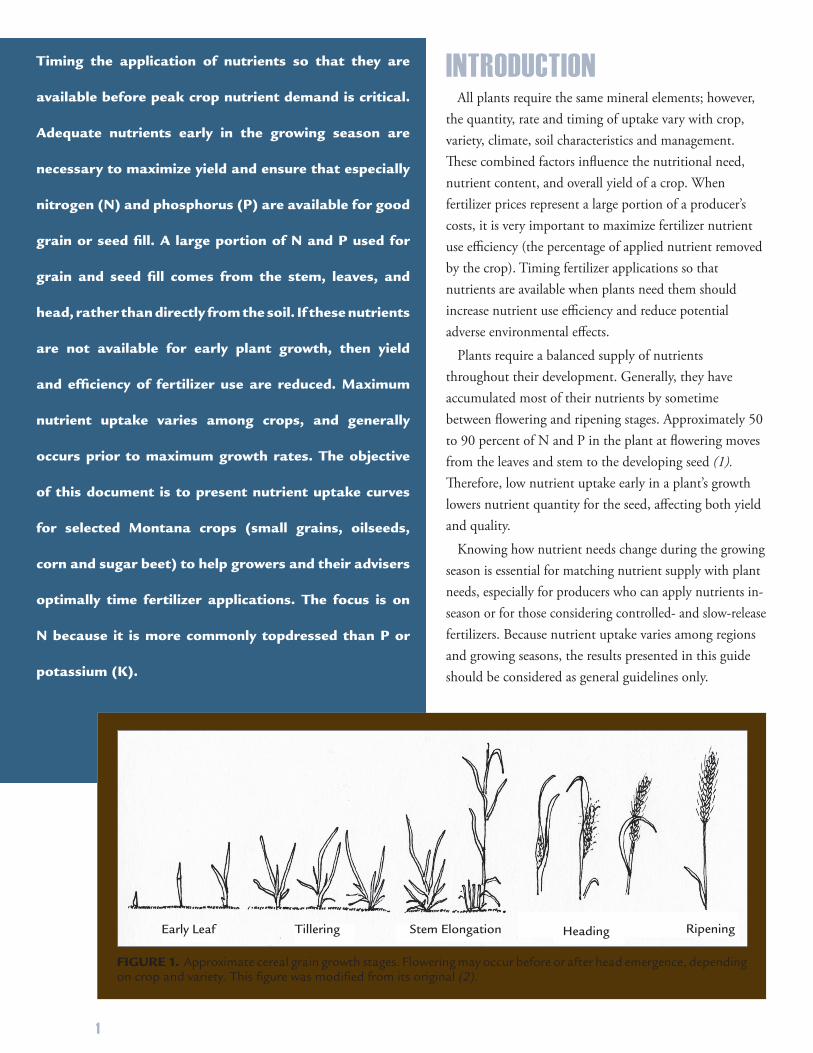
FIGURE 1. Approximate cereal grain growth stages. Flowering may occur before or after head emergence, depending on crop and variety. This figure was modified from its original (2).
Early Leaf Tillering Stem Elongation Heading Ripening
Timing the application of nutrients so that they are
available before peak crop nutrient demand is critical.
Adequate nutrients early in the growing season are
necessary to maximize yield and ensure that especially
nitrogen (N) and phosphorus (P) are available for good
grain or seed fill. A large portion of N and P used for
grain and seed fill comes from the stem, leaves, and
head, rather than directly from the soil. If these nutrients
are not available for early plant growth, then yield
and efficiency of fertilizer use are reduced. Maximum
nutrient uptake varies among crops, and generally
occurs prior to maximum growth rates. The objective
of this document is to present nutrient uptake curves
for selected Montana crops (small grains, oilseeds,
corn and sugar beet) to help growers and their advisers
optimally time fertilizer applications. The focus is on
N because it is more commonly topdressed than P or
potassium (K).
CROP GROWTHGROW TH STAGES Crop nutrient uptake rates are different at each growth stage, and crop growth rates vary with crop, variety, and growing conditions. Therefore, we encourage producers to base their in-season fertilizer management decisions on crop growth stage rather than time of year or an index of crop growth such as ‘Days After Emergence’.
For the purposes of this document, cereal grain plant growth is divided into five basic growth stages (early leaf, tillering, stem elongation, heading and ripening; Figure 1). Tillering refers to the development of small shoots coming from buds at the base of the plant. Heads begin to develop on each tiller even before the stem becomes visible between leaves (stem elongation). However, ‘heading’ begins when the seed head is pushed up through the last leaf and becomes visible. During ripening, lower leaves may die because nutrients stored in the lower leaves are moved to the grain.
Oilseed crop growth stages are divided into branching, bud formation, flowering and ripening. As an example, canola growth stages are illustrated and defined by the Canola Council of Canada (3). Corn growth stages are defined by leaf, tassel, silk and kernel development. They are illustrated and defined in a North Dakota State University publication (4).
NUTRIENT FUNCTIONS The three nutrients N, P, and K are classified as the ‘primary’ macronutrients because deficiencies of N, P and K are most common. Small amounts of N are important early for seedling vigor. However, high rates of N may damage seedlings and over-stimulate vegetative growth early in the season depleting soil moisture and depressing yields. Also, excess N may delay crop maturity. Phosphorus is necessary for energy storage and transfer and is essential for vigorous growth and seed development. It enhances crop maturity and quality, especially in grain crops. Potassium maintains water balance and therefore stalk strength. In addition, K promotes energy generation which is required for moving nutrients in the plant, N uptake and protein synthesis. Crops that are K deficient can have low total N uptake, yield, and protein.
2
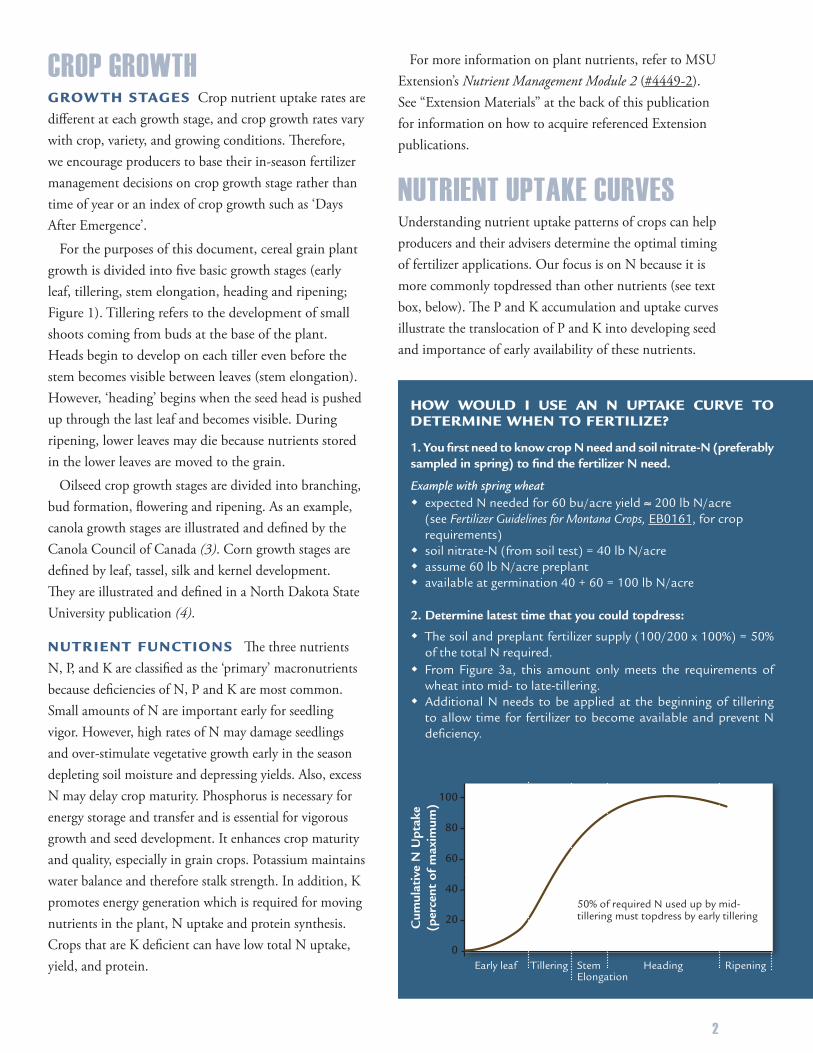
HOW WOULD I USE AN N UPTAKE CURVE TO DETERMINE WHEN TO FERTILIZE?
1. You first need to know crop N need and soil nitrate-N (preferably sampled in spring) to find the fertilizer N need.
Example with spring wheat w expected N needed for 60 bu/acre yield ≈ 200 lb N/acre
(see Fertilizer Guidelines for Montana Crops, EB0161, for crop requirements)
w soil nitrate-N (from soil test) = 40 lb N/acre w assume 60 lb N/acre preplant w available at germination 40 + 60 = 100 lb N/acre
2. Determine latest time that you could topdress:
w The soil and preplant fertilizer supply (100/200 x 100%) = 50% of the total N required.
w From Figure 3a, this amount only meets the requirements of wheat into mid- to late-tillering.
w Additional N needs to be applied at the beginning of tillering to allow time for fertilizer to become available and prevent N deficiency.
Heading Ripening
100
80
60
40
20
0
Cum
ulat
ive
N U
ptak
e(p
erce
nt o
f m
axim
um)
Early leaf Tillering StemElongation
50% of required N used up by mid-tillering must topdress by early tillering
For more information on plant nutrients, refer to MSU Extension’s Nutrient Management Module 2 (#4449-2). See “Extension Materials” at the back of this publication for information on how to acquire referenced Extension publications.
NUTRIENT UPTAKE CURVESUnderstanding nutrient uptake patterns of crops can help producers and their advisers determine the optimal timing of fertilizer applications. Our focus is on N because it is more commonly topdressed than other nutrients (see text box, below). The P and K accumulation and uptake curves illustrate the translocation of P and K into developing seed and importance of early availability of these nutrients.
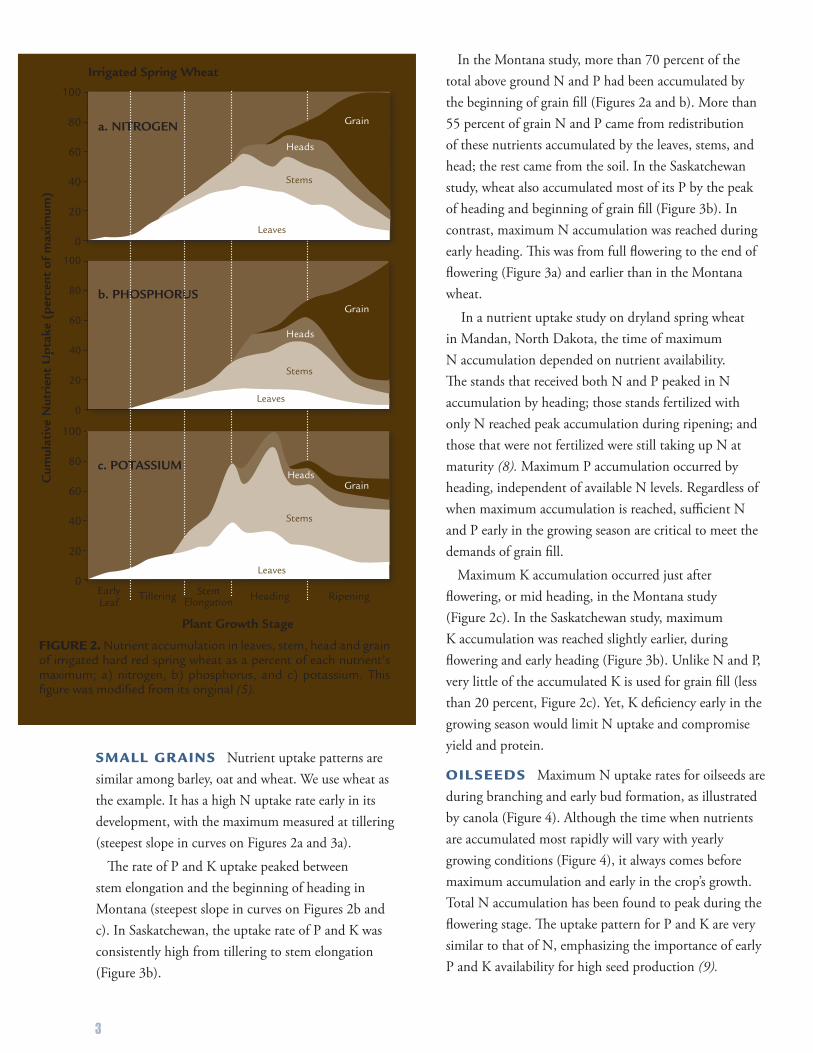
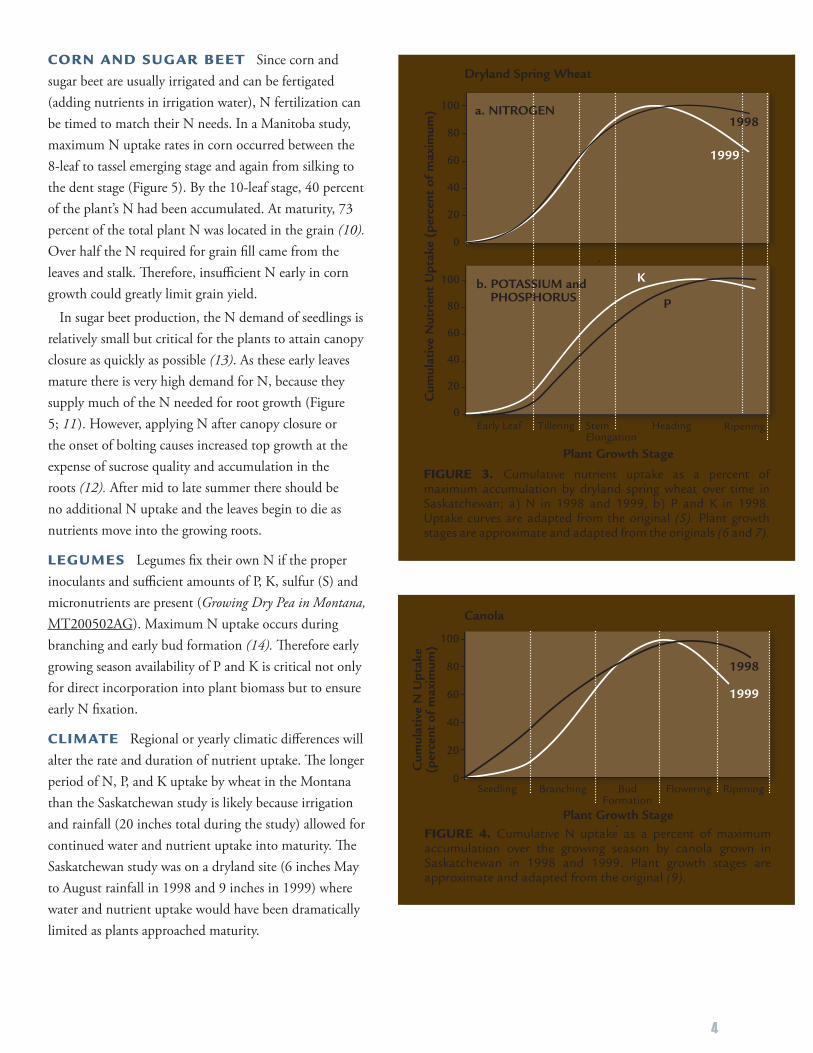
In the Montana study, more than 70 percent of the total above ground N and P had been accumulated by the beginning of grain fill (Figures 2a and b). More than 55 percent of grain N and P came from redistribution of these nutrients accumulated by the leaves, stems, and head; the rest came from the soil. In the Saskatchewan study, wheat also accumulated most of its P by the peak of heading and beginning of grain fill (Figure 3b). In contrast, maximum N accumulation was reached during early heading. This was from full flowering to the end of flowering (Figure 3a) and earlier than in the Montana wheat.
In a nutrient uptake study on dryland spring wheat in Mandan, North Dakota, the time of maximum N accumulation depended on nutrient availability. The stands that received both N and P peaked in N accumulation by heading; those stands fertilized with only N reached peak accumulation during ripening; and those that were not fertilized were still taking up N at maturity (8). Maximum P accumulation occurred by heading, independent of available N levels. Regardless of when maximum accumulation is reached, sufficient N and P early in the growing season are critical to meet the demands of grain fill.
Maximum K accumulation occurred just after flowering, or mid heading, in the Montana study (Figure 2c). In the Saskatchewan study, maximum K accumulation was reached slightly earlier, during flowering and early heading (Figure 3b). Unlike N and P, very little of the accumulated K is used for grain fill (less than 20 percent, Figure 2c). Yet, K deficiency early in the growing season would limit N uptake and compromise yield and protein.
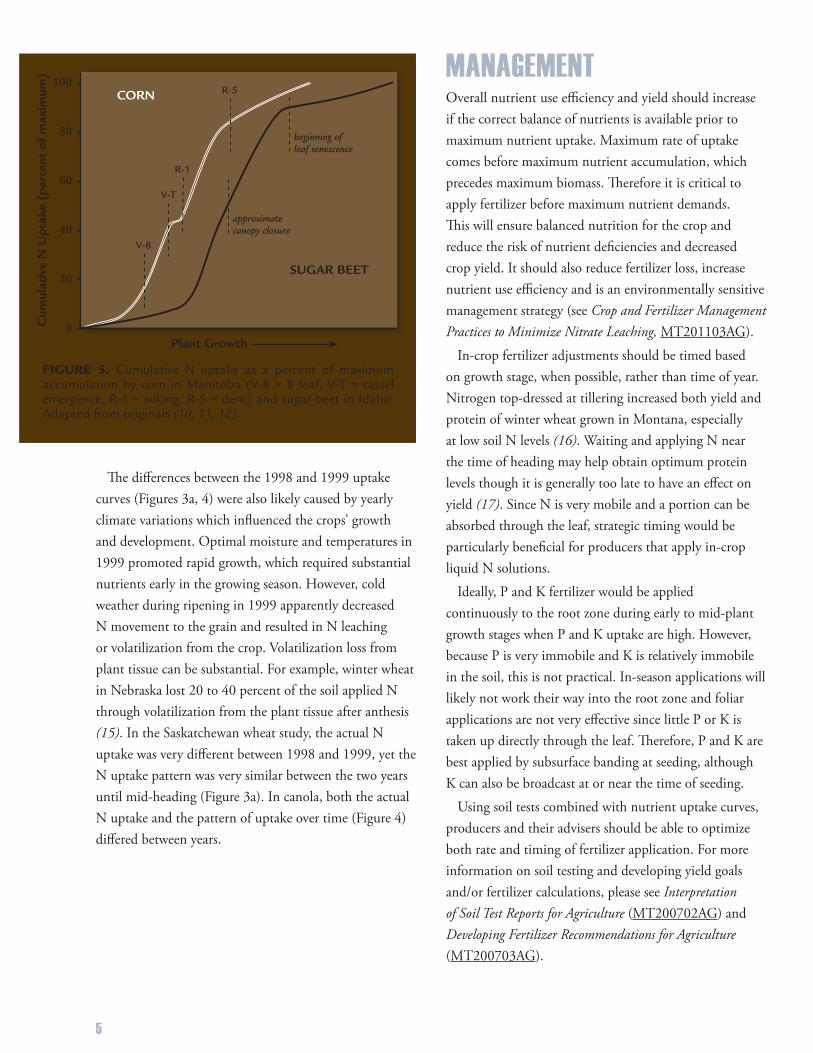
OILSEEDS Maximum N uptake rates for oilseeds are during branching and early bud formation, as illustrated by canola (Figure 4). Although the time when nutrients are accumulated most rapidly will vary with yearly growing conditions (Figure 4), it always comes before maximum accumulation and early in the crop’s growth. Total N accumulation has been found to peak during the flowering stage. The uptake pattern for P and K are very similar to that of N, emphasizing the importance of early P and K availability for high seed production (9).
SMALL GRAINS Nutrient uptake patterns are similar among barley, oat and wheat. We use wheat as the example. It has a high N uptake rate early in its development, with the maximum measured at tillering (steepest slope in curves on Figures 2a and 3a).
The rate of P and K uptake peaked between stem elongation and the beginning of heading in Montana (steepest slope in curves on Figures 2b and c). In Saskatchewan, the uptake rate of P and K was consistently high from tillering to stem elongation (Figure 3b).
3
Cum
ulat
ive
Nut
rien
t U
ptak
e (p
erce
nt o
f m
axim
um)
Plant Growth Stage
FIGURE 2. Nutrient accumulation in leaves, stem, head and grain of irrigated hard red spring wheat as a percent of each nutrient’s maximum; a) nitrogen, b) phosphorus, and c) potassium. This figure was modified from its original (5).
100
80
60
40
20
0
100
80
60
40
20
0
EarlyLeaf Tillering Stem
Elongation Heading Ripening
a. NITROGEN
b. PHOSPHORUS
100
80
60
40
20
0
GrainHeads
Leaves
Stems
c. POTASSIUM
Grain
Heads
Leaves
Stems
Heads
Grain
Leaves
Stems
Irrigated Spring Wheat
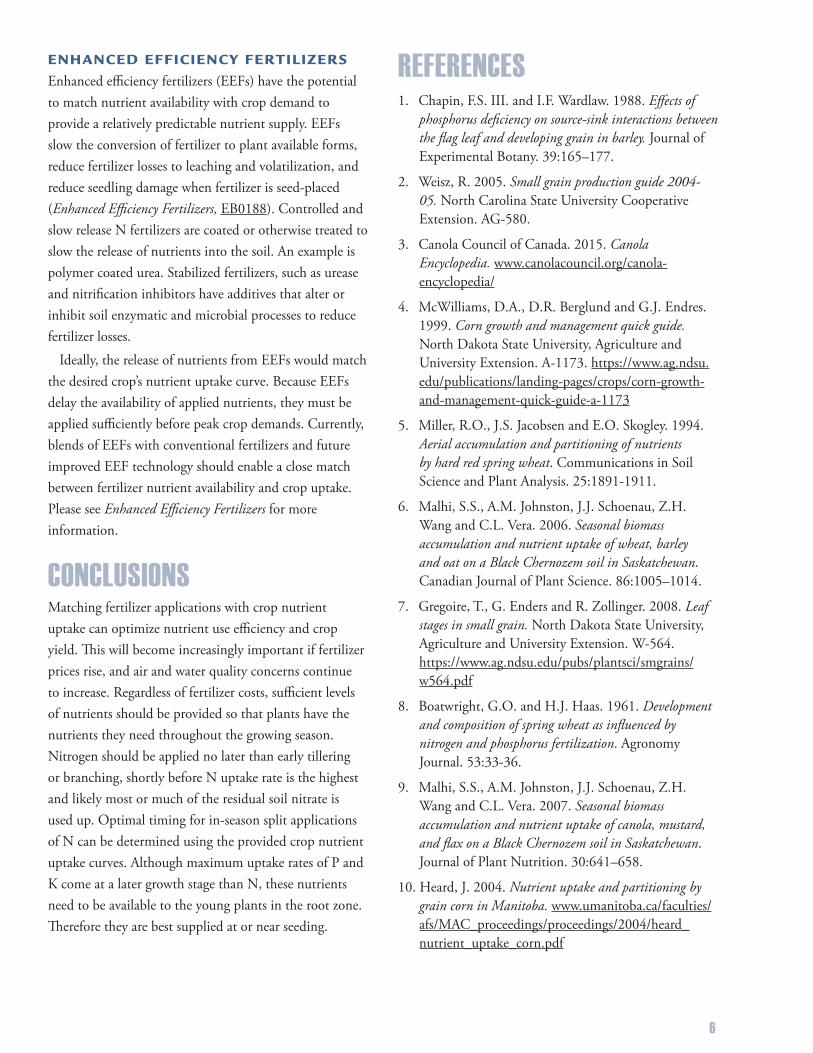
CORN AND SUGAR BEET Since corn and sugar beet are usually irrigated and can be fertigated (adding nutrients in irrigation water), N fertilization can be timed to match their N needs. In a Manitoba study, maximum N uptake rates in corn occurred between the 8-leaf to tassel emerging stage and again from silking to the dent stage (Figure 5). By the 10-leaf stage, 40 percent of the plant’s N had been accumulated. At maturity, 73 percent of the total plant N was located in the grain (10). Over half the N required for grain fill came from the leaves and stalk. Therefore, insufficient N early in corn growth could greatly limit grain yield.
In sugar beet production, the N demand of seedlings is relatively small but critical for the plants to attain canopy closure as quickly as possible (13). As these early leaves mature there is very high demand for N, because they supply much of the N needed for root growth (Figure 5; 11). However, applying N after canopy closure or the onset of bolting causes increased top growth at the expense of sucrose quality and accumulation in the roots (12). After mid to late summer there should be no additional N uptake and the leaves begin to die as nutrients move into the growing roots.
LEGUMES Legumes fix their own N if the proper inoculants and sufficient amounts of P, K, sulfur (S) and micronutrients are present (Growing Dry Pea in Montana, MT200502AG). Maximum N uptake occurs during branching and early bud formation (14). Therefore early growing season availability of P and K is critical not only for direct incorporation into plant biomass but to ensure early N fixation.
CLIMATE Regional or yearly climatic differences will alter the rate and duration of nutrient uptake. The longer period of N, P, and K uptake by wheat in the Montana than the Saskatchewan study is likely because irrigation and rainfall (20 inches total during the study) allowed for continued water and nutrient uptake into maturity. The Saskatchewan study was on a dryland site (6 inches May to August rainfall in 1998 and 9 inches in 1999) where water and nutrient uptake would have been dramatically limited as plants approached maturity.
4
FIGURE 4. Cumulative N uptake as a percent of maximum accumulation over the growing season by canola grown in Saskatchewan in 1998 and 1999. Plant growth stages are approximate and adapted from the original (9).
Plant Growth Stage
100
80
60
40
20
0
FIGURE 3. Cumulative nutrient uptake as a percent of maximum accumulation by dryland spring wheat over time in Saskatchewan; a) N in 1998 and 1999, b) P and K in 1998. Uptake curves are adapted from the original (5). Plant growth stages are approximate and adapted from the originals (6 and 7).
Plant Growth Stage
Cum
ulat
ive
Nut
rien
t U
ptak
e (p
erce
nt o
f m
axim
um)
TilleringEarly Leaf StemElongation
Heading Ripening
100
80
60
40
20
0C
umul
ativ
e N
Upt
ake
(per
cent
of
max
imum
)
100
80
60
40
20
0
1998
1999
Seedling Branching Bud Formation
RipeningFlowering
1999
a. NITROGEN1998
K
P
b. POTASSIUM and PHOSPHORUS
Dryland Spring Wheat
Canola
MANAGEMENTOverall nutrient use efficiency and yield should increase if the correct balance of nutrients is available prior to maximum nutrient uptake. Maximum rate of uptake comes before maximum nutrient accumulation, which precedes maximum biomass. Therefore it is critical to apply fertilizer before maximum nutrient demands. This will ensure balanced nutrition for the crop and reduce the risk of nutrient deficiencies and decreased crop yield. It should also reduce fertilizer loss, increase nutrient use efficiency and is an environmentally sensitive management strategy (see Crop and Fertilizer Management Practices to Minimize Nitrate Leaching, MT201103AG).
In-crop fertilizer adjustments should be timed based on growth stage, when possible, rather than time of year. Nitrogen top-dressed at tillering increased both yield and protein of winter wheat grown in Montana, especially at low soil N levels (16). Waiting and applying N near the time of heading may help obtain optimum protein levels though it is generally too late to have an effect on yield (17). Since N is very mobile and a portion can be absorbed through the leaf, strategic timing would be particularly beneficial for producers that apply in-crop liquid N solutions.
Ideally, P and K fertilizer would be applied continuously to the root zone during early to mid-plant growth stages when P and K uptake are high. However, because P is very immobile and K is relatively immobile in the soil, this is not practical. In-season applications will likely not work their way into the root zone and foliar applications are not very effective since little P or K is taken up directly through the leaf. Therefore, P and K are best applied by subsurface banding at seeding, although K can also be broadcast at or near the time of seeding.
Using soil tests combined with nutrient uptake curves, producers and their advisers should be able to optimize both rate and timing of fertilizer application. For more information on soil testing and developing yield goals and/or fertilizer calculations, please see Interpretation of Soil Test Reports for Agriculture (MT200702AG) and Developing Fertilizer Recommendations for Agriculture (MT200703AG).
The differences between the 1998 and 1999 uptake curves (Figures 3a, 4) were also likely caused by yearly climate variations which influenced the crops’ growth and development. Optimal moisture and temperatures in 1999 promoted rapid growth, which required substantial nutrients early in the growing season. However, cold weather during ripening in 1999 apparently decreased N movement to the grain and resulted in N leaching or volatilization from the crop. Volatilization loss from plant tissue can be substantial. For example, winter wheat in Nebraska lost 20 to 40 percent of the soil applied N through volatilization from the plant tissue after anthesis (15). In the Saskatchewan wheat study, the actual N uptake was very different between 1998 and 1999, yet the N uptake pattern was very similar between the two years until mid-heading (Figure 3a). In canola, both the actual N uptake and the pattern of uptake over time (Figure 4) differed between years.
5
FIGURE 5. Cumulative N uptake as a percent of maximum accumulation by corn in Manitoba (V-8 = 8 leaf, V-T = tassel emergence, R-1 = silking, R-5 = dent) and sugar beet in Idaho. Adapted from originals (10, 11, 12).
Cum
ulat
ive
N U
ptak
e (p
erce
nt o
f m
axim
um)
Plant Growth
100
80
60
40
20
0
CORN
SUGAR BEET
approximatecanopy closure
V-8
V-T
R-1
R-5
beginning ofleaf senescence
ENHANCED EFFICIENCY FERTILIZERS Enhanced efficiency fertilizers (EEFs) have the potential to match nutrient availability with crop demand to provide a relatively predictable nutrient supply. EEFs slow the conversion of fertilizer to plant available forms, reduce fertilizer losses to leaching and volatilization, and reduce seedling damage when fertilizer is seed-placed (Enhanced Efficiency Fertilizers, EB0188). Controlled and slow release N fertilizers are coated or otherwise treated to slow the release of nutrients into the soil. An example is polymer coated urea. Stabilized fertilizers, such as urease and nitrification inhibitors have additives that alter or inhibit soil enzymatic and microbial processes to reduce fertilizer losses.
Ideally, the release of nutrients from EEFs would match the desired crop’s nutrient uptake curve. Because EEFs delay the availability of applied nutrients, they must be applied sufficiently before peak crop demands. Currently, blends of EEFs with conventional fertilizers and future improved EEF technology should enable a close match between fertilizer nutrient availability and crop uptake. Please see Enhanced Efficiency Fertilizers for more information.
CONCLUSIONSMatching fertilizer applications with crop nutrient uptake can optimize nutrient use efficiency and crop yield. This will become increasingly important if fertilizer prices rise, and air and water quality concerns continue to increase. Regardless of fertilizer costs, sufficient levels of nutrients should be provided so that plants have the nutrients they need throughout the growing season. Nitrogen should be applied no later than early tillering or branching, shortly before N uptake rate is the highest and likely most or much of the residual soil nitrate is used up. Optimal timing for in-season split applications of N can be determined using the provided crop nutrient uptake curves. Although maximum uptake rates of P and K come at a later growth stage than N, these nutrients need to be available to the young plants in the root zone. Therefore they are best supplied at or near seeding.
REFERENCES1. Chapin, F.S. III. and I.F. Wardlaw. 1988. Effects of
phosphorus deficiency on source-sink interactions between the flag leaf and developing grain in barley. Journal of Experimental Botany. 39:165–177.
2. Weisz, R. 2005. Small grain production guide 2004-05. North Carolina State University Cooperative Extension. AG-580.
3. Canola Council of Canada. 2015. Canola Encyclopedia. www.canolacouncil.org/canola-encyclopedia/
4. McWilliams, D.A., D.R. Berglund and G.J. Endres. 1999. Corn growth and management quick guide. North Dakota State University, Agriculture and University Extension. A-1173. https://www.ag.ndsu.edu/publications/landing-pages/crops/corn-growth-and-management-quick-guide-a-1173
5. Miller, R.O., J.S. Jacobsen and E.O. Skogley. 1994. Aerial accumulation and partitioning of nutrients by hard red spring wheat. Communications in Soil Science and Plant Analysis. 25:1891-1911.
6. Malhi, S.S., A.M. Johnston, J.J. Schoenau, Z.H. Wang and C.L. Vera. 2006. Seasonal biomass accumulation and nutrient uptake of wheat, barley and oat on a Black Chernozem soil in Saskatchewan. Canadian Journal of Plant Science. 86:1005–1014.
7. Gregoire, T., G. Enders and R. Zollinger. 2008. Leaf stages in small grain. North Dakota State University, Agriculture and University Extension. W-564. https://www.ag.ndsu.edu/pubs/plantsci/smgrains/w564.pdf
8. Boatwright, G.O. and H.J. Haas. 1961. Development and composition of spring wheat as influenced by nitrogen and phosphorus fertilization. Agronomy Journal. 53:33-36.
9. Malhi, S.S., A.M. Johnston, J.J. Schoenau, Z.H. Wang and C.L. Vera. 2007. Seasonal biomass accumulation and nutrient uptake of canola, mustard, and flax on a Black Chernozem soil in Saskatchewan. Journal of Plant Nutrition. 30:641–658.
10. Heard, J. 2004. Nutrient uptake and partitioning by grain corn in Manitoba. www.umanitoba.ca/faculties/afs/MAC_proceedings/proceedings/2004/heard_nutrient_uptake_corn.pdf
6
11. Armstrong, M.J., G.F.J. Milford, T.O. Pocock, P.J. Last and W. Day. 1986. The dynamics of nitrogen uptake and its re-mobilization during the growth of sugar beet. Journal of Agricultural Science. 107:145-154.
12. Carter, J.N. and D.J. Traveller. 1981. Effect of time and amount of nitrogen uptake on sugarbeet growth and yield. Agronomy Journal. 73:665-671.
13. Draycott, A.P. and D.R. Christianson. 2003. Nutrients for Sugar Beet Production: Soil-Plant Relationships. CABI Publishing. 272.pp.
14. Malhi, S.S., A.M. Johnston, J.J. Schoenau, Z.H. Wang and C.L. Vera. 2007. Seasonal biomass accumulation and nutrient uptake of pea and lentil on a Black Chernozem soil in Saskatchewan. Journal of Plant Nutrition. 30:721-737.
15. Daigger, L.A., D.H. Sander and G.A. Peterson. 1976. Nitrogen content of winter wheat during growth and maturation. Agronomy Journal. 68:815-818.
16. Lorbeer, S.L., J. Jacobsen, P. Bruckner, D. Wichman and J. Berg. 2000. Capturing the Genetic Protein Potential in Winter Wheat. Fertilizer Fact No. 23. Montana State University Extension, Bozeman, Montana. http://landresources.montana.edu/fertilizerfacts/
17. Westcott, M., J. Eckhoff, R. Engel, J. Jacobsen, G. Jackson and B. Stougaard.1997. Grain Yield and Protein Response to Late-Season Nitrogen in Irrigated Spring Wheat. Fertilizer Fact No. 11. Montana State University Extension, Bozeman, Montana. http://landresources.montana.edu/fertilizerfacts/
EXTENSION MATERIALSThe following Extension publications can be found at http://landresources.montana.edu/soilfertility/publications.html
Crop and Fertilizer Practices to Minimize Nitrate Leaching (MT201103AG)
Developing Fertilizer Recommendations for Agriculture (MT200703AG)
Enhanced Efficiency Fertilizers (EB0188)
Fertilizer Guidelines for Montana Crops (EB0161)
Growing Dry Pea in Montana (MT200502AG)
Interpretation of Soil Test Reports (MT200702AG)
Nutrient Management Modules (#4449-1 to 4449-15) http://landresources.montana.edu/nm
ACKNOWLEDGEMENTSWe would like to extend our utmost appreciation to the following volunteer reviewers of this document:
- Bob Ullom, Wilbur-Ellis Co., Billings, Montana
- Jay Norton, Assistant Professor and Extension Soil Scientist, Univ. of Wyoming, Laramie, Wyoming
- Russ Miner, Wilbur-Ellis Co., Great Falls, Montana
- Shaun Casteel, Assistant Professor and Extension Agronomist of Soybean and Small Grains, Purdue University, West Lafayette, Indiana
- Steve Lackman, Yellowstone County Extension Agent, Billings, Montana
Copyright © 2015 MSU ExtensionWe encourage the use of this document for nonprofit educational purposes. This document may be reprinted for nonprofit educational purposes if no endorsement of a commercial product, service or company is stated or implied, and if appropriate credit is given to the author and MSU Extension. To use these documents in electronic formats, permission must be sought from the Extension Communications Coordinator, 135 Culbertson Hall, Montana State University, Bozeman MT 59717; E-mail: [email protected]
The U.S. Department of Agriculture (USDA), Montana State University and the Montana State University Extension prohibit discrimination in all of their programs and activities on the basis of race, color, national origin, gender, religion, age, disability, political beliefs, sexual orientation, and marital and family status. Issued in furtherance of cooperative extension work in agriculture and home economics, acts of May 8 and June 30, 1914, in cooperation with the U.S. Department of Agriculture, Jeff Bader, Director of Extension, Montana State University, Bozeman, MT 59717