better crops - soil 5813
TRANSCRIPT
BETTER CROPSWith Plant FoodA Publication of the International Plant Nutrition Institute (IPNI) 2012 Number 1
www.ipni.net
In This Issue...
...and much more
Nitrogen Fertilization of N-Stressed Soybean
2011 Science Award 2011 Photo Contest Results
Waxy (Fresh) Corn Fertilization for Soils of Southwest China
Influence of Cold Temperature on Ammonia Loss from Surface Applied Urea
Also:
Nutrient Management for High Citrus Yieldsin Tropical Soils
Page 4
Vol. XCVI (96) 2012, No. 1Our cover: Orange orchard at the Nossa Senhora Aparecida farm, located in Bebedouro, São Paulo, Brazil. Photo by Daniel dos Santos, Coopercitrus ArchiveEditor: Gavin D. SulewskiAssistant Editor: Danielle C. Edwards Circulation Manager: Carol Mees Design: Rob LeMaster
INTERNATIONAL PLANT NUTRITION INSTITUTE (IPNI) J. Felker, Chairman of the Board (K+S KALI GmbH) S.R. Wilson, Vice Chairman of the Board (CF Industries Holdings, Inc.) M. Ibnabdeljalil, Finance Committee Chair (OCP S.A.)HEADQUARTERS—Norcross, Georgia, USA T.L. Roberts, President S.J. Couch, Vice President, Administration B. Green, IT Manager W. Hollifield, Administrative Assistant B. Rose, Statistics/Accounting C.S. Snyder, Nitrogen Program Director, Conway, ArkansasASIA AND AFRICA GROUP—Saskatoon, Saskatchewan, Canada A.M. Johnston, Vice President, Asia and Africa Group L.M. Doell, Corporate Secretary and Administrative Assistant H.S. Khurana, International Agronomic and Technical Support Specialist Africa Program Shamie Zingore, Nairobi, Kenya, Director China Program Ji-yun Jin, Beijing, Director, and Northeast Region Ping He, Beijing, Deputy Director, Northcentral Region Shutian Li, Beijing, Deputy Director, Northwest Region Fang Chen, Wuhan, Deputy Director, Southeast Region Shihua Tu, Chengdu, Deputy Director, Southwest Region South Asia Program K. Majumdar, Gurgaon, Director, North & East Regions T. Satyanarayana, Secunderabad, Deputy Director, South Region Southeast Asia Program T. Oberthür, Penang, Malaysia, DirectorAMERICAS AND OCEANIA GROUP—Brookings, South Dakota P.E. Fixen, Senior Vice President, Americas and Oceania Group, and Director of Research P. Pates, Administrative Assistant North American Program—Directors T.W. Bruulsema, Guelph, Ontario–Northeast T.L. Jensen, Saskatoon, Saskatchewan–Northern Great Plains R.L Mikkelsen, Merced, California–Western T.S. Murrell, West Lafayette, Indiana–Northcentral S.B. Phillips, Owens Cross Roads, Alabama–Southeast W.M. Stewart, San Antonio, Texas–So. and Central Great Plains Australia & New Zealand R. Norton, Victoria, Australia, Director Brazil Program L.I. Prochnow, Piracicaba, Brazil, Director V. Casarin, Piracicaba, Brazil, Deputy Director Northern Latin America Program R. Jaramillo, Quito, Ecuador, Director Mexico and Central America A.S. Tasistro, Norcross, Georgia, Director Latin America-Southern Cone Program F.O. Garcia, Buenos Aires, Argentina, Director EASTERN EUROPE/CENTRAL ASIA AND MIDDLE EAST GROUP S. Ivanova, Vice President, Moscow, Russia V. Nosov, Moscow, Director, Southern and Eastern Russia M. Rusan, Middle East Consulting Director, Irbid, Jordan
BETTER CROPS WITH PLANT FOOD (ISSN:0006-0089) is published quarterly by the International Plant Nutrition Institute (IPNI). Periodicals postage paid at Norcross, GA, and at additional mailing offices (USPS 012-713). Subscriptions free on request to qualified individuals; others $8.00 per year or $2.00 per issue. Address changes may be e-mailed to: [email protected]
POSTMASTER: Send address changes to Better Crops with Plant Food, 3500 Parkway Lane, Suite 550, Norcross, GA 30092-2844. Phone (770) 447-0335; fax (770) 448-0439. Website: www.ipni.net. Copyright 2011 by International Plant Nutrition Institute.
Better Crops with Plant Food is registered in Canada Post.Publications mail agreement No. 40035026Return undeliverable Canadian addresses to: PO Box 2600 Mississauga ON L4T 0A9 Canada The Government of Saskatchewan helps make this publication possible through its resource tax funding. We thank them for their support of this important educational project.
C O N T E N T SBETTER CROPS with Plant Food
IPNI Members: Agrium Inc. • Arab Potash Company • Belarusian Potash Company • CF Industries Holdings, Inc. • Compass Minerals Specialty Fertilizers • OCP S.A. • Incitec Pivot • International Raw Materials LTD • Intrepid Potash, Inc. • K+S KALI GmbH • The Mosaic Company • PotashCorp • Simplot • Sinofert Holdings Limited • SQM • Uralkali • Vale Fertilizantes S.A. Affiliate Members: Arab Fertilizer Association (AFA) • Associação Nacional para Difusão de Adubos (ANDA)) • Canadian Fertilizer Institute (CFI) • Fertiliser Association of India (FAI) • International Fertilizer Industry Association (IFA) • International Potash Institute (IPI) • The Fertilizer Institute (TFI)
2011 IPNI Science Award Goes to Dr. Michael McLaughlin 3
IPNI Award Available to Scientists in 2012 3
Cold Temperatures Did Not Remove the Risk 9 of Ammonia Loss from Surface-Applied Urea Richard Engel, Clain Jones, and Tom Jensen
Increasing Use Efficiency of Nitrogenous 24 Fertilizers in Fish Ponds Amrita Thakur, Abira Banerjee, and G.N. Chattopadhyay
Balanced Fertilization Promoted Yield and 18 Quality of Waxy Maize in Chongqing Hongzhou He, Wei Li, and Shihua Tu
4R Nutrient Management Practices 20 for Potato Production in China Shutian Li and Jiyun Jin
4R Plant Nutrition Available this March 23
Mathematics and Calculations for Agronomists and 31Soil Scientists ...Available Soon in Metric!
Nutrient Management for High 4 Citrus Fruit Yield in Tropical Soils Dirceu Mattos Junior, José Antônio Quaggio, Heitor Cantarella,
Rodrigo Marcelli Boaretto, and Fernando César Bachiega Zambrosi
Eros Francisco (Brazil) and Sudarshan Dutta (South Asia) 8 to Join Staff of IPNI as Deputy Directors
11th International Conference on Precision Agriculture 7
Nitrogen Fertilization of Nitrogen-Stressed Soybeans 14 Dave Mengel, Dorivar Ruiz-Diaz, Ray Asebedo, and Tom Maxwell
Patterns of Nutrient Accumulation in 'Hass' Avocado Fruit 12 Richard Rosecrance, Ben Faber, and Carol Lovatt
Note to Readers: Articles which appear in this issue of Better Crops with Plant Food can be found at: >www.ipni.net/bettercrops<www.ipni.net/news.rss
@PlantNutritionPlantNutritionInst
Winners of IPNI 2011 Crop Nutrient Deficiency Photo Contest 16
Sulfur Effects on Cotton Yield Components 27 X.H. Yin, C.O. Gwathmey, and C.L. Main
The Agronomy Age 32 Dr. Paul E. Fixen
Foliar Potassium Nitrate Application for Paddy Rice 29 Tran Thuc Son, Le Xuan Anh, Yoav Ronen, and Harmen Tjalling Holwerda
Better C
rops/Vol. 96 (2012, No. 1)
3
2011 IPNI Science Award Goes to Dr. Michael McLaughlin of CSRIO
The International Plant Nutrition Institute (IPNI) has named Dr. Michael J. McLaughlin of The University of Adelaide and the Commonwealth Scientific and In-
dustrial Research Organisation (CSIRO), as the winner of the 2011 IPNI Science Award. He receives a special plaque plus a monetary award of USD 5,000.00 (five thousand dollars).
“We are honored to announce Dr. McLaughlin as the recipi-ent of the IPNI Science Award. It is evident from his accom-plishments that Mike is highly suited to receive this award,” said Dr. Terry L. Roberts, President of IPNI. “His internation-ally recognized contributions to improved nutrient management and production agriculture through advancements in fertilizer chemistry, crop nutrition, and environmental protection are truly excellent. His career marks numerous breakthroughs in improved environmental assessment and management, the development of new fertilizer delivery systems, and a greater understanding of the interactions of nutrients and the environ-ment.”
Dr. Roberts also acknowledged the other outstanding nominees for the award, and encouraged future nominations of qualified scientists. Private or public sector agronomists, soil scientists, and crop scientists from all countries are eligible for nomination. This is the fifth year the IPNI Science Award has been presented. The previous recipient in 2010 was Dr. Andrew Sharpley of the University of Arkansas.
Born in Ballymena, Northern Ireland, Dr. McLaughlin received his B.Sc. degree from the University of Ulster, UK in 1977. He went on to earn his M. Agr. Sc. degree from the University of Reading, UK in 1979. Dr. McLaughlin then re-ceived his Ph.D. from the University of Adelaide in 1986 on the subject of P cycling in soils and the relative importance of crop residues and fertilizer to the P nutrition of cereal crops.
Since 2007, Dr. McLaughlin has been Foundation Direc-tor, University of Adelaide Fertiliser Technology Research Centre supported by The Mosaic Company and the Australian Grain Research and Development Corporation. In 2005, Dr. McLaughlin became Professor in Soil Science at the Univer-sity’s School of Agriculture, Food and Wine and since 2000, he has been Chief Research Scientist, CSIRO Land and Water, Adelaide. From 1999 to 2003, Dr. McLaughlin was Senior Prin-cipal Research Scientist, CSIRO Land and Water, Adelaide. Dr. McLaughlin is a Fellow of the American Society of America
(ASA) and Soil Science Society of America (SSSA), and is a Fel-low of the Australian Academy of Technological Sciences and Engineering. Dr. McLaughlin is also CSIRO Science Fellow in the Environmental Biogeo-chemistry Program, CSIRO Land and Water, as well as the Science Fellow, CSIRO Agri-cultural Sustainability Flagship. His awards and honors include Australian Soil Science Society Prescott Medal in 2009, 2008 Fluid Fertilizer Foundation Researcher of the Year, 2008 Soil Science Society of America International Award, 2005 CSIRO Land and Water Partnership Excellence Award, and the 2002 CSIRO Land and Water Chief’s Award for excellence in research.
Dr. McLaughlin has published 28 book chapters, 184 jour-nal papers, 52 refereed full conference papers, 262 conference abstracts, and over 120 other industry reports and publications. He holds 8 patents and since 1989 has won research grants valued at AUD 23.5 million. Dr. McLaughlin has supervised 20 Ph.D. Students and is actively involved with honors stu-dents in areas of biogeochemistry, fertilizer formulation, and environmental contamination. Dr. McLaughlin and his research group have been instrumental in developing and understanding of the mechanisms behind the effectiveness of fluid fertilizers in low rainfall cropping systems. As Foundation Director of the Fertilizer Technology Research Centre, Dr. McLaughlin is presently heading the development of leading edge fertilizer technologies to match nutrient supply to crop demand and iden-tify new efficient fertilizer formulations, making extensive use of nanotechnology, and advanced tracing and imaging techniques to probe reactions of fertilizers with soils. Dr. McLaughlin has contributed greatly to the body of scientific work published on cadmium, heavy metal contamination in soils, and has di-rectly influenced national and international public policy on developing science-based strategies for minimizing metals in the environment. BC
Dr. Michael J. McLaughlin
IPNI Science Award is Available to Scientists in 2012
Each year, IPNI offers the IPNI Science Award to recognize and promote distinguished contributions by scientists. The Award is intended to recognize outstanding achieve-ments in research, extension, or education, with focus on efficient management of plant
nutrients and their positive interaction in fully integrated crop production that enhances yield potential. Such systems improve net returns, lower unit costs of production, and maintain or improve environmental quality.
The Award requires that a nomination form (no self-nomination) and supporting letters be received at IPNI Headquarters by September 30, 2012. The recipient is selected by a commit-tee of noted international authorities. More information about past winners of this award, plus details on qualifications and requirements are available from the headquarters or regional offices of IPNI, or can be found at the IPNI website: >www.ipni.net/awards<. BC
4
Bet
ter
Cro
ps/V
ol. 9
6 (2
012,
No.
1)
Common abbreviations and notes: N = nitrogen; P = phosphorus; K = potassium; S = sulfur; Ca = calcium; Mg = magnesium; B = boron; Cu = copper; Fe = iron; Mn = manganese; Zn = zinc; Mo = molybdenum; Al = aluminum.
BRAZIL
Citrus fertilizer recommendations in Brazil largely began as adaptations of scientific information and fertilizer recommendations available in Florida and California.
However, inherent differences between varieties and soils (i.e. acidic, low fertility, high P fixation) all pointed to the need for a regionally-adapted approach.
Since the 1980s, the Instituto Agronômico of Campinas (IAC) has worked to develop methods for simultaneously ex-tracting P, Ca, Mg, and K. Extensive research on liming and fertilization has demonstrated the importance of correcting soil acidity. Subsequent work revealed the critical importance of Ca and Mg in tropical soils and their effects on citrus production and fruit quality (Quaggio et al., 1992a, b). Calibration curves for P and K have allowed estimation of concentrations of soil nutrients, above which no increase in fruit yield is expected (Quaggio et al., 1996, 1998). Mathematical models fitted to these data, allowed the concept of economy to be introduced to the fertilizer recommendations, considering soil and leaf analysis as criteria for assessing soil N availability, and fruit yield as an index of nutritional balance in citrus orchards (Can-tarella et al., 1992). Scientific contributions on the effects of fertilization on fruit quality have been incorporated into these recommendations (Quaggio et al., 2005). More recently, with the significant increase in the area of citrus production under irrigation, studies on the efficiency of fertigated systems in tropical soils have also been developed.
Soil Analysis GuidelinesGuidelines for the interpretation of soil macro- and micro-
nutrients fertility specific to citrus are provided in Tables 1 and 2. As a general recommendation, citrus growers should maintain soil levels for nutrients and base saturation within the adequate ranges, thus preventing deficiencies or excesses, since both limit the productivity and quality of fruits.
Leaf Analysis GuidelinesCitrus stores significant amounts of nutrients in tree bio-
mass, part of which is available to be redistributed mainly to developing organs such as leaves and fruits (Mattos Jr. et al., 2003b). For this reason, leaf analysis is a useful tool to complement the analysis of soil fertility and also to assess the nutritional balance of citrus plants. Moreover, in the case of N, where methods of soil analysis lack consistency in diagnosis, citrus leaf N analysis has been used as a criterion for evaluat-ing its availability (Quaggio et al., 1998).
Guidelines used for interpretation of leaf analysis are provided in Table 3. Orchard fertilization programs should
By Dirceu Mattos Junior, José Antônio Quaggio, Heitor Cantarella, Rodrigo Marcelli Boaretto, and Fernando César Bachiega Zambrosi
Current recommendations for nutrient management of citrus in tropical conditions are summarized based on the use of soil and leaf analyses, fruit yield, and characteristics of tree varieties commercially grown in Brazil.
Nutrient Management for High Citrus Fruit Yield in Tropical Soils
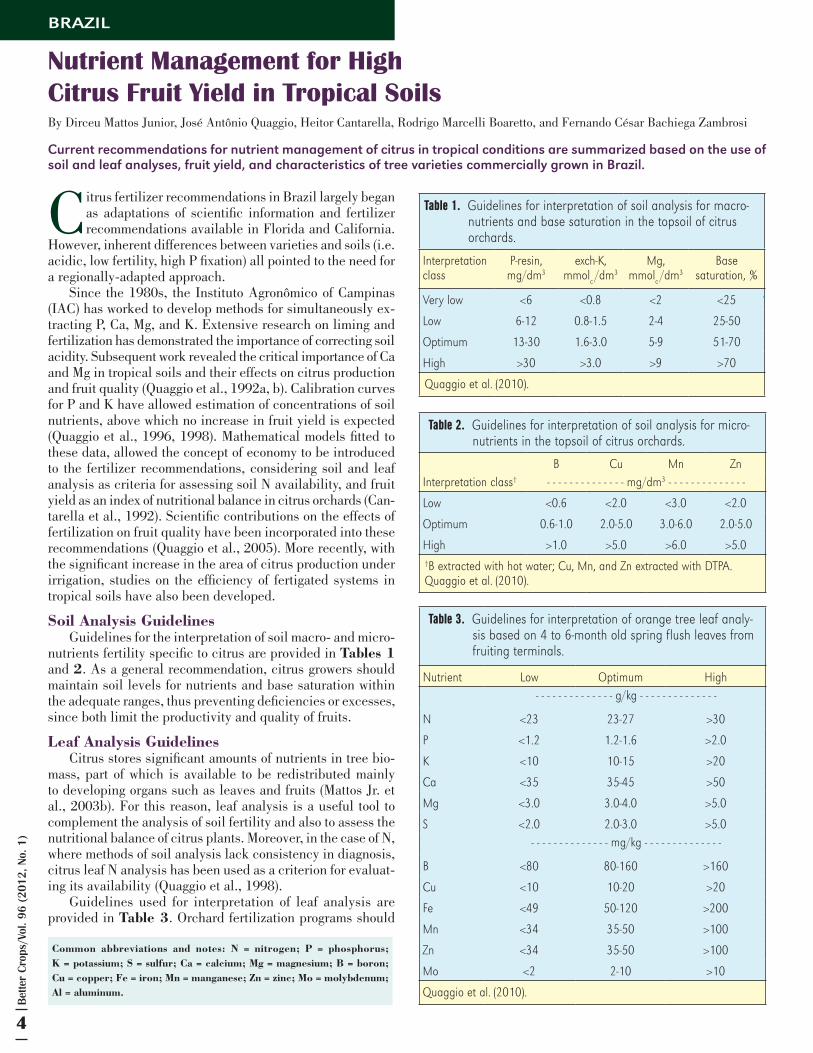
Table 1. Guidelines for interpretation of soil analysis for macro-nutrients and base saturation in the topsoil of citrus orchards.
Interpretationclass
P-resin,mg/dm3
exch-K,mmolc /dm3
Mg,mmolc /dm3
Basesaturation, %
Very low <6 <0.8 <2 <25
Low 6-12 0.8-1.5 2-4 25-50
Optimum 13-30 1.6-3.0 5-9 51-70
High >30 >3.0 >9 >70
Quaggio et al. (2010).
Table 2. Guidelines for interpretation of soil analysis for micro-nutrients in the topsoil of citrus orchards.
Interpretation class†
B Cu Mn Zn- - - - - - - - - - - - - - mg/dm3 - - - - - - - - - - - - - -
Low <0.6 <2.0 <3.0 <2.0
Optimum 0.6-1.0 2.0-5.0 3.0-6.0 2.0-5.0
High >1.0 >5.0 >6.0 >5.0†B extracted with hot water; Cu, Mn, and Zn extracted with DTPA.Quaggio et al. (2010).
Table 3. Guidelines for interpretation of orange tree leaf analy-sis based on 4 to 6-month old spring flush leaves from fruiting terminals.
Nutrient Low Optimum High - - - - - - - - - - - - - - g/kg - - - - - - - - - - - - - -
N <23 23-27 >30
P <1.2 1.2-1.6 >2.0
K <10 10-15 >20
Ca <35 35-45 >50
Mg <3.0 3.0-4.0 >5.0
S <2.0 2.0-3.0 >5.0 - - - - - - - - - - - - - - mg/kg - - - - - - - - - - - - - -
B <80 80-160 >160
Cu <10 10-20 >20
Fe <49 50-120 >200
Mn <34 35-50 >100
Zn <34 35-50 >100
Mo <2 2-10 >10
Quaggio et al. (2010).

Better C
rops/Vol. 96 (2012, No. 1)
5
also be adjusted so that the leaf nutrient concentrations are maintained within the optimum range.
Soil LimingSoil acidity is recognized as a major factor of low crop yields
due to Al toxicity, Mn toxicity in some species, low levels of Ca and Mg, and for reducing the availability of other nutri-ents such as P. The main causes of soil acidification of citrus orchards in the tropics include continued use of acidifying N fertilizers, the use of fertigation, and pest control largely based on forms of elemental S.
Much of the response of citrus to lime is due to the high demand of Ca by trees (Mattos Jr. et al., 2003b). Citrus also demand significant amounts of Mg commonly supplied as dolomitic limestone. The need for lime is calculated based on an established calibration curve. The goal is to raise the base saturation (V) to 70% in the topsoil (0 to 20 cm depth), deter-mined at pH 5.5 (CaCl
2 0.01 mol/L) (Quaggio et al., 1992b). It
is also recommended to manage lime application so levels of Mg in the soil are raised and maintained to a minimum of 5, or ideally 9 mmol
c/dm3 (Quaggio et al., 1992a). The calculation
of lime requirement is made by the following formula:
Lime (t/ha) = CEC (BS2 - BS1)/10 ECCE where:
CEC = Soil cation exchange capacity, mmolc/dm3;
BS1 = Current soil base saturation (%), 0 to 20 cm depth
layer; BS
2 = Soil base saturation recommended for citrus, equal to
70%, and ECCE = Effective Calcium Carbonate Equivalent (%) based on the combined effect of chemical purity and fineness of grind of limestone applied.
The evaluation of soil acidity should be a routine practice within the management program of an orchard. Fertilizers in citrus are generally applied in bands that extend from under the tree to a just beyond the tree line. Thus the application of lime should also be applied in larger amounts in these locations.
Fertilizer ApplicationThe recommendations of N, P and K fertilizer rates vary
with orchard age (i.e. planting, young trees <5-years-old, and
mature trees), citrus fruit type, rootstock, and the quality and market destination of the fruit (i.e. fresh or industrial). Leaf N content has proven to be a good indicator to recommend N fertilizer rates (Figure 1). Orange and mandarin response to N fertilization is lowest for foliar N concentrations above 2.8% (Quaggio et al., 1998; Mattos Jr. et al., 2004).
Since citrus trees store a large amount of N that can be easily redistributed to developing organs such as leaves and fruit, a reduction of the N fertilization may not affect fruit yield immediately. However, when leaf N levels are below those recommended, trees may suffer from gradual reduction in growth, which consequently will lead to losses in fruit produc-tion in subsequent years. The lack of N, or excess, affects size and quality of fruits (Quaggio et al., 2006a). High doses of N increase the number of fruits on the tree at the expense of fruit size. Fertilization with K also affects the size of the fruit, but excessive amounts can cause production losses largely due to an imbalance created with leaf Ca and Mg (Mattos Jr. et al., 2004). Furthermore, management of N fertilizers is important to ensure its efficient use in the production system. Urea, the most common source of N in Brazil, is subject to higher losses through volatilization of ammonia (NH
3) if no incorporation
(mechanical or irrigation/rainfall) occurs. Volatilization losses may vary from 15 to 45% of N applied to the soil surface (Can-tarella et al., 2003; Mattos Jr. et al., 2003b).
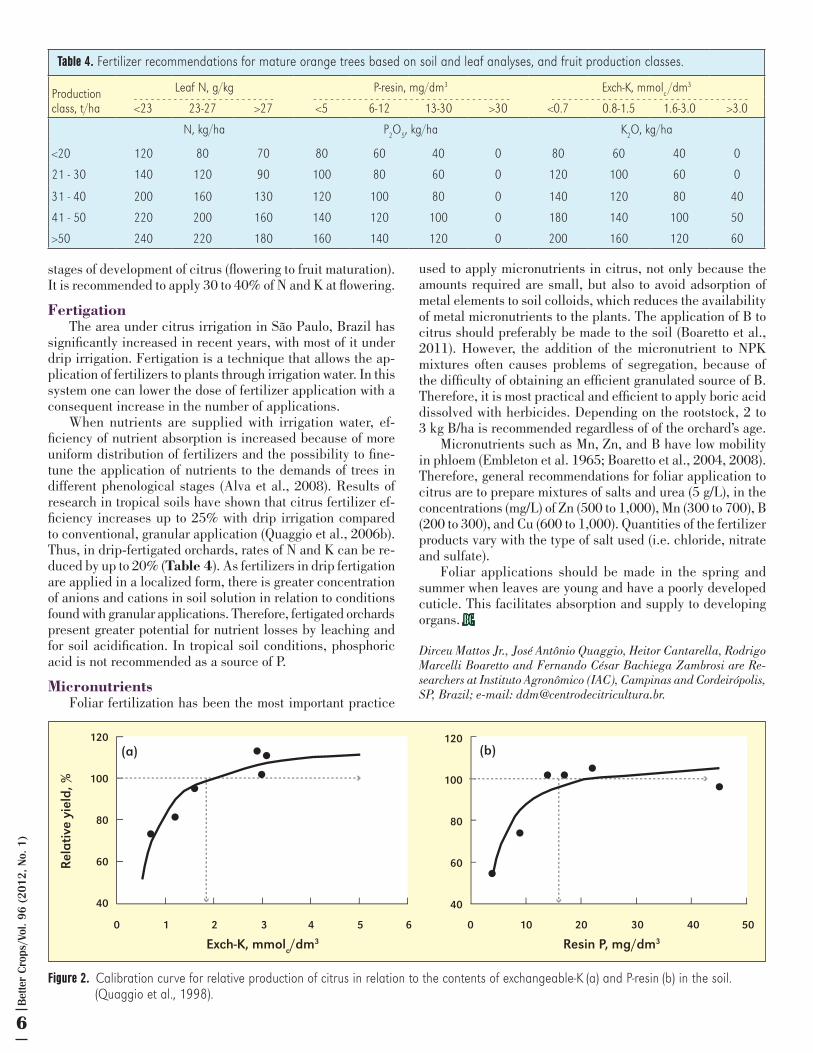
For P and K, calibrations of soil analysis based on extrac-tion of nutrients with ion exchange resins are provided in Figure 2. The critical level for soil K availability is similar to that used for annual crops (2.0 mmol
c/dm3), but for P the
critical level for citrus is lower (18 to 20 mg/dm3).Fertilization of mature orange orchards should be con-
ducted in the rainy season based on the recommendation guidelines presented in Table 4, because the demand for nutrients for citrus is highest in early spring, when vegetative growth is more intense, and extends until early fall, when nutrient reserves in the trees must be maximum to ensure optimum flowering and fruit set (Bustan and Goldschmidt, 1998). The application of N and K in 3 or 4 splits during the year increases fertilizer efficiency by reducing losses of soil nutrients with water drainage, which occurs mainly in sandy soils, and favors proper timing of nutrient supply at different
Figure 1. Response of citrus fruit yield in relation to leaf N content (Quaggio et al., 1998).
Rel
ativ
e yi
eld,
%
Leaf N, %
120
100
80
60
40
2.2 2.4 2.6 2.8
Brazil is the world leader in the production of citrus, with an annual volume of 18 to 20 million t of fruit, or 20% of the world’s total.
6
Bet
ter
Cro
ps/V
ol. 9
6 (2
012,
No.
1)
stages of development of citrus (flowering to fruit maturation). It is recommended to apply 30 to 40% of N and K at flowering.
FertigationThe area under citrus irrigation in São Paulo, Brazil has
significantly increased in recent years, with most of it under drip irrigation. Fertigation is a technique that allows the ap-plication of fertilizers to plants through irrigation water. In this system one can lower the dose of fertilizer application with a consequent increase in the number of applications.
When nutrients are supplied with irrigation water, ef-ficiency of nutrient absorption is increased because of more uniform distribution of fertilizers and the possibility to fine-tune the application of nutrients to the demands of trees in different phenological stages (Alva et al., 2008). Results of research in tropical soils have shown that citrus fertilizer ef-ficiency increases up to 25% with drip irrigation compared to conventional, granular application (Quaggio et al., 2006b). Thus, in drip-fertigated orchards, rates of N and K can be re-duced by up to 20% (Table 4). As fertilizers in drip fertigation are applied in a localized form, there is greater concentration of anions and cations in soil solution in relation to conditions found with granular applications. Therefore, fertigated orchards present greater potential for nutrient losses by leaching and for soil acidification. In tropical soil conditions, phosphoric acid is not recommended as a source of P.
MicronutrientsFoliar fertilization has been the most important practice
used to apply micronutrients in citrus, not only because the amounts required are small, but also to avoid adsorption of metal elements to soil colloids, which reduces the availability of metal micronutrients to the plants. The application of B to citrus should preferably be made to the soil (Boaretto et al., 2011). However, the addition of the micronutrient to NPK mixtures often causes problems of segregation, because of the difficulty of obtaining an efficient granulated source of B. Therefore, it is most practical and efficient to apply boric acid dissolved with herbicides. Depending on the rootstock, 2 to 3 kg B/ha is recommended regardless of of the orchard’s age.
Micronutrients such as Mn, Zn, and B have low mobility in phloem (Embleton et al. 1965; Boaretto et al., 2004, 2008). Therefore, general recommendations for foliar application to citrus are to prepare mixtures of salts and urea (5 g/L), in the concentrations (mg/L) of Zn (500 to 1,000), Mn (300 to 700), B (200 to 300), and Cu (600 to 1,000). Quantities of the fertilizer products vary with the type of salt used (i.e. chloride, nitrate and sulfate).
Foliar applications should be made in the spring and summer when leaves are young and have a poorly developed cuticle. This facilitates absorption and supply to developing organs. BC
Dirceu Mattos Jr., José Antônio Quaggio, Heitor Cantarella, Rodrigo Marcelli Boaretto and Fernando César Bachiega Zambrosi are Re-searchers at Instituto Agronômico (IAC), Campinas and Cordeirópolis, SP, Brazil; e-mail: [email protected].
Rel
ativ
e yi
eld,
%
Exch-K, mmolc/dm3
120
100
80
60
40
0 1 2 3 4 5 6
120
100
80
60
40
Resin P, mg/dm3
0 10 20 30 40 50
(a) (b)
Figure 2. Calibration curve for relative production of citrus in relation to the contents of exchangeable-K (a) and P-resin (b) in the soil. (Quaggio et al., 1998).
Table 4. Fertilizer recommendations for mature orange trees based on soil and leaf analyses, and fruit production classes.
Production class, t/ha
Leaf N, g/kg P-resin, mg/dm3 Exch-K, mmolc /dm3
<23 23-27 >27 <5 6-12 13-30 >30 <0.7 0.8-1.5 1.6-3.0 >3.0
N, kg/ha P2O5, kg/ha K2O, kg/ha
<20 120 80 70 80 60 40 0 80 60 40 0
21 - 30 140 120 90 100 80 60 0 120 100 60 0
31 - 40 200 160 130 120 100 80 0 140 120 80 40
41 - 50 220 200 160 140 120 100 0 180 140 100 50
>50 240 220 180 160 140 120 0 200 160 120 60
- - - - - - - - - - - - - - - - - - - - - - - - - - - - - - - - - - - - - - - - - - - - - - - - - - - - - - - - - - - - - - - - - - - - - - - - - - - - - - - - - - - - - - - - - - - - - - -
Better C
rops/Vol. 96 (2012, No. 1)
7
This article was originally published in the IPNI Brazil news-letter “Informações Agronômicas”. The article was adapted and translated to Better Crops by Dr. Dirceu Mattos Junior, Researcher at Instituto Agronômico (IAC) and Dr. Luís I. Prochnow, IPNI Brazil Program Director.
ReferencesAlva, A.K., D. Mattos Jr., and J.A. Quaggio. 2008. Journal of Crop Improve-
ment, v. 22, p.121-146. Boaretto, A.E., R.M. Boaretto, T.L.M. Contin, and T. Muraoka. 2004. Laranja,
v.25, p.195-208.Boaretto, A.E., R.M. Boaretto, T. Muraoka, V.F. Nascimento Filho, C.S. Tiritan,
and F.A.A. Mourão Filho. 2002. Acta Hort., v.594, p.203-209.Boaretto, R.M., J.A. Quaggio, D. Mattos Jr., T. Muraoka, and A.E. Boaretto.
2011. Journal of Plant Nutrition, v.34, p.839-849. Boaretto, R.M., J.A. Quaggio, F.A.A. Mourão Filho, M.F. Giné, and A.E. Boaret-
to. 2008. Comm. in Soil Science and Plant Analysis, v.39, p.2501-2514. Bustan, A. and E.E. Goldschmidt. 1998. Plant Cell and Environment, v. 21,
p.217-224. Cantarella, H., D. Mattos Jr., J.A. Quaggio, and A.T. Rigolin. 2003. Nutrient
Cycling Agroecosystems, v.67, p.1-9.Cantarella, H., J.A. Quaggio, O.C. Bataglia, and B. van Raij. 1992. In: Interna-
tional Citrus Congress, Acireale, 1992. Proc. Acireale: International Society of Citriculture. v.2, p.607-612.
Embleton, T.W, E.F. Wallihan, and G.E. Goodall. 1965. Proc. Am. Soc. Hort. Sci., v.86, p.253-259.
Mattos Jr, D., J.A. Quaggio, and H. Cantarella. 2003a. Scientia Agricola, v.60, p. 155-160.
Mattos Jr., D., D.A.Graetz, and A.K. Alva. 2003b. Soil Sci. Soc. Am. J., v.67, p.555-563.
Mattos Jr., D., J.A. Quaggio, H. Cantarella, and S.A. Carvalho. 2004. Rev. Bras. Fruticultura, v.26, p.164-167.
Quaggio, J.A., D. Mattos Jr., and R.M. Boaretto. 2010. In Citros, L.I. Prochnow, V. Casarin, S.R., Stipp, (eds). pp. 371-409. Piracicaba, São Paulo: IPNI, v.3.
Quaggio, J.A. H. Cantarella, and B. van Raij. 1998. Nutrient Cycling in Agro-ecosystems, v.52, p.67-74.
Quaggio, J.A., D. Mattos Jr., and H. Cantarella. 2006a. Fruits, v. 61, p. 1-10.Quaggio, J.A., G.O. Silva, T.R. Souza, D. Mattos Jr., and Y. Krontal. 2006b. In:
XXVII Reunião Brasileira de Fertilidade do solo e Nutrição de Plantas - FERTBIO, Bonito, MS.
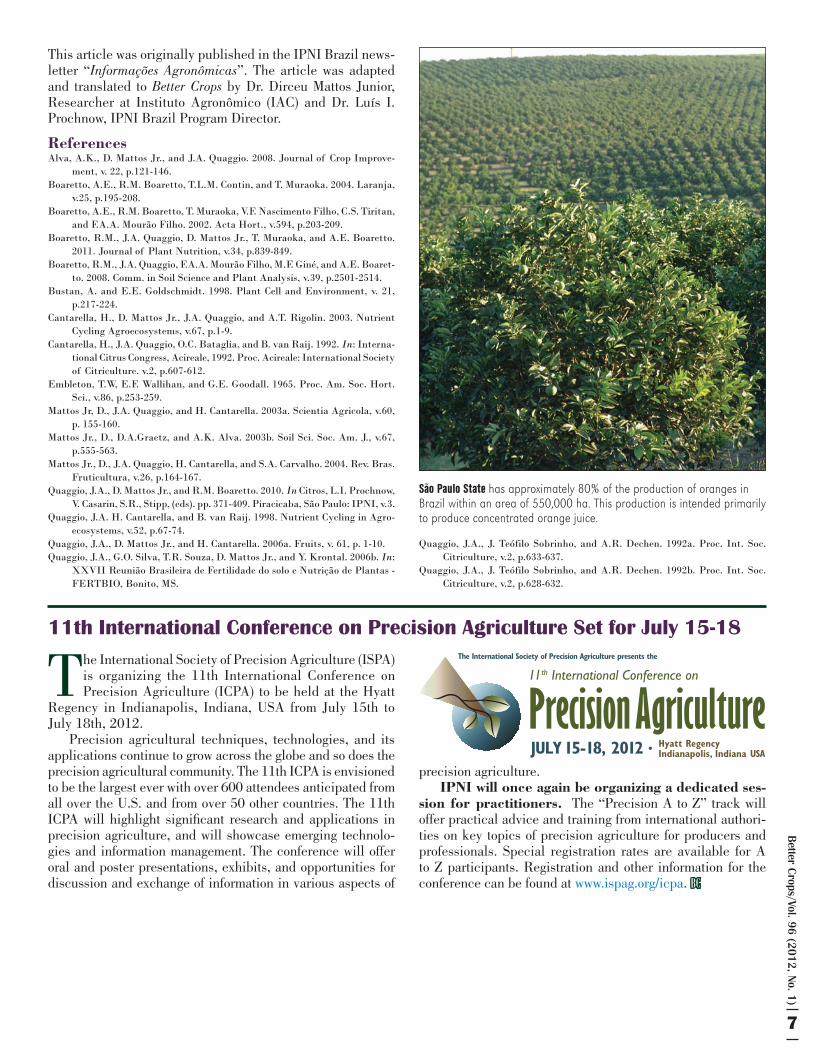
São Paulo State has approximately 80% of the production of oranges in Brazil within an area of 550,000 ha. This production is intended primarily to produce concentrated orange juice.
Quaggio, J.A., J. Teófilo Sobrinho, and A.R. Dechen. 1992a. Proc. Int. Soc. Citriculture, v.2, p.633-637.
Quaggio, J.A., J. Teófilo Sobrinho, and A.R. Dechen. 1992b. Proc. Int. Soc. Citriculture, v.2, p.628-632.
The International Society of Precision Agriculture (ISPA) is organizing the 11th International Conference on Precision Agriculture (ICPA) to be held at the Hyatt
Regency in Indianapolis, Indiana, USA from July 15th to July 18th, 2012.
Precision agricultural techniques, technologies, and its applications continue to grow across the globe and so does the precision agricultural community. The 11th ICPA is envisioned to be the largest ever with over 600 attendees anticipated from all over the U.S. and from over 50 other countries. The 11th ICPA will highlight significant research and applications in precision agriculture, and will showcase emerging technolo-gies and information management. The conference will offer oral and poster presentations, exhibits, and opportunities for discussion and exchange of information in various aspects of
11th International Conference on Precision Agriculture Set for July 15-18
precision agriculture. IPNI will once again be organizing a dedicated ses-
sion for practitioners. The “Precision A to Z” track will offer practical advice and training from international authori-ties on key topics of precision agriculture for producers and professionals. Special registration rates are available for A to Z participants. Registration and other information for the conference can be found at www.ispag.org/icpa. BC
8
Bet
ter
Cro
ps/V
ol. 9
6 (2
012,
No.
1)
Eros Francisco (Brazil) and Sudarshan Dutta (South Asia) to Join Staff of IPNI as Deputy Directors
The International Plant Nutrition Institute (IPNI) is pleased to announce the addition of two new scientific staff to existing regional programs.
Dr. Eros A.B. Francisco is joining as Deputy Director for the Brazil Program, where he will be located in Rondonópolis, Mato Grosso, and will have primary responsibility for the mid-west region of the Cerrado as of April 1, 2012.
“This announcement marks a significant milestone for our organization as we place our third scientific staff member within the Brazil Program,” said IPNI President Dr. Terry Roberts. “Our Board of Directors strongly supports the expansion of our presence in Brazil and Dr. Francisco’s appointment within the heart of the Cerrado will accomplish much to support our goal of sustained improvement in nutrient use in Brazil.”
Dr. Francisco, a native of Rondonópolis, received his B.Sc. (1999) and M.Sc. (2003) from the University of São Paulo. His Ph.D. was completed in 2006 from the Department of Soil and Plant Nutrition, University of São Paulo, where he examined the potential for aluminum phosphates as an alternative source of P to rice.
On completion of his Ph.D., Dr. Francisco worked with the National Institute for Colonization and Land Reform, providing technical support to farmers related to crop production. He has held teaching positions both as Professor of Agronomy at the Superior College Union of Rondonópolis, as well as Profes-sor of Soil Conservation and Fertility, Pasture Management, and Experimental Techniques with Animals at the Exact and Natural Sciences Institute, Federal University of Mato Grosso.
Most recently, Dr. Francisco has been Research Coordina-tor for the Fertilization Monitoring Program, and Leader of the Applied Research Program, at the Mato Grosso Research Foun-dation. Selected highlights from this current research program include: evaluating the effect of crop rotation on yield, crop management, nutrient cycling, and soil physiochemical proper-ties, in no-till grain and fiber cropping systems; optimal N, P, and K fertilization for cotton under ultra narrow rows; long-term evaluation of N rate and “ecological intensification” concepts for maize; and testing agronomic efficiency of fertilizers treated with polymers for slow release, ammonia volatilization inhibi-tors, nitrification inhibitors, and elemental S.
Dr. Francisco’s highly applied field research program has allowed him to become a valued extension resource to farmers and has produced numerous publications within peer-reviewed journals and books.
Dr. Sudarshan Dutta is joining IPNI as Deputy Director for the South Asia Program. Based in Kolkata, West Bengal, Dr. Dutta will be responsible for the East Zone of the South Asia Program. Starting May 1, 2012, his region will cover the Indian states of Chhattisgarh, Jharkhand, Bihar, West Bengal, Assam, Arunachal Pradesh, Nagaland, Manipur, Mizoram, Tripura, Meghalaya, Sikkim, as well as Bangladesh. Dr. Dutta is filling the Deputy Director position that was vacated by Dr. Harmandeep Singh Khurana, who is now the International
Agronomic and Technical Support Specialist based in the IPNI Canada office located in Saskatoon, Canada.
“Dr. Dutta is a valuable addition to our scientific staff, and IPNI will benefit greatly from his strong training in soil chem-istry and environmental assessment,” said IPNI President Dr. Terry Roberts. “We welcome Sudarshan to our staff as we are confident he will make an outstanding contribution towards our Program goals for South Asia.”
Dr. Dutta received his B.Sc. in Soil Science in 2003 from the State Agricultural University (Bidhan Chandra Krishi Viswavidyalaya), in West Bengal. He completed his M.Sc. in 2005 from Punjab Agricultural University, where he examined sorption and desorption behaviors of lead in different soils of India. Dr. Dutta obtained his Ph.D. in 2011 from the University of Delaware. His dissertation title was “Transport of free and conjugated estrogens in runoff from agricultural soils receiv-ing poultry manure: A field and watershed scale evaluation.”
Since his completion of his Ph.D., Dr. Dutta continued his work at the University of Delaware as a Post Doctoral Research Associate within the Watershed Hydrochemistry group where he has made a significant contribution to the understanding of the fate and transport of nutrients (nitrogen and phosphorus), trace elements (arsenic, copper, and zinc), and emerging con-taminants including steroidal hormones, antibiotics, and their degraded byproducts within different runoff components of agricultural watersheds. Dr. Dutta’s research has also involved quantifying exports of dissolved organic matter from the Fair Hill Natural Resource Management Area (NRMA)—a forested watershed in Maryland.
His research has generated a number of peer-reviewed journal articles and guest lecture invitations at the undergradu-ate and graduate student level. Dr. Dutta’s research interest for South Asia include the implementation of regionally ap-propriate management practices supportive of 4R Nutrient Stewardship, soil conservation, and sustainable agricultural. BC
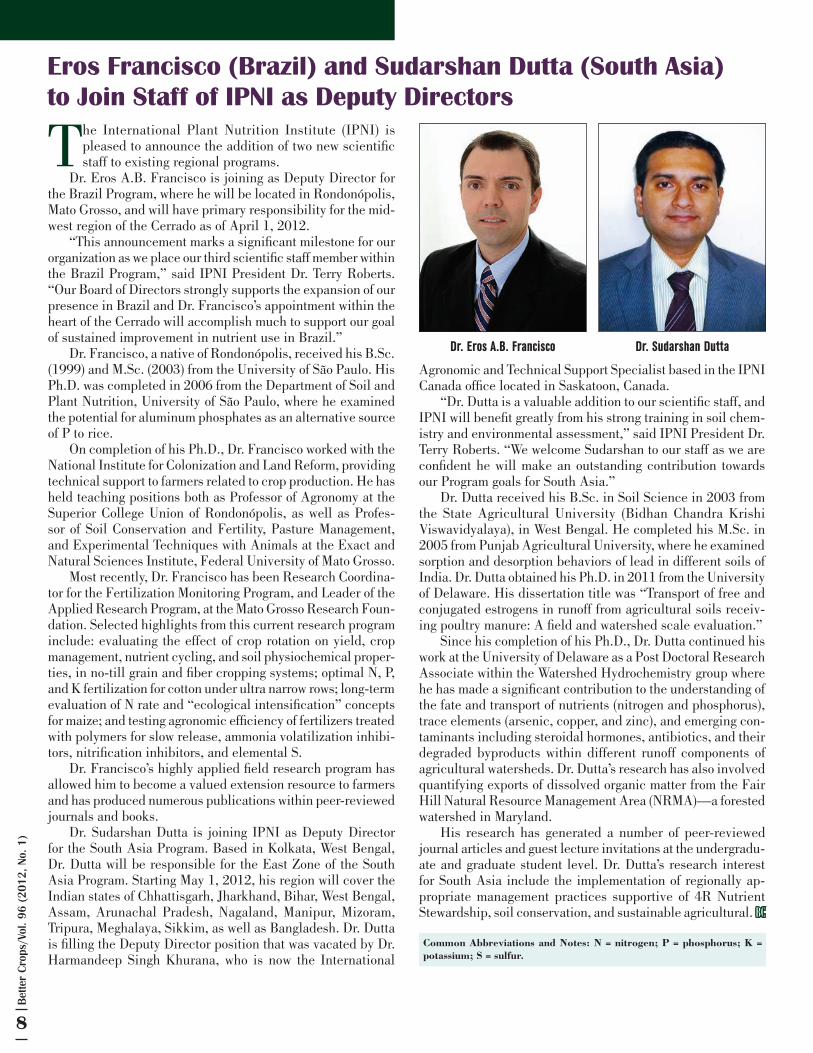
Dr. Eros A.B. Francisco Dr. Sudarshan Dutta
Common Abbreviations and Notes: N = nitrogen; P = phosphorus; K = potassium; S = sulfur.
Better C
rops/Vol. 96 (2012, No. 1)
9
Common abbreviations and notes: N = nitrogen; NH3 = ammonia; NH4+ =
ammonium; NO3- = nitrate; NBPT = N- (n-butyl) thiophosphoric triamide;
θv = volumetric soil water content
NORTHERN GREAT PLAINS
Surface application of N fertilizer, in particular urea, is a common management practice for dryland producers growing winter wheat in Montana and other portions of
the semiarid northern Great Plains. Seeding usually occurs in mid- to late-September depending on weather conditions, then N is broadcast applied during the late fall, or winter if the snowpack is shallow (e.g. ≤ 15 cm ), or early spring as long as fields will allow spreading equipment to drive on the surface without causing ruts. This is usually on cold soils (e.g. < 5°C or 41°F) that are either dry at the surface, frozen, or covered with a modest snowpack as described above. The practice of fertilizing fields in a separate operation is done primarily to ex-pedite seeding operations. Although most modern air-seeders, are capable of side-banding N fertilizer below the soil surface where it is less susceptible to volatilization, many Great Plains growers will not utilize this practice as it slows planting opera-tions. This is significant because individual farmers may need to seed 1,000 ha, or more, of winter wheat over a short interval of time resulting in considerable time constraints. In addition, warmer soil conditions at seeding allow the urea to be hydro-lyzed and the resulting NH
4+ converted to NO
3- during the fall.
The resulting NO3- is susceptible to denitrification if saturated
soil conditions occur at snowmelt the following spring.Volatilization risks associated with surface-applied urea
have been assumed to be minimal if applications were made during cold weather conditions. This opinion is founded, in part, on research and extension literature that often character-izes NH
3 losses or risks as being greater at warm temperatures,
and by inference, small at cold temperatures. Numerous studies have investigated and reported on NH
3 volatilization
from surface-applied urea; however, we know of no study that has specifically targeted its measurement from cold soil with temperatures < 5˚C. In 2008 we began a study that focused on quantifying NH
3 losses
from surface-applications of urea and NBPT-coated urea performed during late-fall to early spring. The purpose of this article is to share a portion of the results obtained from this project. Ammonia volatil-ization losses were quan-tified using a microme-teorological mass-balance approach with circular plots (40 m dia.), a center
mast, and samplers (Leuning et al., 1985) that provided for continuous measurement of NH
3 losses. In all trials urea was
surface broadcast applied to wheat fields at rate of 100 kg N/ha. Urea was treated with NBPT (1 g/kg) using a liquid Agrotain™ formulation. Ammonia losses were followed over 8 to 10 wks by exchanging the samplers approximately once per week (see Engel et al., 2011 for details on gas sampling methodology and NH
3 loss calculations).
Ammonia Losses from UreaUrea was surface applied to soils with temperatures < 5°C
in eight campaigns. The total cumulative NH3 loss, expressed
as a percentage of the applied N rate (100 kg N/ha), averaged 26.3% for these trials but was quite variable among sites (Table 1). The largest cumulative NH
3 loss, 44.1% of the ap-
plied N, occurred during Campaign 10, which was conducted on a Brocko silt loam (pH 8.4) soil. The total cumulative NH
3
loss exceeded 30% of the applied N in three trials conducted on acidic soils, including Telstad–Joplin loam (pH 5.5, Cam-paigns 3 and 4), and Phillips–Elloam clay loam (pH 6.4, Campaign 5). A commonality of all large NH
3 loss campaigns
(> 30% of applied N) was that fertilizer applications were made to a high-water-content soil surface that resulted in the dissolution of urea granules. Precipitation events that followed were ≤ 5 mm and scattered at least through the first 30 d after fertilization. Conversely, comparatively small NH
3 losses (i.e.
< 10% of applied N) were observed during Campaigns 1 and 11. These trials were characterized by urea applications to dry
By Richard Engel, Clain Jones, and Tom Jensen
New field research in Montana found greater than expected NH3 losses from surface-
applied urea following applications to cold soil with temperature < 5°C (41°F), including soils covered with a modest snowpack.
Cold Temperatures Did Not Remove the Risk of Ammonia Loss from Surface-Applied Urea
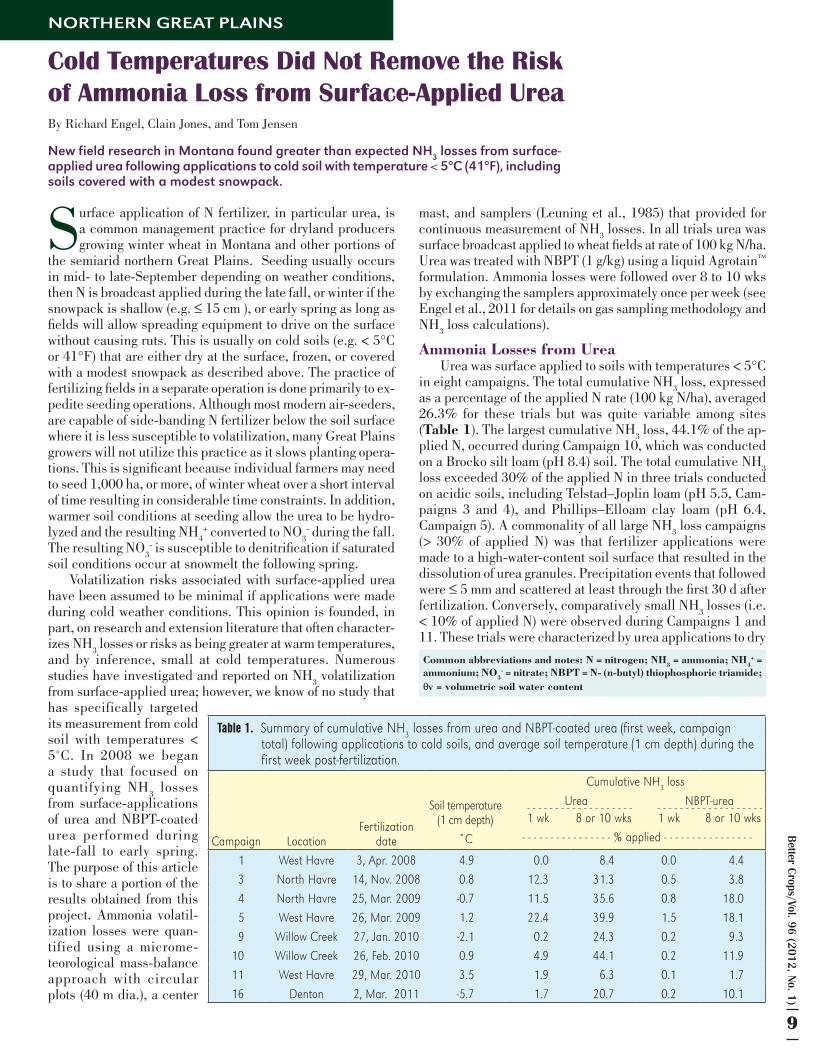
Table 1. Summary of cumulative NH3 losses from urea and NBPT-coated urea (first week, campaign total) following applications to cold soils, and average soil temperature (1 cm depth) during the first week post-fertilization.
Campaign LocationFertilization
date
Soil temperature (1 cm depth)
Cumulative NH3 loss
Urea NBPT-urea1 wk 8 or 10 wks 1 wk 8 or 10 wks
˚C - - - - - - - - - - - - - - - - % applied - - - - - - - - - - - - - - - -
1 West Havre 3, Apr. 2008 -4.9 20.0 8.4 0.0 4.4 3 North Havre 14, Nov. 2008 -0.8 12.3 31.3 0.5 3.8 4 North Havre 25, Mar. 2009 -0.7 11.5 35.6 0.8 18.0 5 West Havre 26, Mar. 2009 -1.2 22.4 39.9 1.5 18.1 9 Willow Creek 27, Jan. 2010 -2.1 20.2 24.3 0.2 9.3 10 Willow Creek 26, Feb. 2010 -0.9 24.9 44.1 0.2 11.9 11 West Havre 29, Mar. 2010 -3.5 21.9 6.3 0.1 1.7 16 Denton 2, Mar. 2011 -5.7 1.7 20.7 0.2 10.1
- - - - - - - - - - - - - - - - - - - - - - - - - - - - - - - - - - - - - -
10
Bet
ter
Cro
ps/V
ol. 9
6 (2
012,
No.
1)
soil surfaces followed by a large precipitation event (> 18 mm). Many studies on NH
3 volatilization from fertilizers have
noted that large NH3 losses are associated with an initially
wet surface soil followed by several days of slow drying with little or no precipitation; and that N losses from urea are mitigated when sufficient rain or irrigation, typically 13 to 25 mm, occurred to move the N into the soil profile (Hargrove, 1988). Our results are consistent with this review; however, they are unique in that we found cold soil temperatures did not provide protection against realizing large NH
3 losses if
the surface water content was high at the time of fertilization with little or no precipitation after application. For example, NH
3 losses > 10% of the applied N rate occurred over the first
week post-fertilization at Campaigns 3, 4, and 5, even though mean daily soil temperature (1 cm) over the sampling period averaged only 0.8, -0.7, and 1.2°C, respectively. Particularly large NH
3 losses (22.4% of applied N) were observed over the
first week at Campaign 5. Field conditions at the beginning of Campaign 5 were characterized by a frozen soil surface with a trace amount of snow, and a soil water content (0 to 8 cm) near saturation (θv = 50% ). During the first week, no precipitation fell and the volumetric soil water content fell to 24.6%. Similarly, large cumulative NH
3 losses equivalent to
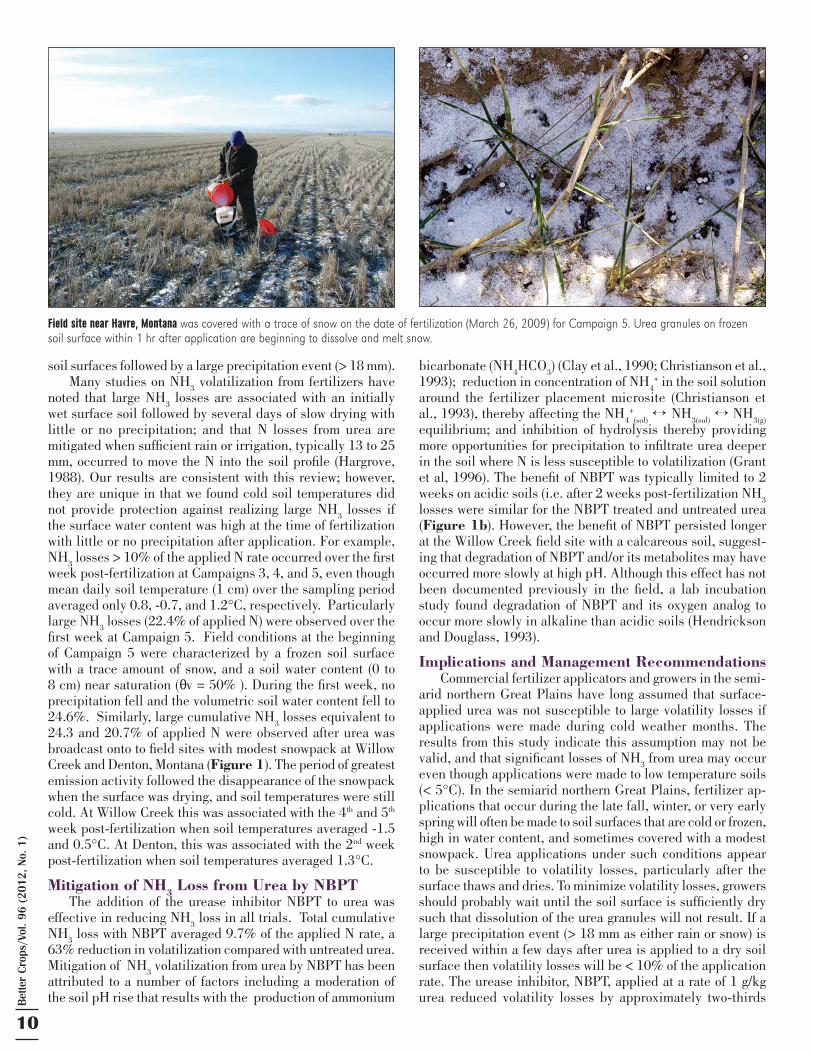
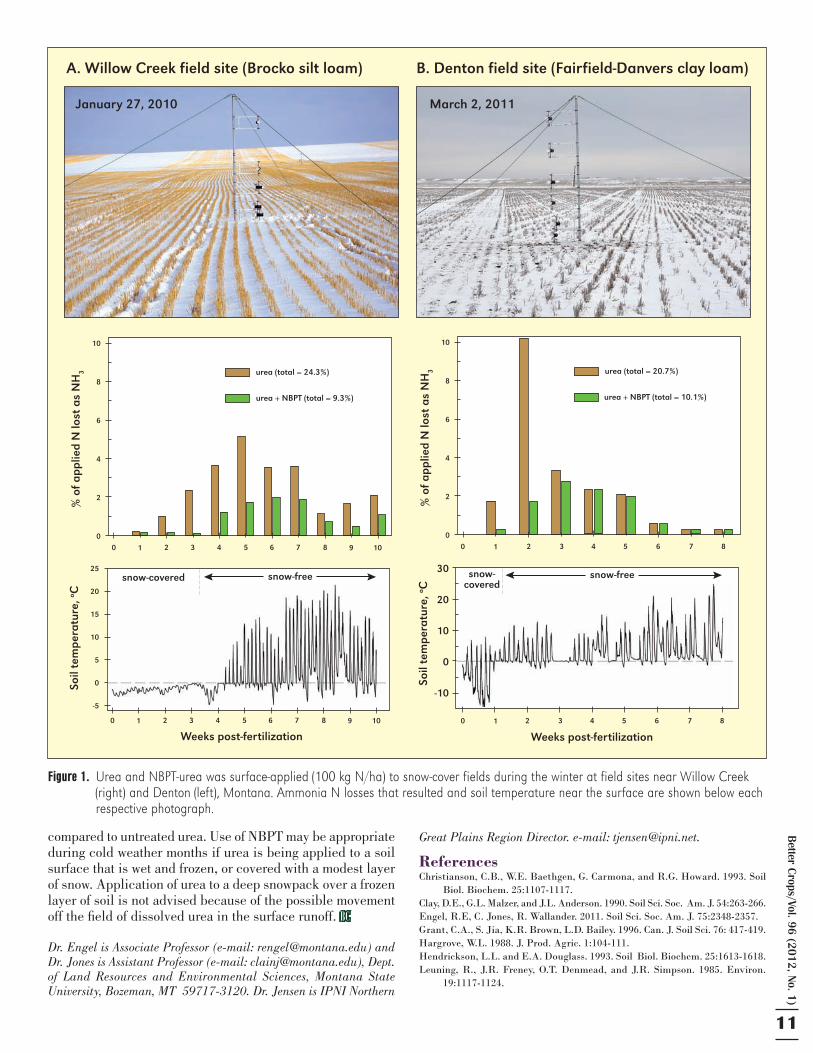
24.3 and 20.7% of applied N were observed after urea was broadcast onto to field sites with modest snowpack at Willow Creek and Denton, Montana (Figure 1). The period of greatest emission activity followed the disappearance of the snowpack when the surface was drying, and soil temperatures were still cold. At Willow Creek this was associated with the 4th and 5th week post-fertilization when soil temperatures averaged -1.5 and 0.5°C. At Denton, this was associated with the 2nd week post-fertilization when soil temperatures averaged 1.3°C.
Mitigation of NH3 Loss from Urea by NBPTThe addition of the urease inhibitor NBPT to urea was
effective in reducing NH3 loss in all trials. Total cumulative
NH3 loss with NBPT averaged 9.7% of the applied N rate, a
63% reduction in volatilization compared with untreated urea. Mitigation of NH
3 volatilization from urea by NBPT has been
attributed to a number of factors including a moderation of the soil pH rise that results with the production of ammonium
bicarbonate (NH4HCO
3) (Clay et al., 1990; Christianson et al.,
1993); reduction in concentration of NH4+ in the soil solution
around the fertilizer placement microsite (Christianson et al., 1993), thereby affecting the NH
4+
(sol) ↔ NH
3(sol) ↔ NH
3(g) equilibrium; and inhibition of hydrolysis thereby providing more opportunities for precipitation to infiltrate urea deeper in the soil where N is less susceptible to volatilization (Grant et al, 1996). The benefit of NBPT was typically limited to 2 weeks on acidic soils (i.e. after 2 weeks post-fertilization NH
3
losses were similar for the NBPT treated and untreated urea (Figure 1b). However, the benefit of NBPT persisted longer at the Willow Creek field site with a calcareous soil, suggest-ing that degradation of NBPT and/or its metabolites may have occurred more slowly at high pH. Although this effect has not been documented previously in the field, a lab incubation study found degradation of NBPT and its oxygen analog to occur more slowly in alkaline than acidic soils (Hendrickson and Douglass, 1993).
Implications and Management RecommendationsCommercial fertilizer applicators and growers in the semi-
arid northern Great Plains have long assumed that surface-applied urea was not susceptible to large volatility losses if applications were made during cold weather months. The results from this study indicate this assumption may not be valid, and that significant losses of NH
3 from urea may occur
even though applications were made to low temperature soils (< 5°C). In the semiarid northern Great Plains, fertilizer ap-plications that occur during the late fall, winter, or very early spring will often be made to soil surfaces that are cold or frozen, high in water content, and sometimes covered with a modest snowpack. Urea applications under such conditions appear to be susceptible to volatility losses, particularly after the surface thaws and dries. To minimize volatility losses, growers should probably wait until the soil surface is sufficiently dry such that dissolution of the urea granules will not result. If a large precipitation event (> 18 mm as either rain or snow) is received within a few days after urea is applied to a dry soil surface then volatility losses will be < 10% of the application rate. The urease inhibitor, NBPT, applied at a rate of 1 g/kg urea reduced volatility losses by approximately two-thirds
Field site near Havre, Montana was covered with a trace of snow on the date of fertilization (March 26, 2009) for Campaign 5. Urea granules on frozen soil surface within 1 hr after application are beginning to dissolve and melt snow.
Better C
rops/Vol. 96 (2012, No. 1)
11
compared to untreated urea. Use of NBPT may be appropriate during cold weather months if urea is being applied to a soil surface that is wet and frozen, or covered with a modest layer of snow. Application of urea to a deep snowpack over a frozen layer of soil is not advised because of the possible movement off the field of dissolved urea in the surface runoff. BC
Dr. Engel is Associate Professor (e-mail: [email protected]) and Dr. Jones is Assistant Professor (e-mail: [email protected]), Dept. of Land Resources and Environmental Sciences, Montana State University, Bozeman, MT 59717-3120. Dr. Jensen is IPNI Northern
Great Plains Region Director. e-mail: [email protected].
ReferencesChristianson, C.B., W.E. Baethgen, G. Carmona, and R.G. Howard. 1993. Soil
Biol. Biochem. 25:1107-1117.Clay, D.E., G.L. Malzer, and J.L. Anderson. 1990. Soil Sci. Soc. Am. J. 54:263-266.Engel, R.E, C. Jones, R. Wallander. 2011. Soil Sci. Soc. Am. J. 75:2348-2357.Grant, C.A., S. Jia, K.R. Brown, L.D. Bailey. 1996. Can. J. Soil Sci. 76: 417-419.Hargrove, W.L. 1988. J. Prod. Agric. 1:104-111.Hendrickson, L.L. and E.A. Douglass. 1993. Soil Biol. Biochem. 25:1613-1618.Leuning, R., J.R. Freney, O.T. Denmead, and J.R. Simpson. 1985. Environ.
19:1117-1124.
A. Willow Creek field site (Brocko silt loam)
January 27, 2010 March 2, 2011
B. Denton field site (Fairfield-Danvers clay loam)
Figure 1. Urea and NBPT-urea was surface-applied (100 kg N/ha) to snow-cover fields during the winter at field sites near Willow Creek (right) and Denton (left), Montana. Ammonia N losses that resulted and soil temperature near the surface are shown below each respective photograph.
% o
f app
lied
N lo
st a
s N
H3
10
8
6
4
2
0
0 1 2 3 4 5 6 7 8 9 10
urea (total = 24.3%)
urea + NBPT (total = 9.3%)
0 1 2 3 4 5 6 7 8 9 10
Soil
tem
pera
ture
, o C
snow-covered snow-free25
20
15
10
5
0
-5
Weeks post-fertilization
% o
f app
lied
N lo
st a
s N
H3
10
8
6
4
2
0
0 1 2 3 4 5 6 7 8
urea (total = 20.7%)
urea + NBPT (total = 10.1%)
Soil
tem
pera
ture
, o C
30
20
10
0
-10
Weeks post-fertilization
0 1 2 3 4 5 6 7 8
snow-freesnow-covered
12
Bet
ter
Cro
ps/V
ol. 9
6 (2
012,
No.
1)
Common abbreviations and notes: N = nitrogen; P = phosphorus; K = potassium; S = sulfur; Mg = magnesium; Ca = calcium; B = boron.
CALIFORNIA
An understanding of seasonal nutrient require-ments of crops is important in order to develop best fertilizer management practices. ‘Hass’
avocado trees absorb nutrients according to seasonal growth patterns, and matching fertilizer applications to those patterns can maximize yields, improve fruit quality, increase nutrient uptake, and reduce the po-tential for nutrient loss.
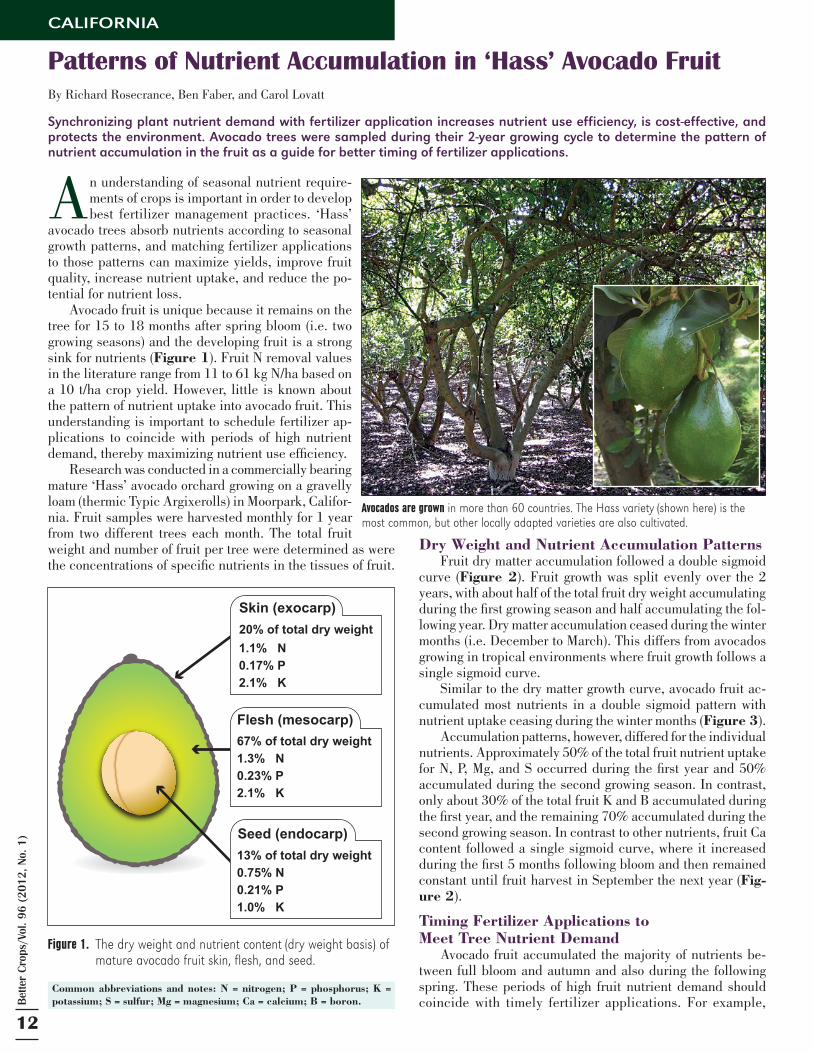
Avocado fruit is unique because it remains on the tree for 15 to 18 months after spring bloom (i.e. two growing seasons) and the developing fruit is a strong sink for nutrients (Figure 1). Fruit N removal values in the literature range from 11 to 61 kg N/ha based on a 10 t/ha crop yield. However, little is known about the pattern of nutrient uptake into avocado fruit. This understanding is important to schedule fertilizer ap-plications to coincide with periods of high nutrient demand, thereby maximizing nutrient use efficiency.
Research was conducted in a commercially bearing mature ‘Hass’ avocado orchard growing on a gravelly loam (thermic Typic Argixerolls) in Moorpark, Califor-nia. Fruit samples were harvested monthly for 1 year from two different trees each month. The total fruit weight and number of fruit per tree were determined as were the concentrations of specific nutrients in the tissues of fruit.
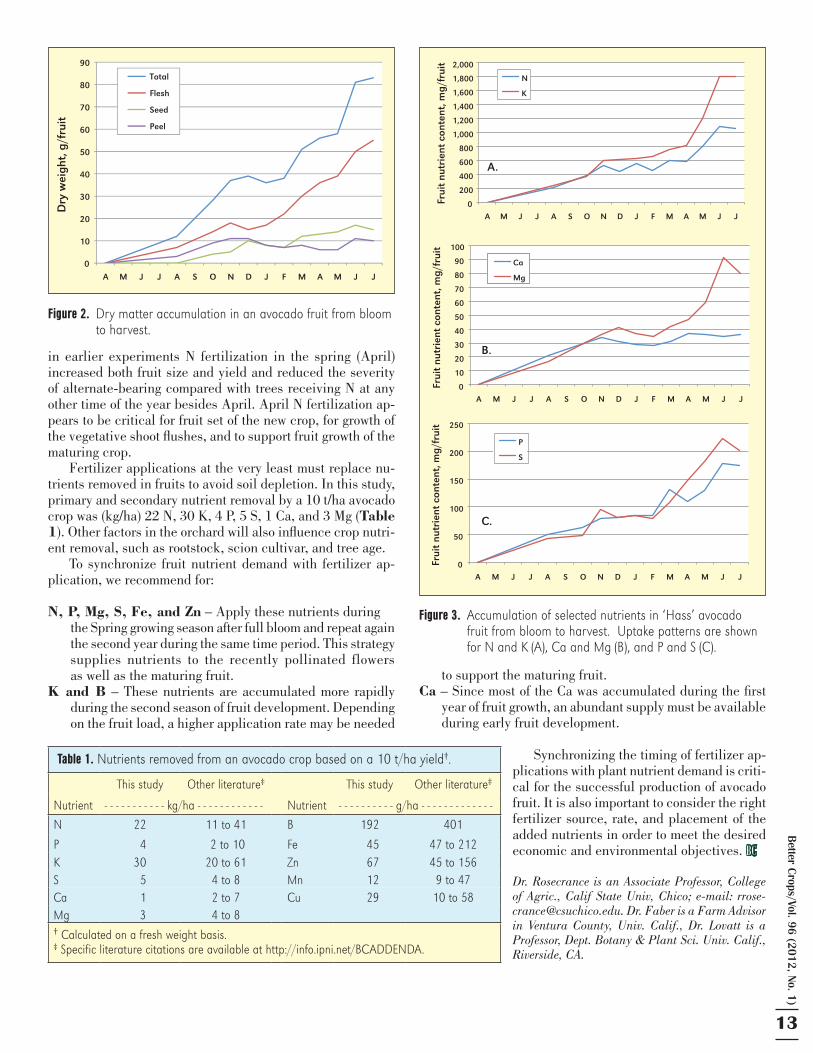
Dry Weight and Nutrient Accumulation PatternsFruit dry matter accumulation followed a double sigmoid
curve (Figure 2). Fruit growth was split evenly over the 2 years, with about half of the total fruit dry weight accumulating during the first growing season and half accumulating the fol-lowing year. Dry matter accumulation ceased during the winter months (i.e. December to March). This differs from avocados growing in tropical environments where fruit growth follows a single sigmoid curve.
Similar to the dry matter growth curve, avocado fruit ac-cumulated most nutrients in a double sigmoid pattern with nutrient uptake ceasing during the winter months (Figure 3).
Accumulation patterns, however, differed for the individual nutrients. Approximately 50% of the total fruit nutrient uptake for N, P, Mg, and S occurred during the first year and 50% accumulated during the second growing season. In contrast, only about 30% of the total fruit K and B accumulated during the first year, and the remaining 70% accumulated during the second growing season. In contrast to other nutrients, fruit Ca content followed a single sigmoid curve, where it increased during the first 5 months following bloom and then remained constant until fruit harvest in September the next year (Fig-ure 2).
Timing Fertilizer Applications to Meet Tree Nutrient Demand
Avocado fruit accumulated the majority of nutrients be-tween full bloom and autumn and also during the following spring. These periods of high fruit nutrient demand should coincide with timely fertilizer applications. For example,
By Richard Rosecrance, Ben Faber, and Carol Lovatt
Synchronizing plant nutrient demand with fertilizer application increases nutrient use efficiency, is cost-effective, and protects the environment. Avocado trees were sampled during their 2-year growing cycle to determine the pattern of nutrient accumulation in the fruit as a guide for better timing of fertilizer applications.
Patterns of Nutrient Accumulation in ‘Hass’ Avocado Fruit
Figure 1. The dry weight and nutrient content (dry weight basis) of mature avocado fruit skin, flesh, and seed.
Skin (exocarp)20% of total dry weight1.1% N0.2% P2.1% K
Flesh (mesocarp)13% of total dry weight0.8% N0.2% P1.0% K
Seed (endocarp)67% of total dry weight1.3% N0.2% P2.0% K
67% of total dry weight1.3% N0.23% P2.1% K
13% of total dry weight0.75% N0.21% P1.0% K
1.1% N0.17% P2.1% K
Avocados are grown in more than 60 countries. The Hass variety (shown here) is the most common, but other locally adapted varieties are also cultivated.
Better C
rops/Vol. 96 (2012, No. 1)
13
in earlier experiments N fertilization in the spring (April) increased both fruit size and yield and reduced the severity of alternate-bearing compared with trees receiving N at any other time of the year besides April. April N fertilization ap-pears to be critical for fruit set of the new crop, for growth of the vegetative shoot flushes, and to support fruit growth of the maturing crop.
Fertilizer applications at the very least must replace nu-trients removed in fruits to avoid soil depletion. In this study, primary and secondary nutrient removal by a 10 t/ha avocado crop was (kg/ha) 22 N, 30 K, 4 P, 5 S, 1 Ca, and 3 Mg (Table 1). Other factors in the orchard will also influence crop nutri-ent removal, such as rootstock, scion cultivar, and tree age.
To synchronize fruit nutrient demand with fertilizer ap-plication, we recommend for:
N, P, Mg, S, Fe, and Zn – Apply these nutrients during the Spring growing season after full bloom and repeat again the second year during the same time period. This strategy supplies nutrients to the recently pollinated flowers as well as the maturing fruit.K and B – These nutrients are accumulated more rapidly during the second season of fruit development. Depending on the fruit load, a higher application rate may be needed
to support the maturing fruit. Ca – Since most of the Ca was accumulated during the first year of fruit growth, an abundant supply must be available during early fruit development.
Synchronizing the timing of fertilizer ap-
plications with plant nutrient demand is criti-cal for the successful production of avocado fruit. It is also important to consider the right fertilizer source, rate, and placement of the added nutrients in order to meet the desired economic and environmental objectives. BC
Dr. Rosecrance is an Associate Professor, College of Agric., Calif State Univ, Chico; e-mail: [email protected]. Dr. Faber is a Farm Advisor in Ventura County, Univ. Calif., Dr. Lovatt is a Professor, Dept. Botany & Plant Sci. Univ. Calif., Riverside, CA.
Figure 2. Dry matter accumulation in an avocado fruit from bloom to harvest.
Figure 3. Accumulation of selected nutrients in ‘Hass’ avocado fruit from bloom to harvest. Uptake patterns are shown for N and K (A), Ca and Mg (B), and P and S (C).
0
10
20
30
40
50
60
70
80
90
A M J J A S O N D J F M A M J J
Dry
wei
ght,
g/f
ruit
Total
Flesh
Seed
Peel
0
200
400
600
800
1,000
1,200
1,400
1,600
1,800
2,000
A M J J A S O N D J F M A M J J
Frui
t nu
trie
nt c
onte
nt, m
g/fr
uit
N
K
0
10
20
30
40
50
60
70
80
90
100
A M J J A S O N D J F M A M J J
Frui
t nu
trie
nt c
onte
nt, m
g/fr
uit
Ca
Mg
0
50
100
150
200
250
A M J J A S O N D J F M A M J J
Frui
t nu
trie
nt c
onte
nt, m
g/fr
uit
P
S
A.
B.
C.
Table 1. Nutrients removed from an avocado crop based on a 10 t/ha yield†.
Nutrient
This study Other literature‡
Nutrient
This study Other literature‡
- - - - - - - - - - - kg/ha - - - - - - - - - - - - - - - - - - - - - - g/ha - - - - - - - - - - - - -
N 22 11 to 41 B 192 401
P 24 2 to 10 Fe 245 47 to 212K 30 20 to 61 Zn 267 45 to 156S 25 4 to 8 Mn 212 9 to 47Ca 21 2 to 7 Cu 229 10 to 58Mg 23 4 to 8† Calculated on a fresh weight basis.‡ Specific literature citations are available at http://info.ipni.net/BCADDENDA.
14
Bet
ter
Cro
ps/V
ol. 9
6 (2
012,
No.
1)
Common notes and abbreviations: N = nitrogen; NBPT = N-(n-butyl) thiophosphoric triamide.
KANSAS
Soybeans do not normally respond to applications of N fertilizer as long as they are well nodulated with rhizobia bacteria. When soybeans are planted into ground that
has no history of soybean production, or when there has been a long interval between soybean crops, adequate rhizobia may not be present for successful nodulation and N fixation. This is usually overcome by inoculating the seed with rhizobia. However, these inoculations are not always successful, and when this happens, poorly nodulated, N-deficient soybean crops can result.
In both 2009 and 2010, a number of fields planted into “vir-gin” soybean ground, or into returned Conservation Reserve Program (CRP) ground in north central Kansas were observed to be poorly nodulated and N-deficient even though the seed was commercially inoculated. A field study was conducted in 2009, and continued at a different location in the same area in 2010, to determine whether these poorly nodulated, N-deficient soybean crops would respond to applied N fertilizers, and if so, how much N could successfully be used.
The 2009 study was conducted on a farmer’s field near Solomon, Kansas that showed noticeable N deficiency in soy-bean. Variety NK S39-A3 was planted (no-till) into sorghum residue from the previous year on May 20, 2009, at 140,000 seeds/A. A liquid inoculant was sprayed on the seeds as they were loaded into the planter. This field had no history of soy-bean production. Nitrogen fertilizer was applied on July 20, 2009, to plants displaying N deficiency symptoms at the R1 to R2 growth stages. The N was surface banded between the soybean rows in the form of urea co-granulated with a urease inhibitor (NBPT) and nitrification inhibitor (dicyandiamide). Rainfall occurred within a few hours of N application.
The 2010 study was conducted on a farmer’s field near Gyp-sum, Kansas that had poorly nodulated, N-deficient soybean. Variety P93Y70 was planted into conventional tilled soil at 130,000 seeds/A on June 19, 2010. The seed was inoculated prior to planting. This field also had no history of soybean pro-duction. The N was broadcast-applied as urea (co-granulated with NBPT + dicyandiamide) on July 22, 2010. Rainfall did not occur until 14 days after treatments were applied.
ResultsThe results from both studies for 2009 and 2010 are sum-
marized in Table 1. In 2009, a highly significant response to the highest N rate applied, 120 lb N/A, was obtained, with a 21 bu/A increase over the control.
Yields at Gypsum in 2010 were lower due to dry weather; however, similar trends were observed, with an 11 bu response to the first 120 lb of N/A compared to the control. There was no advantage to increasing the N rate from 120 to 150 lb/A
in 2010. When averaged across years, the data show a clear response to N, with highest yields found at 120 lb N/A.
The data from these studies show that applying N fertilizer to poorly nodulated, N-deficient soybean can significantly en-hance yield. Applying up to 120 lb N/A was effective in each of the 2 years of this study. At current fertilizer and commodity prices these responses would provide a good return on invest-ment, even on the modest yields obtained in 2010. The results of this work were previously published in the Kansas Fertilizer Research Report (Asebedo and Mengel, 2010).
ConclusionsWhile N applied to N-deficient soybeans at the pod devel-
opment or early pod fill stages of growth can increase yields, it should be noted that there are risks:
Leaf burn – It would be much safer to apply urea than UAN solution.
By Dave Mengel, Dorivar Ruiz-Diaz, Ray Asebedo, and Tom Maxwell
Soybeans are not generally considered responsive to N fertilizer; however, there are some circumstances where this crop can benefit from addition of N. Kansas research performed several years ago and reported in this magazine showed the potential for soybean grain response to N fertilizer in high-yield irrigated conditions. This article looks at other conditions where N fertilizer can be beneficial in soybean production.
Nitrogen Fertilization of Nitrogen-Stressed Soybeans
Table 1. Effect of nitrogen fertilization on yield of N-deficient soybeans (2009-2010).
Solomon 2009 Gypsum 2010 AverageN rate, lb/A - - - - - - - - - - - - - - - Yield, bu/A - - - - - - - - - - - - - - - 0 28d 18c 23d 30 37c 23b 30c 60 42b 26b 33cb 90 43b 26b 34b 120 49a 29a 39a 150 N/A 29a N/A
Means within a column followed by the same letter are not signifi-cantly different at p = 0.05.
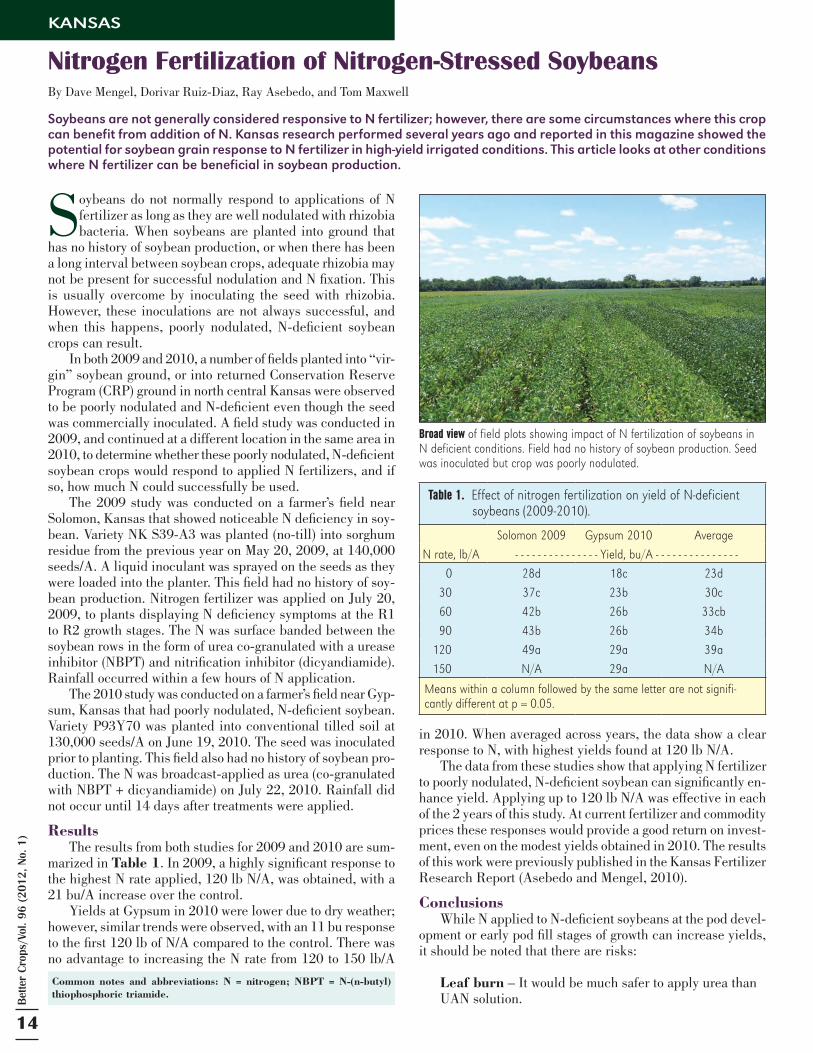
Broad view of field plots showing impact of N fertilization of soybeans in N deficient conditions. Field had no history of soybean production. Seed was inoculated but crop was poorly nodulated.
Better C
rops/Vol. 96 (2012, No. 1)
15
Volatilization – Urea applied to the soil surface under warm, damp, windy conditions may volatilize if it is not moved into the soil by rainfall. This risk can be minimized by having the urea treated with NBPT.
Dry weather after application – If it does not rain after application, the N may not get down into the soil in time to benefit the crop.
Plant damage during the application process – At this time of year, making a fertilizer application with ground equipment could damage some of the plants. Whether the benefits would outweigh the amount of plant damage is a case-by-case judgment call.
This article has reported on one set of conditions where soy-beans have the potential to respond to N fertilization. It should also be noted that irrigated soybeans with high yield potential may respond to N applications, even if they are not N deficient. Research was conducted several years ago at Kansas State on late-season application of N to soybeans (Lamond and Wesley, 2001). This research was on irrigated soybeans with high yield potential, and the plants were not showing N deficiency at the time of application. Lamond applied 20 and 40 lb N/A to the beans at the R3 stage, using UAN, ammonium nitrate, urea, and urea + NBPT. The N increased yields at most locations. The yield increases ranged from about 6 to 10 bu/A—or about 5 to 10%. The high rate (40 lb N/A) of UAN caused severe leaf burn. It was concluded that late-season supplemental N at a rate of 20 lb/A should be applied to irrigated soybeans with high yield potential at the R3 growth stage. BC
Dr. Mengel is Soil Fertility Specialist, Kansas State University, Man-hattan, Kansas; e-mail: [email protected]. Dr. Ruiz-Diaz, Nutrient Management Specialist, Kansas State University; e-mail: [email protected]. Mr. Asebedo is a Graduate Research Assistant at Kansas State University. Mr. Maxwell is Central Kansas District Extension Agent, Salina, Kansas.
ReferencesAsebedo, A.R. and D.B. Mengel. 2010. Kansas Fertilizer Research. Report of
Progress 1049. Lamond, R.E. and T.L. Wesley. 2001. Better Crops with Plant Food. 85: No.2,
6-11.
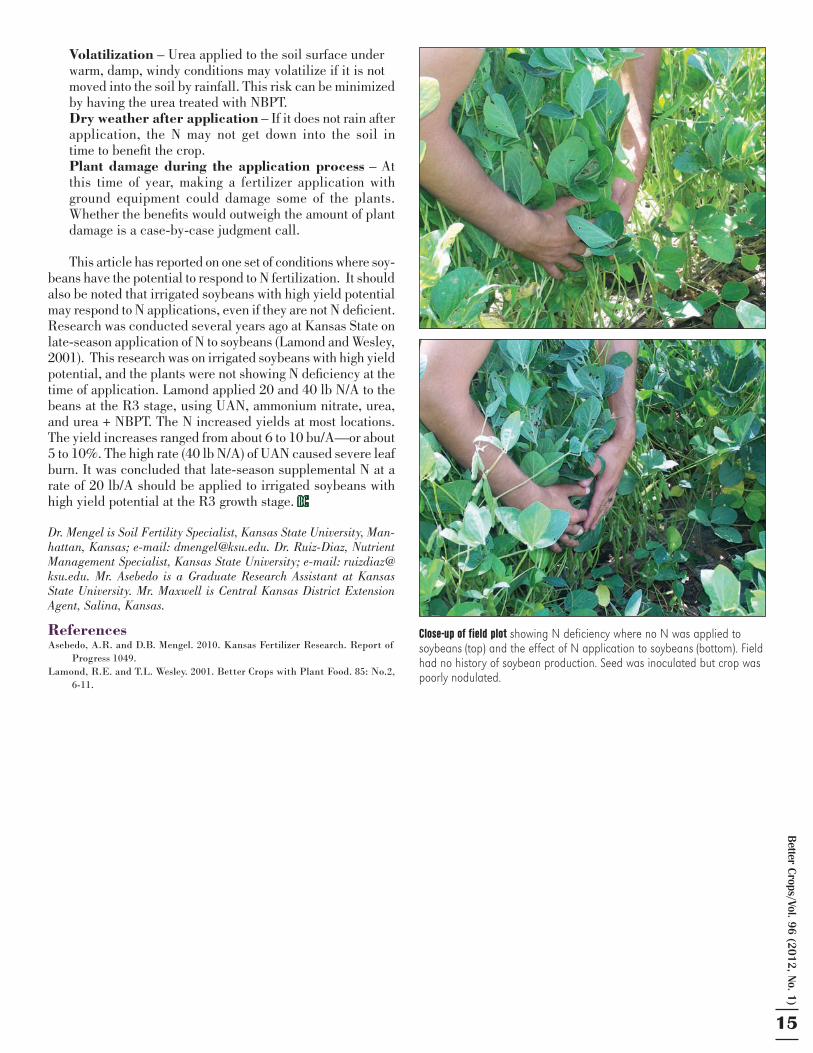
Close-up of field plot showing N deficiency where no N was applied to soybeans (top) and the effect of N application to soybeans (bottom). Field had no history of soybean production. Seed was inoculated but crop was poorly nodulated.
16
Bet
ter
Cro
ps/V
ol. 9
6 (2
012,
No.
1)
Winners of IPNI 2011 Crop Nutrient Deficiency Photo Contest
IPNI has announced the win-ners of our 2011 Crop Nutri-ent Deficiency Photo Contest.
“Our response this past year has been terrific as the diversity and quality of images submitted seems to improve with each year,” noted IPNI President Dr. Terry Roberts. “Our contest has evolved into a world-wide forum for all with a keen eye and access to growing crops to share their unique examples of crop nutrient deficiency and we are very pleased to continue to support this effort.” As has become the custom, our judges were challenged with the task of choosing the winners of each category by evaluating the overall visual quality of each im-age along with any supporting data provided. IPNI extends our congratulations to all winners and we thank all entrants for submit-ting images to our annual contest maintained on the web at www.ipni.net/photocontest. We look forward to collecting your entries in 2012!
Best Overall Image
Abbreviations and notes: Mn = manganese; N = nitrogen; P = phosphorus; K = potassium; Fe = iron; B = boron; C = carbon; ppm = parts per million.
Nitrogen Category
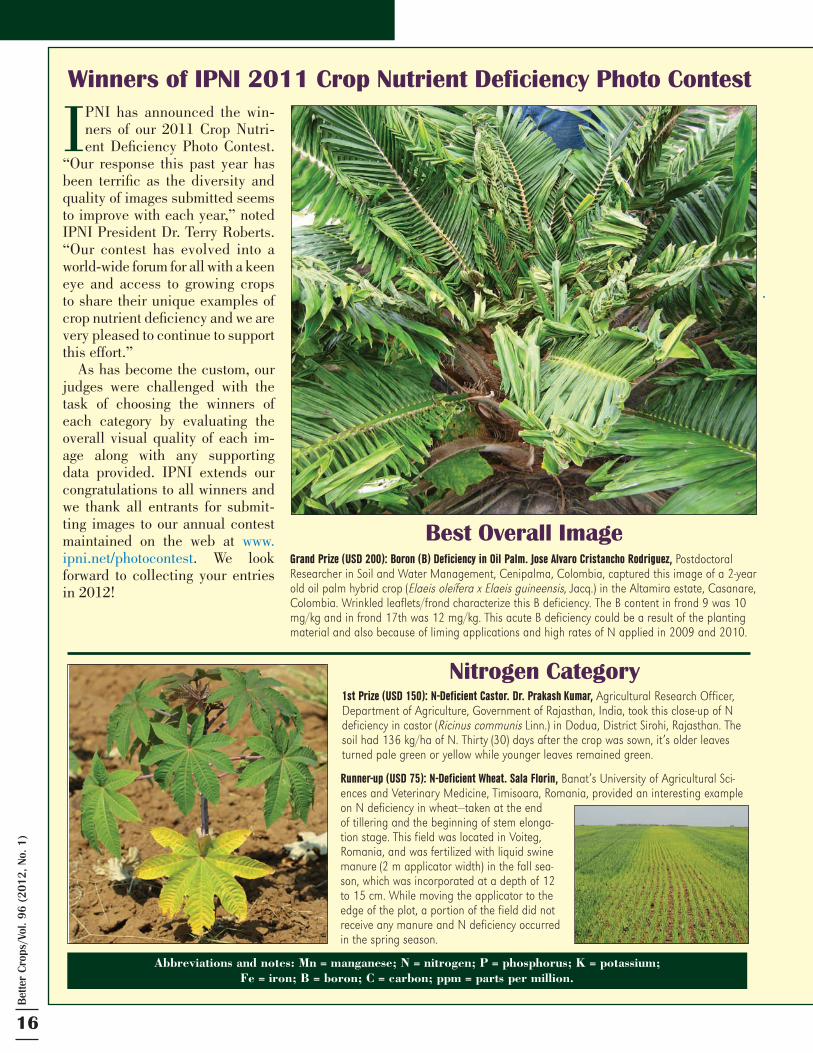
Grand Prize (USD 200): Boron (B) Deficiency in Oil Palm. Jose Alvaro Cristancho Rodriguez, Postdoctoral Researcher in Soil and Water Management, Cenipalma, Colombia, captured this image of a 2-year old oil palm hybrid crop (Elaeis oleífera x Elaeis guineensis, Jacq.) in the Altamira estate, Casanare, Colombia. Wrinkled leaflets/frond characterize this B deficiency. The B content in frond 9 was 10 mg/kg and in frond 17th was 12 mg/kg. This acute B deficiency could be a result of the planting material and also because of liming applications and high rates of N applied in 2009 and 2010.
1st Prize (USD 150): N-Deficient Castor. Dr. Prakash Kumar, Agricultural Research Officer, Department of Agriculture, Government of Rajasthan, India, took this close-up of N deficiency in castor (Ricinus communis Linn.) in Dodua, District Sirohi, Rajasthan. The soil had 136 kg/ha of N. Thirty (30) days after the crop was sown, it’s older leaves turned pale green or yellow while younger leaves remained green.
Runner-up (USD 75): N-Deficient Wheat. Sala Florin, Banat’s University of Agricultural Sci-ences and Veterinary Medicine, Timisoara, Romania, provided an interesting example on N deficiency in wheat—taken at the end of tillering and the beginning of stem elonga-tion stage. This field was located in Voiteg, Romania, and was fertilized with liquid swine manure (2 m applicator width) in the fall sea-son, which was incorporated at a depth of 12 to 15 cm. While moving the applicator to the edge of the plot, a portion of the field did not receive any manure and N deficiency occurred in the spring season.
Better C
rops/Vol. 96 (2012, No. 1)
17
Phosphorus Category
Potassium Category
Other Category (Secondary and Micronutrients)
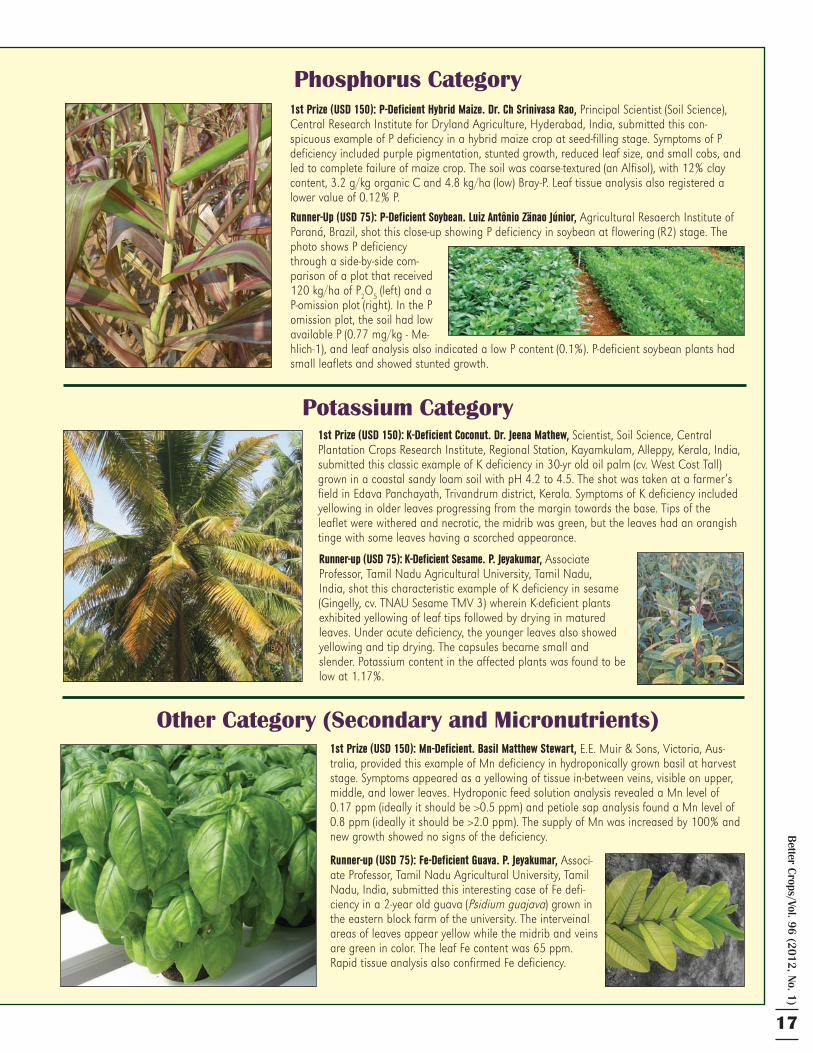
1st Prize (USD 150): P-Deficient Hybrid Maize. Dr. Ch Srinivasa Rao, Principal Scientist (Soil Science), Central Research Institute for Dryland Agriculture, Hyderabad, India, submitted this con-spicuous example of P deficiency in a hybrid maize crop at seed-filling stage. Symptoms of P deficiency included purple pigmentation, stunted growth, reduced leaf size, and small cobs, and led to complete failure of maize crop. The soil was coarse-textured (an Alfisol), with 12% clay content, 3.2 g/kg organic C and 4.8 kg/ha (low) Bray-P. Leaf tissue analysis also registered a lower value of 0.12% P.
Runner-Up (USD 75): P-Deficient Soybean. Luiz Antônio Zänao Júnior, Agricultural Resaerch Institute of Paraná, Brazil, shot this close-up showing P deficiency in soybean at flowering (R2) stage. The photo shows P deficiency through a side-by-side com-parison of a plot that received 120 kg/ha of P2O5 (left) and a P-omission plot (right). In the P omission plot, the soil had low available P (0.77 mg/kg - Me-hlich-1), and leaf analysis also indicated a low P content (0.1%). P-deficient soybean plants had small leaflets and showed stunted growth.
1st Prize (USD 150): K-Deficient Coconut. Dr. Jeena Mathew, Scientist, Soil Science, Central Plantation Crops Research Institute, Regional Station, Kayamkulam, Alleppy, Kerala, India, submitted this classic example of K deficiency in 30-yr old oil palm (cv. West Cost Tall) grown in a coastal sandy loam soil with pH 4.2 to 4.5. The shot was taken at a farmer’s field in Edava Panchayath, Trivandrum district, Kerala. Symptoms of K deficiency included yellowing in older leaves progressing from the margin towards the base. Tips of the leaflet were withered and necrotic, the midrib was green, but the leaves had an orangish tinge with some leaves having a scorched appearance.
Runner-up (USD 75): K-Deficient Sesame. P. Jeyakumar, Associate Professor, Tamil Nadu Agricultural University, Tamil Nadu, India, shot this characteristic example of K deficiency in sesame (Gingelly, cv. TNAU Sesame TMV 3) wherein K-deficient plants exhibited yellowing of leaf tips followed by drying in matured leaves. Under acute deficiency, the younger leaves also showed yellowing and tip drying. The capsules became small and slender. Potassium content in the affected plants was found to be low at 1.17%.
1st Prize (USD 150): Mn-Deficient. Basil Matthew Stewart, E.E. Muir & Sons, Victoria, Aus-tralia, provided this example of Mn deficiency in hydroponically grown basil at harvest stage. Symptoms appeared as a yellowing of tissue in-between veins, visible on upper, middle, and lower leaves. Hydroponic feed solution analysis revealed a Mn level of 0.17 ppm (ideally it should be >0.5 ppm) and petiole sap analysis found a Mn level of 0.8 ppm (ideally it should be >2.0 ppm). The supply of Mn was increased by 100% and new growth showed no signs of the deficiency.
Runner-up (USD 75): Fe-Deficient Guava. P. Jeyakumar, Associ-ate Professor, Tamil Nadu Agricultural University, Tamil Nadu, India, submitted this interesting case of Fe defi-ciency in a 2-year old guava (Psidium guajava) grown in the eastern block farm of the university. The interveinal areas of leaves appear yellow while the midrib and veins are green in color. The leaf Fe content was 65 ppm. Rapid tissue analysis also confirmed Fe deficiency.
18
Bet
ter
Cro
ps/V
ol. 9
6 (2
012,
No.
1)
Common abbreviations and notes: N = nitrogen; P = phosphorus; K = potassium; Mg = magnesium; B = boron; Zn = zinc; NH4 = ammonium; NO3 = nitrate; SSP = single superphosphate; KCl = potassium chloride; OM = organic matter.
SOUTHWEST CHINA
Waxy (fresh) maize has gained wide popularity across the households of China as an on-the-cob product due to its preferred taste characteristics. High mar-
ket value has made this crop very lucrative for the region’s growers. However, in the pursuit of high yields farmers tend to overuse N fertilizers due to a lack of information on best nutrient management practices.
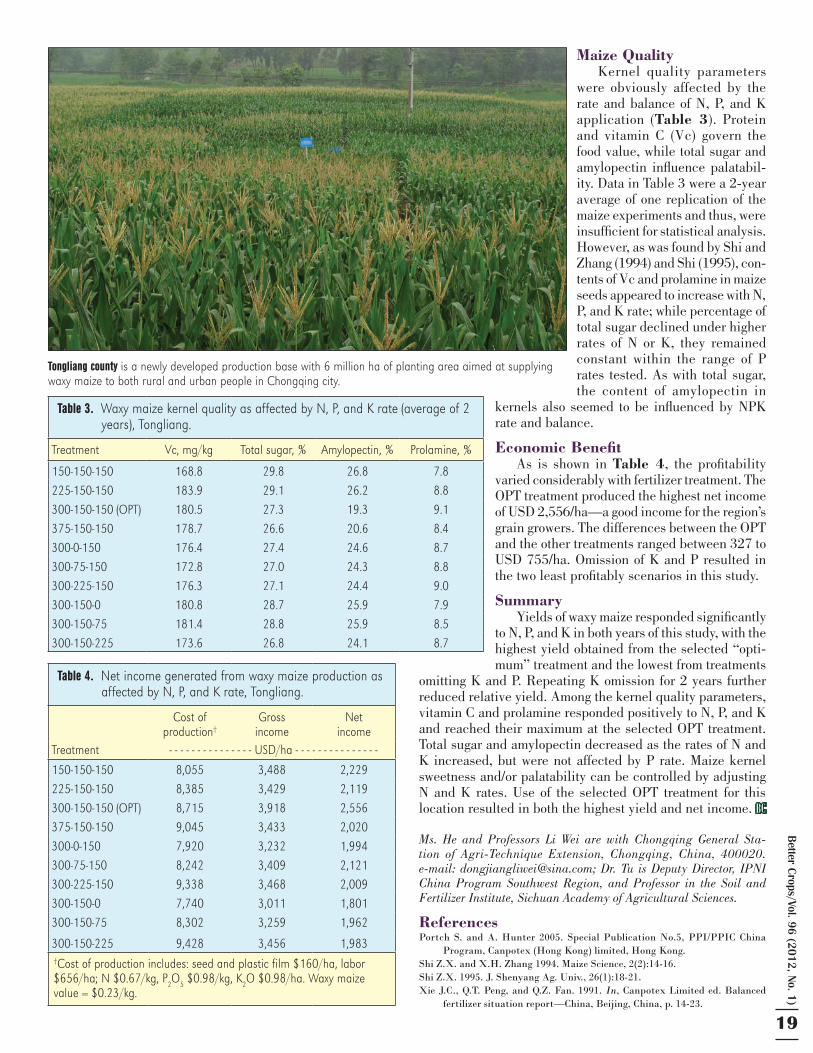
A project was launched in 2008 to test the optimal (OPT) fertilizer rates and fertilizer combinations for high yielding, profitable waxy maize. Field experiments were conducted on an alluvial, sandy loam soil in Tongliang. Surface (0 to 15 cm) soil samples were collected from the field after harvesting the previous wheat crop. These samples were then analyzed by the National Laboratory of Soil Testing according to the ASI method (Portch and Hunter, 2005) (Table 1).
Soil test results indicated that the soil was alkaline, had adequate P, B, and Zn, but was deficient in N and K. The ex-periment was set up in a randomized complete block design with three replications. There were four rates of N (150, 225, 300, 375 kg N/ha), P (0, 75, 150, 225 kg P
2O
5/ha), and K (0,
75, 150, 225 kg K2O/ha), which combined to
form 10 treatments (Table 2). The OPT NPK treatment was 300-150-150 kg N-P
2O
5-K
2O/
ha. This N rate was identified by previous field experimentation while the P and K rates were determined by soil testing. Urea, SSP, and KCl were used as fertilizer sources. All P fertilizer was applied at seeding (a basal dose). Fertilizer N application was split between basal (30%) and topdress applications (i.e. 30% at the two-leaf and 40% at heading stages). Fertilizer K was split between a basal dose (50%) and a topdressing (50%) at the heading stage. Maize seeds were planted on a nurse bed in mid-February and seedlings were transplanted in early March using a plant population of 37,880 plants/ha. Maize cobs were harvested in early June and yield was recorded on a fresh weight basis. Maize kernel samples were collected from each plot, oven-dried, and analyzed for vitamin
C, amino acids, total sugar, amylopectin, and prolamine.
Maize YieldDifferent rates of N, P, and K fertilizers significantly af-
fected maize yield, but the effect varied considerably between 2 years (Table 2). In 2008, maize yields responded signifi-cantly to all the N, P, and K rates applied, which increased with an increase in fertilizer rates and then leveled off when the fertilizer rates exceeded those used in the OPT treatment. Omission of P or K from any fertilizer program would reduce maize yield by 17 and 19%, respectively, if compared to yield under the OPT. In 2009, maize pollination was affected due to three rainfall events that occurred during the flowering stage. This resulted in higher numbers of barren ear tips and lower yields. Besides these lower yields, the yield response to fertil-izer application rate was comparable. Although the relative yield of the P omission treatment did not differ between the 2 years (82.6% in 2008 and 82.5% in 2009), the omission of K lowered relative yield from 81% in 2008 to 77% in 2009. This is because soils in southern China are nearly always K responsive due to continuously removal by crops and leach-ing, while soil P reserves are more highly buffered from these influences (Xie et al., 1991).
By Hongzhou He, Wei Li, and Shihua Tu
Optimal fertilizer treatment cannot only produce high yield and quality of waxy (fresh) maize, but also enhance the net income for growers. The contents of total sugar and amylopectin, which govern maize palatability, can be positively affected through op-timal N and K application.
Balanced Fertilization Promoted Yield and Quality of Waxy Maize in Chongqing
Table 2. Waxy maize yields as affected by N, P, and K rate, Tongliang.
Treatment
- - - - 2008 - - - - - - - - 2009 - - - - - - - Average - - -Yield1,kg/ha
Relativeyield, %
Yield,kg/ha
Relativeyield, %
Yield,kg/ha
Relativeyield, %
150-150-150 15,750 ba 190.7 14,882 b 189.0 15,316 b 189.9 225-150-150 16,933 aa 197.5 14,630 b 187.5 15,782 b 192.6 300-150-150 (OPT) 17,367 aa 100.0 16,717 a 100.0 17,042 a 100.0 375-150-150 17,100 aa 198.5 14,647 b 187.6 15,873 a 193.1 300-0-150 14,350 ca 182.6 13,788 c 182.5 14,069 c 182.6 300-75-150 15,550 ba 189.5 14,545 b 187.0 15,048 b 188.3 300-225-150 17,367 aa 100.0 14,798 b 188.5 16,082 a 194.4 300-150-0 14,050 ca 180.9 12,845 d 176.8 13,448 c 178.9 300-150-75 16,067 ab 192.5 13,906 c 183.2 14,986 b 187.9 300-150-225 16,983 aa 197.8 14,747 b 188.2 15,865 a 193.1
Means in each column followed by the same letter are not significantly different at p = 0.05.1Fresh weight yields.
Table 1. Status of soil pH and selected nutrients from the field site in Tongliang (ASI method).
OM, g/kg pHNH4-N NO3-N P K B Mg Zn - - - - - - - - - - - - - - - - - - - mg/L - - - - - - - - - - - - - - - - - - -
4.4 8.1 13 37 22 29 1.1 98 2.8
Better C
rops/Vol. 96 (2012, No. 1)
19
Maize QualityKernel quality parameters
were obviously affected by the rate and balance of N, P, and K application (Table 3). Protein and vitamin C (Vc) govern the food value, while total sugar and amylopectin influence palatabil-ity. Data in Table 3 were a 2-year average of one replication of the maize experiments and thus, were insufficient for statistical analysis. However, as was found by Shi and Zhang (1994) and Shi (1995), con-tents of Vc and prolamine in maize seeds appeared to increase with N, P, and K rate; while percentage of total sugar declined under higher rates of N or K, they remained constant within the range of P rates tested. As with total sugar, the content of amylopectin in
kernels also seemed to be influenced by NPK rate and balance.
Economic Benefit As is shown in Table 4, the profitability
varied considerably with fertilizer treatment. The OPT treatment produced the highest net income of USD 2,556/ha—a good income for the region’s grain growers. The differences between the OPT and the other treatments ranged between 327 to USD 755/ha. Omission of K and P resulted in the two least profitably scenarios in this study.
SummaryYields of waxy maize responded significantly
to N, P, and K in both years of this study, with the highest yield obtained from the selected “opti-mum” treatment and the lowest from treatments
omitting K and P. Repeating K omission for 2 years further reduced relative yield. Among the kernel quality parameters, vitamin C and prolamine responded positively to N, P, and K and reached their maximum at the selected OPT treatment. Total sugar and amylopectin decreased as the rates of N and K increased, but were not affected by P rate. Maize kernel sweetness and/or palatability can be controlled by adjusting N and K rates. Use of the selected OPT treatment for this location resulted in both the highest yield and net income. BC
Ms. He and Professors Li Wei are with Chongqing General Sta-tion of Agri-Technique Extension, Chongqing, China, 400020. e-mail: [email protected]; Dr. Tu is Deputy Director, IPNI China Program Southwest Region, and Professor in the Soil and Fertilizer Institute, Sichuan Academy of Agricultural Sciences.
ReferencesPortch S. and A. Hunter 2005. Special Publication No.5, PPI/PPIC China
Program, Canpotex (Hong Kong) limited, Hong Kong.Shi Z.X. and X.H. Zhang 1994. Maize Science, 2(2):14-16.Shi Z.X. 1995. J. Shenyang Ag. Univ., 26(1):18-21.Xie J.C., Q.T. Peng, and Q.Z. Fan. 1991. In, Canpotex Limited ed. Balanced
fertilizer situation report—China, Beijing, China, p. 14-23.
Table 3. Waxy maize kernel quality as affected by N, P, and K rate (average of 2 years), Tongliang.
Treatment Vc, mg/kg Total sugar, % Amylopectin, % Prolamine, %
150-150-150 168.8 29.8 26.8 7.8 225-150-150 183.9 29.1 26.2 8.8 300-150-150 (OPT) 180.5 27.3 19.3 9.1 375-150-150 178.7 26.6 20.6 8.4 300-0-150 176.4 27.4 24.6 8.7 300-75-150 172.8 27.0 24.3 8.8 300-225-150 176.3 27.1 24.4 9.0 300-150-0 180.8 28.7 25.9 7.9 300-150-75 181.4 28.8 25.9 8.5 300-150-225 173.6 26.8 24.1 8.7
Table 4. Net income generated from waxy maize production as affected by N, P, and K rate, Tongliang.
Treatment
Cost ofproduction†
Grossincome
Netincome
- - - - - - - - - - - - - - - USD/ha - - - - - - - - - - - - - - -
150-150-150 8,055 3,488 2,229 225-150-150 8,385 3,429 2,119 300-150-150 (OPT) 8,715 3,918 2,556 375-150-150 9,045 3,433 2,020 300-0-150 7,920 3,232 1,994 300-75-150 8,242 3,409 2,121 300-225-150 9,338 3,468 2,009 300-150-0 7,740 3,011 1,801 300-150-75 8,302 3,259 1,962
300-150-225 9,428 3,456 1,983 †Cost of production includes: seed and plastic film $160/ha, labor $656/ha; N $0.67/kg, P2O5 $0.98/kg, K2O $0.98/ha. Waxy maize value = $0.23/kg.
Tongliang county is a newly developed production base with 6 million ha of planting area aimed at supplying waxy maize to both rural and urban people in Chongqing city.
20
Bet
ter
Cro
ps/V
ol. 9
6 (2
012,
No.
1)
Common abbreviations and notes: N = nitrogen; P = phosphorus; K = potassium; Ca = calcium; Mg = magnesium; Mn = manganese; Fe = iron; Al = aluminum; CRU = controlled release urea; KCl = potassium chloride; KNO3 = potassium nitrate; K2SO4 = potassium sulfate; SSP = single su-perphosphate; TSP = triple superphosphate; MgSO4 = magnesium sulfate; MgCl2 = magnesium chloride; DCD = dicyandiamide; NBPT = N-(n-butyl) phosphoric triamide; RMB = Chinese yuan; Currency values are in US dollars (USD).
China is the world’s largest potato producer. Almost two-thirds of its potato production comes from six northwestern and southwestern provinces/regions
(i.e. Inner Mongolia, Gansu, Sichuan, Guizhou, Yunnan, and Chongqing city). Low fertilizer use and imbalanced nutrient application are partially responsible for low tuber yields and quality throughout. Significant area in the southwest is espe-cially dominated by mountains and plateaus, which present complex topography and production challenges. This article presents examples of nutrient management practices needed to address the nutrient requirements of potato in China. These examples are based on the 4R Nutrient Stewardship principles that provide the right nutrient source at the right rate, time, and place (Roberts, 2007).
Nutritional RequirementsIt is important to know the nutrient requirements of po-
tato before considering any particular nutrient management strategy. These requirements can vary considerably for all nutrients based on soil test levels. In the case of P, for example,
the presence of free lime at the surface can have a particular impact. Westerman (2005) reviewed potato nutrition data from the USA and Canada and found nutrient uptake to average 4.19 kg N/t, 1.26 kg P
2O
5/t, and 7.20 kg K
2O/t. Experiments in Inner
Mongolia (northwest China) from 2002 to 2007 found averages of 6.03 kg N/t, 1.30 kg P
2O
5/t, and 6.18 kg K
2O/t (Table 1).
Values for N were considerably higher than those reported by Westerman, while the P and K requirements were very similar. The difference observed for N may reflect both the severely degraded nature of soils at the Chinese field sites, and general overuse of N fertilizers in the recent past. This particular dataset found no clear differences in nutrient requirement per tonne of harvested tuber between rainfed and ir-rigated fields despite clear differences in final yield.
The Right SourceFor N, rapidly soluble sources such as urea
and ammonium bicarbonate (NH4HCO
3) are more
commonly used in China. However, slow/controlled-release N fertilizers are also used, which can contain a nitrification inhibitor (DCD) and/or urease inhibi-tor (NBPT), or are coated with inorganic materials (e.g. S), or an organic polymer. Slow/controlled-release N fertilizers regulate the release of fertilizer N over time, and can improve N use efficiency by synchronizing the supply of N with crop demand. They can also reduce application rates and labor costs. Slow/controlled-release N appears best suited
By Shutian Li and Jiyun Jin
In China, potato yields have been restricted by low and unbalanced nutrient input. A key measure to better tuber yield, quality, and improved nutrient use efficiency will be successful implementation of regionally-based, best nutrient management practices.
4R Nutrient Management Practices for Potato Production in China
Table 1. Nutrient requirements of rainfed and irrigated potato in northwest China.
YearWaterregime
Yield,t/ha
- - - - - - - - - - - - Nutrient uptake, kg/t - - - - - - - - - - - -N P2O5 K2O N:P2O5: K2O
2002 Rainfed 11.8 7.36 1.65 6.37 1:0.22:0.872002 Irrigated 34.4 5.89 1.41 4.89 1:0.24:0.832003 Rainfed 39.6 4.23 1.37 5.45 1:0.32:1.292003 Irrigated 32.4 5.71 1.15 5.64 1:0.20:0.992004 Rainfed 14.4 6.87 1.13 5.02 1:0.16:0.732004 Irrigated 26.0 4.70 0.73 5.67 1:0.16:1.212005 Rainfed 19.3 4.79 1.23 4.18 1:0.26:0.872005 Irrigated 37.5 4.40 1.58 6.63 1:0.36:1.512006 Rainfed 14.2 5.84 1.42 6.36 1:0.24:1.092006 Irrigated 31.5 6.91 1.62 7.91 1:0.23:1.142007 Rainfed 10.3 8.04 1.09 6.55 1:0.14:0.812007 Irrigated 30.6 7.58 1.21 9.44 1:0.16:1.25Average 22.7 6.03 1.30 6.18 1:0.22:1.02
Table 2. Effect of controlled-release urea (CRU) on tuber yield and N use efficiency compared with regular urea (RU), Inner Mongolia (2009 to 2011).
Treatment† Tuber yield, t/ha AEN, kg tuber /kg N‡ REN, %§
CK 30.2 da - -100% CRU 38.6 aa 33.3 ab 45.3 ab100% RU 36.4 ba 24.5 bc 32.1 ca75% CRU 37.0 ab 35.6 aa 52.3 aa75% RU 34.6 ca 22.4 ca 40.6 bc†CK = without N; 100% CRU = recommended N applied as CRU; 100% RU = recommended N rate applied as RU. Fertilizer N, P, and K were applied basally in all treatments. ‡AEN = Agronomic efficiency of N. §REN = Recovery efficiency of N.Means within the same column followed by the same letter are not significantly different at p = 0.05.
Better C
rops/Vol. 96 (2012, No. 1)
21
to irrigated potato systems, where N release can be regulated by soil moisture content. Experiments conducted in irrigated potato in Inner Mongolia from 2009 to 2011 indicate that, at the same N rate, control-release urea (CRU) resulted in bet-ter yield and higher N use efficiency than regular urea (RU). At 75% of the recommended N rate, CRU produced a similar yield and higher N use efficiency compared with RU at the recommended rate (Table 2).
While the source of P commonly used in potato varies (e.g. DAP, MAP, SSP, TSP, and calcium-magnesium phosphate) based on regional preference; KCl is the primary K source compared to other sources like K
2SO
4 and KNO
3. High soil K
supply is required to maintain both tuber yield and quality, and these in turn can be affected by K source. Either KCl or K
2SO
4 are the preferred sources based on yield data (Qin et al.,
2008; Kumar et al., 2007). Evidence suggests tuber starch and vitamin C content are increased, and the content of reduced sugar in tubers decreased, when potato is supplied with KCl instead of K
2SO
4 (Qin et al., 2008).
Organic nutrient sources such as animal manures and/or organic compost are effective nutrient sources in potato pro-duction. However, the combined use of manure with balanced application of fertilizer typically results in better yield (and economic returns) over those obtained with fertilizer or manure alone (Gallandt et al., 1998; Parmar et al., 2007).
The Right RateA number of approaches have been developed to help
determine proper fertilizer application rates in China’s agri-culture. Generally, a fertilizer recommendation based on soil testing and a target yield is commonly used for potato. The ASI systematic approach for soil testing and nutrient recommenda-tion (Hunter, 1980; Portch and Hunter, 2002) was found to be an effective nutrient management tool and is widely used in China (Jin et al., 2006). Compared to farmer’s practice (FP), more balanced, “optimum” treatments (OPT) recommended by the ASI procedure have increased tuber yields by an average of 3 t/ha, and farmer’s income by nearly USD 200/ha (Table 3).
Applied P generally has maximum solubility within a nar-row range in which P is not tied up in low solubility complexes with Fe and Al or Ca (Davenport et al., 2005). A common practice within China is to add P fertilizers in excess of plant removal (average requirement of 1.3 kg P
2O
5/t; see Table 1) to
overcome the effects of soil reactions that reduce P solubility (Davenport et al., 2005).
Few soils can produce high potato yields for many seasons without replenishing the K removed by harvested tubers. IPNI field data have found K responses as high as 22.2 t/ha in Qinghai with the application of 97 kg K
2O/ha; and 16.7 t/
ha in Gansu when 150 kg K2O/ha was applied.
Irrigated potato requires more nutrients and higher ap-
Table 3. Comparison of an optimum fertilizer treatment (OPT) with farmer’s practice (FP) in selected potato field trials from China.
Location TreatmentN,
kg/haP2O5,kg/ha
K2O,kg/ha
Tuber yield†,t/ha
Cost‡,USD/ha
GRF§,USD/ha
Jishishan, Gansu OPT 120 120 150 35.4 a 314 2,479
FP 160 130 110 29.0 b 269 2,223
Zhangjiachuan,Gansu OPT 104 172 168 29.6 a 193 2,144
FP 104 110 110 24.2 b 274 1,841
Wuchuan, IMAR OPT 125 125 100 14.2 a 281 1,841
FP¶ 160 118 110 13.3 a 294 1, 757
Wuchuan, IMAR OPT 250 225 200 31.5 a 540 1,949
FP# 141 151 110 29.6 b 853 1,485
Huzhu, Qinghai OPT 158 175 135 17.9 a 289 1,125
FP 240 152 190 17.2 a 290 1,069
Xining, Qinghai OPT 158 175 135 17.9 a 289 1,125
FP 240 152 190 17.1 a 290 1,060
Xining, QinghaiOPT 158 175 135 30.9 a 289 2,152
FP 240 152 190 27.5 b 290 1,883
Huaxian, Shaanxi OPT 181 322 225 47.9 a 596 3,189
FP 194 504 225 45.8 b 766 2,855
Mizhi, Shaanxi OPT 307 322 225 26.5 a 686 1,410
FP 358 110 110 22.5 b 254 1,523
Zhijin, GuizhouOPT 105 130 1166.5 14.5 a 155 1, 993
FP 175 1122.5 110 10.2 b 273 1, 735† Means in the same location followed by the same letter are not significantly different at p<0.05. ‡ The total cost (USD) of N, P, and K fertilizer: N = $0.71/kg, P2O5 = $0.88/kg, K2O = $0.82/kg. (1 USD = 6.36 RMB)§ GRF is the gross return to fertilizers and manures (when applied). Potato tuber price = $0.079/kg. ¶ Livestock manure applied at 7,500 kg/ha; $31.45/t# Livestock manure applied at 22,500 kg/ha; $31.45/t
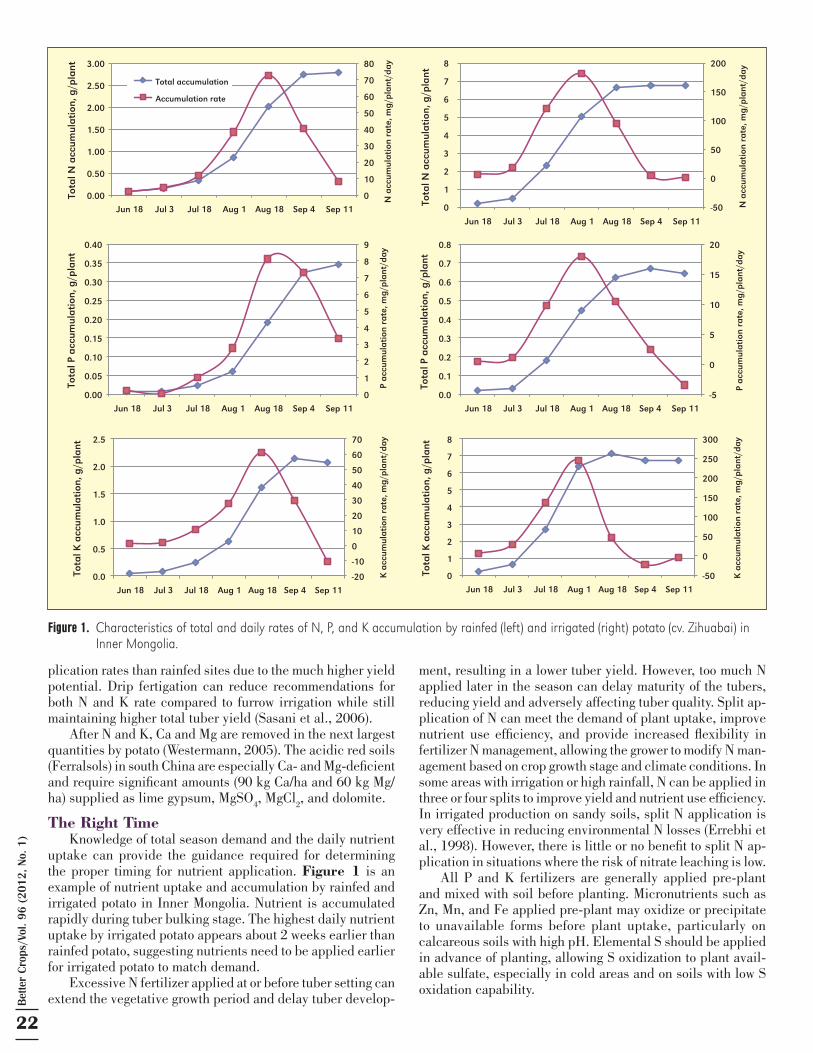
22
Bet
ter
Cro
ps/V
ol. 9
6 (2
012,
No.
1)
plication rates than rainfed sites due to the much higher yield potential. Drip fertigation can reduce recommendations for both N and K rate compared to furrow irrigation while still maintaining higher total tuber yield (Sasani et al., 2006).
After N and K, Ca and Mg are removed in the next largest quantities by potato (Westermann, 2005). The acidic red soils (Ferralsols) in south China are especially Ca- and Mg-deficient and require significant amounts (90 kg Ca/ha and 60 kg Mg/ha) supplied as lime gypsum, MgSO
4, MgCl
2, and dolomite.
The Right TimeKnowledge of total season demand and the daily nutrient
uptake can provide the guidance required for determining the proper timing for nutrient application. Figure 1 is an example of nutrient uptake and accumulation by rainfed and irrigated potato in Inner Mongolia. Nutrient is accumulated rapidly during tuber bulking stage. The highest daily nutrient uptake by irrigated potato appears about 2 weeks earlier than rainfed potato, suggesting nutrients need to be applied earlier for irrigated potato to match demand.
Excessive N fertilizer applied at or before tuber setting can extend the vegetative growth period and delay tuber develop-
ment, resulting in a lower tuber yield. However, too much N applied later in the season can delay maturity of the tubers, reducing yield and adversely affecting tuber quality. Split ap-plication of N can meet the demand of plant uptake, improve nutrient use efficiency, and provide increased flexibility in fertilizer N management, allowing the grower to modify N man-agement based on crop growth stage and climate conditions. In some areas with irrigation or high rainfall, N can be applied in three or four splits to improve yield and nutrient use efficiency. In irrigated production on sandy soils, split N application is very effective in reducing environmental N losses (Errebhi et al., 1998). However, there is little or no benefit to split N ap-plication in situations where the risk of nitrate leaching is low.
All P and K fertilizers are generally applied pre-plant and mixed with soil before planting. Micronutrients such as Zn, Mn, and Fe applied pre-plant may oxidize or precipitate to unavailable forms before plant uptake, particularly on calcareous soils with high pH. Elemental S should be applied in advance of planting, allowing S oxidization to plant avail-able sulfate, especially in cold areas and on soils with low S oxidation capability.
Figure 1. Characteristics of total and daily rates of N, P, and K accumulation by rainfed (left) and irrigated (right) potato (cv. Zihuabai) in Inner Mongolia.
0
10
20
30
40
50
60
70
80
0.00
0.50
1.00
1.50
2.00
2.50
3.00
Jun 18 Jul 3 Jul 18 Aug 1 Aug 18 Sep 4 Sep 11
N a
ccum
ulat
ion
rate
, mg/
plan
t/da
y
Tota
l N a
ccum
ulat
ion,
g/p
lant
Total accumulation
Accumulation rate
-50
0
50
100
150
200
0
1
2
3
4
5
6
7
8
Jun 18 Jul 3 Jul 18 Aug 1 Aug 18 Sep 4 Sep 11
N a
ccum
ulat
ion
rate
, mg/
plan
t/da
y
Tota
l N a
ccum
ulat
ion,
g/p
lant
0
1
2
3
4
5
6
7
8
9
0.00
0.05
0.10
0.15
0.20
0.25
0.30
0.35
0.40
Jun 18 Jul 3 Jul 18 Aug 1 Aug 18 Sep 4 Sep 11
P ac
cum
ulat
ion
rate
, mg/
plan
t/da
y
Tota
l P a
ccum
ulat
ion,
g/p
lant
-5
0
5
10
15
20
0.0
0.1
0.2
0.3
0.4
0.5
0.6
0.7
0.8
Jun 18 Jul 3 Jul 18 Aug 1 Aug 18 Sep 4 Sep 11
P ac
cum
ulat
ion
rate
, mg/
plan
t/da
y
Tota
l P a
ccum
ulat
ion,
g/p
lant
-20
-10
0
10
20
30
40
50
60
70
0.0
0.5
1.0
1.5
2.0
2.5
Jun 18 Jul 3 Jul 18 Aug 1 Aug 18 Sep 4 Sep 11
K a
ccum
ulat
ion
rate
, mg/
plan
t/da
y
Tota
l K a
ccum
ulat
ion,
g/p
lant
-50
0
50
100
150
200
250
300
0
1
2
3
4
5
6
7
8
Jun 18 Jul 3 Jul 18 Aug 1 Aug 18 Sep 4 Sep 11
K a
ccum
ulat
ion
rate
, mg/
plan
t/da
y
Tota
l K a
ccum
ulat
ion,
g/p
lant
Better C
rops/Vol. 96 (2012, No. 1)
23
The Right Place Nutrients can be applied in various ways to meet the re-
quirements for potato production. Most nutrients, including N, can be applied pre-plant if tilled into the rooting zone before planting. Both Mn and Fe applied pre-plant may oxidize to unavailable forms before plant uptake, particularly on the high pH calcareous soils. Nutrient source also influences applica-tion method and rate. Fertilizer applications after planting are usually done before row closure. When topdressing fertilizer materials are broadcast on the soil surface and should be followed by tillage operation such as ridging. Side-dressed materials are usually physically injected into the soil a few centimeters away from the potato seed.
Fertigation can be an alternative practice for nutrient appli-cation, particularly if the nutrient is mobile in the soil, such as nitrate. Fertigation application of nitrate can be more efficient than a pre-plant application when the nutrient is not leached out of the plant’s root zone during the process (Westermann et al. 1988). When nutrients are easily fixed by the soil (e.g. P in calcareous soil or acidic, red soil) they should not be applied by fertigation. In Northern China, where a single crop of potato is grown each year, consolidated farms with up to 100 ha of potato fields are becoming more common. Potato is irrigated by sprinkler irrigation systems, which can provide flexibility and efficient water application. Nitrogen and K fertilizer can both be applied through sprinkler irrigation.
Fertilizer banding can also improve efficiency of fertilizer N and P use. Banding fertilizer in ridges would also be expected to reduce the risk of nitrate leaching because of greater water infiltration in the furrow compared with the ridges (Zebarth and Rosen, 2007). Because potato has a low P use efficiency and limited ability to take up P at low soil P levels (Dechassa et al., 2003), P should be band applied to increase the P con-centration in the root zone.
SummaryResults from this research indicate that there is consider-
able opportunity to modify fertilizer rates for potato production in China. While degraded soils can influence the nutrient rates applied, the negative impact from the overuse of nutrients must be addressed. Fertilizer rates not only depend on potato requirements, but on fertilizer source, water regime, and soil conditions. The best nutrient management practice for potato is to apply nutrients using right source, right rate, right time, and right place (4R) strategies for high tuber yields and nutri-ent use efficiency. The determination of these four “rights” is a location (or site-specific) process. BC
ReferencesDavenport, J.R., P.H. Milburn, C.J. Rosen, and R.E. Thornton. 2005. Am. J.
of Potato Res. 82:321-328. Dechassa, N, Schenk, M.K., Claassen, N. and Steingrobe, B. 2003. Plant and
Soil, 250:215-224. Errebhi, M., C.J. Rosen, S.C. Gupta and D.E. Birong. 1998. Agron J. 90:10-15. Gallandt, E.R., E.B. Mallory, A.R. Alford, F.A. Drummond, E. Groden, M.
Liebman, M.C. Marra, J.C. McBurnie, and G.A. Porter. 1998. Am. J. Alt. Agric. 13:146-161.
Hunter, A.H. 1980. Mimeograph. Agro Service International, Florida, USA.Jin, J., Bai, Y., Yang, L. et al. 2006. China Agriculture Press. (in Chinese)Kumar, P., S.K. Pandey, B.P. Singh, S.V. Singh, and D. Kumar. 2007. Potato
Res. 50:1-13. Parmar, D.K., A. Sharma, S. Chaddha, V. Sharma, A. Vermani, A. Mishra, G.
Gautam, and V. Kumar. 2007. Potato J. 34(3-4):209-215. Portch, S., and A. Hunter. 2002. Modern Agriculture and Fertilizers, PPI/PPIC
China Program Special Publication No. 5.Qin Yusheng, T. Shihua, F. Wenqiang, S. Xifa. 2008. Better Crops China, 21,
13-16. Roberts, T.L. 2007. In Fertilizer Best Management Practices. IFA International
Workshop on Fertilizer Best Management Practices (FBMPs). 7-9 March, 2007. Brussels, Belgium. pp. 29-32.
Sasani, G.V., C.K. Patel, R.N. Patel, N.H. Patel, and S.H. Patel. 2006. Potato J. 33(3-4):131-133.
Westermann, D.T., G.E. Kleinkopf and L.K. Porter. 1988. Am. Potato J. 65: 377-386.
Westermann, D.T. 2005. Am. J. Potato Res. 82:301-307. Zebarth, B.J., and C.J. Rosen. 2007. Am. J. Potato Res. 84:3-18.
A Manual for Improving the Management of Plant Nutrition
4R Nutrient Stewardship is a new innovative approach for fertilizer best man-agement practices adopted by the world’s fertilizer industry. This approach considers economic, social, and environmental dimensions of nutrient man-
agement and is essential to sustainability of agricultural systems. The concept is simple—apply the right source of nutrient, at the right rate, at the right time, and in the right place—but the implementation is knowledge-intensive and site-specific. The 4R Plant Nutrition Manual is a wiro-o bound, 130 page (8½ x 11 in.) book filled with illustrations, learning modules, and case studies. The manual’s initial release will be as a North American version for USD 45 (includes ship-ping). For details on ordering contact IPNI, [email protected] or call 770-825-8082. BC
4R Plant Nutrition
North American Version – Available This March
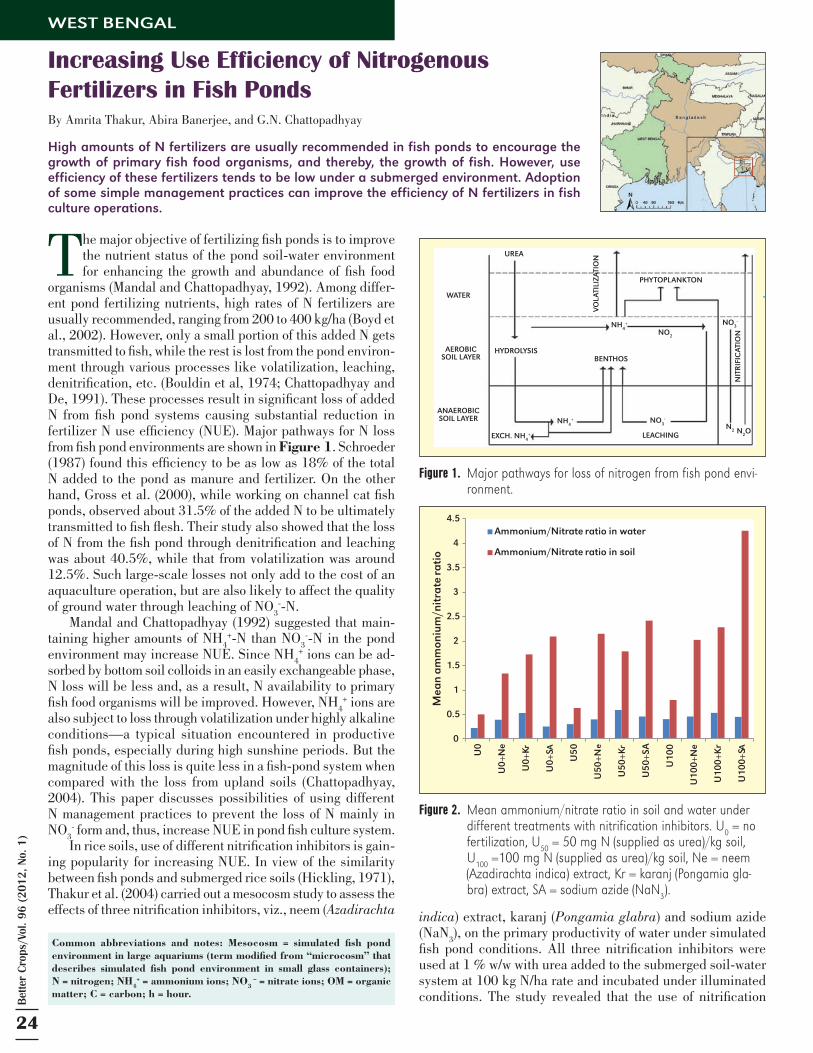
24
Bet
ter
Cro
ps/V
ol. 9
6 (2
012,
No.
1)
WEST BENGAL
Increasing Use Efficiency of Nitrogenous Fertilizers in Fish PondsBy Amrita Thakur, Abira Banerjee, and G.N. Chattopadhyay
High amounts of N fertilizers are usually recommended in fish ponds to encourage the growth of primary fish food organisms, and thereby, the growth of fish. However, use efficiency of these fertilizers tends to be low under a submerged environment. Adoption of some simple management practices can improve the efficiency of N fertilizers in fish culture operations.
Common abbreviations and notes: Mesocosm = simulated fish pond environment in large aquariums (term modified from “microcosm” that describes simulated fish pond environment in small glass containers); N = nitrogen; NH4
+ = ammonium ions; NO3 – = nitrate ions; OM = organic
matter; C = carbon; h = hour.
The major objective of fertilizing fish ponds is to improve the nutrient status of the pond soil-water environment for enhancing the growth and abundance of fish food
organisms (Mandal and Chattopadhyay, 1992). Among differ-ent pond fertilizing nutrients, high rates of N fertilizers are usually recommended, ranging from 200 to 400 kg/ha (Boyd et al., 2002). However, only a small portion of this added N gets transmitted to fish, while the rest is lost from the pond environ-ment through various processes like volatilization, leaching, denitrification, etc. (Bouldin et al, 1974; Chattopadhyay and De, 1991). These processes result in significant loss of added N from fish pond systems causing substantial reduction in fertilizer N use efficiency (NUE). Major pathways for N loss from fish pond environments are shown in Figure 1. Schroeder (1987) found this efficiency to be as low as 18% of the total N added to the pond as manure and fertilizer. On the other hand, Gross et al. (2000), while working on channel cat fish ponds, observed about 31.5% of the added N to be ultimately transmitted to fish flesh. Their study also showed that the loss of N from the fish pond through denitrification and leaching was about 40.5%, while that from volatilization was around 12.5%. Such large-scale losses not only add to the cost of an aquaculture operation, but are also likely to affect the quality of ground water through leaching of NO
3--N.
Mandal and Chattopadhyay (1992) suggested that main-taining higher amounts of NH
4+-N than NO
3--N in the pond
environment may increase NUE. Since NH4+ ions can be ad-
sorbed by bottom soil colloids in an easily exchangeable phase, N loss will be less and, as a result, N availability to primary fish food organisms will be improved. However, NH
4+ ions are
also subject to loss through volatilization under highly alkaline conditions—a typical situation encountered in productive fish ponds, especially during high sunshine periods. But the magnitude of this loss is quite less in a fish-pond system when compared with the loss from upland soils (Chattopadhyay, 2004). This paper discusses possibilities of using different N management practices to prevent the loss of N mainly in NO
3- form and, thus, increase NUE in pond fish culture system.In rice soils, use of different nitrification inhibitors is gain-
ing popularity for increasing NUE. In view of the similarity between fish ponds and submerged rice soils (Hickling, 1971), Thakur et al. (2004) carried out a mesocosm study to assess the effects of three nitrification inhibitors, viz., neem (Azadirachta indica) extract, karanj (Pongamia glabra) and sodium azide
(NaN3), on the primary productivity of water under simulated
fish pond conditions. All three nitrification inhibitors were used at 1 % w/w with urea added to the submerged soil-water system at 100 kg N/ha rate and incubated under illuminated conditions. The study revealed that the use of nitrification
Figure 1. Major pathways for loss of nitrogen from fish pond envi-ronment.
Figure 2. Mean ammonium/nitrate ratio in soil and water under different treatments with nitrification inhibitors. U0 = no fertilization, U50 = 50 mg N (supplied as urea)/kg soil, U100 =100 mg N (supplied as urea)/kg soil, Ne = neem (Azadirachta indica) extract, Kr = karanj (Pongamia gla-bra) extract, SA = sodium azide (NaN3).
UREA
VO
LATI
LIZA
TIO
N
NIT
RIF
ICA
TIO
N
WATER
AEROBICSOIL LAYER
ANAEROBICSOIL LAYER
HYDROLYSIS
EXCH. NH4
+
NH4
+ NO3
-
N2 N
2O
BENTHOS
PHYTOPLANKTON
LEACHING
NH4
+
NO2
NO3
-
0
0.5
1
1.5
2
2.5
3
3.5
4
4.5
U0
U0+
Ne
U0+
Kr
U0+
SA
U50
U50
+Ne
U50
+Kr
U50
+SA
U10
0
U10
0+N
e
U10
0+K
r
U10
0+SA
Mea
n am
mon
ium
/nit
rate
rati
o
Ammonium/Nitrate ratio in water
Ammonium/Nitrate ratio in soil
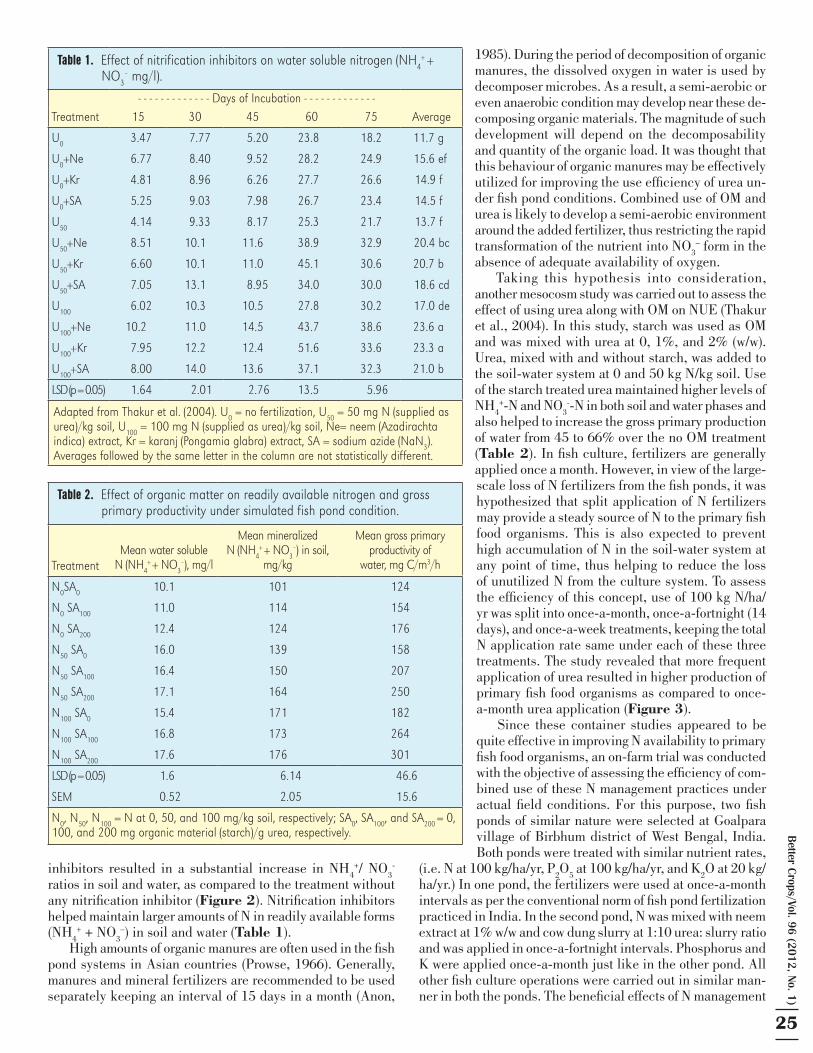
Better C
rops/Vol. 96 (2012, No. 1)
25
inhibitors resulted in a substantial increase in NH4
+/ NO3
- ratios in soil and water, as compared to the treatment without any nitrification inhibitor (Figure 2). Nitrification inhibitors helped maintain larger amounts of N in readily available forms (NH
4+ + NO
3–) in soil and water (Table 1).
High amounts of organic manures are often used in the fish pond systems in Asian countries (Prowse, 1966). Generally, manures and mineral fertilizers are recommended to be used separately keeping an interval of 15 days in a month (Anon,
1985). During the period of decomposition of organic manures, the dissolved oxygen in water is used by decomposer microbes. As a result, a semi-aerobic or even anaerobic condition may develop near these de-composing organic materials. The magnitude of such development will depend on the decomposability and quantity of the organic load. It was thought that this behaviour of organic manures may be effectively utilized for improving the use efficiency of urea un-der fish pond conditions. Combined use of OM and urea is likely to develop a semi-aerobic environment around the added fertilizer, thus restricting the rapid transformation of the nutrient into NO
3– form in the
absence of adequate availability of oxygen. Taking this hypothesis into consideration,
another mesocosm study was carried out to assess the effect of using urea along with OM on NUE (Thakur et al., 2004). In this study, starch was used as OM and was mixed with urea at 0, 1%, and 2% (w/w). Urea, mixed with and without starch, was added to the soil-water system at 0 and 50 kg N/kg soil. Use of the starch treated urea maintained higher levels of NH
4+-N and NO
3--N in both soil and water phases and
also helped to increase the gross primary production of water from 45 to 66% over the no OM treatment (Table 2). In fish culture, fertilizers are generally applied once a month. However, in view of the large-scale loss of N fertilizers from the fish ponds, it was hypothesized that split application of N fertilizers may provide a steady source of N to the primary fish food organisms. This is also expected to prevent high accumulation of N in the soil-water system at any point of time, thus helping to reduce the loss of unutilized N from the culture system. To assess the efficiency of this concept, use of 100 kg N/ha/yr was split into once-a-month, once-a-fortnight (14 days), and once-a-week treatments, keeping the total N application rate same under each of these three treatments. The study revealed that more frequent application of urea resulted in higher production of primary fish food organisms as compared to once-a-month urea application (Figure 3).
Since these container studies appeared to be quite effective in improving N availability to primary fish food organisms, an on-farm trial was conducted with the objective of assessing the efficiency of com-bined use of these N management practices under actual field conditions. For this purpose, two fish ponds of similar nature were selected at Goalpara village of Birbhum district of West Bengal, India. Both ponds were treated with similar nutrient rates,
(i.e. N at 100 kg/ha/yr, P2O
5 at 100 kg/ha/yr, and K
2O at 20 kg/
ha/yr.) In one pond, the fertilizers were used at once-a-month intervals as per the conventional norm of fish pond fertilization practiced in India. In the second pond, N was mixed with neem extract at 1% w/w and cow dung slurry at 1:10 urea: slurry ratio and was applied in once-a-fortnight intervals. Phosphorus and K were applied once-a-month just like in the other pond. All other fish culture operations were carried out in similar man-ner in both the ponds. The beneficial effects of N management
Table 1. Effect of nitrification inhibitors on water soluble nitrogen (NH4+ +
NO3– mg/l).
- - - - - - - - - - - - - Days of Incubation - - - - - - - - - - - - -Treatment 15 30 45 60 75 Average
U0 13.47 1 7.77 1 5.20 23.81 18.2 11.7 g1
U0+Ne 16.77 1 8.40 1 9.52 28.21 24.9 15.6 ef1
U0+Kr 14.81 1 8.96 1 6.26 27.71 26.6 14.9 f1
U0+SA 15.25 1 9.03 1 7.98 26.71 23.4 14.5 f1
U50 14.14 1 9.33 1 8.17 25.31 21.7 13.7 f1
U50+Ne 18.51 10.1 11.6 38.91 32.9 20.4 bc
U50+Kr 16.60 10.1 11.0 45.11 30.6 20.7 b1
U50+SA 17.05 13.1 1 8.95 34.01 30.0 18.6 cd
U100 16.02 10.3 10.5 27.81 30.2 17.0 de
U100+Ne 10.2 11.0 14.5 43.71 38.6 23.6 a1
U100+Kr 17.95 12.2 12.4 51.61 33.6 23.3 a1
U100+SA 18.00 14.0 13.6 37.11 32.3 21.0 b1
LSD (p = 0.05) 11.64 112.01 112.76 13.5 115.96
Adapted from Thakur et al. (2004). U0 = no fertilization, U50 = 50 mg N (supplied as urea)/kg soil, U100 = 100 mg N (supplied as urea)/kg soil, Ne= neem (Azadirachta indica) extract, Kr = karanj (Pongamia glabra) extract, SA = sodium azide (NaN3).Averages followed by the same letter in the column are not statistically different.
Table 2. Effect of organic matter on readily available nitrogen and gross primary productivity under simulated fish pond condition.
TreatmentMean water soluble
N (NH4+ + NO3
–), mg/l
Mean mineralizedN (NH4
+ + NO3–) in soil,
mg/kg
Mean gross primaryproductivity of
water, mg C/m3/h
N0SA0 10.1 101 124
N0 SA100 11.0 114 154
N0 SA200 12.4 124 176
N50 SA0 16.0 139 158
N50 SA100 16.4 150 207
N50 SA200 17.1 164 250
N100 SA0 15.4 171 182
N100 SA100 16.8 173 264
N100 SA200 17.6 176 301
LSD (p = 0.05) 11.6 11 6.14 1 46.6
SEM 110.52 11 2.05 1 15.6
N0, N50, N100 = N at 0, 50, and 100 mg/kg soil, respectively; SA0, SA100, and SA200 = 0, 100, and 200 mg organic material (starch)/g urea, respectively.
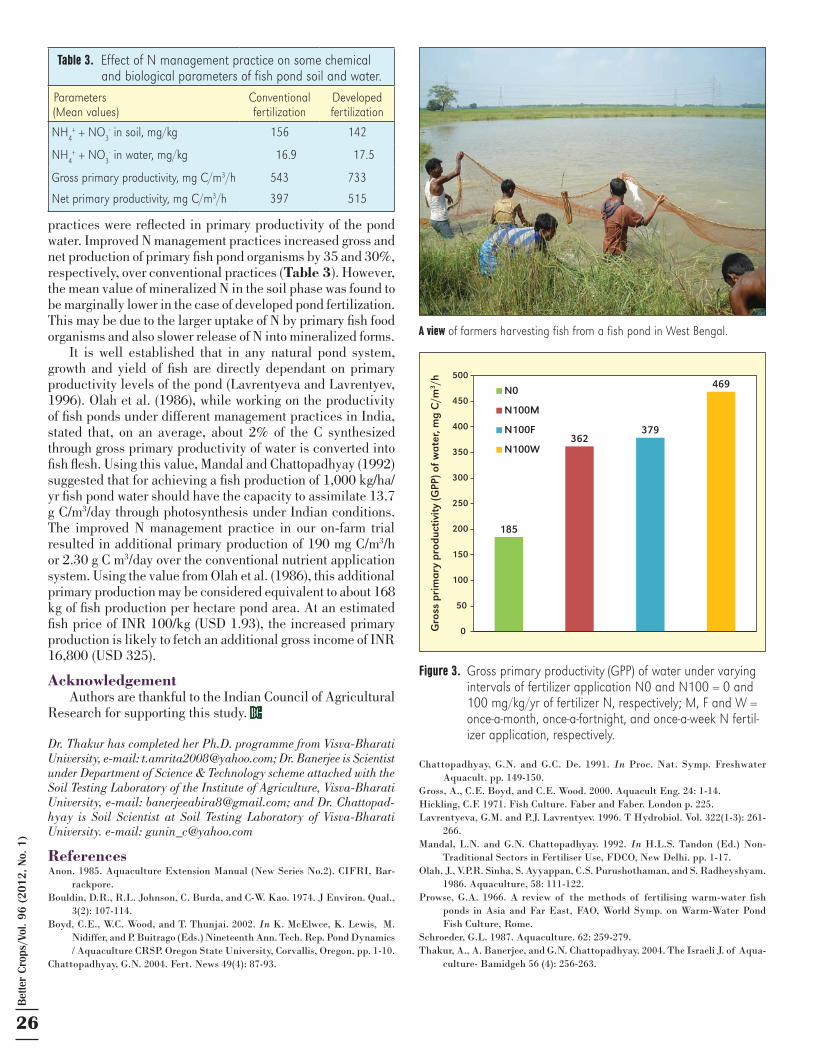
26
Bet
ter
Cro
ps/V
ol. 9
6 (2
012,
No.
1)
practices were reflected in primary productivity of the pond water. Improved N management practices increased gross and net production of primary fish pond organisms by 35 and 30%, respectively, over conventional practices (Table 3). However, the mean value of mineralized N in the soil phase was found to be marginally lower in the case of developed pond fertilization. This may be due to the larger uptake of N by primary fish food organisms and also slower release of N into mineralized forms.
It is well established that in any natural pond system, growth and yield of fish are directly dependant on primary productivity levels of the pond (Lavrentyeva and Lavrentyev, 1996). Olah et al. (1986), while working on the productivity of fish ponds under different management practices in India, stated that, on an average, about 2% of the C synthesized through gross primary productivity of water is converted into fish flesh. Using this value, Mandal and Chattopadhyay (1992) suggested that for achieving a fish production of 1,000 kg/ha/yr fish pond water should have the capacity to assimilate 13.7 g C/m3/day through photosynthesis under Indian conditions. The improved N management practice in our on-farm trial resulted in additional primary production of 190 mg C/m3/h or 2.30 g C m3/day over the conventional nutrient application system. Using the value from Olah et al. (1986), this additional primary production may be considered equivalent to about 168 kg of fish production per hectare pond area. At an estimated fish price of INR 100/kg (USD 1.93), the increased primary production is likely to fetch an additional gross income of INR 16,800 (USD 325).
AcknowledgementAuthors are thankful to the Indian Council of Agricultural
Research for supporting this study. BC
Dr. Thakur has completed her Ph.D. programme from Visva-Bharati University, e-mail: [email protected]; Dr. Banerjee is Scientist under Department of Science & Technology scheme attached with the Soil Testing Laboratory of the Institute of Agriculture, Visva-Bharati University, e-mail: [email protected]; and Dr. Chattopad-hyay is Soil Scientist at Soil Testing Laboratory of Visva-Bharati University. e-mail: [email protected]
ReferencesAnon. 1985. Aquaculture Extension Manual (New Series No.2). CIFRI, Bar-
rackpore.Bouldin, D.R., R.L. Johnson, C. Burda, and C-W. Kao. 1974. J Environ. Qual.,
3(2): 107-114.Boyd, C.E., W.C. Wood, and T. Thunjai. 2002. In K. McElwce, K. Lewis, M.
Nidiffer, and P. Buitrago (Eds.) Nineteenth Ann. Tech. Rep. Pond Dynamics / Aquaculture CRSP. Oregon State University, Corvallis, Oregon, pp. 1-10.
Chattopadhyay, G.N. 2004. Fert. News 49(4): 87-93.
Chattopadhyay, G.N. and G.C. De. 1991. In Proc. Nat. Symp. Freshwater Aquacult. pp. 149-150.
Gross, A., C.E. Boyd, and C.E. Wood. 2000. Aquacult Eng. 24: 1-14.Hickling, C.F. 1971. Fish Culture. Faber and Faber. London p. 225.Lavrentyeva, G.M. and P.J. Lavrentyev. 1996. T Hydrobiol. Vol. 322(1-3): 261-
266.Mandal, L.N. and G.N. Chattopadhyay. 1992. In H.L.S. Tandon (Ed.) Non-
Traditional Sectors in Fertiliser Use, FDCO, New Delhi. pp. 1-17.Olah, J., V.P.R. Sinha, S. Ayyappan, C.S. Purushothaman, and S. Radheyshyam.
1986. Aquaculture, 58: 111-122.Prowse, G.A. 1966. A review of the methods of fertilising warm-water fish
ponds in Asia and Far East, FAO, World Symp. on Warm-Water Pond Fish Culture, Rome.
Schroeder, G.L. 1987. Aquaculture. 62: 259-279.Thakur, A., A. Banerjee, and G.N. Chattopadhyay. 2004. The Israeli J. of Aqua-
culture- Bamidgeh 56 (4): 256-263.
185
362 379
469
0
50
100
150
200
250
300
350
400
450
500
N0
N100M
N100F
N100W
Gro
ss p
rim
ary
prod
ucti
vity
(GPP
) of w
ater
, mg
C/m
3 /h
Figure 3. Gross primary productivity (GPP) of water under varying intervals of fertilizer application N0 and N100 = 0 and 100 mg/kg/yr of fertilizer N, respectively; M, F and W = once-a-month, once-a-fortnight, and once-a-week N fertil-izer application, respectively.
Table 3. Effect of N management practice on some chemical and biological parameters of fish pond soil and water.
Parameters(Mean values)
Conventionalfertilization
Developedfertilization
NH4+ + NO3
- in soil, mg/kg 156 142
NH4+ + NO3
- in water, mg/kg 1 16.9 1 17.5
Gross primary productivity, mg C/m3/h 543 733
Net primary productivity, mg C/m3/h 397 515
A view of farmers harvesting fish from a fish pond in West Bengal.
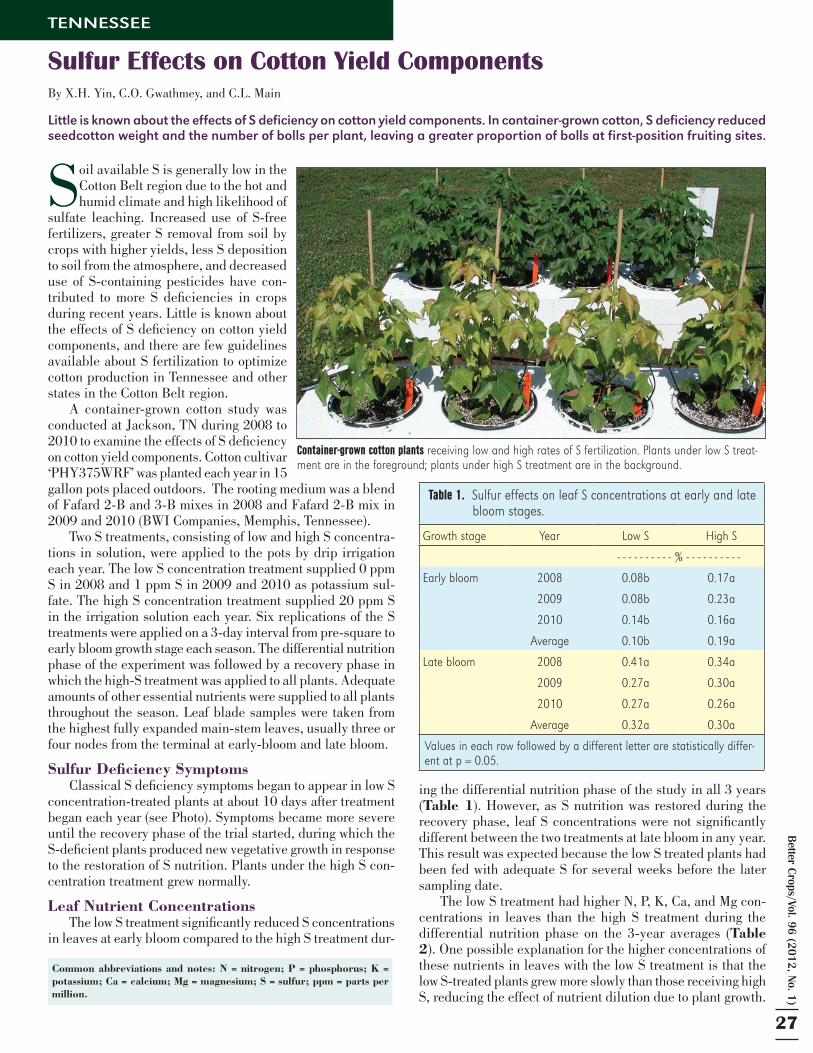
Better C
rops/Vol. 96 (2012, No. 1)
27
Common abbreviations and notes: N = nitrogen; P = phosphorus; K = potassium; Ca = calcium; Mg = magnesium; S = sulfur; ppm = parts per million.
TENNESSEE
Soil available S is generally low in the Cotton Belt region due to the hot and humid climate and high likelihood of
sulfate leaching. Increased use of S-free fertilizers, greater S removal from soil by crops with higher yields, less S deposition to soil from the atmosphere, and decreased use of S-containing pesticides have con-tributed to more S deficiencies in crops during recent years. Little is known about the effects of S deficiency on cotton yield components, and there are few guidelines available about S fertilization to optimize cotton production in Tennessee and other states in the Cotton Belt region.
A container-grown cotton study was conducted at Jackson, TN during 2008 to 2010 to examine the effects of S deficiency on cotton yield components. Cotton cultivar ‘PHY375WRF’ was planted each year in 15 gallon pots placed outdoors. The rooting medium was a blend of Fafard 2-B and 3-B mixes in 2008 and Fafard 2-B mix in 2009 and 2010 (BWI Companies, Memphis, Tennessee).
Two S treatments, consisting of low and high S concentra-tions in solution, were applied to the pots by drip irrigation each year. The low S concentration treatment supplied 0 ppm S in 2008 and 1 ppm S in 2009 and 2010 as potassium sul-fate. The high S concentration treatment supplied 20 ppm S in the irrigation solution each year. Six replications of the S treatments were applied on a 3-day interval from pre-square to early bloom growth stage each season. The differential nutrition phase of the experiment was followed by a recovery phase in which the high-S treatment was applied to all plants. Adequate amounts of other essential nutrients were supplied to all plants throughout the season. Leaf blade samples were taken from the highest fully expanded main-stem leaves, usually three or four nodes from the terminal at early-bloom and late bloom.
Sulfur Deficiency SymptomsClassical S deficiency symptoms began to appear in low S
concentration-treated plants at about 10 days after treatment began each year (see Photo). Symptoms became more severe until the recovery phase of the trial started, during which the S-deficient plants produced new vegetative growth in response to the restoration of S nutrition. Plants under the high S con-centration treatment grew normally.
Leaf Nutrient ConcentrationsThe low S treatment significantly reduced S concentrations
in leaves at early bloom compared to the high S treatment dur-
ing the differential nutrition phase of the study in all 3 years (Table 1). However, as S nutrition was restored during the recovery phase, leaf S concentrations were not significantly different between the two treatments at late bloom in any year. This result was expected because the low S treated plants had been fed with adequate S for several weeks before the later sampling date.
The low S treatment had higher N, P, K, Ca, and Mg con-centrations in leaves than the high S treatment during the differential nutrition phase on the 3-year averages (Table 2). One possible explanation for the higher concentrations of these nutrients in leaves with the low S treatment is that the low S-treated plants grew more slowly than those receiving high S, reducing the effect of nutrient dilution due to plant growth.
By X.H. Yin, C.O. Gwathmey, and C.L. Main
Little is known about the effects of S deficiency on cotton yield components. In container-grown cotton, S deficiency reduced seedcotton weight and the number of bolls per plant, leaving a greater proportion of bolls at first-position fruiting sites.
Sulfur Effects on Cotton Yield Components
Table 1. Sulfur effects on leaf S concentrations at early and late bloom stages.
Growth stage Year Low S High S
- - - - - - - - - - % - - - - - - - - - -
Early bloom 2008 0.08b 0.17a
2009 0.08b 0.23a
2010 0.14b 0.16a
Average 0.10b 0.19a
Late bloom 2008 0.41a 0.34a
2009 0.27a 0.30a
2010 0.27a 0.26a
Average 0.32a 0.30a
Values in each row followed by a different letter are statistically differ-ent at p = 0.05.
Container-grown cotton plants receiving low and high rates of S fertilization. Plants under low S treat-ment are in the foreground; plants under high S treatment are in the background.
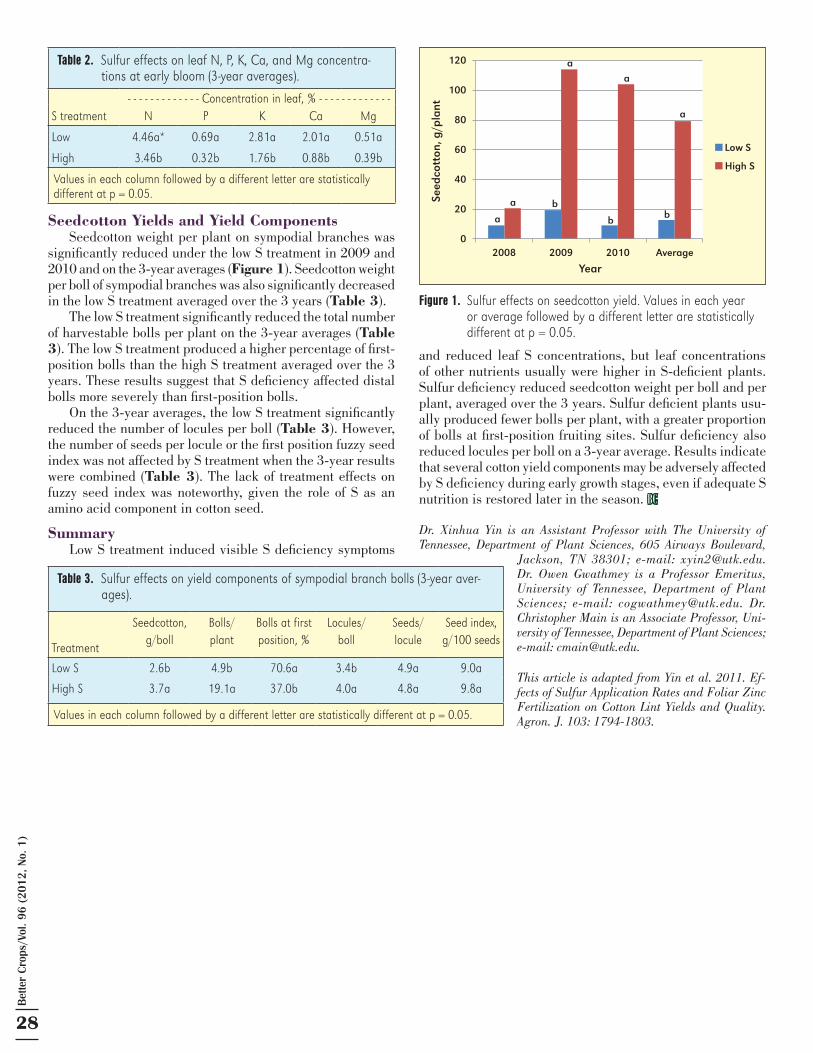
28
Bet
ter
Cro
ps/V
ol. 9
6 (2
012,
No.
1)
Seedcotton Yields and Yield ComponentsSeedcotton weight per plant on sympodial branches was
significantly reduced under the low S treatment in 2009 and 2010 and on the 3-year averages (Figure 1). Seedcotton weight per boll of sympodial branches was also significantly decreased in the low S treatment averaged over the 3 years (Table 3).
The low S treatment significantly reduced the total number of harvestable bolls per plant on the 3-year averages (Table 3). The low S treatment produced a higher percentage of first-position bolls than the high S treatment averaged over the 3 years. These results suggest that S deficiency affected distal bolls more severely than first-position bolls.
On the 3-year averages, the low S treatment significantly reduced the number of locules per boll (Table 3). However, the number of seeds per locule or the first position fuzzy seed index was not affected by S treatment when the 3-year results were combined (Table 3). The lack of treatment effects on fuzzy seed index was noteworthy, given the role of S as an amino acid component in cotton seed.
SummaryLow S treatment induced visible S deficiency symptoms
and reduced leaf S concentrations, but leaf concentrations of other nutrients usually were higher in S-deficient plants. Sulfur deficiency reduced seedcotton weight per boll and per plant, averaged over the 3 years. Sulfur deficient plants usu-ally produced fewer bolls per plant, with a greater proportion of bolls at first-position fruiting sites. Sulfur deficiency also reduced locules per boll on a 3-year average. Results indicate that several cotton yield components may be adversely affected by S deficiency during early growth stages, even if adequate S nutrition is restored later in the season. BC
Dr. Xinhua Yin is an Assistant Professor with The University of Tennessee, Department of Plant Sciences, 605 Airways Boulevard,
Jackson, TN 38301; e-mail: [email protected]. Dr. Owen Gwathmey is a Professor Emeritus, University of Tennessee, Department of Plant Sciences; e-mail: [email protected]. Dr. Christopher Main is an Associate Professor, Uni-versity of Tennessee, Department of Plant Sciences; e-mail: [email protected].
This article is adapted from Yin et al. 2011. Ef-fects of Sulfur Application Rates and Foliar Zinc Fertilization on Cotton Lint Yields and Quality. Agron. J. 103: 1794-1803.
Table 2. Sulfur effects on leaf N, P, K, Ca, and Mg concentra-tions at early bloom (3-year averages).
- - - - - - - - - - - - - Concentration in leaf, % - - - - - - - - - - - - -S treatment N P K Ca Mg
Low 4.46a* 0.69a 2.81a 2.01a 0.51a
High 3.46b 0.32b 1.76b 0.88b 0.39b
Values in each column followed by a different letter are statistically different at p = 0.05.
Table 3. Sulfur effects on yield components of sympodial branch bolls (3-year aver-ages).
Treatment
Seedcotton, g/boll
Bolls/plant
Bolls at first position, %
Locules/boll
Seeds/locule
Seed index, g/100 seeds
Low S 2.6b 4.9b 70.6a 3.4b 4.9a 9.0a
High S 3.7a 19.1a 37.0b 4.0a 4.8a 9.8a
Values in each column followed by a different letter are statistically different at p = 0.05.
Figure 1. Sulfur effects on seedcotton yield. Values in each year or average followed by a different letter are statistically different at p = 0.05.
Seed
cott
on, g
/pla
nt
Year
120
100
80
60
40
20
02008 2009 2010 Average
Low S
High S
a
a
a
a
b
a
b b
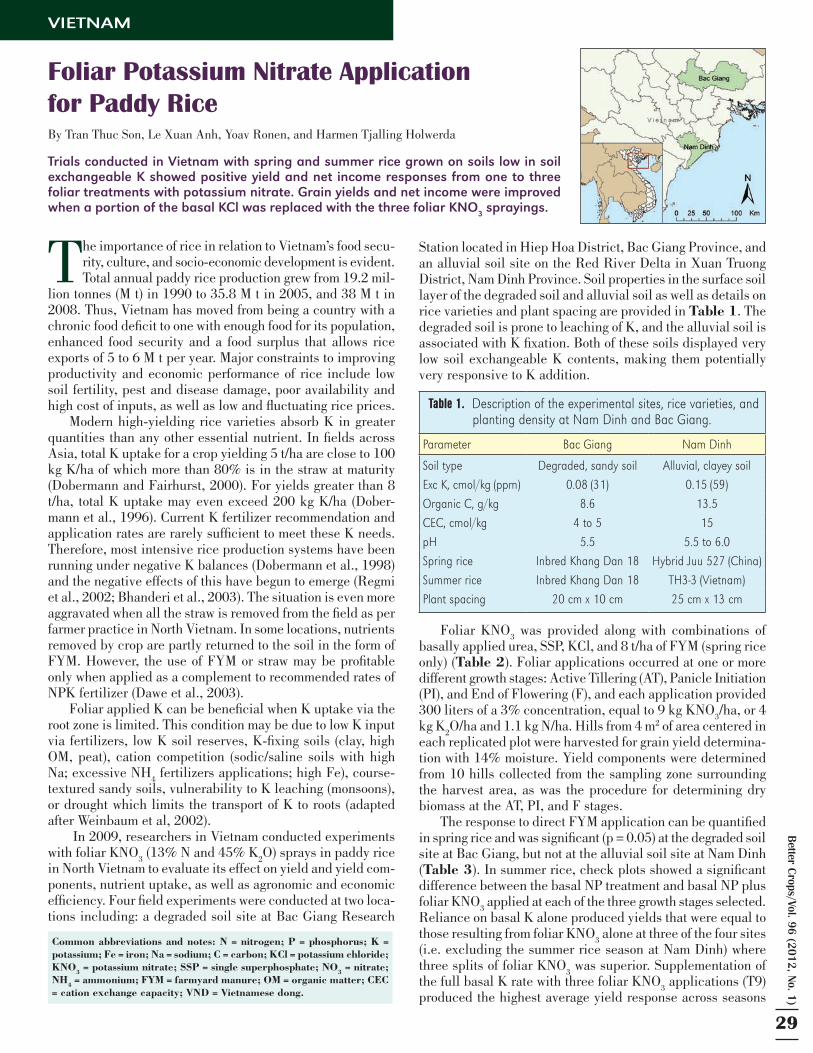
Better C
rops/Vol. 96 (2012, No. 1)
29
Common abbreviations and notes: N = nitrogen; P = phosphorus; K = potassium; Fe = iron; Na = sodium; C = carbon; KCl = potassium chloride; KNO3 = potassium nitrate; SSP = single superphosphate; NO3 = nitrate; NH4 = ammonium; FYM = farmyard manure; OM = organic matter; CEC = cation exchange capacity; VND = Vietnamese dong.
VIETNAM
The importance of rice in relation to Vietnam’s food secu-rity, culture, and socio-economic development is evident. Total annual paddy rice production grew from 19.2 mil-
lion tonnes (M t) in 1990 to 35.8 M t in 2005, and 38 M t in 2008. Thus, Vietnam has moved from being a country with a chronic food deficit to one with enough food for its population, enhanced food security and a food surplus that allows rice exports of 5 to 6 M t per year. Major constraints to improving productivity and economic performance of rice include low soil fertility, pest and disease damage, poor availability and high cost of inputs, as well as low and fluctuating rice prices.
Modern high-yielding rice varieties absorb K in greater quantities than any other essential nutrient. In fields across Asia, total K uptake for a crop yielding 5 t/ha are close to 100 kg K/ha of which more than 80% is in the straw at maturity (Dobermann and Fairhurst, 2000). For yields greater than 8 t/ha, total K uptake may even exceed 200 kg K/ha (Dober-mann et al., 1996). Current K fertilizer recommendation and application rates are rarely sufficient to meet these K needs. Therefore, most intensive rice production systems have been running under negative K balances (Dobermann et al., 1998) and the negative effects of this have begun to emerge (Regmi et al., 2002; Bhanderi et al., 2003). The situation is even more aggravated when all the straw is removed from the field as per farmer practice in North Vietnam. In some locations, nutrients removed by crop are partly returned to the soil in the form of FYM. However, the use of FYM or straw may be profitable only when applied as a complement to recommended rates of NPK fertilizer (Dawe et al., 2003).
Foliar applied K can be beneficial when K uptake via the root zone is limited. This condition may be due to low K input via fertilizers, low K soil reserves, K-fixing soils (clay, high OM, peat), cation competition (sodic/saline soils with high Na; excessive NH
4 fertilizers applications; high Fe), course-
textured sandy soils, vulnerability to K leaching (monsoons), or drought which limits the transport of K to roots (adapted after Weinbaum et al, 2002).
In 2009, researchers in Vietnam conducted experiments with foliar KNO
3 (13% N and 45% K
2O) sprays in paddy rice
in North Vietnam to evaluate its effect on yield and yield com-ponents, nutrient uptake, as well as agronomic and economic efficiency. Four field experiments were conducted at two loca-tions including: a degraded soil site at Bac Giang Research
Station located in Hiep Hoa District, Bac Giang Province, and an alluvial soil site on the Red River Delta in Xuan Truong District, Nam Dinh Province. Soil properties in the surface soil layer of the degraded soil and alluvial soil as well as details on rice varieties and plant spacing are provided in Table 1. The degraded soil is prone to leaching of K, and the alluvial soil is associated with K fixation. Both of these soils displayed very low soil exchangeable K contents, making them potentially very responsive to K addition.
Foliar KNO3 was provided along with combinations of
basally applied urea, SSP, KCl, and 8 t/ha of FYM (spring rice only) (Table 2). Foliar applications occurred at one or more different growth stages: Active Tillering (AT), Panicle Initiation (PI), and End of Flowering (F), and each application provided 300 liters of a 3% concentration, equal to 9 kg KNO
3/ha, or 4
kg K2O/ha and 1.1 kg N/ha. Hills from 4 m2 of area centered in
each replicated plot were harvested for grain yield determina-tion with 14% moisture. Yield components were determined from 10 hills collected from the sampling zone surrounding the harvest area, as was the procedure for determining dry biomass at the AT, PI, and F stages.
The response to direct FYM application can be quantified in spring rice and was significant (p = 0.05) at the degraded soil site at Bac Giang, but not at the alluvial soil site at Nam Dinh (Table 3). In summer rice, check plots showed a significant difference between the basal NP treatment and basal NP plus foliar KNO
3 applied at each of the three growth stages selected.
Reliance on basal K alone produced yields that were equal to those resulting from foliar KNO
3 alone at three of the four sites
(i.e. excluding the summer rice season at Nam Dinh) where three splits of foliar KNO
3 was superior. Supplementation of
the full basal K rate with three foliar KNO3 applications (T9)
produced the highest average yield response across seasons
By Tran Thuc Son, Le Xuan Anh, Yoav Ronen, and Harmen Tjalling Holwerda
Trials conducted in Vietnam with spring and summer rice grown on soils low in soil exchangeable K showed positive yield and net income responses from one to three foliar treatments with potassium nitrate. Grain yields and net income were improved when a portion of the basal KCl was replaced with the three foliar KNO
3 sprayings.
Foliar Potassium Nitrate Application for Paddy Rice
Table 1. Description of the experimental sites, rice varieties, and planting density at Nam Dinh and Bac Giang.
Parameter Bac Giang Nam Dinh
Soil type Degraded, sandy soil Alluvial, clayey soil Exc K, cmol/kg (ppm) 0.08 (31) 0.15 (59)Organic C, g/kg 8.6 13.5 CEC, cmol/kg 4 to 5 15 pH 5.5 5.5 to 6.0 Spring rice Inbred Khang Dan 18 Hybrid Juu 527 (China)Summer rice Inbred Khang Dan 18 TH3-3 (Vietnam)Plant spacing 20 cm x 10 cm 25 cm x 13 cm
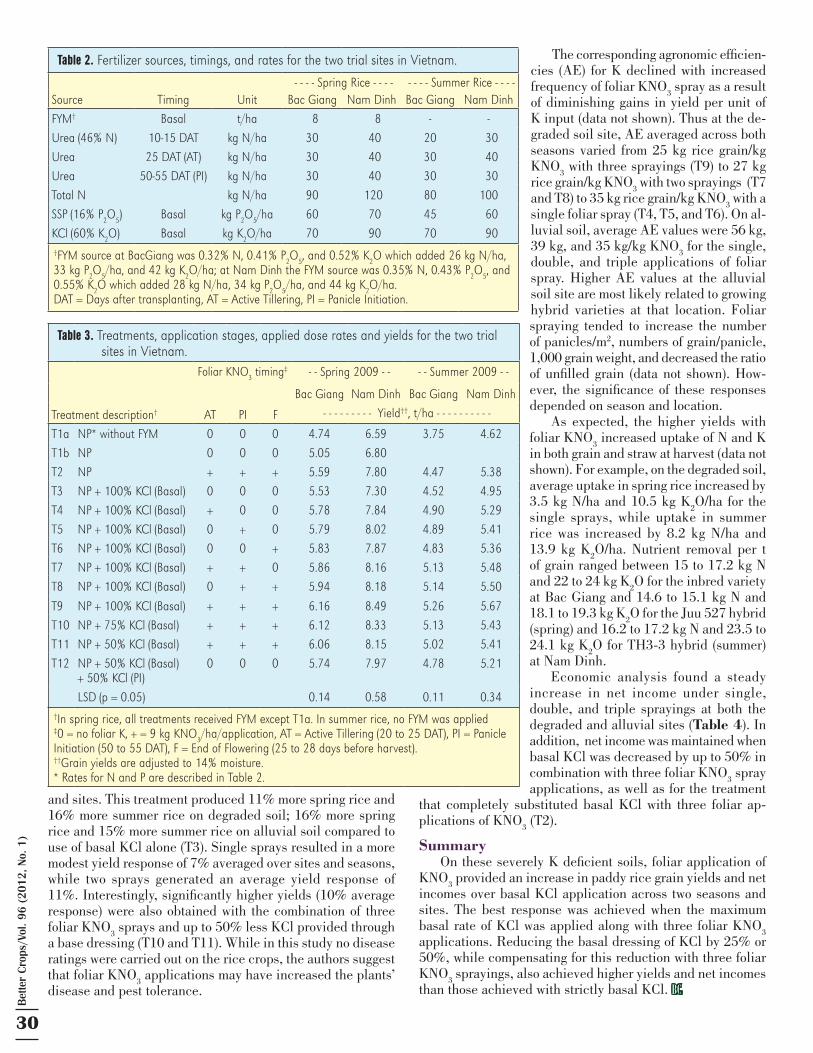
30
Bet
ter
Cro
ps/V
ol. 9
6 (2
012,
No.
1)
and sites. This treatment produced 11% more spring rice and 16% more summer rice on degraded soil; 16% more spring rice and 15% more summer rice on alluvial soil compared to use of basal KCl alone (T3). Single sprays resulted in a more modest yield response of 7% averaged over sites and seasons, while two sprays generated an average yield response of 11%. Interestingly, significantly higher yields (10% average response) were also obtained with the combination of three foliar KNO
3 sprays and up to 50% less KCl provided through
a base dressing (T10 and T11). While in this study no disease ratings were carried out on the rice crops, the authors suggest that foliar KNO
3 applications may have increased the plants’
disease and pest tolerance.
The corresponding agronomic efficien-cies (AE) for K declined with increased frequency of foliar KNO
3 spray as a result
of diminishing gains in yield per unit of K input (data not shown). Thus at the de-graded soil site, AE averaged across both seasons varied from 25 kg rice grain/kg KNO
3 with three sprayings (T9) to 27 kg
rice grain/kg KNO3 with two sprayings (T7
and T8) to 35 kg rice grain/kg KNO3 with a
single foliar spray (T4, T5, and T6). On al-luvial soil, average AE values were 56 kg, 39 kg, and 35 kg/kg KNO
3 for the single,
double, and triple applications of foliar spray. Higher AE values at the alluvial soil site are most likely related to growing hybrid varieties at that location. Foliar spraying tended to increase the number of panicles/m2, numbers of grain/panicle, 1,000 grain weight, and decreased the ratio of unfilled grain (data not shown). How-ever, the significance of these responses depended on season and location.
As expected, the higher yields with foliar KNO
3 increased uptake of N and K
in both grain and straw at harvest (data not shown). For example, on the degraded soil, average uptake in spring rice increased by 3.5 kg N/ha and 10.5 kg K
2O/ha for the
single sprays, while uptake in summer rice was increased by 8.2 kg N/ha and 13.9 kg K
2O/ha. Nutrient removal per t
of grain ranged between 15 to 17.2 kg N and 22 to 24 kg K
2O for the inbred variety
at Bac Giang and 14.6 to 15.1 kg N and 18.1 to 19.3 kg K
2O for the Juu 527 hybrid
(spring) and 16.2 to 17.2 kg N and 23.5 to 24.1 kg K
2O for TH3-3 hybrid (summer)
at Nam Dinh.Economic analysis found a steady
increase in net income under single, double, and triple sprayings at both the degraded and alluvial sites (Table 4). In addition, net income was maintained when basal KCl was decreased by up to 50% in combination with three foliar KNO
3 spray
applications, as well as for the treatment that completely substituted basal KCl with three foliar ap-plications of KNO
3 (T2).
SummaryOn these severely K deficient soils, foliar application of
KNO3 provided an increase in paddy rice grain yields and net
incomes over basal KCl application across two seasons and sites. The best response was achieved when the maximum basal rate of KCl was applied along with three foliar KNO
3
applications. Reducing the basal dressing of KCl by 25% or 50%, while compensating for this reduction with three foliar KNO
3 sprayings, also achieved higher yields and net incomes
than those achieved with strictly basal KCl. BC
Table 3. Treatments, application stages, applied dose rates and yields for the two trial sites in Vietnam.
Foliar KNO3 timing‡ - - Spring 2009 - - - - Summer 2009 - -
AT PI F
Bac Giang Nam Dinh Bac Giang Nam Dinh
Treatment description† - - - - - - - - - Yield††, t/ha - - - - - - - - - -
T1a NP* without FYM 0 0 0 4.74 6.59 3.75 4.62T1b NP 0 0 0 5.05 6.80T2 NP + + + 5.59 7.80 4.47 5.38T3 NP + 100% KCl (Basal) 0 0 0 5.53 7.30 4.52 4.95T4 NP + 100% KCl (Basal) + 0 0 5.78 7.84 4.90 5.29T5 NP + 100% KCl (Basal) 0 + 0 5.79 8.02 4.89 5.41T6 NP + 100% KCl (Basal) 0 0 + 5.83 7.87 4.83 5.36T7 NP + 100% KCl (Basal) + + 0 5.86 8.16 5.13 5.48T8 NP + 100% KCl (Basal) 0 + + 5.94 8.18 5.14 5.50
T9 NP + 100% KCl (Basal) + + + 6.16 8.49 5.26 5.67T10 NP + 75% KCl (Basal) + + + 6.12 8.33 5.13 5.43T11 NP + 50% KCl (Basal) + + + 6.06 8.15 5.02 5.41T12 NP + 50% KCl (Basal)
+ 50% KCl (PI)0 0 0 5.74 7.97 4.78 5.21
LSD (p = 0.05) 0.14 0.58 0.11 0.34†In spring rice, all treatments received FYM except T1a. In summer rice, no FYM was applied‡0 = no foliar K, + = 9 kg KNO3/ha/application, AT = Active Tillering (20 to 25 DAT), PI = Panicle Initiation (50 to 55 DAT), F = End of Flowering (25 to 28 days before harvest).††Grain yields are adjusted to 14% moisture.* Rates for N and P are described in Table 2.
Table 2. Fertilizer sources, timings, and rates for the two trial sites in Vietnam.
- - - - Spring Rice - - - - - - - - Summer Rice - - - -Source Timing Unit Bac Giang Nam Dinh Bac Giang Nam DinhFYM† Basal t/ha 28 118 - - Urea (46% N) 10-15 DAT kg N/ha 30 140 20 130 Urea 25 DAT (AT) kg N/ha 30 140 30 140 Urea 50-55 DAT (PI) kg N/ha 30 140 30 130 Total N kg N/ha 90 120 80 100SSP (16% P
2O5) Basal kg P2O5/ha 60 170 45 160 KCl (60% K2O) Basal kg K2O/ha 70 190 70 190 †FYM source at BacGiang was 0.32% N, 0.41% P2O5, and 0.52% K2O which added 26 kg N/ha, 33 kg P2O5/ha, and 42 kg K2O/ha; at Nam Dinh the FYM source was 0.35% N, 0.43% P2O5, and 0.55% K2O which added 28 kg N/ha, 34 kg P2O5/ha, and 44 kg K2O/ha.DAT = Days after transplanting, AT = Active Tillering, PI = Panicle Initiation.
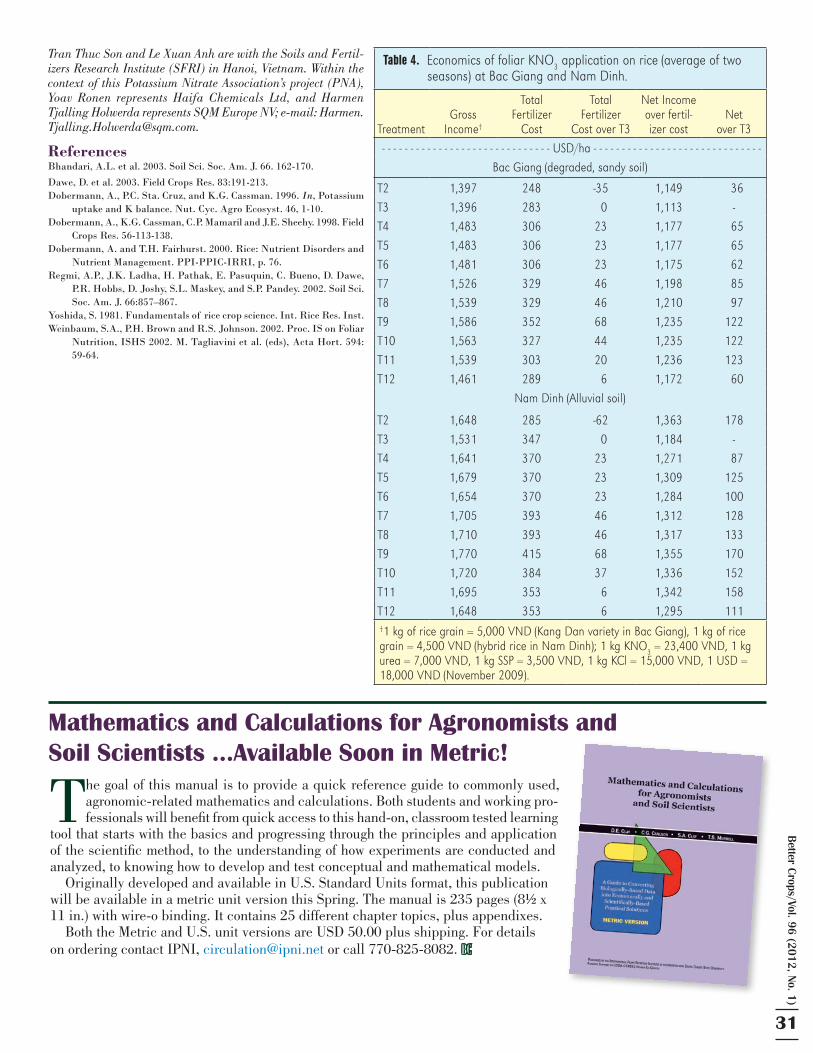
Better C
rops/Vol. 96 (2012, No. 1)
31
Tran Thuc Son and Le Xuan Anh are with the Soils and Fertil-izers Research Institute (SFRI) in Hanoi, Vietnam. Within the context of this Potassium Nitrate Association’s project (PNA), Yoav Ronen represents Haifa Chemicals Ltd, and Harmen Tjalling Holwerda represents SQM Europe NV; e-mail: [email protected].
ReferencesBhandari, A.L. et al. 2003. Soil Sci. Soc. Am. J. 66. 162-170.
Dawe, D. et al. 2003. Field Crops Res. 83:191-213.Dobermann, A., P.C. Sta. Cruz, and K.G. Cassman. 1996. In, Potassium
uptake and K balance. Nut. Cyc. Agro Ecosyst. 46, 1-10.Dobermann, A., K.G. Cassman, C.P. Mamaril and J.E. Sheehy. 1998. Field
Crops Res. 56-113-138.Dobermann, A. and T.H. Fairhurst. 2000. Rice: Nutrient Disorders and
Nutrient Management. PPI-PPIC-IRRI, p. 76.Regmi, A.P., J.K. Ladha, H. Pathak, E. Pasuquin, C. Bueno, D. Dawe,
P.R. Hobbs, D. Joshy, S.L. Maskey, and S.P. Pandey. 2002. Soil Sci. Soc. Am. J. 66:857–867.
Yoshida, S. 1981. Fundamentals of rice crop science. Int. Rice Res. Inst.Weinbaum, S.A., P.H. Brown and R.S. Johnson. 2002. Proc. IS on Foliar
Nutrition, ISHS 2002. M. Tagliavini et al. (eds), Acta Hort. 594: 59-64.
Table 4. Economics of foliar KNO3 application on rice (average of two seasons) at Bac Giang and Nam Dinh.
TreatmentGross
Income†
TotalFertilizer
Cost
TotalFertilizer
Cost over T3
Net Incomeover fertil-izer cost
Netover T3
- - - - - - - - - - - - - - - - - - - - - - - - - - - - - - USD/ha - - - - - - - - - - - - - - - - - - - - - - - - - - - - - - Bac Giang (degraded, sandy soil)
T2 1,397 248 -35 1,149 136T3 1,396 283 20 1,113 -T4 1,483 306 23 1,177 165T5 1,483 306 23 1,177 165T6 1,481 306 23 1,175 162T7 1,526 329 46 1,198 185T8 1,539 329 46 1,210 197T9 1,586 352 68 1,235 122T10 1,563 327 44 1,235 122T11 1,539 303 20 1,236 123T12 1,461 289 26 1,172 160
Nam Dinh (Alluvial soil)
T2 1,648 285 -62 1,363 178T3 1,531 347 20 1,184 -T4 1,641 370 23 1,271 187T5 1,679 370 23 1,309 125T6 1,654 370 23 1,284 100T7 1,705 393 46 1,312 128T8 1,710 393 46 1,317 133T9 1,770 415 68 1,355 170T10 1,720 384 37 1,336 152T11 1,695 353 26 1,342 158T12 1,648 353 26 1,295 111†1 kg of rice grain = 5,000 VND (Kang Dan variety in Bac Giang), 1 kg of rice grain = 4,500 VND (hybrid rice in Nam Dinh); 1 kg KNO3 = 23,400 VND, 1 kg urea = 7,000 VND, 1 kg SSP = 3,500 VND, 1 kg KCl = 15,000 VND, 1 USD = 18,000 VND (November 2009).
The goal of this manual is to provide a quick reference guide to commonly used, agronomic-related mathematics and calculations. Both students and working pro-fessionals will benefit from quick access to this hand-on, classroom tested learning
tool that starts with the basics and progressing through the principles and application of the scientific method, to the understanding of how experiments are conducted and analyzed, to knowing how to develop and test conceptual and mathematical models. Originally developed and available in U.S. Standard Units format, this publication will be available in a metric unit version this Spring. The manual is 235 pages (8½ x 11 in.) with wire-o binding. It contains 25 different chapter topics, plus appendixes. Both the Metric and U.S. unit versions are USD 50.00 plus shipping. For details on ordering contact IPNI, [email protected] or call 770-825-8082. BC
Mathematics and Calculations for Agronomists and Soil Scientists …Available Soon in Metric!
The Agronomy Age
International Plant Nutrition Institute3500 Parkway Lane, Suite 550Norcross, Georgia 30092-2844
www.ipni.net
As a new year begins, I often find myself taking inven-tory of the “big ideas” of the last year. This year has been no different. One prominent idea
exclaims that “This is the Agronomy Age!” because so many of the major challenges the world faces today and in the foreseeable future can only be met with the involvement of agronomic science and the technology and practices that stem from it. The plant nutrition industry plays a major role it that process. Some might view the Agronomy Age as an age of the past because agronomy is an old discipline. In fact, over the last couple de-cades in North America, in the interest of appear-ing more exciting and cutting edge to students and granting agencies, many of our universities elimi-nated “agronomy” from their department names.
In reality, the discipline of agronomy remains only partially developed today, but the tools now exist to rapidly make progress in more systematic integration and application of the pieces of the science. T h i s This publication features many of those tools and their development and promotion are major roles of IPNI programs.
The process of 4R Nutrient Stewardship has become a major IPNI program emphasis, a process that includes nutrient performance assessment. Science tells us that applied plant nutrients can meet stakeholder perfor-mance expectations only when they are used in systems where all the agronomic pieces have been properly assembled. The success of IPNI programs and the fertilizer industry is dependent on this age indeed being the Agronomy Age.
The opportunities in agronomy today are immense, but progress is often threatened by lack of a critical mass of financial and human resources. Much is to be gained through forging partnerships across disciplines, political boundaries, public and private sectors, and generations of scientists and practitioners.
So as we close one year and launch another, I am grateful to be partnered with a team of highly talented and dedicated staff focused on a critical mandate and for the members and other supporters that enable us to fully participate in this Agronomy Age.
Dr. Paul E. FixenIPNI Senior Vice President,
and Director of Research