soil test basics - montana state university
TRANSCRIPT

Soil Fertility, Testing, Amending
Master Farmer Course - Pondera County Extension
February 13, 2020
Clain Jones, Extension Soil Fertility Specialist994-6076, [email protected], and Rick Engel

Today’s topics
• Soil properties and how they interact with plant nutrients
• What can be learned from a soil test• The limitations of soil properties you can
influence• 4Rs of Fertilization• Management for healthy soil
The Montana Fertilizer Advisory Committee and the Western Sustainable Agriculture Research and Education Program are major funding sources for MSU studies included in this talk.

Soil Quality vs Soil Health
Soil Quality = properties that change little, if at all, with land use management practices, often found on a traditional soil test• Texture• Cation Exchange Capacity
Soil Health = dynamic properties which may be subjective to measure• Aggregation• Microbial activity• Tilth• Nutrient availability• Water holding capacity• CompactionWhere do SOM and soil
pH belong?
On both lists

What to look for on a soil test report? Factors affecting plant health and production
Factor Values of concern Impact/considerNutrient content Nutrient dependent Too little = hungry plants, too much =
contaminate water, burn plants
Soil organicmatter
≤ 1 (%) Minimize bare soil, increase N, add legumes
> 3 (%) N credit
Soil pH
< 5 Al toxicity
< 6 Poor seedling establishment and legume nodulation
> 8.3 Nutrients tied up, likely high Na
Soluble salts (EC) > 4 (mmhos/cm) Too saline, water stress, nutrient
imbalance
Soil texture and CEC Water and nutrient holding capacity
Factor Values of concern Impact/considerNutrient content Nutrient dependent Too little = hungry plants, too much =
contaminate water, burn plants
Soil organicmatter
≤ 1 (%) Minimize bare soil, increase N, add legumes
> 3 (%) N credit
Factor Values of concern Impact/considerNutrient content Nutrient dependent Too little = hungry plants, too much =
contaminate water, burn plants
Soil organicmatter
≤ 1 (%) Minimize bare soil, increase N, add legumes
> 3 (%) N credit
Soil pH
< 5 Al toxicity
< 6 Poor seedling establishment and legume nodulation
> 8.3 Nutrients tied up, likely high Na

Particle and pore size
Water and
nutrient holding capacity
Sand: large pore space, low surface area = low water or nutrient holding capacity
Clay: small pore space, large surface area, often negative charge on surface = holds water and nutrients tight
Soil texture
Ideal is loam to clay loam
approx. equal parts of sand,
silt, clay
Images by K. Olson-Rutz

Mason jar texture test Fill a straight sided jar 1/3 with soil
Add water until almost full
Add 1 tsp dishwasher soap or water softener (why?)
Shake and let settle
Mark sand depth at 1 min.
Mark silt depth after 6 hours (or by color/texture change with clay at 24 hr)
Calculate clay by difference (or measure at 24 hours)
http://landresources.montana.edu/soilfertility/documents/PDF/SoilTextureJarTest.pdf

Using the soil texture triangle Textural
triangle for the tactile

DrainageInfiltration
Water holding capacity
Aeration CEC
Sand excellent poor excellent low
Silt good good good medium
Clay poor excellent poor high
Texture Effects on Soil Properties
Soils with large surface areas, such as clay and organic matter, have more cation exchange capacity and surface area and therefore are generally more fertile.

loamy sandCEC ≈ 10
-
clayCEC ≈ 40 -
-
-
-
SOMCEC ≈ 200 -
-
-
--
--
-
- -
- -
------
-
-
Cation Exchange Capacity CEC the parking spaces for nutrients in the soil• CEC is the total neg. charge on a soil
(meq/100g)
• A high CEC soil (> 15) has the capacity to attract and hold nutrients with positive charges, e.g. K+, Zn+2, NH4
+
• Large surface area (clay, SOM) ≈ larger CEC ≈ generally more fertile.
• What else might high CEC soils hold onto?
• CEC of mineral soil is hard to change but can slowly change SOM
Herbicides
1 Tbsp sand has surface area of a kitchen table
1 Tbsp has surface area of a football field

What does SOM do for soil?
SOM = Soil organic matter
Hudson 1994
• Increases water holding capacity which helps nutrients move from soil to plant roots and should increase yield
• As decomposes it releases nutrients bound in OM structure

Small increases in SOM lead to potentially large improvement in soil structure
Fisher et al., 2007Australia, irrigated, variety of soil types
Aggregate stabilityWater infiltrationRoot growthReduced water
and wind erosion

Guesses on how long to increase soil organic matter (SOM) from 1.4 to 1.5%?
Changing SOM?
• A long time. MSU study, CRP increased SOM from 1.4% to 1.5% in 10 years in top foot.
• Fallow, especially tilled – loses SOM!
• Hay, or heavily grazed pasture maybe maintaining, likely losing SOM
Engel et al. 2017

Questions?
On to pH

pH affects soil nutrient availability
High pH, alkaline calcareous soils –may limit P, Fe, Mn, B, Cu, Zn, plant can’t get them
Low pH, acidic soils – may limit N, and eventually Ca, Mg, K, Mo because they don’t stick tight and can leach away (Fe) or form minerals (P), Al toxicity
Troeh and Wegner, 2013

What were historical surface horizon pH values in this region?
Many arable soils in our region are high pH because of a calcium layer
No data
Map courtesy of NRCS
21 samples in Pondera Co. by Adriane Good, May 2018
Is that changing?

Soil acidification: MT counties with at least one field with pH < 5.5
40% of 20 random locations in Chouteau County have pH < 5.5 in top 2”
Jan 2020Symbol is not on location of field(s)

Agronomic reasons for soil acidification
• Ammonium-based N fertilizer above plant needs due to Nitrification:
ammonium or urea fertilizer + air + H2O→ nitrate (NO3-) + acid (H+)
• Leaching loss of nitrate – less nitrate uptake and less root release of basic anions (OH- and HCO3
-) to maintain charge balance. • Crop residue removal – removes Ca, Mg, K (‘base’ cations).
6x the lime to replace base cations removed by oat straw harvest than just oat grain harvest (NE Ext G1503)
• Lack of deep tillage concentrates acidity where N fertilizer applied• Legumes acidify their rooting zone through N-fixation. Perennial
legumes (e.g., alfalfa) more so than annuals (e.g., pea). Yet apparently much less than fertilization of wheat.

8-yrs of N (0, ½, full, 1 ½ recommended rate) reduced top 4-inch soil pH in dryland near Big Sandy
Jones and Miller unpub datasandy clay loam, 1.1% OM
100 lb N/acre
0.12 pH units
5.2
5.4
5.6
5.8
6.0
6.2
6.4
0 100 200 300 400 500 600 700
Soil
pH (0
-3”)
8-yr total fertilizer N (lb/ac)
Fallow SW PGrain LegGM/hayIn rotation with WW

8-yrs of pea in rotation slowed pH reduction
Jones and Miller, unpub datasandy clay loam, 1.1% OM

Is this a real issue or Rick and me looking for more work?
Image courtesy Scott Powell
Safflower field near Big Sandy, 2018 pH 4.3 – 4.5 in bare areas
More on this at end of talk, if time.

Questions?
On to soil nutrients

For sustainable, healthy production
INPUTS OUTPUTS
NUTRIENTS
Mineral soil/organic matter
FertilizerManure
N-fixation by legumes
Harvest
Erosion
Runoff
Leaching
In many ag systems, outputs > inputs = mining the soil for nutrientsLoss of soil productivity leads to financial loss
Inputs should = OutputsMinimize erosion, runoff and leaching losses from the system

Most common lacking nutrient is nitrogen (N)
NH4+
NH3
NO3-
N2Gas
Deni
trifi
catio
n
Vola
tiliza
tion
Plan
t Upt
ake
Leac
hing
Organic material
Clay or OM
Exchange
FixationHarvest
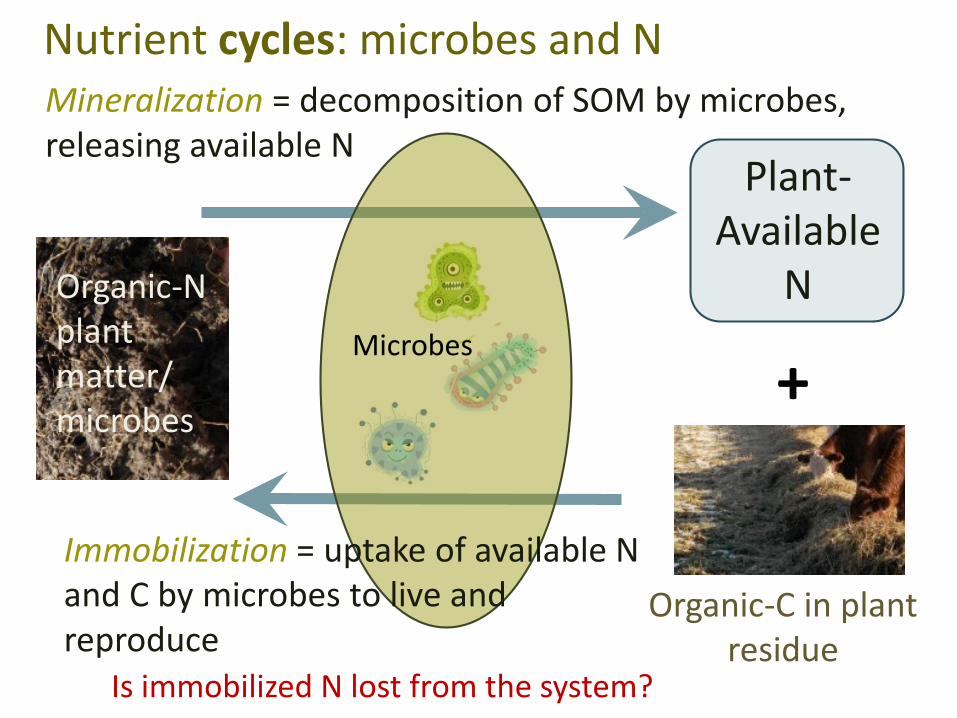
Mineralization = decomposition of SOM by microbes, releasing available N
Nutrient cycles: microbes and N
Plant-Available
NOrganic-N plant matter/ microbes
+Microbes
Organic-C in plant residue
Immobilization = uptake of available N and C by microbes to live and reproduce
Is immobilized N lost from the system?

N is the most common lacking nutrient except with legumes, e.g. mixed alfalfa/grass forage
Focus of N vs P & K fertilization in forages depends on % legume in stand.
Fertilizing with nutrients other than N favors legumes over grass

Phosphoruscycle
Soil Solution
Exchange
Harvest
Plan
t U
ptak
e
Leaching
Organic material
Mineral
Fe or Al oxide/clay
Erosion & Runoff
Movement of P is largely througherosion/runoff,NOT leaching. Why?
P binds strongly to soil
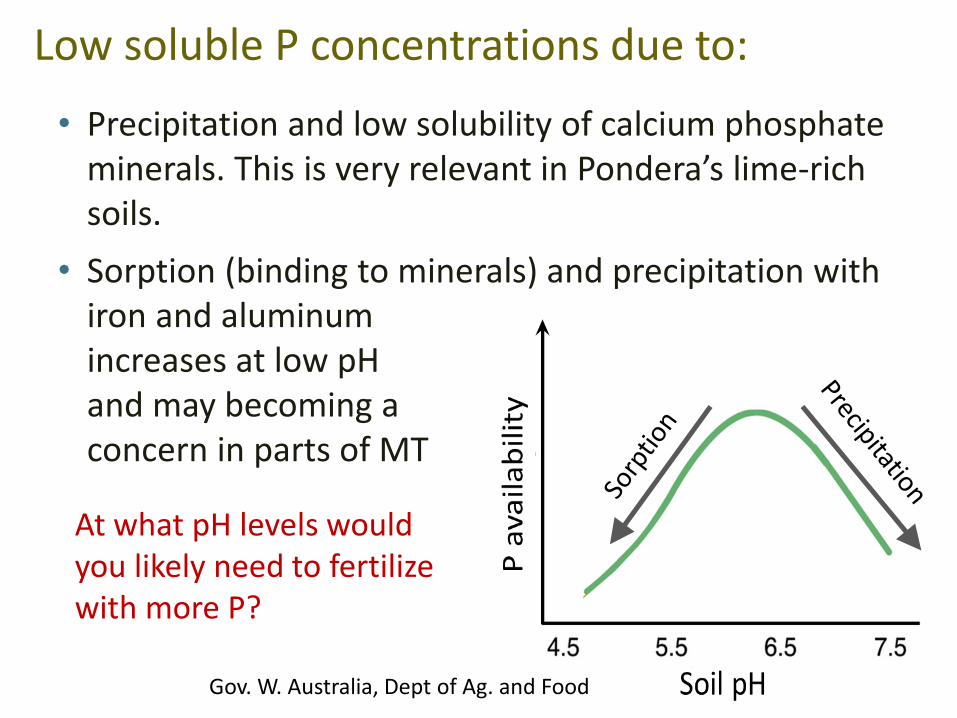
• Precipitation and low solubility of calcium phosphate minerals. This is very relevant in Pondera’s lime-richsoils.
• Sorption (binding to minerals) and precipitation with iron and aluminum increases at low pH and may becoming a concern in parts of MT
Low soluble P concentrations due to:
At what pH levels would you likely need to fertilize with more P?
Gov. W. Australia, Dept of Ag. and Food

Questions to ask before you add fertilizer1. Which elements do I need? (e.g. N, P, K, S, Zn)2. 4R Stewardship, the right:
• Rate• Source• Time• Placement
3. Will I get a return ($ or environmental) on my investment?
How do I know what to add to my soil???

Soil test• To identify nutrient deficiency
or imbalance• To help calculate fertilizer rates• Can increase yield and/or save
on fertilizer costs, and decrease environmental risks
• Best done in early spring, but not when soil is wet, therefore in our climate perhaps best done in late fall
• See publications listed at end for details on ‘how-to’

Location: Sample date:
Desired crop Prior crop
Nitrate-N Pppm K
ppmppm lb/ac Depth
(in) Bray Olsen
Forage 2 4 0-6 33 53 161
Wheat
FallowCereal
Legume?
12 0-6
14 4 35315 6-24
9 24-36
Ideal Crop dependent 16 -30
250 -500
Example soil test report
• Ideally an actual number, rather than a rating (low, medium, high, very high or deficient, sufficient) is provided.
• Drawback of soil test kits is usually rating only, no numbers• Sometimes a recommendation is provided. Make sure it is based on DESIRED
CROP and MT GUIDELINES
Location: Sample date:
Desired crop Prior crop
Nitrate-N Pppm K
ppmppm lb/ac Depth
(in) Bray Olsen
Forage 2 4 0-6 13 5 161
Wheat
FallowCereal
Legume?
12 0-6
14 9 35315 6-24
9 24-36
Ideal Crop dependent 16 -30
250 -500
Location: Sample date:
Desired crop Prior crop
Nitrate-N Pppm K
ppmOM % pH CEC Salts
ppm lb/ac Depth (in) Bray Olsen
Forage 2 4 0-6 13 5 161 2.0 7.5 10.2 0.3
Wheat
FallowCereal
Legume?
12 0-6
14 9 353 1.7 6.5 12 615 6-24
9 24-36
Ideal Crop dependent 16 -30
250 -500
3 -10 6-7.5 15-
30 < 4

• Rates: Provided by lab (check if they use MT rate guidelines) Guidelines & calculations in MSU MontGuides
MT200702AG and 03AG and bulletins
MSU fertilizer rate calculator http://www.sarc.montana.edu/php/soiltest/
How much fertilizer do I need to apply?
• Fertilizer rate based on soil test results:
Need reasonable crop yield goal for N rates
MSU guidelines are based on Olsen P. Bray works in pH < 7.3, Olsen works pH > 6.
http://landresources.montana.edu/soilfertility/publications.html

More is NOT better: Law of diminishing returns
The greatest
yield increase per lb N added
Additional N does not
produce any
additional YIELD, and acidifies, leaches
http://econtools.msuextension.org/nitrogen/
N for max yield (e.g. 80 bu/acre)

High N rates are costly
Miller et al. unpub data. Big Sandy, MT
1. In lower net returns when discounts low
2. And by lowering soil pH to near toxic levels (~5.2)
Legume grain-winter wheat

Timing depends on source• Readily available; e.g. urea (46–0–0), urea
ammonium nitrate (28–0–0), MAP (11-52-0), sulfate N shortly before seeding up to mid-tillering/stem
elongation. See Nutrient uptake timing by cropshttp://landresources.montana.edu/soilfertility/nutuptake.html
P, K, and S at or before seeding
• Slowly available (slow-release N, manure, rock phosphate, elemental-S) take time to become available apply well before needed – e.g., fall or build with
prior crop(s)
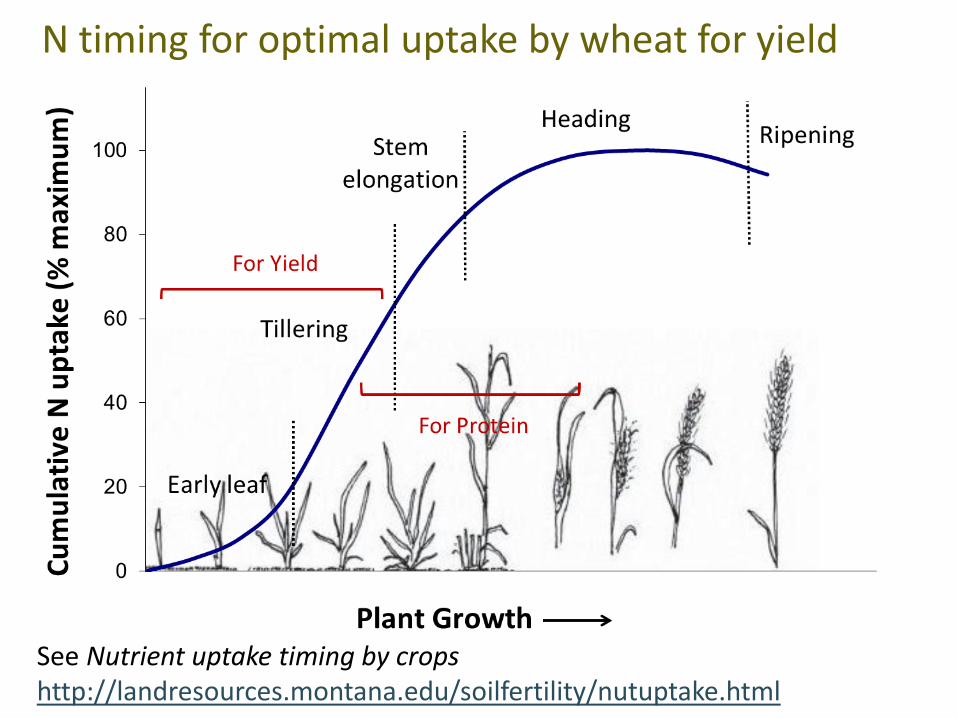
N timing for optimal uptake by wheat for yield and protein
See Nutrient uptake timing by crops http://landresources.montana.edu/soilfertility/nutuptake.html

N timing on forage depends on source
Willamette Valley, Oregon, Hart et al. 1989
Readily available N (urea, UAN): shortly after GRASS green-up
Slowly available N (manure, slow-release N)
• take time to become available• apply well before needed,
e.g. fall

Phosphorus is immobile, gets tied up in soil
spring wheat emergence
10 lb of starterP2O5 with seed
No starter P
Both sides received fall-banded 70-30-10-10
For cereal grains, consider starter (pop-up)
For perennials, apply several years’ worth at one time

K timing
Is relatively immobile – what is best timing?• For cereal grains: subsurface band or
broadcast at seeding• For forage: split between first and after last cutting to
minimize luxury consumption of first harvest apply after last cutting and before fall period of
re-growth to feed root reserves

Placement: N
• In general, subsurface placement/incorporation of N fertilizer decreases losses and increases availability• Broadcast N fertilizer needs to be incorporated by
tillage or ½” water ‘event’ to prevent volatilization• Do not apply on snow or frozen ground
• Fertilizer is salty and can damage germination if placed too close to seed at too high rates

Most important factors affecting urea volatilization• Surface soil moisture at time of fertilization• Precipitation the week or 2 after• Worst-case – moist soil surface w/ only sprinkles
for the next few weeks. • Average urea loss over 23 trials = 16% (Engel)
9 lb N/ac lost
In just 6 days
MSU Fertilizer eFact 70 Photos courtesy Rick Engel

Depth of incorporation reduces volatilization
Ernst & Massey 1960, lab
100 lb N/ac as ureaSilt loam, soil pH 6.5, Temp 75F
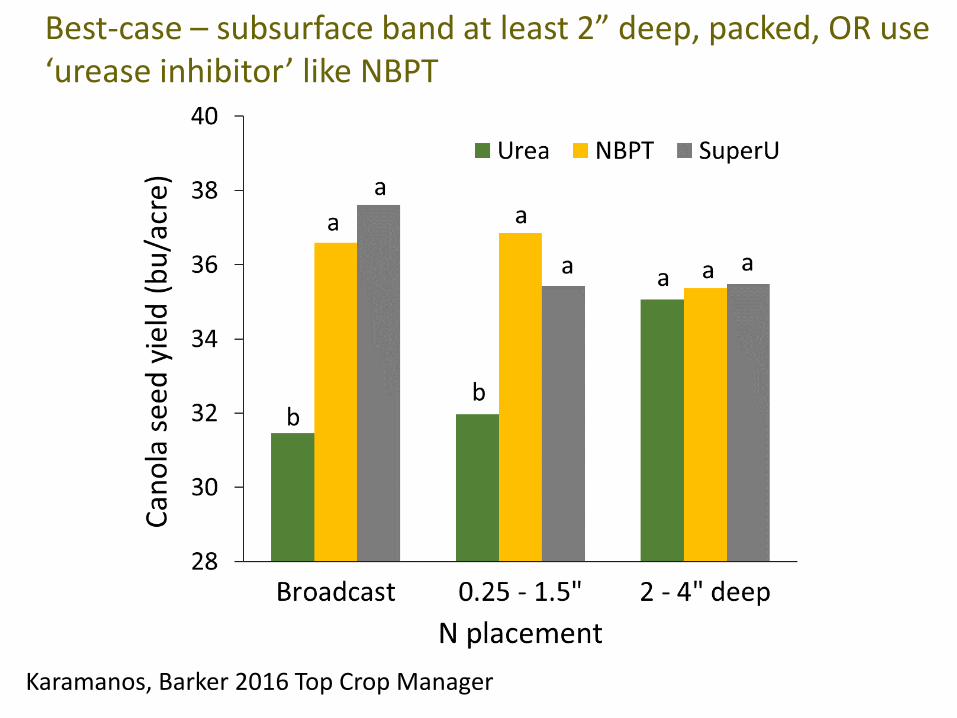
Best-case – subsurface band at least 2” deep, packed, OR use ‘urease inhibitor’ like NBPT
Karamanos, Barker 2016 Top Crop Manager

Placement of phosphate and KCl
• Incorporate prior to seeding (in tilled fields)• Place in-furrow (single shoot) but at low rates
<20 lb P2O5/acre 11-52-0 <10-15 lb N plus K2O with seed
• Place below and to side of seed (double shoot) Advantage – fast uptake Disadvantage – dry out soil and
can cause poorer germination

P band vs. broadcast
Band better than broadcast:Low soil PDry soilsReduced tillage
(Randall & Hoeft 1988)
VL L M H VH

Questions?
On to healthy soils

What describes a good soil?
• Good aeration, drainage and tilth
• Organic matter and organisms (per acre they can consume as much as 1 elephant!)
• Doesn’t crust after planting• Soaks up heavy rains with little runoff• Stores moisture for drought periods• Has few clods and no hardpan• Resists erosion and nutrient loss• Produces healthy, high quality crops
Image by Marit Olson

How can I manage for healthy soils?
Know your soil’s properties and only add fertilizer and amendments as needed
Avoid compaction by:• Reducing tillage and traffic when wet
Increase the organic matter content by: • Minimizing fallow, possibly adding cover crops• Moderate grazing
Maintain cover with vegetation or residue
Scout for problems, such as low pH

The ‘problem’ is not always clear Ex: Unexplained poor health in
low or mid-slope areas Low soil pH → Al toxicity
• stubby club roots, no fine branching (similar to nematode damage)
photo sources: Engel
Durum wheat
A. Robson, https://agric.wa.gov.au/n/4487
Field pea

What’s happening?
• Change in herbicide efficacy and carry over (Raeder et al., 2015)
• Poor N fixation by legumes
• Increase in some fungal diseases (e.g., Cephalosporiumstripe, root rots)
These may be caused by low soil pH and appear before Al toxicity
Smiley et al. 1996, Fusarium crown rot, image by M. Burrows
Drew 2014

Evaluate and adjust:
• Indicators of soil nutrients: yield, quality (protein, forage nitrate), nutrient deficiencies or toxicities
• Use this year’s observations to fine tune rates next year, e.g. wheat grain protein levels
• Use and develop maps, keep records• Experiment with strip trials• Use variable, site specific rates• Manage to reduce N leaching and volatilization

Summary
• Understanding soil properties guides proper fertilization
• Soil tests, the online economic N calculator and MSU Extension publications are important tools to calculate fertilizer rates, maximize plant heath, protect environment
• The right rate, source, placement and timing leads to optimal fertilizer use and plant health
• Observe and adjust to your specific conditions

ResourcesOn soil fertility website under Extension Publicationshttp://landresources.montana.edu/soilfertility/
Soil Sampling Strategies (MT200803AG)
Interpretation of Soil Test Reports for Agriculture (MT200702AG)
Developing Fertilizer Recommendations for Agriculture (MT200703AG)
More bulletins for specific crops Soil Sampling and Laboratory Selection (4449-1)
http://landresources.montana.edu/NM/
The Soil Scoop http://landresources.montana.edu/soilfertility/soilscoop.html
Cropland Soil Acidificationhttp://landresources.montana.edu/soilfertility/acidif/index.html

Photo by Ann Ronning
This presentation and more information on soil fertility is available at http://landresources.montana.edu/soilfertility
Thank you! Questions?