corporate presentation dcb
TRANSCRIPT

7/31/2019 Corporate Presentation DCB
http://slidepdf.com/reader/full/corporate-presentation-dcb 1/33
© Copyright IBM Corporation 2008
Corporate Presentation
November 2010

7/31/2019 Corporate Presentation DCB
http://slidepdf.com/reader/full/corporate-presentation-dcb 2/33

7/31/2019 Corporate Presentation DCB
http://slidepdf.com/reader/full/corporate-presentation-dcb 3/33
© Copyright IBM Corporation 2008 3
Contents
Recent Events
Development Credit Bank – Overview
Business Strategy & Financials
Annexure

7/31/2019 Corporate Presentation DCB
http://slidepdf.com/reader/full/corporate-presentation-dcb 4/33
© Copyright IBM Corporation 2008 4
DCB – Overview
DCB – at a glance
Comprehensive
product range &
scalable
infrastructure
Traditional loyal
customer base
Continued focus on
building low costfranchise
Pedigreed board and
experienced
Management team
Development Credit Bank Ltd (DCB) http://www.dcbl.com is a modern emerging new generation private sector bank. Presentsince 1930s, DCB is the only co-operative bank in India to have been converted into a private sector commercial bank in 1995
Distribution network of 80 branches across 28 cities and 113 ATMs (as on September 30, 2010)
Steady improvement
in credit ratings
Business model focused on achieving a balance between Retail, Micro SME(MSME), SME, Agri/Microfinance and mid-
Corporate
Comprehensive range of banking products across all businesses
Modern systems and infrastructure to support growth- Finacle, FinnOne, CMS, Internet and Mobile banking
Traditional sticky customer base helped by presence of branch network in select areas of Maharashtra, Gujarat & AP
Provides DCB access to low cost deposits
Continued focus on building a low cost deposit franchise with strong capital position
CASA of 34.6% and CRAR of 13.6% under Basel II (as on September 30, 2010)
Rating agencies have upgraded the rating guidelines for DCB
Crisil rating (Long term): BBB + / Stable, Crisil rating (Short term): P1 and Fitch rating: BBB / Stable
Nasser Munjee, Chairman: Ex- Executive Director – HDFC, instrumental in setting up IDFC & sits on the boards of many large
Indian companies
Murali M. Natrajan, MD & CEO: worked in Standard Chartered Bank (Global Head – SME Banking), Citibank, American
Express; strong Retail & SME experience in India & abroad
Robust Promoter
background
DCB’s promoter, Aga Khan Fund for Economic Development (AKFED) http://www.akdn.org/akfedis present in 16 countries
employing over 30,000 people
Promoter group holds 23.09% stake in DCB ( as on September 30, 2010)

7/31/2019 Corporate Presentation DCB
http://slidepdf.com/reader/full/corporate-presentation-dcb 5/33
© Copyright IBM Corporation 2008
Key Milestones
In Existence Since 1930s
1981
Amalgamation of
Masalawala Co-
operative Bank andIsmailia Co-
operative Bank into
Development Co-
operative Bank Ltd.
1984
Multi-State Co-
operative Bank
1995
Conversion to
Development
Credit Bank Ltd.
Secured Foreign
Exchange License
& became an
Authorized Dealer
1988
Acquired
“Scheduled”
status fromReserve Bank of
India
2004
Classified as a
“New Generation
Private Sector Bank” by the RBI
2006
IPO
Tier I Capital Raising
2006
Private Equity
investment of INR
519.9 mn by HDFC
and Khattar
Holdings and
others in
February 2006
2006
Raised INR 1.86 bn
through IPO, issue
oversubscribed
35 times
2009
Raised INR 810 mn
through QIP in
November 2009
subscribed by life
insurance
companies, mutual
funds and FIIs
2005
Private Equity
Investment by
AKFED (Principal
Promoter) of INR
1.38 bn in March
2005
2007
Preferential
Allotment of INR
2.8 bn in Aug 2007
to Al Bateen, TATA
Capital, DCB
Investments (SVG
Capital) and others
5

7/31/2019 Corporate Presentation DCB
http://slidepdf.com/reader/full/corporate-presentation-dcb 6/33
© Copyright IBM Corporation 2008 6
Aga Khan Fund for
Economic Development
Principal
Promoter
Robust Promoter Background and Strong Investor Profile
Key institutional shareholders
Al Bateen Investment Co LLC: 3.69%
Tata Capital Ltd: 3.29%
DCB Investments Ltd. (SVG Capital): 2.65%
HDFC Ltd: 2.02%
Sundaram BNP Paribas Mutual Fund: 1.70%
Birla Sunlife Life Insurance Co Ltd: 1.65%
Khattar Holdings Pvt. Ltd: 1.50%
ICICI Prudential Life Insurance Co Ltd: 1.42%
Edelweiss Securities Ltd: 1.03%
Shareholding
Pattern
Shareholding Pattern (September 30, 2010)
DCB is promoted by the Aga Khan Fund for Economic Development (AKFED) http://www.akdn.org/akfed
AKFED is an international development enterprise. It is dedicated to promoting entrepreneurship and building
economically sound companies
AKFED operates as a network of affiliates with more than 90 separate project companies employing over
30,000 people. The Fund is active in 16 countries in the developing world
*Includes Clearing Members (4.47%), Foreign Nationals, Non
Resident Indians (1.32%), Foreign corporate bodies (7.84%),
Directors their relatives and friends
Note: Numbers are rounded off upto two decimal places
Bodies Corporate
16.95%
Individuals
36.47%
Others (Non-
Institutions)*
13.65%
Institutions
9.84%
Promoter and Promoter
Group
23.09%

7/31/2019 Corporate Presentation DCB
http://slidepdf.com/reader/full/corporate-presentation-dcb 7/33
© Copyright IBM Corporation 2008 7
Sukh Dev Nayyar
Associated with ANZ Grindlays Bank plc
for over 30 yrs. Last assignment withGrindlays as Head - Corporate Banking &Investment Banking, India
Independent Director on the boards of Diamond Trust Bank Kenya and GreavesCotton
Nasim Devji
Fellow of the Institute of Chartered
Accountants of England & Wales (FCA).
Currently working as Managing Director of
Diamond Trust Bank Kenya & Group CEO
of Diamond Trust Banks in East Africa
Suhail Nathani
Founder Partner of Economic Laws
Practice, a law firm. Serves as an
Independent Director on the Board of
Phoenix Mills, India Advisory Board of
Duke University etc.
Nasser Munjee
Non- Executive Chairman
Ex- Executive Director – HDFC,
instrumental in setting up IDFC. Sits on 15
corporate Boards in India including HDFC,
Tata Motors etc
Amir Sabuwala
Specializes in Small Scale Industries. Set
up several small-scale industries over the
past 32 years which include - Premier
Chemicals, Asian Industries, Life
Technologies, etc
Darius Udwadia
Solicitor & Advocate of the Bombay High
Court and Solicitor of the Supreme Court
of England and Wales. Founder Partner of
Udwadia & Udeshi. Independent Director
on the Boards of several corporate entities
Shabir Kassam
Certified Public Accountant from Australia
and a Fellow of the Association of
Chartered Accountants, United Kingdom.Banking consultant for the last eight years
Rajab Momin
Bachelor of Commerce and Fellow of
Institute of Chartered Accountants of India.
Experience in the field of accounting and
audit. On the board of number of
companies
Narayan Seshadri
Specialization in the field of agriculture,
SSI & Rural economy. Corporate
consultant and is on the Board of anumber of companies
Experienced Board
Board of Directors
Murali M. Natrajan
Managing Director & CEO
Standard Chartered Bank, Citibank,
American Express – *27 yrs exp.
* Worked in India & Abroad

7/31/2019 Corporate Presentation DCB
http://slidepdf.com/reader/full/corporate-presentation-dcb 8/33
© Copyright IBM Corporation 2008 8
Gaurav Mehta
Head – Marketing, Corporate
Communication & Public RelationsHSBC India, Convergys, GE Capital and
Taj Group of Hotels – 15 yrs exp.
Strong Management Team
Murali M. NatrajanManaging Director & CEO
Standard Chartered Bank, Citibank,
American Express – *27 yrs exp.
Praveen Kutty
Head- Retail, SME Banking
Citibank – *19 yrs exp.
Rajesh Verma
Head - Treasury
State Bank of India – *31 yrs exp.
* Worked in India & Abroad
Bharat Sampat
Chief Financial Officer ABN Amro Bank, Standard Chartered
Bank, ANZ Banking Group, Hoechst
India – *25 yrs exp.
R. Venkattesh
Head - HR, IT & Operations
Standard Chartered Bank, ANZ
Grindlays Bank, Hindustan Petroleum –20 yrs exp.
Abhijit Bose
Head – Retail Assets
Standard Chartered Bank, Citibank,
Eldeco Housing Industries and GIC
Housing – *18 yrs exp.
Ravi Kumar
Chief Internal Auditor
Samba Financial Group, Ernst & Young
– *13 yrs exp.
Manoj Joshi
Business Head – SME
ICICI Bank, Epcos Ferrites and
Uniworth Group – 15 yrs exp.
Anoop Prabhakar
Head - Corporate Banking
State Bank of India – * 33 yrs exp.
Narendranath Mishra
Head - AMRB
ICICI Bank and Rallis India – 11 yrs
exp.
J. K VishwanathChief Credit Officer
Fullerton India, Citigroup and Eicher
Group – 17 yrs exp.
Sachin Patange
Chief Compliance Officer Reserve Bank of India – 20 yrs exp.
Hemant Barve
Company Secretary
Ritchie Steuart Investments and Union
Bank of India – 36 yrs exp.
Management
Sridhar Seshadri
Financial Controller
ICICI Bank, Syndicate Bank and State
Bank of India – *28yrs exp.

7/31/2019 Corporate Presentation DCB
http://slidepdf.com/reader/full/corporate-presentation-dcb 9/33
© Copyright IBM Corporation 2008 9
80 Branches, Strong Presence in the Western Region
* Branch locations as shown on the map are approximate may not represent the exact location
** Tie up with Euronet enables DCB customers to access VISA ATMs across the world
Branches 80
DCB ATMs 113
**Network 35,000 +
GOA
Mapusa (1)
Margao (1)
Panaji (1)
Vasco -Da-Gama (1)
GUJARAT Ahmedabad (4)
Ankleshwar (1)
Bhuj (1)
Daman (1)
Dediapada (1)
Gandhinagar (1)
Rajkot (1)
Sidhpur (1) Silvassa (1)
Surat (1)
Vapi (1)
MAHARASHTRA
Aurangabad (1)
Mumbai & Its
Suburbs (28) Nanded (1)
Nashik (1)
Pune (4)
ANDHRA PRADESH
Hyderabad (8)
Warangal (2)
HARYANA
Gurgoan (1)
KARNATAKA
Bengaluru (4)
NEW DELHI
Chandni Chowk (1)
Connaught Place (1)
Greater Kailash II (1)
Kapashera Road (1) Kondli (1)
Preet Vihar (1)
RAJASTHAN
Jodhpur (1)
TAMIL NADU
Chennai (2)
WEST BENGAL
Kolkata (3)
July-10:DCB received permission from RBI to open 2 new Rural/Semi-Urban branches at Netrang (Bharuch Distt.) & Mandvi (Surat Distt.) in Gujarat
Geographic Footprint *

7/31/2019 Corporate Presentation DCB
http://slidepdf.com/reader/full/corporate-presentation-dcb 10/33
© Copyright IBM Corporation 2008 10
Products & Services
Retail Banking
Deposit Products:
Current and Savings
Term Deposits
NRI Deposits
Corporate Salary
POS Terminals
Lockers
Cards:
ATM Card
Debit Card
Travel Card***
Secured Card***
Gift Card***
Credit Card*
Payments:
Remittances
Bill / Utility Payments
RTGS / NEFT
On-line Share
Trading/Demat
Tax Payments
Loans:
Auto Loans*
Commercial Vehicle*
Construction
Equipment*
Gold Loans
Home Loans
Loan Against Property
Loan Against Shares
Wealth Management:
Investment Advice
Mutual Funds
Life Insurance and
General Insurance
Services:
24/7 Phone Banking
Any Branch Banking
Privilege Banking
Internet and Mobile Banking
SME, Corporate Banking, NBFCs, Co-operative Banks
Current Account
Trade Current Account
Working Capital
Term Loans
Supply Chain
Portfolio Buyout
Import /Export
Bills Collection
Foreign Exchange
Letters of Credit
Guarantees
Statutory Reserves Management
Liquidity Management
Trading in Government Securities
Foreign Exchange
Corporate Bonds
CDs
Equity Investment
Treasury, NBFCs, Co-operative Banks
Cash Management**
RTGS /NEFT
Internet Banking
DCB offers a comprehensive range of products and services
*Offered to existing customers only ** DCB has tie up with HDFC Bank and Axis Bank to provide customers with cash management facilities at over 500 locations across india
*** Launched on trial basis

7/31/2019 Corporate Presentation DCB
http://slidepdf.com/reader/full/corporate-presentation-dcb 11/33
© Copyright IBM Corporation 2008 11
Contents
Recent Events
Development Credit Bank - Overview
Business Strategy & Financials
Annexure

7/31/2019 Corporate Presentation DCB
http://slidepdf.com/reader/full/corporate-presentation-dcb 12/33
© Copyright IBM Corporation 2008 12
Recent Events
Key challenges since mid 2008
Increase in NPAs and provisions mainly onaccount of unsecured personal loans,commercial vehicle, construction equipmentand a few corporate loans
Decrease in size of balance sheet negativelyimpacting core income
Cost structure created to support acceleratedretail loans growth
Rating downgrades impacting borrowing
Top heavy organization
Dependence on bulk deposits
Strategic initiatives / Actions
Substantial reduction in unsecured personalloans, CV and CE portfolio
Stabilization of NPAs through intensivecollections and recovery efforts. Coverageratio of 79.64% as on September 30, 2010
Reduction in cost base
Implementation of new business strategyresulting in steady balance sheet growth
Launch of new deposit products
Increase in CASA and retail term deposits tolower cost of funds and improve NIMs
Rating upgrades
Strengthening of Credit, Operations andInternal Audit
Leaner organization structure, improvementin staff morale and retention
Raising of Tier I (INR 810 mn) and Tier II (INR650 mn) capital in FY10 to support growth inadvances

7/31/2019 Corporate Presentation DCB
http://slidepdf.com/reader/full/corporate-presentation-dcb 13/33
© Copyright IBM Corporation 2008 13
Feb 28, 2009 Jul 31, 2009 Sep 30, 2010
CRISIL
- Long Term - BBB/Stable BBB +/Stable
- Short Term P1 P1 P1
FITCH BBB/Negative BBB/Negative BBB/Stable
Brickworks - BWR A-/Stable BWR A-/Stable
Ratings

7/31/2019 Corporate Presentation DCB
http://slidepdf.com/reader/full/corporate-presentation-dcb 14/33
© Copyright IBM Corporation 2008 14
Contents
Recent Events
Development Credit Bank – Overview
Business Strategy & Financials
Annexure
7/31/2019 Corporate Presentation DCB
http://slidepdf.com/reader/full/corporate-presentation-dcb 15/33
© Copyright IBM Corporation 2008 15
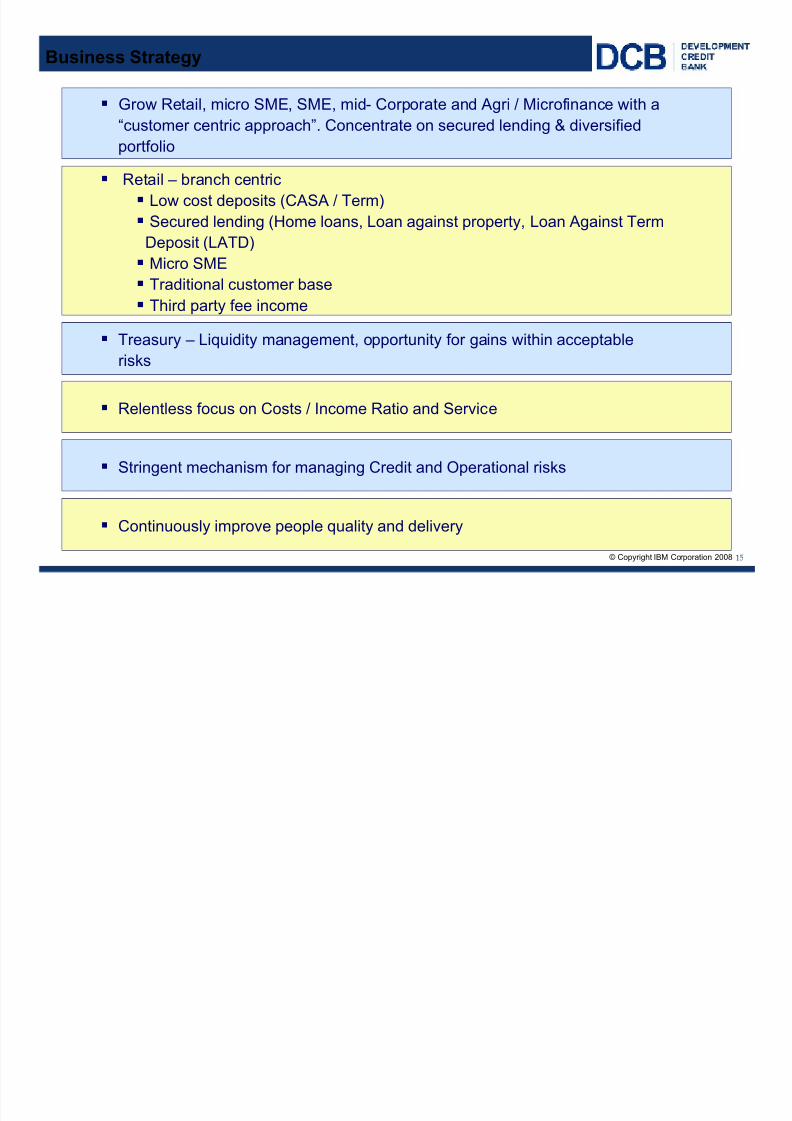
Business Strategy
Grow Retail, micro SME, SME, mid- Corporate and Agri / Microfinance with a“customer centric approach”. Concentrate on secured lending & diversified
portfolio
Treasury – Liquidity management, opportunity for gains within acceptable
risks
Relentless focus on Costs / Income Ratio and Service
Stringent mechanism for managing Credit and Operational risks
Continuously improve people quality and delivery
Retail – branch centric
Low cost deposits (CASA / Term)
Secured lending (Home loans, Loan against property, Loan Against Term
Deposit (LATD)
Micro SME
Traditional customer base
Third party fee income

7/31/2019 Corporate Presentation DCB
http://slidepdf.com/reader/full/corporate-presentation-dcb 16/33
© Copyright IBM Corporation 2008 16
Target
Improve ROA and ROE
Increase balance sheet size
Improve cost / Income ratioGoal
Calibrated growth, diversified portfolio with emphasis on secured lending
Focus on retail deposits to lower funding cost
“Income before costs”
Discipline in execution (strategy / credit / operations / costs)
Approach Enhance fee income

7/31/2019 Corporate Presentation DCB
http://slidepdf.com/reader/full/corporate-presentation-dcb 17/33
© Copyright IBM Corporation 2008 17
Calibrated Growth in Balance Sheet
Total Assets INR mn
* Net Advances – Gross advances less (net of) provisions
Note: Financial numbers are rounded off to nearest whole number
Net Advances* INR mn
31,048 29,631 38,39834,78631,39240,688 32,740 34,597
Mar 31, 2008 Mar 31, 2009 Jun 30, 2009 Sep 30, 2009 Dec 31, 2009 Mar 31, 2010 Jun 30, 2010 Sep 30, 2010
57,991 55,907 57,021 61,36759,43075,775 63,733 69,376
Mar 31, 2008 Mar 31, 2009 Jun 30, 2009 Sep 30, 2009 Dec 31, 2009 Mar 31, 2010 Jun 30, 2010 Sep 30, 2010

7/31/2019 Corporate Presentation DCB
http://slidepdf.com/reader/full/corporate-presentation-dcb 18/33
© Copyright IBM Corporation 2008 18
Building Stable Low Cost Funding Base
INR mn
INR mn
Mar 31,
2008
Mar 31,
2009
Jun 30,
2009
Sep 30,
2009
Dec 31,
2009
Mar 31,
2010
Jun 30,
2010
Sep 30,
2010
Retail
Deposit/
Total
Deposits 51.95% 67.53% 78.75% 82.56% 83.87% 81.54% 79.77% 78.65%
CASA
Ratio 24.27% 31.01% 33.49% 36.80% 38.14% 35.36% 36.02% 34.57%
Deposits INR mn
Access to low cost stable funding source to support advance growth without undue reliance on volatile wholesale funding
Note: Financial numbers are rounded off to nearest whole number
14,743 15,312 16,567 17,097 18,422 18,998
27,980 26,680
16,92714,411
34,30131,22029,35626,36541,735 28,101
3,957
4,271
2,422 2,093
1,5901,510
1,652
1,047
60,749
46,469 45,714 45,025 44,824
47,87351,152
54,951
Mar 31, 2008 Mar 31, 2009 Jun 30, 2009 Sep 30, 2009 Dec 31, 2009 Mar 31, 2010 Jun 30, 2010 Sep 30, 2010
CASA Term Deposits Other Deposits
7/31/2019 Corporate Presentation DCB
http://slidepdf.com/reader/full/corporate-presentation-dcb 19/33
© Copyright IBM Corporation 2008
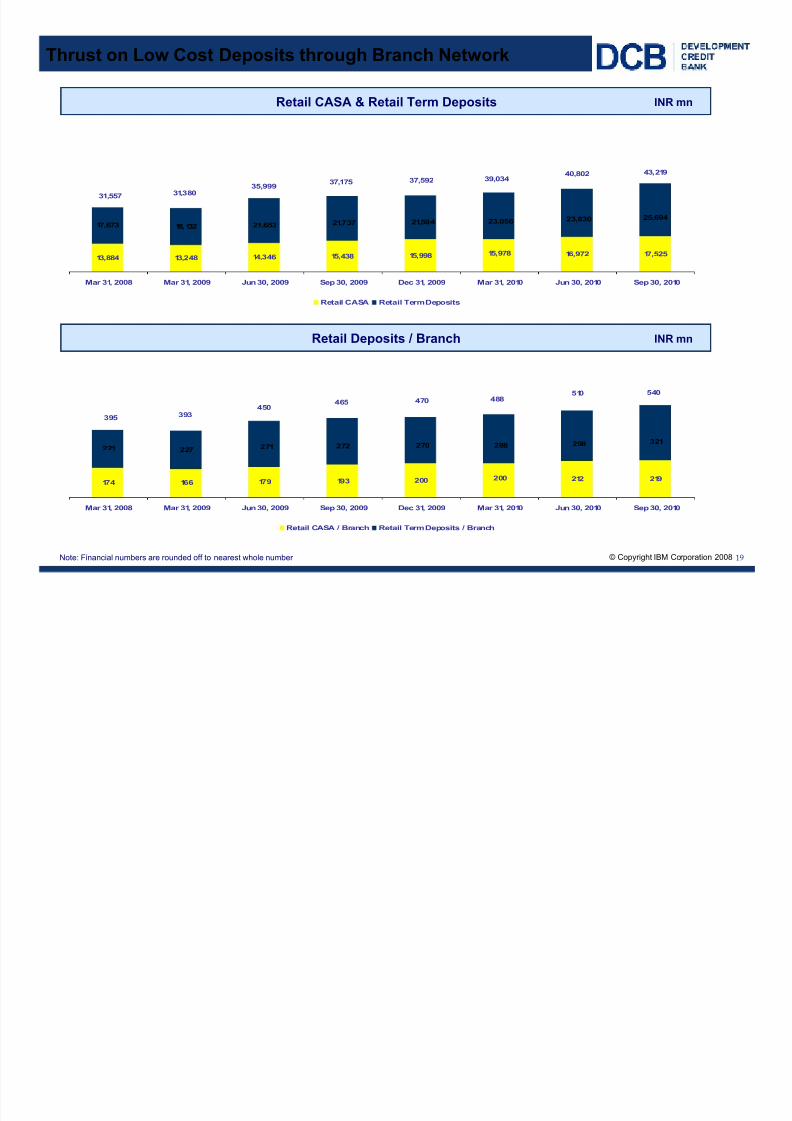
13,884 14,346 15,438 15,998 16,972 17,525
17,673 18,132
15,97813,248
25,69423,83023,05621,59421,73721,653
39,03437,59237,17535,999
31,38031,557
40,802 43,219
Mar 31, 2008 Mar 31, 2009 Jun 30, 2009 Sep 30, 2009 Dec 31, 2009 Mar 31, 2010 Jun 30, 2010 Sep 30, 2010
Retail CASA Retail Term Deposits
19
Thrust on Low Cost Deposits through Branch Network
Retail CASA & Retail Term Deposits INR mn
Note: Financial numbers are rounded off to nearest whole number
Retail Deposits / Branch INR mn
174 179 193 200 212 219
221 227
166200
321298288270272271
540510
395 393450
465 470 488
Mar 31, 2008 Mar 31, 2009 Jun 30, 2009 Sep 30, 2009 Dec 31, 2009 Mar 31, 2010 Jun 30, 2010 Sep 30, 2010
Retail CASA / Branch Retail Term Deposits / Branch

7/31/2019 Corporate Presentation DCB
http://slidepdf.com/reader/full/corporate-presentation-dcb 20/33
© Copyright IBM Corporation 2008
48.40%52.81%
61.28% 63.42%
75.19%79.64%
66.20%
76.66%
64.37%68.93%
73.25%
82.50%
89.88%93.99%
70.04%
53.34%
8.78%
0.66%
1.86%
1.49%
10.86%11.24%
8.69% 8.47%
7.61%
11.05%
3.88%
4.96%4.67%
4.35%
3.11%2.53%
Mar 31, 2008 Mar 31, 2009 Jun 30, 2009 Sep 30, 2009 Dec 31, 2009 Mar 31, 2010 Jun 30, 2010 Sep 30, 2010
Coverage Ratio - Bank Coverage Ratio - PL Gross NPA% Net NPA%
20
Increased Provisions with Adequate Coverage
INR mn
Mar 31,
2008
Mar 31,
2009
Jun 30,
2009
Sep 30,
2009
Dec 31,
2009
Mar 31,
2010
Jun 30,
2010
Sep 30,
2010
Personal
Loans 338 1,326 1,641 1,665 1,715 1,694 1,659 1,617
CV/CE/STVL* 71 533 592 620 640 599 584 540
Corporate 162 988 1,150 1,065 1,064 594 590 654
Others 63 209 257 226 311 305 307 296
Gross NPA 634 3,056 3,640 3,576 3,730 3,192 3,140 3,107
Net NPA** 270 1,270 1,540 1,385 1,364 1,076 878 714
Key Ratios
* CV / CE / STVL represents Commercial Vehicle, Construction Equipment and Small Ticket Vehicle Loan
Note: Financial numbers are rounded off to nearest whole number / Net NPAs are net of provisions
** Net NPA = Gross NPA – (Balance in Interest Suspense account + DICGC/ECGC claims received and held pending adjustment + Part payment received and kept in suspense
account + total provisions held)

7/31/2019 Corporate Presentation DCB
http://slidepdf.com/reader/full/corporate-presentation-dcb 21/33
© Copyright IBM Corporation 2008 21
INR mn Mar 31, 2009 Mar 31, 2010 Sep 30, 2010
Variance
H2 vs. H1
CASA 14,411 16,927 18,998 2,070
Retail Term Deposits 18,132 23,056 25,694 2,638
Mortgages - sourced byDCB 2,120 2,939 4,622 1,683
Mortgages - acquired 506 1,179 4,562 3,383
SME + Micro SME 4,483 6,004 7,362 1,358
Agri / Microfinance & RuralBanking
5,710 8,583 5,588 (2,995)
Corporate Banking 9,327 11,095 12,866 1,771
Calibrated Growth with Focus on Select Areas
Note: Financial numbers are rounded off to nearest whole number

7/31/2019 Corporate Presentation DCB
http://slidepdf.com/reader/full/corporate-presentation-dcb 22/33
© Copyright IBM Corporation 2008 22
Diversified Portfolio
Portfolio Mix as on September 30, 2010
Retail Banking - 26%Retail Banking - 40%
Retail Banking - 33%
* AMRB – Agri / Microfinance / Rural, MSME – Micro SME, CV / CE / STVL – Commercial Vehicle, Corporate Equipment and Small Ticket Vehicle Loan
Portfolio* as on Mar 31, 2009 Portfolio* as on Mar 31, 2010
Portfolio* as on Sep 30, 2010
Note: Financial numbers are rounded off to nearest whole number
CV/CE/STVL
8%
AMRB
25%
Corporate Banking
32%
SME+MSME
17%
Others
3%
Mortgages
12% Personal Loans
3%
AMRB14%
Corporate Banking
34%
SME+MSME
19%
Others
3%
Personal Loans
1%
Mortgages
24%CV/CE/STVL
5%
CV/CE/STVL
17%
AMRB
17%Corporate Banking
29%
SME+MSME
14%
Others
5%
Personal Loans
10%
Mortgages
8%

7/31/2019 Corporate Presentation DCB
http://slidepdf.com/reader/full/corporate-presentation-dcb 23/33
© Copyright IBM Corporation 2008 23
Focus on Cost Management
Operating Cost INR mn
Operating Income INR mn
Note: Financial numbers are rounded off to nearest whole number
1,626
1,071
227 342 246 299 269
1,861
1,972
1,420
354 314 326 426 433 464
581656
583672 732 733
1,201
257
3,487
3,173
2,491
FY08 FY09 FY10 Q1FY10 Q2 FY10 Q3 FY10 Q4 FY10 Q1FY11 Q2 FY11
Other Income Net Interest Income
1,4201,127
284 271 288 258 275
971 1,044
881
239 229 221 192 248 250
1,376
284
71.59%
76.20%
69.13%71.46%
86.63%90.18%
80.62%
68.56%
76.27%
2,3912,420
2,008
523 500 505 480 506 525
FY08 FY09 FY10 Q1FY10 Q2 FY10 Q3 FY10 Q4 FY10 Q1FY11 Q2 FY11
Operating Cost Staff Cost Cost Income Ratio

7/31/2019 Corporate Presentation DCB
http://slidepdf.com/reader/full/corporate-presentation-dcb 24/33
© Copyright IBM Corporation 2008
713
1,634
1,268
410325 259 274 255
160
FY08 FY09 FY10 Q1FY10 Q2 FY10 Q3 FY10 Q4 FY10 Q1FY11 Q2 FY11
24
Improvement in Operating Performance
Provisions INR mn
Operating Profit INR mn
* Provisions include provisions for NPAs, standard assets, income tax, fringe benefit tax, other assets, restructured advances etc
Provisions also includes depreciation on investments and sacrifice of one time settlement
Note: Financial numbers are rounded off to nearest whole number
1,096
753
483
57156
78192 226 208
FY08 FY09 FY10 Q1FY10 Q2 FY10 Q3 FY10 Q4 FY10 Q1FY11 Q2 FY11

7/31/2019 Corporate Presentation DCB
http://slidepdf.com/reader/full/corporate-presentation-dcb 25/33
© Copyright IBM Corporation 2008
383
(881)
(785)
(353)
(169) (181)
(82)(29)
48
FY08 FY09 FY10 Q1FY10 Q2 FY10 Q3 FY10 Q4 FY10 Q1FY11 Q2 FY11
25
Bottom Line Improvement
19
Net Profit / Loss * INR mn
Note: Financial numbers are rounded off to nearest whole number
* Net Profit / (loss) represents post tax numbers

7/31/2019 Corporate Presentation DCB
http://slidepdf.com/reader/full/corporate-presentation-dcb 26/33
© Copyright IBM Corporation 2008 26
NIM, Yield on Advances and Cost of Funds
Net Interest Margin INR mn
Yield on Advances & Cost of Funds
Note: Financial numbers are rounded off to nearest whole number
3.14%3.12%
2.79%
3.27%
2.61%2.50%
2.78%2.86%
3.03%
FY08 FY09 Q1FY10 Q2 FY10 Q3 FY10 Q4 FY10 FY10 Q1FY11 Q2 FY11
13.32%13.58% 13.05%
12.50% 12.04% 11.70%12.33%
11.21%10.95%
7.27%
7.51%
7.18% 6.58% 6.35% 5.65%6.44%
5.63%5.58%
FY08 FY09 Q1FY10 Q2 FY10 Q3 FY10 Q4 FY10 FY10 Q1FY11 Q2 FY11
Yield on Advances Cost of Funds

7/31/2019 Corporate Presentation DCB
http://slidepdf.com/reader/full/corporate-presentation-dcb 27/33
© Copyright IBM Corporation 2008 27
Other Income
INR mn FY08 FY09 FY10 Q1FY11 Q2FY11
Commission, exchange and brokerage 845 768 664 156 175
Sale of investments 15 20 178 86 36
Sale of land, buildings and other assets 102 47 (3) (2) (2)
Exchange transactions 229 224 64 19 29
Lease income 7 - 9 - -
Miscellaneous income 428 142` 159 40 31
Total 1,626 1,201 1,071 299 269
Note: Financial numbers are rounded off to nearest whole number

7/31/2019 Corporate Presentation DCB
http://slidepdf.com/reader/full/corporate-presentation-dcb 28/33
© Copyright IBM Corporation 2008 28
Treasury
INR mn Mar 31, 2009 Mar 31, 2010 Sep 30, 2010
SLR 12,675 15,789 16,639
Non-SLR 3,542 4,390 4,336
Total Investments * 16,217 20,179 20,975
HTM 10,808 16,890 18,542
AFS 4,630 3,263 2,178
HFT 779 26 255
Total Investments * 16,217 20,179 20,975
* Represents Net investments (HTM – Held To Maturity, AFS – Available For Sale, Held For Trading)
Note: Financial numbers are rounded off to nearest whole number

7/31/2019 Corporate Presentation DCB
http://slidepdf.com/reader/full/corporate-presentation-dcb 29/33
© Copyright IBM Corporation 2008 29
Capital Adequacy Ratios
Mar 31,
2009
Jun 30,
2009
Sep 30,
2009
Dec 31,
2009
Mar 31,
2010
Jun 30,
2010
Sep 30,
2010
Basel II 13.30% 13.22% 14.85% 14.85% 14.85% 13.80% 13.57%
Basel II
DCB has following approvals for raising capital in the future:
Tier I – QIP not exceeding INR 1,500 mn
Tier I – Rights not exceeding INR 2,000 mn
Capital Adequacy Ratios
Note: Financial numbers are rounded off to nearest whole number
11.50% 11.65% 11.96% 11.93% 11.26%
1.80% 1.79%3.20% 2.89% 2.92%
2.40% 2.31%
11.40%
11.43%
13.30% 13.22%
14.85% 14.85% 14.85%13.80%
13.57%
Mar 31, 2009 Jun 30, 2009 Sep 30, 2009 Dec 31, 2009 Mar 31, 2010 Jun 30, 2010 Sep 30, 2010
Tier I Tier II

7/31/2019 Corporate Presentation DCB
http://slidepdf.com/reader/full/corporate-presentation-dcb 30/33
© Copyright IBM Corporation 2008 30
Contents
Recent Events
Development Credit Bank – Overview
Business Strategy & Financials
Annexure

7/31/2019 Corporate Presentation DCB
http://slidepdf.com/reader/full/corporate-presentation-dcb 31/33
© Copyright IBM Corporation 2008 31
Balance Sheet
INR mn
Mar 31,
2009
Jun 30,
2009
Sep 30,
2009
Dec 31,
2009
Mar 31,
2010
Jun 30,
2010
Sep 30,
2010
CASA 14,411 15,312 16,567 17,097 16,927 18,422 18,998
Other Deposits 32,058 30,402 28,458 27,727 30,946 32,730 35,953
Total Deposits 46,469 45,714 45,025 44,824 47,873 51,152 54,951
CASA Ratio 31.01% 33.49% 36.80% 38.14% 35.36% 36.02% 34.57%
INR mn
Mar 31,
2009
Jun 30,
2009
Sep 30,
2009
Dec 31,
2009
Mar 31,
2010
Jun 30,
2010
Sep 30,
2010
Shareholder’s Equity 5,957 5,633 5,469 6,073 5,990 5,960 6,003
Deposits 46,469 45,714 45,025 44,824 47,873 51,152 54,951
Borrowings 1 3,455 3,264 1,488 2,108 5,035 3,840 5,648
Other Liabilities & Provisions 1 3,523 3,352 3,898 3,997 2,447 2,754 2,747
Cash, Inter-bank, etc 6,534 3,939 3,703 5,113 3,324 5,647 6,177
Investments 16,217 19,287 19,087 17,011 20,179 20,057 20,975
Advances 32,740 31,048 29,631 31,392 34,597 34,786 38,398
Fixed Assets 1,489 1,457 1,418 1,378 1,358 1,326 1,308
Other Assets 2,450 2,260 2,068 2,127 1,909 1,918 2,518
Credit Deposit Ratio 70.46% 67.92% 65.81% 70.03% 72.27% 68.00% 69.88%
Note: Financial numbers are rounded off to nearest whole number
1 : Subordinated debt included in borrowings since March 31, 2010 as per RBI guidelines, same included in other liabilities and provisions in earlier periods

7/31/2019 Corporate Presentation DCB
http://slidepdf.com/reader/full/corporate-presentation-dcb 32/33
© Copyright IBM Corporation 2008 32
Profit & Loss
INR mn FY09 Q1FY10 Q2FY10 Q3FY10 Q4FY10 FY10 Q1FY11 Q2FY11
Net Interest Income 1,972 354 314 326 426 1,420 433 464
Other Income 1,201 227 342 257 246 1,071 299 269
Operating Income 3,173 581 656 583 672 2,491 732 733
Operating Expenses (2,420) (523) (500) (505) (480) (2,008) (506) (525)
Operating Profit 753 57 156 78 192 483 226 208
Total Provisions (1,634) (410) (325) (259) (274) (1,268) (255) (160)
PAT (881) (353) (169) (181) (82) (785) (29) 48
Cost Income Ratio 76.27% 90.18% 76.20% 86.63% 71.46% 80.62% 69.13% 71.59%
Note: Financial numbers are rounded off to nearest whole number

7/31/2019 Corporate Presentation DCB
http://slidepdf.com/reader/full/corporate-presentation-dcb 33/33
© Copyright IBM Corporation 2008 33
Thank you