consumer confidence: measurement and meaning
DESCRIPTION
Presented at the annual conference of the American Association for Public Opinion Research, Nashville, Tennessee, May 15-18, 2003.TRANSCRIPT

Consumer Confidence: Measurement and Meaning
Daniel M. Merkle
Gary E. Langer Dalia Sussman
ABC News
47 W. 66th St. 6th Floor
New York, NY 10023 212-456-3564
Revised 6/18/04
A version of this article was presented at the annual conference of the American Association for Public Opinion Research, Nashville, Tennessee, May 15-18, 2003. We are grateful to Fred Breimyer, chief economist at State Street Corp., for his advice and comments on this article.

2
Abstract
This article examines in detail the methodology and performance of the three most
prominent, ongoing surveys of consumer confidence, conducted by the University of
Michigan, the Conference Board and ABC News/Money magazine. While all three seek
to measure the same construct, we find that they differ greatly in methodology, including
sampling procedures, mode of interviewing, interview periods, question wording and
index construction. But, despite their methodological differences, the indices track each
other closely over the 17-year time period studied, providing solid evidence of their
reliability. The analysis also finds strong support for the validity of these indices, in that
each is significantly correlated with a diverse set of key economic measures. Finally we
document the major influence of confidence on political sentiment from presidential
approval to more general measures of national well-being.

3
Introduction
Consumer confidence – a shorthand phrase for public views of economic
conditions – is a closely watched, widely discussed and sometimes hotly debated
economic indicator, all for good reason. Consumer spending accounts for about 70
percent of economic activity in this country (Bureau of Economic Analysis, undated). To
the extent that consumer confidence interacts with consumer behavior, and with other
economic factors, it may provide important information as to the economy's current
condition and future direction alike.
Indeed, policymakers and economists track consumer confidence closely in the
apparent belief it serves as a useful economic forecasting tool. Economic analysts and the
news media report its ups and downs prominently. The release of confidence numbers is
often cited (with and sometimes without supporting evidence) as a force in the movement
of the stock markets (e.g., Chu, 2003; Fuerbringer, 2002; Associated Press, 2002).
Confidence also has a strong political connection; it's virtually axiomatic that presidential
approval suffers, and political discontent grows, as consumer confidence deteriorates
(Soulas and Langer, 1994).
While the political importance of consumer confidence is widely accepted
(expressed in Clinton campaign manager James Carville's famous aphorism in the 1992
presidential campaign, "It's the economy, stupid"), some commentators have questioned
the usefulness of measuring and reporting consumer confidence as a purely economic
indicator, expressing doubt as to its meaning or value in this realm (e.g., Uchitelle, 2002).
Confidence surveys have also been criticized recently on methodological grounds for the
types of questions and response categories they use (Dominitz and Manski, 2004).

4
This research synthesis examines in detail the three most prominent, ongoing
indices of consumer confidence in the United States – the 58-year-old University of
Michigan survey, the 37-year-old survey from The Conference Board1 and the 18-year-
old ABC News/Money magazine survey. First we present a detailed comparison of the
methodologies used by each of the indices. This comparison will be useful for those who
regularly track the changes in confidence over time as well as for more casual observers.
Second, we assess the fundamental reliability and validity of these three gauges. We
examine how well they track with each other over time, their correlation with other
economic indicators, their movement in advance of economic recessions and recoveries,
and the relationship between consumer confidence and political sentiment. We are aware
of no previous study that has compared the performance of the three main confidence
indices across such a wide range of economic and political variables. More generally, it is
not commonplace in survey research to have such long time trends that can be validated
against objective measures.
Comparison of Confidence Methodologies
"Consumer confidence" is in some ways a subjective term. There’s no single
agreed-upon definition of what it means, nor one accepted method to measure it. Each of
the Michigan, Conference Board and ABC/Money surveys regularly reports the results of
an overall consumer confidence index. As this section details, even though these surveys
all purport to measure the same construct, they differ methodologically in a number of
1 The Conference Board is a nonprofit organization that conducts research and organizes conferences and meetings for the business community.

5
ways, including sampling procedures, mode of interviewing, interview periods, question
wording and index construction (see Table 1).2
Table 1 Methodology of Consumer Confidence Surveys ABC News/Money Conference Board Univ. of Michigan Method Telephone Mail Telephone Sampling RDD with random Selection from RDD with random selection in a non-random selection in household panel household Weighting For probability Not disclosed For probability of selection and of selection and to Census (region, to Census (age age, race, sex, and income) and education) Sample size About 1,000 (250 About 2,500 for 250-300 for mid- per week x 4 weeks) end-of-month month release; release; 3,500 for 500 for end-of- later revision month revision Field period Wed-Sun each week; Sent first of the Around first of Results based on a month; Accepts the month through four-week rolling returns through a few days before average end of month the release Fieldwork International TNS NFO Michigan Survey Communications Research Center Research Release Weekly, Tuesday Prelim. figures, Preliminary evening last Tuesday of figures at mid- month; final figures month; final with next month’s figures at end release of the month History Started in December Started bimonthly Started annually 1985 in 1967; went to in 1946;quarter- monthly in 1977 ly in 1952 and monthly in 1978
The longest-running confidence survey, Michigan’s Survey of Consumers, began
annually in 1946.3 It switched to a quarterly schedule in 1952, the same year its Index of
2 Information for this section was compiled from Bram and Ludvigson (1998), Conference Board (undated), Curtin (2004), Curtin (2002c), Curtin (2001), Curtin (1982), Curtin (undated), Curtin, Presser and Singer (2000), Franco (2004), Franco (2003), Linden (1982), Saad (2002) and Surveys of Consumers (undated).
6
Consumer Sentiment was introduced, and then became monthly in 1978. The Conference
Board’s Consumer Confidence Index began bimonthly in 1967 and became monthly in
1977. ABC/Money’s Consumer Comfort Index dates to 1985; its results are released
weekly with each release including data from the prior four weeks.
Data analyzed in this article are monthly results of the three surveys from
December 1985 though December 2002, a period in which all were contemporaneously
conducted. This 17-year period includes two economic recessions (1990-91 and 2001)
and, from 1991-2001, the longest economic expansion on record (Hall et al., 2003;
National Bureau of Economic Research, undated). For Michigan and Conference Board,
final monthly results are used. For ABC/Money we use each month's final release, based
on data from the preceding four weeks.
1. Sampling and Data Collection
The sampling and data collection approaches used by Michigan and ABC/Money
are quite different than the Conference Board’s. The Michigan and ABC/Money surveys
are conducted by telephone and are based on probability samples representative of
virtually the entire U.S. adult population. The Conference Board survey is conducted by
mail using a panel.
The Conference Board website and monthly releases say, "The Consumer
Confidence Survey is based on a representative sample of 5,000 U.S. households"
(Conference Board, 2003). However, it has been reported elsewhere that this survey is
based on questionnaires mailed to a random sample of members of a panel who are pre-
3Michigan’s Index of Consumer Expectations, a component of its overall index, is part of the Conference

7
recruited by non-probability methods, chiefly for product-testing purposes (Goldberg,
1991).4
Michigan and ABC/Money use random-digit-dialing with random selection of
respondents within household, weighting adjustments for selection probabilities (i.e.,
phone lines and number of adults in the household) and post-stratification to Census
demographics. Michigan uses Kish selection within household whereas ABC/Money uses
most-recent-birthday selection. Michigan data are weighted to two Census variables, age
and income. ABC/Money data are weighted to five Census variables: region, age, race,
sex and education. Both surveys use an interative raking procedure and also trim
extreme weights.
Michigan and ABC/Money differ in how their samples are managed. Michigan
uses a "rotating panel design" in which about 60 percent of respondents each month are
new, and 40 percent are interviewed for a second time six months after they were
originally interviewed. Michigan gradually releases its sample in replicates in the first
half of the month with callbacks being made over the course of the entire month-long
field period. In contrast, ABC/Money surveys an independent random sample of
approximately 250 respondents each week, and combines weekly results into a four-week
rolling average. Three call attempts are made to each sampled number on three different
days during the five-day field period.5
Board’s Index of Leading Economic Indicators (ILEI). The Conference Board took over the ILEI from the U.S. Department of Commerce, Bureau of Economic Analysis, in 1995. 4 The Conference Board reports that there are 575,000 households in the panel but specific details about the composition of the panel, sample selection procedures and weighting, if any, are not disclosed (Franco, 2003). 5 Michigan reported a response rate of 60 percent (AAPOR RR2) in 2002 with unlimited callbacks during its month-long field period (Curtin, Presser, and Singer, 2003). An extensive study of Michigan response rates from 1979 to 1996 found no significant deterioration in the quality of data based on just two calls,

8
Another difference between the surveys is sample size. ABC/Money interviews
approximately 1,000 respondents monthly; Michigan, 500. The Conference Board has
about 2,500 respondents in its initial monthly release and adds another 1,000 or so when
it revises its figures the next month (D’Innocenzio, 2003). The Conference Board's
sample size often is incorrectly reported as 5,000 (e.g., Bloomberg News, 2003), perhaps
because the Conference Board's releases say the survey is based on a “sample of 5,000
U.S. households." However, that is the number of questionnaires mailed out each month,
not the number returned (Franco, 2003).
The Michigan index requires a movement of 4.8 points for change from one
month to the next to be statistically significant at the 95 percent confidence level (Curtin,
2002c). ABC/Money needs movement of approximately 3.5 points from one week to the
next for statistical significance at the 95 percent confidence level, or approximately seven
points when comparing monthly results with no overlapping data.6 The Conference
Board offers no calculation of significance in movement of its data.
2. Timing and Data Release
Data-collection periods, release schedules and the nature of data released also
differ. The Conference Board mails out its surveys the first of each month. Preliminary
results based on about 2,500 returns are released at 10 a.m. on the last Tuesday of each
month. The overwhelming majority of these returns, about 90 percent, date from the first
with a response rate about 50 points below that of the unlimited-callback regimen (Curtin, Presser and Singer, 2000). The ICR Excel omnibus survey used by ABC/Money had a response rate of 12 percent (AAPOR RR3) in a random week in late 2002; that is typical for this type of commercial omnibus survey, used by a variety of commercial, academic and news researchers. The Conference Board does not calculate a response rate for its panel-based sample.
9
two weeks of the month. For example, the Conference Board reported that 88 percent of
its September 2001 results were returned before September 11 (Flynn, 2001). Revised
figures, which include about 1,000 additional questionnaires received through the end of
the target month, are released the following month.
Michigan starts interviewing around the first of the month and distributes a
preliminary report (to subscribers) on the second Friday of each month based on 50 to 60
percent of the full sample (Curtin, 2003). Interviewing is completed around the 28th of the
month and the complete results are distributed around midday on the first Friday after the
end of interviewing. Some onlookers have been critical of Michigan's release of partial
results because of the smaller sample size and assumed preponderance of easier-to-reach
respondents (e.g., Mitofsky, 2002). Michigan has responded by pointing out that
historically its partial data release has been consistent with its full-sample release later
each month (Curtin 2002a; Curtin 2002b).
ABC/Money interviews 250 respondents Wednesday through Sunday each week
(about 50 per day), combining the results in a four-week rolling average, with results
released each Tuesday (two days after the end of interviewing) at 4:30 p.m. ABC/Money
does not release partial data, nor does it revise released data.
The difference in interviewing periods and release schedules can be responsible
for apparently different movements in the indices. In one recent example, on April 29,
2003, the Conference Board showed a large gain in confidence compared to its data from
the previous month (Conference Board, 2003). In a release the same day, ABC/Money
showed a decline in confidence from the previous week (Sussman, 2003). Almost all of
6 We’re grateful to Carl Finkbeiner, executive vice president, advanced methods; and Dave Lambert, senior

10
the Conference Board’s data had been collected during the first two weeks of April, a
period when ABC/Money also showed a rise in confidence. It was in more recent
interviews that ABC/Money, with its weekly updates, found confidence halting its
advance and turning down.
A similar phenomenon occurred after the terrorist attacks of September 11, 2001.
Conference Board data released at the end of that month - almost all of it collected before
the attacks - showed confidence declining, compared to the previous month. ABC/Money
also showed confidence down in the first week of September. But in data collected after
September 11, ABC/Money (and others) found confidence rebounding through early
October (Saad, 2002).
Such differences are unusual. Given the differences in timing and the high
correlation between the three indices over time (discussed below), it's perhaps not
surprising that some analysts use the weekly ABC/Money index as a predictor of
upcoming Michigan or Conference Board data (e.g., McTeague, 2003).
3. Operationalization and Question Wording
The indices also differ in how they operationalize confidence, both in terms of
what they attempt to measure and how they measure it (see Appendix A for full question
wordings).7 The main indices produced by Conference Board and Michigan combine
questions on current conditions with questions measuring expectations for the future,
with more emphasis placed on expectations (each includes three expectations questions
versus two measures of current conditions). Each also breaks these into individual sub-
vice president; both of TNS Intersearch, for their computational assistance.

11
indices, one for current conditions, based on those two questions, and one for
expectations, based on those three questions.
ABC/Money’s index is based solely on views of current economic conditions.
The survey measures expectations separately, in a single question, on a monthly basis.
The ABC/Money expectations question was not asked on a regular monthly schedule
until January 2001. Therefore, data for this question are only available for 133 of the 205
months during the 17-year time period studied here.
Combining current sentiment with expectations in a single index would seem to
be well-advised if the two are highly correlated. In the absence of such correlation,
however, the practice might seem less advisable, in that it could obscure contradictory
trends. This concept is explored in greater detail below.
The three confidence indices also differ in their relative focus on respondents'
personal economic experience versus broader, less experiential assessments of local or
national conditions.
In measurement of current conditions, ABC/Money asks two questions focused
on personal experience – one on personal finances and a second on personal views of the
buying climate "considering the cost of things today and your own personal finances." A
third question asks for a general assessment of the national economy.
In its current sentiment questions the Conference Board measures views of
economic conditions, with no direct measure of personal experience. Michigan’s
measurement of current conditions includes one experiential question on family finances,
and one middle-ground question gauging the buying climate for “people” in general.
7 The Conference Board does not release its question wordings (Franco, 2003). Wordings are as reported

12
Measuring expectations, Conference Board and Michigan each include two
questions on economic conditions and one on personal finances. ABC/Money’s
expectations question focuses on general economic conditions, asking people if they
think the economy’s getting better, worse, or staying the same.
Question wordings are substantially different in numerous respects. Conference
Board asks about business conditions and job availability "in your area." Michigan asks
about national conditions, as does ABC/Money.
Scales vary widely. In one questions Conference Board asks respondents to rate
local business conditions as "good, normal, or bad," and in another if locally available
jobs are "plenty, not so many, or hard to get." Michigan asks respondents if they think
that in the next five years the country will experience "continuous good times… periods
of widespread unemployment or depression, or what?" ABC/Money, in all three of its
index questions, uses standard scales of excellent, good, not so good or poor.
Further, while the Michigan question cited above asks respondents to project
"five years" into the future, Conference Board uses a much shorter time frame, asking
predictions of job availability, and of family income, six months into the future.
ABC/Money's expectations question, "getting better," implies a time frame that's closer
still.
In another difference, ABC/Money asks if respondents think it's a good time to
buy "things you want and need." Michigan asks whether it’s a good time for "people" to
buy "major household items," such as "a refrigerator, stove, television, and things like
that."
by Bram and Ludvigson (1998) and Saad (2002).

13
Dominitz and Manski (2004) offer a critique of some of the questions used by
Michigan to measure confidence (and by extension ABC/Money and Conference Board).
First, Dominitz and Manski (2004) take issue with confidence questions asking about
“ambiguous phenomena” such as business conditions in the country. Instead, they argue
that questions should focus on personal assessments. But as shown below, ABC/Money’s
general question on the economy is somewhat more strongly correlated with objective
economic measures than are the two personal questions asking about finances and buying
conditions.
Second, Dominitz and Manski (2004) criticize the use of categorical response
options (e.g., better off, worse off, the same), instead calling for questions that ask for
probability assessments.8 Their only evaluation of the reliability or validity of the two
types of question formats is limited to rank-order correlations using 12 monthly
observations. But even in this limited test, the correlations for the probability assessment
questions were much lower than for the questions using discrete response categories.
Whether the probability assessment questions can achieve the levels of reliability and
validity shown here for the current approach remains to be demonstrated.
4. Computation of Indices
The three confidence indices are computed on different scales, so the magnitude
of the point changes are not directly comparable (see Appendix B for a more detailed
description of each computation and examples). Each survey starts by using the
8 For example, in their study they ask: “What do you think is the percent chance that your income in the next twelve months will be higher than your income in the past twelve months?”

14
aggregate percentage response to each question, but the actual computations diverge after
that.
ABC/Money takes the positive value (“excellent” and “good”) from each question
and subtracts the negative value (“not so good” and “poor”) and then averages them.
Using this computation, the index can take on any value from -100 to +100.
The Conference Board index is computed by taking the positive percentage for
each question divided by the sum of the positive and negative percentages. This number
is then divided by the base year value from 1985 and multiplied by 100. The resulting
values from each question are averaged to form the overall index .
Michigan computes its index by taking the difference between the positive and
negative percentages for each question and then adding 100 to each. These are summed
and then divided by a factor representing the base year, 1966. Finally a small correction
is made to account for a design change in the 1950s.
The Conference Board’s index is seasonally adjusted; ABC/Money’s and
Michigan’s are not. Bram and Ludvigson (1998) and Matsusaka and Sbordone (1995)
note that the confidence indices don’t exhibit much seasonality.
The impact of the different computation methods on index results can be seen in
Table 2. The ABC/Money and Conference Board indices show much more movement
than Michigan’s, as evidenced by the smaller range and standard deviation for Michigan.
Regressions using Michigan to predict each of the other two indices finds that a one-point
movement in the Michigan index is equivalent to about a two-point movement in
ABC/Money (b=1.91, p<.001) and the Conference Board (b=2.17, p<.001).

15
Table 2 Descriptive Statistics for the Confidence Indices ABC/Money Conference Board Michigan Minimum -49 47.3 63.9 Maximum 34 144.7 112.0 Range 83 97.4 48.1 Mean -8.5 102.7 92.3 Standard deviation 21.7 24.1 10.0 Note: Based on monthly data from Dec. 1985 through Dec. 2002; n=205.
Michigan’s smaller sample size should make its results more variable, but this is
masked in the raw data given the construction of the indices. The data when standardized
show that Michigan’s index is in fact more variable than either ABC/Money’s or the
Conference Board’s (see below).
Comparing the Confidence Indices: Reliability
Given the significant methodological differences between these surveys, one
might wonder how they all can realistically claim to be measuring the same construct,
consumer confidence. This is an issue of reliability. The test is in how well the results of
the three indices empirically relate to each other over time. We explore this for the
overall indices, as well as for the two sub-indices, current and expectations. Finally, we
look at the relationship between current conditions and expectations to evaluate the
utility of combing them into an overall index.

16
1. Overall Indices
Even with all the methodological differences between the three surveys, we find
that the overall confidence indices pass the reliability test with ease. All three closely
track each other over the 17-year time period reviewed in this article, with correlations of
.91 (p < .001) between ABC/Money and Conference Board, .90 (p < .001) between
Michigan and Conference Board, and .88 (p < .001) between Michigan and ABC/Money.
Graphing the data shows the very close correspondence between the indices over time,
with the exception of a few larger swings by Michigan in the early 1990s (Figure 1).9
The close correspondence of Conference Board to ABC/Money and Michigan
may surprise some, given its non-probability sampling; and may lead others to wonder
whether the expense of probability sampling is justified, given the very similar results
produced by a non-probability sample. While this article does not address that debate, the
cause of the correspondence seems clear. The correlations we measure are an analysis of
trend over time, not of population values at a given point along the way. The consistency
of the Conference Board's procedures produces reliable trend over time, regardless of the
validity of population values at any specific point in time.
In sum, regardless of any short-term differences, the fact that the three main
consumer confidence indices correlate so strongly over time is solid evidence of the
reliability of these measures (cf. Nunnally, 1978). The Cronbach’s alpha for the three
indices is .91 (p<.001), clearly indicating that they all measure the same underlying
construct.

17
2. Current Conditions
Since two of the overall indices combine expectations and current assessments,
while one does not, it also makes sense to look at these subcomponents separately. Using
measures of current conditions alone, we also find strong relationships. The correlation
between ABC/Money and the current conditions component of Conference Board is
especially sizable (r=.93; p < .001), but we also find very high correlations between the
current conditions component of Michigan and its peers: r=.83 (p < .001) with
ABC/Money and r=.82 (p < .001) with Conference Board (see Figure 2).
3. Expectations
The three expectations measures are also reliably related to each other, although
the strength of the correlations is lower than those observed for current conditions. The
largest correlation is between Conference Board and Michigan (r=.83, p < .001) which
makes sense given the content of the questions. Both expectations indices include ratings
of business conditions and family finances.
The correlation between the single ABC/Money expectations question and
Michigan's expectations index is .74 (p < .001). ABC/Money asks about the direction of
the national economy, and two of Michigan’s three questions also ask expectations of
national conditions. The correlation between ABC/Money and Conference Board is
somewhat lower (r=.58; p < .001); ABC/Money’s question on the direction of the
9 The graphs in this article use standardized scores because, as noted above, the scales used by the three confidence indices are not directly comparable.

18
economy is conceptually different than the Conference Board’s questions, which measure
family income and local rather than national conditions.10
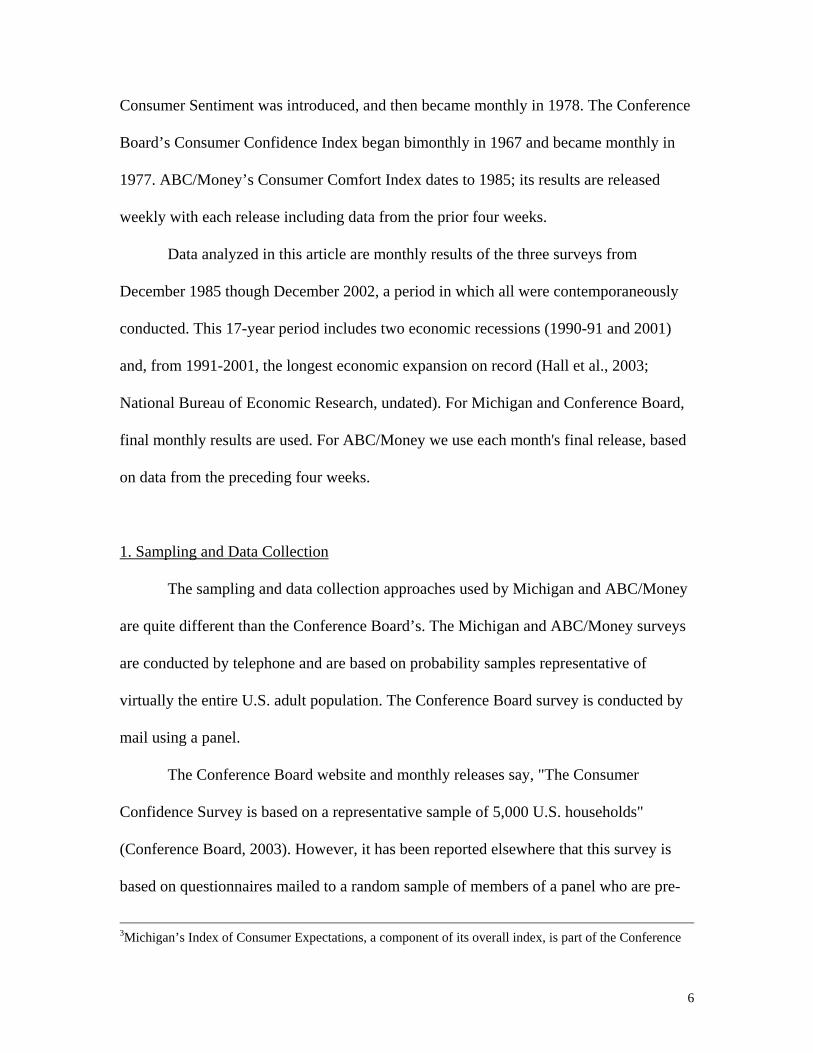
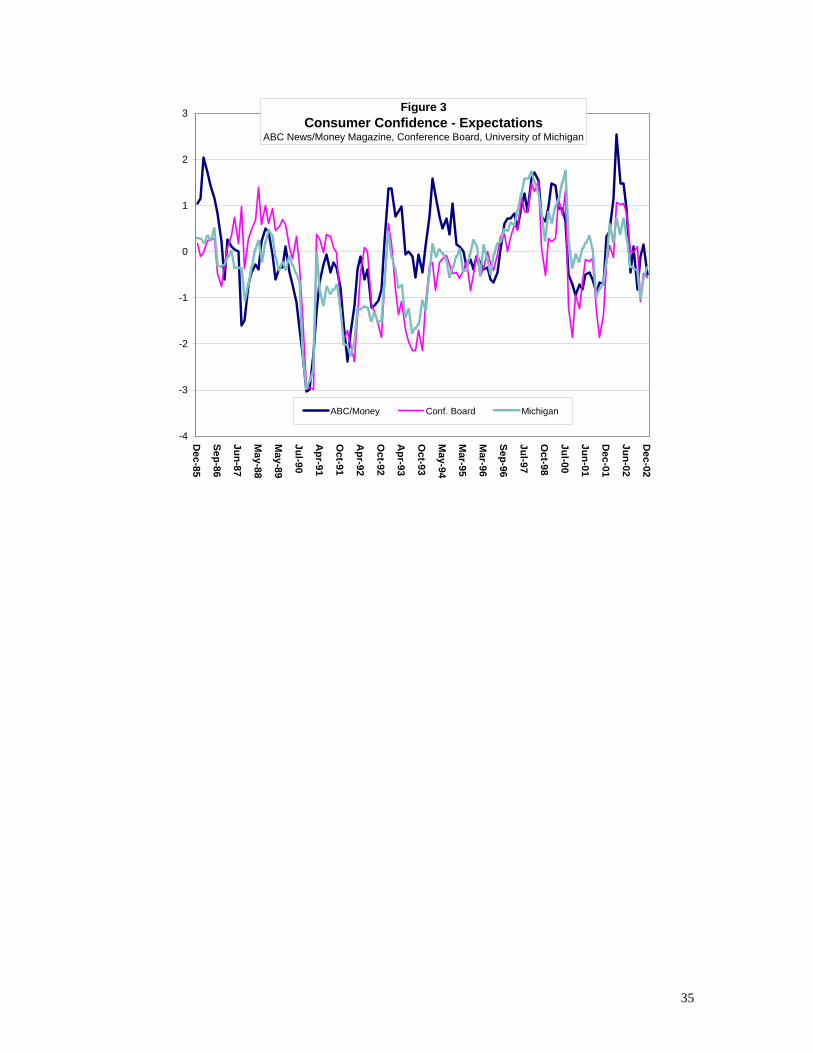
It's particularly noteworthy that the standardized expectations data show much
more volatility than assessments of current conditions, especially for ABC/Money and
the Conference Board (see Figure 3). This could be another reason for the lower
correlations. It would seem that by their nature, expectations are predictive and therefore
subject to more guesswork; this may create additional measurement error that attenuates
the relationships. In Michigan’s case, hypothetically the five-year outlook might cause
respondents to retreat toward reiterating current assessments, hence the higher correlation
between its expectations and current conditions indices reported below.
Current assessments themselves would seem to be grounded in personal
experience and current observation; they're more stable across the three indices, and may
have less measurement error. Indeed, despite suggestions of volatility (Hagenbaugh,
2003), measurements of current confidence are exceedingly stable. Weekly changes in
the ABC/Money index were within the margin of sampling error in 784 of 887 weeks
covered in this study, or 88 percent of the time. Monthly changes in the Michigan current
sentiment index were within the margin of sampling error in 188 of 205 months studied,
or 92 percent of the time.
Monthly changes in the Michigan expectations index also were stable, within
sampling error 85 percent of the time (174 out of 205 weeks). By contrast, monthly
changes in ABC/Money expectations data, in the 102 months for which change data are
10 As noted, data for the ABC/Money expectations question are only available for 133 of the 205 months studied here. However, the Conference Board and Michigan correlation using only those 133 months is essentially the same as for the full period (r=.80, p<.001), suggesting that the ABC/Money correlations are unaffected by missing data.

19
available, was within sampling error less often – 64 percent of the time.11 As noted, the
Conference Board doesn’t report the standard errors necessary to make this comparison
for its data.
4. Current Conditions vs. Expectations
This raises the question of whether it makes sense conceptually and statistically to
combine current sentiment with expectations. If the two are fundamentally different,
combining them can obscure rather than elucidate the direction and content of consumer
views.
A reliability analysis sheds more light on this. The Cronbach’s alpha for
Michigan’s current and expectations indices is quite large at .91 (p < .001), indicating
that these two components track very closely with each other. Therefore, it’s reasonable
to combine them into a single overall index for that survey.
The alphas for ABC/Money (.65; p < .001) and Conference Board (.53; p < .001)
are much lower. Current sentiment and expectations in these two surveys often don’t
move in tandem, but for different reasons. Looking at the unstandardized values shows
that ABC/Money’s expectations measure shows much more movement over time than
does its current index. For the Conference Board, expectations move in a much narrower
range than do current conditions.
While there’s no one standard for what constitutes an acceptable level of
reliability, Nunnally (1978) provides some general guidelines. For exploratory research
he suggests that a reliability of .70 is sufficient, and for basic research .70-.80. In
11 The Michigan figure for the same 102 months is 77 percent, still higher than ABC/Money.

20
contrast, Nunnally states that “in many applied settings a reliability of .80 is not nearly
high enough” and that when important decisions are to be made with the data “a
reliability of .90 is the minimum that should be tolerated” (pp. 245-46). Clearly, the
important uses to which the confidence indices are put would argue for a standard near
the higher end of these ranges.
Mismatches between expectations and current conditions are another reason there
can be divergences between the overall confidence indices in the short term, although
they’re very highly correlated in the long term. As noted, ABC/Money doesn’t include
expectations in its overall index, while Conference Board and Michigan do. When
expectations spike up or down, or when expectations and current sentiment move in
different directions, as sometimes occurs, the Conference Board and Michigan indices
will tell a different short-term story than ABC/Money.
Validity and Objective Economic Measures
Now that the reliability of the confidence indices has been established, we turn
our attention to the critical issue of validity: What do these indices tell us about the
general state of the economy and, specifically, how do they relate to other economic
measures?
An early criticism of the attitude questions in Michigan’s confidence survey was
that they did not predict future consumer expenditures at the individual level (Tobin,
1959; Federal Reserve Board, 1955). This criticism seems misplaced today given the
widespread use of the confidence indices as aggregate measures of public sentiment (see
also Katona, 1957). Indeed, the preponderance of recent studies by economists on the

21
topic have looked at the ability of aggregate measures of confidence to predict future
economic conditions after controlling for other economic variables. Findings on this are
mixed. Some studies have found that confidence does predict future consumer spending
(Bram and Ludvigson, 1998; Kumar, Leone, and Gaskins, 1995; Carroll, Fuhrer, and
Wilcox, 1994) and the future rate of GDP growth (Howrey, 2001; Matsusaka and
Sbordone, 1995). But other research has found the forecasting ability of confidence to be
limited (e.g., Garner 2002; Garner, 1991; Madsen and McAleer, 2000).
As public opinion researchers, our focus here is on assessing the validity of the
confidence indices rather than on economic forecasting. Therefore, we analyze the
coincident correlations between the indices and a variety of key economic indicators. We
begin by looking at these correlations for the overall indices, followed by the current
condition indices, the three current condition variables that make up the ABC/Money
index, and then the expectations indices. The section concludes with a review of how the
confidence indices have moved going into and out of recent economic recessions.
We selected a variety of key economic indicators measured on a monthly basis:
unemployment, personal consumption expenditures, the federal funds rate, consumer
price index (CPI), the Dow Jones Industrial Average (DJIA), retail sales, and personal
income (see Appendix C). Additionally, we also analyzed real gross domestic product
(GDP) which is available quarterly. We compiled data on these measures for the entire
time period studied here with two exceptions: personal consumption expenditures starts
in January 1987 and retail sales in January 1992.12
12 In 1992, the Census Bureau changed its methodology for estimating retail sales, so its pre-1992 data are not comparable.

22
There are a variety of ways to compute these correlations; caution is required,
because some are fraught with confounding factors. One example would be simply to
correlate the monthly values of the indices with the monthly values of the economic
measures. These results could be misleading, however, because the economic measures
often include a strong time trend. Table 3 shows how strongly most of these variables are
correlated with time, .93 or greater. The exceptions are the two that are measured in
proportions, unemployment and the federal funds rate, although they also are
significantly correlated (negatively) with time.
Table 3 Correlation Between Time and Economic Measures Time CPI 1.00** Retail sales (n=132) 1.00** GDP (n=68) .99** Personal expenditures (n=192) .98** Income .96** DJIA .93** Federal funds rate -.60** Unemployment rate -.59** **p<.001; n=205 except where noted.
Given their movement over the period studied – sharply up during the long
economic expansion of 1991-2001 – the three confidence indices are also positively
correlated with time. Therefore, correlations between the confidence indices and the
economic measures would be inflated because they’d be confounded with time.
The solution is to de-trend the data by using change scores. For the confidence
indices, we computed change by taking the current month minus that same month the
previous year. We used the same principle for the economic measures, except that we
computed the percent change. To have a standard period of comparison, these

23
correlations are based on data from December 1986 though December 2002, because it’s
not possible to compute change scores for ABC/Money before the start of its second year.
1. Overall Indices
Table 4 shows the correlations between each overall index and the economic
variables. All of the correlations are in the expected direction: negative for
unemployment and CPI and positive for the rest. The confidence indices correlate most
strongly with GDP, unemployment, personal consumption expenditures and the federal
funds rate, providing compelling evidence of the validity of the confidence measures. In
addition, there are moderate and statistically significant correlations in the expected
directions between the indices and the other economic variables: the Dow, CPI, retail
sales13 and income.
Averaging across the eight economic measures yields overall correlations of .51
for Conference Board, .50 for ABC/Money and .38 for Michigan.14 One possible
explanation for the somewhat lower correlations for Michigan – greater measurement
error because of its smaller sample size – does not test out. Using quarterly Michigan
data with three times the sample size, the average correlation is .40, - still somewhat
lower than those for the monthly ABC/Money and Conference Board data.
Table 4 Correlation Between Confidence Indices and Economic Measures Using Change Scores
13As noted, data for retail sales are only available starting in January 1992. We re-ran all these correlations using only data from January 1992 through December 2002 to see if the restricted time period affects them. The average correlations across these items were similar for ABC/Money (r=.48; p < .001) and Michigan (r=.35; p < .001) and slightly lower for the Conference Board (r=.43; p < .001), suggesting that the time period is not greatly affecting the retail sales correlations. 14 We also ran this analysis using quarterly data and the results were very similar, with average correlations of .53 (p < .001) for Conference Board, .52 (p < .001) for ABC/Money, and .40 (p < .001) for Michigan.

24
ABC/Money Conference Board Michigan GDP (n=64) .75** .81** .66** Unemployment rate -.70** -.75** -.45** Personal expenditures (n=180) .58** .58** .43** Federal funds rate .52** .58** .30** DJIA .39** .35** .28** CPI -.36** -.27** -.34** Retail sales (n=120) .35** .38** .33** Income .32** .34** .23* Absolute mean .50** .51** .38** **p<.001, *p<.01; n=193 except where noted.
2. Current Conditions
Table 5 shows the correlations between the current conditions indices and the
economic measures. While the average correlations here are similar to those for the
overall indices, the magnitude of some of the individual correlations changed. For
Conference Board, the current condition correlations are larger for unemployment (-.92
compared to -.75) and the federal funds rate (.72 compared to .58) and a smaller for CPI
(-.15 compared to -.27). For Michigan, the current conditions correlation was larger for
personal consumption expenditures (.52 compared to .43). (This does not affect
ABC/Money’s correlations since its overall index contains only current measures.)
Table 5 Correlation Between Current Indices and Economic Measures Using Change Scores
ABC/Money Conference Board Michigan GDP (n=64) .75** .81** .72** Unemployment rate -.70** -.92** -.59** Personal expenditures (n=180) .58** .63** .52** Federal funds rate .52** .72** .33** DJIA .39** .33** .24* CPI -.36** -.15 -.33** Retail sales (n=120) .35** .43** .34** Income .32** .32** .23* Absolute mean .50** .54** .41** **p<.001, *p<.01; n=193 except where noted.
3. Individual ABC/Money Gauges

25
We also correlated the objective economic measures with ABC/Money’s
individual questions on current sentiment (Table 6). As one would expect, ratings of the
national economy are a stronger correlate of GDP and unemployment than are ratings of
personal finances or of the buying climate. And buying climate is a stronger correlate of
CPI than are the other two measures. Contrary to what one might expect, though, the
three ABC/Money measures don’t differ significantly in their correlations with
expenditures, retail sales and income.
Overall, the economic variables correlate more strongly with the general question
about economic conditions in the county than with the two personal questions about
finances and buying conditions. This runs counter to Dominitz and Manski’s (2004)
suggestion that personal assessments are preferable to more general ones when measuring
consumer confidence.
Table 6 Correlation Between Current ABC/Money Questions Economic Measures Using Change Scores National Personal Buying economy finances climate GDP (n=64) .76** .67** .58** Unemployment rate -.75** -.63** -.38** Personal expenditures (n=180) .55** .51** .51** Federal funds rate .57** .52** .21* DJIA .41** .22* .35** CPI -.27** -.21* -.54** Retail sales (n=120) .32** .35** .31* Income .33** .26** .22* Absolute mean .50** .42** .39** **p<.001, *p<.01; n=193 except where noted.
4. Expectations

26
Next we correlated the Conference Board and Michigan expectations indices with
the economic measures. The ABC/Money expectations measure was not included
because of the large amount of missing data.15
Most of the correlations with expectations are significantly lower than for current
sentiment, which makes sense given the greater relative variability of expectations (Table
7). Overall, the average correlation with Conference Board’s expectations index is .27,
compared with .54 for its current conditions index. For Michigan, it’s .33 for
expectations, compared with .41 for current conditions.
By their nature, expectations may correlate better with future economic
conditions than with current conditions. As noted, the Index of Leading Economic
Indicators includes Michigan’s Index of Consumer Expectations, but no measure of
current sentiment.
Table 7 Correlation Between Expectations Indices and Economic Measures Using Change Scores
Conference Board Michigan GDP (n=64) .49** .58** Unemployment rate -.24* -.35** Personal expenditures (n=180) .29** .34** Federal funds rate .17* .26** DJIA .23* .27** CPI -.32** -.31** Retail sales (n=120) .15 .29* Income .24* .21* Absolute mean .27** .33** **p<.001, *p<.01; n=193 except where noted. 5. Recession and Recovery
15 As noted, ABC/Expectations data were only available for 133 of the 205 months during this time period. However, computing the change scores further reduced the valid cases to under half the number available for Conference Board and Michigan. That’s because data are needed in both the current month and the comparison month to compute the change scores.

27
As noted, this analysis measures coincident correlations between confidence and
other economic measures. Although an analysis of leading and lagging correlations is
beyond the scope of this article, we conclude this section by looking at how the
confidence indices moved going into and out of recent economic recessions.
Observationally, the data suggest that current economic sentiment better predicts
the start of recessions, while expectations better predict the end of recessions. This would
be another reason to consider these two facets of confidence separately.
All three confidence indices fell in advance of the last two recessions (see
Appendix D). The ABC/Money index fell 10 points in the three months before the 1990-
91 recession; Michigan and Conference Board each dropped about six points.16
ABC/Money lost 18 points going into the 2001 recession; Michigan lost about seven
points, the Conference Board, nearly 12. [It's been suggested that confidence measures in
1991 far outshone the prognostications of professional economists in anticipating the
onset of recession (Langer, 1991).]
Approaching the end of the 1990-91 recession, Michigan and Conference Board
each gained about 20 points, almost entirely due to jumps in their expectations
components. Michigan’s expectations index rose 30 points; Conference Board’s 40
points. Meanwhile, Michigan’s index of current conditions rose only about nine points,
while Conference Board’s current index actually lost nearly 12 points during that time.
The ABC/Money index of current sentiment gained eight points – while ABC/Money’s
separate measure of expectations gained 16 points.
16 As noted above, because the indices are computed differently, the magnitude of the point changes across each index isn’t directly comparable.

28
Michigan and Conference Board data follow a similar pattern in earlier
recessions. In the 1981-82 recession and the 1979-80 recession, Michigan's index rose
more coming out than it lost before each one. But the gains it made at the end of each
recession were not nearly as large as in 1990-91 (then, the index rose 22 points; in 1982 it
rose almost seven points; and in 1980, about 10 points). As in 1991, the increase coming
out of the 1981-82 recession was fueled by a 10-point rise in Michigan’s expectations
component, while the current conditions component rose only one point. In 1980,
however, the two indices performed equally, with the expectations index rising nine
points and the current index gaining 10 points.
Whatever gains were made in the Conference Board data coming out of these
earlier recessions were again due to rises in its expectations component. In fact, the
current component tended to lose points coming out of each recession. Coming out of the
1979-80 recession, the Conference Board index rose about five points, with the current
component losing 26 points, and the expectations component gaining about 25 points.
Changes were slighter coming out of the 1981-82 recession: the current component in the
Conference Board's index fell five points and the expectations component rose just over
four points, producing only a half-point gain in the overall index.
Political Sentiment
The previous sections demonstrate the usefulness of the consumer confidence
indices as gauges of the economy. This section expands the scope of the analysis out of
the economic realm by empirically testing the importance of confidence in political
sentiment, specifically presidential approval, the widely used right direction-wrong track

29
question and Gallup’s measure of satisfaction with the way things are going in the United
States.
Recent elections highlight the important role consumer confidence plays in
informing political sentiment. The defeat of George H.W. Bush in 1992 appeared directly
related to the poor economic conditions of the time. The outcome of the 1994 election
also was related to continued economic discontent (confidence had not yet well
recovered, despite the fact that recovery technically was underway). And Bill Clinton's
re-election was widely regarded as a function of the strong economic conditions that
prevailed in 1996.
Indeed, as noted above, it's axiomatic that absent war or national crisis, nothing
influences presidential approval like consumer confidence, particularly when it manifests
broad economic discontent. Correlations between the confidence indices and presidential
approval bear this out.
Over the time period studied, there’s a small but significant positive relationship
between confidence and presidential approval (Table 8).17 But this correlation is
suppressed by the Persian Gulf War in 1991 and the September 11, 2001 attacks and
subsequent war on terrorism. Both of these boosted presidential approval dramatically at
the same time that consumer confidence was falling.18
17 Presidential approval was computed by averaging the results of Gallup polls conducted during each month. Data were available for 199 of the 205 months studied. Question wording: “Do you approve or disapprove of the way [president’s name] is handling his job as president?” 18 For a complete discussion of the impact of rally events on presidential approval, see Hugick and Engle (2003) and Hugick and Gallup (1991).

30
A regression analysis was used to control for the impact of wartime events using a
dummy variable.19 The analysis finds that controlling for war doubles the strength of the
relationship between confidence and presidential approval from an average beta across
the three surveys of .21 to .42 (Table 8). But the impact of wartime events has an even
larger impact on approval, with an average beta of .75. These two variables together
explain over half of the variance in presidential approval for each of the three confidence
indices.
Table 8 Regression Results Predicting: Pres. Approval Satisfaction Right Direction (n=199) (n=113) (n=134) Confid. Confid. Confid. Confid. Confid. Confid. only and war only and war only and war ABC/Money .27** .43** .75** .85** .66** .75** Wartime dummy -- .73** -- .45** -- .46** Adj. R Square .07 .57 .56 .75 .43 .63 Conference Board .23* .44** .68** .81** .59** .72** Wartime dummy -- .76** -- .48** -- .50** Adj. R Square .05 .58 .45 .66 .34 .57 Michigan .13 .38** .61** .77** .50** .70** Wartime dummy -- .76** -- .50** -- .55** Adj. R Square .01 .52 .36 .59 .25 .51 Average betas: Confidence .21** .42** .68** .81** .58** .72** Wartime dummy -- .75** -- .48** -- .50** Note: Table entries are beta coefficients. **p<.001, *p<.01
The data also suggest that falling and low confidence hurt a president’s approval
rating more than rising and high confidence help. Presidential approval bottomed out
below confidence’s low (in standardized data) after the 1990-91 recession. However,
19 The dummy variable was coded 1 starting at the point when presidential approval surged because of wartime events, through the time that approval reverted back to it pre-war levels.

31
during the recovery in the 1990s, approval increased, but never reached confidence’s
heights.
Next, we looked at the relationship between consumer confidence and two
general measures of the country’s mood: the right direction-wrong track question and a
measure
of satisfaction with the way things are going in the United States.20 Both of these are
typically used as basic measures of the political climate in this country, and they track
closely with presidential approval. The correlation between approval and satisfaction is
.73 (p<.001); between approval and right direction, .74 (p<.001).
Consumer confidence is more strongly correlated with both satisfaction and right
direction than it is with presidential approval. The average correlation between
confidence and satisfaction is .68, and between confidence and right direction, .58 (Table
8). That’s about three times the strength of the relationship between confidence and
approval noted above (before controlling for war).
Controlling for war somewhat increases the strength of the relationship between
confidence and these two variables, but not as much as with approval. Both of these
measures clearly have a large economic component. In all of the equations, the impact of
confidence is quite a bit larger than for war. The opposite was the case for presidential
approval.
20 The right direction-wrong track data were compiled using the Roper Center archive and include findings from a variety of national polls, from ABC News and others. Data were found for 134 of the 205 months studied. The ABC News question asks: “Do you think things in this country (are generally going in the right direction) or do you feel things (have gotten pretty seriously off on the wrong track)?” Others included use very similar wording. The Gallup question on satisfaction asks: “In general, are you satisfied or dissatisfied with the way things are going in the United States at this time?” Data from 113 months were found, including 111 from Gallup, one from CBS News/New York Times and one from Princeton Survey Research Associates.

32
Discussion
This article examined in detail the three most prominent, ongoing surveys of
consumer confidence, finding differences in sampling procedures, mode of interviewing,
interview periods, release schedules, question wording and index construction. Despite
these, the three indices closely track each other over the 17-year time period reviewed
here, providing solid evidence of the reliability of these measures.
A main reason the three confidence measures correlate so strongly over time,
even though they use quite different methods, is that they each use a consistent
methodology which produces reliable trend measurements. Combining multiple questions
into an index also undoubtedly also helps. Although the surveys ask quite different
questions, they all tap various aspects of economic conditions. Combining them into an
index increases the reliability of the measures.
Even though the indices are highly correlated over time, the results can diverge in
the short term. One reason is the different fieldwork and release schedules; releases of the
different indices within the same week or even on the same day can be based on very
different field periods. Different operationalizations of confidence can also lead to short-
term divergences: The Conference Board and Michigan indices include expectations and
current sentiment, while the ABC/Money index only includes current views. Divergences
in these two components can lead to different findings in the short term.
Our analysis also finds strong support for the validity of the confidence indices.
Each is significantly correlated with a diverse set of key economic measures over this
time period. As noted, our research here examined coincident correlations. An area for

33
further study, given the conflicting results of previous research on the subject, is the
extent to which each of the three confidence indices leads or lags other economic data –
an important issue for economists and others trying to predict the direction of the
economy. For our purposes as public opinion researchers this is less of an issue, given
that our focus is more on measuring public perceptions at a given point in time rather
than in predicting future movements of the economy. But such an analysis would be of
undoubted interest and value.
We also find strong empirical evidence for the anecdotal observation that
consumer confidence informs the political situation. Confidence wields a major influence
on political sentiment from presidential approval to more general measures of national
well-being. Finally, this analysis also empirically demonstrates the large impact of other
events, such as war or the September 11, 2001 terrorist attacks, on the political landscape,
and shows that such events can trump the usual influence of consumer confidence on
political sentiment.

34
-4
-3
-2
-1
0
1
2
3
Dec-85
Aug-86
Apr-87
Dec-87
Aug-88
Apr-89
Dec-89
Aug-90
Apr-91
Dec-91
Aug-92
Apr-93
Dec-93
Aug-94
Apr-95
Dec-95
Aug-96
Apr-97
Dec-97
Aug-98
Apr-99
Dec-99
Aug-00
Apr-01
Dec-01
Aug-02
ABC/Money Conf. Board Michigan
Figure 1Consumer Confidence
ABC News/Money Magazine, Conference Board, University of Michigan
-4
-3
-2
-1
0
1
2
3
Dec-85
Aug-86
Apr-87
Dec-87
Aug-88
Apr-89
Dec-89
Aug-90
Apr-91
Dec-91
Aug-92
Apr-93
Dec-93
Aug-94
Apr-95
Dec-95
Aug-96
Apr-97
Dec-97
Aug-98
Apr-99
Dec-99
Aug-00
Apr-01
Dec-01
Aug-02
ABC/Money Conf. Board Michigan
Figure 2Consumer Confidence - Current Conditions
ABC News/Money Magazine, Conference Board, University of Michigan
35
-4
-3
-2
-1
0
1
2
3
Dec-85
Sep-86
Jun-87
May-88
May-89
Jul-90
Apr-91
Oct-91
Apr-92
Oct-92
Apr-93
Oct-93
May-94
Mar-95
Mar-96
Sep-96
Jul-97
Oct-98
Jul-00
Jun-01
Dec-01
Jun-02
Dec-02
ABC/Money Conf. Board Michigan
Figure 3Consumer Confidence - Expectations
ABC News/Money Magazine, Conference Board, University of Michigan

36
Appendix A Question Wording of Confidence Measures
ABC News/Money Magazine - Consumer Comfort Index The index is made up of three questions on present conditions. A question on expectations is asked separately. Index questions: 1. Would you describe the state of the nation's economy these days as excellent, good, not so good, or poor? (Current) 2. Would you describe the state of your own personal finances these days as excellent, good, not so good, or poor? (Current) 3. Considering the cost of things today and your own personal finances, would you say now is an excellent time, a good time, a not so good time or a poor time to buy the things you want and need? (Current) Expectations: Do you think the nation's economy is getting better, getting worse or staying the same? (Future) University of Michigan - Index of Consumer Sentiment The index is made up of five questions: two on present conditions and three on expectations. The two component indexes are reported in addition to the overall index. 1. We are interested in how people are getting along financially these days. Would you say that you (and your family living there) are better off or worse off financially than you were a year ago? (Current) 2. Now looking ahead - do you think that a year from now you (and your family living there) will be better off financially, or worse off, or just about the same as now? (Future) 3. Now turning to business conditions in the country as a whole - do you think that during the next twelve months, we'll have good times financially or bad times, or what? (Future) 4. Looking ahead, which would you say is more likely - that in the country as a whole we'll have continuous good times during the next five years or so, or that we will have periods of widespread unemployment or depression, or what? (Future) 5. About the big things people buy for their homes - such as furniture, a refrigerator, stove, television, and things like that. Generally speaking, do you think now is a good or bad time for people to buy major household items? (Current) The Conference Board - Consumer Confidence Index The index is made up of five questions: two on present conditions and three on expectations. The two component indexes are reported in addition to the overall index.

37
1. How would you rate the present general business conditions in your area? Good, normal, or bad? (Current) 2. Six months from now, do you think they will be better, the same, or worse? (Future) 3. What would you say about available jobs in your area right now? Plenty, not so many, or hard to get? (Current) 4. Six months from now, do you think there will be more, the same, or fewer jobs available in your area? (Future) 5. How would you guess your total family income to be six months from now? Higher, the same, or lower? (Future)

38
Appendix B Computation of Confidence Indices
ABC/Money – Consumer Comfort Index
The Consumer Comfort Index (CCI) is computed by taking the sum of the positive percentages (“excellent” and “good”) from each question and subtracting the sum of the negative percentages (“not so good” and “poor”) and then averaging them (Langer, 2003). For each question, Xi = (excellent % + good %) – (not so good % + poor %) CCI = (X1+X2+X3)/3 Example: X1. National economy: excellent (5%), good (60%), not so good (25%), poor (10%) X2. Personal finances: excellent (5%), good (60%), not so good (25%), poor (10%) X3. Personal buying climate: excellent (5%), good (60%), not so good (25%), poor (10%) Xi = (65-35) = 30 CCI = [(30)+(30)+(30)]/3 = 30. Conference Board - Consumer Confidence Index The Consumer Confidence Index (CCI) is computed by taking the positive percentage for
each question divided by the sum of the positive and negative percentages. This number
is then divided by the base year value from 1985 and multiplied by 100.21 The resulting
values from each question are averaged to form the overall index (Franco, 2004). The
CCI is also seasonally adjusted (computation not shown).
For each question, Xi = [((positive %)/(positive % + negative %))/Base Year Value]*100 CCI = ((X1+X2+X3+X4+X5)/5) Example: X1. Current business conditions: good (65%), normal (0%), bad (35%) X2. Future business conditions: better (65%), the same (0%), worse (35%)? X3. Current jobs: plenty (65%), not so many (0%), hard to get (35%) X4. Future jobs: will be more (65%), the same (0%), fewer (35%) 21A different base year value is used for each question. The example below uses one value for illustrative purposes.

39
X5. Future family income: higher (65%), the same (0%), lower (35%) Base Year Value = 62.5 Xi = [(65/(65+35))/62.5] * 100 = 104 CCI = ((104+104+104+104+104)/5) = 104 Michigan - Index of Consumer Sentiment The Index of Consumer Sentiment (ICS) is computed by taking the difference between the positive and negative percentages for each question and then adding 100 to each. These are summed and then divided by a factor representing the base year, 1966 (i.e., 6.7558). Finally a small correction is made to account for a design change in the 1950s (i.e., 2) (Surveys of Consumers, undated).
For each question, Xi = (positive % - negative %) + 100 ICS = [(X1+X2+X3+X4+X5)/6.7558]+2 Example: X1. Current family finances: better off (65%), worse off (35%) X2. Future family finances: better off (65%), worse off (35%), about the same (0%) X3. Future business conditions: good times (65%), bad times (35%), or what (0%) X4. Future national economy: continuous good times (65%), periods of widespread unemployment or depression (35%), or what (0%)? X5. Current buying climate: good time (65%), bad time (35%) Xi = (65–35) + 100 = 130 ICS = [(130+130+130+130+130)/6.7558]+2 = 98

40
Appendix C Description of the Objective Economic Measures22
Consumer Price Index - CPI Measures the average change in prices over time of goods and services purchased by households (for all urban consumers). Source: Bureau of Labor Statistics Dow Jones Industrial Average Monthly average of the weekly closing price of the Dow Jones Industrial Average (average of each Friday’s closing for the month). Source: Dow Jones Federal Funds Rate The cost of borrowing immediately available funds, primarily for one day. The effective rate is a weighted average of the reported rates at which different amounts of the day's trading through New York brokers occurs. Monthly figures are averages of each calendar day in the month. Source: Federal Reserve Board of Governors Gross Domestic Product - GDP Real gross domestic product, seasonally adjusted (in chained 1996 dollars). Covers the goods and services produced by labor and property located in the United States. Source: Bureau of Economic Analysis Income Real per capita disposable personal income (in chained 1996 dollars). Source: Bureau of Economic Analysis Personal Consumption Expenditures Measures the goods and services purchased by individuals (in chained 1996 dollars). Source: Bureau of Economic Analysis and Economagic. Retail Sales Monthly estimates of broad-based retail trade activity. Calculated using a stratified random sampling method to select retail firms whose sales are then weighted and benchmarked to represent the complete universe of over three million retail firms. (Seasonally adjusted.) Source: U.S. Census Bureau
22 Data on these measures were collected for the 17-year time period studied here with two exceptions: personal expenditures starts in January 1987 and retail sales in January 1992. (In 1992, the Census Bureau changed its methodology for estimating retail sales; the pre-1992 data are not comparable.) All data are monthly except GDP which is quarterly.

41
Unemployment Rate Percent of the civilian labor force that is unemployed, available for work and has made specific efforts to find employment. (Employment rate is one minus the unemployment rate.) Source: Bureau of Labor Statistics

42
Appendix D Confidence Data Leading Into and Out of Recession
__ABC/Money Conference Board Michigan________ Index Expect. Overall Current Expect. Overall Current Expect. Dec-00 +25 NA 128.6 176.1 96.9 98.4 110.5 90.7 Jan-01 +18 -28 115.7 170.4 79.3 94.7 107.7 86.4 Feb-01 +13 -32 109.3 167.1 70.7 90.6 105.8 80.8 Recession starts Mar-01 + 7 -36 116.9 167.5 83.1 91.5 103.4 83.9 Apr-90 -17 NA 107.3 119.4 99.2 93.9 109.4 83.9 May-90 -21 -39 107.3 117.8 100.3 90.6 108.1 79.3 June-90 -16 NA 102.4 111.1 96.6 88.3 106.5 76.6 Recession starts Jul-90 -27 -49 101.7 116.6 91.8 88.2 105.1 77.3 Dec-90 -39 NA 61.2 63.3 59.8 65.5 84.0 53.7 Jan-91 -37 -59 55.1 54.7 55.3 66.8 84.9 55.2 Feb-91 -39 NA 59.4 53.1 63.6 70.4 83.7 62.0 Recession ends Mar-91 -31 -43 81.1 51.7 100.7 87.7 92.7 84.5 Apr-81 NA NA 81.6 64.4 93.1 72.4 78.1 68.8 May-81 NA -35 86.9 72.8 96.3 76.3 80.4 73.6 June-81 NA NA 83.0 66.6 94.0 73.1 76.1 71.2 Recession starts Jul-81 NA NA 83.5 67.7 94.1 74.1 84.9 67.1 Aug-82 NA -33 56.9 21.9 80.2 65.4 72.5 60.9 Sep-82 NA -24 58.1 16.2 86.1 69.3 72.9 66.9 Oct-82 NA -27 54.3 17.8 78.6 73.4 78.1 70.4 Recession ends Nov-82 NA NA 57.4 16.6 84.7 72.1 73.8 71.0 Oct-79 NA NA 92.3 119.5 74.1 62.1 81.6 49.5 Nov-79 90.2 115.9 73.0 63.3 80.9 52.0 Dec-79 90.7 114.4 74.8 61.0 75.8 51.5 Recession starts Jan-80 85.9 107.6 71.4 67.0 87.1 54.1 Apr-80 60.5 76.3 50.0 52.7 65.8 44.4 May-80 50.1 50.2 50.0 51.7 61.7 45.3 June-80 56.1 46.9 62.3 58.7 67.4 53.0 Recession ends Jul-80 “ “ 65.4 50.4 75.4 62.3 76.1 53.4 Aug-73 NA NA 93.8 120.0 76.4 NA NA NA Oct-73 107.5 125.3 95.6 Recession starts Nov-73 NA NA NA Dec-74 43.2 32.3 50.5 Feb-74 54.5 31.9 69.5 Recession ends Mar-75 “ “ NA NA NA “ “ “ Aug-69 NA NA 131.7 162.8 111.0 NA NA NA Oct-69 126.8 162.2 103.2 Recession starts Dec-69 126.0 160.8 102.9 Aug-70 91.0 75.9 101.0 Oct-70 83.2 61.8 97.5 Recession ends Nov-70 “ “ NA NA NA “ “ “

43
References Associated Press (2002). “Shares Fall on Report of Drop in Consumer Confidence.” The New York Times, August 22, Section C, page 10. Bloomberg News (2003). “Consumer Confidence Shows a Substantial Gain.” The New York Times, April 30, page C8. Bureau of Economic Analysis (undated). “National Income and Product Accounts Table.” Available at http://www.bea.doc.gov/bea/dn/nipaweb/TableViewFixed.asp Bram, J. and Ludvigson S. (1998). "Does Consumer Confidence Forecast Household Expenditure? A Sentiment Index Horserace.” FRBNY Economic Policy Review, June, pp. 59-78. Carroll, C.D., Fuhrer, J.C. and Wilcox, D.W. (1994). “Does Consumer Sentiment Forecast Household Spending? If So, Why?” The American Economic Review, December, 1397-1408. Chu, V. (2003). “U.S. Blue-Chip Stocks Slip, Techs Edge Up.” Reuters, April 29. Conference Board (undated). “Methodology.” Consumer Research Center, http://www.crc-conquest.org/consumer_confidence/methodology.htm. Conference Board (2003). “The Conference Board’s Consumer Confidence Index Rebounds in April.” April 29. Curtin, R.T. (undated). “Surveys of Consumers.” University of Michigan, Survey Research Center. Available at http://www.sca.isr.umich.edu/ Curtin, R.T. (1982). “Indicators of Consumer Behavior: The University of Michigan Surveys of Consumers.” Public Opinion Quarterly, 46, 340-352. Curtin, R.T. (2001). E-mail communication. October 5. Curtin, R.T. (2002a). Letter to the Editor, New York Times, July 27, page A10. Curtin, R.T. (2002b). “Surveys of Consumers: The Accuracy of the Preliminary Estimates.” University of Michigan. Available at http://www.sca.isr.umich.edu/ Curtin, R.T. (2002c). “Surveys of Consumers: Theory, Methods, and Interpretation.” Paper presented at the NABE 44th Annual Meeting, Washington, DC., September 30. Curtin, R.T. (2003). E-mail communication. University of Michigan, May 4.

44
Curtin, R.T. (2004). E-mail communication. University of Michigan, June 15. Curtin, R.T., Presser, S. and Singer, E. (2000). “The Effects of Response Rate Changes on the Index of Consumer Sentiment.” Public Opinion Quarterly, 64, 413-428. Curtin, R.T., Presser, S. and Singer, E. (2003). “Recent Response Rate Changes on the Michigan Survey of Consumer Attitudes.” Paper presented at the annual conference of the American Association for Public Opinion Research, Nashville, Tennessee, May 15-18, 2003. D’Innocenzio, A. (2003). “Consumer Confidence Rises Sharply After Four Consecutive Months of Decline; Beats Forecast.” The Associated Press, April 29. Dominitz, J. and Manski, C.F. (2004). “How Should We Measure Consumer Confidence.” Journal of Economic Perspectives, 18. Federal Reserve Board (1955). “Consumer Survey Statistics.” A Report of the Consultant Committee on Consumer Survey Statistics, Board of Governors of the Federal Reserve System, July. Flynn, B. (2001). “Losing Confidence: Consumers Go Slow Amid Economic Uncertainty.” The Orlando Sentinel, September 26. Franco, L. (2003). E-mail communication. Conference Board, April 30. Franco, L. (2004). E-mail communication. Conference Board, June 4. Fuerbringer, J. (2002). “Falling Consumer Confidence Helps Send the Dow Lower.” The New York Times, June 15, Section C, page 4. Garner, C.A. (1991). “Forecasting Consumer Spending: Should Economists Pay Attention to Consumer Confidence Surveys?” Economic Review, May/June, pp. 57-71. Garner, C.A. (2002). “Consumer Confidence After September 11.” Economic Review, Second Quarter, pp. 1-21. Goldberg, H. (1991). “Consumer Survey Garners Unusual Confidence.” The Associated Press, December 1. Hagenbaugh, B. (2003). “Consumer Mood Up, but It May Not Last." USA Today, April 30, page B1. Hall, R. Feldstein, M., Frankel, J., Gordon, R., Romer, C., Romer, D. Zarnowitz, V. (2003). “The NBER’s Business-Cycle Dating Procedure.” Business Cycle Dating Committee, National Bureau of Economic Research, July 17.
45
Howery, P.E. (2001). “The Predictive Power of the Index of Consumer Sentiment.” Brookings Papers on Economic Activity, 1, 175-216. Hugick, L. and Engle, M. (2003). “Rally Events and Presidential Approval – An Update.” Paper presented at the annual conference of the American Association for Public Opinion Research, Nashville, TN, May 15-18. Hugick, L. and Gallup, A.M. (1991). “’Rally Events’ and Presidential Approval.” The Gallup Poll Monthly, June, pp.15-31. Katona, G. (1957). “Federal Reserve Board Committee Reports on Consumer Expectations and Savings Statistics.” The Review of Economics and Statistics, 39, 40-45. Keeter, S, Miller C., Kohut A., Groves R.M. and Presser S. (2000). “Consequences of Reducing Nonresponse in a National Telephone Survey.” Public Opinion Quarterly 64:125-148. Kumar, V., Leone, R. P., Gaskins, J. N. (1995). “Aggregate and Disaggregate Sector Forecasting Using Consumer Confidence Measures.” International Journal of Forecasting, 11, 361-377. Langer, G. (1991). “The Public Can Predict What Economists Can’t.” The Wall Street Journal, May 1, page A14. Langer, G. (2003). “Confidence Its Best in Seven Months.” ABC News Polling Unit, April 22. Linden, F. (1982). “The Consumer as Forecaster.” Public Opinion Quarterly, 46, 353-360. Matsusaka, J.G. and Sbordone, A.M. (1995). “Consumer Confidence and Economic Fluctuations.” Economic Inquiry, 33, 296-318. Madsen, J.B. and McAleer, M. (2000). “Direct Tests of the Permanent Income Hypothesis under Uncertainty, Inflationary Expectations and Liquidity Constraints.” Journal of Macroeconomics, Spring, 229-252. McTeague, P. (2003) “RBS Treasury Morning Call,” Greenwich Capital e-mail distribution list, April 25. Mitofsky, W. (2002). Letter to the Editor, New York Times, July 20, page A12. National Bureau of Economic Research (undated). “Business Cycle Expansions and Contractions.” Available at http://www.nber.org/cycles.html/

46
Nunnally, J. (1978), Psychometric Theory. New York: McGraw-Hill Publishing Company. Saad, L. (2002). “Chicken Little Economics: A Tale of Consumer Confidence After Sept. 11.” Paper presented at the annual conference of the American Association for Public Opinion Research, St. Pete Beach, FL, May 16-19. Soulas, F. and Langer, G. (1994). “Changes in Clinton’s Approval Rating.” Paper presented at the annual conference of the American Association for Public Opinion Research, Danvers, MA, May 11-15. Surveys of Consumers (undated). “Index Calculations.” University of Michigan. Available at http://www.sca.isr.umich.edu/ Sussman, D. (2003). “Post-War Boost in Confidence Ends With a Sharp Snap.” ABC News Polling Unit, April 29. Tobin, J. (1959). “On the Predictive Value of Consumer Intentions and Attitudes.” The Review of Economics and Statistics, 41, 1-11. Utchitelle, L. (2002). “Consumer Confidence Index Goes from an Aha to a Hmm.” The New York Times, June 8, Section A, page 1.