climate change implications -...
TRANSCRIPT
Colorado Drought Mitigation and Response Plan C.i Annex C August 2013
CLIMATE CHANGE IMPLICATIONS
ANNEX C TO THE DROUGHT MITIGATION AND RESPONSE PLAN
August 2013
Prepared Pursuant to
Disaster Mitigation Act 2000 & Section 409, PL 93-288
Prepared by
Colorado Water Conservation Board
Department of Natural Resources
in Cooperation with
The Department of Public Safety
Division of Homeland Security and Emergency Management
and the Drought Mitigation and Response Planning Committee
Colorado Drought Mitigation and Response Plan C.ii Annex C August 2013
Table of Contents
1 Introduction .......................................................................................................................... 1
2 Placing Historical Conditions in Context: Past and Future ................................................ 3
3 Other Climate Change Findings in Colorado....................................................................... 7
3.1 Colorado River Water Availability Study .................................................................... 7
3.2 The Boulder Climate Change Study ........................................................................... 21
4 Incorporating Climate Change into Planning .................................................................... 24
5 Appendix 1: Flow Comparison Charts ............................................................................. 26
6 References .......................................................................................................................... 54
Colorado Drought Mitigation and Response Plan C.1 Annex C August 2013
1 Introduction
The hydrology and water resources of Colorado, and hence the economy of the state, are
extremely sensitive to climate. Multifaceted stress on water supply such as irrigation, municipal
demands, mandated biological flows, and the increasing need for hydropower, coupled with
climate variability and change, are increasing the importance of supply forecasting to both water
managers and business markets. This section of the Colorado Drought Mitigation and Response
Plan was motivated by the question “what could drought look like in the future.” What follows is
a high level analysis of possible implications of climate change for drought in Colorado.
The International Panel on Climate Change (IPCC 2007) has indicated that projected changes in
mean flow or flow variability could cause physical infrastructure to be inadequate for intended
purposes, or increase the risk of failure of the water resource system under extremes of drought.
While such risks may be somewhat buffered in large water systems by robustness and resilience
in the design of the system, smaller systems may be extremely vulnerable under climate
scenarios.
A significant body of work exists considering the effect of climate change on water availability
in the western United States (refer to bibliography). While there is a large amount of uncertainty
regarding future climate scenarios and how these may translate to physical conditions, it is clear
that current climate is not stationary and responsible planning efforts should take into account
this uncertainty. Planning approaches that rely on stationary climate and notions of hydrologic
history repeating itself are inherently flawed. Water managers need to understand how the nature
of drought might vary in the future and incorporate that understanding into their planning
processes.
Climate change has implications both in terms of inter-annual droughts and intra-annual runoff
patterns. Intra-annual spring warming can shift peak runoff earlier in the year; important for
Colorado, where hydrology is driven by snowmelt. Furthermore, many studies agree that higher
temperatures could lead to an increased ratio of precipitation falling as rain versus snow as well
as a higher snowline, which reduces the natural storage effect of Colorado’s mountain snowpack
(i.e., CWCB 2008, CWCB 2012, Knowles et al 2006, Mote 2006, Saunders 2005, Udall 2007).
Consequently, runoff could start earlier and end earlier. If this is the case, reservoirs would fill
earlier, and what could not be stored in the spring and early summer would be spilled when
agricultural demands are not as great as they are later in the summer. Decreased runoff in the
summer would result in additional reservoir drawdown and many studies agree that higher
temperatures and lower precipitation during summer months would further increase agricultural
demands, thus causing even more stress on reservoir storage (CWCB 2008, CWCB 2012).
These factors could reduce the amount of water available for year-to-year carryover storage, thus
increasing drought vulnerability.
The effects of climate change are not expected to be spatially consistent across the state. For
example, there may be areas that receive additional moisture even in a “drier” climate.
Colorado Drought Mitigation and Response Plan C.2 Annex C August 2013
Recently, the Colorado Water Conservation Board commissioned a synthesis report summarizing
climate change science as it relates to Colorado’s water supply (CWCB 2008). Some of their key
findings are copied below. Regional studies suggest a reduction in total water supply in
Colorado by the mid-21st century. Temperature increases and the resulting changes in
evaporation and soil moisture will also add to a trend of decreasing runoff for most of Colorado’s
basins (CWCB 2008). However, when all of the available climate projections are considered,
about one-third indicate no change or an increase in average streamflow in the Upper Colorado
River Basin (i.e. at Lees Ferry Arizona). (Harding et al., 2012)
In Colorado Temperatures increased about 2º F from 1977-2006. All regions examined
within the state warmed during this time period, except the far southeast corner, in which
there was a slight cooling trend.
Climate models project Colorado will warm 2.5º F (+1.5º F to +3.5º F) by 2025, relative to
the 1950-1999 baseline, and 4º F (+2.5º F to +5.5º F) by 2050. The 2050 projections show
summers warming by 5º F (3º F to 7º F). These projections also suggest that typical summer
monthly temperatures will be as warm as or warmer than the hottest 10% of summers that
occurred between 1950 and 1999.
Winter projections show fewer extreme cold months, more extreme warm months, and more
strings of consecutive warm winters. Typical projected winter monthly temperature, although
significantly warmer than current, are between the 10th
and 90th
percentiles of the historical
record. Between today and 2050, typical January temperatures of the Eastern Plain of
Colorado are expected to shift northward by ~150 miles. In all seasons, the climate of the
mountains is projected to migrate upward in elevation, and the climate of the Desert
Southwest to progress up into the valleys of the Western Slope.
Projections show a precipitous decline in lower-elevation (below 8,200 ft) snowpack across
the western part of the state by the mid-21st century. Modest declines are projected (10-20%)
for Colorado’s high-elevation snowpack (above 8,200 ft) within the same timeframe.
Between 1978 and 2004, the spring pulse (the onset of streamflow from melting snow) in
Colorado has shifted earlier by two weeks. Several studies suggest that shifts in timing of
streamflows are related to warming spring temperatures. The timing of runoff is projected to
shift earlier in the spring, and late-summer flows may be reduced. These changes are
projected to occur regardless of changes in precipitation.
Throughout the western part of the state, less frequent and less severe drought conditions
have occurred during the 20th
century than revealed in the paleoclimate records over the last
1,000 years. Precipitation variations are the main driver of drought in Colorado and low Lake
Powell inflows, including the recent drought of 2000-2007, and these variations are
consistent with the natural variability observed in long-term and paleoclimate records.
However, warming temperatures may have increased the severity of droughts and
exacerbated drought impacts.
The drought vulnerability assessment conducted for this project considers vulnerability to
drought in a contemporary sense. However, the climate change implications noted above could
Colorado Drought Mitigation and Response Plan C.3 Annex C August 2013
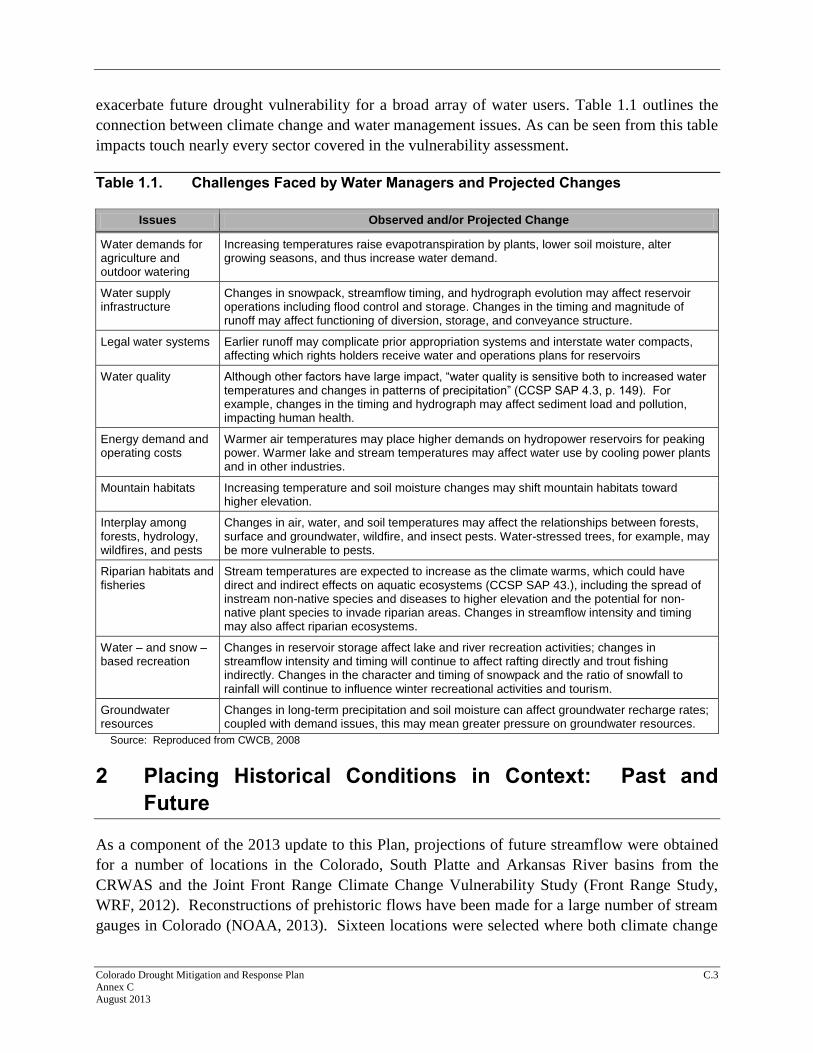
exacerbate future drought vulnerability for a broad array of water users. Table 1.1 outlines the
connection between climate change and water management issues. As can be seen from this table
impacts touch nearly every sector covered in the vulnerability assessment.
Table 1.1. Challenges Faced by Water Managers and Projected Changes
Issues Observed and/or Projected Change
Water demands for agriculture and outdoor watering
Increasing temperatures raise evapotranspiration by plants, lower soil moisture, alter growing seasons, and thus increase water demand.
Water supply infrastructure
Changes in snowpack, streamflow timing, and hydrograph evolution may affect reservoir operations including flood control and storage. Changes in the timing and magnitude of runoff may affect functioning of diversion, storage, and conveyance structure.
Legal water systems Earlier runoff may complicate prior appropriation systems and interstate water compacts, affecting which rights holders receive water and operations plans for reservoirs
Water quality Although other factors have large impact, “water quality is sensitive both to increased water temperatures and changes in patterns of precipitation” (CCSP SAP 4.3, p. 149). For example, changes in the timing and hydrograph may affect sediment load and pollution, impacting human health.
Energy demand and operating costs
Warmer air temperatures may place higher demands on hydropower reservoirs for peaking power. Warmer lake and stream temperatures may affect water use by cooling power plants and in other industries.
Mountain habitats Increasing temperature and soil moisture changes may shift mountain habitats toward higher elevation.
Interplay among forests, hydrology, wildfires, and pests
Changes in air, water, and soil temperatures may affect the relationships between forests, surface and groundwater, wildfire, and insect pests. Water-stressed trees, for example, may be more vulnerable to pests.
Riparian habitats and fisheries
Stream temperatures are expected to increase as the climate warms, which could have direct and indirect effects on aquatic ecosystems (CCSP SAP 43.), including the spread of instream non-native species and diseases to higher elevation and the potential for non-native plant species to invade riparian areas. Changes in streamflow intensity and timing may also affect riparian ecosystems.
Water – and snow – based recreation
Changes in reservoir storage affect lake and river recreation activities; changes in streamflow intensity and timing will continue to affect rafting directly and trout fishing indirectly. Changes in the character and timing of snowpack and the ratio of snowfall to rainfall will continue to influence winter recreational activities and tourism.
Groundwater resources
Changes in long-term precipitation and soil moisture can affect groundwater recharge rates; coupled with demand issues, this may mean greater pressure on groundwater resources.
Source: Reproduced from CWCB, 2008
2 Placing Historical Conditions in Context: Past and
Future
As a component of the 2013 update to this Plan, projections of future streamflow were obtained
for a number of locations in the Colorado, South Platte and Arkansas River basins from the
CRWAS and the Joint Front Range Climate Change Vulnerability Study (Front Range Study,
WRF, 2012). Reconstructions of prehistoric flows have been made for a large number of stream
gauges in Colorado (NOAA, 2013). Sixteen locations were selected where both climate change
Colorado Drought Mitigation and Response Plan C.4 Annex C August 2013
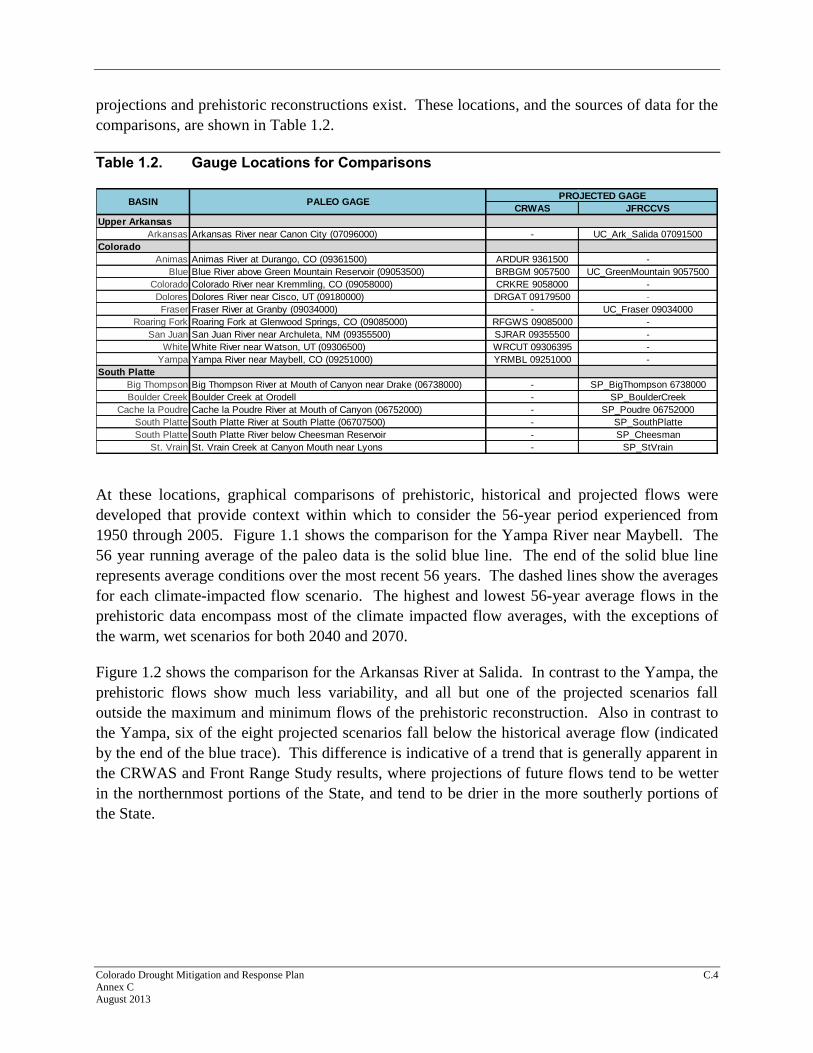
projections and prehistoric reconstructions exist. These locations, and the sources of data for the
comparisons, are shown in Table 1.2.
Table 1.2. Gauge Locations for Comparisons
CRWAS JFRCCVS
Upper Arkansas
Arkansas Arkansas River near Canon City (07096000) - UC_Ark_Salida 07091500
Colorado
Animas Animas River at Durango, CO (09361500) ARDUR 9361500 -
Blue Blue River above Green Mountain Reservoir (09053500) BRBGM 9057500 UC_GreenMountain 9057500
Colorado Colorado River near Kremmling, CO (09058000) CRKRE 9058000 -
Dolores Dolores River near Cisco, UT (09180000) DRGAT 09179500 -
Fraser Fraser River at Granby (09034000) - UC_Fraser 09034000
Roaring Fork Roaring Fork at Glenwood Springs, CO (09085000) RFGWS 09085000 -
San Juan San Juan River near Archuleta, NM (09355500) SJRAR 09355500 -
White White River near Watson, UT (09306500) WRCUT 09306395 -
Yampa Yampa River near Maybell, CO (09251000) YRMBL 09251000 -
South Platte
Big Thompson Big Thompson River at Mouth of Canyon near Drake (06738000) - SP_BigThompson 6738000
Boulder Creek Boulder Creek at Orodell - SP_BoulderCreek
Cache la Poudre Cache la Poudre River at Mouth of Canyon (06752000) - SP_Poudre 06752000
South Platte South Platte River at South Platte (06707500) - SP_SouthPlatte
South Platte South Platte River below Cheesman Reservoir - SP_Cheesman
St. Vrain St. Vrain Creek at Canyon Mouth near Lyons - SP_StVrain
PROJECTED GAGEPALEO GAGEBASIN
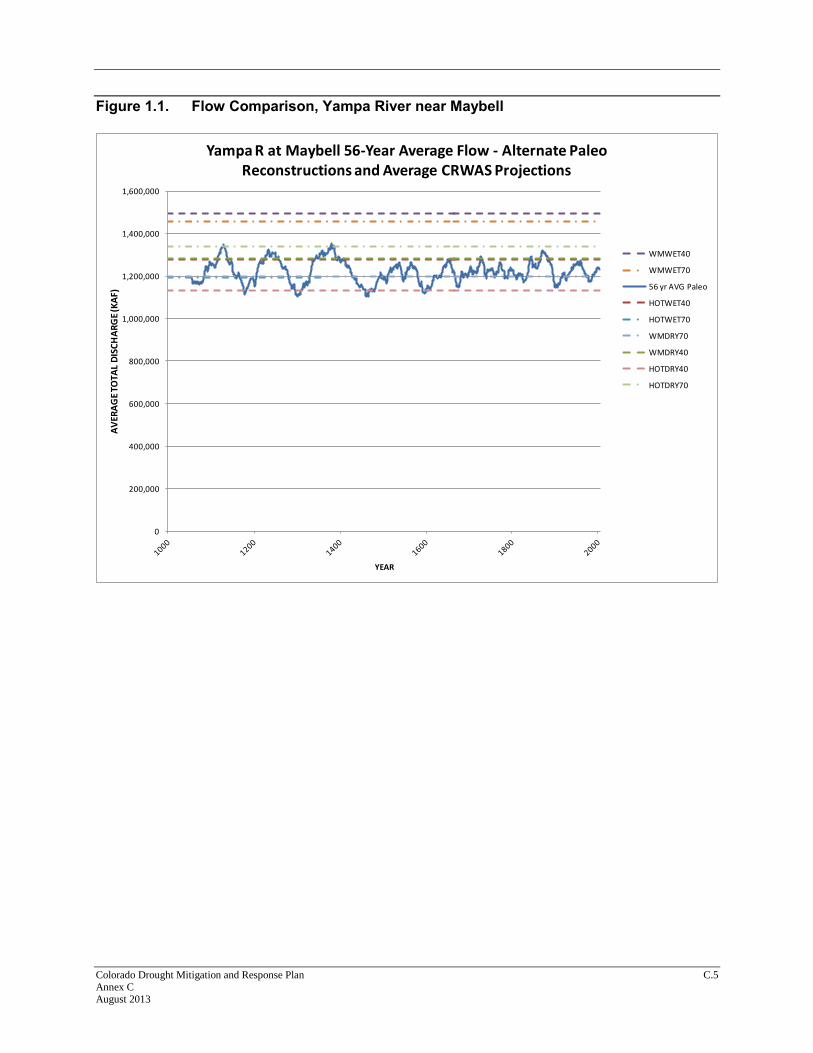
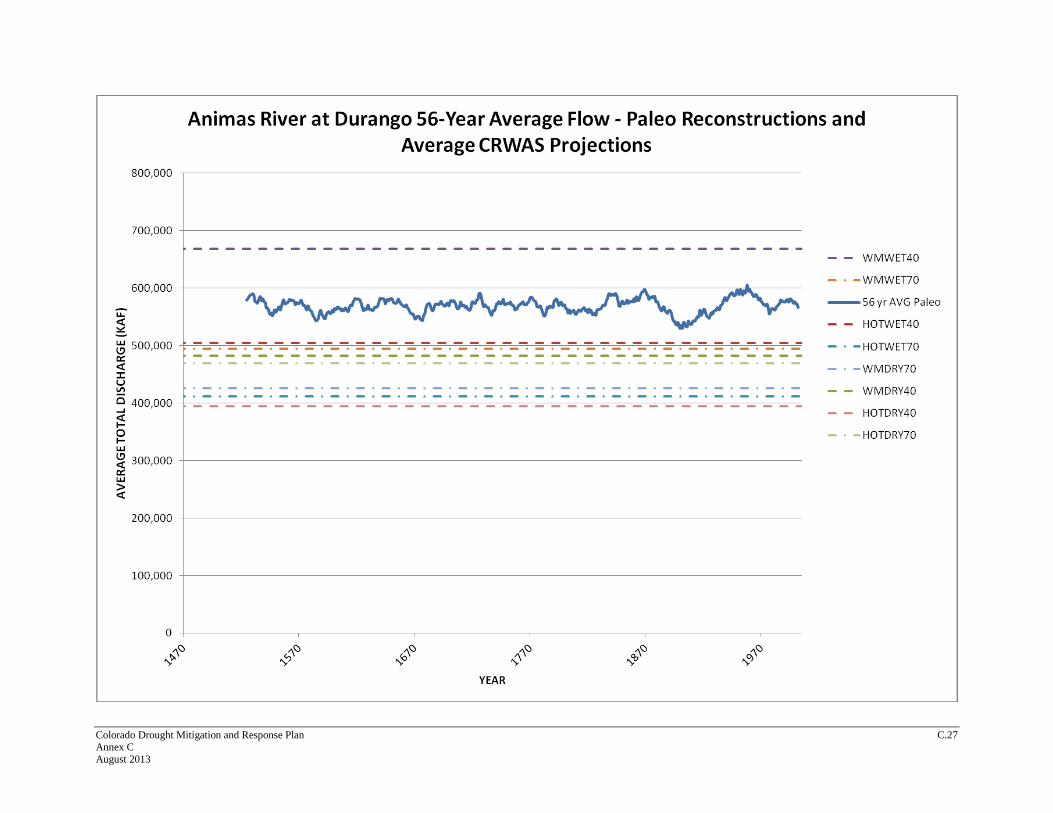
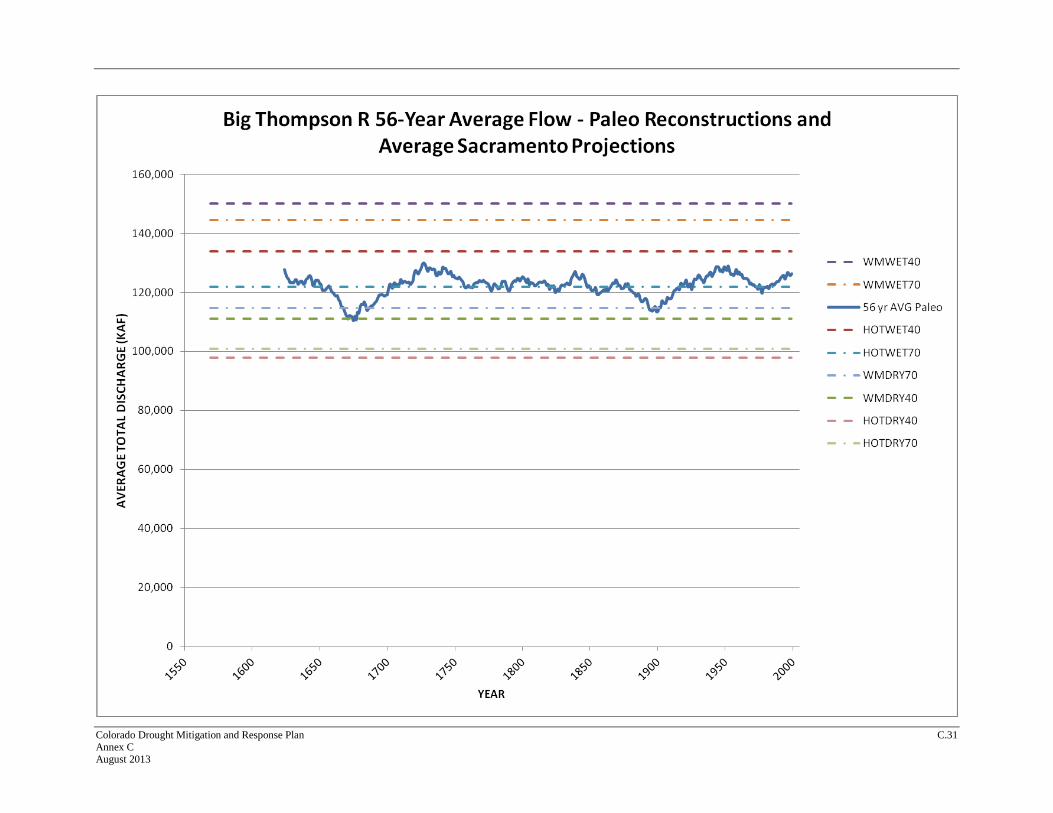
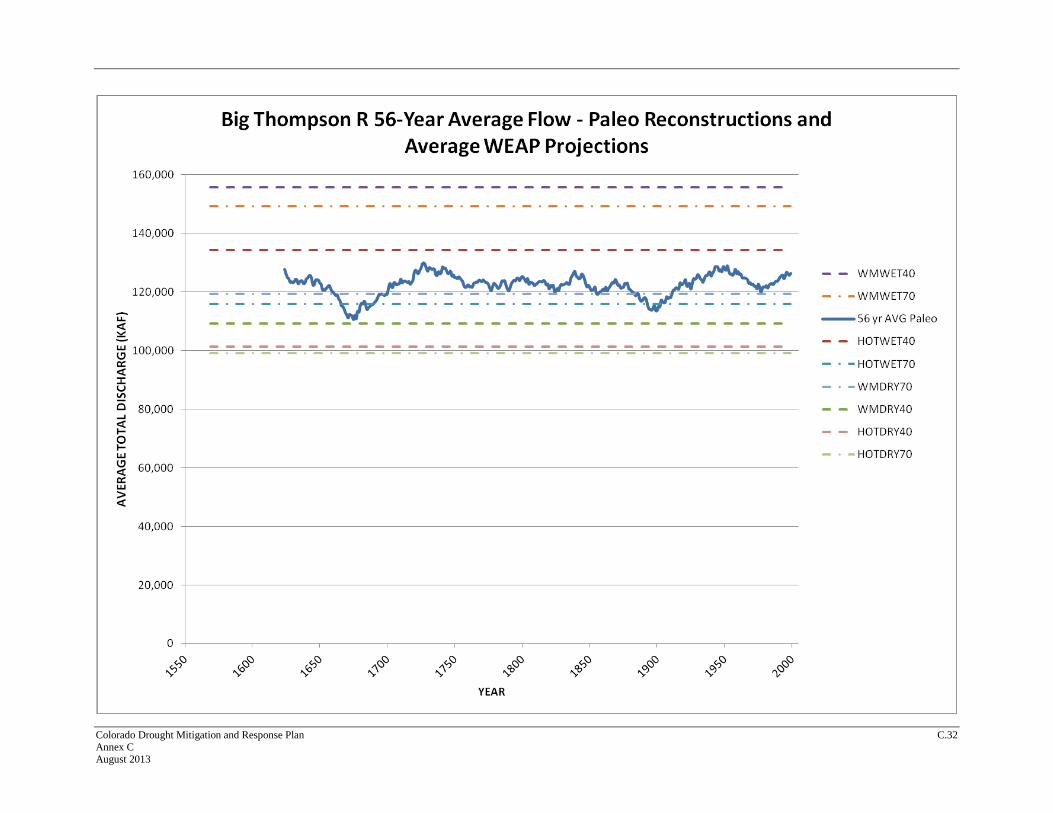
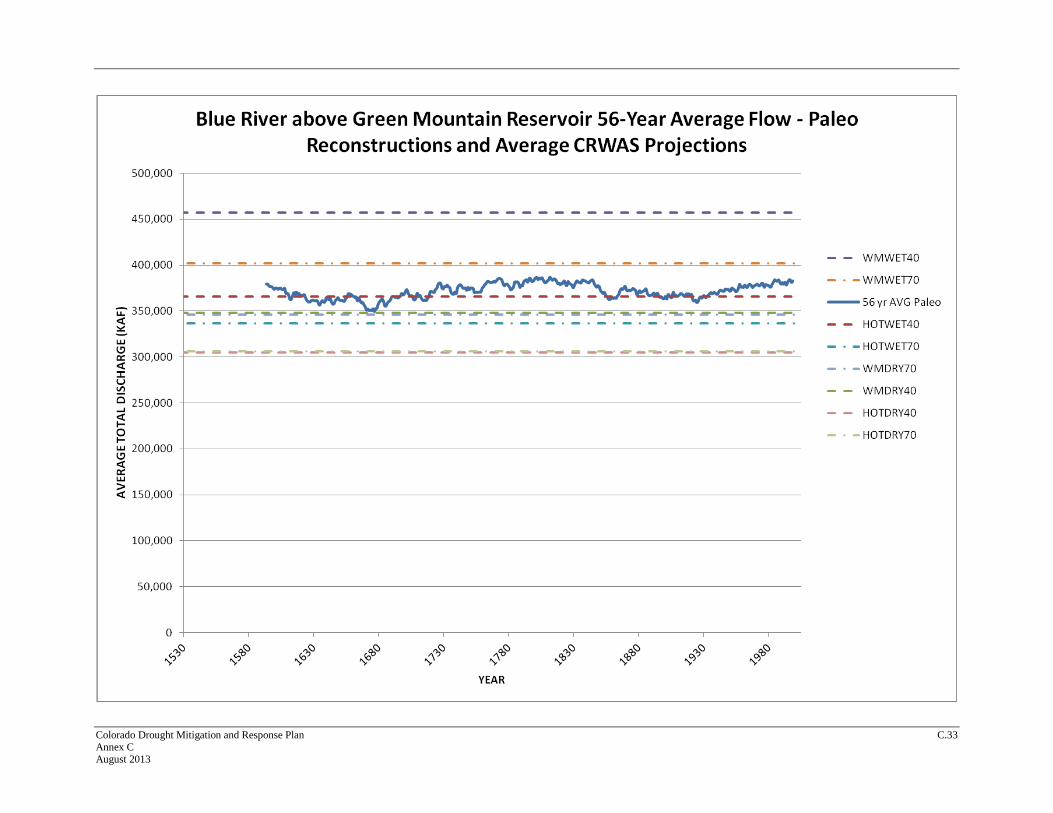
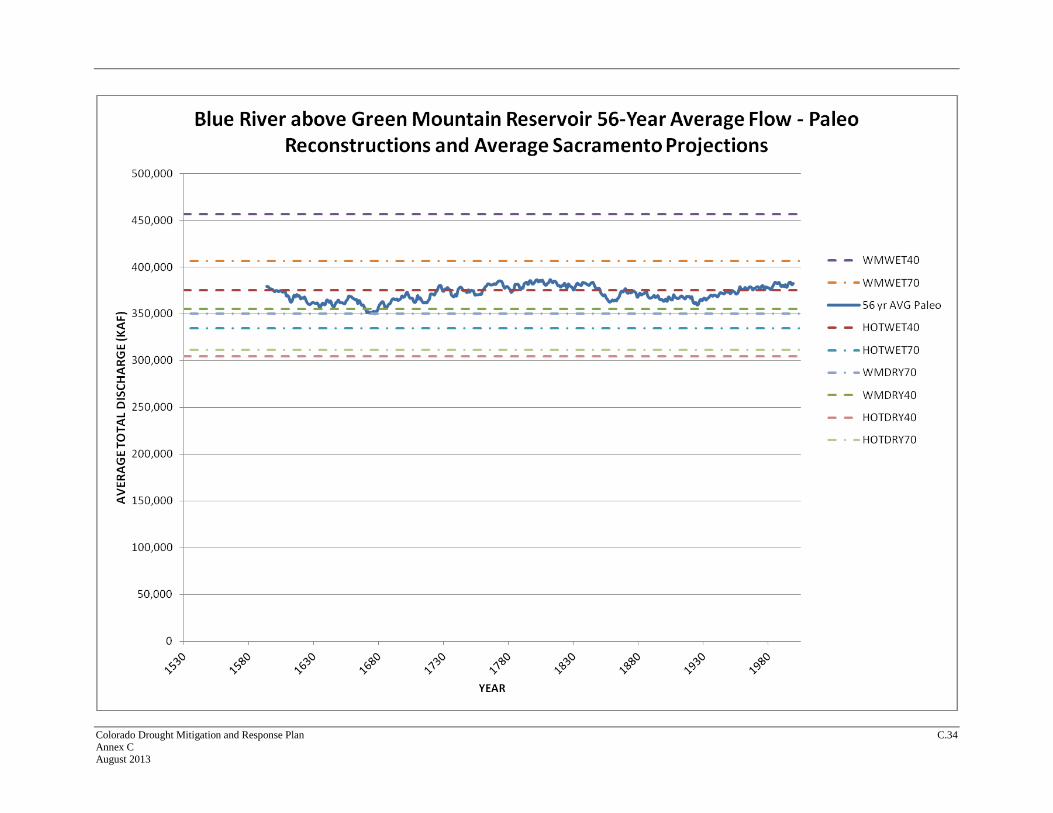
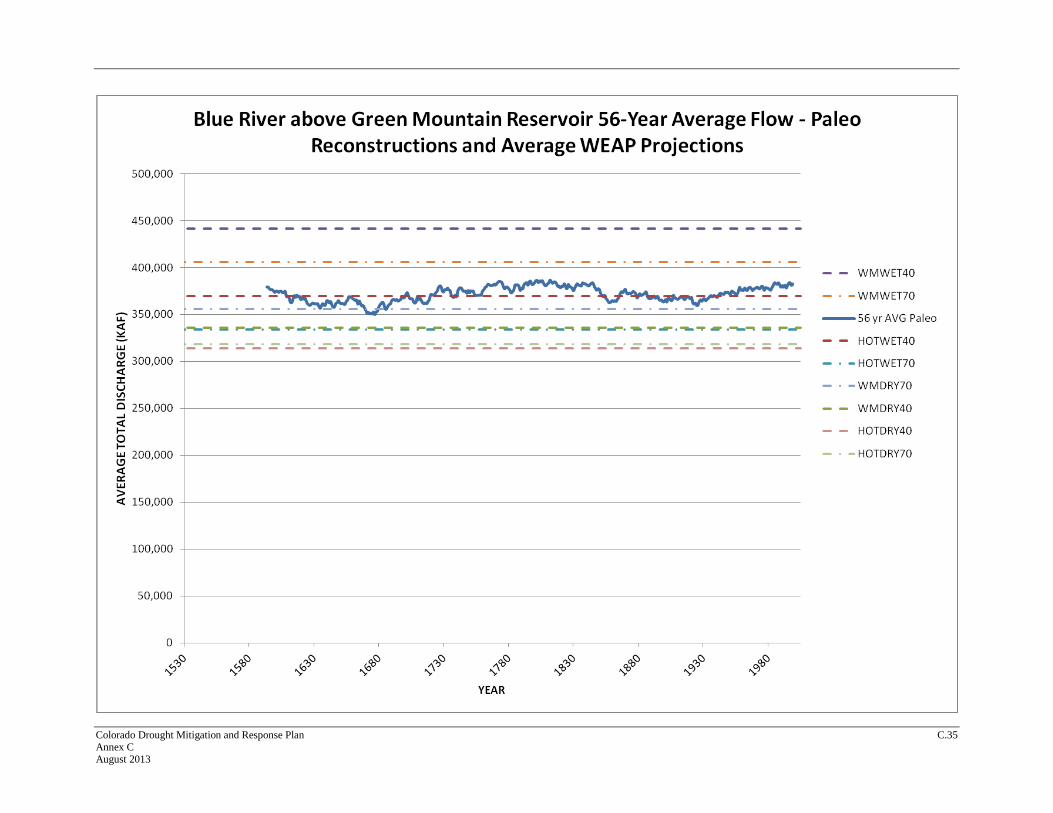
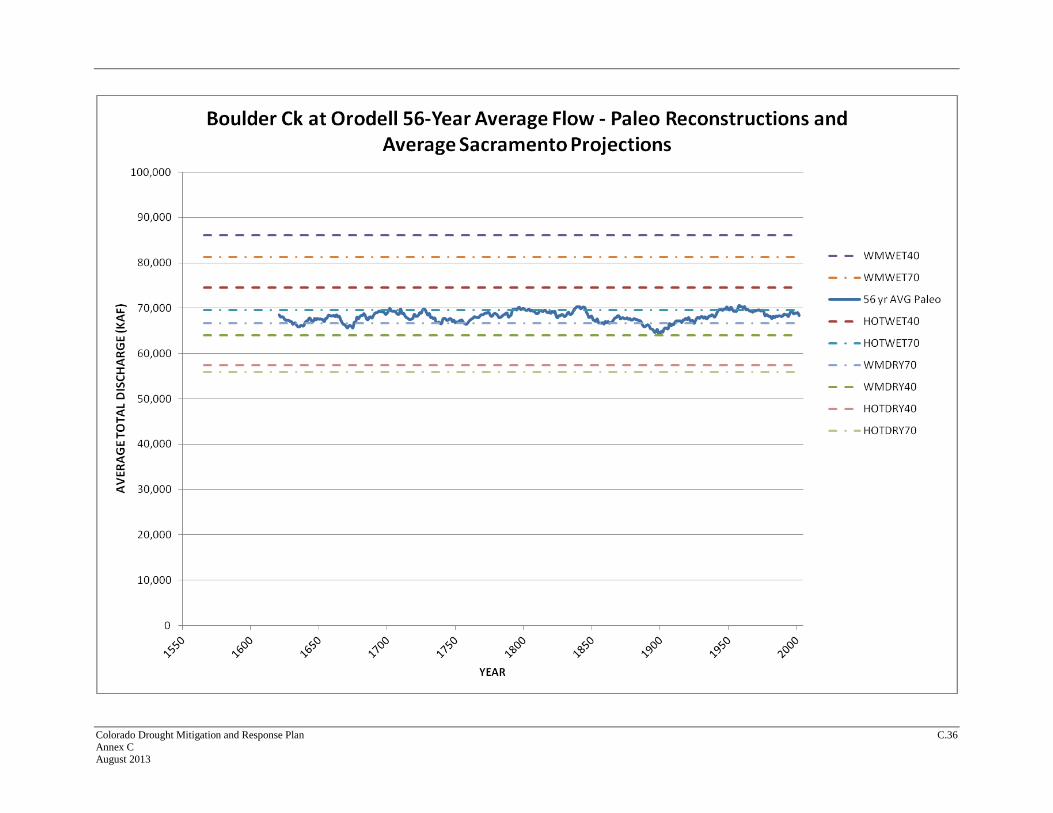
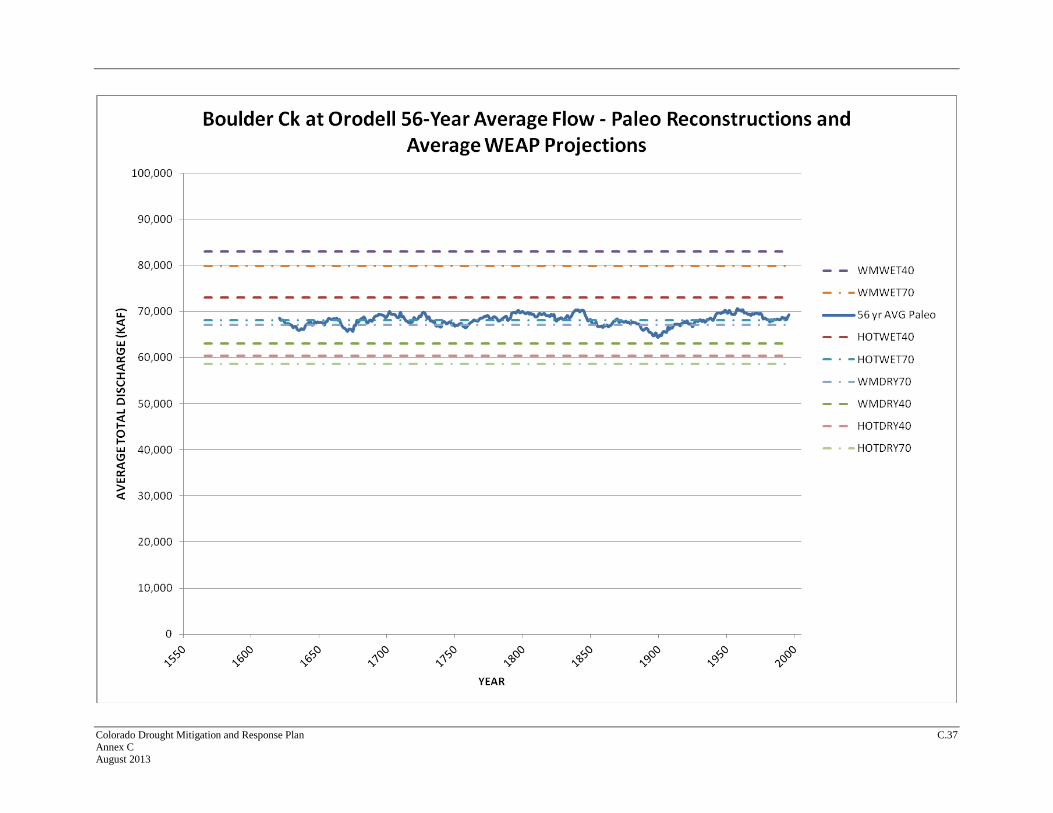
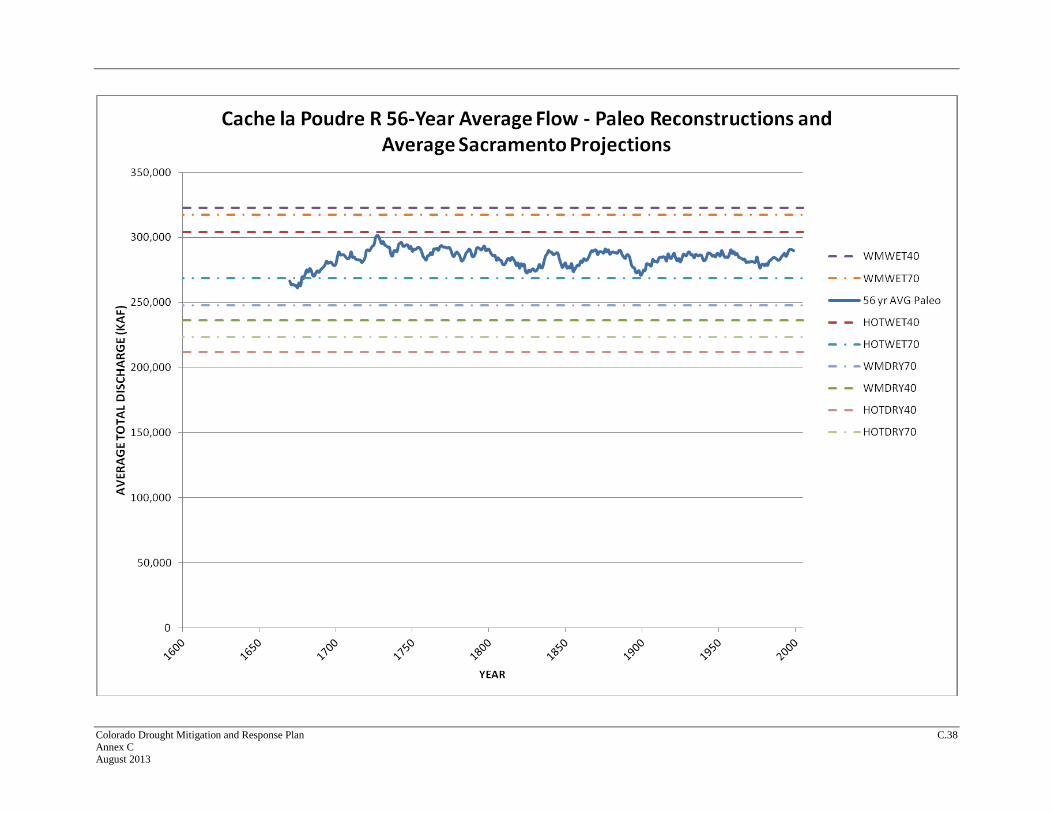
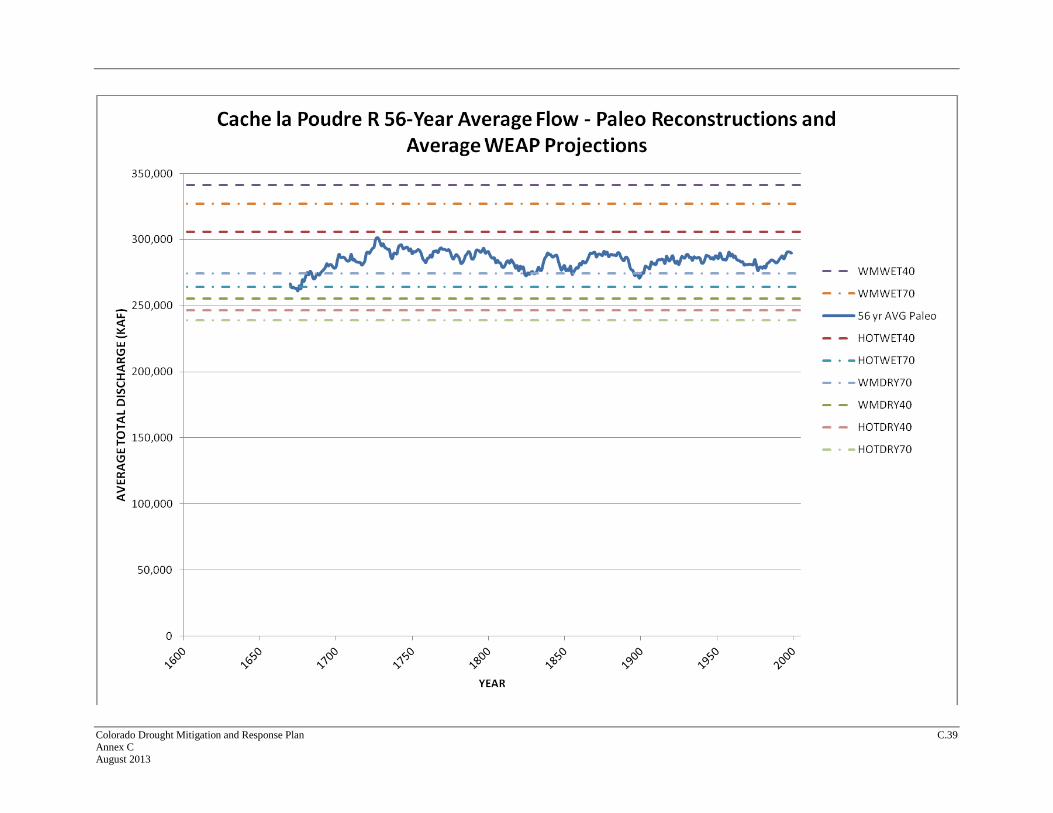
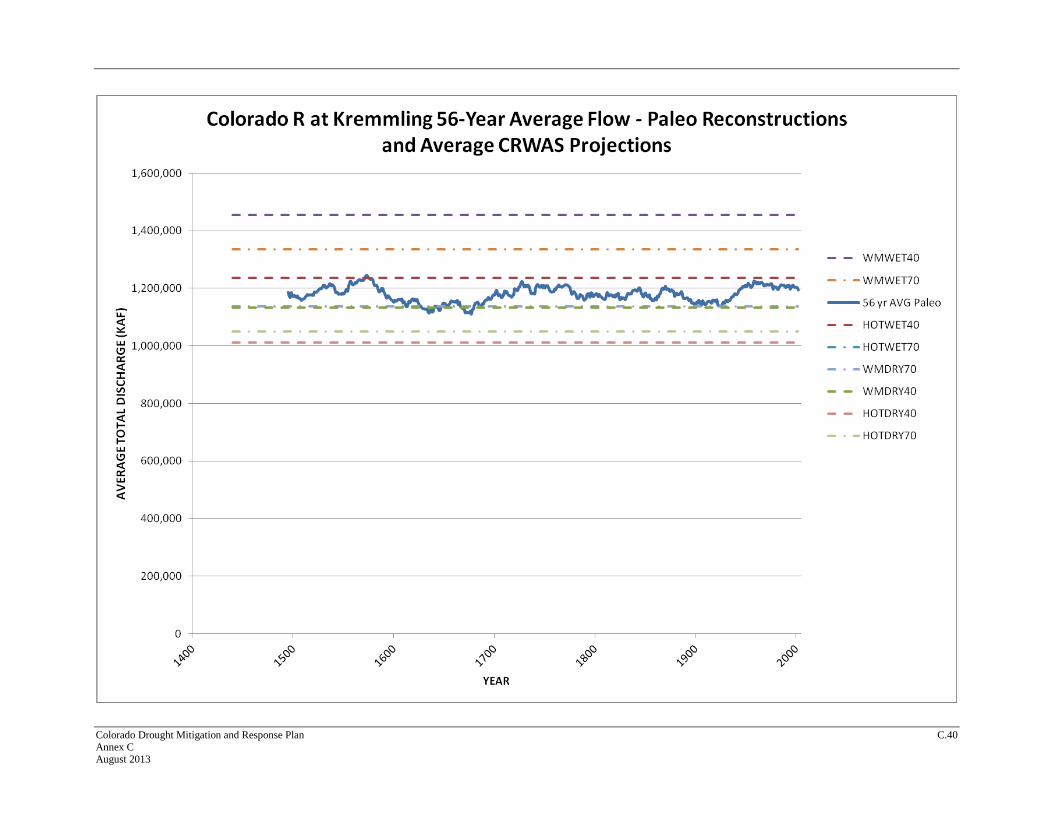
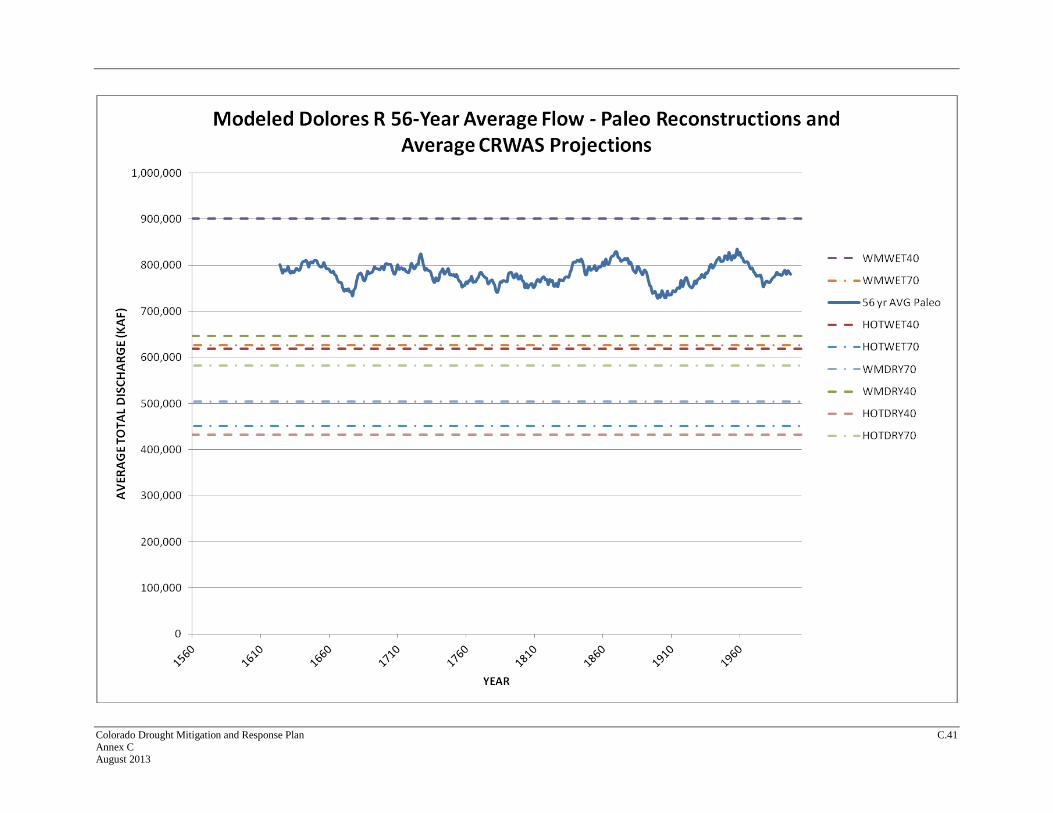
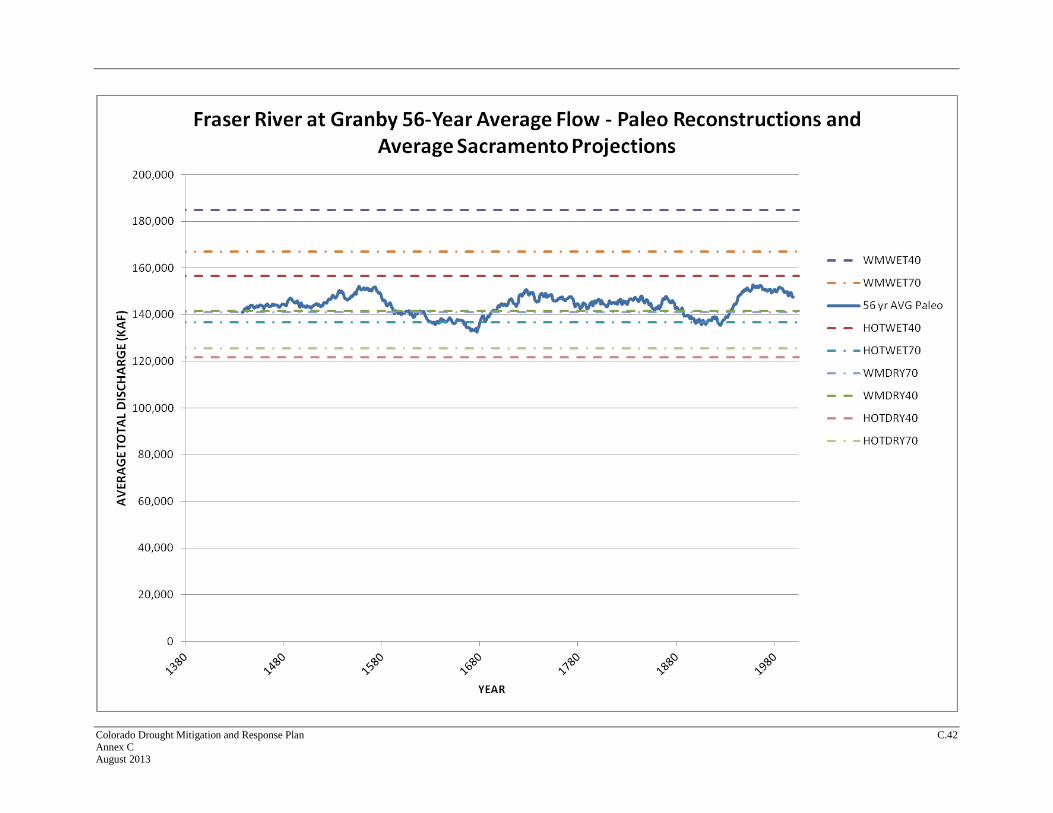
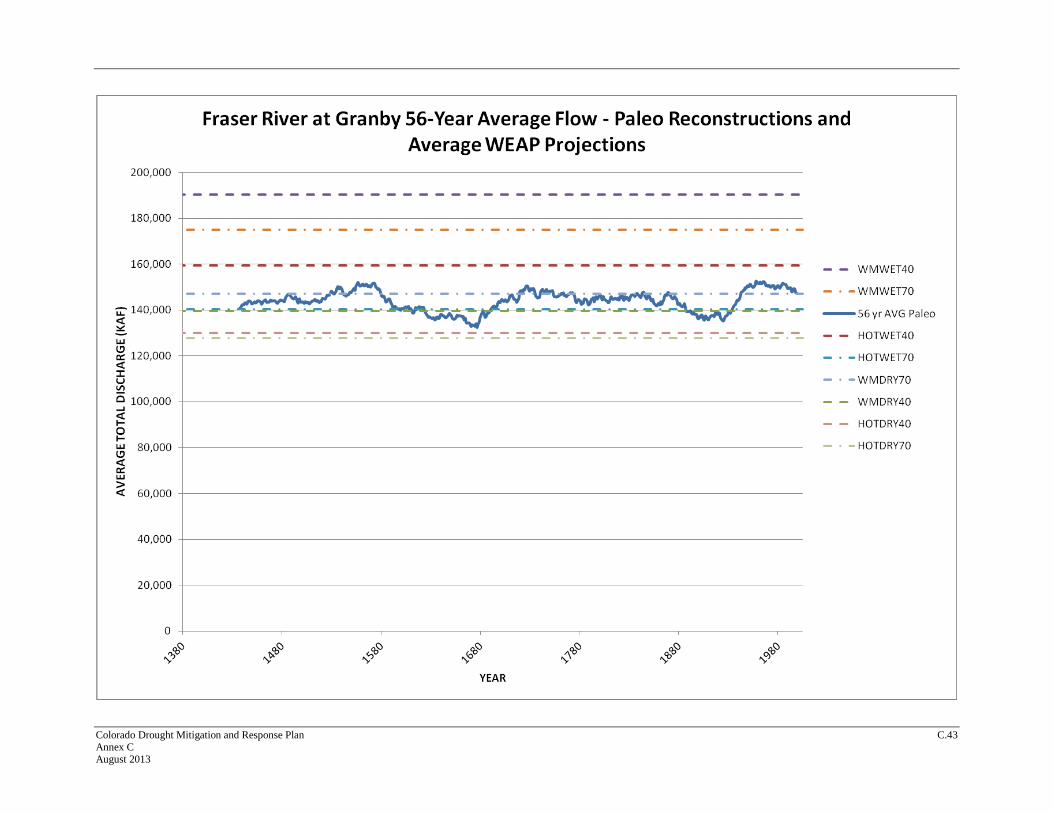
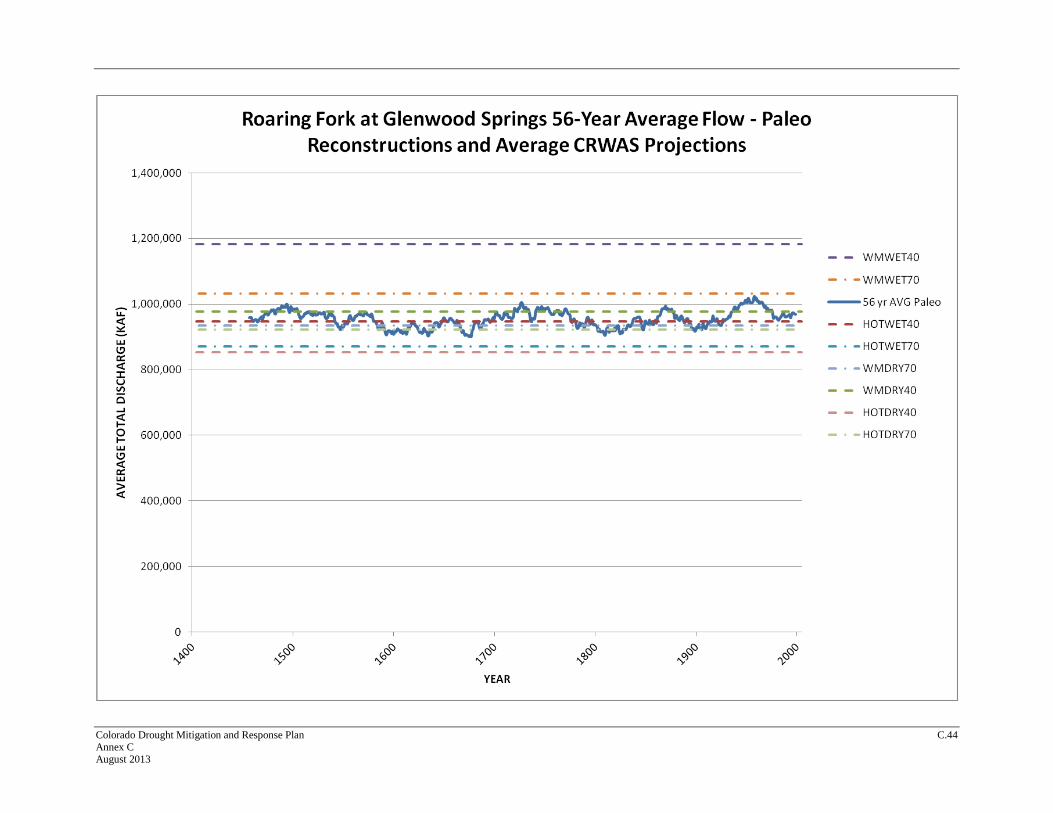
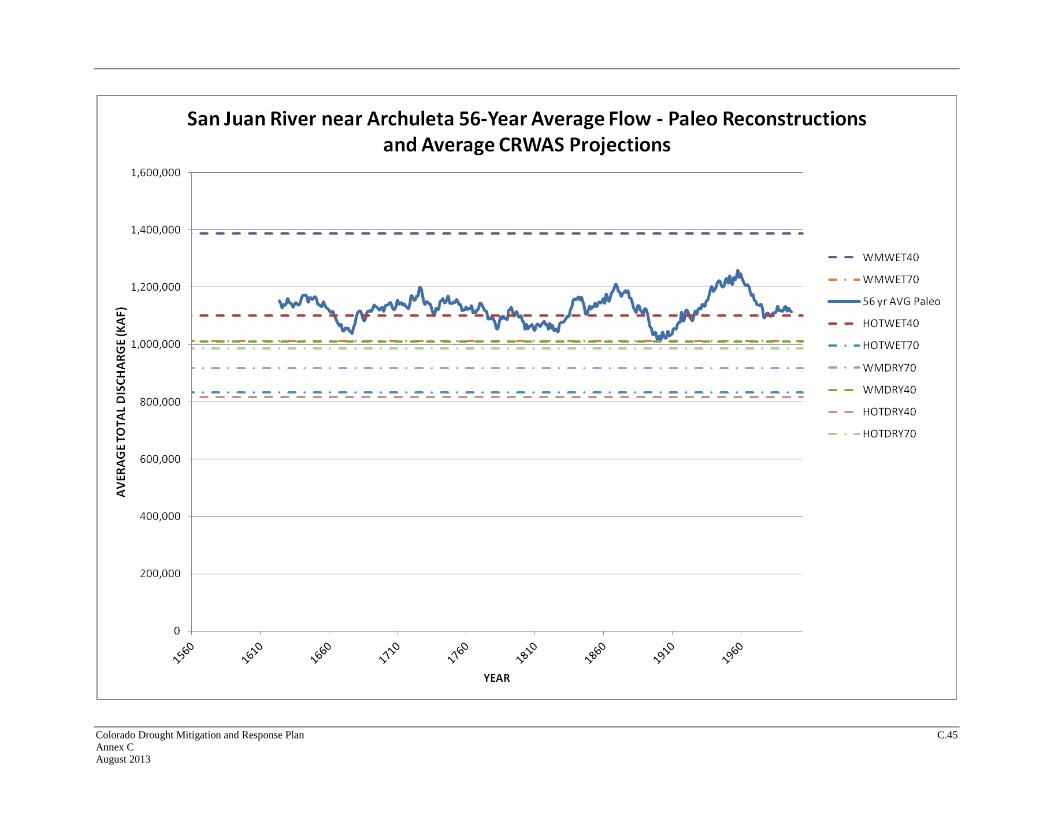
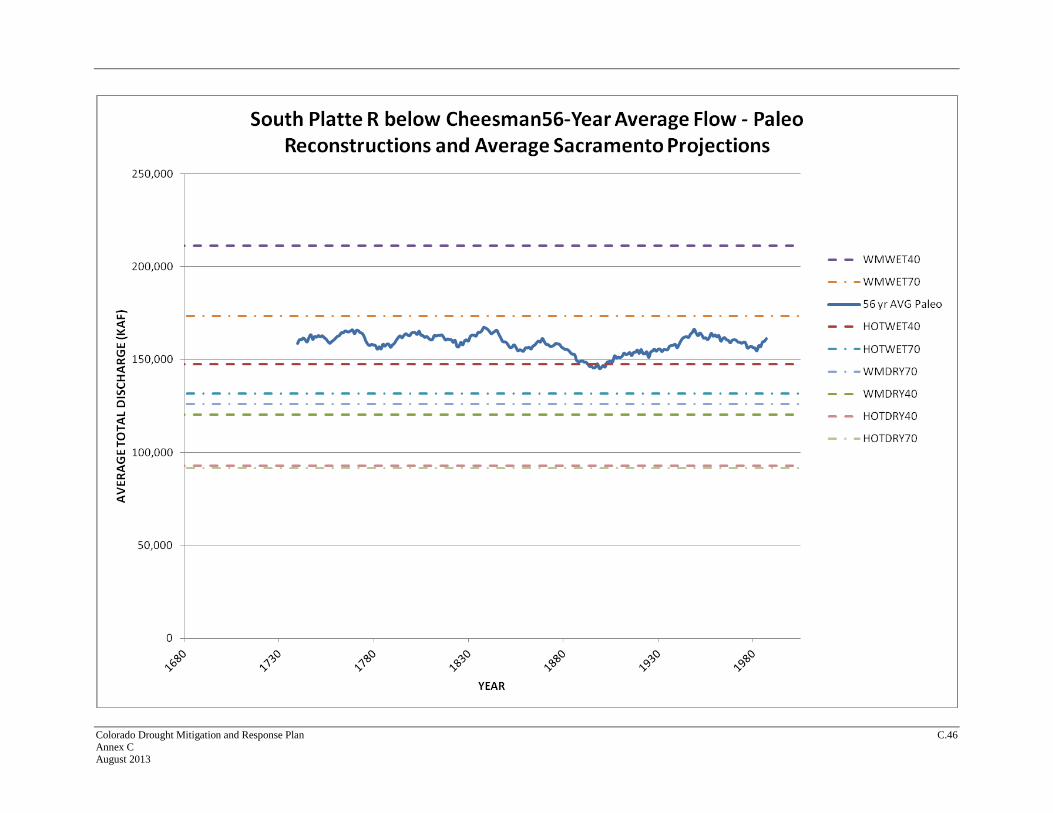
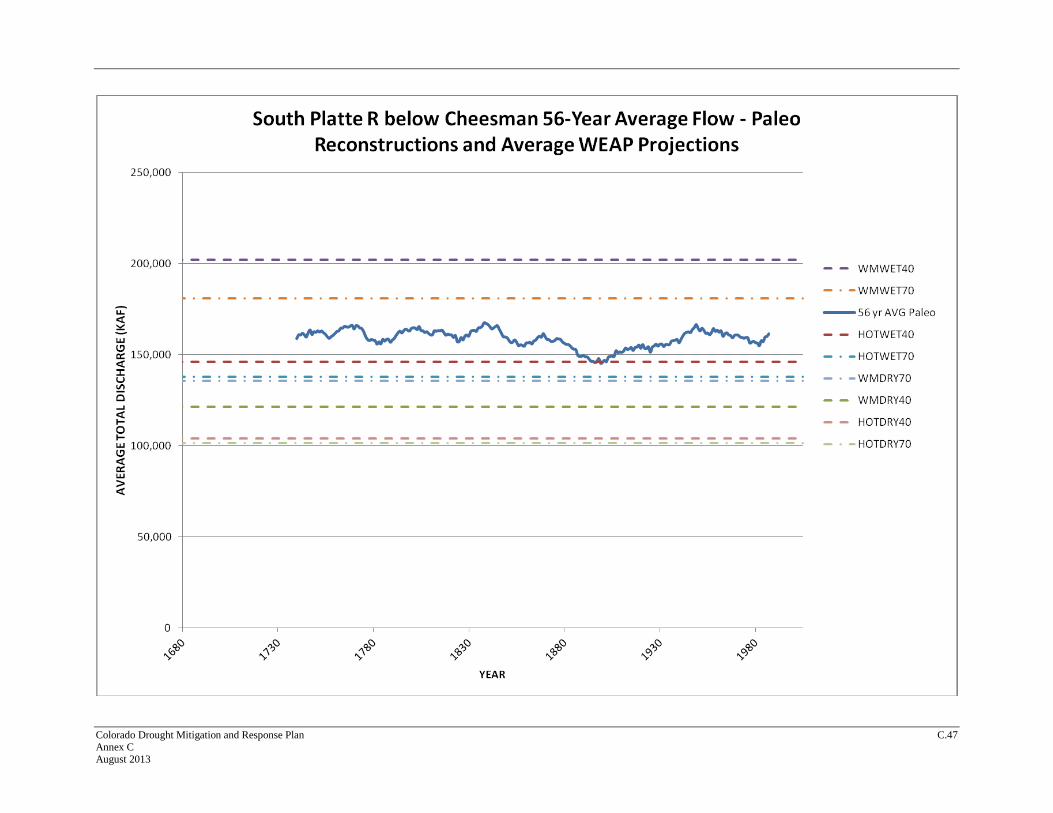
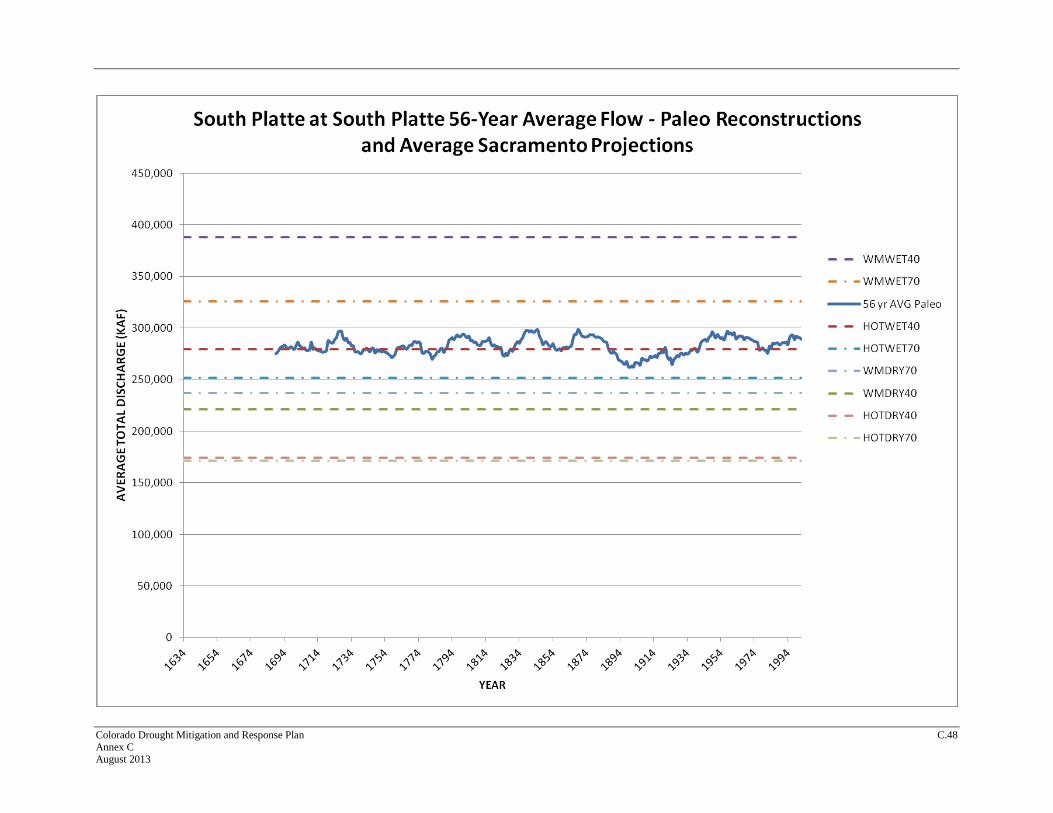
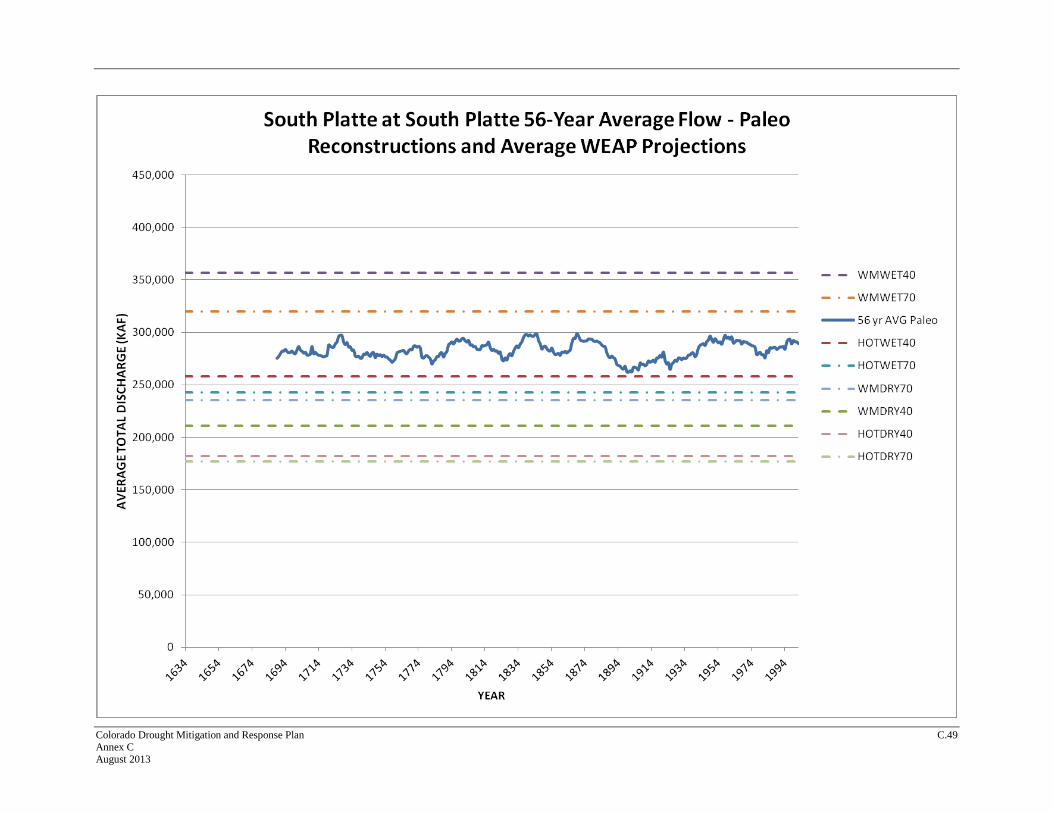
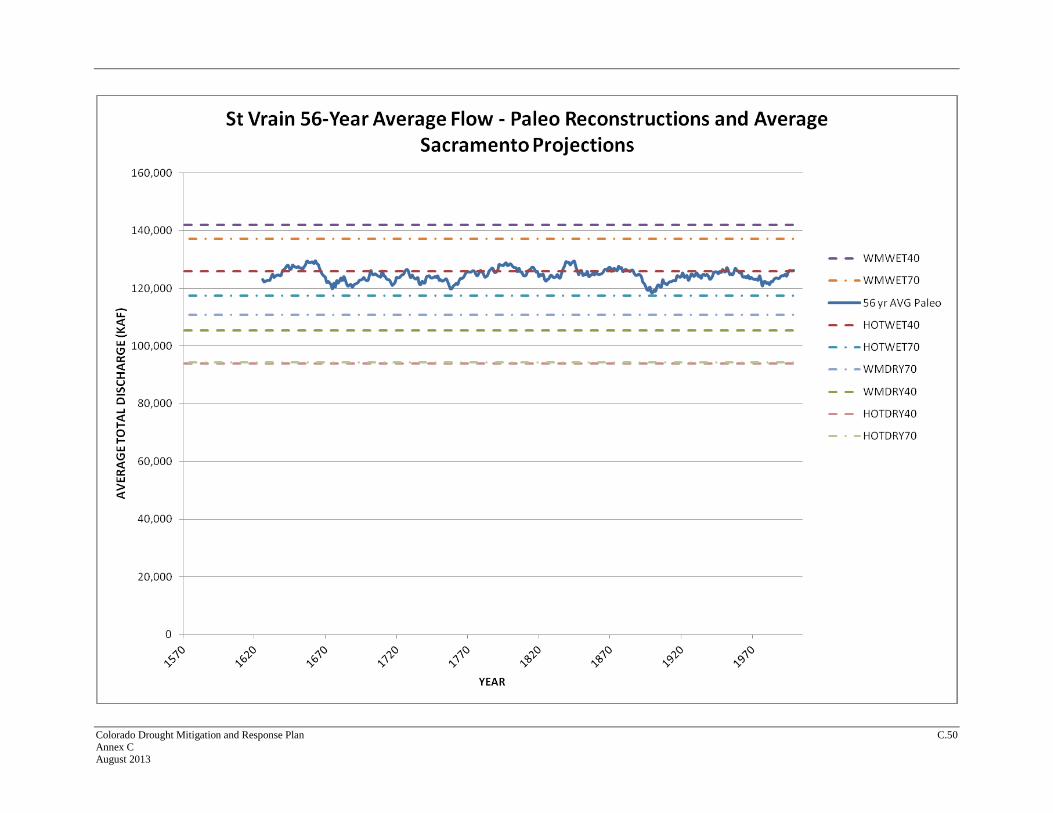
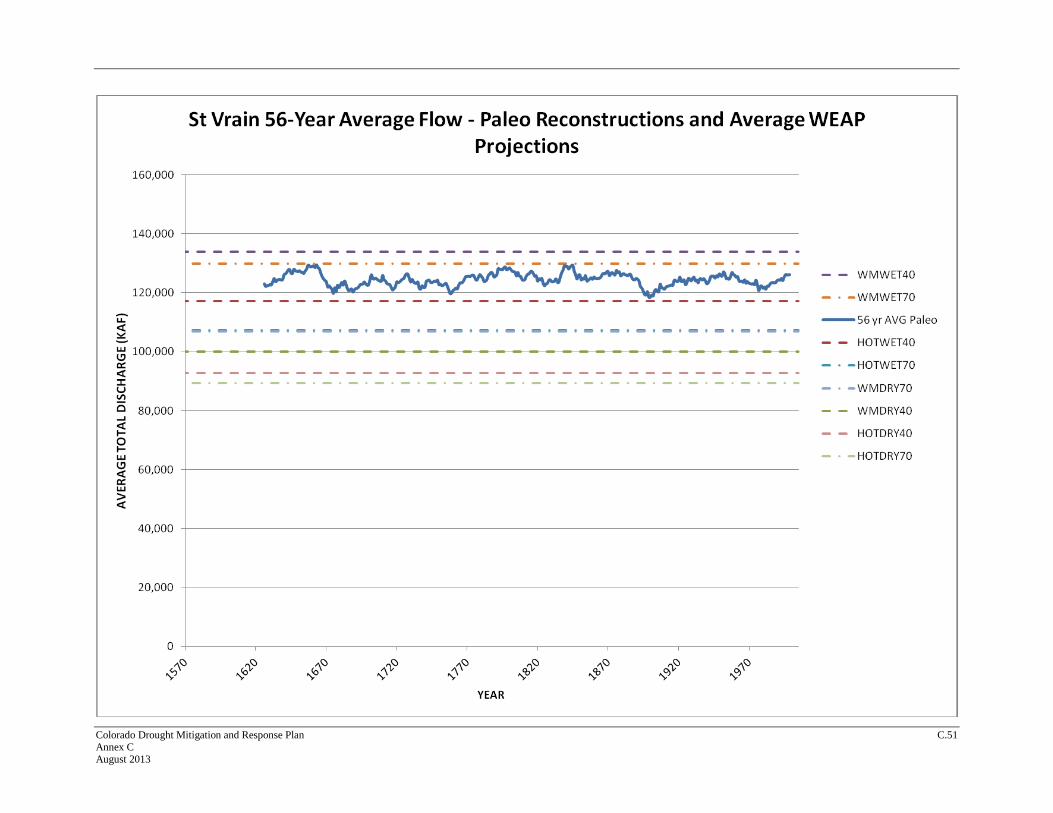
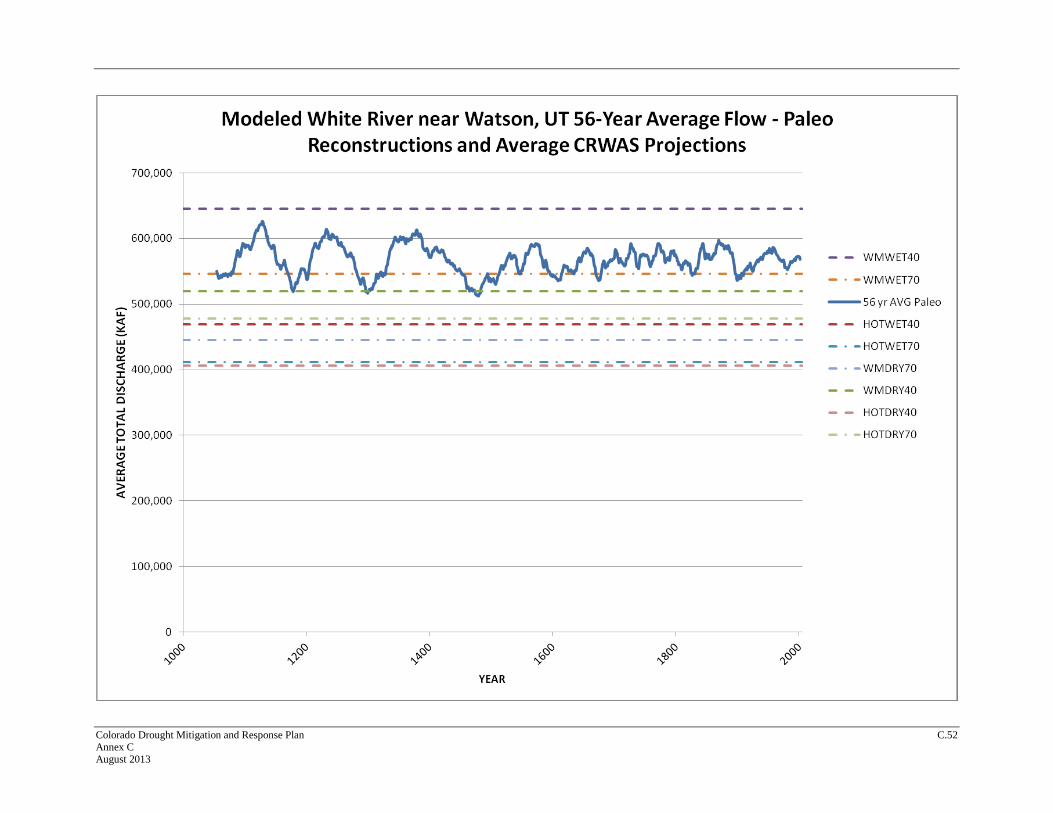
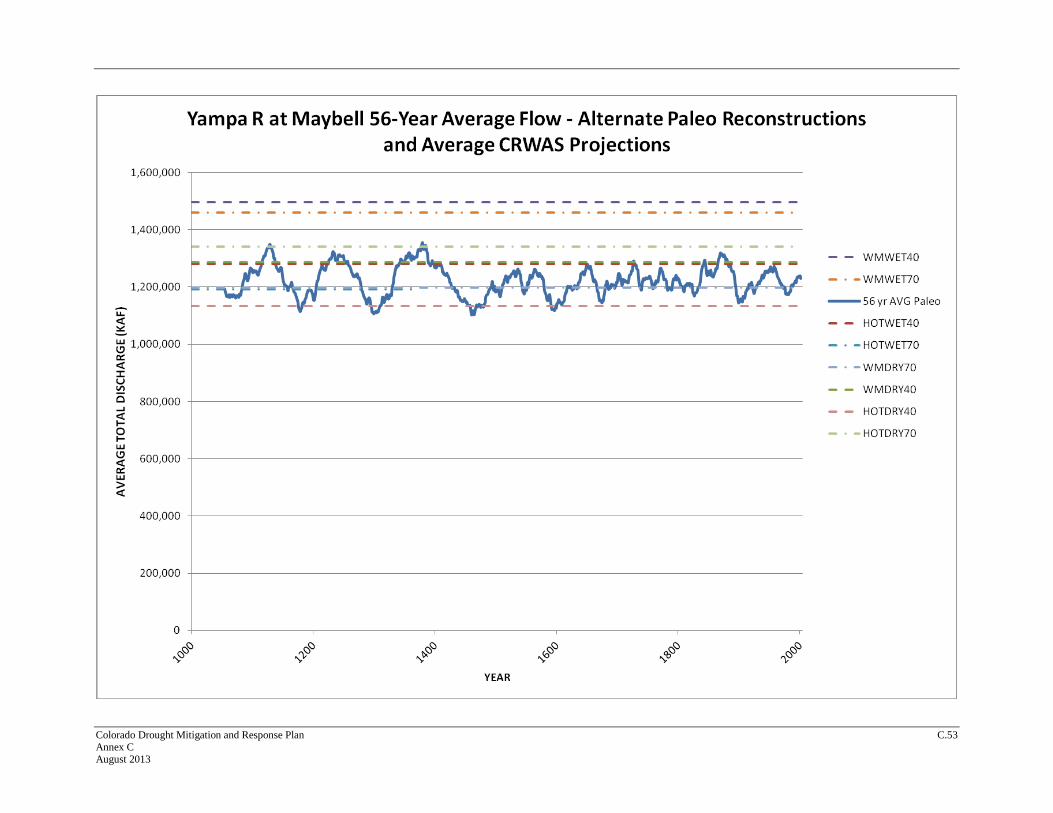
At these locations, graphical comparisons of prehistoric, historical and projected flows were
developed that provide context within which to consider the 56-year period experienced from
1950 through 2005. Figure 1.1 shows the comparison for the Yampa River near Maybell. The
56 year running average of the paleo data is the solid blue line. The end of the solid blue line
represents average conditions over the most recent 56 years. The dashed lines show the averages
for each climate-impacted flow scenario. The highest and lowest 56-year average flows in the
prehistoric data encompass most of the climate impacted flow averages, with the exceptions of
the warm, wet scenarios for both 2040 and 2070.
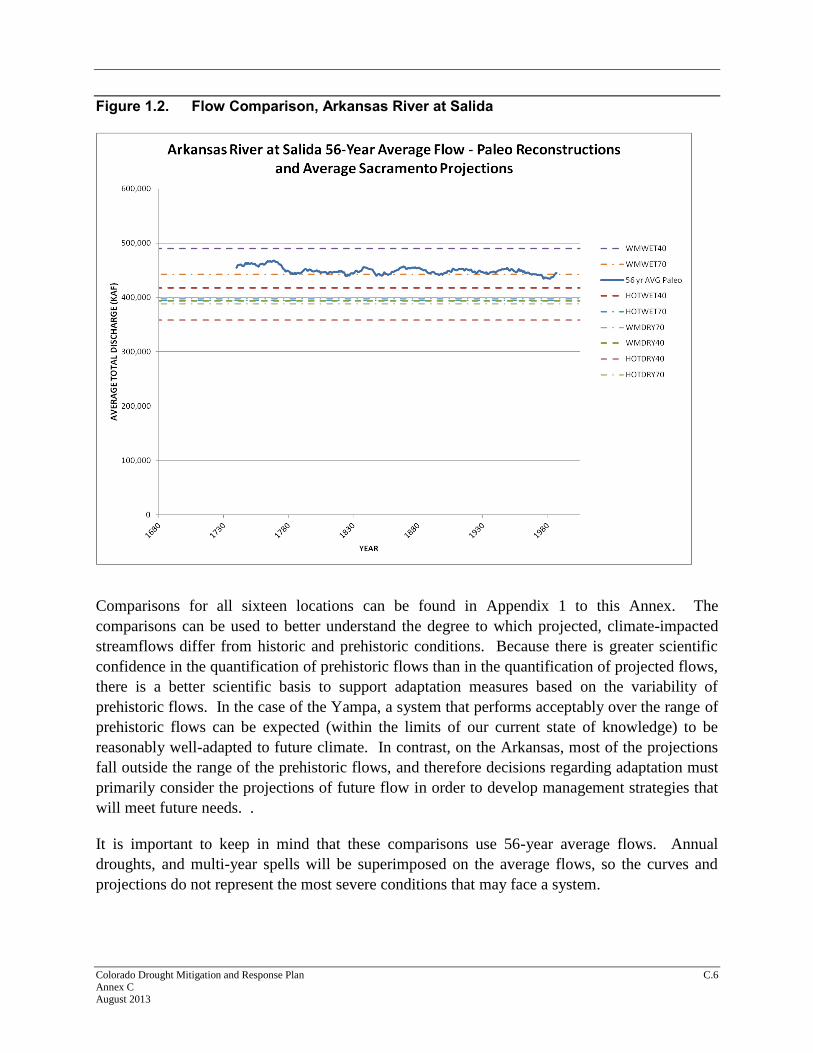
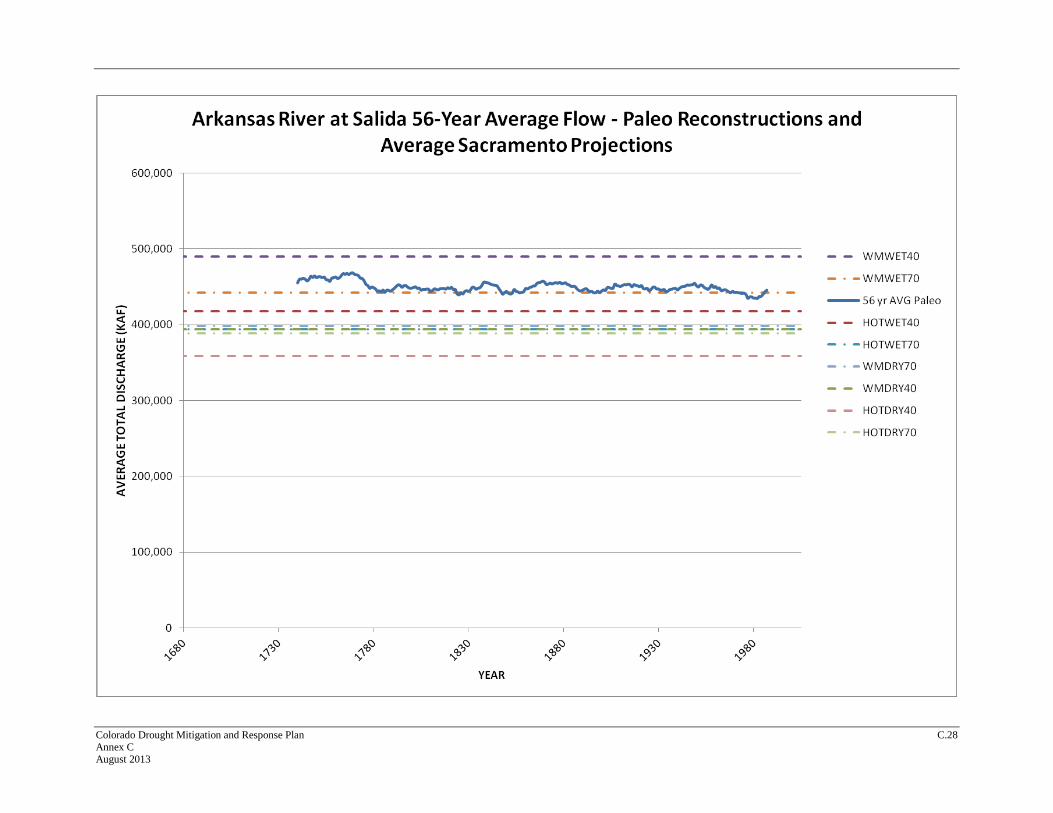
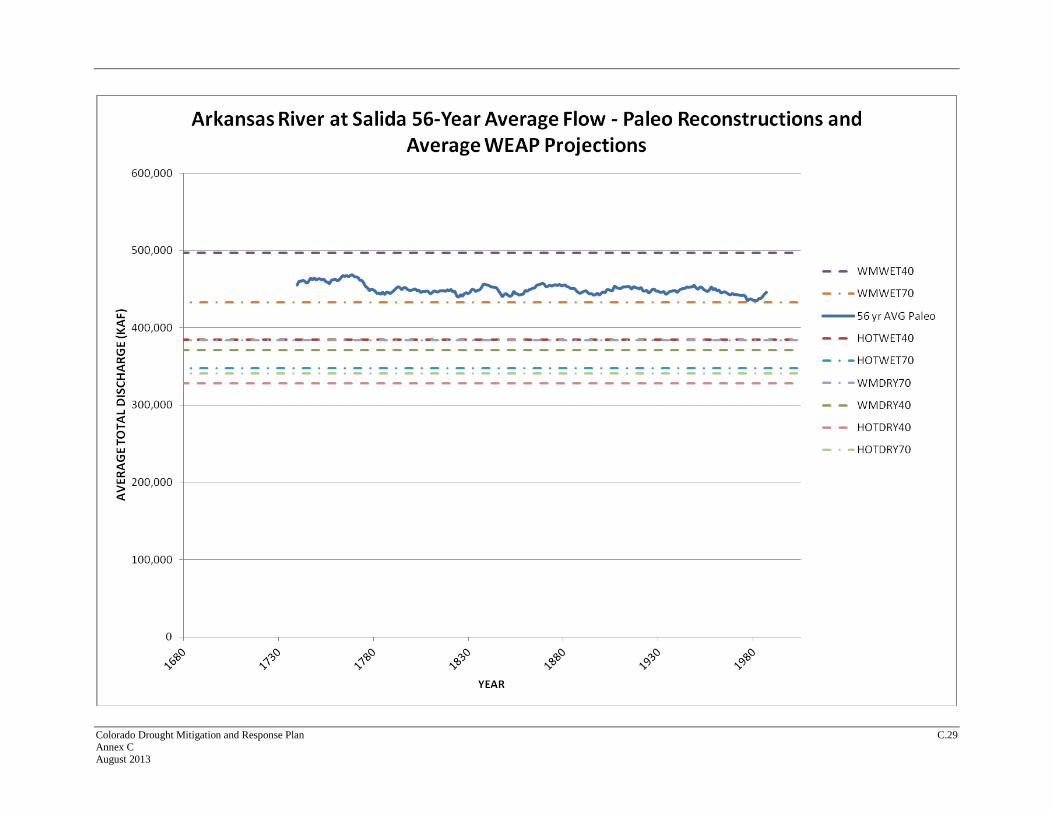
Figure 1.2 shows the comparison for the Arkansas River at Salida. In contrast to the Yampa, the
prehistoric flows show much less variability, and all but one of the projected scenarios fall
outside the maximum and minimum flows of the prehistoric reconstruction. Also in contrast to
the Yampa, six of the eight projected scenarios fall below the historical average flow (indicated
by the end of the blue trace). This difference is indicative of a trend that is generally apparent in
the CRWAS and Front Range Study results, where projections of future flows tend to be wetter
in the northernmost portions of the State, and tend to be drier in the more southerly portions of
the State.
Colorado Drought Mitigation and Response Plan C.5 Annex C August 2013
Figure 1.1. Flow Comparison, Yampa River near Maybell
0
200,000
400,000
600,000
800,000
1,000,000
1,200,000
1,400,000
1,600,000
AV
ERA
GE
TOTA
L D
ISC
HA
RG
E (K
AF)
YEAR
Yampa R at Maybell 56-Year Average Flow - Alternate Paleo Reconstructions and Average CRWAS Projections
WMWET40
WMWET70
56 yr AVG Paleo
HOTWET40
HOTWET70
WMDRY70
WMDRY40
HOTDRY40
HOTDRY70
Colorado Drought Mitigation and Response Plan C.6 Annex C August 2013
Figure 1.2. Flow Comparison, Arkansas River at Salida
Comparisons for all sixteen locations can be found in Appendix 1 to this Annex. The
comparisons can be used to better understand the degree to which projected, climate-impacted
streamflows differ from historic and prehistoric conditions. Because there is greater scientific
confidence in the quantification of prehistoric flows than in the quantification of projected flows,
there is a better scientific basis to support adaptation measures based on the variability of
prehistoric flows. In the case of the Yampa, a system that performs acceptably over the range of
prehistoric flows can be expected (within the limits of our current state of knowledge) to be
reasonably well-adapted to future climate. In contrast, on the Arkansas, most of the projections
fall outside the range of the prehistoric flows, and therefore decisions regarding adaptation must
primarily consider the projections of future flow in order to develop management strategies that
will meet future needs. .
It is important to keep in mind that these comparisons use 56-year average flows. Annual
droughts, and multi-year spells will be superimposed on the average flows, so the curves and
projections do not represent the most severe conditions that may face a system.
Colorado Drought Mitigation and Response Plan C.7 Annex C August 2013
3 Other Climate Change Findings in Colorado
3.1 Colorado River Water Availability Study
The Colorado River Water Availability Study (Water Availability Study) sponsored by the
Colorado Water Conservation Board, investigated water availability on the Colorado River under
a range of climate change scenarios. The Study Area for this work was the Colorado River Basin
within the State of Colorado.1 The methods are discussed in more detail in the following section.
The discussion below outlines the primary findings of this study based on climate projections for
2040.
Preliminary Colorado River Water Availability Study Findings
Compared to current conditions, CRWAS Phase I findings show that projected future climate
conditions may lead to the following changes to hydrologic conditions in the Colorado River
basin within western Colorado.
Temperature
At northern climate stations (e.g., Grand Lake, Yampa, and Hayden), temperature increase is
less than for the Study Area average.
Every climate projection shows an increase in average annual and monthly temperature
Study Area average annual increases range from 1.8°F to 5.2°F
Precipitation
Generally increases in the winter months and decreases in the summer months
Average winter increases are larger in the northern portion of the Study Area, and smaller in
the southwestern portion of the Study Area
Increase in temperatures causes a shift from snow to rain in the early and late winter months
Study Area winter average changes by 102% to 116% of historical
Study Area April through October average changes by 82% to 105% of historical
Crop Irrigation Requirement (based on acreage and crop types identified in a 1993
acreage inventory)
Increases for each of the climate projections throughout the Study Area
Increases are primarily due to higher temperature and lower irrigation-season precipitation,
which increase:
the number of days in the growing season for perennial crops, and
the crop demand for irrigation water
1 The CRWAS also evaluated the impact of climate change on streamflows at Lee’s Ferry on the Colorado River.
Colorado Drought Mitigation and Response Plan C.8 Annex C August 2013
Peak CIR continues to occur in the same month as it has historically
Study Area average annual CIR increases by 1.9 to 7.4 inches for individual climate
scenarios
Study Area average annual growing season increases by 8 to 32 days
Crop Irrigation Requirement for Study Basins
Every Study Basin shows an increase for all climate scenarios
The White River basin shows the largest percentage increase
The Yampa River basin shows the smallest percentage increase
Natural Flow
Historical Hydrology
The longest (historic) wet spells range from 4 to 16 years in length, with only 4% longer than
7 years
Historic dry spells range from 3 to 11 years in length with 95% being 5 or 6 years long
Moving from north to south, historic dry spells generally become shorter and historic west
spells generally become longer
Extended Historical Hydrology
The return interval of historic wet and dry spells vary widely from location to location
Return intervals are shorter for locations that have shorter historic spells and longer for
locations that have longer historic spells
At 90% of the sites, the return interval of the historic dry spell ranges from about 8 to about
200 years, and the return interval of the historic wet spell ranges from about 13 to about 100
years
In very general terms, locations with shorter historic spells should expect longer spells and
vice versa
Climate-Adjusted Hydrology
At over 80% of the sites, the majority of climate cases suggest a decrease in annual flow.
Annual flow is more likely to increase in parts of the Yampa River basin and in some higher
elevation watersheds
Annual flow is more likely to decrease in southwestern watersheds and at lower elevations
At 75% of locations, all climate cases showed a shift toward earlier runoff, and at all
locations, some climate cases showed a shift toward earlier runoff
Higher peak flows may be beneficial for riparian health; however, lower flows in late
summer and fall may impact other non-consumptive needs
At three locations, all climate cases showed increases in average annual flows. At the
remaining 224 locations, the climate cases contained the historic average annual flow
Colorado Drought Mitigation and Response Plan C.9 Annex C August 2013
Runoff shifts earlier by an average of 8 days
Modeled Streamflow
Flows are generally higher than historical in May and June and lower in July through March
Flows are generally lower than historical in three of the five climate projections, but
generally higher than historical in two projections
The historical annual low-flow values generally fall within the range of projected low-flow
values
Water Available to Meet Future Demands
Upstream locations on main rivers and smaller tributaries generally have less flow available
to meet future demands as a percent of modeled streamflow than gages farther downstream
that include more tributary inflow
Most locations show less water availability for three of the five climate projections.
However, for one of the projections, the locations selected to display CRWAS results show
more water available.
The climate projects generally indicate more water availability in April and May,
corresponding to the shift in the natural flow hydrographs
The historical annual minimum water availability values generally fall within the range of
projected minimum water availability values for 2040 throughout the Study Area
Modeled Reservoir Storage
Earlier peak runoff, reduced flows during the peak irrigation season, and increased crop
demands result in more use of reservoirs (more reservoir fluctuation)
Reservoirs are generally drawn down to lower levels, and generally fill to historical levels
Modeled Consumptive Use
Average annual consumptive use in the Yampa, White, Upper Colorado, and Gunnison
basins is greater for every climate projection. Average annual consumptive use in the San
Juan basin is less for every climate projection
Total consumptive use for the Study Area is greater than for historical climate conditions for
most climate projections
Although modeled consumptive use generally increases, not all crop demands are met in any
basin. Similar to historical conditions, there continue to be water shortages on tributaries and
in the late irrigation season for the projected conditions
Projected consumptive use increases in most months in every basin except the San Juan.
Projected consumptive use in the San Juan generally increases in spring months only
Phase I of the Water Availability Study considered five climate change scenarios, all treated as if
they were equally probable. Temperature and precipitation changes from Global Climate Models
Colorado Drought Mitigation and Response Plan C.10 Annex C August 2013
(GCMs) were translated to natural flows using the Variable Infiltration Capacity (VIC) model.
The historical hydrology used for comparison is the observed flow over the 56-year period from
1950-2005. Additionally, historical streamflow records were extended using previously
published tree ring records dating back more than 1,200 years. The 56 year historical hydrology
was re-sequenced into 100 equally likely 56 year traces based on the probabilities of
transitioning between wet and dry years that were derived from the paleohydrology record.
These traces are called the alternate historical hydrology traces in this report. The discussion in
the following section outlines the technical approach of the Water Availability Study in more
detail. The results of the Water Availability Study include information about how projected
future climate might affect drought duration, drought intensity and drought frequency.
The Water Availability Study analyzed drought frequency and intensity compared to the longest
drought observed throughout the 56-year period of record. Modeled natural flow results from
each of the five equally likely climate change scenarios and the historical hydrology were each
re-sequenced to produce a record 5,600 years long, equivalent to 100, equally likely, 56 year
hydrology traces Drought durations and intensities (the degree to which flows are reduced during
the drought) were calculated for each of the 100 traces. Drought conditions were defined as any
time flow drops below the historical mean flow.
All of the droughts identified for each of the six scenarios (five climate change scenarios and the
alternate historical hydrology) were used to calculate the return interval and the intensity of a dry
or wet spell that has the same length as the longest spell experienced during the historical period.
This approach answers the question: What is the likelihood that a spell of a particular length will
begin next year (now, or in 2040 or 2070)?
Colorado River Water Availability Study Technical Approach Summary
Historical Hydrology includes hydrology observed for period 1950-2005.
Paleohydrology is based on an extended record dating to AD 762 (more than 1,200 years
ago)
Provides estimated streamflow duration/frequency/intensity for years prior to gaged data.
Estimated using statistical models applied to tree ring data.
Paleohydrology flow magnitudes are derived from the historical flow record (1950-
2006).
Flow sequences are derived from paleohydrology flow record to provide more robust
variety of year to year flow sequences than historical record.
Re-sequencing – Future sequences of wet and dry years cannot be predicted; therefore, a
5600-year hydrologic trace was developed.
This is statistically equivalent to the 10056-year traces used for modeling in
CRWAS.
Each 56-year period in the 5600-year trace is equally probable.
Climate-Adjusted Hydrology is based on five climate projections selected in consultation
with the State’s Climate Change Technical Advisory Group.
Colorado Drought Mitigation and Response Plan C.11 Annex C August 2013
Five climate projections were chosen for each of the 2040 and 2070 planning horizons.
Each of the selected climate projections is treated as being equally probable; but differs
from the others.
Projections are “downscaled” to the Colorado River basin and temperature and
precipitation changes were translated into effects on hydrology using the VIC hydrologic
model. Flow sequences (dry/wet spells) were derived from those used in the
paleohydrology flow record because it has been shown in the literature that GCM’s alone
do not simulate flow sequences reliably.
Selected results from CRWAS are displayed in Tables 1.3 through 1.6 and Figures 1.3 through
1.8. Results for 42 sub-basins and selected weather stations and reservoirs may be found in
Appendix C of the CRWAS final report (CWCB 2012a)
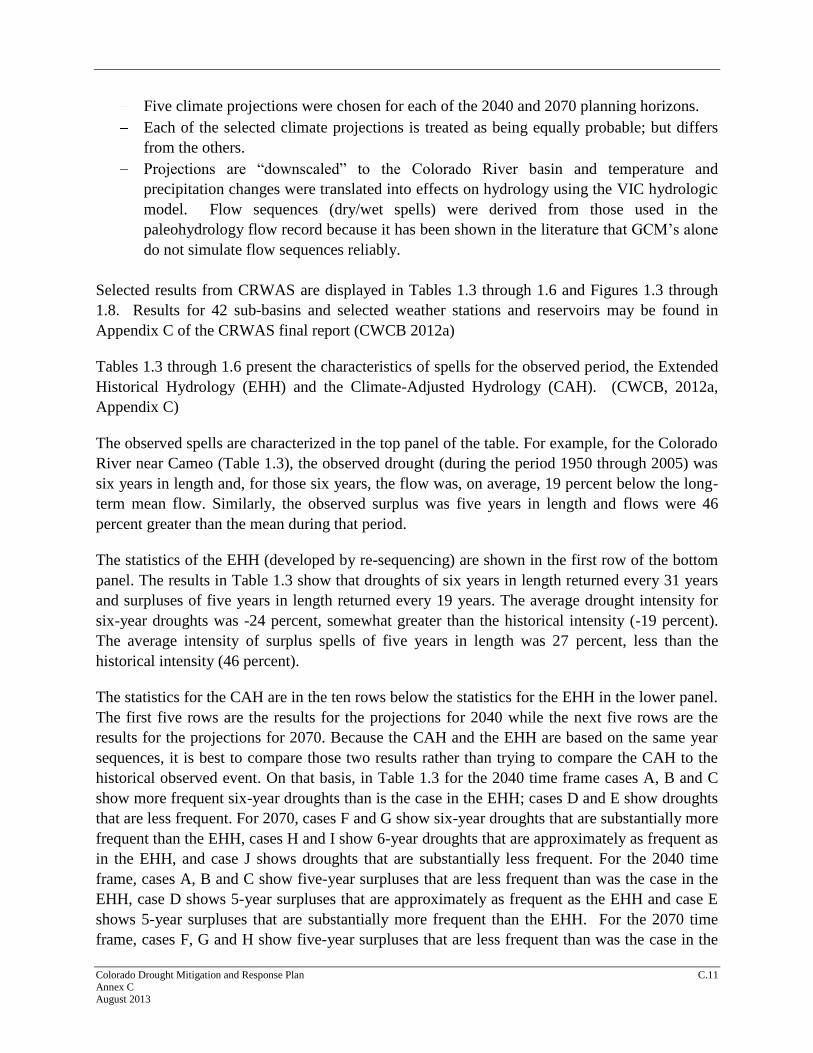
Tables 1.3 through 1.6 present the characteristics of spells for the observed period, the Extended
Historical Hydrology (EHH) and the Climate-Adjusted Hydrology (CAH). (CWCB, 2012a,
Appendix C)
The observed spells are characterized in the top panel of the table. For example, for the Colorado
River near Cameo (Table 1.3), the observed drought (during the period 1950 through 2005) was
six years in length and, for those six years, the flow was, on average, 19 percent below the long-
term mean flow. Similarly, the observed surplus was five years in length and flows were 46
percent greater than the mean during that period.
The statistics of the EHH (developed by re-sequencing) are shown in the first row of the bottom
panel. The results in Table 1.3 show that droughts of six years in length returned every 31 years
and surpluses of five years in length returned every 19 years. The average drought intensity for
six-year droughts was -24 percent, somewhat greater than the historical intensity (-19 percent).
The average intensity of surplus spells of five years in length was 27 percent, less than the
historical intensity (46 percent).
The statistics for the CAH are in the ten rows below the statistics for the EHH in the lower panel.
The first five rows are the results for the projections for 2040 while the next five rows are the
results for the projections for 2070. Because the CAH and the EHH are based on the same year
sequences, it is best to compare those two results rather than trying to compare the CAH to the
historical observed event. On that basis, in Table 1.3 for the 2040 time frame cases A, B and C
show more frequent six-year droughts than is the case in the EHH; cases D and E show droughts
that are less frequent. For 2070, cases F and G show six-year droughts that are substantially more
frequent than the EHH, cases H and I show 6-year droughts that are approximately as frequent as
in the EHH, and case J shows droughts that are substantially less frequent. For the 2040 time
frame, cases A, B and C show five-year surpluses that are less frequent than was the case in the
EHH, case D shows 5-year surpluses that are approximately as frequent as the EHH and case E
shows 5-year surpluses that are substantially more frequent than the EHH. For the 2070 time
frame, cases F, G and H show five-year surpluses that are less frequent than was the case in the
Colorado Drought Mitigation and Response Plan C.12 Annex C August 2013
EHH, case I shows 5-year surpluses that are approximately the same frequency as in the EHH,
and case J shows more frequent surpluses than in the EHH. Deficit intensities vary from case to
case, but not by a large amount except for cases E and J; surplus intensities vary over a wider
range.
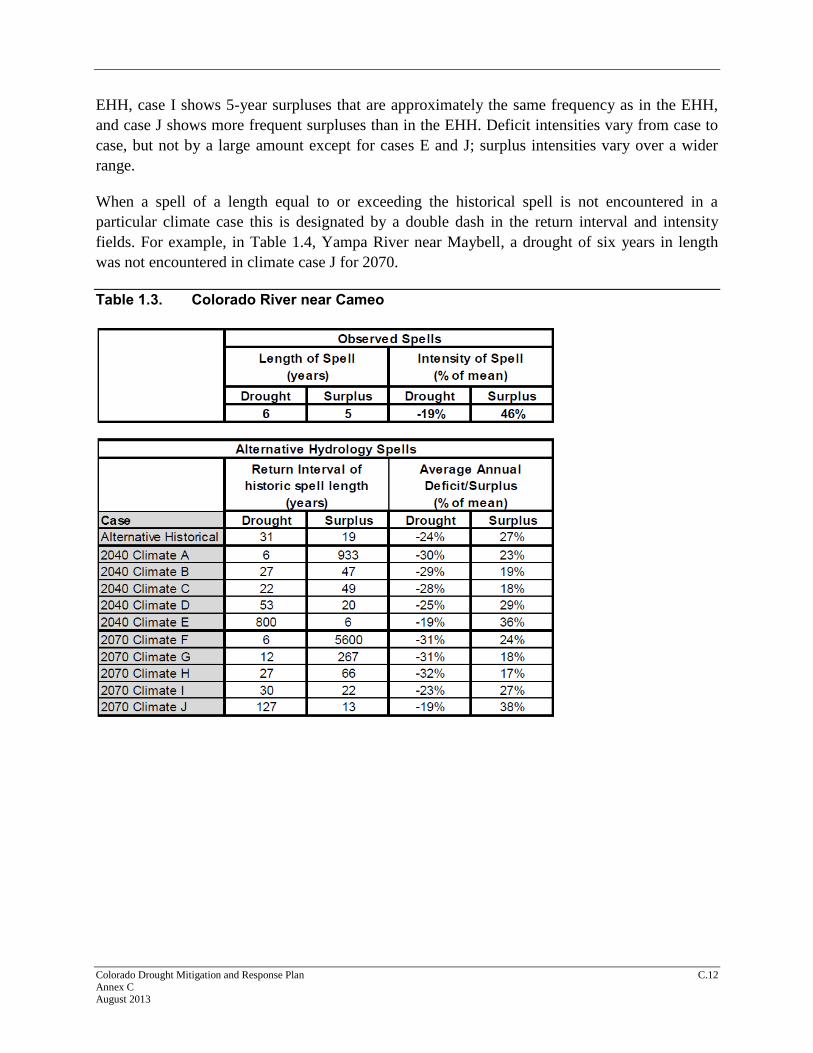
When a spell of a length equal to or exceeding the historical spell is not encountered in a
particular climate case this is designated by a double dash in the return interval and intensity
fields. For example, in Table 1.4, Yampa River near Maybell, a drought of six years in length
was not encountered in climate case J for 2070.
Table 1.3. Colorado River near Cameo
Colorado Drought Mitigation and Response Plan C.13 Annex C August 2013
Table 1.4. Yampa River near Maybell
Colorado Drought Mitigation and Response Plan C.14 Annex C August 2013
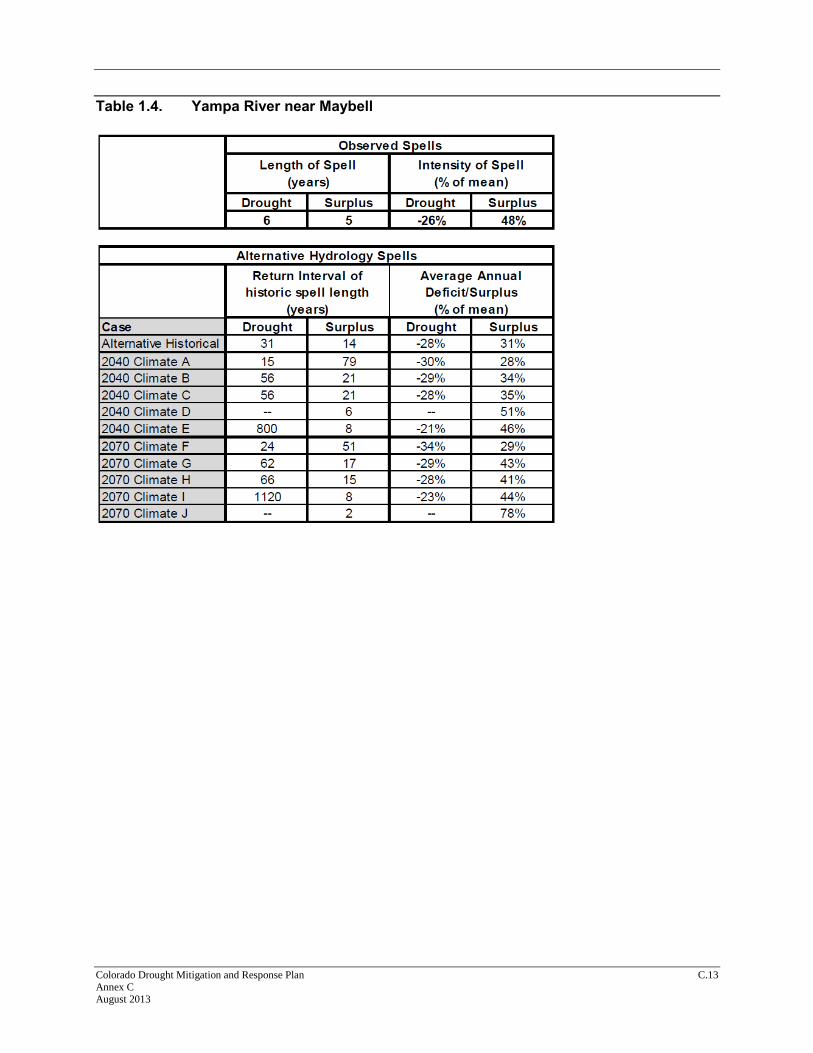
Table 1.5. Gunnison River near Grand Junction
Colorado Drought Mitigation and Response Plan C.15 Annex C August 2013
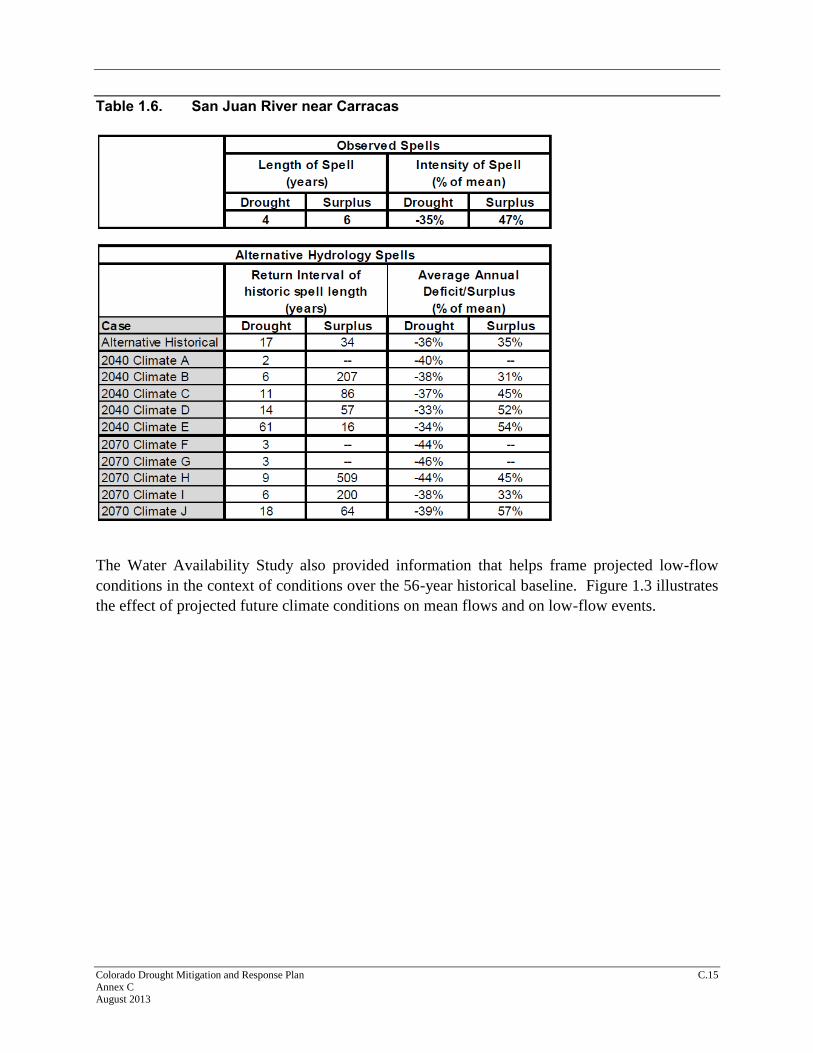
Table 1.6. San Juan River near Carracas
The Water Availability Study also provided information that helps frame projected low-flow
conditions in the context of conditions over the 56-year historical baseline. Figure 1.3 illustrates
the effect of projected future climate conditions on mean flows and on low-flow events.
Colorado Drought Mitigation and Response Plan C.16 Annex C August 2013
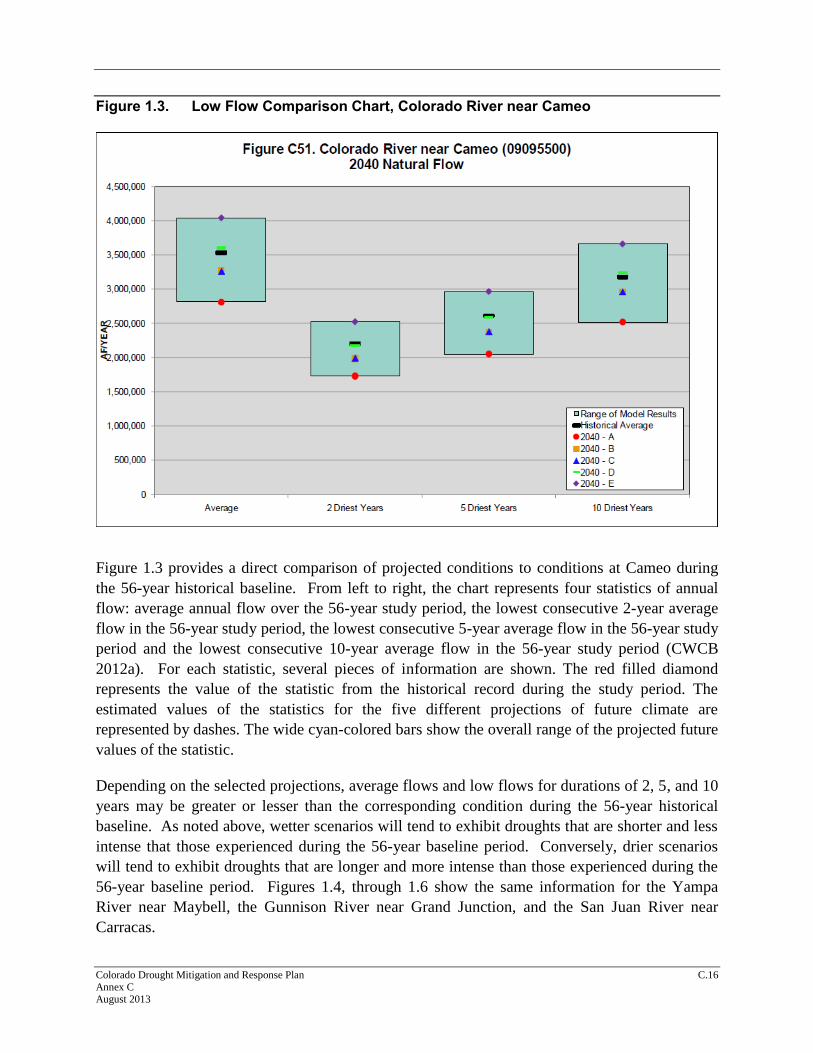
Figure 1.3. Low Flow Comparison Chart, Colorado River near Cameo
Figure 1.3 provides a direct comparison of projected conditions to conditions at Cameo during
the 56-year historical baseline. From left to right, the chart represents four statistics of annual
flow: average annual flow over the 56-year study period, the lowest consecutive 2-year average
flow in the 56-year study period, the lowest consecutive 5-year average flow in the 56-year study
period and the lowest consecutive 10-year average flow in the 56-year study period (CWCB
2012a). For each statistic, several pieces of information are shown. The red filled diamond
represents the value of the statistic from the historical record during the study period. The
estimated values of the statistics for the five different projections of future climate are
represented by dashes. The wide cyan-colored bars show the overall range of the projected future
values of the statistic.
Depending on the selected projections, average flows and low flows for durations of 2, 5, and 10
years may be greater or lesser than the corresponding condition during the 56-year historical
baseline. As noted above, wetter scenarios will tend to exhibit droughts that are shorter and less
intense that those experienced during the 56-year baseline period. Conversely, drier scenarios
will tend to exhibit droughts that are longer and more intense than those experienced during the
56-year baseline period. Figures 1.4, through 1.6 show the same information for the Yampa
River near Maybell, the Gunnison River near Grand Junction, and the San Juan River near
Carracas.
Colorado Drought Mitigation and Response Plan C.17 Annex C August 2013
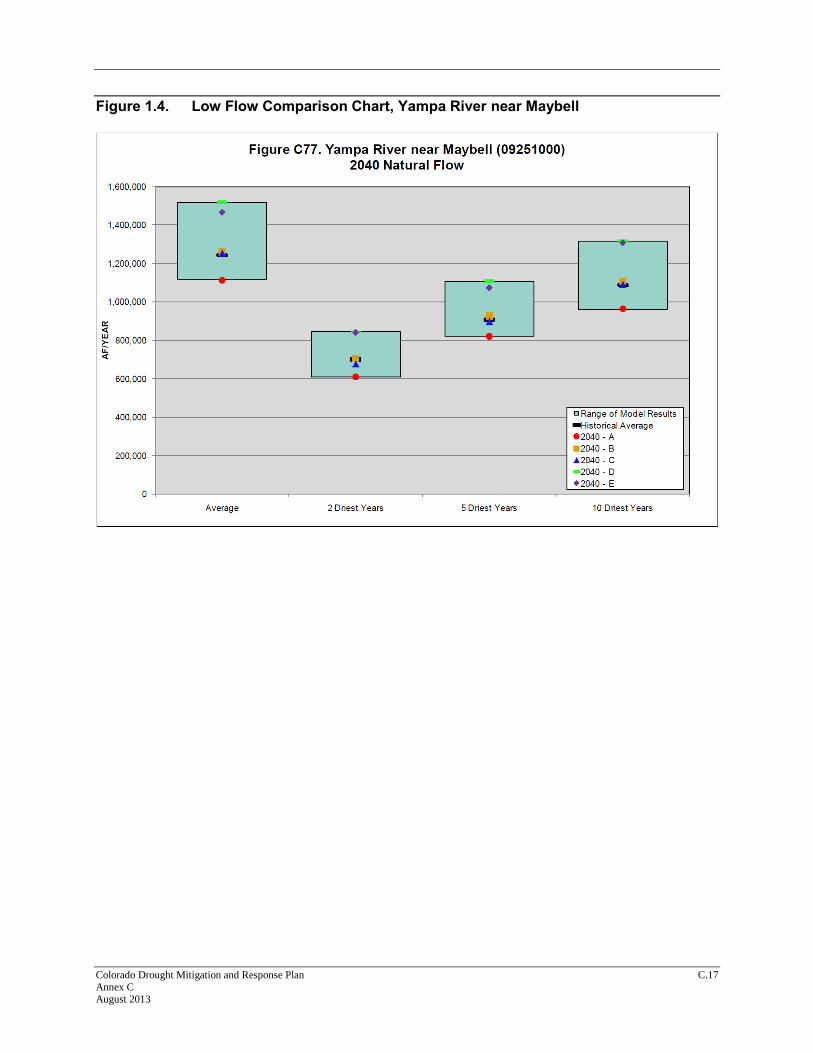
Figure 1.4. Low Flow Comparison Chart, Yampa River near Maybell
Colorado Drought Mitigation and Response Plan C.18 Annex C August 2013
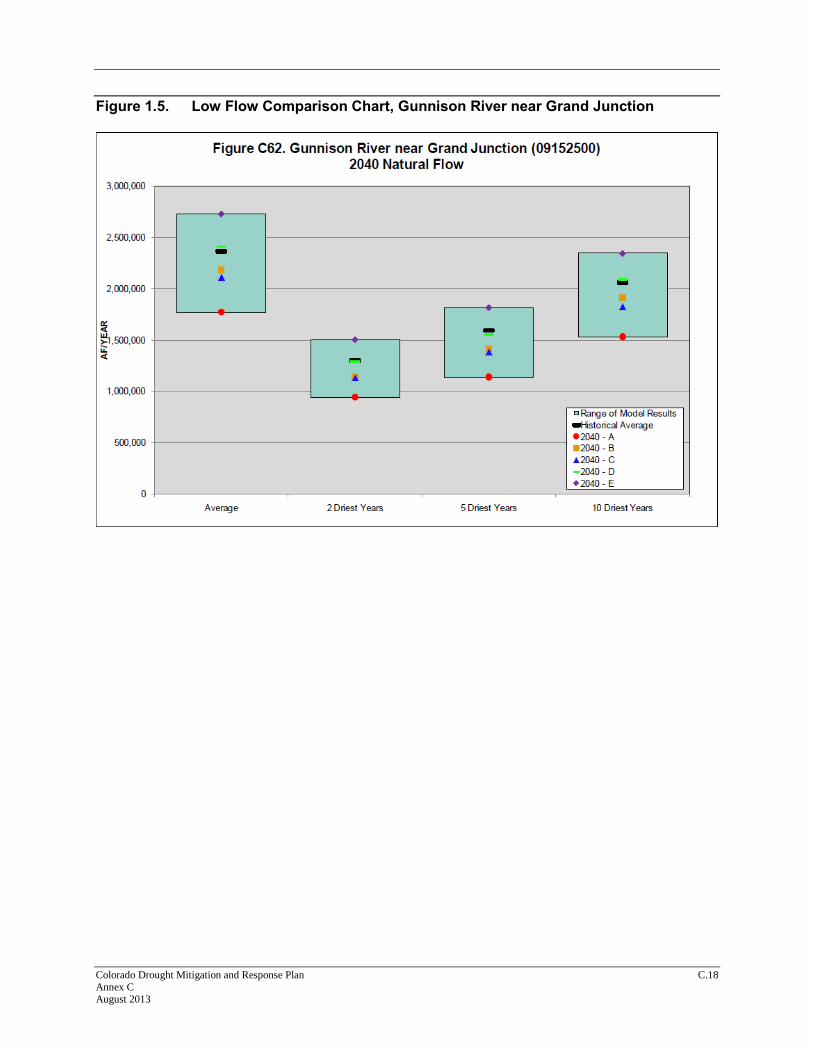
Figure 1.5. Low Flow Comparison Chart, Gunnison River near Grand Junction
Colorado Drought Mitigation and Response Plan C.19 Annex C August 2013
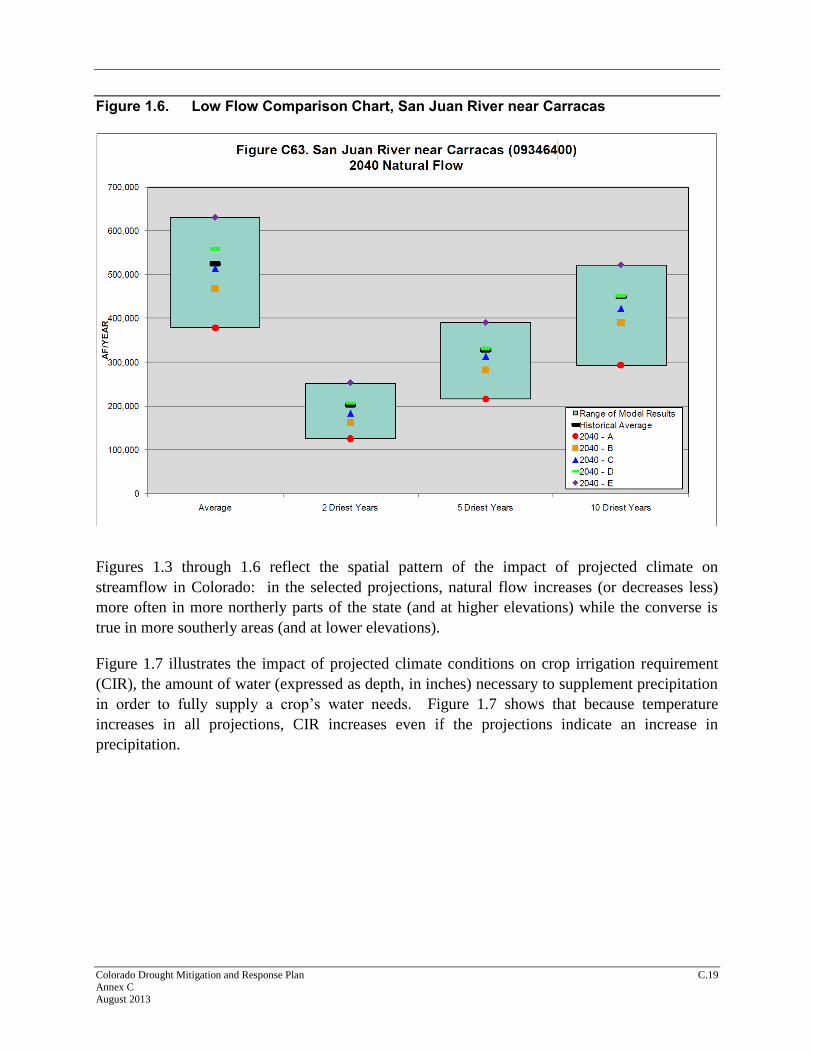
Figure 1.6. Low Flow Comparison Chart, San Juan River near Carracas
Figures 1.3 through 1.6 reflect the spatial pattern of the impact of projected climate on
streamflow in Colorado: in the selected projections, natural flow increases (or decreases less)
more often in more northerly parts of the state (and at higher elevations) while the converse is
true in more southerly areas (and at lower elevations).
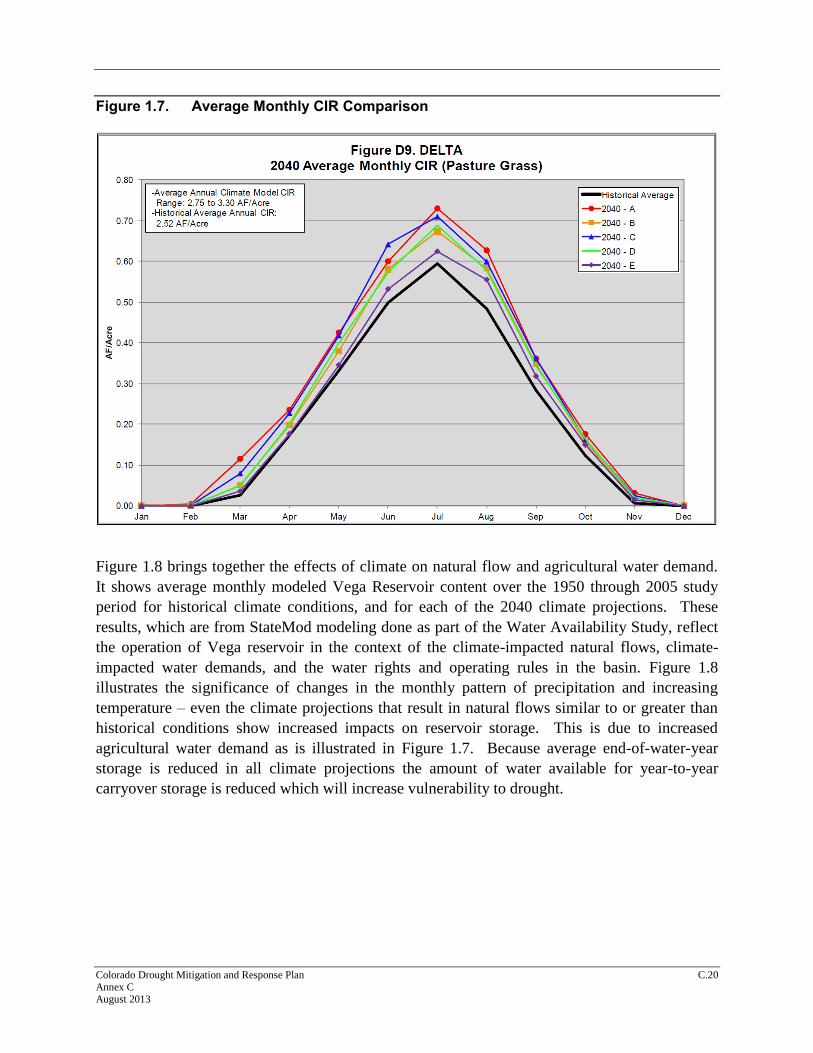
Figure 1.7 illustrates the impact of projected climate conditions on crop irrigation requirement
(CIR), the amount of water (expressed as depth, in inches) necessary to supplement precipitation
in order to fully supply a crop’s water needs. Figure 1.7 shows that because temperature
increases in all projections, CIR increases even if the projections indicate an increase in
precipitation.
Colorado Drought Mitigation and Response Plan C.20 Annex C August 2013
Figure 1.7. Average Monthly CIR Comparison
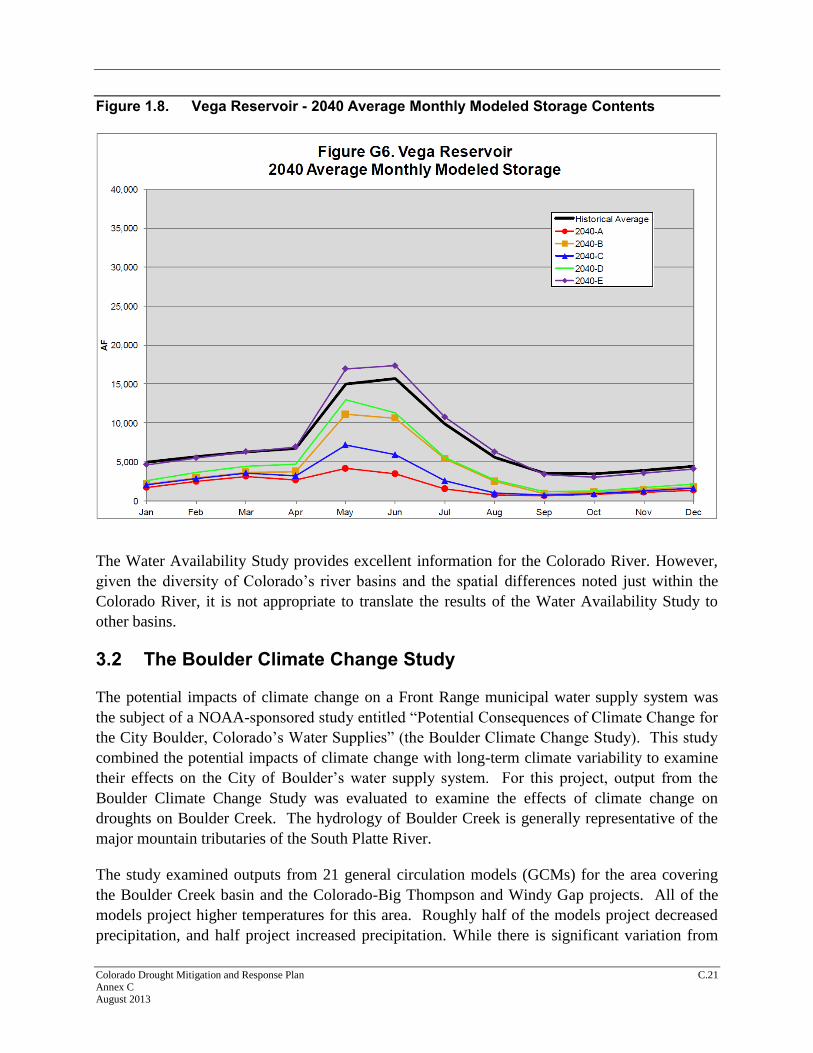
Figure 1.8 brings together the effects of climate on natural flow and agricultural water demand.
It shows average monthly modeled Vega Reservoir content over the 1950 through 2005 study
period for historical climate conditions, and for each of the 2040 climate projections. These
results, which are from StateMod modeling done as part of the Water Availability Study, reflect
the operation of Vega reservoir in the context of the climate-impacted natural flows, climate-
impacted water demands, and the water rights and operating rules in the basin. Figure 1.8
illustrates the significance of changes in the monthly pattern of precipitation and increasing
temperature – even the climate projections that result in natural flows similar to or greater than
historical conditions show increased impacts on reservoir storage. This is due to increased
agricultural water demand as is illustrated in Figure 1.7. Because average end-of-water-year
storage is reduced in all climate projections the amount of water available for year-to-year
carryover storage is reduced which will increase vulnerability to drought.
Colorado Drought Mitigation and Response Plan C.21 Annex C August 2013
Figure 1.8. Vega Reservoir - 2040 Average Monthly Modeled Storage Contents
The Water Availability Study provides excellent information for the Colorado River. However,
given the diversity of Colorado’s river basins and the spatial differences noted just within the
Colorado River, it is not appropriate to translate the results of the Water Availability Study to
other basins.
3.2 The Boulder Climate Change Study
The potential impacts of climate change on a Front Range municipal water supply system was
the subject of a NOAA-sponsored study entitled “Potential Consequences of Climate Change for
the City Boulder, Colorado’s Water Supplies” (the Boulder Climate Change Study). This study
combined the potential impacts of climate change with long-term climate variability to examine
their effects on the City of Boulder’s water supply system. For this project, output from the
Boulder Climate Change Study was evaluated to examine the effects of climate change on
droughts on Boulder Creek. The hydrology of Boulder Creek is generally representative of the
major mountain tributaries of the South Platte River.
The study examined outputs from 21 general circulation models (GCMs) for the area covering
the Boulder Creek basin and the Colorado-Big Thompson and Windy Gap projects. All of the
models project higher temperatures for this area. Roughly half of the models project decreased
precipitation, and half project increased precipitation. While there is significant variation from
Colorado Drought Mitigation and Response Plan C.22 Annex C August 2013
model to model, in general the models tend to project wetter winters and drier summers. Four
GCMs were selected to reflect a range of potential changes in precipitation. Outputs from the
selected models reflecting three greenhouse gas emission scenarios (B1, A1-B and A2) were
evaluated. Estimates of climate change for 20-year periods centering on 2030 and 2070 were
used.
The study incorporated long-term climate variability exhibited by 437-year (1566-2002) tree
ring-based streamflow reconstructions for Boulder Creek, South Boulder Creek, and the
Colorado River (Woodhouse and Lukas 2006). A “nearest neighbor” approach was used to
match natural streamflows and observed temperature and precipitation for 1953 through 2004
(for which climate records are available for the mountains above Boulder) with tree ring-derived
annual streamflows. Years from 1953 through 2004 were used as proxies for pre-1953 years. A
non-parametric re-sampling method was used to generate a 1,000 member ensemble of climate
change scenarios (and a base case “no-climate-change” scenario), each comprised of 437 “years”
selected from the 1953-2004 population that reflects the statistical properties of the 437-year
long paleo-streamflow reconstruction.
A runoff model was calibrated using historical (1953-2004) weather data from the Niwot Ridge
C1 station located west of Boulder and monthly natural streamflows for Boulder Creek at
Orodell, South Boulder Creek near Eldorado Springs, and the Colorado River at Hot Sulphur
Springs. Temperature and precipitation changes from the GCMs were applied to the runoff
model to generate altered monthly flows that were reflected in the ensembles. Temperature and
precipitation changes from the GCMs were also used to adjust Boulder Creek basin irrigation
demands and South Platte River calls.
The effects of altered streamflows, precipitation and temperature upon Boulder’s water supply
system were evaluated using the Boulder Creek Model, developed by the City of Boulder to
analyze water supply reliability. The Boulder Creek Model simulates the operation of Boulder’s
water supply system given natural streamflows, water rights, water demands and return flows,
and diversion and storage facilities in the Boulder Creek basin and calls from downstream South
Platte rights.
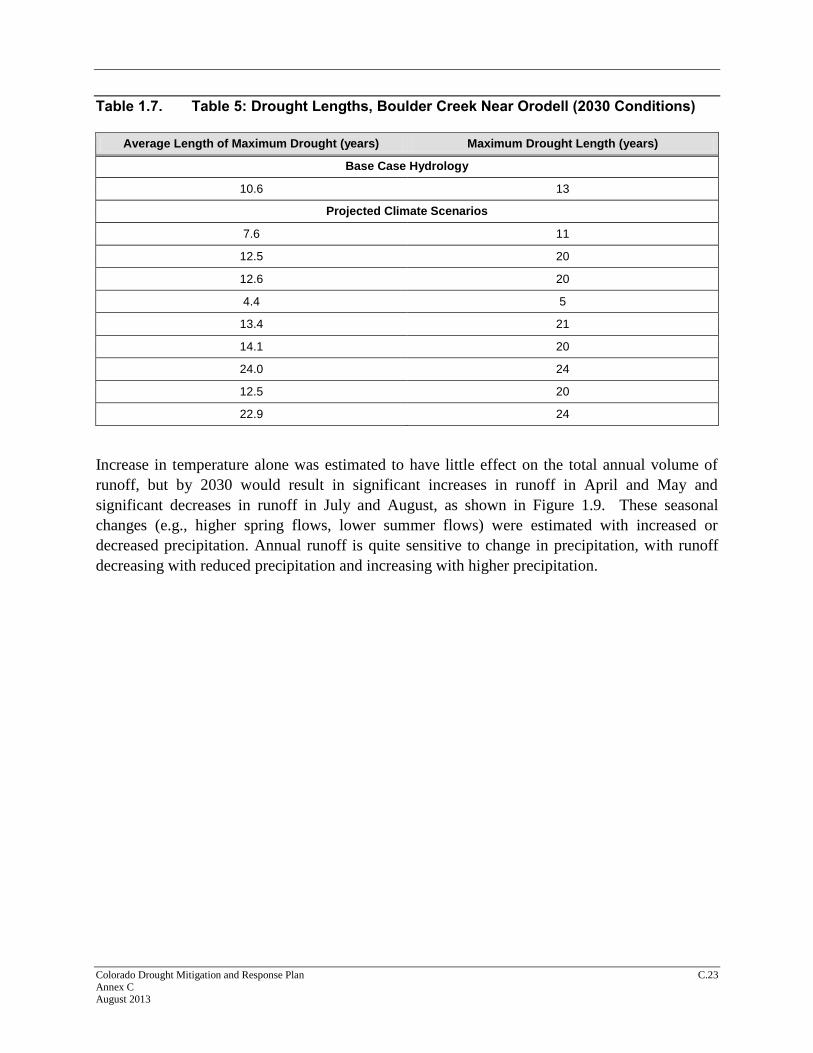
Results from the Boulder Climate Change Study (shown in Table 1.7) indicate that, in seven out
of the nine climate change scenarios evaluated, droughts on Boulder Creek are likely to be
significantly longer than those simulated in the base-case.
Colorado Drought Mitigation and Response Plan C.23 Annex C August 2013
Table 1.7. Table 5: Drought Lengths, Boulder Creek Near Orodell (2030 Conditions)
Average Length of Maximum Drought (years) Maximum Drought Length (years)
Base Case Hydrology
10.6 13
Projected Climate Scenarios
7.6 11
12.5 20
12.6 20
4.4 5
13.4 21
14.1 20
24.0 24
12.5 20
22.9 24
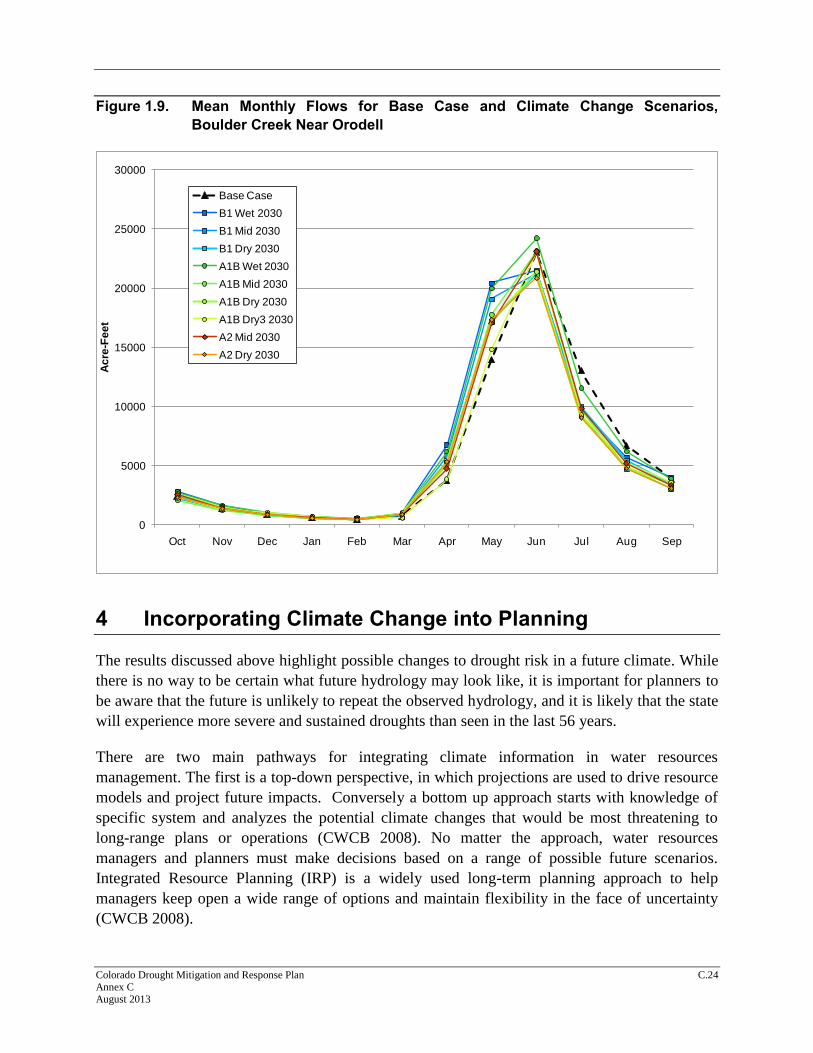
Increase in temperature alone was estimated to have little effect on the total annual volume of
runoff, but by 2030 would result in significant increases in runoff in April and May and
significant decreases in runoff in July and August, as shown in Figure 1.9. These seasonal
changes (e.g., higher spring flows, lower summer flows) were estimated with increased or
decreased precipitation. Annual runoff is quite sensitive to change in precipitation, with runoff
decreasing with reduced precipitation and increasing with higher precipitation.
Colorado Drought Mitigation and Response Plan C.24 Annex C August 2013
Figure 1.9. Mean Monthly Flows for Base Case and Climate Change Scenarios,
Boulder Creek Near Orodell
0
5000
10000
15000
20000
25000
30000
Oct Nov Dec Jan Feb Mar Apr May Jun Jul Aug Sep
Ac
re-F
ee
t
Base Case
B1 Wet 2030
B1 Mid 2030
B1 Dry 2030
A1B Wet 2030
A1B Mid 2030
A1B Dry 2030
A1B Dry3 2030
A2 Mid 2030
A2 Dry 2030
4 Incorporating Climate Change into Planning
The results discussed above highlight possible changes to drought risk in a future climate. While
there is no way to be certain what future hydrology may look like, it is important for planners to
be aware that the future is unlikely to repeat the observed hydrology, and it is likely that the state
will experience more severe and sustained droughts than seen in the last 56 years.
There are two main pathways for integrating climate information in water resources
management. The first is a top-down perspective, in which projections are used to drive resource
models and project future impacts. Conversely a bottom up approach starts with knowledge of
specific system and analyzes the potential climate changes that would be most threatening to
long-range plans or operations (CWCB 2008). No matter the approach, water resources
managers and planners must make decisions based on a range of possible future scenarios.
Integrated Resource Planning (IRP) is a widely used long-term planning approach to help
managers keep open a wide range of options and maintain flexibility in the face of uncertainty
(CWCB 2008).
Colorado Drought Mitigation and Response Plan C.25 Annex C August 2013
Over the last seven years, the state has been paying increased attention to climate change
projections from the Intergovernmental Panel on Climate Change (IPCC) and has developed a
Climate Action Plan which includes the need to investigate vulnerabilities of the state’s water
supplies to climate change and to plan for severe drought (as well as other risks) resulting from
climate change. In 2008, the state held a conference to assist water providers, planners,
managers, and agency and local government officials assess drought risk, impacts, and
preparedness in Colorado, and the improvements that will be needed for management under
different conditions such as climate change.
Future climate change analysis should be used in conjunction with the vulnerability assessment
completed here to inform the hazard profile and to support a drought risk assessment that
incorporates vulnerability to possible future droughts.
Colorado Drought Mitigation and Response Plan C.26 Annex C August 2013
5 Appendix 1: Flow Comparison Charts
Colorado Drought Mitigation and Response Plan C.27 Annex C August 2013
Colorado Drought Mitigation and Response Plan C.28 Annex C August 2013
Colorado Drought Mitigation and Response Plan C.29 Annex C August 2013

Colorado Drought Mitigation and Response Plan C.30 Annex C August 2013
Colorado Drought Mitigation and Response Plan C.31 Annex C August 2013
Colorado Drought Mitigation and Response Plan C.32 Annex C August 2013
Colorado Drought Mitigation and Response Plan C.33 Annex C August 2013
Colorado Drought Mitigation and Response Plan C.34 Annex C August 2013
Colorado Drought Mitigation and Response Plan C.35 Annex C August 2013
Colorado Drought Mitigation and Response Plan C.36 Annex C August 2013
Colorado Drought Mitigation and Response Plan C.37 Annex C August 2013
Colorado Drought Mitigation and Response Plan C.38 Annex C August 2013
Colorado Drought Mitigation and Response Plan C.39 Annex C August 2013
Colorado Drought Mitigation and Response Plan C.40 Annex C August 2013
Colorado Drought Mitigation and Response Plan C.41 Annex C August 2013
Colorado Drought Mitigation and Response Plan C.42 Annex C August 2013
Colorado Drought Mitigation and Response Plan C.43 Annex C August 2013
Colorado Drought Mitigation and Response Plan C.44 Annex C August 2013
Colorado Drought Mitigation and Response Plan C.45 Annex C August 2013
Colorado Drought Mitigation and Response Plan C.46 Annex C August 2013
Colorado Drought Mitigation and Response Plan C.47 Annex C August 2013
Colorado Drought Mitigation and Response Plan C.48 Annex C August 2013
Colorado Drought Mitigation and Response Plan C.49 Annex C August 2013
Colorado Drought Mitigation and Response Plan C.50 Annex C August 2013
Colorado Drought Mitigation and Response Plan C.51 Annex C August 2013
Colorado Drought Mitigation and Response Plan C.52 Annex C August 2013
Colorado Drought Mitigation and Response Plan C.53 Annex C August 2013
Colorado Drought Mitigation and Response Plan C.54 Annex C August 2013
6 References
Barnett, T. P., et al. 2008. Human-induced changes in the hydrology of the western United
States. Science 319 (2).
Barnett, T. P., and D. W. Pierce. 2008. When will Lake Mead go dry? Water Resources Research
44.
CCSP. 2008. 4.3 The effects of climate change on agriculture, land resources, water resources,
and biodiversity in the United States. A Report by the U.S. Climate Change Science Program and
the Subcommittee on Global Change Research.
Christensen, N. S., et al. 2004. The Effects of climate change on the hydrology and water
resources of the Colorado River Basin. Climate Change 62.
Colorado Water Conservation Board. 2008. Climate Change in Colorado; A Synthesis to Support
Water Resources Management and Adaptation.
Colorado Water Conservation Board. 2012. Colorado River Water Availability Study, Phase I
final report.
Colorado Water Conservation Board. 2012a. Colorado River Water Availability Study, Phase I
final report, Appendices.
Gleick, P. H., and E. L. Chalecki. 1999. The impacts of climate change for water resources of the
Colorado and Sacramento-San Joaquin River Basins. Journal of the American Water Resources
Association 35 (6).
Harding, B. L., Wood, A. W. and Prairie, J. B., 2012. The implications of climate change
scenario selection for future streamflow projection in the upper Colorado River basin, Hyd. Earth
Sys. Sci. http://www.hydrol-earth-syst-sci.net/16/3989/2012/.
IPCC. 2001. Climate change 2001: The Scientific Basis. Contribution of Working Group I to the
Third Assessment Report for the Intergovernmental Panel on Climate Change. Cambridge
University Press, Cambridge, UK and New York, NY.
IPCC. 2007. Climate Change 2007: The Physical Science Basis, Contribution of Working Group
I to the Fourth Assessment Report of the Intergovernmental Panel on Climate Change.
Cambridge University Press, Cambridge UK and New York, NY.
Karl, T. R., and W. E. Riebsame. 1989. The impact of decadal fluctuation in mean precipitation
and temperature on runoff: a sensitivity study over the United States. Climate Change 15.
Knowles, N., M. D. Dettinger, and D. R. Cayan. 2006 Trends in snowfall versus rainfall in the
western United States. Journal of Climate 19.
Colorado Drought Mitigation and Response Plan C.55 Annex C August 2013
Milly, P. C. D., et al. 2008. Stationarity is dead: whither water management? Science 319 (2).
Mote, P. W. 2006. Climate-driven variability in trends in mountain snowpack in western North
America. American Meterological Society.
Mote, P. W., et al. 2005. Declining mountain snowpack in western North America. Bulletin of
the American Meteorological Society.
Nash, L. L., and P. H. Gleick. 1990. Sensitivity of streamflow in the Colorado basin to climate
changes. Journal of Hydrology 125 (10).
NOAA. 2009. The potential consequences of climate change for Boulder Colorado’s water
supplies.
NOAA. 2013. Treeflow web site. http://treeflow.info/index.html Last accessed, June 22, 2013.
Stewart, I. T., D. R. Cayan, and M. D. Dettinger. 2004. Changes toward earlier streamflow
timing across western North America. Journal of Climate 18 (7).
Suanders, S., and M. Maxwell. 2005. Less snow, less water: climate disruption in the west. In A
Clear the Air Report.
Udall, B., and G. Bates. 2007. Climate and Hydrologic Trends in the Western U. S.: A review of
Recent Peer-Reviewed Research. In Intermountain West Climate Summary.
Water Research Foundation, 2012. Joint Front Range Climate Change Vulnerability Study.
Denver, Colorado, 2012.
Woodhouse, C., and J. Lukas. 2006. Streamflow Reconstructions for Boulder Creek, South
Boulder Creek, and the Colorado River. Report to City of Boulder and Hydrosphere Resource
Consultants, January 2006.