by dr. rudy schlaf wind energy - schlaf group usf …rsl.eng.usf.edu/documents/pdf/wind energy.pdfby...
TRANSCRIPT
Sustainable Energy Wind EnergyBy Dr. Rudy Schlaf
Wind Energy
Photo from: http://serdarguler.deviantart.com/art/Wind-turbines-92959540

Sustainable Energy Wind EnergyBy Dr. Rudy Schlaf
Horizontal Axis Turbines• Most popular design• Horizontal designs use
airfoils similar to wings of planes
• Lift is used to drive the rotor• Slow speeds are preferred to
reduce drag losses (remember from planes, that most energy goes into combatting drag at higher than ‘optimum’ speeds. Low speeds yield a higher lift component From American Wind Energy Association: http://www.awea.org/faq/basicop.html

Sustainable Energy Wind EnergyBy Dr. Rudy Schlaf
Horizontal Axis Turbines• Propeller shaft is
connected to a gear box to increase rotational speed
• Output drives a generator• Control:
– Anemometer measures wind speed
– Wind vane measures wind direction
– Yaw drive adjusts orientation of propeller
– Blade pitch can be adjusted to optimize rotational speed depending on wind conditions From American Wind Energy Association: http://www.awea.org/faq/basicop.html

Sustainable Energy Wind EnergyBy Dr. Rudy Schlaf
Vertical Axis Turbines: Darrieus Design
• Advantages of vertical designs are that they work with any wind direction, that the mechanics are in the base for easy access, and that there are lesser stresses on the tower since stabilizing wires can be used to hold the top.
• Disadvantages: Not self-starting (‘wings’ need forward rotation to generate tangential force component), cannot be turned out of the wind for protection, high centrifugal stresses in the wings (all mass on the outside of the rotor), force not constant during a rotational cycle-this causes resonant phenomena and certain rotational speeds need to be avoided.
Turbine on Rottnest islandin Western Australia
From
: http
://en
.wik
iped
ia.o
rg/w
iki/D
arrie
us_w
ind_
turb
ine
Roto
r Fig
. http
://w
ww.
wor
ldof
ener
gy.c
om.a
u/fa
ctsh
eet_
win
d/07
_fac
t_w
ind_
type
s.htm
l

Sustainable Energy Wind EnergyBy Dr. Rudy Schlaf
Physics of Wind Power• Wind turbines convert KE of
flowing air into electrical energy• The power that can be extracted is
proportional to the KE of a cylinder of air moving at wind speed v through A per time t.– Air density: 1.23 kg/m3 (at 1 bar/15
C).• Note that the power is proportional
to v3!– This is basically the same formula
that was derived for the amount of energy going into air resistance when driving a car.
– This excludes a majority of the earth surface from economically viable wind power installations
From: D.J.C. MacKay: Sustainable Energy-without the hot air, UIT Cambridge, 2009
KE =12mairv
2 =12ρVairv
2
=12ρAvtv2 = 1
2ρAtv3
Power = KEt
=12ρAv3

Sustainable Energy Wind EnergyBy Dr. Rudy Schlaf
Physics of Wind Power: Betz’ Law• Wind turbines convert KE in the air into
KE of a ‘shaft’ that drives a generator.• This implies that the air will have less
KE after passing the wind turbine.• The turbine also ‘swirls’ the air,
resulting in a widening of the flow• A wind turbine cannot extract all KE
from the air (otherwise the air would be at a standstill and block further flow)
• Betz’ law predicts the power that can be extracted depending on the air speed before (v1) and after (v2) the turbine.
• Theoretical maximum: Most power (59.3%) can be extracted when v2 is 0.33v1.
• This implies that a wind turbine must be optimized for a particular wind speed.
From: D.J.C. MacKay: Sustainable Energy-without the hot air, UIT Cambridge, 2009http://en.wikipedia.org/wiki/Betz'_law
pow
er c
oeffi
cien
t = p
ower
in/o
ut
v2v1
A
Sustainable Energy Wind EnergyBy Dr. Rudy Schlaf
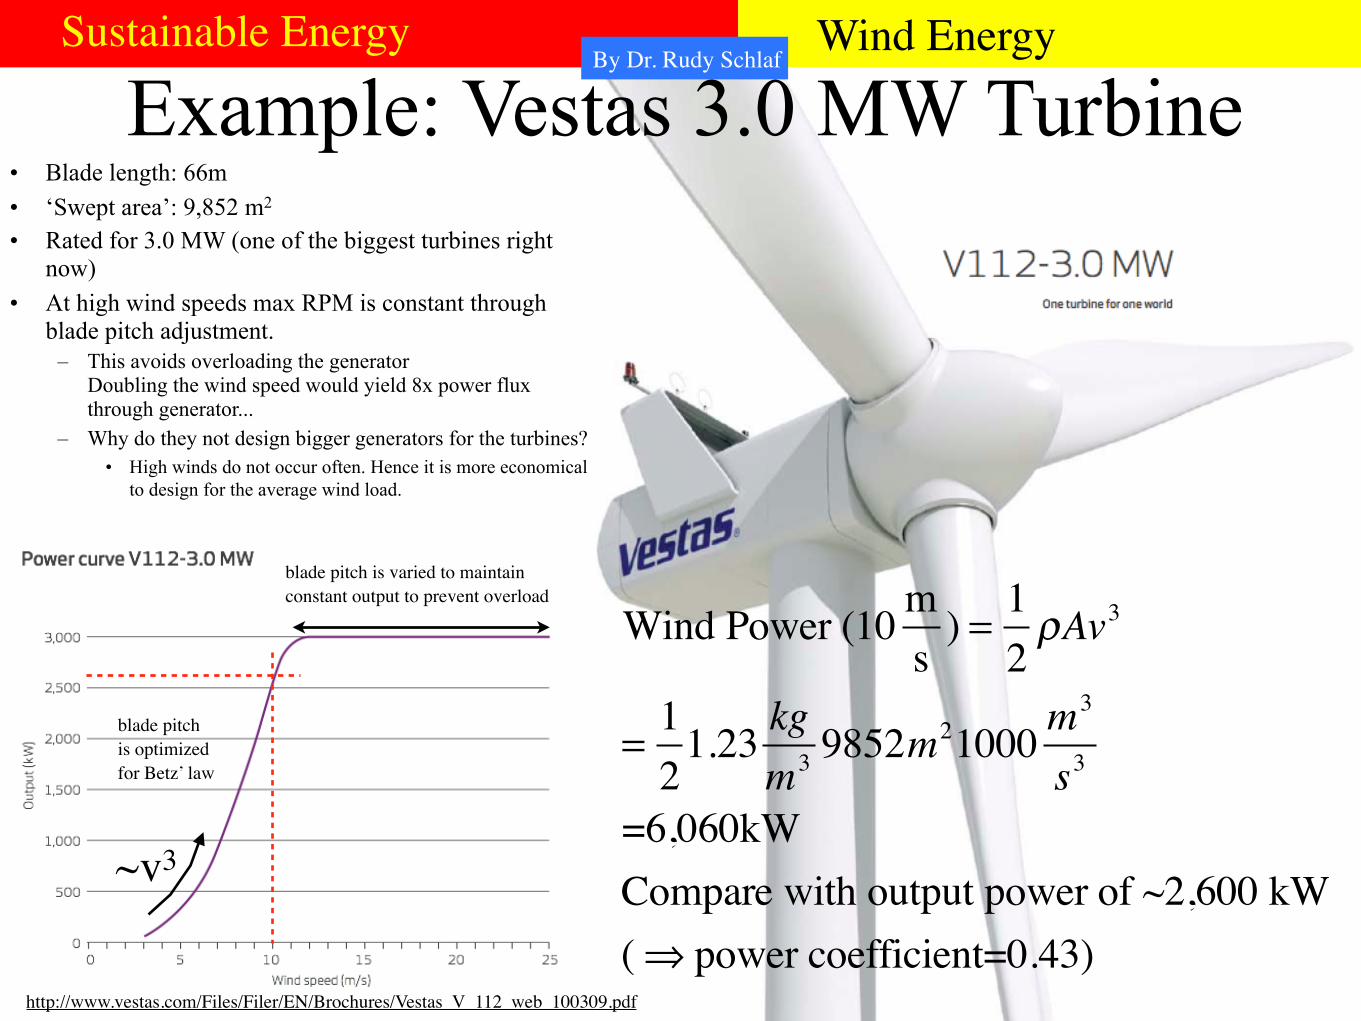
Example: Vestas 3.0 MW Turbine• Blade length: 66m• ‘Swept area’: 9,852 m2 • Rated for 3.0 MW (one of the biggest turbines right
now)• At high wind speeds max RPM is constant through
blade pitch adjustment.– This avoids overloading the generator
Doubling the wind speed would yield 8x power flux through generator...
– Why do they not design bigger generators for the turbines?• High winds do not occur often. Hence it is more economical
to design for the average wind load.
http://www.vestas.com/Files/Filer/EN/Brochures/Vestas_V_112_web_100309.pdf
Wind Power (10 ms
) = 12ρAv3
=12
1.23 kgm3 9852m21000 m
3
s3
=6,060kWCompare with output power of ~2,600 kW( ⇒ power coefficient=0.43)
~v3
blade pitch is varied to maintain constant output to prevent overload
blade pitch is optimized for Betz’ law
win
d sp
eed
m/s
Seasonal wind speed in Cairngorm (Scottland)(red line: daily / blue: half-hourly)
Sustainable Energy Wind EnergyBy Dr. Rudy Schlaf
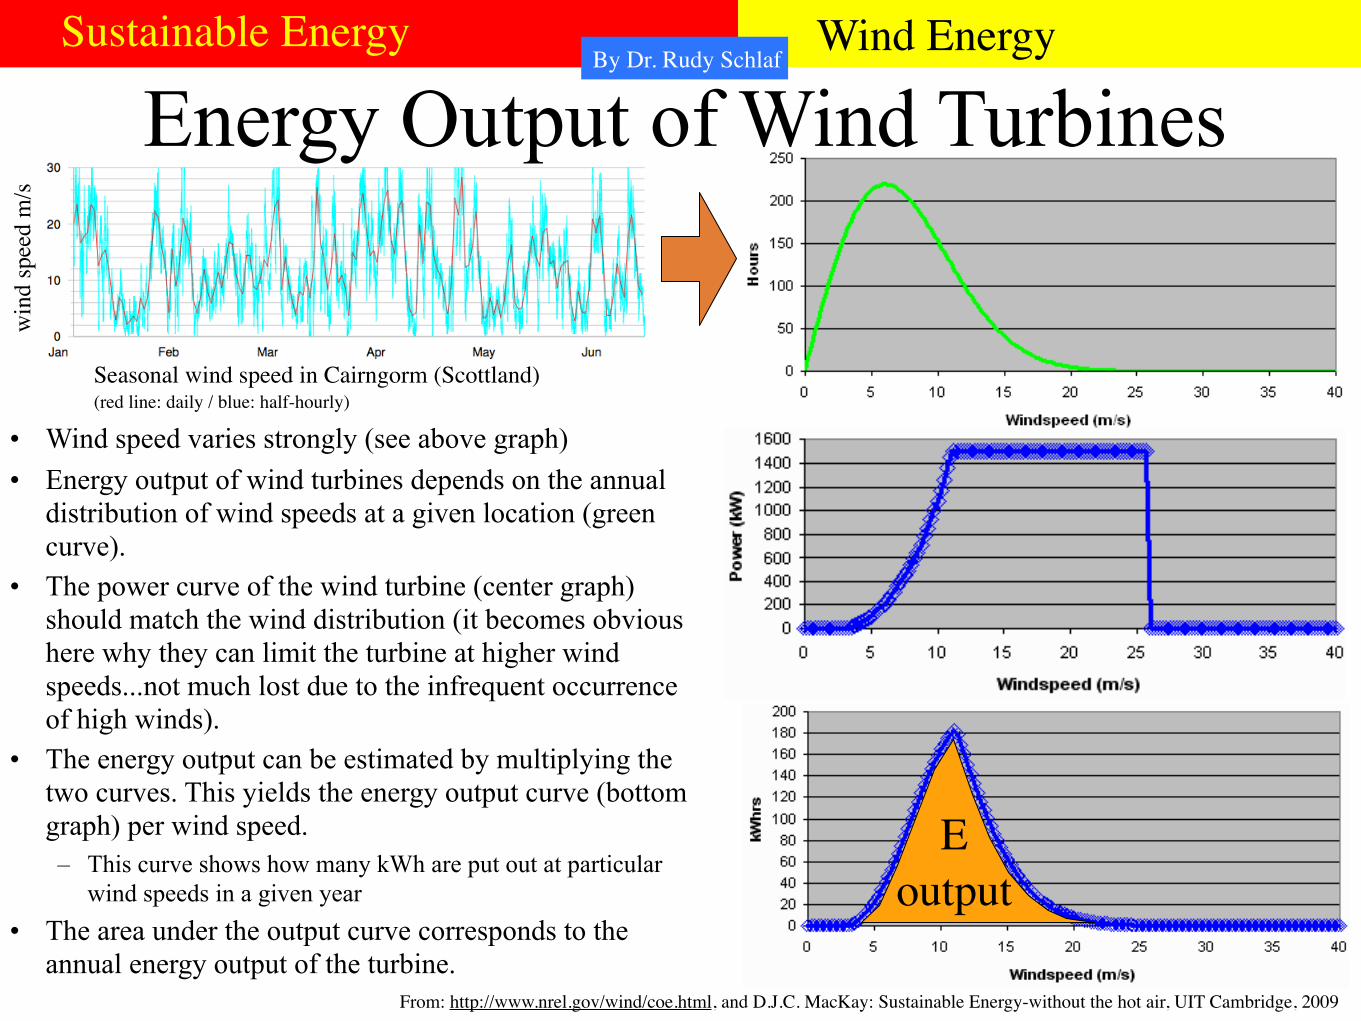
Energy Output of Wind Turbines
• Wind speed varies strongly (see above graph)• Energy output of wind turbines depends on the annual
distribution of wind speeds at a given location (green curve).
• The power curve of the wind turbine (center graph) should match the wind distribution (it becomes obvious here why they can limit the turbine at higher wind speeds...not much lost due to the infrequent occurrence of high winds).
• The energy output can be estimated by multiplying the two curves. This yields the energy output curve (bottom graph) per wind speed.– This curve shows how many kWh are put out at particular
wind speeds in a given year• The area under the output curve corresponds to the
annual energy output of the turbine.From: http://www.nrel.gov/wind/coe.html, and D.J.C. MacKay: Sustainable Energy-without the hot air, UIT Cambridge, 2009
Eoutput

Sustainable Energy Wind EnergyBy Dr. Rudy Schlaf
How Many Wind Turbines Per Area?• Wind turbines slow down the
wind, and disturb the flow in a wider area than their immediate rotor diameter– The added width is needed to handle
the airflow due to the lower air speed post-turbine...
• It turns out that a spacing of about 5 times the rotor diameter ensures that the turbines do not interfere much with each other.– A comparable statement in Lu et al.:
loss is smaller than 20% if there is a minimum of 7 rotors distance downstream and 4 rotors perpendicular.
From: D.J.C. MacKay: Sustainable Energy-without the hot air, UIT Cambridge, 2009X.Lu et al.: Proc. Natl. Academy of Sciences 106(27), pp. 10933-8, 2009Photo: http://www.adamscountywind.com/Revised%20Site/Windmills/Other%20Issues/Flicker%20Noise%20&%20Other%20Issues.htm

Sustainable Energy Wind EnergyBy Dr. Rudy Schlaf
Wind Power Dependence on Height• Wind typically has a larger velocity higher up• This is a result of friction with the earth surface• The ‘wind profile power law’ defines the wind
velocity v at height h depending on a known reference velocity vref at a reference height href.
• This implies that more power can be generated the higher turbines are located above the surface.
• The small α suggests the velocity difference is not much, but since power~v3 a significant power increase is seen.
From: http://en.wikipedia.org/wiki/Wind_profile_power_law
vvref
=hhref
⎛
⎝⎜⎞
⎠⎟
α
; α~0.143
v=velocityh=heightref=reference valuesα=power coefficient

Sustainable Energy Wind EnergyBy Dr. Rudy Schlaf
Wind Power Depending on Height: Some Numbers
• Power density doubles when going from 10m to 50m height.
From: http://en.wikipedia.org/wiki/Wind_profile_power_law

Sustainable Energy Wind EnergyBy Dr. Rudy Schlaf
Wind Power Potential• 1% of the total solar power absorbed by the earth is converted
to KE of the atmosphere• Total sun power reaching earth: 1.740×10¹⁷W
• If it were distributed uniformly this would corresponding to a total wind power of about 3.4×10¹⁴W on the land mass.
• World power use (2002): 14.3×10¹²W• US power use: (2008): 3.3×10¹²W• When making comparisons, keep in mind that wind power is electrical,
and that 59.3% is the theoretical maximum for extraction.
• Of course, wind power is not homogeneously distributed.• Land areas receive less, oceans more• US is one of the better wind places, but also has large areas where wind
power is not economically feasibleFrom: X.Lu et al.: Proc. Natl. Academy of Sciences 106(27), pp. 10933-8, 2009

Sustainable Energy Wind EnergyBy Dr. Rudy Schlaf
Global Onshore Wind Power Potential
• Map shows ‘feasible’ power potential that could be extracted as electricity (wooded/permafrost/urban was excluded)• Note W/m2 scale (compare to max insolation of ~1000W/m2)
– Suitable mid west states have power density of about 3-4 W/m2.– Compare with biofuels at 0.01% conversion efficiency corresponding to 0.0001x5000Wh/24h=0.021W/m2.– Compare with PV at 5% corresponding to 0.05x5000Wh/24h=10.4W/m2.
From: X.Lu et al.: Proc. Natl. Academy of Sciences 106(27), pp. 10933-8, 2009

Sustainable Energy Wind EnergyBy Dr. Rudy Schlaf
Global Onshore Wind Energy Potential• Maps show ‘feasible’
annual wind energy potential onshore (A) and offshore (B) per country in PWh
• Compare annual energy usage:– World: 125 PWh– US: 29 PWh
• On and off-shore potential of the US: 88 PWh (~3x consumption)
From: X.Lu et al.: Proc. Natl. Academy of Sciences 106(27), pp. 10933-8, 2009
Sustainable Energy Wind EnergyBy Dr. Rudy Schlaf
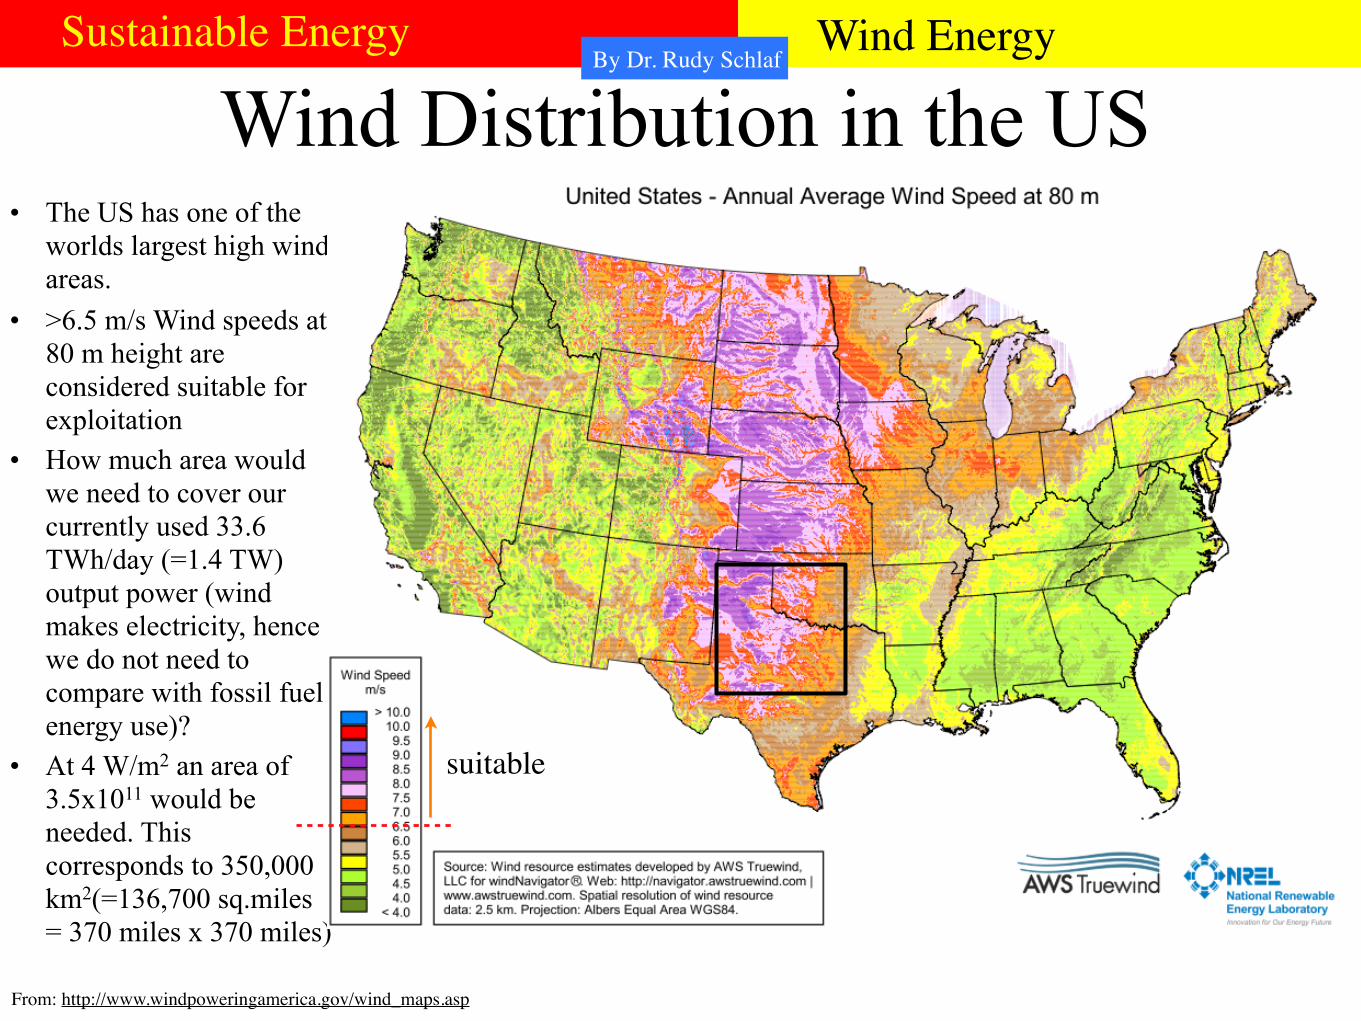
Wind Distribution in the US• The US has one of the
worlds largest high wind areas.
• >6.5 m/s Wind speeds at 80 m height are considered suitable for exploitation
• How much area would we need to cover our currently used 33.6 TWh/day (=1.4 TW) output power (wind makes electricity, hence we do not need to compare with fossil fuel energy use)?
• At 4 W/m2 an area of 3.5x10¹¹ would be needed. This corresponds to 350,000 km2(=136,700 sq.miles = 370 miles x 370 miles)
From: http://www.windpoweringamerica.gov/wind_maps.asp
suitable

Sustainable Energy Wind EnergyBy Dr. Rudy Schlaf
Seasonal Wind Energy Potential
• Graph compares US wind energy potential with US electricity consumption– Note different scales for each curve. Offshore potential already matches the US electricity consumption. – In summer there is less wind...(but solar cells typically work better...)
From: X.Lu et al.: Proc. Natl. Academy of Sciences 106(27), pp. 10933-8, 2009

Sustainable Energy Wind EnergyBy Dr. Rudy Schlaf
Energy Balance of Wind Power• Kubiszewski et al.
paper conducted a ‘meta-analysis’ of 114 published individual analyses of operating and conceptual wind turbines
• Their ‘boundary conditions’ included construction, operation and decommissioning (incl. materials recycling) energy costs
From: I.Kubiszewski et al.:Renewable Energy 35, pp. 218-25, 2010
Sustainable Energy Wind EnergyBy Dr. Rudy Schlaf
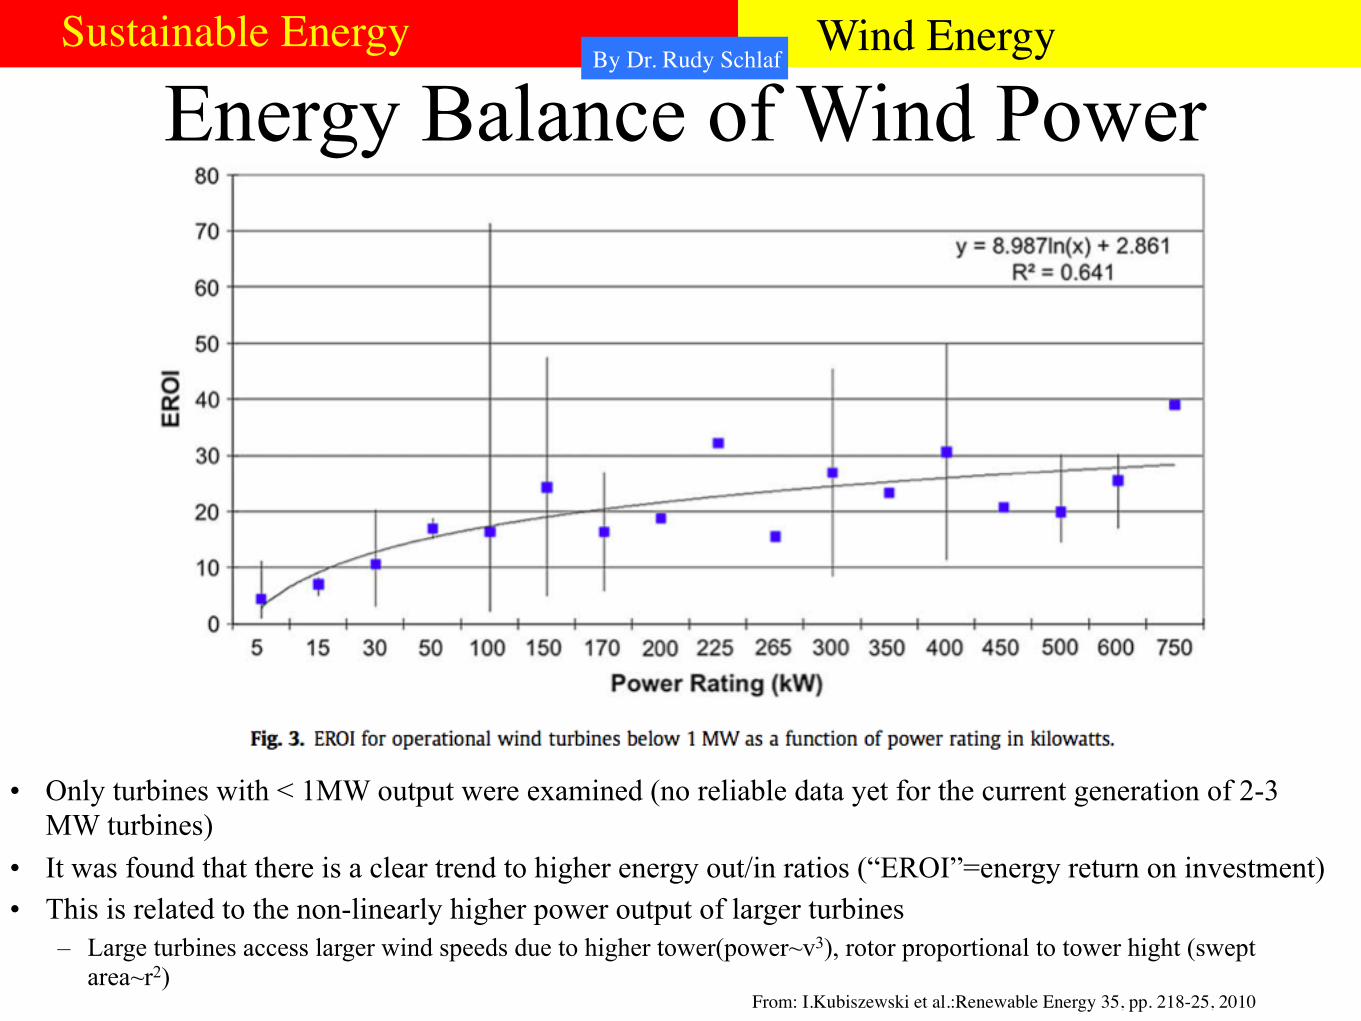
Energy Balance of Wind Power
• Only turbines with < 1MW output were examined (no reliable data yet for the current generation of 2-3 MW turbines)
• It was found that there is a clear trend to higher energy out/in ratios (“EROI”=energy return on investment)• This is related to the non-linearly higher power output of larger turbines
– Large turbines access larger wind speeds due to higher tower(power~v3), rotor proportional to tower hight (swept area~r2)
From: I.Kubiszewski et al.:Renewable Energy 35, pp. 218-25, 2010
Sustainable Energy Wind EnergyBy Dr. Rudy Schlaf
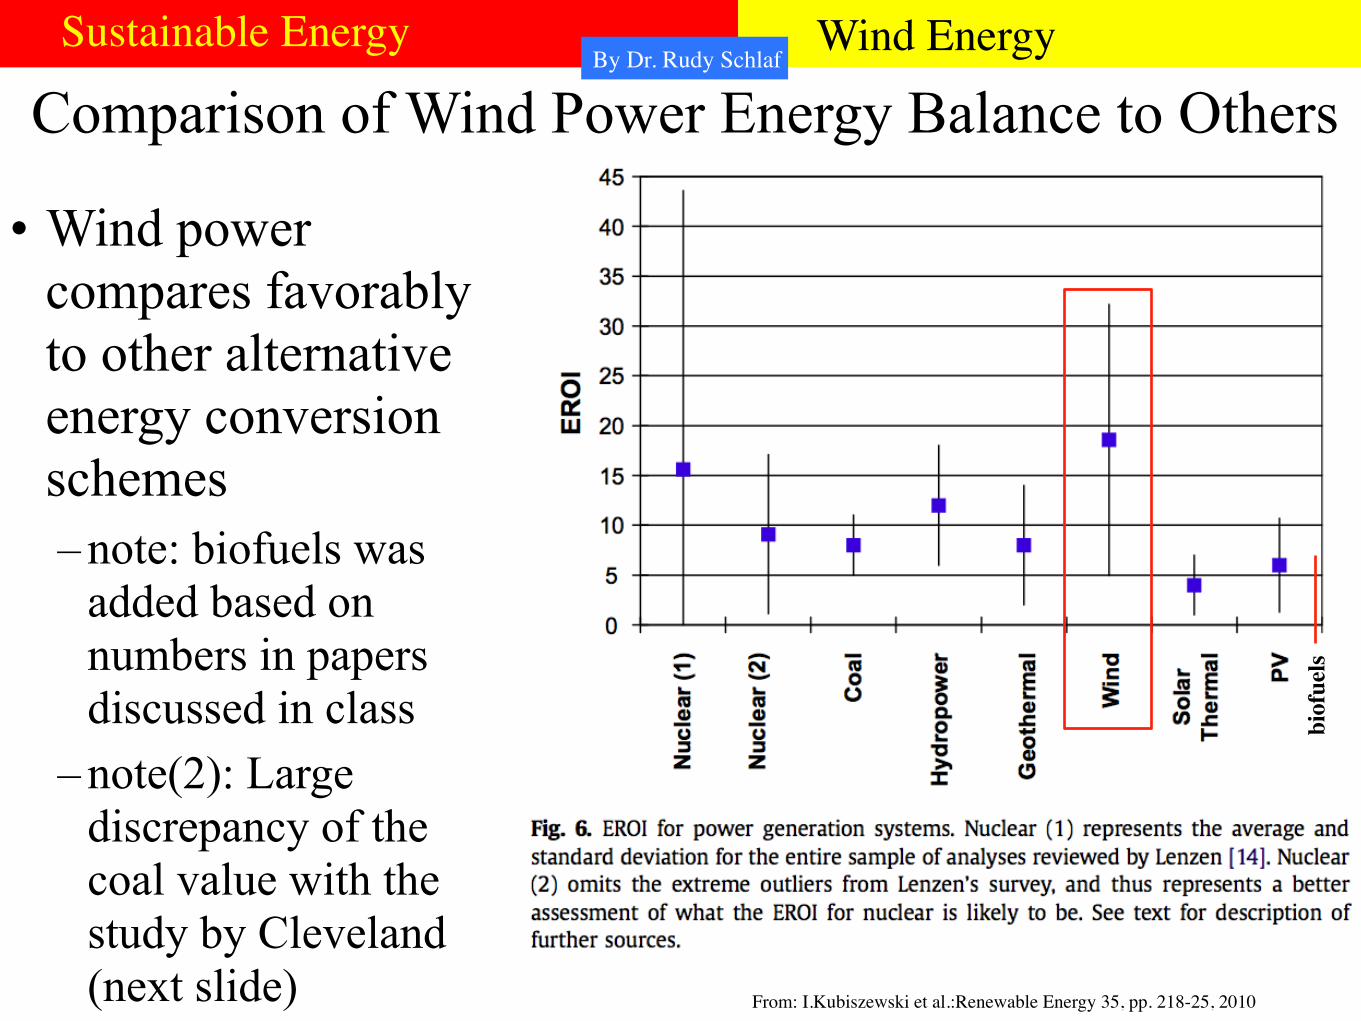
Comparison of Wind Power Energy Balance to Others
• Wind power compares favorably to other alternative energy conversion schemes– note: biofuels was
added based on numbers in papers discussed in class
– note(2): Large discrepancy of the coal value with the study by Cleveland (next slide) From: I.Kubiszewski et al.:Renewable Energy 35, pp. 218-25, 2010
biofuels
1930-2000
1950-2000
Sustainable Energy Wind EnergyBy Dr. Rudy Schlaf
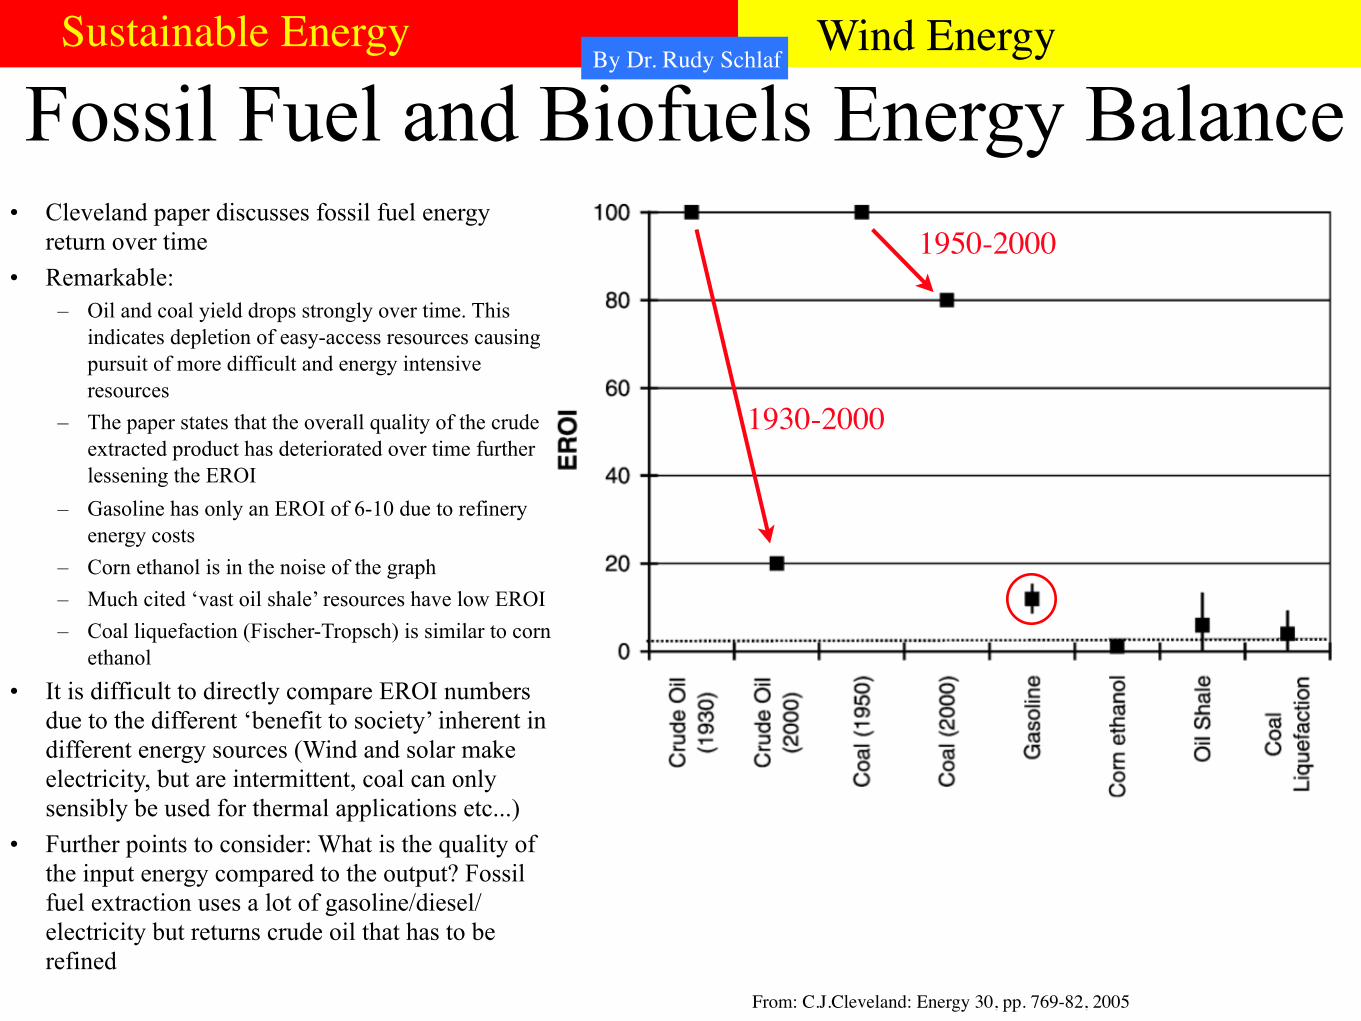
Fossil Fuel and Biofuels Energy Balance• Cleveland paper discusses fossil fuel energy
return over time• Remarkable:
– Oil and coal yield drops strongly over time. This indicates depletion of easy-access resources causing pursuit of more difficult and energy intensive resources
– The paper states that the overall quality of the crude extracted product has deteriorated over time further lessening the EROI
– Gasoline has only an EROI of 6-10 due to refinery energy costs
– Corn ethanol is in the noise of the graph– Much cited ‘vast oil shale’ resources have low EROI– Coal liquefaction (Fischer-Tropsch) is similar to corn
ethanol• It is difficult to directly compare EROI numbers
due to the different ‘benefit to society’ inherent in different energy sources (Wind and solar make electricity, but are intermittent, coal can only sensibly be used for thermal applications etc...)
• Further points to consider: What is the quality of the input energy compared to the output? Fossil fuel extraction uses a lot of gasoline/diesel/electricity but returns crude oil that has to be refined
From: C.J.Cleveland: Energy 30, pp. 769-82, 2005

Sustainable Energy Wind EnergyBy Dr. Rudy Schlaf
Wind Power Cost• Wind power costs (per
installed peak capacity) are down-trending as global capacity increases
• Between 1990 and 2001 prices fell almost 50%
• 2001 price per installed W:– 0.8-1.2 Euros (~$1.1-1.6)– Compare with current costs
of $5-6/W for solar• It is difficult to estimate
how much it would cost to build capacity to provide the entire US power needs due to the different wind curves in varying locations etc...
From: M. Junginger: Energy Policy 33, pp. 133–50, 2005
Sustainable Energy Wind EnergyBy Dr. Rudy Schlaf
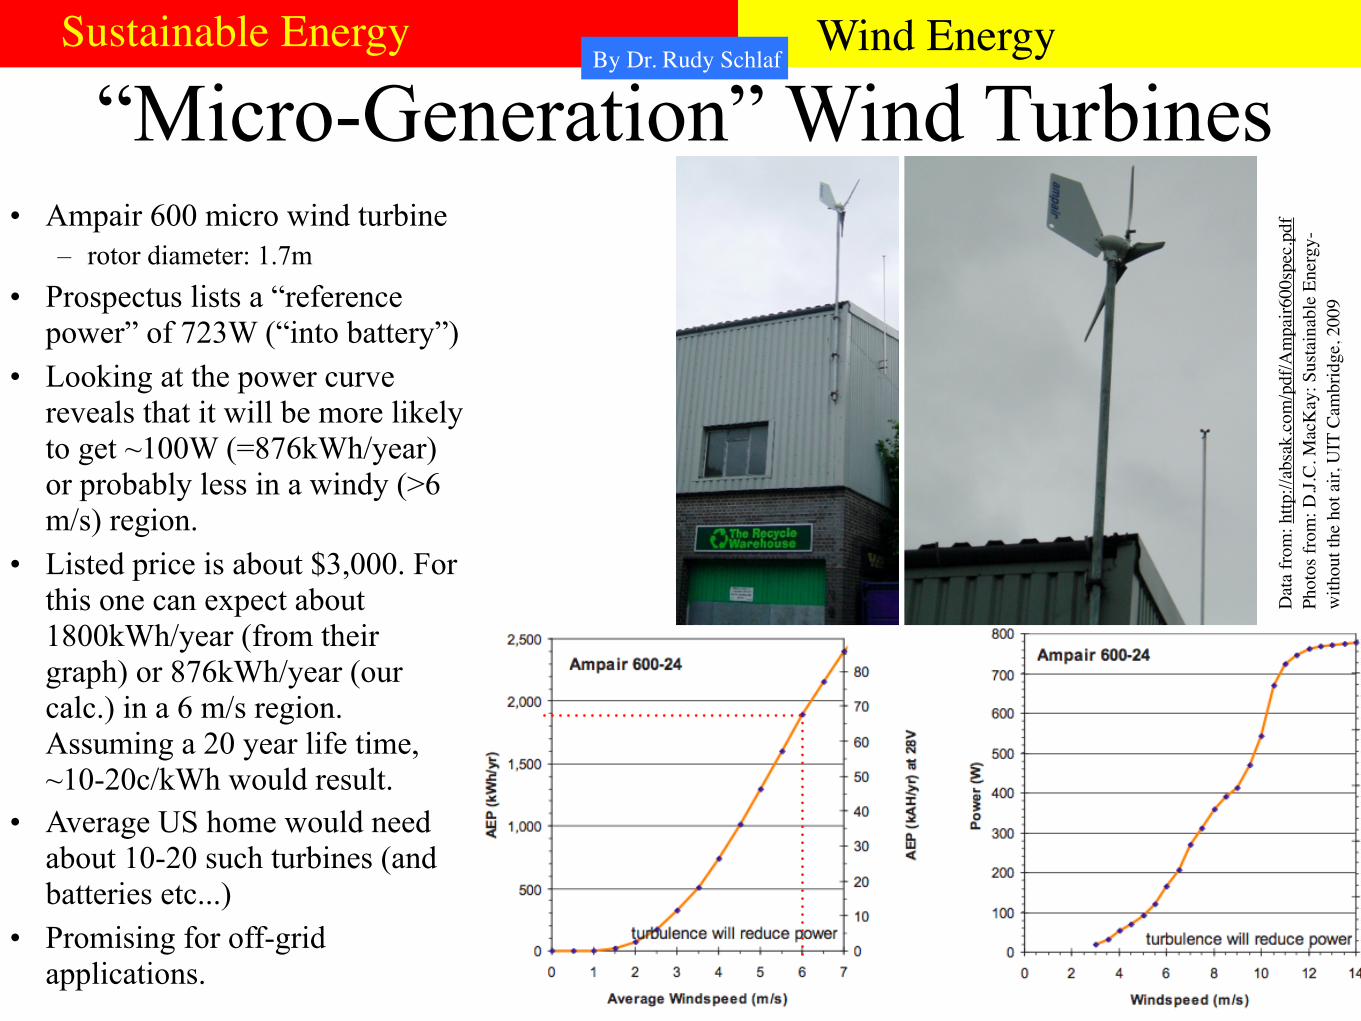
“Micro-Generation” Wind Turbines• Ampair 600 micro wind turbine
– rotor diameter: 1.7m• Prospectus lists a “reference
power” of 723W (“into battery”)• Looking at the power curve
reveals that it will be more likely to get ~100W (=876kWh/year) or probably less in a windy (>6 m/s) region.
• Listed price is about $3,000. For this one can expect about 1800kWh/year (from their graph) or 876kWh/year (our calc.) in a 6 m/s region. Assuming a 20 year life time, ~10-20c/kWh would result.
• Average US home would need about 10-20 such turbines (and batteries etc...)
• Promising for off-grid applications.
Dat
a fro
m: h
ttp://
absa
k.co
m/p
df/A
mpa
ir600
spec
Phot
os fr
om: D
.J.C.
Mac
Kay
: Sus
tain
able
Ene
rgy-
with
out t
he h
ot a
ir, U
IT C
ambr
idge
, 200
9
Sustainable Energy Wind EnergyBy Dr. Rudy Schlaf
Wind Power Summary• Wind power potential of the US is about 3x current
power use (or better, since wind yields electricity)• Energy balance is one of the best of the renewables
(~15-20, probably better with current 3 MW designs)• Economies of scale have driven the price per W down
into the $1 range–Bigger turbines are better.
• Energy density per area is low, i.e. a large part of the US would need to be plastered with wind turbines
• Conclusion: Wind power has the potential to satisfy a significant part of the US energy needs.