brie hawley, ms, phd stephen b. martin, jr., phd, pe matt ... · health at a coffee roasting and...
TRANSCRIPT
Page 1Health Hazard Evaluation Report 2016-0013-3294
Evaluation of exposures and respiratory health at a coffee roasting and packaging facility
Report No. 2016-0013-3294October 2017
Brie Hawley, MS, PhDStephen B. Martin, Jr., PhD, PE
Matt Duling, MSRachel L. Bailey, DO, MPH
U.S. Department of Health and Human ServicesCenters for Disease Control and PreventionNational Institute for Occupational Safety and Health
Page 2 Health Hazard Evaluation Report 2016-0013-3294
ContentsHighlights ...............................................i
Abbreviations .......................................v
Summary .............................................. 1
Introduction ......................................... 2
Background .......................................... 2
Process Description ............................. 4
Methods ............................................... 5
Results ................................................ 13
Discussion .......................................... 25
Conclusions ........................................ 31
Recommendations............................. 32
Appendix A: Tables ............................ 37
References .......................................... 45
Acknowledgements ........................... 55
The employer is required to post a copy of this report for 30 days at or near the workplace(s) of affected employees. The employer must take steps to ensure that the posted report is not altered, defaced, or covered by other material.
Page iHealth Hazard Evaluation Report 2016-0013-3294
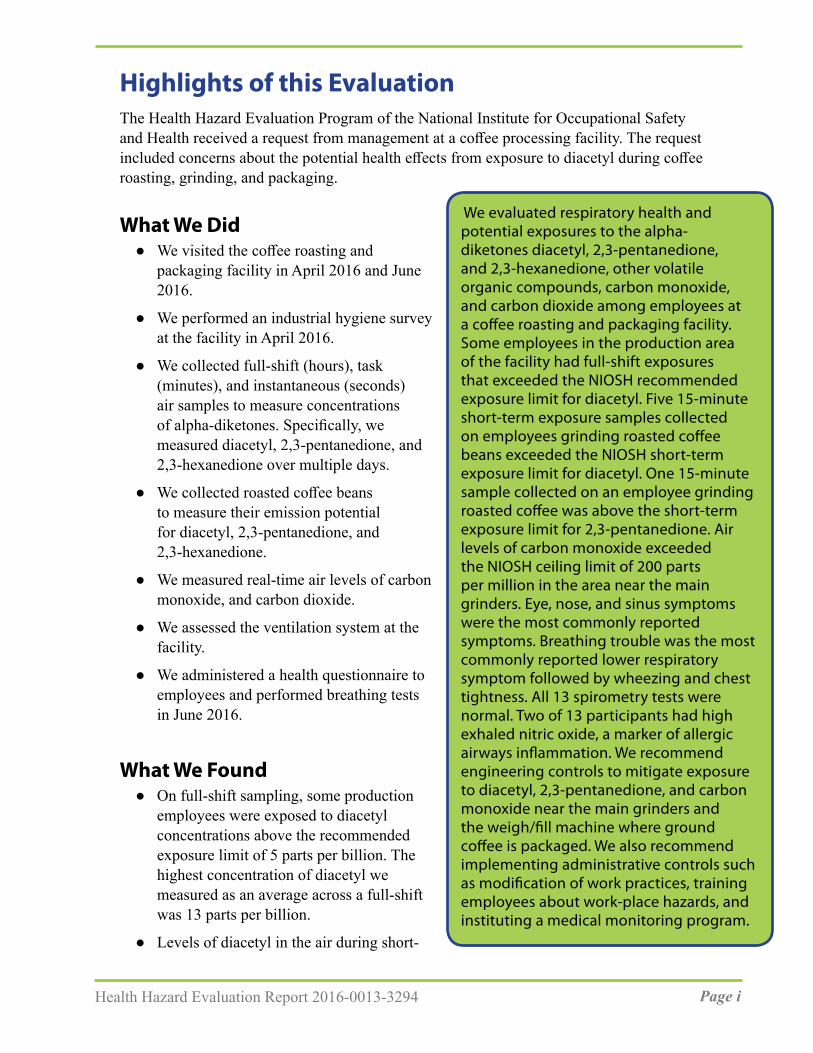
We evaluated respiratory health and potential exposures to the alpha-diketones diacetyl, 2,3-pentanedione, and 2,3-hexanedione, other volatile organic compounds, carbon monoxide, and carbon dioxide among employees at a coffee roasting and packaging facility. Some employees in the production area of the facility had full-shift exposures that exceeded the NIOSH recommended exposure limit for diacetyl. Five 15-minute short-term exposure samples collected on employees grinding roasted coffee beans exceeded the NIOSH short-term exposure limit for diacetyl. One 15-minute sample collected on an employee grinding roasted coffee was above the short-term exposure limit for 2,3-pentanedione. Air levels of carbon monoxide exceeded the NIOSH ceiling limit of 200 parts per million in the area near the main grinders. Eye, nose, and sinus symptoms were the most commonly reported symptoms. Breathing trouble was the most commonly reported lower respiratory symptom followed by wheezing and chest tightness. All 13 spirometry tests were normal. Two of 13 participants had high exhaled nitric oxide, a marker of allergic airways inflammation. We recommend engineering controls to mitigate exposure to diacetyl, 2,3-pentanedione, and carbon monoxide near the main grinders and the weigh/fill machine where ground coffee is packaged. We also recommend implementing administrative controls such as modification of work practices, training employees about work-place hazards, and instituting a medical monitoring program.
Highlights of this EvaluationThe Health Hazard Evaluation Program of the National Institute for Occupational Safety and Health received a request from management at a coffee processing facility. The request included concerns about the potential health effects from exposure to diacetyl during coffee roasting, grinding, and packaging.
What We Did ● We visited the coffee roasting and
packaging facility in April 2016 and June 2016.
● We performed an industrial hygiene survey at the facility in April 2016.
● We collected full-shift (hours), task (minutes), and instantaneous (seconds) air samples to measure concentrations of alpha-diketones. Specifically, we measured diacetyl, 2,3-pentanedione, and 2,3-hexanedione over multiple days.
● We collected roasted coffee beans to measure their emission potential for diacetyl, 2,3-pentanedione, and 2,3-hexanedione.
● We measured real-time air levels of carbon monoxide, and carbon dioxide.
● We assessed the ventilation system at the facility.
● We administered a health questionnaire to employees and performed breathing tests in June 2016.
What We Found ● On full-shift sampling, some production
employees were exposed to diacetyl concentrations above the recommended exposure limit of 5 parts per billion. The highest concentration of diacetyl we measured as an average across a full-shift was 13 parts per billion.
● Levels of diacetyl in the air during short-

Page ii Health Hazard Evaluation Report 2016-0013-3294
term sampling were higher for tasks involving grinding roasted coffee (maximum 375 parts per billion) and packaging ground coffee at the new weigh-fill machine (maximum 30 parts per billion).
● Tasks with the highest levels of diacetyl or 2,3-pentanedione were grinding, packaging ground coffee, and cleaning the roaster.
● All five of the fifteen-minute samples collected on employees performing grinding of coffee beans exceeded the National Institute for Occupational Safety and Health short-term exposure limit for diacetyl of 25 parts per billion.
● We observed employees hand blending roasted beans in the areas between the two roasters.
● Carbon monoxide levels exceeded the National Institute for Occupational Safety and Health ceiling limit of 200 parts per million in the area near the main grinders.
● Carbon dioxide levels reached as high as 2500 parts per million in the area near the main grinders.
● All tested roasted coffee beans emitted diacetyl and 2,3-pentanedione.
● Eye, nose, and sinus symptoms were the most commonly reported symptoms. Some employees reported their symptoms were caused or aggravated by green coffee bean dust, roasted coffee dust, bagging ground coffee, or cleaning the roaster.
● Breathing trouble was the most commonly reported lower respiratory symptom followed by wheezing and chest tightness.
● All spirometry tests (n=13) were normal.
● Two of 13 participants had high exhaled nitric oxide, a marker of allergic airways inflammation.
What the Employer Can Do ● Ensure employees understand potential hazards (e.g., diacetyl, 2,3-pentanedione,
carbon monoxide, carbon dioxide, green and roasted coffee dust) in the workplace and how to protect themselves.
● Install local exhaust ventilation at the main grinders and at the new weigh-fill machine to capture diacetyl, 2,3-pentanedione, and carbon monoxide emissions from the main grinders and packaging of ground coffee.
● Continue to cover bins of roasted beans to reduce emissions of alpha-diketones, carbon monoxide, and carbon dioxide into the air.
● Automate transfer of roasted beans, whenever possible, to minimize manual handling.
● Conduct follow-up air sampling to verify that the modifications have been effective in reducing exposures to below the recommended exposure limits.

Page iiiHealth Hazard Evaluation Report 2016-0013-3294
● Install a carbon monoxide monitor near the main grinders to alert employees if carbon monoxide levels exceed the National Institute for Occupational Safety and Health ceiling limit of 200 ppm.
● Continue to make N95 disposable filtering-face piece respirators available for voluntary use for protection against coffee dust exposure, such as when emptying burlap bags of green beans into the storage silos, cleaning the chaff out of the roaster exhaust system, emptying the chaff containers, or cleaning the green bean storage area.
● Encourage employees to report new or ongoing respiratory symptoms to their personal healthcare providers and to a designated individual at the workplace.
● Institute a medical monitoring program for employees who work in the production area.
What Employees Can Do ● Use any local exhaust ventilation as instructed by your employer when it is installed.
● As much as possible, avoid placing your head directly above or inside roasted bean storage bins.
● Follow your employer’s instructions for an alternative method to hand-blending roasted coffee beans.
● Some employees may wish to use N95 disposable filtering-facepiece respirators for some tasks, such as when emptying burlap bags of green beans into storage containers, cleaning the chaff out of the roaster exhaust system, emptying the chaff containers, or cleaning the green bean storage area.
● Report new, persistent, or worsening respiratory symptoms to your personal healthcare provider(s) and a designated individual at your workplace.
● Participate in any personal air sampling offered by your employer.
● Participate in your employer’s medical monitoring program as instructed by your employer.

Page iv Health Hazard Evaluation Report 2016-0013-3294
This page left intentionally blank
Page vHealth Hazard Evaluation Report 2016-0013-3294
Abbreviationsµg MicrogramACGIH® American Conference of Governmental Industrial HygienistsAHU Air-handling unitAL Action levelANSI American National Standards InstituteAPF Assigned protection factorAX Area of reactanceCFR Code of Federal RegulationsCO Carbon monoxideCO2 Carbon dioxideCOPD Chronic obstructive pulmonary diseaseDR5-R20 The difference between resistance at 5 and 20 HertzFEV1 Forced expiratory volume in 1 secondfpm Feet per minuteFres Resonant frequencyFVC Forced vital capacityHVAC Heating, ventilation, and air-conditioningHz HertzIDLH Immediately dangerous to life or healthIOS Impulse oscillometrykPa/(L/s) Kilopascals per liter per second LOD Limit of detectionLOQ Limit of quantitationLPM Liters per minuteMERV Minimum efficiency reporting valuemg/m3 Milligrams per cubic meter of airmL MillilitermL/min Milliliter per minuteNHANES National Health and Nutrition Examination SurveyNIOSH National Institute for Occupational Safety and HealthOEL Occupational exposure limitOSHA Occupational Safety and Health AdministrationPEL Permissible exposure limitppb Parts per billionppm Parts per millionQC Quality control

Page vi Health Hazard Evaluation Report 2016-0013-3294
R5 Resistance at 5 HertzR20 Resistance at 20 HertzREL Recommended exposure limitSMR Standard morbidity ratioSTEL Short-term exposure limitTLV® Threshold limit valueTWA Time-weighted averageUS United StatesVOC Volatile organic compoundX5 Reactance at 5 Hertz

Page viiHealth Hazard Evaluation Report 2016-0013-3294
Mention of any company or product does not constitute endorsement by NIOSH. In addition, citations to websites external to NIOSH do not constitute NIOSH endorsement of the sponsoring organizations or their programs or products. Furthermore, NIOSH is not responsible for the content of these websites. All web addresses referenced in this document were accessible as of the publication date of this report.
Page 1Health Hazard Evaluation Report 2016-0013-3294
SummaryIn October 2015, the Health Hazard Evaluation Program of the National Institute for Occupational Safety and Health received a request from management at a coffee roasting and packaging company. The request stated concerns about health issues related to exposure to diacetyl during coffee roasting, grinding, and packaging. In April 2016, we conducted an industrial hygiene survey and ventilation assessment at the facility. The industrial hygiene survey consisted of the collection of air samples and bulk samples of coffee for the analysis of diacetyl, 2,3-pentanedione, and 2,3-hexanedione. Continuous monitoring instruments were used to monitor total volatile organic compounds, carbon monoxide, carbon dioxide, temperature, and relative humidity in specific areas and during tasks. We returned in June 2016 to perform a medical survey. The medical survey consisted of a health questionnaire and breathing tests.
Sixteen of the 27 personal full-shift air samples exceeded the NIOSH recommended exposure limit for diacetyl of 5 parts per billion. These sixteen personal air samples were collected on employees with primary job duties on the production floor. High full-shift and task-based diacetyl and 2,3-pentanedione exposure measurements were observed on employees that ground coffee, packaged ground coffee, or worked in areas near ground coffee. Areas with ground coffee present, specifically the main grinders and new weigh-fill machine, consistently had the highest levels of diacetyl, 2,3-pentanedione, total volatile organic compounds, and carbon monoxide. We observed high instantaneous levels of diacetyl and 2,3-pentanedione during grinding. Carbon monoxide levels near the main grinders exceeded the NIOSH ceiling limit of 200 parts per million. Carbon dioxide levels were low throughout most of the facility.
Mucous membrane symptoms, specifically eye, nose, and sinus symptoms, were the most commonly reported symptoms. Some employees reported their symptoms were caused or aggravated by green coffee bean and roasted coffee dust, bagging ground coffee, or cleaning the roaster. Breathing trouble was the most commonly reported lower respiratory symptom followed by wheezing and chest tightness. All administered spirometry tests (n=13) were normal. Two of 13 participants had high exhaled nitric oxide, a marker of allergic airways inflammation. We recommend installing local exhaust ventilation and training employees about workplace hazards. We also recommend a medical monitoring program to identify any employees who may be developing work-related lung disease (e.g., asthma, obliterative bronchiolitis) and to help management prioritize interventions to prevent occupational lung disease.
Page 2 Health Hazard Evaluation Report 2016-0013-3294
IntroductionIn October 2015, the Health Hazard Evaluation Program of the National Institute for Occupational Safety and Health (NIOSH) received a request from management at a coffee roasting and packaging company. The request stated concerns about possible health issues related to exposure to diacetyl during coffee roasting and packaging. In April 2016, we conducted a ventilation assessment and industrial hygiene survey at the facility. We collected area and personal breathing zone air samples for volatile organic compounds (VOCs), including diacetyl, 2,3-pentanedione, and 2,3-hexanedione. We also monitored and recorded carbon monoxide (CO), carbon dioxide (CO2), and total VOCs. In June 2016, we conducted a medical survey.
BackgroundDiacetyl and 2,3-Pentanedione Diacetyl (2,3-butanedione) and 2,3-pentanedione (acetyl propionyl) are VOCs known as alpha-diketones that are added as ingredients in food flavorings used in some food products such as microwave popcorn, bakery mixes, and flavored coffee [Day et al. 2011; Kanwal et al. 2006; Bailey et al. 2015]. Diacetyl, 2,3-pentanedione, other VOCs, and gases such as CO and CO2 are naturally produced and released during the coffee roasting process [Duling et al. 2016; Raffel and Thompson 2013; Daglia et al. 2007; Nishimura et al. 2003; Newton 2002]. Grinding roasted coffee beans produces a greater surface area for off-gassing (sometimes called degassing) of these same compounds [Akiyama et al. 2003]. Often, coffee roasting facilities package newly roasted coffee in permeable bags or in bags fitted with one-way valves to allow the coffee to off-gas after it is packaged. Sometimes, newly roasted coffee is placed in bins or containers and allowed to off-gas before packaging.
NIOSH has recommended exposure limits (RELs) for diacetyl and 2,3-pentanedione in workplace air (Table 1) [NIOSH 2016]. The NIOSH objective in establishing RELs for diacetyl and 2,3-pentanedione is to reduce the risk of respiratory impairment (decreased lung function) and the severe irreversible lung disease obliterative bronchiolitis associated with occupational exposure to these chemicals. The NIOSH RELs are intended to protect workers exposed to diacetyl or 2,3-pentanedione for a 45-year working lifetime. The REL for diacetyl is based on a quantitative risk assessment which necessarily contains assumptions and some uncertainty. Analytical limitations current at the time were taken into consideration in setting the REL for 2,3-pentanedione. The RELs should be used as a guideline to indicate when steps should be taken to reduce exposures in the workplace.
These exposure limits and the accompanying recommendations for control of exposures were derived from a risk assessment of flavoring-exposed workers. At an exposure equal to the diacetyl REL, the risk of adverse health effects is low. NIOSH estimated that less than 1 in 1,000 workers exposed to diacetyl levels of 5 parts per billion (ppb) as a time-weighted average (TWA) for 8 hours a day, 40 hours a week for a 45-year working lifetime would develop reduced lung function (defined as forced expiratory volume in one second [FEV1]

Page 3Health Hazard Evaluation Report 2016-0013-3294
below the 5th percentile) as a result of that exposure. NIOSH predicted that around 1 in 10,000 workers exposed to diacetyl at 5 ppb for a 45-year working lifetime would develop more severe lung function reduction (FEV1 below 60% predicted, defined as moderately severe by the American Thoracic Society [Pellegrino et al. 2005]). Workers exposed for less time would be at lower risk for adverse lung effects.
2,3-Hexanedione2,3-Hexanedione is also an alpha-diketone that is sometimes used as a substitute for diacetyl and is produced naturally during coffee roasting. In a study using animals, there was some evidence that 2,3-hexanedione might also damage the lungs, but it appeared to be less toxic than diacetyl and 2,3-pentanedione [Morgan et al. 2016]. There are currently no established recommended exposure limits for 2,3-hexanedione.
Carbon Monoxide and Carbon DioxideCO and CO2 are gases produced by combustion. CO and CO2 are also produced as a result of reactions that take place during coffee roasting and are released during and after roasting and grinding by a process called off-gassing [Anderson et al. 2003]. High exposures to CO and CO2 can cause headache, dizziness, fatigue, nausea, confusion, rapid breathing, impaired consciousness, coma, and death [Newton 2002; Nishimura et al. 2003; Langford 2005; CDC 2013a; Raffel and Thompson 2013; Rose et al. 2017]. Occupational exposure limits for CO and CO2 are listed in Table 1.
Obliterative BronchiolitisObliterative bronchiolitis is a serious, often disabling, lung disease that involves scarring of the very small airways (i.e., bronchioles). Symptoms of this disease may include cough, shortness of breath on exertion, and/or wheeze, that do not typically improve away from work [NIOSH 2012]. Occupational obliterative bronchiolitis has been identified in flavoring manufacturing workers and microwave popcorn workers who worked with flavoring chemicals or butter flavorings [Kreiss 2013; Kim et al. 2010; Kanwal et al. 2006]. Obliterative bronchiolitis has also been identified in employees at a coffee roasting and packaging facility that produced unflavored and flavored coffee [CDC 2013b]. A NIOSH health hazard evaluation at that facility found diacetyl and 2,3-pentanedione concentrations in the air that were concerning and identified three sources: 1) flavoring chemicals added to roasted coffee beans in the flavoring area; 2) grinding unflavored roasted coffee beans and packaging unflavored ground and whole bean roasted coffee in a distinct area of the facility, and 3) storing roasted coffee in hoppers for off-gassing, on a mezzanine above the grinding/packaging process [Duling et al. 2016]. At the time of the previous health hazard evaluation, workers had excess shortness of breath and obstruction on spirometry, both consistent with undiagnosed lung disease. Respiratory illness was associated with exposure and not limited to the flavoring areas [Bailey et al. 2015]. However, all workers who were diagnosed with obliterative bronchiolitis had worked in the flavoring area. To date, no cases of obliterative bronchiolitis have been reported in workers at coffee roasting and packaging facilities that produce only unflavored coffee.

Page 4 Health Hazard Evaluation Report 2016-0013-3294
Work-related AsthmaWork-related asthma refers to asthma that is brought on by (“occupational asthma”) or made worse by (“work-exacerbated asthma” or “work-aggravated asthma”) workplace exposures [Tarlo 2016; Tarlo and Lemiere 2014; OSHA 2014; Henneberger et al. 2011]. Work-related asthma includes asthma due to sensitizers, which cause disease through immune (allergic) mechanisms, and asthma due to irritants, which cause disease through non-immune mechanisms. Symptoms of work-related asthma include episodic shortness of breath, cough, wheeze, and chest tightness. The symptoms may begin early in a work shift, towards the end of a shift, or hours after a shift. They generally, but do not always, improve or remit during periods away from work, such as on weekends or holidays.
Green and roasted coffee dust and castor beans (from cross-contamination of bags used to transport coffee) are known risk factors for occupational asthma [Figley and Rawling 1950; Karr et al. 1978; Zuskin et al. 1979, 1985; Thomas et al. 1991]. Persons who become sensitized (develop an immune reaction) to coffee dust can subsequently react to relatively low concentrations in the air. Others may experience irritant-type symptoms from exposure to coffee dust [Oldenburg et al. 2009].
Process DescriptionIn April and June 2016, the coffee roasting and packaging facility had 29 employees consisting of 13 production and 16 administrative employees. The employees were not represented by a union, and there was no café onsite. The facility was located in a building shared with four other organizations. The coffee company also had four cafés located off site. At the coffee roasting and packaging facility, the production area was approximately 10,000 square feet in size. Roughly 2000 to 3000 pounds of coffee was roasted and packaged per day, and approximately one-third of the coffee produced was ground coffee. The facility received green coffee beans in burlap bags from around the world including, but not limited to, Peru, Indonesia, Nicaragua, Ethiopia, Guatemala, Mexico, and Honduras. Green beans were stored in burlap bags and storage containers along the wall by a Diedrich roaster and packaging area.
To prepare a batch for roasting, a roaster operator poured a desired amount of green coffee beans from the storage containers into a 5-gallon plastic bucket. The contents of the bucket were then dumped into the hopper at their respective roaster. The facility had two roasters. The Primo roaster was capable of roasting 50 pounds of coffee per batch, and the Diedrich could roast 150 pounds of coffee per batch. When ready, the roaster operator dropped the green beans into the roaster. The beans were heated to a specific temperature and for a specific time period for the desired roast. Time and temperature varied between different types of roasts. On average, roasts lasted 14-16 minutes. Occasionally, the roaster operator would pull a small sample of beans from the roaster to check the color and smell of the beans. At the end of each cycle, the roaster operator emptied the roasted beans into a cooling bin where they were agitated by a rotating arm. The cooling bins at both roasters utilized a downdraft exhaust system that pulled air downward past the roasted beans to accelerate
Page 5Health Hazard Evaluation Report 2016-0013-3294
cooling. The downdraft system exhausted through the roaster and then to the outside through a ventilation duct. The roaster operator monitored the roasting equipment throughout the roasting and cooling process. After cooling, the roasted beans were dispensed from the cooling bin of the Primo roaster into approximately 30-gallon plastic containers with lids. At the Diedrich roaster, the cooled beans were pulled by a siphon system through a destoner and then dispensed into a large plastic bin. The roaster operator then manually moved the plastic containers to a storage area, adjacent to the two roasters and packaging areas, until needed for further processing, including grinding and packaging. A quality control technician periodically brewed roasted coffee in a separate quality control room to assess product quality and taste.
In the packaging area, orders were completed using the new or old weigh-fill machines to measure out either 12 ounces or 5 pounds of beans. All bags were manually packaged and were equipped with one-way valves for off-gassing. Whole beans were packaged using the old weigh-fill machine. Whole beans and ground coffee were packaged using the new weigh-fill machine. For ground coffee, an employee took roasted whole beans to the grinding area, manually emptied the coffee beans into a grinder, and then placed the packages at the bottom of the grinder to collect the ground coffee. The facility had two Ditting KR 1403 grinders capable of grinding 5 pounds of coffee per batch. A MPE GPX-WCI grinder was capable of grinding 40 pounds of coffee per batch. After packaging, bags of coffee were stored on open shelves and racks adjacent to the packaging area. Occasionally, coffee with faulty packaging was reworked, where the coffee was dumped from the faulty package and manually redirected into the packaging process for repackaging.
Every six weeks, the roasters were cleaned; accumulated chaff was removed and the exhaust lines from the roasters were cleaned. All employees helped disassemble the roasters and manually knock and scrape off the chaff from inside of the roaster and associated exhaust lines.
A kitchen (breakroom) area and a small office were also located in the production floor. Administrative offices were located in two separate locations in the same building.
Personal Protective Equipment Employees were not required to wear a company uniform or protective clothing. We observed one or more employees wearing an N95 disposable filtering-facepiece respirator while working with green coffee beans during our survey.
MethodsWe initially visited the coffee roasting and packaging facility in April 2016. We held an opening meeting with management and an employee representative, collected bulk samples and air samples, and performed a ventilation assessment. At the conclusion of our site visit, we held a closing meeting with management and employees. We visited the facility again in June 2016 for a medical survey.

Page 6 Health Hazard Evaluation Report 2016-0013-3294
We had the following objectives for the health hazard evaluation:1. Measure employees’ exposure to diacetyl, 2,3-pentanedione, and 2,3-hexanedione
during coffee roasting and packaging;
2. Identify process areas or work tasks associated with emission of diacetyl, 2,3-pentanedione, and 2,3-hexanedione;
3. Measure levels of CO and CO2 in different areas of the facility;
4. Assess the ventilation systems and the ventilation systems’ effect on exposure levels;
5. Determine if employees had mucous membrane, respiratory, or systemic symptoms and the proportion of those symptoms that were work-related or aggravated by work;
6. Determine if employees had abnormal lung function tests;
7. Compare employees’ prevalence of lower respiratory symptoms and healthcare provider-diagnosed asthma to expected levels based on general population values.
Industrial Hygiene SurveySampling Times for Alpha-Diketones We designed the sampling strategy to assess full-shift exposures and to identify tasks and processes that were the greatest contributors to worker exposure to alpha-diketones. For diacetyl, 2,3-pentanedione, and 2,3-hexanedione, air samples were collected over seconds, minutes, and hours. Samples collected over hours can help determine average concentrations that can be compared to the NIOSH RELs for diacetyl and 2,3-pentanedione. These average concentrations might not tell us about short-term peak exposures that could be relevant to respiratory health, particularly when tasks are repeated multiple times per day. Therefore, during particular tasks, we collected air samples over several minutes. We also conducted instantaneous sampling over seconds to help identify point sources of alpha-diketones.
Air Sampling and Analysis Using Modified Occupational Safety and Health (OSHA) Methods 1013/1016We collected personal and area air samples for diacetyl, 2,3-pentanedione, and 2,3-hexanedione on silica gel sorbent tubes during our industrial hygiene survey. The samples were collected and analyzed according to the modified OSHA sampling and analytical Methods 1013/1016 [OSHA 2008; OSHA 2010; LeBouf and Simmons 2017]. In accordance with the two methods, two glass silica gel sorbent tubes were connected by a piece of tubing and inserted into a protective, light-blocking cover. The tubes were connected in series to a sampling pump pulling air through the tubes at a flow rate of 50 milliliters per minute (mL/min). The sampling setup was attached to an employee’s breathing zone or placed in an area basket in various places throughout the facility. For full-shift sampling, we collected two consecutive 3-hour samples and calculated the time-weighted average (TWA) concentration from the two samples, assuming that the total 6-hour monitoring results reflected a full work shift (8-hour) TWA exposure. Although this may introduce some error, it is a conservative approach that is more protective of employees than the alternative assumption of no exposure during the last two hours of the shift. We refer to these samples as “full-shift samples”
Page 7Health Hazard Evaluation Report 2016-0013-3294
throughout this report. We also collected short-term task based samples in the same manner, but the sampling pump flow rate was 200 mL/min as detailed in OSHA Methods 1013 and 1016 [OSHA 2008; 2010]. Sampling times were dependent on the duration of the task being performed.
Analyses of the samples were performed in the NIOSH Respiratory Health Division’s Organics Laboratory. The samples were extracted for one hour in 95% ethanol:5% water containing 3-pentanone as an internal standard. Samples were analyzed using an Agilent 7890/7001 gas chromatograph/mass spectrometer system operated in selected ion monitoring mode for increased sensitivity compared to the traditional flame ionization detector used in OSHA Methods 1013 and 1016 [LeBouf and Simmons 2017].
A limit of detection (LOD) is the lowest mass that an instrument can measure above background and is a criteria used to determine whether to report a result from a sample. The limit of quantitation (LOQ) is the lowest mass that can be reported with precision; we have a greater confidence in the reported result if it is above the LOQ. The LODs were 0.01 micrograms per sample (µg/sample) for diacetyl, 2,3-pentanedione, and 2,3-hexanedione. These equate to 0.3 parts per billion (ppb) for diacetyl, 0.2 ppb for 2,3-pentanedione, and 0.2 ppb for 2,3-hexanedione for a typical full-shift TWA air sample but will vary depending on the volume of air collected during the sampling period. The LODs for task samples are generally higher than typical LOD values for full-shift samples since the air volumes collected during task samples are lower. When the values presented in the report are from samples below the LOD they are denoted by a “<” symbol. The LOQs equate to 1.1 ppb for diacetyl, 0.90 ppb for 2,3-pentanedione, and 0.79 ppb for 2,3-hexanedione for a typical full-shift air sample.
Air Sampling and Analysis Using Evacuated CanistersWe collected area full-shift air samples and instantaneous task-based and source air samples for VOCs including diacetyl, 2,3-pentanedione, and 2,3-hexanedione using evacuated canisters. We also collected instantaneous air samples before and after the work shift to determine if air concentrations of alpha-diketones increased over a work shift. The evacuated canister sampling setup consisted of a 450-mL evacuated canister equipped an instantaneous flow controller that was designed for a short sampling duration (less than 30 seconds). Instantaneous samples were taken by opening the evacuated canister to grab a sample of air to help identify point sources of alpha-diketones. For task-based air samples, a NIOSH employee placed the inlet of the flow controller by the employee’s personal breathing zone as they performed their work task to replicate exposure. For source air samples, a NIOSH employee placed the inlet of the flow control directly at the source of interest.
The canister air samples were analyzed using a pre-concentrator/gas chromatograph/mass spectrometer system pursuant to a published method validation study [LeBouf et al. 2012], with the following modifications: the pre-concentrator was a Model 7200 (Entech Instruments, Inc., Simi Valley, CA), and six additional compounds, diacetyl, 2,3-pentanedione, and 2,3-hexanedione, acetaldehyde, acetonitrile, and styrene, were included. At present, this canister method is partially validated [LeBouf et al. 2012] and

Page 8 Health Hazard Evaluation Report 2016-0013-3294
not considered the standard method. The LODs were 0.78 ppb for diacetyl, 1.08 ppb for 2,3-pentanedione, and 1.92 ppb for 2,3-hexanedione based on a three-times dilution factor. However, LODs are dependent on the pressure inside each canister after the samples have been collected, and they may be higher or lower than typical LOD values.
Bulk Sampling and Headspace AnalysisWe used 50-mL sterile polypropylene centrifuge tubes to collect approximately 40-mL bulk samples of roasted coffees (whole bean and ground). For headspace analysis of alpha-diketones, we transferred 1 gram of solid bulk material into a sealed 40-mL amber volatile organic analysis vial and let it rest for 24 hours at room temperature (70°F) in the laboratory. Then 2 mL of headspace air was transferred to a 450-mL canister and pressurized to approximately 1.5 times atmospheric pressure. Using the canister analysis system, the concentrations were calculated in ppb of analytes in the headspace as an indicator of emission potential. Real-time (Continuous) Air SamplingWe used RAE Systems (San Jose, CA) ppbRAE 3000 (Model #PGM-7340) monitors to measure concentrations of total VOCs in the air. The ppbRAE has a non-specific photoionization detector that responds to chemicals with ionization potentials below the energy of the lamp. This sampling was conducted to identify areas where coffee could be releasing total VOCs. Areas where higher concentrations of total VOCs are measured help indicate areas where sampling to characterize specific exposures to alpha-diketones may be necessary. We also collected real-time measurements of CO2, CO, temperature, and relative humidity (RH) using TSI Incorporated (Shoreview, MN) VelociCalc Model 9555-X Multi-Function Ventilation Meters equipped with Model 982 IAQ probes.
Exposure LimitsWe utilize mandatory (legally enforceable) and recommended occupational exposure limits (OELs) when evaluating workplace hazards. OELs have been developed by federal agencies and safety and health organizations to prevent adverse health effects from workplace exposures.
Occupational Safety and Health Administration (OSHA)The U.S. Department of Labor’s OSHA permissible exposure limits (PELs) are legal limits that are enforceable in workplaces covered under the Occupational Safety and Health Act. OSHA PELs represent the legal maximum for a TWA exposure to a physical or chemical agent over a work shift [OSHA 2016]. OSHA short-term exposure limits (STELs) are the legal maximum average exposure for a 15-minute time period. Some chemicals also have an OSHA ceiling value which represent levels that must not be exceeded at any time. Currently, there are no PELs for diacetyl, 2,3-pentanedione, or 2,3-hexanedione. For substances for which an OSHA PEL has not been issued, violation of the OSHA General Duty Clause can be considered using available occupational exposure references and recommendations [OSHA 1993; OSHA 2003], such as the American Conference of Governmental Industrial Hygienists (ACGIH®) TLVs® and NIOSH RELs.

Page 9Health Hazard Evaluation Report 2016-0013-3294
American Conference of Governmental Industrial Hygienists (ACGIH®) ACGIH® is a professional, not-for-profit scientific association that reviews existing published, peer-reviewed scientific literature and publishes recommendations for levels of substances in air based on an 8-hour workday and 40-hour workweek. These recommendations are called threshold limit values (TLVs®) [ACGIH® 2016]. ACGIH® TLVs® are not standards; they are health-based guidelines derived from scientific and toxicological information. ACGIH® provides TLV®-TWA guidelines that are levels that should not be exceeded during any 8-hour workday of a 40-hour workweek. ACGIH® also provides TLV®-STEL guidelines which are 15-minute exposure levels that should not be exceeded during a workday. Exposures above the TLV®-TWA but less than the TLV®-STEL should be (1) less than 15 minutes, (2) occur no more than four times a day, and (3) be at least 60 minutes between exposures [ACGIH® 2016]. Additionally, ACGIH® provides TLV®-Ceiling values which are levels that should not be exceeded at any time during a work shift. The ACGIH® TLV®-TWA for diacetyl is 10 ppb. The TLV®-STEL for diacetyl is 20 ppb. Currently, there is no TLV®-TWA or TLV®-STEL for 2,3-pentanedione. ACGIH® has placed 2,3-pentanedione on the 2017 list of Chemical Substances and Other Issues Under Study [ACGIH® 2017].
National Institute for Occupational Safety and Health (NIOSH)NIOSH provides RELs as TWA concentrations that should not be exceeded over an 8 or 10-hour work shift, during a 40-hour workweek. [NIOSH 2010]. NIOSH also provides STELs which are 15-minute TWA exposures that should not be exceeded at any time during a workday [NIOSH 2010]. Some chemicals have ceiling values which are concentrations that should not be exceeded at any time [NIOSH 2010]. For some chemicals, NIOSH has established an Immediately Dangerous to Life or Health (IDLH) value. An IDLH value is a concentration of an air contaminant that can cause death or immediate or delayed permanent adverse health effects, or prevent escape from such an environment. Currently, NIOSH has RELs and STELs for diacetyl and 2,3-pentanedione. NIOSH does not have a REL or a STEL for 2,3-hexanedione. NIOSH does not have ceiling limits or IDLH values for diacetyl, 2,3-pentanedione, or 2,3-hexanedione.
For diacetyl and 2,3-pentanedione, the NIOSH RELs are 5.0 ppb and 9.3 ppb, respectively, as a TWA for up to an 8-hour workday during a 40-hour workweek (Table 1). The NIOSH STELs are 25 ppb for diacetyl and 31 ppb for 2,3-pentanedione [NIOSH 2016]. The NIOSH exposure limits do not differentiate between natural and synthetic chemical origin of diacetyl or 2,3-pentanedione. Although the NIOSH exposure limit for 2,3-pentanedione is above that of diacetyl, 2,3-pentanedione has been shown to be as hazardous as diacetyl [Hubbs et al. 2012; Morgan et al. 2012]. The hazard potential probably increases when these chemicals occur in combination with each other; having exposure to chemicals with the same functional alpha-diketone group and effect on the same system or organ (e.g., lungs) can result in additive effects [ACGIH® 2016]. The NIOSH REL is higher for 2,3-pentanedione than for diacetyl largely because analytic measures were not available in a validated OSHA method to detect 2,3-pentanedione at lower levels. In addition to the REL, NIOSH also recommends an action level for diacetyl of 2.6 ppb to be used with exposure monitoring in an effort to ensure employee exposures are routinely below the diacetyl REL. When exposures exceed the action level, employers should take corrective action (i.e., determine the source of exposure,

Page 10 Health Hazard Evaluation Report 2016-0013-3294
identify methods for controlling exposure) to ensure that exposures are maintained below the NIOSH REL for diacetyl [NIOSH 2016].
Table 1. Exposure limits for compounds sampled during the NIOSH survey, April 2016.
CompoundOSHA* ACGIH® NIOSH
PEL TLV® STEL REL STEL IDLH
Diacetyl - 10 ppb 20 ppb 5 ppb† 25 ppb -
2,3-Pentanedione - - - 9.3 ppb† 31 ppb -
2,3-Hexanedione - - - - - -
Carbon dioxide 5,000 ppm 5,000 ppm 30,000 ppm 5,000 ppm 30,000 ppm 40,000 ppm
Carbon monoxide§ 50 ppm 25 ppm - 35 ppm 200 ppm (ceiling limit)¶ 1,200 ppm
Note: OSHA=Occupational Safety and Health Administration; ACGIH® =American Conference of Governmental Industrial Hygienist; NIOSH=National Institute for Occupational Safety and Health; PEL=permissible exposure limit; STEL=short-term exposure limit; TLV® =threshold limit value; REL=recommended exposure limit; IDLH=immediately dangerous to life or health; mg/m3=milligram per cubic meter; ppb=parts per billion; ppm=parts per million; “-“=no exposure limit available.*There are no OSHA STELs for the compounds in the table.†The NIOSH RELs for diacetyl and 2,3-pentanedione are time-weighted averages for up to an 8-hourday, during a 40-hour workweek.§OSHA and NIOSH limits are designed for occupational exposure measurements in manufacturing andother trades that have potential sources of carbon dioxide or carbon monoxide (e.g., coffee roasting,welding, vehicle exhaust, diesel engine exhaust). Typical levels of carbon monoxide in offices are 0–5 ppm.In office settings, carbon dioxide generally should not be greater than 700 ppm above outdoor carbondioxide levels; this typically corresponds to indoor concentrations below 1200 ppm.¶This is the NIOSH ceiling exposure limit for carbon monoxide. A ceiling concentration should not beexceeded at any time.
Ventilation AssessmentOn April 7, 2016, we did a visual and physical assessment of all ventilation components at the facility. Physical measurements of the facility were taken with a Model DISTO E7100i laser-tape measure (Leica Geosystems AG, Heerbrugg, Switzerland). Ventilation measurements in the production space were taken using a Model EBT731 Balometer Air Balancing Instrument (Alnor Products, TSI Incorporated, Shoreview, MN). The make, model, and other key information on the air-handling unit (AHU) supplying air to the production space was also collected.
NIOSH Medical SurveyParticipants We invited all current employees to participate in the medical survey at the workplace on June 9-10, 2016. Participation was voluntary; written informed consent was obtained from each participant before testing. The survey included, in the order performed, a medical and work history questionnaire, quantification of exhaled nitric oxide, impulse oscillometry, spirometry, and if indicated the administration of a bronchodilator with repeat impulse oscillometry and spirometry. We mailed participants their individual reports explaining their breathing test results and recommended each participant provide the information to their

Page 11Health Hazard Evaluation Report 2016-0013-3294
personal physician.
Questionnaire We used an interviewer-administered computerized questionnaire to ascertain symptoms and diagnoses, work history at this coffee roasting and packaging facility and other coffee or flavoring companies, and cigarette smoking history. Questions on respiratory health were derived from five standardized questionnaires, the European Community Respiratory Health Survey [Burney et al. 1994; ECRHS 2014], the American Thoracic Society adult respiratory questionnaire (ATS-DLD-78) [Ferris 1978], the International Union Against Tuberculosis and Lung Disease [Burney and Chinn 1987; Burney et al. 1989], and the Third National Health and Nutrition Examination Survey (NHANES III) [CDC 1996] and NHANES 2007-2012 questionnaires [CDC 2017a]. Some of the questions appeared on more than one of the standardized questionnaires. We also supplemented our questionnaire with additional respiratory and systemic symptom questions.
Spirometry The purpose of the spirometry test was to determine a person’s ability to move air out of their lungs. Test results were compared to expected normal values. The test included the three measurements or calculations: 1) forced vital capacity (FVC), (the total amount of air the participant can forcefully blow out after taking a deep breath), 2) FEV1 (the amount of air that the participant can blow out in the first second of exhaling), and 4) the ratio of FEV1 to FVC. We used American Thoracic Society criteria for acceptability and repeatability [Miller et al. 2005].
We used a volume spirometer (dry rolling seal spirometer) to measure exhaled air volume and flow rates. We used equations for predicted values and lower limits of normal derived from NHANES III data to define abnormal spirometry [Hankinson et al. 1999]. We defined obstruction as an FEV1/FVC ratio less than the lower limit of normal with FEV1 less than the lower limit of normal; restriction as a normal FEV1/FVC ratio with FVC less than the lower limit of normal; and mixed obstruction and restriction as having FEV1, FVC, and FEV1/FVC ratio all less than the lower limit of normal. We used the FEV1 percent predicted to categorize such abnormalities as mild, moderate, moderately severe, severe, or very severe [Pellegrino et al. 2005].
Impulse OscillometryMany occupational lung diseases (e.g., chronic obstructive pulmonary disease (COPD), asthma) involve the small airways; however, this part of the lung is difficult to evaluate non-invasively. Oscillometry is a helpful technology to understand the effects of occupational exposures on the small airways. There are no contraindications to the test as this test is conducted using regular breathing and does not require a forceful exhalation [Smith et al. 2005]. Spirometry can be normal despite respiratory symptoms or evidence of small airways disease on lung biopsy [King et al. 2011; Oppenheimer et al. 2007]; therefore, oscillometry results complement spirometry and can be used when spirometry is not possible because of a contraindication.

Page 12 Health Hazard Evaluation Report 2016-0013-3294
We used an impulse oscillometry machine (CareFusion Corp., San Diego, CA) to measure resistance (R), the energy required to propagate the pressure wave through the airways, and reactance (X), which reflects the viscoelastic properties of the respiratory system. The impulse oscillometry testing machine sends sound waves called pressure oscillations at different frequencies (e.g., 5 Hertz and 20 Hertz) into the airways to measure how airways respond to these small pressures. The test calculates 1) the airway resistance at different frequencies including 5 Hertz (R5) and 20 Hertz (R20), and the difference between R5 and R20 (DR5-R20); 2) the reactance at different frequencies including 5 Hertz (X5); 3) resonance frequency (Fres) which is the frequency where there is no airway reactance; and 4) the total reactance (AX) at all frequencies between 5 Hertz and the Fres. The predicted values for R and X were based on sex and age according to reference values recommended by the manufacturer [Vogel and Smidt 1994]. R5 was considered abnormal (elevated) if the measured value was equal to or greater than 140 percent of the predicted R5. X5 was considered abnormal (decreased) if the value of the predicted X5 minus measured X5 was equal to or greater than 0.15 kilopascals per liter per second (kPa/(L/s)) DR5-R20 values greater than 30% were considered abnormal and evidence of frequency dependence [Smith HJ 2015]. We interpreted the test as normal if both the R5 and X5 were normal [Smith HJ 2015]. We defined possible large (central) airways abnormality as a normal X5 and elevated R5 with no evidence of frequency dependence. We defined a possible small airways abnormality if there was evidence of frequency dependence and/or a decreased X5 with or without an elevated R5. We defined possible combined small (peripheral) and large (central airways) abnormality as a decreased X5 and elevated R5 with no evidence of frequency dependence.
Bronchodilator Reversibility Testing for Impulse Oscillometry and SpirometryIf a participant had abnormal impulse oscillometry or spirometry, we repeated both tests after the participant received a bronchodilator inhaler medication (i.e., albuterol), which can open the airways in some individuals (e.g., asthmatics). For oscillometry, we defined reversibility (improvement) after bronchodilator administration as a decrease of at least 20% of either Fres or R5 or a decrease of 40% for AX. For spirometry, we defined reversibility (improvement) as increases of at least 12% and 200 mL for either FEV1 or FVC after bronchodilator administration. Fractional Exhaled Nitric Oxide (FeNO) We used the NIOX MINO® device (Aerocrine Inc., Morrisville, NC) to measure the amount of nitric oxide in the air the participant breathed out. Nitric oxide is a gas that is produced by the airways, and elevated levels can be a sign of eosinophilic airway inflammation in asthma [Dweik et al. 2011]. In adults, fractional nitric oxide concentration in exhaled breath levels above 50 ppb are considered elevated. In adults with asthma, elevated levels may indicate that their asthma is uncontrolled [Dweik et al. 2011].
Statistical Analysis Industrial Hygiene Survey and Ventilation AssessmentWe performed analyses using Excel (Microsoft®, Redmond, WA) and SAS version 9.3 (SAS Institute, Cary, NC). We created summary statistics by work area, job title, and task. When
Page 13Health Hazard Evaluation Report 2016-0013-3294
the values presented in the report are from samples below the LOD they are denoted by a “<” symbol.
Medical SurveyWe calculated frequencies and standardized morbidity ratios (SMRs) and their associated 95% confidence intervals (CI) using SAS version 9.3 (Cary, NC). The SMRs compare prevalences of symptoms and diagnoses among participants to expected prevalences of a sample of the general population reflected in the NHANES III (1988–1994) or NHANES 2007–2012 adjusting for sex, race/ethnicity, age (less than 40 years old or 40 years or greater), and cigarette smoking categories (ever/never). For comparisons to the US population, we used the most recent NHANES survey available for the specific comparisons. The small number of participants limits the conclusions that can be drawn from these analyses. Nonetheless, we report these results to provide some context for how commonly these symptoms and diagnoses are reported by adults in the general population.
ResultsAll results tables are located in Appendix A.
Industrial Hygiene Survey Personal and Area Full-shift Air Sampling Results Personal and area full-shift air sampling results using OSHA Method 1013/1016 can be seen in Table A1. We collected 27 personal and 35 area full-shift air samples. Sixteen personal air samples collected on employees with primary job duties on the production floor were above the NIOSH REL for diacetyl of 5 ppb. Employees with personal air samples above the NIOSH REL for diacetyl perform various tasks including roasting, grinding, and packaging. Seven personal air samples collected on employees with primary duties in the office areas were below the NIOSH REL for diacetyl. No personal air samples were above the NIOSH REL for 2,3-pentanedione of 9.3 ppb.
Twenty-two area full-shift air samples were above the NIOSH REL for diacetyl. Because area air samples are not personal air samples collected directly on an employee, the NIOSH RELs are not directly applicable to the results for exposure monitoring purposes. However, area air samples can highlight areas with higher exposure risk and the RELs can be used as points of reference. The following areas had 6-hour air levels that exceeded the NIOSH REL for diacetyl: Diedrich roaster (5.3 ppb - 7.7 ppb), Primo roaster (6.7 ppb – 12 ppb), main grinders (17 ppb – 51 ppb), new weigh-fill machine (9.7ppb -18 ppb), old weigh-fill machine (5.9 ppb - 6.8 ppb), finished product storage (6.7 ppb – 11 ppb), break room (5.5 ppb – 6.1 ppb), and rework (5.1 ppb – 5.2 ppb). The highest full-shift average area samples for diacetyl and 2,3-pentanedione were measured near the grinders and the new weigh/fill machine.
The area near the main grinders consistently had the highest level of diacetyl each day. For the three days on which we collected samples, full-shift air levels of diacetyl at the main grinders were 17 ppb, 20 ppb, and 51 ppb, respectively. The second highest levels of diacetyl

Page 14 Health Hazard Evaluation Report 2016-0013-3294
were consistently observed at the new weigh-fill machine. Full-shift air levels of diacetyl at the new weigh-fill machine were 9.7 ppb, 18 ppb, and 14 ppb, respectively. Three full-shift area air samples near the main grinders (9.7 ppb, 12.1 ppb, 27 ppb) were above the NIOSH REL for 2,3-pentanedione.
Task-Based Air Sampling ResultsPersonal task air concentration results can be seen in Tables A2 and A3. We collected 58 personal task air samples using OSHA Method 1013/1016. Task duration ranged from 3 minutes to 86 minutes, with a median of 17 minutes. We collected personal task air samples while employees roasted coffee (n = 38), ground coffee (n = 9), packaged coffee (n = 10), and cleaned chaff from the roaster (n = 1). The highest exposures to diacetyl (375 ppb) and 2,3-pentanedione (219 ppb) were measured while an employee was grinding coffee (Tables A2). For task samples collected while employees packaged coffee, the highest exposures to diacetyl (29.7 ppb) and 2,3-pentanedione (20.9 ppb) were observed while an employee packaged ground coffee. The highest exposures to diacetyl and 2,3-pentanedione while employees roasted coffee were 13.2 ppb and 6.2 ppb, respectively. Diacetyl and 2,3-pentanedione air concentrations measured when an employee cleaned chaff from the roaster while the roaster was not operating were 14.4 ppb and 9.2 ppb, respectively.
All five fifteen-minute samples collected while employees ground coffee exceeded the NIOSH STEL of 25 ppb for diacetyl (exposures ranged from 27.4 ppb – 375.4 ppb). One 15-minute sample collected while an employee ground coffee (219.2 ppb) was above the NIOSH STEL of 31 ppb for 2,3-pentanedione. None of the 15-minute samples (N=11) collected while employees packaged or roasted coffee exceeded the NIOSH STELs for diacetyl or 2,3-pentanedione.
We collected nine personal samples near the breathing zone of employees using instantaneous canisters (Table A3). Levels of diacetyl and 2,3-pentanedione observed in the breathing zone of employees using instantaneous canisters were much lower than the levels described above. Instantaneous samples taken at the breathing zone of employees while they ground coffee were 19 ppb to 28.3 ppb for diacetyl, and 10.3 ppb to10.9 ppb for 2,3-pentanedione. A breathing zone sample taken while an employee dumped roasted beans from the storage bin into the hopper had a diacetyl concentration of 24.4 ppb and a 2,3-pentanedione concentration of 9.4 ppb. Instantaneous samples collected at the breathing zone of an employee while they hand blended roasted beans ranged from 6.6 ppb to 25.2 ppb for diacetyl and 3.4 ppb to 6.0 for 2,3-pentanedione.
Source Air Sampling ResultsInstantaneous evacuated canister concentrations for diacetyl and 2,3-pentanedione can be seen in Table A4. Instantaneous samples were less than 30 seconds in duration. We collected 32 source samples using evacuated canisters.
The highest instantaneous source sample for diacetyl (20,574 ppb), and 2,3-pentanedione (9910 ppb) was measured at the main grinders, while an employee ground 5 pound bags of roasted coffee. All instantaneous samples taken near the main grinders had diacetyl levels
Page 15Health Hazard Evaluation Report 2016-0013-3294
greater than 100 ppb and 2,3-pentanedione levels greater than 35 ppb. The second highest diacetyl and 2,3-pentanedione air concentrations were observed in an air sample taken in the finished product storage area, near French roast bags. The instantaneous sample taken in the finished product storage had a diacetyl concentration of 4322 ppb and a 2,3-pentanedione concentration of 1389 ppb.
Beginning and End of Day Air Sampling We collected instantaneous samples using evacuated canisters at the end of the production shift on April 6, 2016, and the beginning of production on April 7. Both samples were taken in the center of the production floor. The beginning of day diacetyl air concentration was 6.5 ppb and the 2,3-pentanedione air concentration was 2.5 ppb. The end of day diacetyl air concentration was 22.9 ppb and the 2,3-pentanedione air concentration was 22.1 ppb.
Bulk Samples and Headspace ResultsHeadspace results of diacetyl and 2,3-pentanedione for the bulk samples of roasted coffee beans can be seen in Table A5. The highest air concentration of diacetyl (9216 ppb) was observed in the headspace of French Roast beans that had been roasted in the Diedrich Roaster. The highest air concentration of 2,3-pentanedione (6853 ppb) was observed in the headspace of decaffeinated beans that had been roasted in the Diedrich Roaster.
Real-time Monitoring: Carbon Dioxide (CO2 ), Carbon Monoxide (CO), and Total Volatile Organic Compounds (VOCs)The real-time total VOCs, CO, and CO2, monitoring results near the roasters on April 5, 2016 can be seen in Figures 1 through 6. Total VOC levels increased steadily in the morning while roasting was occurring, at both roasters. Peak levels of total VOCs and CO were much higher at the Primo roaster than at the Diedrich roaster. A peak total VOC level of 2561 ppm was observed at the Primo roaster (11:55am); whereas, the peak total VOC level observed at the Diedrich roaster was 1126 ppm (12:38pm). A maximum concentration of 62.5 ppm CO was observed at the Primo roaster (3:03pm); whereas, the CO maximum at the Diedrich roaster was 8.8 ppm (12:38pm). The average CO levels observed at the Primo and Diedrich roaster were 5.8 ppm and 1.7 ppm, respectively. The average CO2 levels observed at the Primo and Diedrich roaster were 660 ppm and 640 ppm, respectively.
We noted that the Primo roaster was in close proximity to the main grinders. Although we did not have a log of each time the grinders were used, we did observe that the main grinders near the Primo roaster were in use at 11:28 a.m.; this roughly corresponds with a peak of total VOCs and CO observed at the roaster at that time.

Page 16 Health Hazard Evaluation Report 2016-0013-3294
0
500
1000
1500
2000
2500
3000
9:25
AM
9:45
AM
10:0
5 AM
10:2
5 AM
10:4
5 AM
11:0
5 AM
11:2
5 AM
11:4
5 AM
12:0
5 PM
12:2
5 PM
12:4
5 PM
1:05
PM
1:25
PM
1:45
PM
2:05
PM
2:25
PM
2:45
PM
3:05
PM
3:25
PM
Tota
l VO
Cs
(ppb
)
Figure 1. Real-time monitoring results of total VOC concentrations near the Primo Roaster, NIOSH survey, April 5, 2016.
Figure 2. Real-time monitoring results of total VOC concentrations near the Diedrich Roaster, NIOSH survey, April 5, 2016.
0
500
1000
1500
2000
2500
3000
9:25
AM
9:45
AM
10:0
5 AM
10:2
5 AM
10:4
5 AM
11:0
5 AM
11:2
5 AM
11:4
5 AM
12:0
5 PM
12:2
5 PM
12:4
5 PM
1:05
PM
1:25
PM
1:45
PM
2:05
PM
2:25
PM
2:45
PM
3:05
PM
3:25
PM
Tota
l VO
Cs
(ppb
)

Page 17Health Hazard Evaluation Report 2016-0013-3294
0
10
20
30
40
50
60
70
10:1
9 AM
10:3
9 AM
10:5
9 AM
11:1
9 AM
11:3
9 AM
11:5
9 AM
12:1
9 PM
12:3
9 PM
12:5
9 PM
1:19
PM
1:39
PM
1:59
PM
2:19
PM
2:39
PM
2:59
PM
3:19
PM
CO
(ppm
)
Figure 3. Real-time monitoring results of CO concentrations near the Primo Roaster, NIOSH survey, April 5, 2016.
0
10
20
30
40
50
60
70
10:1
9 AM
10:3
9 AM
10:5
9 AM
11:1
9 AM
11:3
9 AM
11:5
9 AM
12:1
9 PM
12:3
9 PM
12:5
9 PM
1:19
PM
1:39
PM
1:59
PM
2:19
PM
2:39
PM
2:59
PM
3:19
PM
CO
(ppm
)
Figure 4. Real-time monitoring results of CO concentrations near the Diedrich Roaster, NIOSH survey, April 5, 2016.

Page 18 Health Hazard Evaluation Report 2016-0013-3294
0
200
400
600
800
1000
1200
10:1
9 AM
10:3
9 AM
10:5
9 AM
11:1
9 AM
11:3
9 AM
11:5
9 AM
12:1
9 PM
12:3
9 PM
12:5
9 PM
1:19
PM
1:39
PM
1:59
PM
2:19
PM
2:39
PM
2:59
PM
3:19
PM
CO
2(p
pm)
Figure 5. Real-time monitoring results of CO2 concentrations near the Primo Roaster, NIOSH survey, April 5, 2016.
0
200
400
600
800
1000
1200
10:1
9 AM
10:3
9 AM
10:5
9 AM
11:1
9 AM
11:3
9 AM
11:5
9 AM
12:1
9 PM
12:3
9 PM
12:5
9 PM
1:19
PM
1:39
PM
1:59
PM
2:19
PM
2:39
PM
2:59
PM
3:19
PM
CO
2(p
pm)
Figure 6. Real-time monitoring results of CO2 concentrations near the Diedrich Roaster, NIOSH survey, April 5, 2016.
Page 19Health Hazard Evaluation Report 2016-0013-3294
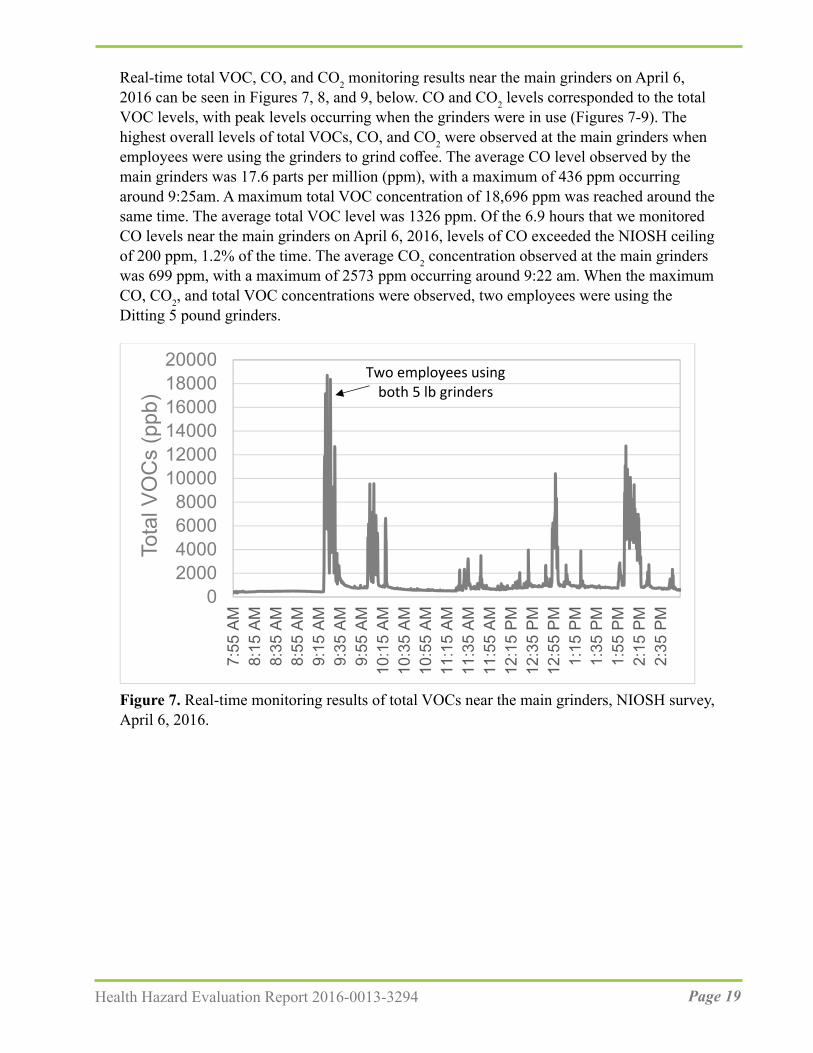
Real-time total VOC, CO, and CO2 monitoring results near the main grinders on April 6, 2016 can be seen in Figures 7, 8, and 9, below. CO and CO2 levels corresponded to the total VOC levels, with peak levels occurring when the grinders were in use (Figures 7-9). The highest overall levels of total VOCs, CO, and CO2 were observed at the main grinders when employees were using the grinders to grind coffee. The average CO level observed by the main grinders was 17.6 parts per million (ppm), with a maximum of 436 ppm occurring around 9:25am. A maximum total VOC concentration of 18,696 ppm was reached around the same time. The average total VOC level was 1326 ppm. Of the 6.9 hours that we monitored CO levels near the main grinders on April 6, 2016, levels of CO exceeded the NIOSH ceiling of 200 ppm, 1.2% of the time. The average CO2 concentration observed at the main grinders was 699 ppm, with a maximum of 2573 ppm occurring around 9:22 am. When the maximum CO, CO2, and total VOC concentrations were observed, two employees were using the Ditting 5 pound grinders.
02000400060008000
100001200014000160001800020000
7:55
AM
8:15
AM
8:35
AM
8:55
AM
9:15
AM
9:35
AM
9:55
AM
10:1
5 AM
10:3
5 AM
10:5
5 AM
11:1
5 AM
11:3
5 AM
11:5
5 AM
12:1
5 PM
12:3
5 PM
12:5
5 PM
1:15
PM
1:35
PM
1:55
PM
2:15
PM
2:35
PM
Tota
l VO
Cs
(ppb
)
Two employees using both 5 lb grinders
Figure 7. Real-time monitoring results of total VOCs near the main grinders, NIOSH survey, April 6, 2016.

Page 20 Health Hazard Evaluation Report 2016-0013-3294
050
100150200250300350400450500
7:55
AM
8:15
AM
8:35
AM
8:55
AM
9:15
AM
9:35
AM
9:55
AM
10:1
5 AM
10:3
5 AM
10:5
5 AM
11:1
5 AM
11:3
5 AM
11:5
5 AM
12:1
5 PM
12:3
5 PM
12:5
5 PM
1:15
PM
1:35
PM
1:55
PM
2:15
PM
2:35
PM
CO
(ppm
)Two employees using both 5 lb grinders
Figure 8. Real-time monitoring results of CO near the main grinders, NIOSH survey, April 6, 2016.
0
500
1000
1500
2000
2500
3000
7:58
AM
8:18
AM
8:38
AM
8:58
AM
9:18
AM
9:38
AM
9:58
AM
10:1
8 AM
10:3
8 AM
10:5
8 AM
11:1
8 AM
11:3
8 AM
11:5
8 AM
12:1
8 PM
12:3
8 PM
12:5
8 PM
1:18
PM
1:38
PM
1:58
PM
2:18
PM
2:38
PM
CO
2(p
pm)
Two employees using both 5 lb grinders
Figure 9. Real-time monitoring results for CO2 air levels near the main grinders, NIOSH survey, April 6, 2016.
Levels of total VOCs, CO, and CO2 observed at the new weigh-fill machine on April 6, 2016 can be seen in Figures 10, 11, and 12. Peak total VOC and CO concentrations were reached

Page 21Health Hazard Evaluation Report 2016-0013-3294
in the afternoon. A maximum of 8372 ppb total VOCs and 24 ppm CO was measured at the new weigh-fill machine at 12:15 p.m.
0100020003000400050006000700080009000
7:57
AM
8:17
AM
8:37
AM
8:57
AM
9:17
AM
9:37
AM
9:57
AM
10:1
7 AM
10:3
7 AM
10:5
7 AM
11:1
7 AM
11:3
7 AM
11:5
7 AM
12:1
7 PM
12:3
7 PM
12:5
7 PM
1:17
PM
1:37
PM
1:57
PM
2:17
PM
2:37
PM
Tota
l VO
Cs
(ppb
)
Figure 10. Real-time monitoring results for total VOCs concentrations near the new weigh-fill machine, NIOSH survey, April 6, 2016.
0
5
10
15
20
25
7:57
AM
8:17
AM
8:37
AM
8:57
AM
9:17
AM
9:37
AM
9:57
AM
10:1
7 AM
10:3
7 AM
10:5
7 AM
11:1
7 AM
11:3
7 AM
11:5
7 AM
12:1
7 PM
12:3
7 PM
12:5
7 PM
1:17
PM
1:37
PM
1:57
PM
2:17
PM
2:37
PM
CO
(ppm
)
Figure 11. Real-time monitoring results for CO concentrations near the new weigh-fill machine, NIOSH survey, April 6, 2016.

Page 22 Health Hazard Evaluation Report 2016-0013-3294
0100200300400500600700800900
1000
7:57
AM
8:17
AM
8:37
AM
8:57
AM
9:17
AM
9:37
AM
9:57
AM
10:1
7 AM
10:3
7 AM
10:5
7 AM
11:1
7 AM
11:3
7 AM
11:5
7 AM
12:1
7 PM
12:3
7 PM
12:5
7 PM
1:17
PM
1:37
PM
1:57
PM
2:17
PM
2:37
PM
CO
2 (p
pm)
Figure 12. Real-time monitoring results for CO2 concentrations near the new weigh-fill machine, NIOSH survey, April 6, 2016.
Real-time monitoring results of total VOCs, CO, and CO2 levels near the main grinders on April 7, 2016 can be seen in Figures 13, 14, and 15. Although we did not record each time the main grinders were used, we did note that the large Ditting grinder was in use at 9:50 a.m. and 2:20 p.m.; this corresponds with peaks of approximately 14,000 ppb total VOCs and 280-380 ppm CO. On April 7, 2016, the average total VOC (1826 ppm), CO (38.4 ppm), and CO2 (744 ppm) levels observed at the main grinders were higher than the day prior.
Figure 13. Real-time monitoring results of total VOCs near the main grinders, NIOSH survey, April 7, 2016. Monitors were placed on the left (black) and right (grey) of the main grinders.
0
2000
4000
6000
8000
10000
12000
14000
16000
8:48 A
M9:0
8 AM
9:28 A
M9:4
8 AM
10:08
AM
10:28
AM
10:48
AM
11:08
AM
11:28
AM
11:48
AM
12:08
PM
12:28
PM
12:48
PM
1:08 P
M1:2
8 PM
1:48 P
M2:0
8 PM
2:28 P
M2:4
8 PM
3:08 P
M
Total
VOC
s (pp
b)

Page 23Health Hazard Evaluation Report 2016-0013-3294
050
100150200250300350400450
8:51
AM
9:11
AM
9:31
AM
9:51
AM
10:1
1 AM
10:3
1 AM
10:5
1 AM
11:1
1 AM
11:3
1 AM
11:5
1 AM
12:1
1 PM
12:3
1 PM
12:5
1 PM
1:11
PM
1:31
PM
1:51
PM
2:11
PM
2:31
PM
2:51
PM
CO
(ppm
)
Figure 14. Real-time monitoring results of CO levels near the main grinders, NIOSH survey, April 7, 2016. Monitors were placed on the left (black) and right (grey) of the main grinders.
0
500
1000
1500
2000
2500
3000
3500
4000
8:51
AM
9:11
AM
9:31
AM
9:51
AM
10:1
1 AM
10:3
1 AM
10:5
1 AM
11:1
1 AM
11:3
1 AM
11:5
1 AM
12:1
1 PM
12:3
1 PM
12:5
1 PM
1:11
PM
1:31
PM
1:51
PM
2:11
PM
2:31
PM
2:51
PM
CO
2(p
pm)
Figure 15. Real-time monitoring results of CO2 levels near the main grinders, NIOSH survey, April 7, 2016. Monitors were placed on the left (black) and right (grey) of the main grinders.

Page 24 Health Hazard Evaluation Report 2016-0013-3294
Ventilation Assessment The production space, including the break room, production office, and storage area that are partitioned with partial walls, is served by a single Lennox (Dallas, TX) Model LGA088SH1G Packaged Cooling and Gas Heat AHU mounted on the roof of the facility. The AHU was equipped with four Glasfloss (Desoto, TX) Z-Line Series 18-inch × 20-inch × 2-inch pleated air filters. The Glasfloss filters have a published ASHRAE Minimum Efficiency Reporting Value (MERV) of 10, which relates to filter efficiency. A MERV 10 filter corresponds to a removal efficiency of better than 80% for 3.0 to 10 micrometer particles and better than 50% for 1.0 to 3.0 micrometer particles [ANSI/ASHRAE 2017]. MERV 10 filters are better than MERV 8 filters that are the minimum requirement for AHUs providing air to occupied spaces according to ASHRAE [ANSI/ASHRAE 2017]. The filters in place during the NIOSH visit were clean and sized appropriately for the AHU.
The AHU was providing some amount of fresh, outdoor air to the occupied space during our visit, but we did not have equipment that allowed us to measure the amount. One return duct from the production space led to the AHU. Air from the production space was pulled through the return duct into the AHU, where it mixed with some outdoor air, passed through the MERV 10 filters and was then heated or cooled, as necessary. Once the air was tempered, it was pushed back into the production space through a network of round, galvanized ducts to eight terminal circular diffusers. The total supply air flow through the AHU was measured to be 1595 cubic feet per minute.
In addition to the fresh, outdoor air supplied by the mechanical ventilation system, there were two 18-inch circular, passive makeup air ducts that allowed additional fresh air into the space. These ducts were located on the eastern wall with the windows, behind the roasters. The amount of fresh air brought into the space through these ducts is dependent on the outdoor weather conditions, the windows being opened or closed, and, most importantly, the various operating modes of the roasters during a complete roasting cycle and each mode’s individual air flow requirements.
Medical Survey DemographicsThirteen of 29 employees (45%) at the coffee roasting and packaging facility participated in the medical survey, including nine of 13 production employees. The majority of participants was male (54%) and Caucasian (85%). The mean age of the participants was 34 years (range 22-45 years), and average tenure at the company was 4 years (range: 1 year – 10 years). Seven of the 13 participants worked at one of the company’s café locations or in the coffee industry (e.g., barista, production) prior to working at this facility. Eight (62%) participants were current or former smokers. All 13 participants reported working or entering the production area, ranging from two hours to 40 hours a week. All reported being within an arm’s length of roasted coffee in one or more areas of the production process. Nine of 13 participants worked in the production area while some of the other participants occasionally assisted with production activities on an as need basis.

Page 25Health Hazard Evaluation Report 2016-0013-3294
Symptoms and Self-Reported DiagnosesThe prevalence of symptoms over the last year and last four weeks at the time of the survey are listed in Table A6. Nose symptoms were the most commonly reported symptom (n=11, 85%), followed by eye symptoms (n=10, 77%) and sinusitis or sinus problems (n=6, 46%). Seven participants noted that their mucous membrane symptoms were caused or aggravated by green coffee bean and roasted coffee dust, bagging ground coffee, or cleaning the roaster.
Eight (62%) participants reported one or more lower respiratory symptoms in the past 12 months: regular trouble breathing, woken by shortness of breath, woken with chest tightness, wheeze or whistling in chest, attack of asthma, or shortness of breath on level ground or walking up a slight hill (Table A6). Breathing trouble was the most commonly reported lower respiratory symptom (n=5, 38%) followed by chest wheezing or whistling (n=4, 31%) and awoke with chest tightness (n=4, 31%). Three of the eight reported improvement in one or more of their symptoms when away from the workplace. Four of the eight were former smokers.
Eleven (85%) participants reported one or more systemic symptoms. Flu-like achiness or achy joints (n=6, 46%) and fever or chills (n=6, 46%) were the most commonly reported systemic symptoms. Three (23%) participants reported that one or more of their systemic symptoms improved away from work; some participants reported that green coffee, green coffee or roasted coffee dust, or burnt particulates from the roaster aggravated their symptoms.
Four participants reported a diagnosis of hay fever or nasal allergies; five participants reported a lung condition including four with a history of asthma. All these conditions were diagnosed prior to employment at the coffee roasting and packaging facility. No participants reported a diagnosis of bronchiolitis obliterans, interstitial lung disease, hypersensitivity pneumonitis, chemical pneumonitis, sarcoidosis, heart disease, vocal cord dysfunction, or gastroesophageal reflux.
Medical TestsAll 13 spirometry tests were normal. One impulse oscillometry test in a never smoker was interpreted as consistent with a possible small airway abnormality with improvement after bronchodilator. Two exhaled nitric oxide tests were interpreted as elevated.
NHANES Comparison of Symptoms, Diagnoses, and SpirometryThe prevalence of selected symptoms (including wheeze and shortness of breath) and diagnoses (including asthma) among participants was not different than expected from comparisons to the general US population (Table A7).
Discussion At the coffee roasting and packaging facility that is the subject of this report, the highest area samples for total VOCs, CO, diacetyl, and 2,3-pentanedione were observed in areas
Page 26 Health Hazard Evaluation Report 2016-0013-3294
where coffee was ground (near the main grinders) or ground coffee was present (near the new weigh-fill machine). Diacetyl, 2,3-pentanedione, 2,3-hexanedione, other VOCs, and other compounds such as CO2 and CO are naturally produced when coffee beans are roasted, and grinding the roasted coffee beans produces greater surface area for the off-gassing of these chemicals [Anderson et al. 2003; Akiyama et al. 2003; Daglia et al. 2007; Newton 2002; Nishimura et al. 2003; Raffel and Thompson 2013].
Alpha-Diketones Personal Air Sampling Sixteen personal (five roaster operator, nine production, and two production manager employee measurements) full-shift air samples taken inside the facility using standard OSHA methods were above the NIOSH REL for diacetyl. The highest personal full-shift air samples (12-13 ppb) were collected on employees with grinding and/or packaging duties. No personal air samples were above the NIOSH REL for 2,3-pentanedione. As noted earlier, the REL should be used as a guideline to indicate when steps should be taken to reduce exposures in the workplace. The risks associated with the measured levels are higher than NIOSH recommends. As described in the quantitative risk assessment from the NIOSH Criteria Document (Table 5-27) [NIOSH 2016], after a 45-year working lifetime exposure to 10 ppb (a concentration slightly lower than the highest concentration measured at this facility), NIOSH estimated less than 2 in 1,000 workers would develop reduced lung function (FEV1 below the 5th percentile). NIOSH predicted that around 2 in 10,000 workers exposed to diacetyl at 10 ppb would develop more severe lung function reduction (FEV1 below 60% predicted, defined as moderately severe by the American Thoracic Society [Pellegrino et al. 2005]). After a 45-year working lifetime exposure to 20 ppb (a concentration slightly higher than the highest concentration measured at this facility), NIOSH estimated that 3 in 1,000 workers would develop reduced lung function (FEV1 below the 5th percentile). NIOSH predicted that 5 in 10,000 workers exposed to diacetyl at 20 ppb would develop more severe lung function reduction. The effects of a working lifetime exposure at 13 ppb would be between those for 10 ppb and 20 ppb. NIOSH recommends keeping diacetyl concentrations below 5 ppb because at this level, the risk of reduced lung function after a working lifetime of exposure is below 1 in 1000 workers. NIOSH recommends taking steps to reduce diacetyl exposures to below the REL of 5 ppb whenever possible.
Area Air Sampling Areas near the Diedrich roaster, Primo roaster, main grinders, new weigh-fill machine, old weigh-fill machine, finished product storage, break room, and rework had air levels that exceeded the NIOSH REL for diacetyl. Of the 35 full-shift area samples, 22 were above the NIOSH REL for diacetyl. Areas where coffee was ground had the highest diacetyl (16.8-51.1 ppb) and 2,3-pentanedione (9.7-26.7 ppb) air levels. We note that NIOSH RELs are intended to be directly compared to personal measurements; therefore, an area air sample that exceeds a NIOSH REL is only an indication of potential personal exposures.
Task-Based ExposuresCoffee processing involves multiple tasks that may cause intermittent exposure to diacetyl and 2,3-pentanedione. Traditional full-shift sampling will not characterize these

Page 27Health Hazard Evaluation Report 2016-0013-3294
intermittent, peak exposures. Evaluating intermittent and task-based exposures to diacetyl and 2,3-pentanedione is difficult with current validated sampling methods (OSHA Methods 1013/1016). Since tasks are so sporadic in coffee processing, with some only lasting a few seconds or minutes, we used instantaneous evacuated canisters to sample tasks that were only a few seconds to minutes long and OSHA Methods 1013/1016 for longer duration tasks. We sampled by task, with varying durations, to understand which tasks may have contributed to higher exposures to diacetyl and 2,3-pentanedione.
Our task-based air sampling revealed that some tasks had higher air concentrations of diacetyl and/or 2,3-pentanedione than other tasks. The highest exposures to diacetyl (375 ppb) and 2,3-pentanedione (219 ppb) were measured while an employee ground coffee (Table A2). The greater surface area for off-gassing that is produced during grinding could have resulted in the higher air concentrations [Akiyama et al. 2003]. Five fifteen-minute samples collected while employees ground coffee exceeded the NIOSH STEL for diacetyl. One of the fifteen-minute air samples collected while an employee ground coffee was also above the NIOSH STEL for 2,3-pentanedione. We also measured higher exposures to diacetyl (29.7 ppb) and 2,3-pentanedieone (20.9 ppb) during packaging coffee.
The highest exposures to diacetyl and 2,3-pentanedione while employees roasted coffee were 13.2 ppb and 6.2 ppb, respectively. Diacetyl and 2,3-pentanedione concentrations while an employee cleaned chaff from the roaster were 14.4 ppb and 9.2 ppb, respectively. Although the Primo roaster is smaller than the Diedrich roaster and processes less total volume of roasted beans than the Diedrich roaster, levels of diacetyl and 2,3-pentanedione as well as total VOCs and CO were consistently higher near the Primo roaster. The main grinders are in close proximity to the Primo roaster, and emissions of diacetyl, 2,3-pentanedione, total VOCs and CO from the main grinders may have contributed to the higher levels observed at the Primo roaster.
Instantaneous SamplingWe measured diacetyl and 2,3-pentanedione using instantaneous sampling, in which sample duration was less than 30 seconds. These instantaneous samples were collected to identify and describe tasks and point sources of diacetyl and 2,3-pentanedione. The highest instantaneous source sample for diacetyl (20,574 ppb), and 2,3-pentanedione (9911) was measured at the main grinders, while an employee was grinding coffee for 5 pound bags. All instantaneous samples taken near the main grinders had diacetyl levels greater than 100 ppb, and 2,3-pentanedione levels greater than 35 ppb. Levels of diacetyl and 2,3-pentanedione observed in the breathing zone of employees using instantaneous canisters were much lower for diacetyl (19 ppb-28.3 ppb), and 2,3-pentanedione (10.3 ppm-10.9 ppm). The second highest instantaneous sample for diacetyl and 2,3-pentanedione were observed in a sample taken in the finished product storage area, near French roast bags. The instantaneous sample taken in the finished product storage had a diacetyl concentration of 4322 ppb and a 2,3-pentanedione concentration of 1389 ppb. We did not take note of other tasks being performed in the vicinity of the storage area; it is possible that coffee was being ground or ground coffee was being packaged at the same time the instantaneous sample was taken. Instantaneous samples of diacetyl and 2,3-pentanedione taken while workers were handling

Page 28 Health Hazard Evaluation Report 2016-0013-3294
roasted whole beans were much lower. A breathing zone sample taken while an employee dumped roasted beans from the storage bin into the hopper had a diacetyl concentration of 24.4 ppb and a 2,3-pentanedione concentration of 9.4 ppb. Instantaneous samples collected at the breathing zone of an employee while they hand blended roasted beans were anywhere from 6.6 to 25.2 ppb for diacetyl and 3.4 ppb to 6.0 ppb for 2,3-pentanedione.
Our instantaneous samples collected at the end of the day on April 6, 2016 and at the beginning of production on April 7, 2016 indicated that background levels of diacetyl may remain elevated even when production activities have ceased overnight. Both samples were taken in the center of the production floor. The end of day diacetyl air concentration on April 6, 2016 was 22.9 ppb, and the 2,3-pentanedione air concentration was 22.1 ppb. The beginning of day diacetyl air concentration on April 7, 2016 was 6.5 ppb and the 2,3-pentanedione air concentration was 2.5 ppb. Whole or ground coffee that is off gassing from bags stored in the finished product storage area combined with elevated air levels of alpha diketones from the production activities like grinding and packaging ground coffee without sufficient ventilation to remove alpha diketones may have contributed to the elevated levels of diacetyl even after production activities have ceased.
Bulk samplesDiacetyl is not found in green coffee beans. Rather, diacetyl is generated later in the coffee roasting process [Daglia et al. 2007]. As expected, we found that roasted coffee emits alpha-diketones into the headspace of sealed vessels, indicating that roasted coffee is a considerable source of alpha-diketones in the facility. The amount of time beans were roasted, and the amount of time roasted beans off-gassed prior to the collection of bulk samples could be responsible for differences in headspace analysis results.
Real-time Sampling for CO, CO2, and VOCsOur real-time monitoring found that the highest overall levels of total CO, CO2, and VOCs were observed at the main grinders when employees were using the grinders to grind coffee. As noted earlier, lower emissions were also noted from the roasters.
None of the average area levels of CO exceeded the NIOSH REL (35 ppm) or OSHA PEL (50 ppm). However, of the 6.9 hours that we monitored CO levels near the main grinders on April 6, 2016, levels of CO exceeded the NIOSH ceiling (200 ppm) 1.2% of the time. The NIOSH ceiling limit should not be exceeded at any time. The average CO2 concentration observed at the main grinders was 699 ppm, with a maximum of 2573 ppm, which was below the NIOSH REL (5,000 ppm) and OSHA PEL (5,000 ppm).
One limitation of interpreting real-time measurements for VOCs, CO2, or CO is that the results can only be summarized within the context of when tasks were documented. Increases in VOCs, CO2, or CO may be explained by another task that occurred but was not captured in our notes. For example, activity at the nearby grinders may have contributed to the peak levels of CO and total VOCs observed at the new-weigh fill machine, but we were not able to note all tasks being performed and in the vicinity of the real-time monitors for the entirety of the day.

Page 29Health Hazard Evaluation Report 2016-0013-3294
VentilationWe observed that fresh, outdoor air supplied to the production space was delivered by the rooftop AHU, but also through inconsistent passive air transfer. Passive air transfer is largely dependent on weather conditions and operating parameters of the roasters. An adequate supply of outdoor air, typically delivered through the heating, ventilation, and air-condition (HVAC) system, is necessary in any occupied spaces to dilute pollutants that are released by equipment, processes, products, and people. We were unable to accurately measure the amount of fresh, outdoor air being provided by the rooftop AHU to the production space. The outdoor air supply may be sufficient, at least during certain parts of the year. If the amount of outdoor air supplied to the space is low, however, increasing the outdoor air flow will provide more dilution and removal of airborne contaminants from the space. Consistently supplying the production space with appropriate outdoor air may not bring all personal exposures to diacetyl and 2,3-pentanedoine below the NIOSH RELs, but it is an inexpensive, easy place to start engineering control improvements. The existing AHU is capable of providing adequate outdoor air flows, so only minor adjustments (if any) to the operating controls may be necessary. Providing more outdoor air flow will enhance dilution and removal of contaminants, but there will be additional energy costs associated with heating and cooling that outside air for much of the year. Those decisions should be made as part of an overall plan to improve engineering controls at the facility. A ventilation system expert can help meet all ventilation requirements in the production space and other areas of the building occupied by employees.
Medical Survey Overall, mucous membrane symptoms, specifically eye, nose, and sinus symptoms, were the most commonly reported symptoms. Some production employees reported their mucous membrane symptoms were caused or aggravated by green and roasted coffee dust, bagging ground coffee, and cleaning the roaster. Coffee dust is an organic dust known to cause respiratory symptoms [Zuskin et al. 1993; Sakwari et al. 2013]. Green and roasted coffee dust and castor beans (from cross-contamination of bags used to transport coffee) are known risk factors for occupational asthma [Figley and Rawling 1950; Karr et al. 1978; Zuskin et al. 1979, 1985; Thomas 1991]. Persons who become sensitized (develop an immune reaction) to coffee dust can subsequently react to relatively low concentrations in the air. Others may experience irritant-type symptoms from exposure to coffee dust [Oldenburg et al. 2009].
Upper respiratory disease such as allergic rhinitis (hay fever, nasal allergies) and sinusitis are sometimes associated with lower respiratory symptoms and asthma and may precede the diagnosis of asthma [Shaaban et al. 2008; EAACI Task Force on Occupational Rhinitis et al. 2008; Rondón et al. 2012, 2017; Sahay et al. 2016]. Upper respiratory involvement (e.g., rhinitis, sinusitis) can result in suboptimal control of asthma. Six of the eight participants that reported lower respiratory symptoms also reported nasal, sinus problems and/or physician-diagnosed hay fever or nasal allergies. Green coffee dust is thought to be a more potent allergen than roasted coffee dust because roasting destroys some of the allergenic activity [Lehrer et al. 1978]. As discussed in the recommendations section, to prevent symptoms related to green coffee dust, make N95 disposable filtering-face piece respirators available

Page 30 Health Hazard Evaluation Report 2016-0013-3294
for voluntary use when emptying burlap bags of green coffee beans into storage containers or cleaning the green bean storage area.
The number of participants with physician-diagnosed asthma was not different from that observed in the U.S. population. However, 62% of participants reported one or more lower respiratory symptoms in the 12 months prior to the medical survey. Three reported improvement in one or more of their lower respiratory symptoms when away from the workplace. Asthma symptoms often improve when away from exposures that trigger symptoms while other lung diseases such as obliterative bronchiolitis or COPD generally do not improve. Spirometry can be used to help detect and follow individuals with asthma and other lung diseases such as obliterative bronchiolitis or COPD. Spirometry can show if air is exhaled from the lungs more slowly than normal (i.e. obstructive abnormality) or if the amount of air exhaled is smaller than normal (i.e., restrictive abnormality). In asthma, there is intermittent airways obstruction which is reversible after treatment with bronchodilator medications (e.g., albuterol). In obliterative bronchiolitis, scar tissue prevents the small airways (bronchioles) from opening up when albuterol is given. In other words, the airways are fixed and not responsive (reversible) to bronchodilator medicine. The obstructed airways prevent rapid emptying of the lung air sacs (alveoli) during exhalation. This explains why the respiratory symptoms of those with occupational obliterative bronchiolitis do not tend to improve when away from work-related exposures; however, avoidance of further exposure can stop progression of the disease [Akpinar-Elci et al. 2004].
Spirometry and impulse oscillometry measure different things. Spirometry assesses airflow and is the breathing test typically used to screen for flavoring-related lung disease. Impulse oscillometry accesses the airways response to a sound or pressure wave and has not commonly been used to screen for flavoring-related lung disease. In general, during the impulse oscillometry test, a small pressure impulse (sound wave) is imposed upon the inspiratory and expiratory airflow during normal tidal breathing. This pressure wave causes a disturbance in the airflow and pressure, and the response of the airways (i.e., change in pressure to change in flow) is a measure of the resistance to airflow in the airways [Desiraju and Agrawal 2016]. Impulse oscillometry may be useful as an indirect measure of airflow obstruction and helpful in individuals not able to perform forced breathing maneuvers that are required during the spirometry test. The impulse oscillometry test has been used for many years to measure changes in the airways of children with lung problems such as asthma and cystic fibrosis [Song et al. 2008; Komarow et al. 2011; Shi et al. 2012; Schulze et al. 2016]. More recently, impulse oscillometry has been used to investigate lung problems in adults exposed to dust or chemicals, such as World Trade Center emergency responders and soldiers returning from deployment overseas [Oppenheimer et al. 2007; Berger et al. 2013; Weinstein et al. 2016]. Over the years, researchers have developed reference (predictive) equations for different populations of children for oscillometry [Malmberg et al. 2002; Park et al. 2011; Lee et al. 2012; de Assumpcão et al. 2016]. For adults, there are fewer reference equations available for oscillometry [Vogel and Smidt 1994; Newbury et al. 2008; Schulz et al. 2013]. The predicted values we used for oscillometry measures were based on gender and age according to references values recommended by the manufacturer. Unlike predictive equations used for spirometry, the impulse oscillometry reference equations we used did not
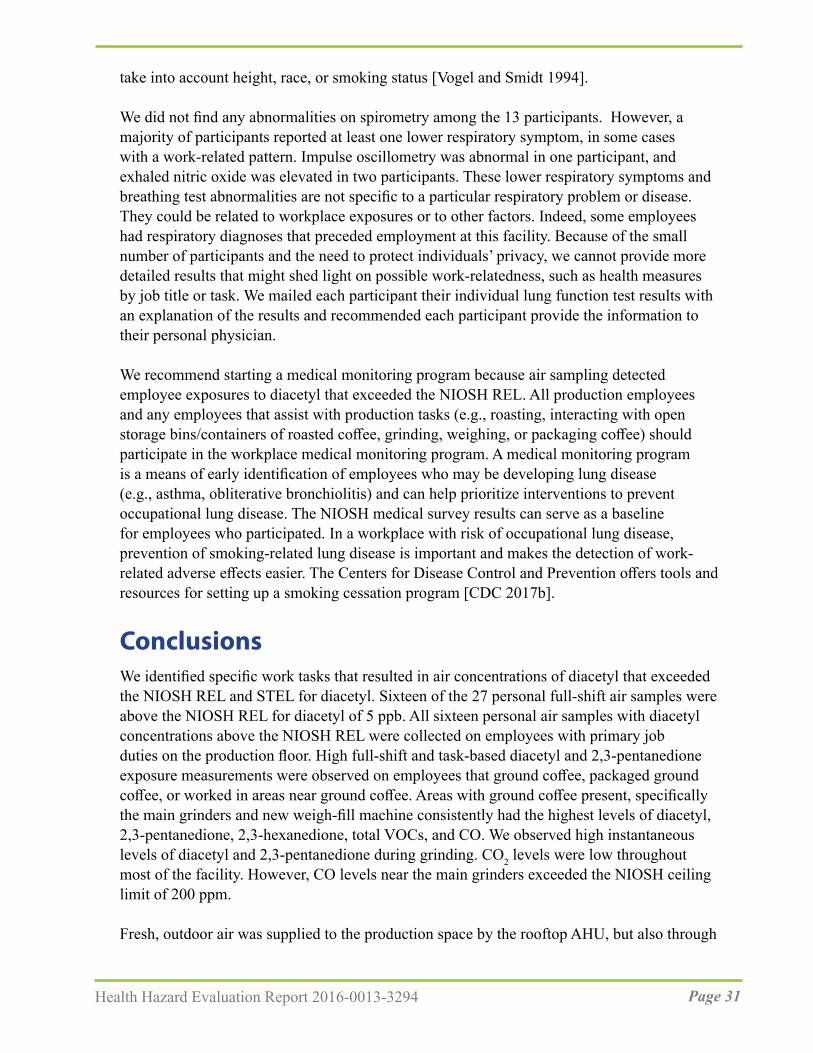
Page 31Health Hazard Evaluation Report 2016-0013-3294
take into account height, race, or smoking status [Vogel and Smidt 1994].
We did not find any abnormalities on spirometry among the 13 participants. However, a majority of participants reported at least one lower respiratory symptom, in some cases with a work-related pattern. Impulse oscillometry was abnormal in one participant, and exhaled nitric oxide was elevated in two participants. These lower respiratory symptoms and breathing test abnormalities are not specific to a particular respiratory problem or disease. They could be related to workplace exposures or to other factors. Indeed, some employees had respiratory diagnoses that preceded employment at this facility. Because of the small number of participants and the need to protect individuals’ privacy, we cannot provide more detailed results that might shed light on possible work-relatedness, such as health measures by job title or task. We mailed each participant their individual lung function test results with an explanation of the results and recommended each participant provide the information to their personal physician.
We recommend starting a medical monitoring program because air sampling detected employee exposures to diacetyl that exceeded the NIOSH REL. All production employees and any employees that assist with production tasks (e.g., roasting, interacting with open storage bins/containers of roasted coffee, grinding, weighing, or packaging coffee) should participate in the workplace medical monitoring program. A medical monitoring program is a means of early identification of employees who may be developing lung disease (e.g., asthma, obliterative bronchiolitis) and can help prioritize interventions to prevent occupational lung disease. The NIOSH medical survey results can serve as a baseline for employees who participated. In a workplace with risk of occupational lung disease, prevention of smoking-related lung disease is important and makes the detection of work-related adverse effects easier. The Centers for Disease Control and Prevention offers tools and resources for setting up a smoking cessation program [CDC 2017b].
Conclusions We identified specific work tasks that resulted in air concentrations of diacetyl that exceeded the NIOSH REL and STEL for diacetyl. Sixteen of the 27 personal full-shift air samples were above the NIOSH REL for diacetyl of 5 ppb. All sixteen personal air samples with diacetyl concentrations above the NIOSH REL were collected on employees with primary job duties on the production floor. High full-shift and task-based diacetyl and 2,3-pentanedione exposure measurements were observed on employees that ground coffee, packaged ground coffee, or worked in areas near ground coffee. Areas with ground coffee present, specifically the main grinders and new weigh-fill machine consistently had the highest levels of diacetyl, 2,3-pentanedione, 2,3-hexanedione, total VOCs, and CO. We observed high instantaneous levels of diacetyl and 2,3-pentanedione during grinding. CO2 levels were low throughout most of the facility. However, CO levels near the main grinders exceeded the NIOSH ceiling limit of 200 ppm.
Fresh, outdoor air was supplied to the production space by the rooftop AHU, but also through

Page 32 Health Hazard Evaluation Report 2016-0013-3294
inconsistent passive air transfer. We were unable to measure the amount of fresh, outdoor air supplied to the space. The outdoor air supply may be sufficient, at least during certain parts of the year. If the amount of outdoor air supplied to the space is low, however, increasing the outdoor air flow will provide more dilution and removal of airborne contaminants from the space. Consistently supplying the production space with appropriate outdoor air may still not bring all personal exposures to diacetyl and 2,3-pentanedoine below the NIOSH RELs. Regardless, working with a ventilation engineer to optimize outdoor air delivery is a relatively inexpensive, easy place to start engineering control improvements, as the existing AHU is likely capable of providing more outdoor air flows with only minor adjustments (if any). Additionally, installing a local exhaust ventilation system around the grinders to immediately remove alpha-diketones produced during that operation could make noticeable reductions in overall concentrations.
Overall, mucous membrane symptoms, specifically eye, nose, and sinus symptoms, were the most commonly reported symptoms. Some employees reported their symptoms were caused or aggravated by green coffee bean and roasted coffee dust, bagging ground coffee, or cleaning the roaster. Breathing trouble was the most commonly reported lower respiratory symptom followed by wheezing and chest tightness. All administered spirometry tests were normal. Two of 13 participants had high exhaled nitric oxide, a marker of allergic airways inflammation; one participant had an impulse oscillimetry test interpreted as consistent with possible small airways abnormality with improvement after bronchodilator. We recommend a medical monitoring program to identify any employees who may be developing lung disease (e.g., asthma, obliterative bronchiolitis) and to help management prioritize interventions to prevent occupational lung disease. All production workers and employees that assist with production tasks (e.g., roasting, interacting with open storage bins/containers of roasted coffee, grinding, weighing, or packaging coffee) should participate in the workplace medical monitoring program.
Recommendations On the basis of our findings, we recommend the actions listed below. We encourage this coffee processing facility to use a labor-management health and safety committee or working group to discuss our recommendations and develop an action plan. Our recommendations are based on an approach known as the hierarchy of controls. This approach groups actions by their likely effectiveness in reducing or removing hazards. In most cases, the preferred approach is to eliminate hazardous materials or processes and install engineering controls to reduce exposure or shield employees.
Engineering ControlsEngineering controls reduce employees’ exposures by removing the hazard from the process or by placing a barrier between the hazard and the employee. Engineering controls protect employees effectively without placing primary responsibility of implementation on the employee.

Page 33Health Hazard Evaluation Report 2016-0013-3294
1. Consult with a ventilation engineer for local exhaust ventilation.
2. Install local exhaust ventilation at the grinders.
3. Install local exhaust ventilation at the new weigh/fill machine.
4. Consider relocating the grinders to an area with little or no bystander foot traffic tominimize potential exposure risks to employees not directly using the grinder.
Administrative ControlsThe term administrative controls refers to employer-dictated work practices and policies to reduce or prevent hazardous exposures. Their effectiveness depends on employer commitment and employee acceptance. Regular monitoring and reinforcement are necessary to ensure that policies and procedures are followed consistently.
1. Install a CO monitor and alarm near the main grinders that can alert employees whenCO levels exceed the NIOSH ceiling of 200 ppm. Employees should evacuate andmove to an area of fresh air until the CO level drops below 200 ppm.
2. After engineering controls have been installed, conduct personal air monitoring fordiacetyl and 2,3-pentanedione on employees with primary duties in the production areausing OSHA Sampling Method 1012 for diacetyl [OSHA 2008] and OSHA SamplingMethod 1016 for 2,3-pentanedione [OSHA 2010]. Because air levels of VOCs likediacetyl and 2,3-pentanedione may fluctuate from day to day based on productionschedules, we recommend personal air sampling for diacetyl and 2,3-pentanedioneover multiple days.
3. Whenever possible, employees should avoid spending time in the immediate areawhere coffee is being ground and/or ground coffee is being packaged.
4. Whenever possible, do not blend roasted beans by hand. Instead, use some otherautomatic mechanism that minimizes employee contact with roasted beans duringblending.
5. Continue to cover bins of roasted beans to aid in reducing the overall emission ofalpha-diketones and other chemicals (e.g., CO, CO2) into the workplace.
6. To reduce exposures to VOCs (including alpha-diketones), CO, and CO2, minimizeproduction tasks that require employees to place their heads directly above or insidethe roasted bean bins.
7. Continue to periodically clean the roaster’s exhaust according to manufacturerinstructions to remove chaff build up to reduce a fire hazard and to improve theefficiency, energy usage, and roaster performance.
8. Ensure employees understand potential hazards (e.g., diacetyl, 2,3-pentanedione,CO, CO2, dust) in the workplace and how to protect themselves. OSHA’s HazardCommunication Standard, also known as the “Right to Know Law” [29 CFR1910.1200] requires that employees are informed and trained on potential workhazards and associated safe practices, procedures, and protective measures.

Page 34 Health Hazard Evaluation Report 2016-0013-3294
9. Ensure employees are educated to consider the risks of further exposure if theydevelop lower respiratory symptoms (e.g., cough, shortness of breath, wheezing)that are progressive and severe in degree. Employees should report new, persistent,or worsening symptoms to their personal healthcare providers and to a designatedindividual at this workplace. Employees with new, persistent, or worsening symptomsshould share this report with their healthcare providers.
Personal Protective EquipmentPersonal protective equipment in the form of respiratory protection is considered the least effective means for controlling hazardous respiratory exposures because breakdowns in implementation can result in insufficient protection. Proper use of respiratory protection (respirators) requires a comprehensive respiratory protection program and a high level of employee and management involvement and commitment to assure that the right type of respirator is chosen for each hazard, respirators fit users and are maintained in good working order, and respirators are worn when they are needed. Supporting programs such as training, change-out schedules, and medical assessment may be necessary. Respirators should not be the sole method for controlling hazardous inhalation exposures. Rather, respirators should be used until effective engineering and administrative controls are in place.
1. In addition to engineering and administrative controls, respiratory protection is apotential option to further reduce exposures to alpha-diketones (e.g., diacetyl and2,3-pentanedione). If follow-up air sampling after engineering controls have beeninstalled indicates levels of diacetyl and 2,3-pentanedione above their respectiveNIOSH RELs and STELs, we recommend that respiratory protection be used duringtasks with elevated exposures. If respiratory protection is used, NIOSH-certifiedrespirators should be fitted with organic vapor cartridges and particulate filters. Thechoice of respirator should be guided by personal exposure sampling for diacetyl and2,3-pentanedione (NIOSH 2004). Respirators have assigned protection factors (APFs).APF refers to the highest level of protection a properly selected respirator can provide.For instance, air-purifying half-face respirators have an assigned protection factor(APF) of 10, and air-purifying full-face respirators have an APF of 50. Also, thereare powered-air purifying respirators that have APFs of 25, 50, or 1000. The OSHAAPFs can be found in Table 1 of OSHA Respiratory Protection Standard at https://www.osha.gov/pls/oshaweb/owadisp.show_document?p_table=STANDARDS&p_id=12716.
If mandatory respiratory protection is used, a written respiratory protection program should be implemented as required by the OSHA Respiratory Protection Standard (29 CFR 1910.134), including training, fit testing, maintenance and use requirements.
2. Continue to make N95 disposable filtering-face piece respirators available forvoluntary use for protection against green or roasted coffee dust exposure suchas when emptying burlap bags of green beans into the storage silos, cleaning the

Page 35Health Hazard Evaluation Report 2016-0013-3294
roaster exhaust system of chaff, emptying the chaff containers, or cleaning the green bean storage area. N95 respirators should be available in various sizes, and each potential N95 user should receive a copy of Appendix D of the OSHA Respiratory Protection Standard (http://www.osha.gov/pls/oshaweb/owadisp.show_document?p_table=standards&p_id=9784). Information about Appendix D and voluntary use of respirators can be found on the OSHA website at https://www.osha.gov/video/respiratory_protection/voluntaryuse_transcript.html.
Please be aware that N95s are not protective against alpha-diketones (diacetyl, 2,3-pentanedione, or 2,3-hexanedione). In cases of dual exposure to dust and alpha-diketones, NIOSH-certified organic vapor cartridges (for the alpha-diketones) and particulate cartridges/filters (for the dust) would be warranted.
Medical MonitoringThe purpose of a medical monitoring program is to help assure the health of employees who have workplace exposures (e.g., diacetyl, 2,3-pentanedione, green coffee beans/dust) known to pose risk for potentially serious health conditions such as asthma or obliterative bronchiolitis.
According to the NIOSH Criteria document [NIOSH 2016], employees should have baseline evaluations before they are allowed to work in or enter areas where they might be exposed to diacetyl, 2,3-pentanedione, or similar fla voring compounds. Air sampling results indicated that employees in the production area that roasted coffee, ground coffee, blended coffee by hand, or weighed and packaged roasted coffee could be exposed to diacetyl above the NIOSH REL or STEL.
Institute a medical monitoring program for employees who work or assist in the production area. The medical monitoring should consist of evaluation with a questionnaire (to obtain health and work task information) and spirometry (to assess lung function) at baseline and at one year to monitor for respiratory symptoms and to establish employees’ baseline in lung function and any abnormal decline in lung function in the first year. Subsequently, an annual questionnaire evaluation should occur to monitor for respiratory symptoms. New or worsening respiratory symptoms should prompt additional evaluation including spirometry. Details about spirometry and a medical monitoring program can be found in chapter 9 of the NIOSH Criteria Document [NIOSH 2016].
If an employee is identified as likely having lung disease from exposure to diacetyl or 2,3-pentanedione, it should be viewed as a sentinel event indicating that there was a breakdown in exposure controls and that there is potential risk for co-workers. Should this occur, the unanticipated source of exposure must be identified and brought under control. In addition, increased intensity of medical surveillance would be required for all employees performing similar job tasks or having similar or greater potential for exposure. The NIOSH Criteria Document provides detailed guidance on responses to such sentinel events [NIOSH 2016].

Page 36 Health Hazard Evaluation Report 2016-0013-3294
Smoking Cessation ProgramIn a workplace with risk of occupational lung disease, prevention of smoking-related lung disease is important and makes the detection of work-related adverse effects easier. We recommend implementing a smoking cessation program to assist employees to stop smoking. The Centers for Disease Control and Prevention offers tools and resources for setting up a smoking cessation program [CDC 2017b].
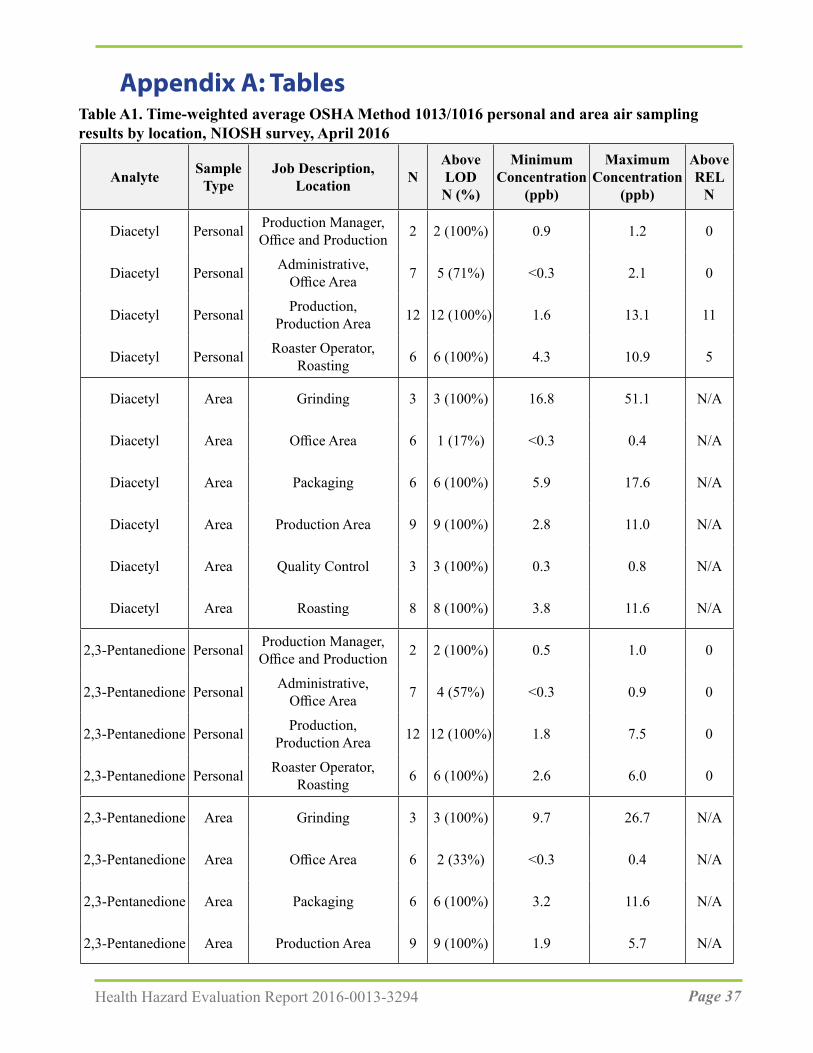
Page 37Health Hazard Evaluation Report 2016-0013-3294
Table A1. Time-weighted average OSHA Method 1013/1016 personal and area air sampling results by location, NIOSH survey, April 2016
Analyte Sample Type
Job Description, Location N
Above LODN (%)
MinimumConcentration
(ppb)
MaximumConcentration
(ppb)
Above REL
N
Diacetyl Personal Production Manager,Office and Production 2 2 (100%) 0.9 1.2 0
Diacetyl Personal Administrative,Office Area 7 5 (71%) <0.3 2.1 0
Diacetyl Personal Production,Production Area 12 12 (100%) 1.6 13.1 11
Diacetyl Personal Roaster Operator,Roasting 6 6 (100%) 4.3 10.9 5
Diacetyl Area Grinding 3 3 (100%) 16.8 51.1 N/A
Diacetyl Area Office Area 6 1 (17%) <0.3 0.4 N/A
Diacetyl Area Packaging 6 6 (100%) 5.9 17.6 N/A
Diacetyl Area Production Area 9 9 (100%) 2.8 11.0 N/A
Diacetyl Area Quality Control 3 3 (100%) 0.3 0.8 N/A
Diacetyl Area Roasting 8 8 (100%) 3.8 11.6 N/A
2,3-Pentanedione Personal Production Manager,Office and Production 2 2 (100%) 0.5 1.0 0
2,3-Pentanedione Personal Administrative,Office Area 7 4 (57%) <0.3 0.9 0
2,3-Pentanedione Personal Production,Production Area 12 12 (100%) 1.8 7.5 0
2,3-Pentanedione Personal Roaster Operator,Roasting 6 6 (100%) 2.6 6.0 0
2,3-Pentanedione Area Grinding 3 3 (100%) 9.7 26.7 N/A
2,3-Pentanedione Area Office Area 6 2 (33%) <0.3 0.4 N/A
2,3-Pentanedione Area Packaging 6 6 (100%) 3.2 11.6 N/A
2,3-Pentanedione Area Production Area 9 9 (100%) 1.9 5.7 N/A
Appendix A: Tables

Page 38 Health Hazard Evaluation Report 2016-0013-3294
Analyte Sample Type
Job Description, Location N
Above LODN (%)
MinimumConcentration
(ppb)
MaximumConcentration
(ppb)
Above REL
N
2,3-Pentanedione Area Quality Control 3 3 (100%) 0.5 1.0 N/A
2,3-Pentanedione Area Roasting 8 8 (100%) 2.0 6.6 N/A
2,3-Hexanedione Personal Production Manager,Office and Production 2 0 (0%) <0.2 <0.3 -
2,3-Hexanedione Personal Administrative,Office Area 7 0 (0%) <0.2 <0.2 -
2,3-Hexanedione Personal Production,Production Area 12 4 (33%) <0.2 0.4 -
2,3-Hexanedione Personal Roaster Operator,Roasting 6 2 (33%) <0.2 0.4 -
2,3-Hexanedione Area Grinding 3 3 (100%) 0.3 1.3 N/A
2,3-Hexanedione Area Office Area 6 0 (0%) <0.2 <0.2 N/A
2,3-Hexanedione Area Packaging 6 2 (33%) <0.2 0.6 N/A
2,3-Hexanedione Area Production Area 9 1 (11%) <0.2 0.3 N/A
2,3-Hexanedione Area Quality Control 3 0 (0%) <0.2 <0.2 N/A
2,3-Hexanedione Area Roasting 8 1 (13%) <0.2 0.4 N/A
Note: OSHA=Occupational Safety and Health Administration; N=number of samples; Above LOD N (%)=number and percentage of samples above limit of detection (LOD); < indicates below the LOD; ≤ indicates less than or equal to the LOD; % Above REL=percentage of samples above the NIOSH recommended exposure limit (REL); ppb=parts per billion; N/A indicates that NIOSH RELs are specified for personal air samples and area air samples cannot be used for direct comparisons with area samples; “Production Area” location includes employees that were cross-trained and performed tasks at different areas; “−“indicates that there is currently no REL for 2,3-hexanedione.
Table A1 (cont). Time-weighted average OSHA Method 1013/1016 personal and area air sampling results by location, NIOSH survey, April 2016

Page 39Health Hazard Evaluation Report 2016-0013-3294
Table A2. Summary of OSHA Method 1013/1016 personal air sampling results by task, NIOSH survey, April 2016
Analyte Task NAbove LOD
N (%)
Minimum Concentration
(ppb)
Maximum Concentration
(ppb)
Mean (range) Sample Duration
(minutes)
Diacetyl Cleaning Roaster 1 1 (100%) 14.4 14.4 ̶Diacetyl Grind coffee beans 9 9 (100%) 27.4 375.4 12 (3-15)Diacetyl Package coffee 10 9 (90%) <=1.1 29.7 17 (6-53)Diacetyl Roast coffee beans 38 32 (84%) <0.7 13.2 20 (0-86)2,3-Pentanedione Cleaning Roaster 1 1 (100%) 9.2 9.2 ̶2,3-Pentanedione Grind coffee beans 9 9 (100%) 15.0 219.2 12 (3-15)2,3-Pentanedione Package coffee 10 8 (80%) <0.8 20.9 17 (6-53)2,3-Pentanedione Roast coffee beans 38 29 (76%) <0.6 6.2 20 (0-86)2,3-Hexanedione Cleaning Roaster 1 0 (0%) <1.2 <1.2 ̶2,3-Hexanedione Grind coffee beans 9 3 (33%) <0.7 1.5 12 (3-15)2,3-Hexanedione Package coffee 10 1 (10%) <0.7 0.8 17 (6-53)2,3-Hexanedione Roast coffee beans 38 0 (0%) <0.1 . 20 (0-86)Note: OSHA=Occupational Safety and Health Administration; N=number of samples; Above LOD N (%)=number and percentage of samples above limit of detection (LOD); < indicates below the LOD; ≤ indicates less than or equal to the LOD; “All Over” includes employees that were cross-trained and performed tasks at different areas.
Table A3. Instantaneous evacuated canister method* air sampling results by task, NIOSH survey, April 2016
Task Description Diacetyl (ppb)
2,3-Pentanedione (ppb)
2,3-Hexanedione (ppb)
Dumped French Roast beans from storage bin into hopper 24.4 9.4 1.7Grinding 5 pound bags 28.3 10.9 <0.9Grinding coffee 19.0 10.3 <0.9Hand blending roasted beans 10.7 6.0 <0.9Hand blending roasted beans 25.2 11.5 <1.1Hand blending roasted beans 10.2 5.6 <0.9Hand blending roasted beans 6.6 3.4 <0.9Pouring roasted beans into Weigh/Pack hopper 6.3 3.3 <1.5Dumping roasted beans into cooling bin 8.3 5.1 <1.3Note: ppb=parts per billion; < indicates below the limit of detection.*Sampling duration approximately 30 seconds; task-based air samples were collected by placing the inlet of the canistersampler in the employee’s personal breathing zone as he/she performed work task to mimic exposure.

Page 40 Health Hazard Evaluation Report 2016-0013-3294
Tabl
e A4.
Inst
anta
neou
s eva
cuat
ed c
anis
ter
met
hod* a
ir sa
mpl
ing
resu
lts b
y so
urce
, NIO
SH su
rvey
, Apr
il 20
16
Sour
ce D
escr
iptio
nD
iace
tyl
(ppb
)2,
3-Pe
ntan
edio
ne
(ppb
)2,
3-H
exan
edio
ne
(ppb
)
At f
an a
t the
bac
k of
the
5 po
und
grin
der
124
35.0
2.8
At f
an a
t the
bac
k of
the
5 po
und
grin
der
225
87.4
6.9
Bes
ide
velo
cica
lc w
hile
wor
ker g
roun
d 5
poun
d ba
gs15
069
.25.
0B
esid
e ve
loci
calc
whi
le w
orke
r gro
und
5 po
und
bags
253
120
8.6
Che
ckin
g sm
ell a
nd c
olor
of r
oast
ing
bean
s; S
umat
ran
Ligh
t Roa
st23
.411
.9<1
.3C
lean
ing
chaff
out
of e
xhau
st li
ne fr
om D
iedr
ich
Roa
ster
32.0
20.8
1.7
Cle
anin
g ch
aff o
ut o
f exh
aust
line
from
Die
dric
h R
oast
er18
.97.
2<0
.9C
lean
ing
chaff
out
of e
xhau
st li
ne fr
om D
iedr
ich
Roa
ster
22.2
13.2
1.0
Deg
assi
ng a
bag
of O
rgan
ic F
renc
h R
oast
4322
1389
54.1
Dum
ped
roas
ted
bean
s fro
m ro
aste
r int
o co
olin
g bi
n5.
63.
6<1
.2D
umpe
d ro
aste
d be
ans f
rom
pla
stic
stor
age
bin
into
hop
per
0.3
<0.4
<0.6
Dum
ped
roas
ted
bean
s fro
m ro
aste
r coo
ling
bin
into
pla
stic
bin
5.5
2.8
<0.9
Dum
ped
roas
ted
bean
s fro
m ro
aste
r coo
ling
bin
into
pla
stic
bin
0.6
0.6
<0.6
Dum
ped
roas
ted
bean
s fro
m P
rimo
roas
ter c
oolin
g bi
n in
to p
last
ic b
in2.
30.
9<1
.0D
umpe
d D
ecaf
Per
u be
ans f
rom
coo
ling
bin
into
stor
age
bin
2.2
1.2
<0.9
Dum
ped
Ecua
dor b
eans
from
coo
ling
bin
into
stor
age
bin
1.7
0.7
<0.9
Dum
ped
Ecua
dor b
eans
from
coo
ling
bin
into
stor
age
bin
5.5
3.8
1.6
Dum
ped
roas
ted
bean
s fro
m ro
aste
r coo
ling
bin
into
pla
stic
bin
9.0
1.3
<0.9
Dum
ped
roas
ted
bean
s fro
m ro
aste
r coo
ling
bin
into
pla
stic
bin
11.2
5.5
<1.0
Dum
ped
roas
ted
bean
s fro
m ro
aste
r coo
ling
bin
into
pla
stic
bin
3.7
2.1
<1.0
Filli
ng 1
2 ou
nce
bag
with
gro
und
coffe
e 14
711
35.
8G
rindi
ng 5
pou
nd b
ag o
f coff
ee b
eans
20
574
9910
525

Page 41Health Hazard Evaluation Report 2016-0013-3294
Sour
ce D
escr
iptio
nD
iace
tyl
(ppb
)2,
3-Pe
ntan
edio
ne
(ppb
)2,
3-H
exan
edio
ne
(ppb
)
Dum
ping
dec
affei
nate
d ro
aste
d be
ans f
rom
coo
ling
bin
into
stor
age
bin
26.5
15.3
1.1
Dum
ping
Fre
nch
Roa
st ro
aste
d be
ans f
rom
coo
ling
bin
into
stor
age
bin
5.4
3.0
1.2
Dum
ping
roas
ted
bean
s fro
m c
oolin
g bi
n in
to st
orag
e bi
n58
.428
.62.
2Pu
lling
dec
affei
nate
d ro
aste
d be
ans f
rom
coo
ling
bin
thro
ugh
dest
oner
and
into
stor
age
bin
60.9
28.8
1.6
Pulli
ng F
renc
h R
oast
roas
ted
bean
s fro
m c
oolin
g bi
n th
roug
h de
ston
er a
nd in
to st
orag
e bi
n2.
11.
0<0
.9Pu
lling
Fre
nch
Roa
st ro
aste
d be
ans f
rom
coo
ling
bin
thro
ugh
dest
oner
and
into
stor
age
bin
109
41.4
4.5
Pulli
ng ro
aste
d be
ans f
rom
coo
ling
bin
thro
ugh
dest
oner
and
into
stor
age
bin
37.0
21.8
1.4
Dum
ping
roas
ted
bean
s fro
m c
oolin
g bi
n in
to st
orag
e bi
n12
.86.
51.
2R
oast
er c
heck
ing
the
smel
l and
col
or o
f bea
ns
10.1
6.3
1.6
Roa
ster
che
ckin
g th
e sm
ell a
nd c
olor
of b
eans
7.9
4.8
<2.2
Not
e: p
pb=p
arts
per
bill
ion;
< in
dica
tes b
elow
the
limit
of d
etec
tion
for
the
inst
rum
ent u
sed
to d
etec
t 2,3
-hex
aned
ione
.*S
ampl
ing
dura
tion
appr
oxim
atel
y 30
seco
nds;
sour
ce a
ir sa
mpl
es w
ere
colle
cted
by
plac
ing
the
inle
t of t
he c
anis
ter
sam
pler
nea
r ro
aste
d be
ans.
Tabl
e A4
(con
t.). I
nsta
ntan
eous
eva
cuat
ed c
anis
ter
met
hod* a
ir sa
mpl
ing
resu
lts b
y so
urce
, NIO
SH su
rvey
, Apr
il 20
16

Page 42 Health Hazard Evaluation Report 2016-0013-3294
Apr
il 20
16oa
sted
coff
ee b
eans
, NIO
SH su
rvey
, b
ulk
sam
ples
of r
esul
ts*
for
able
A5.
Hea
dspa
ce a
naly
sis r
T
ence
s in
head
spac
e an
alys
is r
esul
ts.
som
e of
the
diffe
res
pons
ible
for
diff
eren
t am
ount
s of t
ime,
and
this
cou
ld b
e r
*The
roa
sted
coff
ee b
eans
off-
gass
ed fo
r b
illio
nN
ote:
ppb
=par
ts p
er
Dia
cety
l2,
3-Pe
ntan
edio
ne2,
3-H
exan
edio
neSa
mpl
e Ty
peB
ulk
Sam
ple
Des
crip
tion
(ppb
)(p
pb)
(ppb
)
Coff
ee b
eans
Coff
ee b
eans
Coff
ee b
eans
Coff
ee b
eans
Coff
ee b
eans
Coff
ee b
eans
Coff
ee b
eans
Coff
ee b
eans
Coff
ee b
eans
Coff
ee b
eans
Coff
ee b
eans
Coff
ee b
eans
Coff
ee b
eans
Coff
ee b
eans
Coff
ee b
eans
Fren
ch R
oast
, Die
dric
h R
oast
er
Fren
ch R
oast
, Die
dric
h R
oast
er
Dec
af F
ull C
ity, D
iedr
ich
Roa
ster
Won
derla
nd P
ark
Espr
esso
, Prim
o R
oast
er
Med
/Dar
k Pa
ngda
, Prim
o R
oast
er
Bol
ivia
n, P
rimo
Roa
ster
Sol y
Caf
é, P
rimo
Roa
ster
Full
City
, Prim
o R
oast
er
Peru
vian
Nat
ural
, Prim
o R
oast
er
Hon
dura
n H
oney
, Prim
o R
oast
er
Polin
ator
, Prim
o R
oast
er
Mex
ican
Dar
k, P
rimo
Roa
ster
Nic
arag
ua, P
rimo
Roa
ster
Espr
esso
, Prim
o R
oast
er
Dec
af D
ark,
Die
dric
h R
oast
er
9216
6225
275
2295
2043
0
7286
6853
278
2557
3063
0
2898
3164
0
2806
3578
0
1651
2474
0
3077
4242
0
1656
2478
0
205
192
0
971
1128
0
472
234
0
311
191
0
1386
756
0
5183
3020
0

Page 43Health Hazard Evaluation Report 2016-0013-3294
Expe
rienc
ed in
the
last
12
mon
ths
Expe
rienc
ed in
the
last
4 w
eeks
Sym
ptom
N =
13
N =
13
Num
ber (
%)
Num
ber (
%)
Nos
e sy
mpt
oms*
11
(85%
)7
(54%
)E
ye sy
mpt
oms†
10
(77%
)6
(46%
)Si
nusi
tis o
r si
nus p
robl
ems
6 (4
6%)
2 (1
5%)
Prob
lem
with
abi
lity
to sm
ell
6 (4
6%)
-Ph
legm
on
mos
t day
s for
3 m
onth
s2
(15%
)-
Low
er r
espi
rato
ry sy
mpt
oms (
repo
rted
at l
east
one
of t
he fo
llow
ing)
8 (6
2%)
5 (3
8%)
Bre
athi
ng tr
oubl
e 5
(38%
)3
(23%
)
C
hest
whe
ezin
g or
whi
stlin
g 4
(31%
)3
(23%
)
Aw
oke
with
che
st ti
ghtn
ess
4 (3
1%)
1 (8
%)
SOB
on
leve
l gro
und
or w
alki
ng u
p a
slig
ht a
hill
2 (1
5%)
-
Aw
oke
with
shor
tnes
s of b
reat
h 2
(15%
)1
(8%
)
A
sthm
a at
tack
1 (8
%)
0
U
sual
cou
gh
00
Sy
stem
ic sy
mpt
oms (
repo
rted
at l
east
one
of t
he fo
llow
ing)
11 (8
5%)
3 (2
3%)
Flu
-like
ach
ines
s or a
chy
join
ts
8 (6
2%)
0
F
ever
or c
hills
6 (4
6%)
1 (8
%)
Unu
sual
tire
dnes
s or f
atig
ue3
(23%
)3
(23%
) th
e sy
mpt
om.
four
wee
k qu
estio
n w
as n
ot a
sked
for
eath
; “-“
= A
of p
artic
ipan
ts; S
OB
=sho
rtne
ss o
f br
Not
e: N
=num
ber
2) s
tingi
ng, b
urni
ng n
ose.
, or
runn
y no
se o
r 2
) stin
ging
, bur
ning
eye
s. b
oth
of th
e fo
llow
ing:
1) s
tuffy
, itc
hy, i
tchy
eye
s or
bot
h of
the
follo
win
g: 1
) wat
ery
*Nos
e sy
mpt
oms i
nclu
des o
ne o
r†E
ye sy
mpt
oms i
nclu
des o
ne o
r
. Pre
vale
nce
of r
epor
ted
sym
ptom
s, N
IOSH
med
ical
surv
ey, J
une
2016
6A
able
T
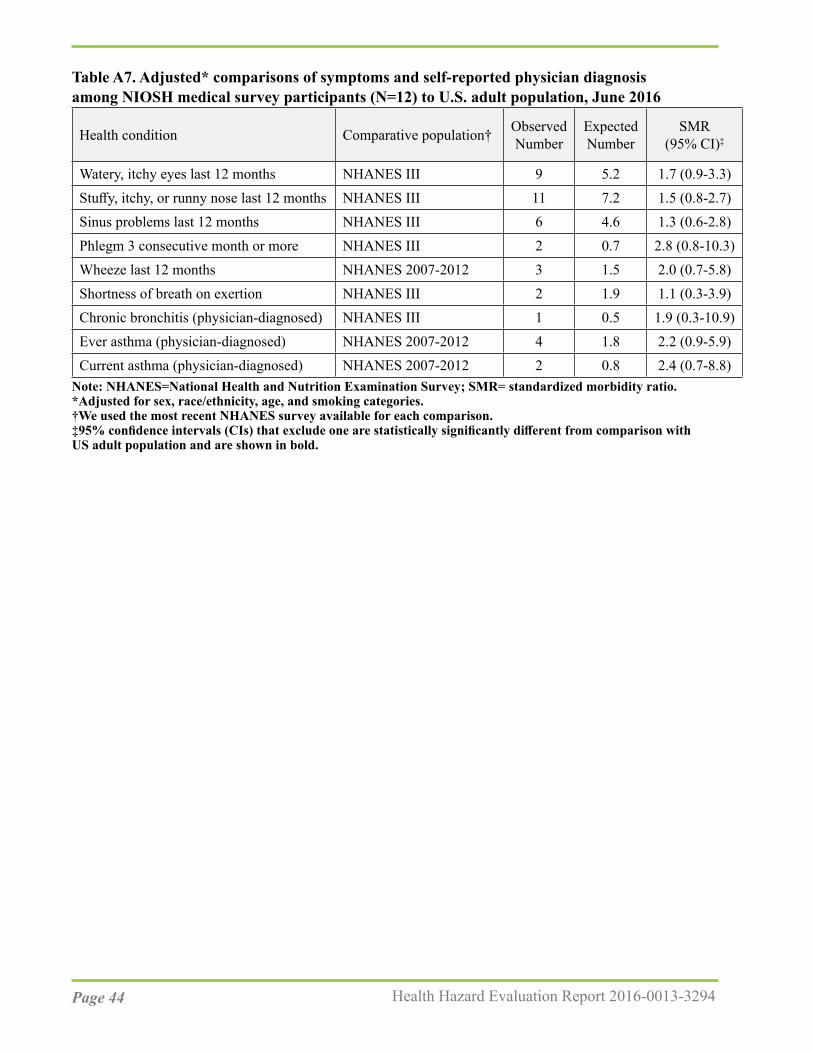
Page 44 Health Hazard Evaluation Report 2016-0013-3294
Table A7. Adjusted* comparisons of symptoms and self-reported physician diagnosis among NIOSH medical survey participants (N=12) to U.S. adult population, June 2016
Health condition Comparative population† Observed Number
Expected Number
SMR(95% CI)‡
Watery, itchy eyes last 12 months NHANES III 9 5.2 1.7 (0.9-3.3)Stuffy, itchy, or runny nose last 12 months NHANES III 11 7.2 1.5 (0.8-2.7)Sinus problems last 12 months NHANES III 6 4.6 1.3 (0.6-2.8)Phlegm 3 consecutive month or more NHANES III 2 0.7 2.8 (0.8-10.3)Wheeze last 12 months NHANES 2007-2012 3 1.5 2.0 (0.7-5.8)Shortness of breath on exertion NHANES III 2 1.9 1.1 (0.3-3.9)Chronic bronchitis (physician-diagnosed) NHANES III 1 0.5 1.9 (0.3-10.9)Ever asthma (physician-diagnosed) NHANES 2007-2012 4 1.8 2.2 (0.9-5.9)Current asthma (physician-diagnosed) NHANES 2007-2012 2 0.8 2.4 (0.7-8.8)
Note: NHANES=National Health and Nutrition Examination Survey; SMR= standardized morbidity ratio.*Adjusted for sex, race/ethnicity, age, and smoking categories.†We used the most recent NHANES survey available for each comparison.‡95% confidence intervals (CIs) that exclude one are statistically significantly different from comparison withUS adult population and are shown in bold.

Page 45Health Hazard Evaluation Report 2016-0013-3294
ReferencesACGIH® (American Conference of Governmental Industrial Hygienist) [2016]. 2016 TLVs® and BEIs®: Threshold limit values for chemical substances and physical agents and biological exposure indices. Cincinnati, OH: American Conference of Governmental Industrial Hygienists.
ACGIH® [2017]. Chemicals Substances and Other Issues Under Study (TLV®-CS). Available at: http://www.acgih.org/tlv-bei-guidelines/documentation-publications-and-data/under-study-list/chemical-substances-and-other-issues-under-study-tlv. Date accessed: October 2017.
Akiyama M, Murakami K, Ohtani N, Iwatsuki K, Sotoyama K, Wada A, Tokuno K, Iwabuchi H, Tanaka K [2003]. Analysis of volatile compounds released during the grinding of roasted coffee beans using solid-phase microextraction. J Agric Food Chem 51(7):1961-1969.
Akpinar-Elci M, Travis WD, Lynch DA, Kreiss K [2004]. Bronchiolitis obliterans syndrome in popcorn production plant workers. Eur Respir J 24(2):298-302.
Anderson BA, Shimoni E, Liardon R, Labuza P [2003]. The diffusion kinetics of carbon dioxide in fresh roasted and ground coffee. J Food Eng 59:71-78.
ANSI (American National Standards Institute)/ASHRAE [2017]. Method of testing general ventilation air-cleaning devices for removal efficiency by particle size, standard 52.2-2017. Atlanta, GA: ASHRAE.
Bailey RL, Cox-Ganser JM, Duling MG, LeBouf RF, Martin SB Jr, Bledsoe TA, Green BJ, Kreiss K [2015]. Respiratory morbidity in a coffee processing workplace with sentinel obliterative bronchiolitis cases. Am J Ind Med 58(12):1235-1245.
Berger KI, Reibman J, Oppenheimer BW, Vlahos I, Harrison D, Goldring RM [2013]. Lessons from the World Trade Center disaster: airway disease presenting as restrictive dysfunction. Chest 144(1):249-257.
Burney P, Chinn S [1987]. Developing a new questionnaire for measuring the prevalence and distribution of asthma. Chest 91 (6 Suppl):79S-83S.
Burney PG, Laitinen LA, Perdrizet S, Huckauf H, Tattersfield AE, Chinn S, Poisson N, Heeren A, Britton JR, Jones T [1989]. Validity and repeatability of the IUATLD (1984) Bronchial symptoms questionnaire: an international comparison. Eur Respir J 2(10):940-945.
Burney PG, Luczynska C, Chinn S, Jarvis D [1994]. The European community respiratory health survey. Eur Respir J 7(5):954-960.

Page 46 Health Hazard Evaluation Report 2016-0013-3294
CDC (Centers for Disease Control and Prevention) [1996]. Third National Health and Nutrition Examination Survey, 1988–1994, NHANES III Examination Data File [CDROM]. Hyattsville, Maryland: U.S. Department of Health and Human Services, Centers for Disease Control and Prevention. (Public use data file documentation No. 76300.)
CDC [2013a]. Obliterative bronchiolitis in workers in a coffee-processing facility—Texas, 2008–2012. Morb Mortal Wkly Rep 62(16):305–307.
CDC [2013b]. Carbon monoxide. Available at: https://www.cdc.gov/niosh/topics/co-comp/default.html. Date accessed: Date accessed: October 2017.
CDC [2017a]. National Center for Health Statistics. National Health and Nutrition Examination Survey Data. Hyattsville, MD: U.S. Department of Health and Human Services, Centers for Disease Control and Prevention, [2007-2012] Available at: https://wwwn.cdc.gov/nchs/nhanes/default.aspx. Accessed: October 2017.
CDC [2017b]. Smoking & tobacco use: quit smoking. Available at: https://www.cdc.gov/tobacco/stateandcommunity/tobacco_control_programs/index.htm. Date accessed: Date accessed: October 2017.
CFR. Code of Federal Regulations. Washington, DC: U.S. Government Printing Office, Office of the Federal Register.
Cockcroft D, Davis B [2009]. Direct and indirect challenges in the clinical assessment of asthma. Ann Allergy Asthma Immunol 103(5):363-369.
Daglia M, Papetti A, Aceti C, Sordelli B, Spini V, Gazzani G [2007]. Isolation and determination of α-dicarbonyl compounds by RP-HPLC-DAD in green and roasted coffee. J Agric and Food Chem 55(22):8877-8882.
Day G, LeBouf R, Grote A, Pendergrass S, Cummings K, Kreiss K, and Kullman G [2011]. Identification and measurement of diacetyl substitutes in dry bakery mix production. J Occ Env Hygiene 8(2):93-103.
de Assumpção MS, Gonçalves RM, Martins R, Bobbio TG, Schivinski CI [2016]. Reference Equations for Impulse Oscillometry System Parameters in Healthy Brazilian Children and Adolescents. Respir Care 61(8):1090-1099.
Desiraju K, Agrawal A [2016]. Impulse oscillometry: The state-of-art for lung function testing. Lung India 33(4):410-416.
Duling MG, LeBouf RF, Cox-Ganser JM, Kreiss K, Martin SB Jr, Bailey RL [2016]. Environmental characterization of a coffee processing workplace with obliterative bronchiolitis in former workers. J Occup Environ Hyg 13(10):770-781.

Page 47Health Hazard Evaluation Report 2016-0013-3294
Dweik RA, Boggs PB, Erzurum SC, Irvin CG, Leigh MW, Lundberg JO, Olin AC, Plummer AL, Taylor DR; American Thoracic Society Committee on Interpretation of Exhaled Nitric Oxide Levels (FENO) for Clinical Applications [2011]. An official ATS clinical practice guideline: interpretation of exhaled nitric oxide levels (FENO) for clinical applications. Am J Respir Crit Care Med 184(5):602-615.
EAACI Task Force on Occupational Rhinitis, Moscato G, Vandenplas O, Gerth Van Wijk R, Malo JL, Quirce S, Walusiak J, Castano R, De Groot H, Folletti I, Gautrin D, Yacoub MR, Perfetti L, Siracusa A [2008]. Occupational rhinitis. Allergy 63(8):969-980.
ECRHS (European Community Respiratory Health Survey) [2014]. Questionnaires, protocols and instructions. Available at: http://www.ecrhs.org/Quests.htm. Date accessed: October 2017.
Ferris BG [1978]. Epidemiology standardization project. Am Rev Respir Dis 118(Suppl):1–53.
Figley KD, Rawling FF [1950] Castor bean: an industrial hazard as a contaminant of green coffee dust and used burlap bags. J Allergy 21:545–553.
Ghanei M, Tazelaar HD, Chilosi M, Harandi AA, Peyman M, Akbari HM, Shamsaei H, Bahadori M, Aslani J, Mohammadi A [2008]. An international collaborative pathologic study of surgical lung biopsies from mustard gas-exposed patients. Respir Med 102(6):825-30.
Grassi M, Rezzani C, Biino G, Marinoni A [2003]. Asthma-like symptoms assessment through ECRHS screening questionnaire scoring. J Clin Epidemiol 56(3):238–247.
Hankinson JL, Odencrantz JR, Fedan KB [1999]. Spirometric reference values from a sample of the general U.S. population. Am J Respir Crit Care Med 159(1):179-187.
Henneberger PK Redlich CA, Callahan DB, Harber P, Lemière C, Martin J, Tarlo SM, Vandenplas O, Torén K; ATS Ad Hoc Committee on Work-Exacerbated Asthma [2011]. An official American Thoracic Society statement: work-exacerbated asthma. Am J Respir Crit Care Med 184(3):368–378.
Hubbs AF, Cumpston AM, Goldsmith WT, Battelli LA, Kashon ML, Jackson MC, Frazer DG, Fedan JS, Goravanahally MP, Castranova V, Kreiss K, Willard PA, Friend S, Schwegler- Berry D, Fluharty KL, Sriram K [2012]. Respiratory and olfactory cytotoxicity of inhaled 2,3-pentanedione in Sprague-Dawley rats. Am J Pathol 181(3):829-844.
Kanwal R, Kullman G, Piacitelli C, Boylstein R, Sahakian N, Martin S, Fedan K, Kreiss K [2006]. Evaluation of flavorings-related lung disease risk at six microwave popcorn plants. J Occup Environ Med. 48(2):149-57.

Page 48 Health Hazard Evaluation Report 2016-0013-3294
Karr RM, Davies RJ, Butcher BT, Lehrer SB, Wilson MR, Dharmarajan V, Salvaggio JE [1978]. Occupational asthma. J Allergy Clin Immunol 61(1):54–65.
Kim TJ, Materna BL, Prudhomme JC, Fedan KB, Enright PL, Sahakian NM, Windham GC, Kreiss K [2010]. Industry-wide medical surveillance of California flavor manufacturing workers: Cross-sectional results. Am J Ind Med 53(9):857-865.
King MS, Eisenberg R, Newman JH, Tolle JJ, Harrell FE Jr, Nian H, Ninan M, Lambright ES, Sheller JR, Johnson JE, Miller RF [2011]. Constrictive bronchiolitis in soldiers returning from Iraq and Afghanistan. N Engl J Med. 365(3):222-230.
Kreiss K [2013]. Occupational causes of constrictive bronchiolitis. Curr Opin Allergy Clin Immunol 13(2):167-172.
Komarow HD, Myles IA, Uzzaman A, Metcalfe DD [2011]. Impulse oscillometry in the evaluation of diseases of the airways in children. Ann Allergy Asthma Immunol 106(3):191-199.
Langford NJ [2005]. Carbon dioxide poisoning. Toxicol Rev 24(4):229-235.
LeBouf RF, Stefaniak AB, Virji, MA [2012]. Validation of evacuated canisters for sampling volatile organic compounds in healthcare settings. J Environ Monit 14(3):977–983.
LeBouf RF and Simmons M [2017]. Increased sensitivity of OSHA method analysis of diacetyl and 2,3-pentanedione in air. J Occup Environ Hyg 14(5):343-348.
Lee JY, Seo JH, Kim HY, Jung YH, Kwon JW, Kim BJ, Kim HB, Lee SY, Jang GC, Song DJ, Kim WK, Shim JY, Kim HJ, Shin YJ, Park JW, Cho SH, Lee JS, Hong SJ [2012]. Reference values of impulse oscillometry and its utility in the diagnosis of asthma in young Korean children. J Asthma 49(8):811-816.
Lehrer SB, Karr RM, Salvaggio JE [1978]. Extraction and analysis of coffee bean allergens. Clin Allergy 8(3):217-226.
Malmberg LP, Pelkonen A, Poussa T, Pohianpalo A, Haahtela T, Turpeinen M [2002]. Determinants of respiratory system input impedance and bronchodilator response in healthy Finnish preschool children. Clin Physiol Funct Imaging 22(1):64-71.
Miller MR, Hankinson J, Brusasco V, Burgos F, Casaburi R, Coates A, Crapo R, Enright P, van der Grinten CP, Gustafsson P, Jensen R, Johnson DC, MacIntyre N, McKay R, Navajas D, Pedersen OF, Pellegrino R, Viegi G, Wanger J, ATS/ERS Task Force [2005]. Standardisation of spirometry. Eur Respir J 26(2):319-338.

Page 49Health Hazard Evaluation Report 2016-0013-3294
Morgan DL, Jokinen MP, Price HC, Gwinn WM, Palmer SM, Flake GP [2012]. Bronchial and bronchiolar fibrosis in rats exposed to 2,3-pentanedione vapors: implications for bronchiolitis obliterans in humans. Toxicol Pathol 40(3):448-465.
Morgan DL, Jokinen MP, Johnson CL, Price HC, Gwinn WM, Bousquet RW, Flake GP [2016]. Chemical reactivity and respiratory toxicity of the α-diketone flavoring agents: 2,3-butanedione, 2,3-pentanedione, and 2,3-hexanedione. Toxicol Pathol 44(5):763–783.
Newbury W, Crockett A, Newbury J [2008]. A pilot study to evaluate Australian predictive equations for the impulse oscillometry system. Respirology 13(7):1070-1075.
Newton J [2002]. Carbon monoxide exposure from coffee roasting. Appl Occup Environ Hyg 17(9):600-602.
NIOSH (National Institute for Occupational Safety and Health) [2003]. NIOSH manual of analytical methods (NMAM®). 4th ed. Schlecht PC, O’Connor PF, eds. Cincinnati, OH: U.S. Department of Health and Human Services, Centers for Disease Control and Prevention, National Institute for Occupational Safety and Health, DHHS (NIOSH) Publication 94–113 (August 1994); 1st Supplement Publication 96–135, 2nd Supplement Publication 98–119; 3rd Supplement 2003–154. Available at: http://www.cdc.gov/niosh/docs/2003-154/. Date accessed: October 2017.
NIOSH [2004]. NIOSH respirator selection logic. Department of Health and Human Services, Centers for Disease Control and Prevention, National Institute for Occupational Safety and Health DHHS (NIOSH) Publication No. 2005-100. Available at: https://www.cdc.gov/niosh/docs/2005-100/pdfs/2005-100.pdf. Date accessed: October 2017.
NIOSH [2010]. NIOSH pocket guide to chemical hazards. Cincinnati, OH: U.S. Department of Health and Human Services, Centers for Disease Control and Prevention, National Institute for Occupational Safety and Health, DHHS (NIOSH) Publication No. 2010-168c. Available at: http://www.cdc.gov/niosh/npg/. Date accessed: October 2017.
NIOSH [2012]. Flavoring-related lung disease. Information for healthcare providers. Department of Health and Human Services, Centers for Disease Control and Prevention, DHHS (NIOSH) Publication No. 2012-148 (supersedes 2012-107). Available at: http://www.cdc.gov/niosh/docs/2012-148/. Date accessed: October 2017.
NIOSH [2016]. Criteria for a recommended standard: occupational exposure to diacetyl and 2,3-pentanedione. U.S. Department of Health and Human Services, Centers for Disease Control and Prevention, National Institute for Occupational Safety and Health, DHHS (NIOSH) Publication No. 2016-111. Available at: https://www.cdc.gov/niosh/docs/2016-111/. Date accessed: October 2017.
Nishimura F, Abe S, Fukunaga T [2003]. Carbon monoxide poisoning from industrial coffee extraction. JAMA 290(3):334.
Page 50 Health Hazard Evaluation Report 2016-0013-3294
Ohashi Y, Motojima S, Fukuda T, Makino S [1992]. Airway hyperresponsiveness, increased intracellular spaces of bronchial epithelium, and increased infiltration of eosinophils and lymphocytes in bronchial mucosa in asthma. Am Rev Respir Dis 145(6):1469-1476.
Oldenburg M, Bittner C, Baur X [2009]. Health risks due to coffee dust. Chest 136(2):536-544.
Oppenheimer BW, Goldring RM, Herberg ME, Hofer IS, Reyfman PA, Liautaud S, Rom WN, Reibman J, Berger KI [2007]. Distal airway function in symptomatic subjects with normal spirometry following World Trade Center dust exposure. Chest 132(4):1275–1282.
OSHA (Occupational Safety and Health Administration) [1993]. Compliance and enforcement activities affected by the PELs decision. August 5, 1993 Memorandum. Available at: https://www.osha.gov/pls/oshaweb/owadisp.show_document?p_table=INTERPRETATIONS&p_id=21220. Date accessed: October 2017.
OSHA [2003]. Enforcement policy for respiratory hazards not covered by OSHA permissible exposure limits. January 24, 2003 Memorandum. Available at: https://www.osha.gov/pls/oshaweb/owadisp.show_document?p_table=INTERPRETATIONS&p_id=24749. Date accessed: October 2017.
OSHA [2008]. Sampling and analytical methods: Method 1013 – Acetoin and diacetyl. Available at: http://www.osha.gov/dts/sltc/methods/validated/1013/1013.html. Date accessed: October 2017.
OSHA [2010]. Sampling and analytical methods: Method 1016 – 2,3-pentanedione. Available at: http://www.osha.gov/dts/sltc/methods/validated/1016/1016.html. Date accessed: October 2017.
OSHA [2014]. OSHA fact sheet: Do you have work-related asthma? A guide for you and your doctor. Washington, D.C.: U.S. Department of Labor, Occupational Safety and Health Administration. Available at: https://www.osha.gov/Publications/OSHA3707.pdf. Date accessed: October 2017.
OSHA [2016]. Permissible exposure limits – annotated tables. Available at: https://www.osha.gov/dsg/annotated-pels/index.html. Date accessed: October 2017.
Park JH, Yoon JW, Shin YH, Jee HM, Wee YS, Chang SJ, Sim JH, Yum HY, Han MY [2011]. Reference values for respiratory system impedence using impulse oscillometry in healthy preschool children. Korean J Pediatr 54(2)64-68.
Pellegrino R, Viegi G, Brusasco V, Crapo RO, Burgos F, Casaburi R, Coates A, van der Grinten CP, Gustafsson P, Hankinson J, Jensen R, Johnson DC, MacIntyre N, McKay R, Miller MR, Navajas D, Pedersen OF, Wanger J [2005]. Interpretative strategies for lung function tests. Eur Respir J 26(5):948–968.

Page 51Health Hazard Evaluation Report 2016-0013-3294
Perez T, Chanez P, Dusser D, Devillier P [2013]. Small airway impairment in moderate to severe asthmatics without significant proximal airway obstruction. Respir Med 2013 Nov;107(11):1667-1674.
Raffel JB, Thompson J [2013]. Carbon monoxide from domestic coffee roasting: a case report. Ann Intern Med 159(11):795-796.
Rondón C, Campo P, Galindo L, Blanca-López N, Cassinello MS, Rodriguez-Bada JL, Torres MJ, Blanca M [2012]. Prevalence and clinical relevance of local allergic rhinitis. Allergy. 67(10):1282-1288.
Rondón C, Bogas G, Barrionuevo E, Blanca M, Torres MJ, Campo P [2017]. Nonallergic rhinitis and lower airway disease. Allergy 72(1):24-34.
Rose JJ, Wang L, Xu Q, McTiernan CF, Shiva S, Tejero J, Gladwin MT [2017]. Carbon monoxide poisoning: pathogenesis, management, and future directions of therapy. Am J Respir Crit Care Med 195(5):596-606.
Sahay S, Gera K, Bhargava SK, Shah A [2016]. Occurrence and impact of sinusitis in patients with asthma and/or allergic rhinitis. J Asthma 53(6):635-643.
Sakwari G, Mamuya SH, Bråtveit M, Moen BE [2013]. Respiratory symptoms, exhaled nitric oxide, and lung function among workers in Tanzanian coffee factories. J Occup Environ Med 55(5):544-551.
Schulz H, Flexeder C, Behr J, Heier M, Holle R, Huber RM, Jörres RA, Nowak D, Peters A, Wichmann HE, Heinrich J, Karrasch S; KORA Study Group [2013]. Reference values of impulse oscillometric lung function indices in adults of advanced age. PLoS One 8(5):e63366. doi: 10.1371/journal.pone.0063366.
Schulze J, Biedebach S, Christmann M, Herrmann E, Voss S, Zielen S [2016]. Impulse oscillometry as a predictor of asthma exacerbations in young children. Respiration 91(2):107-114.
Shaaban R, Zureik M, Soussan D, Neukirch C, Heinrich J, Sunyer J, Wjst M, Cerveri I, Pin I, Bousquet J, Jarvis D, Burney PG, Neukirch F, Leynaert B [2008]. Rhinitis and onset of asthma: a longitudinal population-based study. Lancet. 372(9643):1049-1057.
Shi Y, Aledia AS, Tatavoosian AV, Vijayalakshmi S, Galant SP, George SC [2012]. Relating small airways to asthma control by using impulse oscillometry in children.Allergy Clin Immunol 129(3):671-678.
Smith HJ, Reinhold P, Goldman MD [2005]. Forced oscillation technique and impulse oscillometry. In: Gosselink R, Stam H, eds. European Respiratory Monograph 31: Lung Function Testing. Vol. 10. Wakefield, UK: European Respiratory Society Journals, pp. 72–105.

Page 52 Health Hazard Evaluation Report 2016-0013-3294
Smith HJ ([email protected]) [2015]. Questions about impulse oscillometry. Email of December 9, 2015, from Hans-Juergen Smith, CareFusion, to Rachel Bailey ([email protected]), Respiratory Health Division, National Institute for Occupational Safety and Health, Centers for Disease Control and Prevention, Department of Health and Human Services.
Song TW, Kim KW, Kim ES, Park JW, Sohn MH, Kim KE [2008]. Utility of impulse oscillometry in young children with asthma. Pediatr Allergy Immunol 19(8):763-768.
Tarlo SM, Lemiere C [2014]. Occupational asthma. N Engl J Med 370:640-649.
Tarlo SM [2016].Update on work-exacerbated asthma. Int J Occup Med Environ Health 29(3):369-374.
Thomas KE, Trigg CJ, Baxter PJ, Topping M, Lacey J, Crook B, Whitehead P, Bennett JB, Davies RJ. [1991]. Factors relating to the development of respiratory symptoms in coffee process workers. Br J Ind Med 48(5):314–322.
Usmani OS, Singh D, Spinola M, Bizzi A, Barnes PJ [2016].The prevalence of small airways disease in adult asthma: A systematic literature review. Respir Med 116:19-27.
Vogel J, Smidt U [1994] Impulse oscillometry. analysis of lung mechanics in general practice and clinic, epidemiological and experimental research.1st ed. Frankfurt: PMI-Verlagsgruppe.
Weinstein DJ, Hull JE, Ritchie BL, Hayes JA, Morris MJ [2016]. Exercise-associated excessive dynamic airway collapse in military personnel. Ann Am Thorac Soc 13(9):1476-1482.
Zuskin E, Valić F, Skurić Z [1979]. Respiratory function in coffee workers. Br J Ind Med 36(2):117–122.
Zuskin E, Kanceljak B, Skurić Z, Butković D [1985]. Bronchial reactivity in green coffee exposure. Br J Ind Med 42(6):415-420.
Zuskin E, Schachter EN, Kanceljak B, Witek TJ Jr, Fein E [1993]. Organic dust disease of airways. Int Arch Occup Environ Health 65(2):135-140.

Page 53Health Hazard Evaluation Report 2016-0013-3294
Keywords: NAICS 311920 (Coffee roasting), Minnesota, diacetyl, 2,3-pentanedione, 2,3-hexanedione, coffee, volatile organic compounds (VOCs).
Page 54 Health Hazard Evaluation Report 2016-0013-3294
This page left intentionally blank
Page 55Health Hazard Evaluation Report 2016-0013-3294
The Health Hazard Evaluation Program investigates possible health hazards in the workplace under the authority of the Occupational Safety and Health Act of 1970 (29 U.S.C. § 669(a)(6)). The Health Hazard Evaluation Program also provides, upon request, technical assistance to federal, state, and local agencies to investigate occupational health hazards and to prevent occupational disease or injury. Regulations guiding the Program can be found in Title 42, Code of Federal Regulations, Part 85; Requests for Health Hazard Evaluations (42 CPR Part 85).
Disclaimers The recommendations in this report are made on the basis of the findings at the workplace evaluated and may not be applicable to other workplaces.
Mention of any company or product in this report does not constitute endorsement by the National Institute for Occupational Safety and Health (NIOSH).
Citations to Web sites external to NIOSH do not constitute NIOSH endorsement of the sponsoring organizations or their programs or products. NIOSH is not responsible for the content of these Web sites. All Web addresses referenced in this document were accessible as of the publication date.
AcknowledgmentsDesktop Publisher: Tia McClelland Data Analysis Support: Nicole Edwards, Kathy Fedan, and Brian TiftNIOSH Laboratory Assistance: Dru Burns, Kyle Hatcher, Ryan LeBouf, Anand RanparaSite Visit Team Members: Rachel Bailey, Matthew Duling, Brie Hawley, Robert Lawrence, Stephen Martin, Jr., and Brian Tift
Availability of ReportCopies of this report have been sent to the employer, employees, and union at the facility. The state and local health department and the Occupational Safety and Health Administration Regional Office have also received a copy. This report is not copyrighted and may be freely reproduced.
This report is available at http://www.cdc.gov/niosh/hhe/reports/pdfs/2016-0013-3294.pdf.All other HHE Reports may be found at http://www2a.cdc.gov/hhe/search.asp.
Recommended citation for this report:NIOSH [2017]. Health hazard evaluation report: evaluation of exposures and respiratory health at a coffee roasting and packaging facility. By Hawley B, Martin S, Duling M, Bailey RL. Morgantown, WV: U.S. Department of Health and Human Services, Centers for Disease Control and Prevention, National Institute for Occupational Safety and Health, NIOSH HHE Report No. 2016-0013-3294.
To receive documents or other information aboutoccupational safety and health topics, contact NIOSH
Telephone: 1-800-CDC-INFO (1-800-232-4636)TTY: 1-888-232-6348email: [email protected] visit the NIOSH website at http://www.cdc.gov/niosh
Delivering on the Nation’s promise:Safety and health at work for all people through research and prevention