brian golding bhs-ciwem - · pdf filerainfall prediction dr. brian golding ... image...
TRANSCRIPT

© Crown copyright 2007 Page 1
Rainfall predictionDr. Brian Golding
Head of Meteorology Research & DevelopmentMet Office
June 2007

© Crown copyright 2007 Page 2
Outline
Extreme rainfall eventsRadar observationExtrapolation nowcastingNWP nowcasting

© Crown copyright 2007 Page 3
Extreme rainfall events
© Crown copyright 2007 Page 4
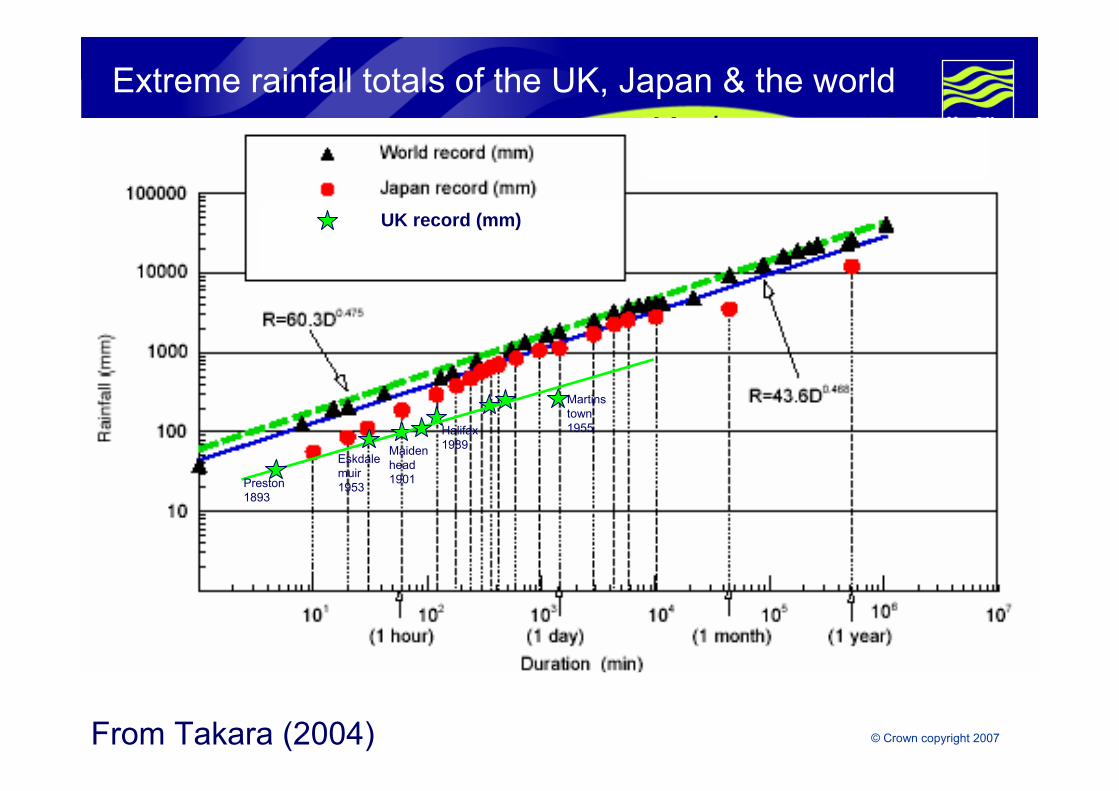
Extreme rainfall totals of the UK, Japan & the world
Takara, 1996, 97, 2004
Maximum Precipitation records of the world
Preston 1893
Eskdalemuir1953
Maidenhead 1901
Halifax 1989
Martinstown1955
From Takara (2004)
UK record (mm)
© Crown copyright 2007
© Crown copyright 2007 Page 5
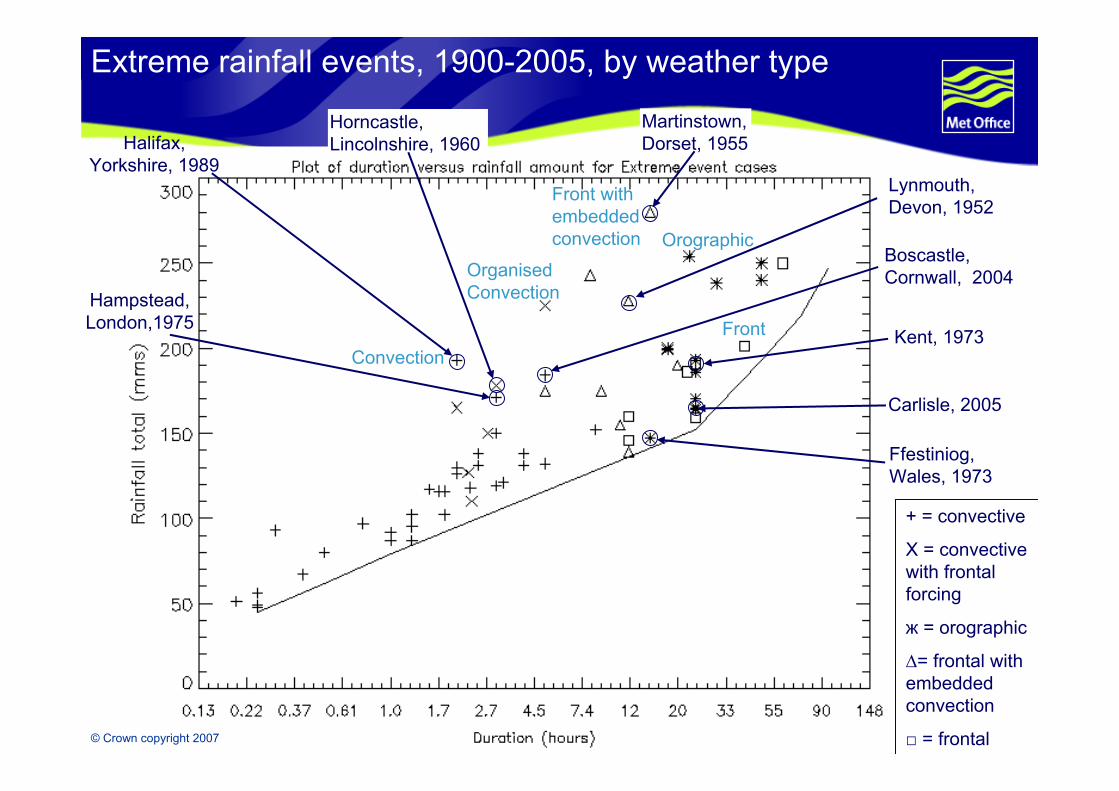
Extreme rainfall events, 1900-2005, by weather type
Convection
Organised Convection
Front with embedded convection
Front
OrographicBoscastle, Cornwall, 2004
Kent, 1973
Lynmouth, Devon, 1952
Ffestiniog, Wales, 1973
Hampstead, London,1975
Halifax, Yorkshire, 1989
Horncastle, Lincolnshire, 1960
Martinstown, Dorset, 1955
+ = convective
X = convective with frontal forcing
ж = orographic
∆= frontal with embedded convection
□ = frontal
Carlisle, 2005
© Crown copyright 2007

© Crown copyright 2007 Page 6
Scales of Motion & Predictability
Hail shaft
Thunderstorm
Front
Extratropical Cyclone
Space Scale
Lifetime
Predictability
Nowcast
10mins 1 hr 12hrs 3 days
30mins 3 hrs 36hrs 9 days
2mins 15min 3hrs 18hrs
1000km
100km
10km
1km
MCS*
* Mesoscale Convective System

© Crown copyright 2007 Page 7
Boscastle: Radar and Gauge Accumulations
200.4 mm

© Crown copyright 2007 Page 8
Hampstead, 14th August 1975
Extreme rainfall, 170.8mm in 3 hrs - largest record in LondonStorm consisted of successive clouds, forming to south then drifting north along a stationary convergence lineHigh ground may have been triggerRapid runoff due to hard urban surfaceMajor disruption and several deaths
0
20
40
60
80
100
120
140
160
180
0 60 120 180minutes
Cumulative rainfall (mm)Rainfall rate (mm/hr)

© Crown copyright 2007 Page 9
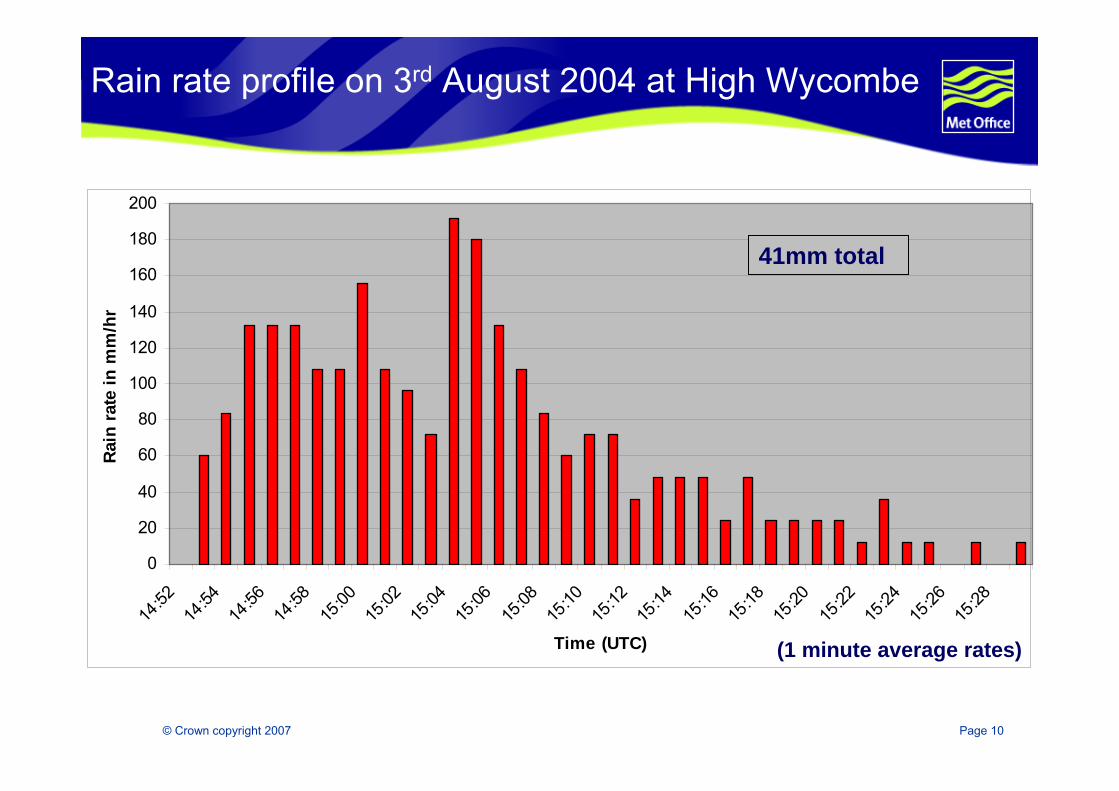
West London flood, 3rd August 2004
Silverlink rail services affected between Willesden & Wembley Signals out of action at Charing Cross & London Bridge due to lightning strikeShop ceilings collapsed in StainesDisruption at Heathrow
Parts of Metropolitan, District, Piccadilly and Central Lines closed by floods.
© Crown copyright 2007 Page 10
Rain rate profile on 3rd August 2004 at High Wycombe
0
20
40
60
80
100
120
140
160
180
200
14:52
14:54
14:56
14:58
15:00
15:02
15:04
15:06
15:08
15:10
15:12
15:14
15:16
15:18
15:20
15:22
15:24
15:26
15:28
Time (UTC)
Rain
rat
e in
mm
/hr
(1 minute average rates)
41mm total

© Crown copyright 2007 Page 11
Nowcasting
© Crown copyright 2007 Page 12
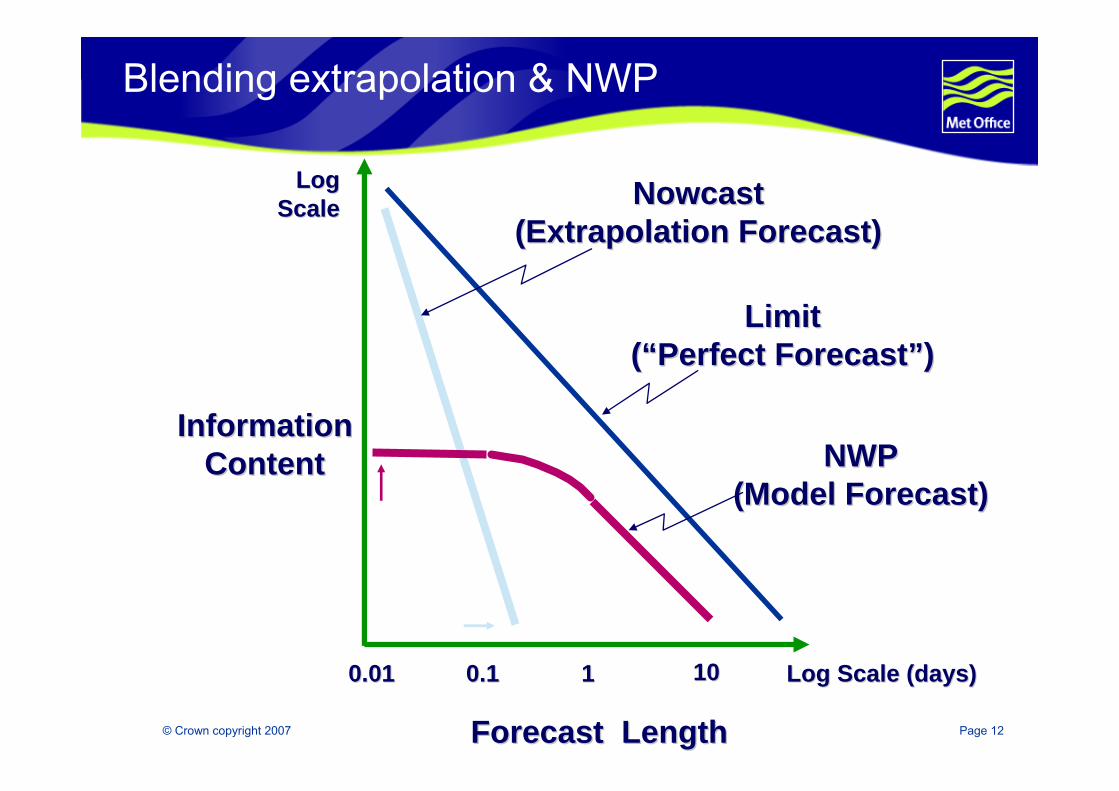
InformationInformationContentContent
Forecast LengthForecast Length
LogLogScaleScale
Log Scale (days)Log Scale (days)0.010.01 0.10.1 11 1010
NowcastNowcast(Extrapolation Forecast)(Extrapolation Forecast)
LimitLimit((““Perfect ForecastPerfect Forecast””))
NWPNWP(Model Forecast)(Model Forecast)
Blending extrapolation & NWP
© Crown copyright 2007 Page 13
The role of Nimrod
A rapid update cyclefor
very short range forecasting of
hazardous weather variables using
high resolution observationsmerged with
NWP forecasts

© Crown copyright 2007 Page 14
Outline structure of Nimrod processing
Each cycle (15 mins)Image processing (radar & satellite)Data fusion (images, lightning fixes, in situ obs)Extrapolation (to T+6 hours)Merging with downscaled NWP (4km grid)Diagnosis

© Crown copyright 2007 Page 15
Planned radar coverage
1km resolution
2km
5km
© Crown copyright 2007 Page 16
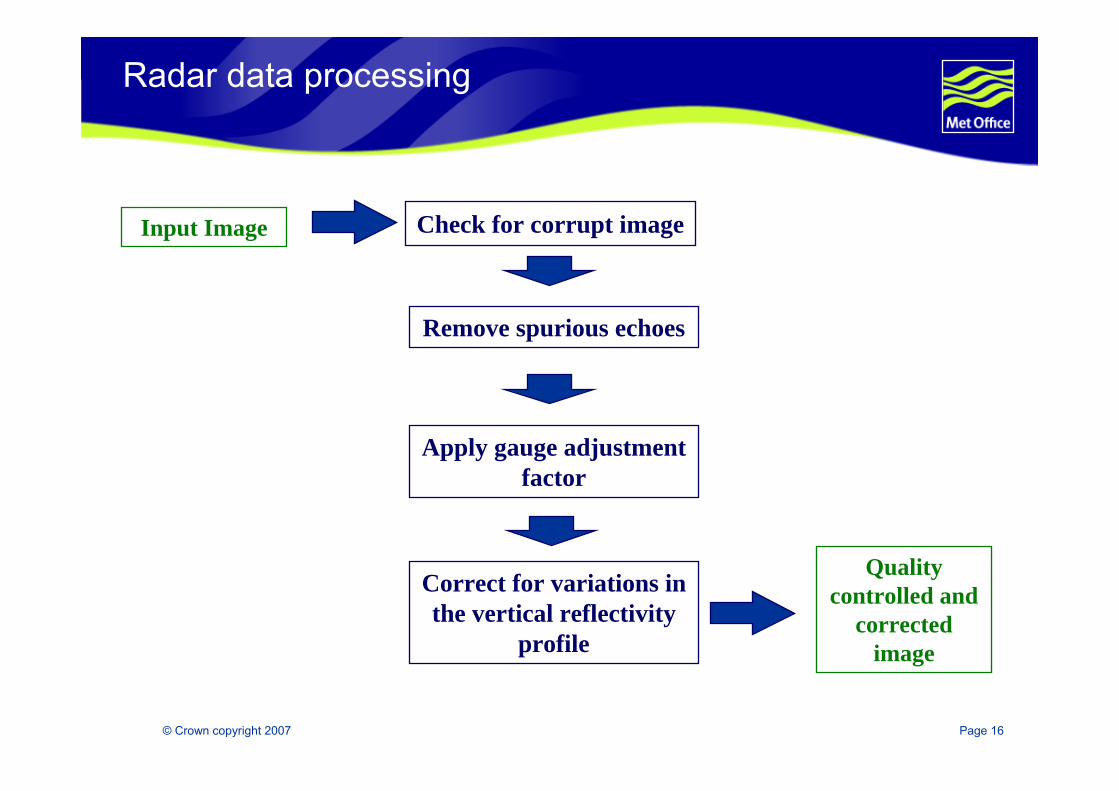
Apply gauge adjustment factor
Correct for variations in the vertical reflectivity
profile
Remove spurious echoes
Check for corrupt imageInput Image
Quality controlled and
corrected image
Radar data processing
© Crown copyright 2007 Page 17
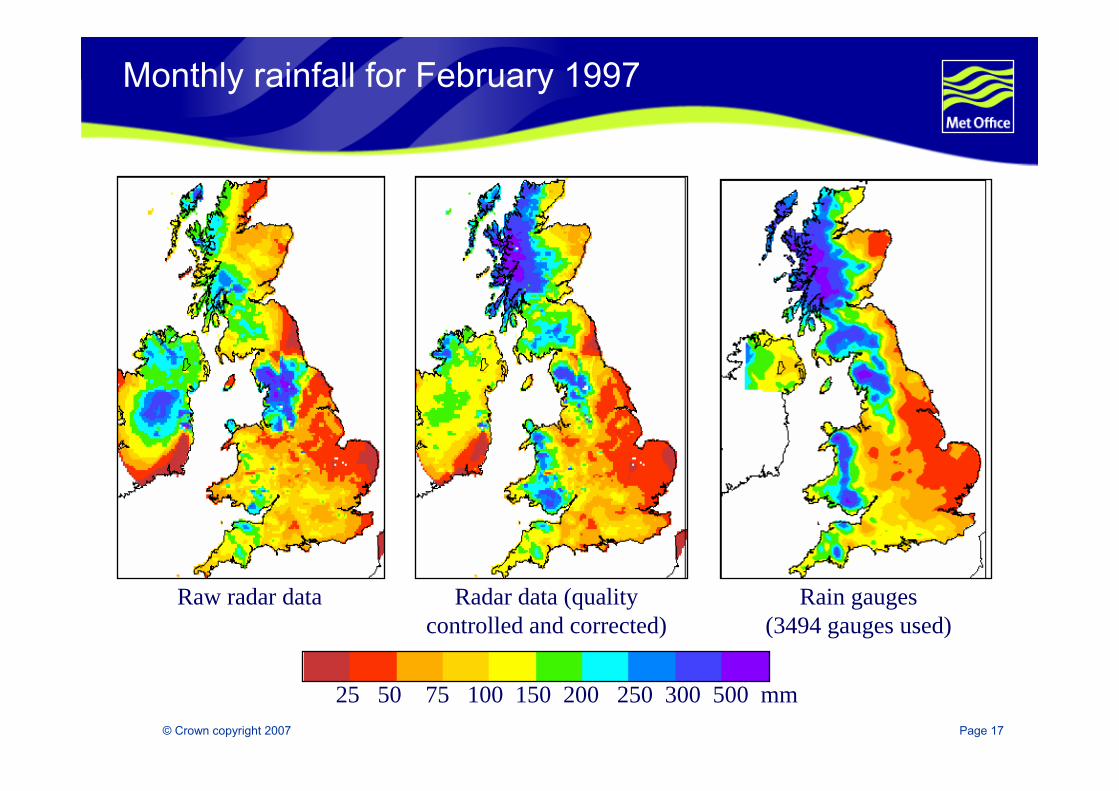
Raw radar data Radar data (qualitycontrolled and corrected)
25 50 75 100 150 200 250 300 500 mm
Rain gauges(3494 gauges used)
Monthly rainfall for February 1997

© Crown copyright 2007 Page 18
Raw Radar data Radar data (qualitycontrolled and corrected)
25 50 75 100 150 200 250 300 500 mm
Rain gauges (3463 gauges used)
Monthly rainfall for June 1997
© Crown copyright 2007 Page 19
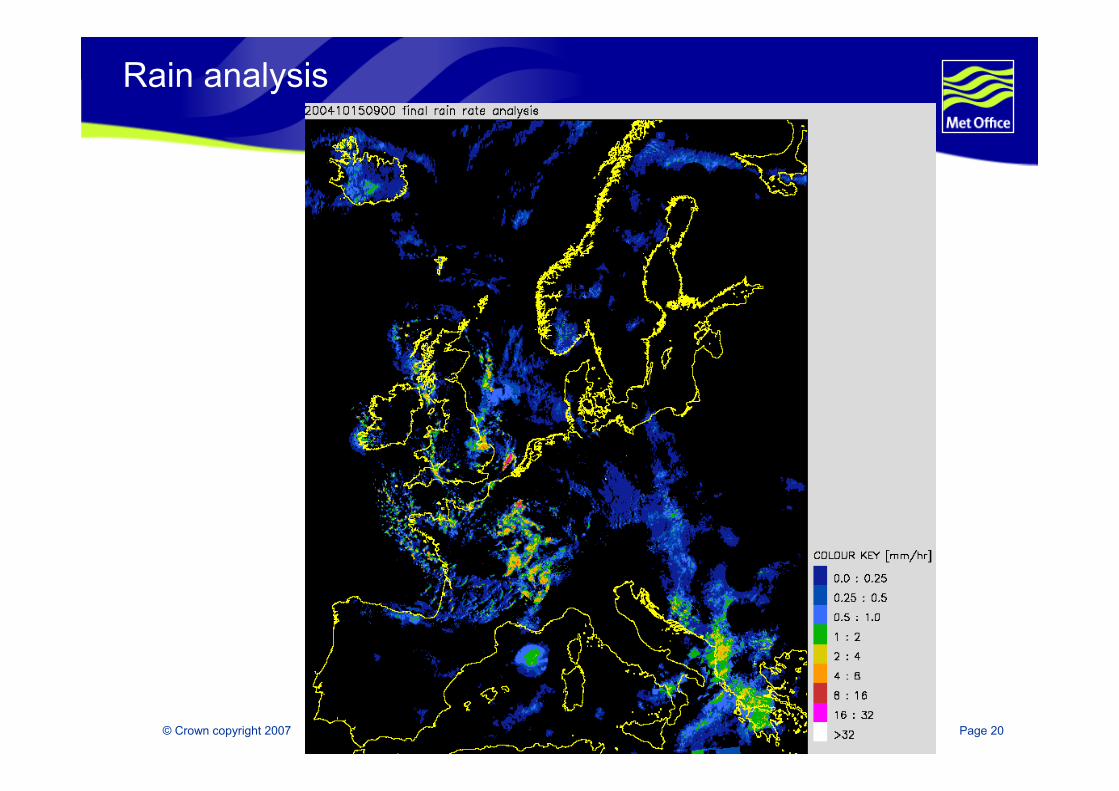
Generate analysis for full domain by blending:
Corrected radar compositeSatellite visible and infrared imagery calibrated against radarLightning fixes (minimum rain rate)A very short range forecast Surface in situ weather reports
Radar is used where it has good visibilityA variational analysis, combining the
remaining data sources, is used elsewhere
Producing a rain analysis
© Crown copyright 2007 Page 20
Rain analysis

© Crown copyright 2007 Page 21
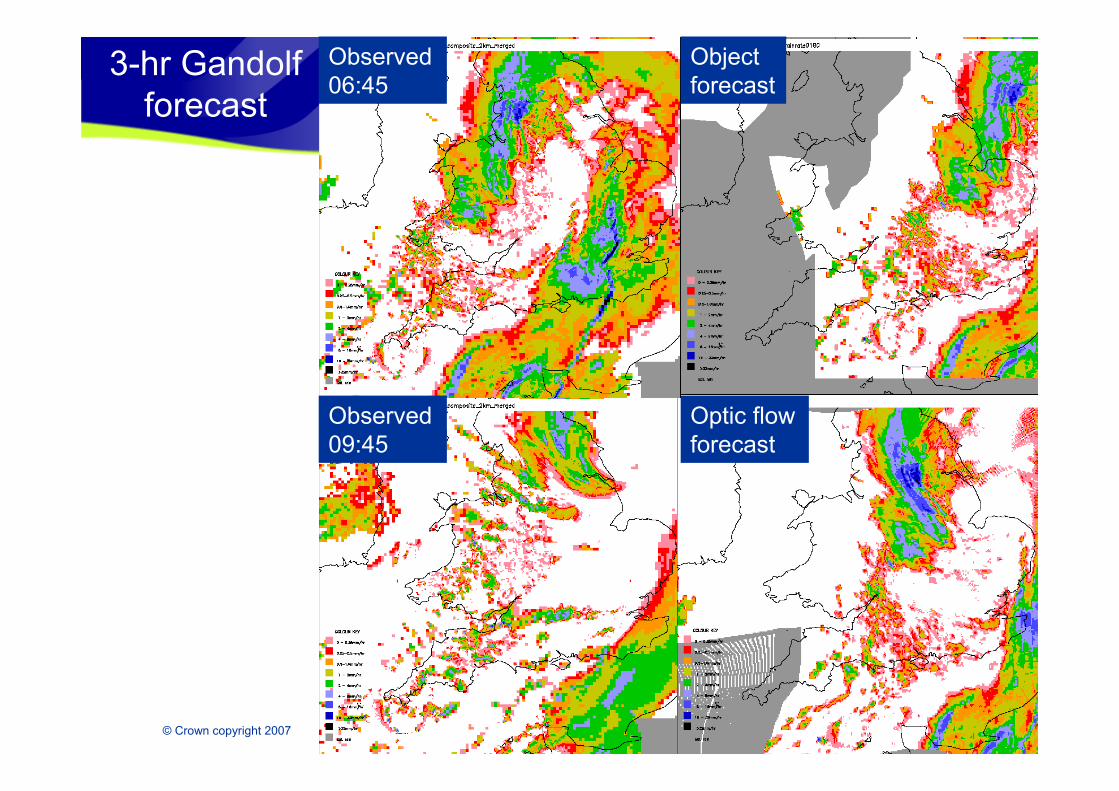
“Optic Flow” extrapolation method
Given the “Optic flow” equationdp/dt = ∂p/∂t + u.∂p/∂x + v.∂p/∂y = 0with p the precipitation rate
Calculate estimates of ∂p/∂t, ∂p/∂x & ∂p/∂y in each nxn pixel block containing precipitationFind values of u,v that minimise the residualSmooth the results and extend to non-precipitating areas
© Crown copyright 2007 Page 22
3-hr Gandolfforecast
Observed 06:45
Object forecast
Observed 09:45
Optic flow forecast

© Crown copyright 2007 Page 23
Merge with NWP model forecast
NWP provides forecast information in areas where the extrapolation forecast has areas of “missing data”Introduces an element of growth and/or decay into the forecastsEnsures continuity between forecast products

© Crown copyright 2007 Page 24
Accuracy of 15km rain accumulation vs radarover UK, Oct 03 - Sep 04
1
2
3
4
5
6
7
0 60 120 180 240 300 360 420 480Lead tim e in m inutes
RMSF
mesoscale model
advection
Nimrod
Persistence
© Crown copyright 2007 Page 25
Convective scale NWP
© Crown copyright 2007 Page 26
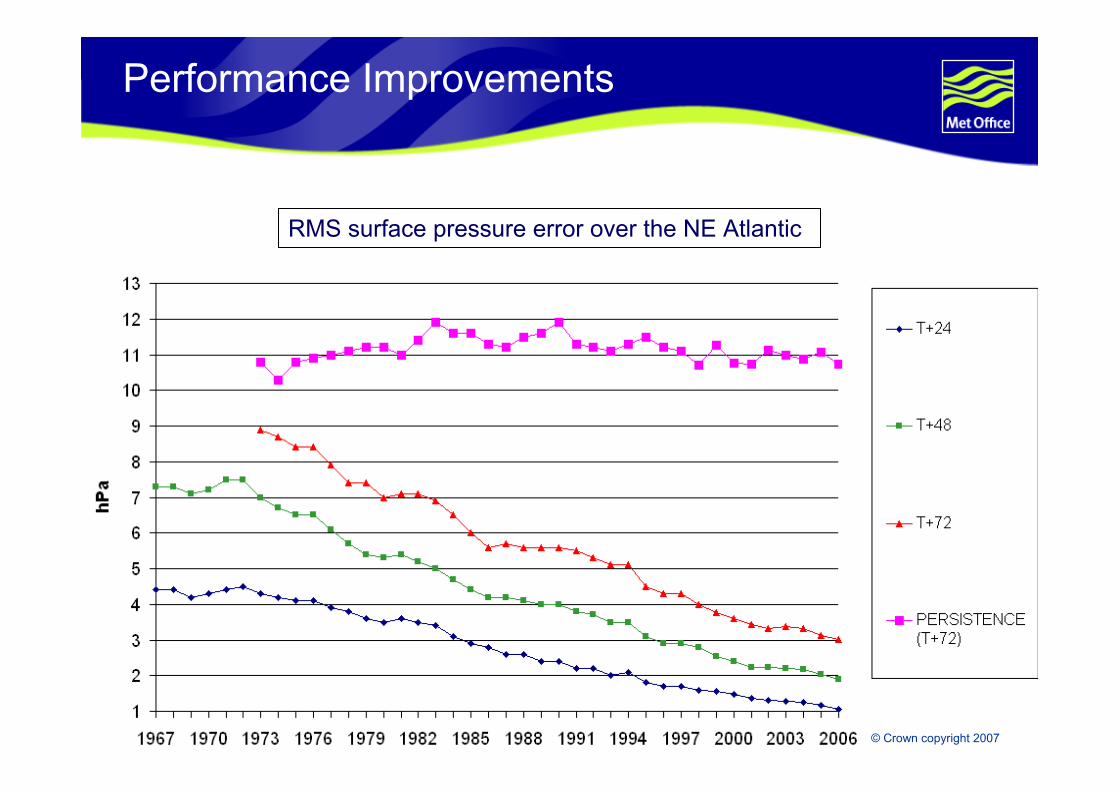
Performance Improvements
RMS surface pressure error over the NE Atlantic
© Crown copyright 2007
© Crown copyright 2007 Page 27
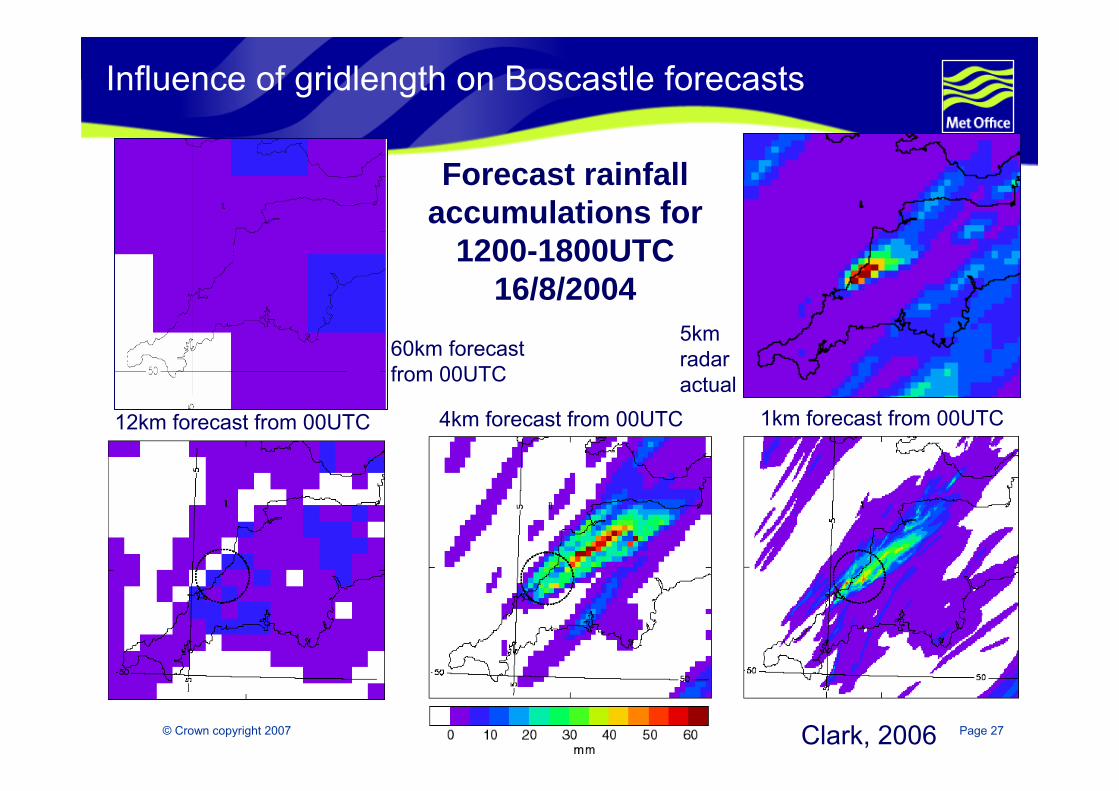
Influence of gridlength on Boscastle forecasts
60km forecast from 00UTC
Forecast rainfall accumulations for
1200-1800UTC 16/8/2004
12km forecast from 00UTC 4km forecast from 00UTC 1km forecast from 00UTC
5km radar actual
Clark, 2006

© Crown copyright 2007 Page 28
3rd August 2004
1500-1700UTC12km modelvs 1km modelvs radar actual

© Crown copyright 2007 Page 29
Lower scale limit of skill 3rd Aug 2004
Uncertainty scale above which forecast of exceedanceof 8mm has useful skill: 12km (blue) and 1km (red) models initialised at 0900UTC 3rd August 2004

© Crown copyright 2007 Page 30
13th Aug 2006
1500-1700UTC12km modelvs 1.5km modelvs radar actual

© Crown copyright 2007 Page 31
Lower scale limit of skill for 13/8/2006
Uncertainty scale above which forecast of exceedance of 4mm has useful skill: 12km (blue)
and 1.5km (red) models initialised at 0900UTC 13th August 2006

© Crown copyright 2007 Page 32
Summary
Nowcasting, based on extrapolation, can provide useful very short range forecasts of high impact weather variables
Convective scale Numerical Weather Prediction should be able to provide more accurate nowcasts at longer lead times
Success will require fundamental scientific research, as well as bigger computers. In particular:
New approaches to data assimilation using new data sources such as radar
Improved models, which represent both boundary layer and convective cloud processes more accurately
Better products which convey the information required by the user