brd finrespres q4 2017 2017.pdf · full-year and 4 th quarter 2017 results 02/12/2018 2 disclaimer...
TRANSCRIPT

F U L L - Y E A R AN D 4 T H Q U AR T E R 2 0 1 7
RESULTS
BRD - GROUP
F E B R U A R Y 2 0 1 8
02/12/2018 2FULL-YEAR AND 4TH QUARTER 2017 RESULTS
DISCLAIMER
The consolidated balance sheet and profit and loss account for the period ended December 31, 2017 were examined by the Board of Directors on February 7, 2018.
The financial information presented for the year ended December 31, 2017 and comparative periods has been prepared according to IFRS as adopted by the European Union and applicable at this date.
BRD will publish a full set of consolidated and individual financial statements for the 2017 financial year.
This financial information is at group level, does not constitute a full set of financial statements and is not audited.
This presentation contains forward-looking statements relating to the targets and strategies of BRD and are based on a series ofassumptions. These forward-looking statements have been developed from scenarios based on a number of economic assumptions in the context of a given competitive and regulatory environment. BRD may be unable to anticipate all the risks, uncertainties or other factors likely to affect its business and to appraise their potential consequences, and to evaluate the extent to which the occurrence of a risk or a combination of risks could cause actual results to differ materially from those provided in this document.
Investors and analysts are advised to take into account factors of uncertainty and risk likely to impact the operations of BRD when considering the information contained in such forward-looking statements. Other than as required by applicable law, BRD does not undertake any obligation to update or revise any forward-looking information or statements.

INTRODUCTION
1

02/12/2018 4FULL-YEAR AND 4TH QUARTER 2017 RESULTS
2017: FULL YEAR NET PROFIT AT RON 1.4BN, +85% Y/Y
* NBI and GOI excluding non recurring items (gains on sale of Visa share and other AFS instruments, transformation program exceptional charge)
ROE: 20.1% in 2017 vs. 11.8% in 2016
Further enhanced operational performance
Strongly increased profitability
Loan portfolio quality continued to improveFull year positive cost of risk on strong recovery performance on non retail, recognition of insurance indemnities, and gain on sale of NPL
Solid capital and liquidity positions enabling BRD to capture future business opportunities while meeting regulatory requirements
Core NBI*RON 2,777m +4.9% vs 2016
Core GOI*RON 1,333m +5.9% vs 2016
NCRRON 360m releasevs RON 484m charge in 2016
Net profit RON 1,415m +85.3% vs. 2016
CAR: 19.5%, solid capital level
Note: CAR, Bank only, incl. current year result unaudited, net of dividends (subject to GSM approval)
Strong momentum in core revenues
Net interest income (+8.4% y/y) gaining momentum, mostly on growing volumes Healthy loan advance (+5.3% y/y)Large and growing retail deposit base (+5.8% y/y)
106 157
349
Q4-2015 Q4-2016 Q4-2017
663
650
690 712 725
Q4-2016 Q1-2017 Q2-2017 Q3-2017 Q4-2017
02/12/2018 5FULL-YEAR AND 4TH QUARTER 2017 RESULTS
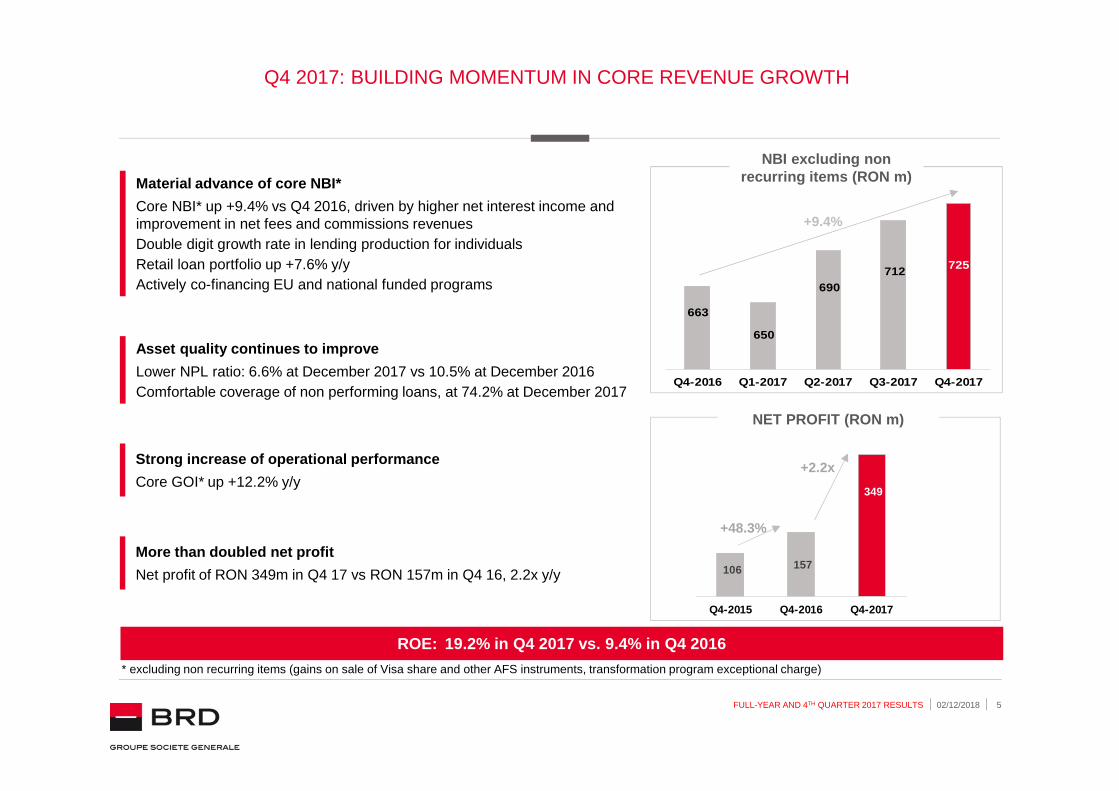
Q4 2017: BUILDING MOMENTUM IN CORE REVENUE GROWTH
ROE: 19.2% in Q4 2017 vs. 9.4% in Q4 2016
NBI excluding non recurring items (RON m)
NET PROFIT (RON m)
Material advance of core NBI*
Core NBI* up +9.4% vs Q4 2016, driven by higher net interest income and improvement in net fees and commissions revenues Double digit growth rate in lending production for individualsRetail loan portfolio up +7.6% y/yActively co-financing EU and national funded programs
Asset quality continues to improve
Lower NPL ratio: 6.6% at December 2017 vs 10.5% at December 2016Comfortable coverage of non performing loans, at 74.2% at December 2017
More than doubled net profit
Net profit of RON 349m in Q4 17 vs RON 157m in Q4 16, 2.2x y/y
+48.3%
+2.2x
* excluding non recurring items (gains on sale of Visa share and other AFS instruments, transformation program exceptional charge)
Strong increase of operational performance
Core GOI* up +12.2% y/y
+9.4%

MACROECONOMIC & BANKING ENVIRONMENT
2

02/12/2018 7FULL-YEAR AND 4TH QUARTER 2017 RESULTS
0.6%
3.5%3.1%
3.9%
4.8%
6.2%
-0.6%
1.2%
1.9%2.2%
1.9%2.3%
2012 2013 2014 2015 2016 2017P
RO EU
ECONOMIC GROWTH ABOVE EXPECTATIONS
GDP GROWTH
INTEREST RATE ENVIRONMENT
Largest GDP growth in Europe expected for 2017
Strong economic momentum in 2017, mostly fueled by consumption boom
Q3 17 GDP accelerated significantly at +8.6% y/y (seasonally adjusted) from +5.9% y/y in the previous quarter with household consumption as main driver
GDP growth expected to slow down to more sustainable levels in 2018
Towards monetary policy normalization
NBR key interest rate hike to 2% in Jan 2018 (from 1.75%, since May 2015), and again to 2.25% in February 2018, aiming at anchoring inflationary pressures
Source: projections for Romanian GDP as per BRD Research and for EU as per IMF World Economic Outlook, October 2017
Accelerating inflation dynamics
Inflation rate at +3.3% y/y at Dec 2017
Rising trend expected to continue in the coming months, influenced by the fading base effect from January – February 2017 tax cuts, the evolution of administered prices and strengthening cost pressures from the labor market
Significant rise in RON interest rates starting Sep tember 2017 Average ROBOR 3M reaching 1.99% in Q4-17 vs. 0.94% in Q3-17
-0.9%
-3.0%
-0.7% -0.6% -0.5%
0.2%
0.9%1.8%
3.3%
1.0% 0.8% 0.8% 0.7% 0.8% 0.8% 0.8% 1.1%
2.1%1.75% 1.75% 1.75% 1.75% 1.75% 1.75% 1.75% 1.75% 1.75%
Dec-15 Mar-16 Jun-16 Sep-16 Dec-16 Mar-17 Jun-17 Sep-17 Dec -17
Inflation rate Average ROBOR 3M NBR reference rate
02/12/2018 8FULL-YEAR AND 4TH QUARTER 2017 RESULTS
148 164 179
128 136
152
275 300
331
Dec-15 Dec-16 Dec-17
Individuals Companies
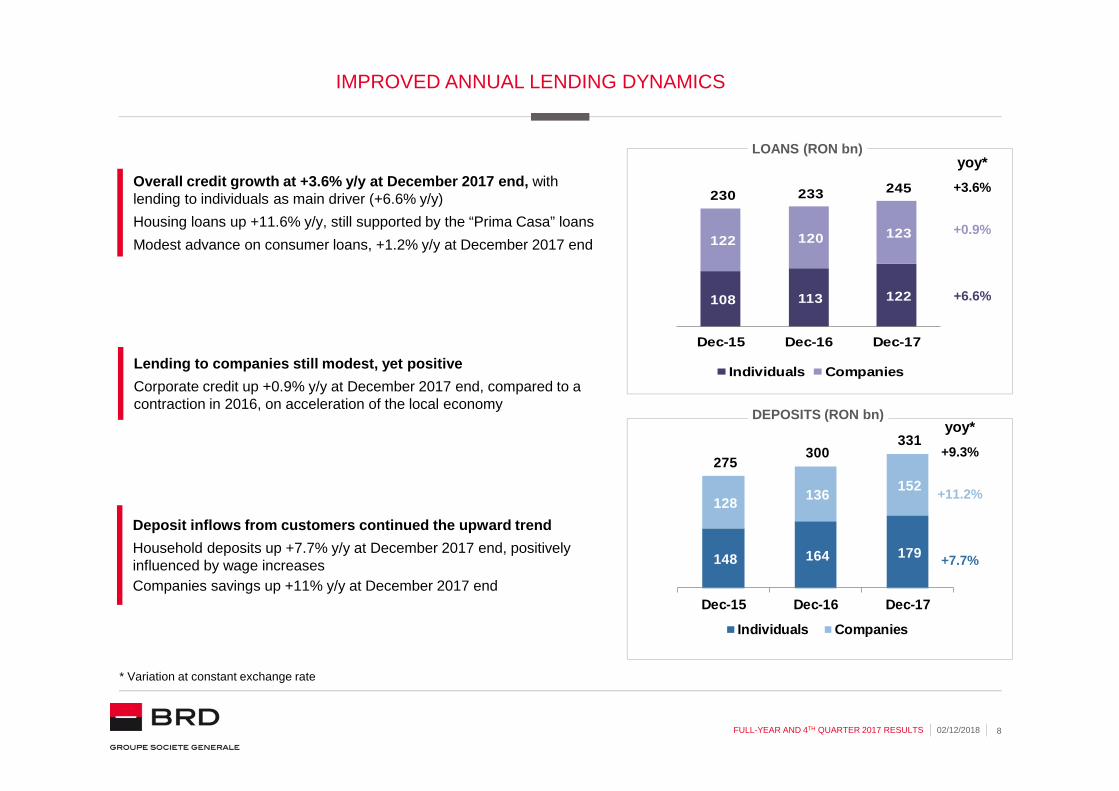
IMPROVED ANNUAL LENDING DYNAMICS
* Variation at constant exchange rate
DEPOSITS (RON bn)
LOANS (RON bn)
yoy*
+11.2%
+7.7%
+9.3%
Lending to companies still modest, yet positive
Corporate credit up +0.9% y/y at December 2017 end, compared to a contraction in 2016, on acceleration of the local economy
Overall credit growth at +3.6% y/y at December 2017 end, withlending to individuals as main driver (+6.6% y/y)
Housing loans up +11.6% y/y, still supported by the “Prima Casa” loans
Modest advance on consumer loans, +1.2% y/y at December 2017 end
Deposit inflows from customers continued the upward t rend
Household deposits up +7.7% y/y at December 2017 end, positively influenced by wage increasesCompanies savings up +11% y/y at December 2017 end
yoy*
+0.9%
+6.6%
+3.6%
108 113 122
122 120 123
230 233 245
Dec-15 Dec-16 Dec-17
Individuals Companies

02/12/2018 9FULL-YEAR AND 4TH QUARTER 2017 RESULTS
20.7%
13.6%
9.5%7.3%6.5% 5.7% 5.1% 4.2%
Dec-14 Dec-15 Dec-16 Nov-17
RO EU average
THE QUALITY OF BANK ASSETS CONTINUES TO IMPROVE
Source: EBA Risk Dashboard – Q3 2017, NBR data
NPL RATIO
NPL COVERAGE RATIO
Improved coverage ratio of NPLs
Comfortable liquidity indicators
Loan to deposit ratio at 80% at September 2017 end (vs 116% in 2011)
Average liquidity coverage ratio at 239% at September 2017 end, well above regulatory requirement (80% in 2017) and European average (145%)
* NPL ratio, EU average, as of Sep-17 end
NPL ratio continued its downward trend …
…as a result of write off operations and sale of defaulted loans portfoliosNPL ratio at 7.3% at November 2017 end, lower by 2.2 ppts y/y as compared to December 2016 end
Adequately capitalized banking sector
Total capital ratio of 19.0% as of September 2017 end (vs. 19.7% as of December 2016 end).
Strengthened profitability
ROE near 10% in both 2015 and 2016ROE at 12.9% in the first 9M 2017
*
55.6% 57.7% 59.4%
43.4% 43.7% 44.7%
Dec-14 Dec-15 Sep-17
RO EU average

4TH QUARTER AND 2017 BRD GROUP RESULTS
3

02/12/2018 11FULL-YEAR AND 4TH QUARTER 2017 RESULTS
ENHANCED DIGITAL INTENSITY
Significant growth across remote banking channels
Stock of remote banking contracts up +21% y/y at December 2017 end (+12% internet and +45% mobile banking)
MyBRD Net and MyBRD Mobile penetration rates reaching 43% (+4pts y/y) and 22% (+7pts y/y) respectively, at December 2017
Further optimisation of network footprint (-50 branches y/y at December 2017)
c
INCREASINGLY DIGITIZED CUSTOMER JOURNEY
c c
Further enhancing digital offer
Enhancement of the mobile application functionality
� face and fingerprint authentication for logging in and signing transactions
� value proposition tour before logging in
� increased flexibility of navigation and user interface upgrades
Fully online subscription to investment funds (MyBRD Net) and real time access to investment funds portfolios (MyBRD Net and Mobile)
Western Union incomings directly through MyBRD Net and MyBRD Mobile
Front-to-back process automation
Time-to-Yes/Time-to-Cash reduced on optimized workflows, increased level of automation
Processes dematerialization implemented for retail lending
Prerequisite for fully digital end-to-end processes

02/12/2018 12FULL-YEAR AND 4TH QUARTER 2017 RESULTS
3.95
4.07
4.16
Dec-15 Dec-16 Dec-17Intensified all-round commercial relationships
Average equipment rate of individual clients up to 4.16 from 4.07 at December 2016.
Average equipment rate of small business clients up to 3.72 from 3.61 at December 2016
Greater penetration of online banking services
INTENSIFIED COMMERCIAL RELATIONSHIPS, RAPIDLY GROWING REMOTE BANKING TRANSACTIONS
Continuing to record robust commercial growth
Stock of active clients increased by + 41,000 y/y
Continued increase in digital channels adoption
AVERAGE INDIVIDUAL CUSTOMEREQUIPMENT RATE
DIGITAL BANKING SOLUTIONS*
* No of contracts: MyBRD Mobile, MyBRD Net
2.33m active clients
1.4m contracts (MyBRD Net & MyBRD Mobile) +21% vs December 2016 end+30% nb of transactions in 2017 vs 2016+45% nb of connections in 2017 vs. 2016
Small businessIndividuals
115k clients
+3,000 y/y
2.19m clients
+38,000 y/y
692
832932
196
318
460
Dec-15 Dec-16 Dec-17MyBRD Net MyBRD Mobile

02/12/2018 13FULL-YEAR AND 4TH QUARTER 2017 RESULTS
ACTIVELY CO-FINANCING COMPANIES UNDER EU AND NATIONAL FUNDED PROGRAMS
LEVERAGING ON THE EXPERTISE OF OUR DEDICATED STRUCT URE
*Ministry for Business Environment, Trade and Entrepreneurship
European Funds 2014-2020
� co-financing of over 180 investment projects, representing ~ 370 investment and working capital loans, amounting to ~ EUR 60m granted in 2017 (EUR 20m in 2016), of which 90% for agricultural sector under the National Programme for Rural Development (PNDR)
APIA subsidies
� approx. 3000 APIA bridge loans granted during 2017 campaign, totaling ~ EUR 44m
Government programs for SMEs
� over 15% of the eligible SME beneficiaries selected by the management authority* under the National Programs for Micro Industrialization and Commerce, financed by BRD in 2017

02/12/2018 14FULL-YEAR AND 4TH QUARTER 2017 RESULTS
HEALTHY CREDIT GROWTH PUSHED UP BY DOUBLE-DIGIT INCREASE IN NEW LOAN PRODUCTION TO INDIVIDUALS
LOANS TO INDIVIDUALS PRODUCTION (RON m)
Continued focus on credit to large companies and lea sing to SMEs
Credits to large companies up +3.1% y/y
Leasing portfolio increasing by +17%** y/y
Double digit growth rate in lending production for individuals
Strong advance of new housing loans, with increasing share of BRD specific product “La Casa Mea”
Consumer loans on upward trend in 2017 vs 2016 on increasing disposable income and well targeted campaigns
NET LOANS (outstanding amounts, RON bn)
Q4-17 vs. Q4-16
+18.7%
-9.1%
+103.7%
+13.8%
+7.1%
+30.5 %
2017 vs. 2016
Accelerated annual growth rate of net loans in 2017
Annual dynamics in net loans outstanding accelerating to +5.3% y/y at December 2017 end
* Variations at constant exchange rate
Net loans outstanding for retail segment up +7.6% y /y
Favorable evolution on both housing and consumer loans Strengthened leadership position on the market
18.3 19.3 21.0
9.2 9.2 9.3
27.6 28.530.3
Dec-15 Dec-16 Dec-17
Retail Non retail
yoy*
+5.3%
+0.4%
+7.6%
** Including operational leasing
324 587
372 321 307 588 544 655
782
1,176
1,050 983 987
1,249 1,146 893
1,106
1,763
1,422 1,304 1,294
1,837 1,690
1,548
Q1-16 Q2-16 Q3-16 Q4-16 Q1-17 Q2-17 Q3-17 Q4-17Housing loans Consumer loans

02/12/2018 15FULL-YEAR AND 4TH QUARTER 2017 RESULTS
yoy*
ENLARGED DEPOSIT BASE AND EXPANDING ASSETS UNDER MANAGEMENT
DEPOSITS (outstanding amounts, RON bn)
Strong collection in current accounts
Deposits on current accounts up +22% y/y vs December 2016
Expansion of assets under management
BRD AM assets under management up +9% y/y
Market share on open end mutual funds up by +0.6ppt y/y
Still elevated deposit inflows on retail segment
Retail savings +5.8% y/y vs December 2016 end
Non retail deposits quasi stable y/y in a context of comfortable liquidity position
ASSETS UNDER MANAGEMENT (RON bn) & MARKET SHARE
AUM +9% YoY
Market share +0.6ppt
Resilient funding base
Loan to deposit ratio at 68.6%, well positioning the bank for further credit growth
Share of deposits in total liabilities growing from 69% at 2011 end to 93% at 2017 end
Parent funding around 2% of total liabilities at 2017 end
Note: Market share for AUM computation based on total Open-end Funds assets under management.
+3.8%
+0.5%
+5.8%23.6 26.0 27.8
17.5 16.2 16.4
41.2 42.2 44.2
Dec-15 Dec-16 Dec-17
Retail Non retail
2.9 3.1
12.1%12.6%
2016 2017
* Variations at constant exchange rate

02/12/2018 16FULL-YEAR AND 4TH QUARTER 2017 RESULTS
407 459
188 192 68
73 4 667
725
Q4-2016 Q4-2017
DYNAMIC RISE IN CORE REVENUES
NET BANKING INCOME (RONm)
NET BANKING INCOME (RONm)
…reflecting very robust net interest income growth
Net interest income up +12.8% in Q4 2017 and +8.4% in 2017Significant positive volume effect 2017 avg. outstanding of loans up +5.3% (retail loans up +7.0%)2017 avg. outstanding of deposits up +6.6%Favorable interest rate effect in Q4 2017
...and resilient fees and commissions income
Strong pressure on transactional banking pricesCompensated by higher revenues from card activity and increased contribution from asset management and capital market activities
Substantially higher core NBI*…
NBI up +9.4% in Q4 2017 and +4.9% in 2017 excluding non recurring items (gains on sale of AFS instruments, mostly VISA)
Other incomeNet fee and commissions
Net interest income
Non recurring elements
incl. non recurring
excl. non recurring *
* Non recurring items include gains on sale of Visa share and other AFS instruments
Other income
Net fee and commissions
Net interest income
Non recurring elements
incl. non recurring
excl. non recurring *
+9.4%
+8.6%
+2.3%
+12.8%
+8.7%
+2.5%
+2.3%
+12.8%
+4.9%
+2.5%
-1.2%
+8.4%
+0.3%
-27.6%
-1.2%
+8.4%1,586 1,719
773 763
287 294 131 9
2,778 2,786
2016 2017

02/12/2018 17FULL-YEAR AND 4TH QUARTER 2017 RESULTS
307 344
Q4-2016 Q4-2017
ACCELERATION OF INVESTMENTS IN BUSINESS MODEL TRANSFORMATION, ENHANCED OPERATIONAL PERFORMANCE
OPERATING EXPENSES (RON m)
Other expenses
Staff expenses
Q4 2017 operating expenses influenced by the upfront ing of upcoming transformation costsAcceleration of the adaptation of the business model (including the resizing of network footprint) leading to a planned headcount reduction of approximately 10% over the next 3 years
Recognition of a one-off provision for exceptional charges, of RON 29m
Growth in other operating expenses mostly driven by ongoing transformation initiatives
Increased investments in transformationTotal investments up +25% in 2017 vs 2016
Change the bank initiatives concentrating 76% of the overall effort
Staff expenses up +3.2% in 2017 excluding provision for restructuring, influenced by pressure on labor costs
OPERATING EXPENSES (RON m)
Other expenses
Staff expenses
Contribution to FGDB & FR
*GOI and C/I excluding gains on VISA transaction , other AFS securities and transformation program exceptional charge
Core GOI* up +5.9% in 2017 and +12.2% in Q4 2017
Baseline costs under controlCore C/I* at 52% in 2017, lower by 0.4 pts vs 2016
CORE GROSS OPERATING INCOME (RON m)
+12.2%
+4.1%
+3.2%
+4.5%
+8.6%
+7.0%
+4.8%
+9.2%179 195
177 186
356 410
-29
Q4-2016 Q4-2017
65 71
635 663
688 710
1,388 1,473
- 29
2016 2017
incl. non recurring
excl. non recurring *
+15.2%
+21.3%
+9.2%
+6.2%
+7.5%
+9.2%
incl. non recurring
excl. non recurring *
+8.6%
Non recurring elements
Non recurring elements
1,259
2016
1,333
2017
+5.9%

02/12/2018 18FULL-YEAR AND 4TH QUARTER 2017 RESULTS
IMPROVED ASSET QUALITY
GROSS LOANS – December 31, 2017breakdown by segment and currency (RON bn)
NPL RATIO – EBA methodology
Loan portfolio market mix65.2% on individuals market segment34.8% on legal entities market segment
Declining NPL ratioDeclining trend in line with the evolution observed at the level of theRomanian banking sectorReflecting write-offs performed during the 2015-2017 period as wellas outstanding NPL recovery performanceFurther write-offs to be performed, in line with the Bank’s policyNPL portfolios sale activities under the new regulatory pressure
Consolidation of RON lendingShare of RON denominated loans at 61.7% (vs 56.6% as of 12/2016)Trend in line with market evolution
All figures at individual level * Ratio for the Banking System – as of November 2017

02/12/2018 19FULL-YEAR AND 4TH QUARTER 2017 RESULTS
COST OF RISK INFLUENCED BY STRONG RECOVERY PERFORMANCE
COST OF RISK EVOLUTION (RON m)
NPL COVERAGE RATIO - EBA methodology
Q4 2017 NCR highlights
Strong recovery performance, mainly from legal entities NPL exposures (near 90 MRON in net provision reversals), leading to overall net release of provisions of 95 MRON in Q4-2017
Key ratios evolutionNet cost of risk at -120 bp for 2017, following exceptional items (i.e.insurance payments in H1) and NPL salesSlight decrease in NPL provision coverage ratio vs. Dec-16, followingwrite-off operations
All figures at individual level
Limited impact of IFRS 9 FTA: 57 MRON

02/12/2018 20FULL-YEAR AND 4TH QUARTER 2017 RESULTS
VERY STRONG FINANCIAL RESULTS ON ROBUST BUSINESS GROWTH AND NON RECURRING POSITIVE COST OF RISK ITEMS
NET PROFIT (RON m)
NET PROFIT (RON m)
Net profit up +85% y/y in 2017 (+121.7% y/y in Q4 2017)supported by healthy income growth and positive cost of risk
Net profit excluding non-recurring items
Non-recurring items contribution
to net profit *Net profit excluding
non-recurring items
ROE above 20% in 2017Unadjusted ROE of 20.1% for 2017Adjusted ROE** of 17.1% in 2017 vs. 10.1% in 2016
+85.3%
+84.2%
+121.7%
+142.6%
* Non recurring items:
2016: gains on VISA transaction and sale of AFS instruments2017: insurance indemnities (impact in Q1 and Q2) and gain on sale of NPL portfolio (impact in Q2); transformation program exceptional charge, gain on sale of AFS instruments
** ROE excluding non recurring items
incl. non recurring items
excl. non recurring items
incl. non recurring items
excl. non recurring items
Non-recurring items contribution
to net profit *
154
374 3
(24)
157
349
Q4-2016 Q4-2017
653
1,203 110
212
763
1,415
2016 2017

02/12/2018 21FULL-YEAR AND 4TH QUARTER 2017 RESULTS
SOLID CAPITAL POSITION
SOLVENCY RATIO *
Solid Tier 1 capital baseCAR at 19.49% at December 2017 (incl. current year result) comfortably above regulatory requirement
Dec-16 Dec-172017
Retained profit OCI RWA Other
19.76% 19.49%
+88bp
-46bp-73bp
+0.04bp
* Bank only, incl. current year result (unaudited) net of dividends (subject to GSM approval), including impact of prudential filters
Bank only Dec-16 Dec-17Capital adequacy ratio 19.76% 19.49%
Own funds (RONm) 5,212 5,335
Total risk exposure amount (RONm) 26,373 27,369
Capital requirements (RONm) 2,110 2,189
Note: Own funds for 2017 include the net profit (unaudited), net of dividends (subject to GSM approval)

CONCLUSIONS
4

02/12/2018 23FULL-YEAR AND 4TH QUARTER 2017 RESULTS
CONCLUSIONS
� Continued improvement of customer experience through cont inuous development of digitalcapacities
� Healthy credit growth pushed up by double-digit increase in new loan production to individuals
� Enlarged deposit base and expanding assets under managemen t
� Dynamic rise in core revenues driven by strong net interest i ncome momentum
� Increased investments in business model transformation
� Enhanced operational performance
� Improved credit risk profile
� Sustainable liquidity and capital positions
� Very strong financial performance on robust business growt h and non recurring positive costof risk items
� Considering the results of the year as well as the expected ca pital adequacy trajectory, theBoard of Directors has decided to propose a dividend corresp onding to a payout ratio of 80% ofthe bank 2017 core net result and 100% of non recurring items n et of tax, resulting in an overallpayout ratio of 83%, subject to a favorable vote by the Annual General Meeting of Shareholderson April 19, 2018
� Continued active engagement in the Romanian society

02/12/2018 24FULL-YEAR AND 4TH QUARTER 2017 RESULTS
AN ACTIVE ENGAGEMENT IN THE ROMANIAN SOCIETY
• BRD Bucharest Open• Romanian Handball Federation
SPORT
Mindcraft technology platform, with : - BRD First Tech Challenge (a robotics competition)- Innovation Labs - Financial education
EDUCATION &TECH
CULTURE
• Cultural Journalism/ Scena9.ro• Platform for the new creators Rezidenta BRD Scena9
•Classical Music: Sonoro, Stradivarius•Performing Arts: Sibiu Festival, National Theater Festival, Ideo Ideis
•Contemporary Art: White Night of Galleries

02/12/2018 25FULL-YEAR AND 4TH QUARTER 2017 RESULTS
RECOGNIZED EXCELLENCE
“Safest Bank in Romania”, Global Finance - the 4th consecutive year
No 1, Global Investor “sub-custody survey” 2017 Global Investor Group
Best in Leasing – BRD SogeleaseBest Sub-custodian Bank in Romania, 2017
“Friendliest Bank for Youth ”MasterCard Bank of the Year Awards
BRD Asset Management: BRD Eurofund -Best EURO denominated investment fund
B R D S T R A T E G I C O B J E C T I V E S
2020 VISION
TRANSFORM TO GROW
F E B R U A R Y 1 2 T H 2 0 1 8

02/12/2018 27FULL-YEAR AND 4TH QUARTER 2017 RESULTS
BRD: A UNIVERSAL BANKING GROUP WITH LEADING FRANCHI SES ACROSS THE BOARD
RETAIL
� 2 191 ths active individual customers
� 115 ths active small business customers
� # 1 on loans to individuals (16.9% MS)*
� # 3 on deposits from individuals (13.9%
MS)*
SPECIALIZED AFFILIATESCORPORATE
� 18.2 ths SME customers
� 2.1 ths large corporate customers
� # 1 on deposits from companies (13.6%
MS)*
� # 1 on factoring with 1117 MEUR
turnover in 2017
� # 1 in custody services with 11.8 GEUR
assets under custody (73% MS)
� # 4 on loans to companies (9.3% MS)*
� 100% owned by BRD� # 3 on local leasing market
� 100% owned by BRD
� 675 MEUR AUM in 7 funds
� # 4 with 12.6% MS
� 49% owned by BRD, 51% by SG
� 117 MEUR loans outstanding
* Loans and deposits market shares and rankings as of September 2017
� 49% owned by BRD, 51% by SG
� # 6 with 6.5% MS

02/12/2018 28FULL-YEAR AND 4TH QUARTER 2017 RESULTS
POSITIVE DEVELOPMENTS IN THE BANKING ENVIRONMENT IN THE RECENT PAST, SIGNIFICANT CHALLENGES AND OPPORTUNITI ES AHEAD
� Strong and sustained GDP growth in the last years
� Rising interest rates, driven by inflation and gradual withdrawal of ultra-accommodative monetary policies within the Eurozone
� Low unemployment, well below EU average, with sustained decreasing trend registered in the last years
� Unsustainable GDP growth in the mid-term – Economy fueled largely by private consumption boom andgovernment-driven fiscal impulse
� Wage growth outpacing productivity gains undermining external competitiveness in the mid-term
Macro-context – Current opportunities and future challenges
� Sector profitability reversed to positive territory as of 2015, driven by reduced cost of risk and favorable macro-economic environment
� Improved overall risk profile , with a consistent decline in NPL ratio and solid NPL coverage ratio, and a high level of capitalization.
� Several customer segments (e.g. Affluents, unbanked1, SMEs) under-served at market level
� Growth potential from higher customer sophistication in retail (e.g. digital value proposition) and corporate (e.g. cash management, structured and corporate finance)
� PSD2 opening up new business model opportunities/ revenue sources for banks
� Margins squeezed by ongoing price war
� Growing pressure on fee income/ prices driven by implementation of payment accounts Directive (EU Directive 92)
� Lower barriers to entry for new players and potential sector disruption due to PSD2
� Local regulatory instability and transforming EU regulatory environment 2
1) i.e. 40% of the Romanian population aged over 15; 2) E.g. EBA Guidelines on RM's variable compensation, IDD, MiFID II
Economy
Banking sector

02/12/2018 29FULL-YEAR AND 4TH QUARTER 2017 RESULTS
Achieve core solid profitability growth on both retail and corporate segments, driven by superior customer experience, strong employee engagement , and by the bank's commitment to having a positive contribution to the Romanian society and b anking sector
OUR STRATEGIC OBJECTIVES FOR 2020
ST
RA
TE
GIC
OB
JEC
TIV
ES
Customer Satisfaction
Employee Commitment
Financial Performance
Corporate Social Responsibility
� Proactively understand and deliver on the needs of our customers
� Gain market leadership on customer experience
� Develop further digital capabilities and enhance integrated multi-channel user experience
� Become the reference relationship bank in Romania
� Become employer of choice in Romania
� Foster a culture geared towards excellence and high employee engagement , built on mutual trust, team spirit and people development
� Increase organizational agility and change readiness to support ongoing innovation
� Target solid performance growth on both retail and corporate segments and improve overall core profitability
� Support Romania's economic growth and investments
� Conduct an ethical and fair business, in line with the bank's legal and ethical responsibility
� Support initiatives aimed at developing education, culture, technological advanc es and sports

02/12/2018 30FULL-YEAR AND 4TH QUARTER 2017 RESULTS
BRD TRANSFORMATION PROGRAM
Accelerate the transformation of the business model
Enable the bank to reach its 2020 objectives
Retail Corporate Operations IS & Projects
Transformation Program structured around four pillars
2020Ambition & Strategy
Transformation Program Goals

02/12/2018 31FULL-YEAR AND 4TH QUARTER 2017 RESULTS
RETAIL – TOWARDS A MORE CUSTOMER CENTRIC, DIGITAL, AND EFFICIENT BANK
CUSTOMIZE THE VALUE PROPOSITION
Key Objective: Adjust the value proposal, including sales and service model, to the clients’ needs and potential
� Implement a comprehensive behavioral sub-segmentation and targeted value proposition, adjusted to the different sub-segments
� Create full cycle customer journeys
� Concentrate resources on most attractive segments
STREAMLINE THE OPERATING MODEL AND INVEST IN PEOPLE
Key Objective: Optimize processes and organization, maximize employee engagement
� Enhance processes through an increased level of digitization and workflow automation
� Improve organization efficiency
� Further grow and engage employees via upgraded training journeys and enhanced performance management system
ADAPT THE DISTRIBUTION CHANNEL MIX
Key Objective: Reposition the channel mix in line with the evolution of customers’ expectations
� Further develop digital channels penetration and capabilities:
• greater efficiency for daily banking operations
• end-to-end digital subscription process
� Increase the capacity and role of the contact center
� Brick and mortar – fewer branches, increasingly focused on expertise and advisory services

02/12/2018 32FULL-YEAR AND 4TH QUARTER 2017 RESULTS
MOVING TOWARD AN OMNI-CHANNEL BUSINESS MODEL, COMBI NING HUMAN EXPERTISE AND DIGITAL EFFICIENCY
CLIENTS
Various branch Various branch Various branch Various branch formatformatformatformat
Digital Digital Digital Digital cornerscornerscornerscorners
Business Business Business Business centerscenterscenterscenters
Specialized Specialized Specialized Specialized Platforms for Platforms for Platforms for Platforms for
CorporateCorporateCorporateCorporate
Contact Contact Contact Contact CenterCenterCenterCenter
Apps & Apps & Apps & Apps & websitewebsitewebsitewebsite
Enhanced Enhanced Enhanced Enhanced ATMsATMsATMsATMs
ChatbotChatbotChatbotChatbot
BRANCHES
REMOTEPLATFORMS
SELFSERVICES
Greater EXPERTISE, via physical and remote channels, for customers’ key projects
Greater EFFICIENCY for daily banking operations

02/12/2018 33FULL-YEAR AND 4TH QUARTER 2017 RESULTS
CORPORATE – FULLY ACTIVATE VALUE GROWTH LEVERS AND F URTHER INCREASE LOAN ORIGINATION
FOCUS ON VALUE GROWTHLEVERS
Key Objective: Maximize value extraction from the existing customer base and develop new growth drivers
� Further enhance portfolio profitability by increasing share of primary bank customers
� Implement a superior sales management and monitoring set up to boost commercial performance
� Compensate for price pressure on traditional activities by intensifying cross selling and fully activating value growth levers – Structured Finance, Corporate Finance, derivatives, GTB -, ensuring their promotion to all customer segments
� Continue to develop synergies with retail, specialized affiliates and SG group
OPTIMIZE PROCESSES AND ORGANIZATIONAL SET-UP
Key Objective: Improve both customer satisfaction and operational efficiency
� Invest in digital offer and bring it to the highest market standards
� Improve process time and quality through:
• simplification and optimization
• higher level of workflow automation
• centralized processes supervision
� Fully integrate SME and large corporate set ups to maximize internal synergiesand create scale
ACHIEVE MATERIAL AND PROFITABLE LOAN VOLUME
GROWTH
Key Objective: Outperform corporate loan market growth while continuing to improve the risk profile
� Further enhance the origination process effectiveness
� On the SME segment, develop the lending activity based on:
• in-depth understanding of both client needs and risk profiles
• refined sectorial approaches
• dynamic and forward looking management of risk appetite
� Capitalize on the specialized EU and national funds structure capabilities

02/12/2018 34FULL-YEAR AND 4TH QUARTER 2017 RESULTS
OPERATIONS – SIMPLIFIED ORGANIZATION AND OPTIMIZED P ROCESSES FOR INCREASED REACTIVITY AND QUALITY
MORE AGILE ORGANIZATION
Key Objective: Revise organization structure and increase alignment to best practices
� Simplify governance structure
� Enhance specialization of back office centers
� Flatter organizational structure to foster team commitment and increase agility
OPTIMIZE COST BASE
Key Objective: Maximize financial performance from leveraging lower cost base
� Lower overall cost base
• improve internal processes
• roll out digital tools and processes
• leverage on scale advantages from back office center specialization
� Optimize span of control
� Further develop internal performance culture
ENHANCE PROCESS EFFICIENCY
Key Objective: Achieve superior customer service quality and operational risk mitigation
� LEAN process implementation -shorten lead time on key processes and reduce operational risk
� Improve productivity management tools and sustain performance-orientedculture
� Unlock scale advantages associated with back office center specialization
� Dematerialize BO processes and increase OCR capabilities

02/12/2018 35FULL-YEAR AND 4TH QUARTER 2017 RESULTS
ACCELERATE DIGITAL READINESS THROUGH INNOVATIVE, OP EN, AND AGILE APPROACHES
BOOST INNOVATION
� Continuous interactions with an entire and developing ecosystem
� Open innovation strategy
� Dedicated team to foster innovation
TRANSFORM THE DELIVERY MODELS AND EXPERTISE
� AGILE First
� Reduce time to market
� Increase efficiency
� Optimize alignment with Business
� Ensure the critical skills for tomorrow
GROW THE INFORMATION SYSTEMS VALUE
� Trusted partner , custodian of clients’ data
� A modular digital approach : “API first”
� Develop services interoperability - An OPEN approach to develop offers and clients’ satisfaction
� Continue to focus on Security

02/12/2018 36FULL-YEAR AND 4TH QUARTER 2017 RESULTS
2020 FINANCIAL TARGETS
* CAGR (2018-2020)
KE
Y T
AR
GE
TS
HEALTHY VOLUME GROWTH
+7% *
+4% *
• INCREASED INVESTMENTS IN TRANSFORMATION
• ENHANCED OPERATIONAL EFFICIENCY
• ROBUST GOI GROWTH
>+4% *
Higher value extraction on both Retail an Non Retail portfolios
Solid volume growth
Pressure on margins
Adjustment of network footprint
Enhanced processes, higher digitization level
Further pressure from increasing labor costs
Solid growth on loan book
Sustainable funding sources
SOLID RETURNS ■ ROE >12%***
-18% number of branches **
-10% headcount **
GOI
Deposits
Loans ����
����
����
��������
����
����
����
*** ROE throughout the period** variation over 3 years

Q&A SESSION
5
APPENDIX

02/12/2018 39FULL-YEAR AND 4TH QUARTER 2017 RESULTS
BRD GROUP | KEY FIGURES
RON m Q4-2017 Q4-2016 Change 2017 2016 Change
Net banking income 725 667 +8.7% 2,786 2,778 +0.3%
Operating expenses (410) (356) +15.2% (1,473) (1,388) +6.2%
Gross operating income 315 311 +1.3% 1,313 1,390 -5.6%
Net cost of risk 88 (122) n/a 360 (484) n/a
Net profit 349 157 +121.7% 1,415 763 +85.3%
Cost/Income 56.5% 53.3% +3.2 pt 52.9% 50.0% +2.9 pt
ROE 19.2% 9.4% +9.8 pt 20.1% 11.8% +8.3 pt
RON m Q4-2017 Q4-2016 Change 2017 2016 Change
Net banking income 725 663 +9.4% 2,777 2,646 +4.9%
Operating expenses (381) (356) +7.0% (1,444) (1,388) +4.1%
Gross operating income 344 307 +12.2% 1,333 1,259 +5.9%
Net cost of risk 88 (122) n/a 88 (484) n/a
Net profit 374 154 +142.6% 1,203 653 +84.2%
Cost/Income 52.5% 53.7% -1.2 pt 52.0% 52.4% -0.4 pt
ROE 20.6% 9.2% +11.4 pt 17.1% 10.1% +7.0 pt
Non recurring items (RON m)
NBI: gain on sale of AFS, incl. VISA 0.1 4.2 9.3 131.4
Opex: exceptional charge (29.3) - (29.3) -
NCR: insurance indemnities, gain on sale of NPLs - - 271.9 -
Reported financial results
Financial results excluding non recurring items

02/12/2018 40FULL-YEAR AND 4TH QUARTER 2017 RESULTS
BRD GROUP | KEY FIGURES
(1) Variations at constant exchange rate; (2) CAR as at Dec-17 end: Bank only, incl. current year result unaudited, net of dividends (subject to GSM approval),including impact of prudential filters; (3) Bank only
Loans and deposits RON bn Dec-16 Dec-17 vs. Dec-16
Net loans including leasing (RON bn) (1) 28.5 30.3 +5.3%
Retail 19.3 21.0 +7.6%
Non retail 9.2 9.3 +0.4%
Total deposits (RON bn) (1) 42.2 44.2 +3.8%
Retail 26.0 27.8 +5.8%
Non retail 16.2 16.4 +0.5%
Loan to deposit ratio 67.6% 68.6% +1.1 pt
Capital adequacy CAR (2) 19.8% 19.5% -0.3 pt
Franchise No of branches 810 760 (50)
No of active customers(3)
(x 1000) 2,285 2,327 +41

02/12/2018 41FULL-YEAR AND 4TH QUARTER 2017 RESULTS
BRD | KEY FIGURES FOR BANK ONLY
(1) Variations at constant exchange rate; (2) CAR as at Dec-17 end: Bank only, incl. current year result unaudited, net of dividends (subject to GSM approval),including impact of prudential filters;
RON m Q4-2017 Q4-2016 Change 2017 2016 Change
Net banking income 680 619 +9.8% 2,641 2,634 +0.3%
Financial results Operating expenses (385) (335) +15.0% (1,388) (1,310) +5.9%
Gross operating income 295 284 +3.8% 1,254 1,324 -5.3%
Net cost of risk 95 (112) n/a 376 (461) n/a
Net profit 336 142 +137.1% 1,380 728 +89.5%
Cost/Income 56.6% 54.1% +2.5 pt 52.5% 49.7% +2.8 pt
ROE 19.4% 8.9% +10.5 pt 20.6% 11.8% +8.8 pt
Loans and deposits RON bn Dec-16 Dec-17 Change
Net loans (RON bn) (1) 27.4 29.0 +4.8%
Retail 18.7 20.3 +7.2%
Non retail 8.7 8.8 -0.4%
Total deposits (RON bn) (1) 42.3 44.4 +3.9%
Retail 26.0 27.8 +5.8%
Non retail 16.3 16.6 +0.9%
Loan to deposit ratio 64.8% 65.4% +0.6 pt
Capital adequacy CAR (2) 19.8% 19.5% -0.3 pt
Franchise No of branches 810 760 (50)
No of active customers (x 1000) 2,285 2,327 +41

02/12/2018 42FULL-YEAR AND 4TH QUARTER 2017 RESULTS
BRD | STOCK PRICE PERFORMANCE
� BRD is part of the main market indices on the Bucharest Stock Exchange
� BRD is in Top 5 largest domestic companies listed on the local stock exchange
� BRD’s share price reached RON 12.90 as of December 2017 end, higher by 8.6% y/y.
0
500
1,000
1,500
2,000
2,500
3,000
3,500
4,000
6.0
7.0
8.0
9.0
10.0
11.0
12.0
13.0
14.0
15.0Market capitalisation
EUR 1.9 bn
Volume ('000 shares, rhs) Price (RON, lhs)

02/12/2018 43FULL-YEAR AND 4TH QUARTER 2017 RESULTS
FINANCIAL CALENDAR FOR 2018
� 8th February: Preliminary 2017 financial results and an nual press conference
� 19th April: General Shareholders Meeting
� 19th April: General Assembly of Shareholders and publica tion of the 2017 BoD Report
� 4th May: Q1-2018 results publication
� 2nd August: H1-2018 results publication
� 8th November: 9M-2018 results publication

02/12/2018 44FULL-YEAR AND 4TH QUARTER 2017 RESULTS
GLOSSARY – CLIENT SEGMENTATION
� The Retail category is comprised of the following customer segments:
• Individuals – BRD provides individual customers with a range of banking products such as: savings and deposits taking, consumer and housing loans, overdrafts, credit card facilities, funds transfer and payment facilities.
• Small business – business entities with annual turnover lower than EUR 1m and having an aggregated exposure at group level less than EUR 0.3m. Standardized range of banking products is offered to small companies and professionals: savings and deposits taking, loans and transfers and payment services.
� The Non-Retail category is comprised of the following customer segments:
� Small and medium enterprises - companies with annual turnover between EUR 1m and EUR 50m and the aggregated exposure at group level higher than EUR 0.3m. The Bank provides SMEs with a range of banking products such as: savings and deposits taking, loans and other credit facilities, transfers and payment services.
� Large corporate - within corporate banking BRD provides customers with a range of banking products and services, including lending and deposit taking, provides cash-management, investment advices, securities business, project and structured finance transaction, syndicated loans and asset backed transactions. The large corporate customers include companies with annual turnover higher than EUR 50m, municipalities, public sector and other financial institutions.
