brd finrespres 2016 webcast cnr · nbr maintained the key policy rate at the historical low of...
TRANSCRIPT

BRD GROUPRESULTS
10 FEBRUARY 2017
FULL-YEAR AND 4TH QUARTER 2016

DISCLAIMER
The consolidated balance sheet and profit and loss account for the period ended December 31, 2016 were examined by the Board of Directors on February 8, 2017.
The financial information presented for the year ended December 31, 2016 and comparative periods has been prepared according to IFRS as adopted by the European Union and applicable at this date.
BRD will publish a full set of consolidated and individual financial statements for the 2016 financial year.
This financial information is at group level, does not constitute a full set of financial statements and is not audited.
This presentation contains forward-looking statements relating to the targets and strategies of BRD and are based on a series of assumptions. These forward-looking statements have been developed from scenarios based on a number of economic assumptions in the context of a given competitive and regulatory environment. BRD may be unable to anticipate all the risks, uncertainties or other factors likely to affect its business and to appraise their potential
|10 FEBRUARY 2017
anticipate all the risks, uncertainties or other factors likely to affect its business and to appraise their potential consequences, and to evaluate the extent to which the occurrence of a risk or a combination of risks could cause actual results to differ materially from those provided in this document.
Investors and analysts are advised to take into account factors of uncertainty and risk likely to impact the operations of BRD when considering the information contained in such forward-looking statements. Other than as required by applicable law, BRD does not undertake any obligation to update or revise any forward-looking information or statements.
P.2

CONTENT
CHAPTER 01_INTRODUCTION
CHAPTER 02_MACROECONOMIC AND BANKING ENVIRONMENT
CHAPTER 03_FULL-YEAR AND 4TH QUARTER 2016 GROUP RESULTS
|10 FEBRUARY 2017
CHAPTER 03_FULL-YEAR AND 4TH QUARTER 2016 GROUP RESULTS
CHAPTER 04_CONCLUSIONS
P.3

� Net profit of RON 763m in 2016, +63.4% vs 2015
� Increase in net banking income by +7.0% vs 2015 driven by growth in net interest income, higher fee and commissions income and VISA Europe transaction gain
� Operating expenses quasi stable vs 2015 reflecting ongoing cost discipline
� Gross operating income +14.9% vs 2015
� Lower risk costs (RON 484 million, -26.5% compared to 2015) and improved risk profile: further decline in the non-performing loan ratio (10.5% at December 31, 2016 against 13.3% at December 31, 2015) and higher non-performing loans coverage ratio (76.6% against 69.3% at December 31, 2015)
� Q4-2016 vs Q4-2015: net profit of RON 157m, +48.3% y/y, on a -40.4% lower cost of risk
2016: VERY SOLID FINANCIAL PERFORMANCE
Significant rise in net profit, +63.4% vs 2015
|10 FEBRUARY 2017
Continued commercial growth
� Number of active individual customers: +37k vs Dec 2015 end
� Increased deposit base (+2.3%* y/y)
� Credit growth (+3.2%* y/y) driven by the positive momentum in retail production and loans to large corporate expansion
Comfortable capital and liquidity positions
� Solvency ratio (Bank only) of 18.9% at Dec 2016 end (versus 18.1% at Dec 2015 end), comfortably above regulatory requirements
� Net loan/deposit ratio of 67.6% (vs 66.9% at Dec 2015 end)
(*) Variations at constant exchange rate
Note: NPL ratio, NPL provision coverage according to EBA definition
P.4

BRD GROUP | KEY FIGURES
Q4-2016 Q4-2015 Variation 2016 2015 Variation
Net banking income (RON m) 667 670 -0.4% 2,778 2,595 +7.0%
Operating expenses (RON m) (356) (344) +3.5% (1,388) (1,385) +0.2%
Gross operating income (RON m) 311 326 -4.5% 1,390 1,210 +14.9%
Cost of risk (RON m) (122) (204) -40.4% (484) (658) -26.5%
Net result (RON m) 157 106 +48.3% 763 467 +63.4%
Cost/Income 53.3% 51.3% +2.0 pt 50.0% 53.4% -3.4 pt
Dec-16 Dec-15 vs. Dec -15
Financial results
|10 FEBRUARY 2017 P.5
(1) Bank only, according to Basel 3, including the impact of prudential filters; (2) Variations at constant exchange rate; (3) Bank only
Dec-16 Dec-15 vs. Dec -15
CAR (1) 18.9% 18.1% +0.8 pt
Net loans including leasing (RON bn) (2)
28.5 27.6 +3.2%
Total deposits (RON bn) (2)
42.2 41.2 +2.3%
Net loans/deposits 67.6% 66.9% +0.6 pt
No of branches 810 829 (19)
No of active customers(3)
(x 1000) 2,285 2,250 36
Loans and deposits
Franchise
Capital adequacy

CHAPTER 02
MACROECONOMIC AND BANKING ENVIRONMENT
|10 FEBRUARY 2017
ENVIRONMENT
P.6
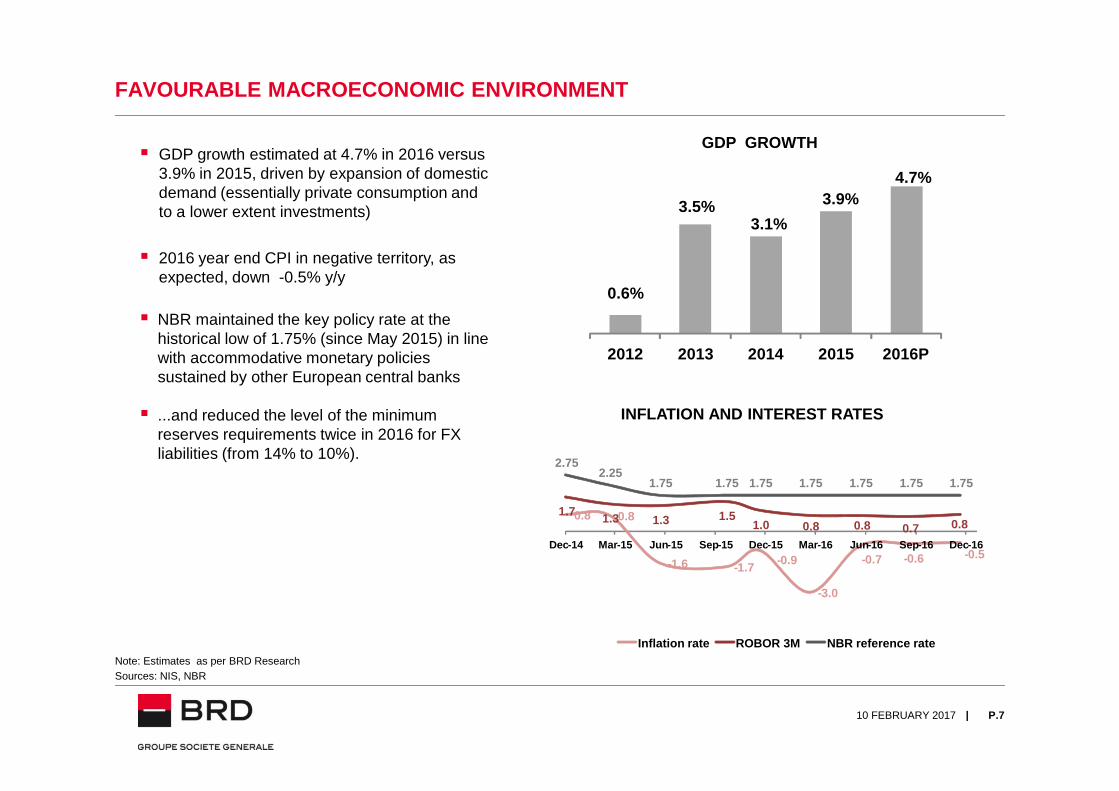
FAVOURABLE MACROECONOMIC ENVIRONMENT
GDP GROWTH� GDP growth estimated at 4.7% in 2016 versus
3.9% in 2015, driven by expansion of domestic demand (essentially private consumption and to a lower extent investments)
� 2016 year end CPI in negative territory, as expected, down -0.5% y/y
� NBR maintained the key policy rate at the historical low of 1.75% (since May 2015) in line with accommodative monetary policies sustained by other European central banks
0.6%
3.5%3.1%
3.9%4.7%
2012 2013 2014 2015 2016P
|10 FEBRUARY 2017
� ...and reduced the level of the minimum reserves requirements twice in 2016 for FX liabilities (from 14% to 10%).
Sources: NIS, NBRNote: Estimates as per BRD Research
P.7
INFLATION AND INTEREST RATES
1.71.3 1.3 1.5
1.0 0.8 0.8 0.7 0.8
2.752.25
1.75 1.75 1.75 1.75 1.75 1.75 1.75
0.8 0.8
-1.6 -1.7-0.9
-3.0
-0.7 -0.6 -0.5Dec-14 Mar-15 Jun-15 Sep-15 Dec-15 Mar-16 Jun-16 Sep-16 Dec -16
Inflation rate ROBOR 3M NBR reference rate

BANKING SECTOR: HIGHER SAVINGS RATE, MODEST LENDING GROWTH
� 7.3% deposit growth at 2016 end vs 2015 end:
� 11.0% higher individuals’ savings
� 2.9% increase in companies’ deposits
� 1.2% higher gross loans pushed by loans granted to individuals while corporate lending remained subdued (influenced also by write-offs and loan portfolio sales):
� 4.5% increase in loans to individuals driven by housing loans advance (+12.2%)
BANKING SYSTEM DEPOSITS (RON bn) yoy*
+2.9%
+11.0%
+7.3%
139 148 164
110 122
126
249 270
290
Dec -14 Dec -15 Dec -16Individuals Companies
|
102 108 113
121 122 120
223 230 233
Dec -14 Dec -15 Dec -16Individuals Companies
10 FEBRUARY 2017
driven by housing loans advance (+12.2%) in spite of tighter lending conditions imposed by banks after PIK law enforcement, while consumer loans continued to contract (-2.7%) though at a slower pace
� RON denominated consumer loans on a positive trend starting with the second quarter of 2015
� -1.7% decline in loans to companies as FX lending drop exceeded the growth of RON component
BANKING SYSTEM GROSS LOANS (RON bn )
(*) Variations at constant exchange rate; Source: NBR
P.8
yoy*
-1.7%
+4.5%
+1.2%

BANKING SECTOR: STEADY DECLINE OF NPL RATIO
BANKING SECTOR NPL RATIO *
Loss 2 NPL ratio EBA NPL ratio
14.3%
18.2%
21.9%
13.9%
20.7%
13.6%
9.9%
|10 FEBRUARY 2017
3 4
(*) 1) Loss 2 indicator: Regulatory ratio representing loans overdue more than 90 days and/or in litigation. Starting with 2014 NBR changed the methodology and widened the area of application by including banks with internal rating based approaches, which led to a decline in the NPL ratio. 2) NPL ratio (EBA definition): Non-performing exposures are those that satisfy any of the following criteria: a) material exposures which are more than 90 days past due; b) the debtor is assessed as unlikely to pay its credit obligations in full without realization of collateral, regardless of the existence of any past due amount or of the number of days past due.
� Single digit NPL ratio at November 2016 end as portfolio clean up operations led to a continuous reduction of bad loans volume over the last 3 years.
� Coverage of non performing loans by risk provisions, using EBA methodology, reached 54% as of September 2016 versus 57% as of December 2015 and 56% as of December 2014.
Source: NBR
P.9
Dec-11 Dec-12 Dec-13 Dec-14 Dec-14 Dec-15 Nov-16

CHAPTER 03
2016 AND 4TH QUARTER GROUP RESULTS
|10 FEBRUARY 2017
GROUP RESULTS
P.10

STRONG CLIENT AQUISITION
EVOLUTION OF ACTIVE INDIVIDUAL CUSTOMERS* (x 1000)� Continuously expanding customer base over the
last 2 years:
� +14k clients in 2015
� +37k clients in 2016
� Increased equipment rate (number of products per active client) of individual customers due to a better penetration rate of remote banking solutions: 4.07 (2016 end) versus 3.95 (2015 end)
� Stock of remote banking contracts, up by +30% y/y driven by:
� +20% y/y increase in the number of internet NUMBER OF REMOTE BANKING
+37k+14k
2,102 2,117 2,154
Dec -14 Dec -15 Dec -16
|10 FEBRUARY 2017
� +20% y/y increase in the number of internet banking contracts
� +63% y/y increase in the number of mobile banking contracts
NUMBER OF REMOTE BANKING CONTRACTS FOR INDIVIDUALS * (X 1000)
(*) Bank only
P.11
541
692
832
93
196
318
Dec -14 Dec -15 Dec -16
MyBRD Net MyBRD Mobile

ROBUST GROWTH IN CREDIT ORIGINATION
� Production of loans to individuals remained on a strong upward trend versus 2015, up by +11.2%:
� further advance on unsecured consumer loans, +20.3% vs 2015, thanks to rising demand and optimized granting process leading to a better time to cash
� housing loans production down -6.5% vs 2015 influenced by tighter lending standards given PIK law enforcement
� Net loans outstanding to retail segment increased by +5.4% driven by further advance of unsecured
INDIVIDUALS’ LOAN PRODUCTION (RON m)Q4-16 vs.
Q4-152016 vs.
2015
-5.1% +11.2%
+20.3%+5.3%
-27.0% -6.5%354 489 432 441 324
587 372 321
636 933
814 934 782
1,176
1,050 983
990
1,422 1,246
1,374
1,106
1,763
1,422 1,304
Q1 -15 Q2 -15 Q3 -15 Q4 -15 Q1 -16 Q2 -16 Q3 -16 Q4 -16
Housing loans Consumer loans
|
+5.4% driven by further advance of unsecured consumer loans and housing loans portfolios
� Loans outstanding to large corporate clients , up by +6.6% vs 2015, in spite of intensive competition on the segment
(*) Variations at constant exchange rateNote: The Retail Segment is comprised of Individuals and Small Business (see Appendix).
NET LOANS including leasing (outstanding amounts, RON bn)
10 FEBRUARY 2017 P.12
yoy*
+3.2%
-1.0%
+5.4%17.4 18.3 19.3
9.9 9.2 9.2
27.3 27.6 28.5
Dec-14 Dec-15 Dec-16
Retail Non-retail

DEPOSITS GROWTH WITH POSITIVE STRUCTURE SHIFTS
� Overall deposits up +2.3% compared to December 2015 end
� retail deposits up +9.9% y/y while non retail deposits contracted in a context of very comfortable liquidity situation
� Significant increase registered on deposits on current accounts average outstanding amounts for both segments:
� retail: +32.8% vs 2015
� non- retail: +35.3% vs 2015
� Household deposits performance above banking
DEPOSITS (outstanding amounts, RON bn)
HOUSEHOLD DEPOSITS EVOLUTION (yoy *)
yoy*
+2.3%
-7.9%
+9.9%21.4 23.6 26.0
14.6 17.5 16.1
36.0 41.2 42.2
Dec-14 Dec-15 Dec-16
Retail Non -retail
|
� Household deposits performance above banking system leading to a higher market share on the segment (up +0.1 percentage point, to 14.0% as of 2016 end)
10 FEBRUARY 2017
(*) Variations at constant exchange rateNote: The Retail Segment is comprised of Individuals and Small Business (see Appendix).
P.13
HOUSEHOLD DEPOSITS EVOLUTION (yoy *)
8.0%
10.6%11.1%
12.7%
10.4%
9.0%10.1%
9.1%
12.1%
5.8%6.9% 6.9% 6.8%
6.0% 5.9%8.7% 8.8%
11.0%
Dec-14 Mar-15 Jun-15 Sep-15 Dec-15 Mar-16 Jun-16 Sep-16 Dec -16
BRD Banking system

BROAD – BASED FULL YEAR NET BANKING INCOME INCREASE
NET BANKING INCOME (RON m)
Other income
Net fee and commissions
Net interest income
+4.6%
+3.1%
+27.0%
+7.0%
NET BANKING INCOME (RON m)
Other income
Net fee and commissions
Net interest income
-0.4%
+2.8%
-2.6%
-10.8%
yoy
yoy
330 419
750 773
1,516 1,586
2,595 2,778
2015 2016
80 72
193 188
396 407
670 667
Q4-2015 Q4-2016
|
� Net banking income up by +7.0% in 2016 on higher core and non core banking revenues compared to 2015
� Improvement in net interest income, +4.6% in 2016 vs 2015 as:� volume growth and positive structure shifts (increase of deposits on current accounts weight in total deposits to 34%
at 2016 end from 27% at 2015 end) � more than offset the impact of persistently low interest rates
average ROBOR 3M: 0.78% in 2016 vs 1.33% in 2015average EURIBOR 3M: -0.26% in 2016 vs 0.02% in 2015
� Increase of net fee and commissions income in 2016 vs 2015 mostly driven by higher revenues from cards, e-banking subscriptions growth and insurance activity
� Decline in net fee and commissions income in Q4-2016 compared to Q4-2015 mostly due to lower revenues on banking transfers
10 FEBRUARY 2017 P.14

NET BANKING INCOME EXCLUDING SALE OF VISA EUROPE SH ARE UP +3.1%
NET BANKING INCOME excl. non-recurring items (RON m)
Other income
Net fee and commissions
Net interest income
Other income
Net fee and commissions
Net interest income
NET BANKING INCOME excl. non-recurring items (RON m)
-0.4%
+2.8%
-2.6%
yoy
-10.8%
+3.0%
+4.6%
+3.1%
-5.5%
yoy
304 287
750 773
1,516 1,586
2,569 2,646
2015 2016
76 68
193 188
396 407
665 663
Q4-2015 Q4-2016
|
� Non – recurring elements booked in other income totaled RON 131.4 m in 2016 (RON 25.8m in 2015):
� VISA Europe transaction gain (RON 103.1m)
� Gain on sales of Government bonds and fund units booked as AFS (RON 28.3m)
10 FEBRUARY 2017 P.15

CONTINUED DISCIPLINED COSTS CONTROL
OPERATING EXPENSES (RON m)
OPERATING EXPENSES (RON m)
Other expenses
Staff expenses
Other expenses
Staff expenses
Contributions to FGDB & FR*
+3.5%
+5.9%
+1.2%
yoy
yoy
+0.2%
+5.1%
-1.2%
-26.0%88 65
643 635
655 688
1,385 1,388
2015 2016
177 179
167 177
344 356
Q4-2015 Q4-2016
|10 FEBRUARY 2017
� Quasi stable operating expenses in 2016 compared to 2015 as:
� savings on real estate and sundry costs as well as lower contributions to the Bank Deposit Guarantee Fund and Resolution Fund (-26% year on year)
� …almost offset higher staff costs
�…keeping in mind the 11.4% overall decline in operating costs registered in the previous four years
P.16
(*) The annual contributions to the Bank Deposit Guarantee Fund (FGDB) and Resolution Fund (FR) were booked in full in Q1 2016 following implementation of IFRIC 21 – Levies. Operating expenses for Q4 2015 were adjusted for comparability purposes.

0.4% 0.3%51.7% 53.7%
53.4% 50.0%
0.5% 2.5%
53.9% 52.4%
2015 2016
SOLID OPERATIONAL PERFORMANCE
GROSS OPERATING INCOME (RON m)
GOI excl. non recurring items
Non recurring items
-4.5%
-4.4%
C/I ratio
Non recurring items
C/I ratio excl. non recurring items
COST/INCOME RATIO
+14.9%
+6.9%
COST/INCOME RATIO
GROSS OPERATING INCOME (RON m)
GOI excl. non recurring items
Non recurring items
Non recurring
C/I ratio excl. non recurring
1,184 1,259
26 131 1,210
1,390
2015 2016
321 307 5 4
326 311
Q4 -2015 Q4 -2016
|
51.3% 53.3%
0.4% 0.3%
Q4-2015 Q4-2016
2015 2016
10 FEBRUARY 2017
� Strong operating income growth in 2016 as compared to 2015
� Cost/Income ratio at 50%, improved by 3.4 percentage points vs 2015
P.17
C/I ratio
Non recurring items
2015 2016

ASSET QUALITY
� Loan portfolio market mix
� 61% on individuals market segments
� 39% on legal entities market segments
� Consolidation of RON lending
�Share of RON denominated loans at around 57% (versus 50% as of 12/2015)
�Trend in line with market evolution
� Declining NPL ratio
GROSS LOANS - December 31, 2016BREAKDOWN BY SEGMENT &
CURRENCY (in bn RON)
NPL RATIO - EBA methodology *
18.9
12.0
Individuals
Companies 17.5
13.4
RON
FX
|
� Declining NPL ratio
� Trend in line with the evolution observed at the level of the Romanian banking sector
� Reflecting write-offs performed during the 2015-2016 period as well as improving NPL recovery performance
� Some further write-offs to be performed (in line with the Bank’s write-off policy)
� NPL portfolios sale activities to continue, for both retail and non retail segments
NPL RATIO - EBA methodology *
10 FEBRUARY 2017
(*) At individual level (**) Ratio for the Banking system - as of Nov 2016
P.18
20.2% 19.8%
16.0%15.3%
13.3% 13.7%
11.8%10.8% 10.5%
20.7% 20.2%
16.2%15.7%
13.6% 13.5%
11.3%10.0% 9.9%
Dec-14 Mar-15 Jun-15 Sep-15 Dec-15 Mar-16 Jun-16 Sep-16 De c-16**
BRD Banking system

COST OF RISK AND COVERAGE RATIO
� 2016 highlights
� Overall resilient risk profile for all non legacy portfolios (retail and non retail)
� Some residual impact from legacy NPL portfolio sale activities
� Further upgrade of the Bank’s provisioning methodology for non defaulted portfolios
� Further improvement in BRD’s recovery performance recorded on defaulted exposures (both retail and non retail)
COST OF RISK EVOLUTION (in M RON)
800
1,193
1,883
2,083
1,193
631
461 205 112
198137
248
132
0
100
200
300
400
500
600
0
500
1,000
1,500
2,000
2,500
2010 2011 2012 2013 2014 2015 2016 Q4-15 Q4-16
CoR (RONm) CoR* (bps)
|
� Key ratios evolution
� Net cost of risk at 137 bp for 2016 (versus 198 bp in 2015)
� Higher NPL coverage ratio vs 2015 end (despite continued write-offs activity)
NPL COVERAGE RATIO - EBA methodology
P.1910 FEBRUARY 2017
(*) cost of credit risk only
66.7%68.9%
66.3%
69.8% 69.3%
74.8% 74.7% 74.7%76.6%
Dec-14 Mar-15 Jun-15 Sep-15 Dec-15 Mar-16 Jun-16 Sep-16 Dec -16

STRONG NET INCOME GROWTH, ROE AT 11.8%
NET PROFIT (RON m)
RETURN ON EQUITY
Net profit excluding non recurring items
Net non recurring items
ROE excl. non recurring items
Non recurring items
+63.4%
+46.6%
+48.3%
+50.4%Net profit excl non recurring
items
Net non recurring items
Non recurring items
RETURN ON EQUITY
NET PROFIT (RON m)
446
653
22
110
467
763
2015 2016
7.4%10.1%
0.4%
1.7%7.8%
11.8%
2015 2016
102 154
4
3 106 157
Q4-2015 Q4-2016
0.3%
0.2%6.9%
9.4%
|
� Significant increase in full year net profit vs 2015 (+63.4%) driven by higher revenues, strict operating expenses control, lower risk costs
� Strongly improved ROE reaching 11.8% in 2016 compared to 7.8% in 2015
� Q4-2016 vs Q4-2015: net profit of RON 157m, +48.3% y/y, on a -40.4% lower cost of risk
P.2010 FEBRUARY 2017
ROE excl non recurring items
6.6%9.2%
0.3%
Q4 -2015 Q4 -2016

SELF- FUNDED ON A STANDALONE BASIS
� Slightly higher net loans to deposits at 67.6% at 2016 end (versus 66.9% at 2015 end) on credit portfolio growth
� Excess of liquidity primarily invested in Government bonds and interbank placements allowing BRD to maintain an adequate liquidity buffer and to hedge its exposure to interest rate risk
� Policy of diversification of resources:
� Stable funding based on growing deposits:increase of the share of deposits in total liabilities
NET LOANS AND DEPOSITS (RON bn)
32.6
32.4
28.6
27.3
27.6
28.530
.2
31.8
36.1
36.0 41
.2
42.2
107.8%101.8%
79.4% 76.0%66.9% 67.6%
0.0%
20.0%
40.0
%
60.0%
80.0%
100.0%
0.0
5.0
10.0
15.0
20.0
25.0
30.0
35.0
40.0
Dec -11 Dec -12 Dec -13 Dec -14 Dec -15 Dec -16
Net loans incl. leasing Deposits Net loan to deposit
|
43.8 43.1 42.6 40.3
43.9 45.2
69% 74% 85% 89% 94% 93%
23% 14%10% 7%
2% 2%8% 12% 5% 4% 5% 4%
Dec-11 Dec-12 Dec-13 Dec-14 Dec-15 Dec-16
LIABILITIES STRUCTURE (RON bn)
increase of the share of deposits in total liabilities from 69% at 2011 end to 93% at 2016 end
� Reduced reliance on parent funding, from 23% of total liabilities at 2011 end to 2% at 2016 end on a consolidated basis
10 FEBRUARY 2017 P.21
Customers’ deposits
Interbank & IFIs
Parent

STRONG CAPITAL POSITION SUPPORTIVE FOR FURTHER GROW TH
� Solid capital base composed of high quality Tier 1 eligible instruments: share capital, retained earnings, reserves
� Capital adequacy ratio well above regulatory requirements: CAR reached 18.9% as at 2016 end compared to 18.1% at 2015 end (Bank only)
Bank only Dec-14 Dec-15 Dec-16
Capital adequacy ratio 17.2% 18.1% 18.9%
Own funds (RONm) 4,614 4,857 4,992
Total risk exposure amount (RONm) 26,873 26,862 26,373
Capital requirements (RONm) 2,150 2,149 2,110
|10 FEBRUARY 2017
Note: Figures are with national discretions.
P.22

CHAPTER 04
CONCLUSIONS
|10 FEBRUARY 2017
CONCLUSIONS
P.23

� BRD Group delivered a very good commercial and financial performance in 2016, marked by:
� Strong client acquisition dynamics
� Solid growth in credit origination mainly on retail and large corporate segments
� Increased core revenues
� Disciplined cost control
� Reduced cost of risk reflecting the improved quality of the credit portfolio and origination
� A significantly higher net profit (+63% vs 2015) and a 11.8% ROE (+4.0 percentage points vs 2015)
� Considering the results of the year as well as the comfortable capital adequacy level, the Board of Directors has decided to propose a dividend corresponding to a payout ratio of 70% of the bank 2016 net income, subject to a favorable vote by the Annual General Meeting of Shareholders on April 20, 2017.
CONCLUSIONS
|10 FEBRUARY 2017
favorable vote by the Annual General Meeting of Shareholders on April 20, 2017.
� Looking ahead, we are confident of our universal bank business model which will further enable us to satisfy the most various needs of our customers and grow healthily on all segments while creating value for our shareholders.
P.24

RECOGNIZED EXCELLENCE
“e-premiere“, best product on the market - for our new
credit card, e-finance
“The mobile application of the year ”, for our mobile banking application
MyBRD Mobile, MasterCard
Bank of the year on retail market, Piata Financiara
|10 FEBRUARY 2017 P.25
“Safest Bank in Romania”,Global Finance
“Best Trade Finance Bank”, Global Finance
“World’s Best Securities Services Provider ” – Best in Romania
“Best Custodian in Romania ”, Global Custodian
No. 1 Custodian in Romania, Global Investor
Number one on syndicated loan market , with a market share of 21%

Q&A
|10 FEBRUARY 2017
Session
P.26

APPENDIX
|10 FEBRUARY 2017
APPENDIX
P.27
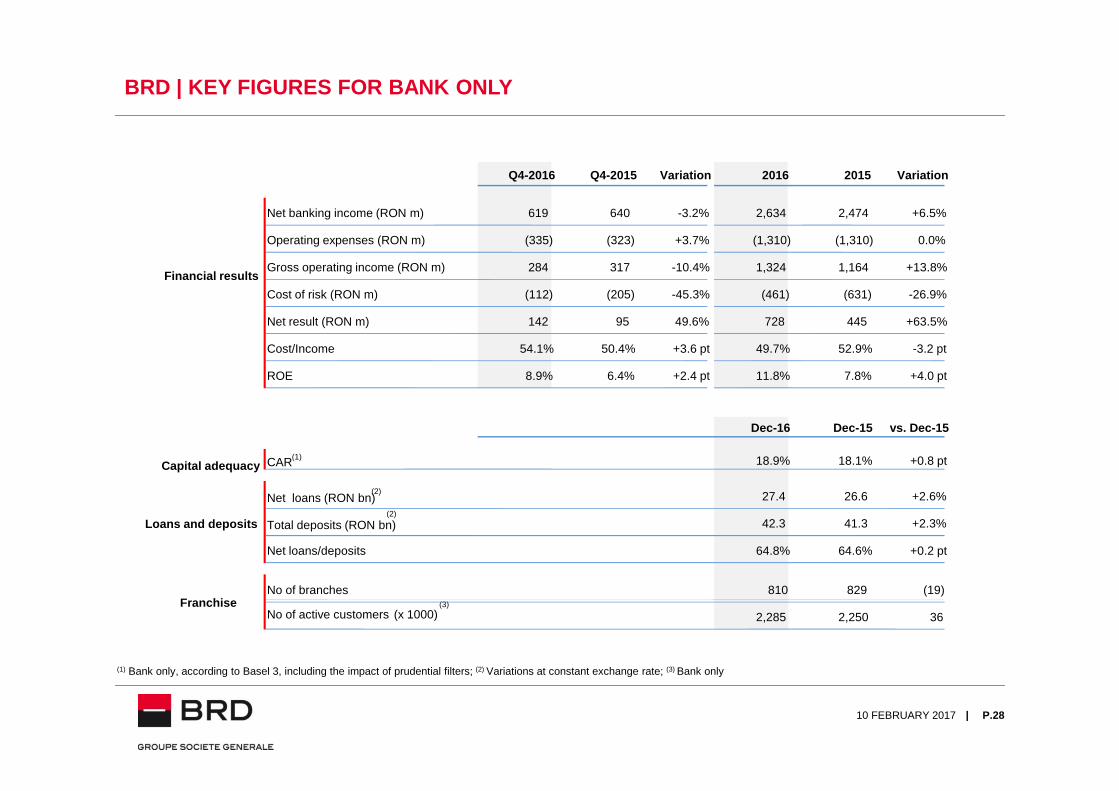
BRD | KEY FIGURES FOR BANK ONLY
Q4-2016 Q4-2015 Variation 2016 2015 Variation
Net banking income (RON m) 619 640 -3.2% 2,634 2,474 +6.5%
Operating expenses (RON m) (335) (323) +3.7% (1,310) (1,310) 0.0%
Gross operating income (RON m) 284 317 -10.4% 1,324 1,164 +13.8%
Cost of risk (RON m) (112) (205) -45.3% (461) (631) -26.9%
Net result (RON m) 142 95 49.6% 728 445 +63.5%
Cost/Income 54.1% 50.4% +3.6 pt 49.7% 52.9% -3.2 pt
ROE 8.9% 6.4% +2.4 pt 11.8% 7.8% +4.0 pt
Financial results
|10 FEBRUARY 2017 P.28
(1) Bank only, according to Basel 3, including the impact of prudential filters; (2) Variations at constant exchange rate; (3) Bank only
Dec-16 Dec-15 vs. Dec-15
CAR (1) 18.9% 18.1% +0.8 pt
Net loans (RON bn) (2) 27.4 26.6 +2.6%
Total deposits (RON bn) (2)
42.3 41.3 +2.3%
Net loans/deposits 64.8% 64.6% +0.2 pt
No of branches 810 829 (19)
No of active customers (3)
(x 1000) 2,285 2,250 36
Capital adequacy
Loans and deposits
Franchise

BRD STOCK PRICE PERFORMANCE
1,000
1,500
2,000
2,500
3,000
3,500
4,000
8.0
9.0
10.0
11.0
12.0
13.0 Market capitalisationEUR 1.8bn
|10 FEBRUARY 2017
� BRD is part of the main market indices on the Bucharest Stock Exchange
� BRD is in Top 5 largest domestic companies listed on the local stock exchange
� BRD’s share price reached RON 11.38 as of 3 February 2017, down by 4% ytd and up by 13% yoy.
Sources: Bloomberg, Bucharest Stock Exchange
P.29
0
500
6.0
7.0
Volume ('000 shares, rhs) Price (RON, lhs)

FINANCIAL CALENDAR FOR 2017
� 9th February: Preliminary 2016 financial results and an nual press conference
� 20th April: General Shareholders Meeting
� 20th April: Publication of the 2016 Board of Directors R eport
� 4th May: Q1-2017 results publication
� 2nd August: H1 -2017 results publication
| P.3010 FEBRUARY 2017
� 2nd August: H1 -2017 results publication
� 3rd November: 9M-2017 results publication

GLOSSARY – CLIENT SEGMENTATION
� The Retail category is comprised of the following customer segments:
� Individuals – BRD provides individual customers with a range of banking products such as: savings and deposits taking, consumer and housing loans, overdrafts, credit card facilities, funds transfer and payment facilities.
� Small business – business entities with annual turnover lower than EUR 1m and having an aggregated exposure at group level less than EUR 0.3m. Standardized range of banking products is offered to small companies and professionals: savings and deposits taking, loans and transfers and payment services.
.� The Non-Retail category is comprised of the following customer segments:
� Small and medium enterprises - companies with annual turnover between EUR 1m and EUR 50m and the
|10 FEBRUARY 2017
� Small and medium enterprises - companies with annual turnover between EUR 1m and EUR 50m and the aggregated exposure at group level higher than EUR 0.3m. The Bank provides SMEs with a range of banking products such as: savings and deposits taking, loans and other credit facilities, transfers and payment services.
� Large corporate - within corporate banking BRD provides customers with a range of banking products and services, including lending and deposit taking, provides cash-management, investment advices, securities business, project and structured finance transaction, syndicated loans and asset backed transactions. The large corporate customers include companies with annual turnover higher than EUR 50m, municipalities, public sector and other financial institutions.
P.31

THANK YOUInvestor Relations
Tel. : +4 021 380 47 62
|10 FEBRUARY 2017
Tel. : +4 021 380 47 62 Email : [email protected]: www.brd.ro
P.32