bio-control technology: development, production and ... · 4/1/2012 · bio-control technology:...
TRANSCRIPT

Journal of Progressive Agriculture, Vol.3, No. 1: April 2012
1
Bio-control technology: Development, production and popularization for plant disease control in semi-arid region of Rajasthan, India- A success story
R B GAUR AND R N SHARMA Department of Plant Pathology, Agricultural Research Station (S.K. Rajasthan Agricultural University),
Sriganganagar-335 001, Rajasthan, India E mail: dr.rbgaur @ yahoo.com
ABSTRACT
The first bio-agent production unit of the state was established at this research station in 1995, funded by the DBT, Govt. of India. Initially exotic isolate of Trichoderma harzianum (Th-8) was used for mass production but latter on a potent native strain of T. harzianum (TG-1) was substituted for commercial production of bio-agent. Systematic studies (1995-2010) were conducted to evolve several biocontrol technologies like, suitable substrates for Trichoderma multiplication, shelf-life of talc based formulation of Trichoderma, delivery system of antagonists to seed, soil and paint formulation, dry root rot control in chickpea using Khejri based production system, development of new consortium formulation of bioagents and compatibility of bio-agents with fungicides. Several recommendations were provided for successful biocontrol of plan diseases like root rot of chickpea and cotton (Rhizoctonia bataticola), Sclerotinia stem rot of mustard (Sclerotinia sclerotiorum), Phytophthora rot/gummosis (Phytophthora spp.), canker (Xanthomonas axonopodis pv. Citri) and fruit dropping in Kinnow. These technologies were transferred to cultivators systematically through front line, field and IPM based demonstration. Since establishment of bioagent production unit, a total of 9855 kg of talc based Trichoderma has been produced for commercial sale and income of Rs. 11,69,340/- has been generated. This successful transfer of bioagent technology has led to generate interest of State Agricultural Department and private companies in the market to meet out the growing demand of bioagent in the area. The commercial sale through these sources in this zone between 2007-08 to 2009-10 was approximately 87 metric tonnes. During this 15 year of journey on eco-friendly road approximately 13,633 ha and 1,23,142 ha area has been covered under this technology through commercial sale of bioagent by this centre and Govt. and private agencies respectively. This clearly indicates impact of technology generated by this centre in managing soil borne diseases of the area and improving soil health.
Key words: Bio-control, Trichoderma, crops. In intensive agriculture pesticides have been looked upon as omnipotent weapons for modern disease management. Indiscriminate use of pesticides against crop diseases has created several problems related with environmental pollution, development of resistance in pathogen and accumulation of harmful residue in soil, water and plants. This has prompted the necessity for development of alternative that could be practical and effective for eco-friendly disease management. Steady efforts were therefore made to develop cost effective, eco-friendly, viable bioagent based technology to manage important soil borne plant pathogens such as Phytophthora, Rhizoctonia, Fusarium, Sclerotinia which have detrimental effect on kinnow, cotton, chickpea and mustard crop of economic importance in the region.
Establishment of bioagent production unit Keeping this in view, a mission mode pilot project on “Development, production and demonstration of bio-control agents under integrated pest management” was submitted by R.K. Joshi and S. Gangopadhyay. A bioagent production unit was finally established in 1995 under the funding (Rs. 33 lac) of DBT, Government of India for production and demonstration of bioagents for the management of pests and diseases in cotton and chickpea crops in semi-arid region of Rajasthan. This was the first bioagent based lab in the State.
Preliminary studies Collection of bioagent isolates & mass production of Trichoderma. Preliminary bioagent based studies (1995-1998) were conducted by Gangopadhyay and Joshi. Initially, different isolates of bioagents were collected from biocontrol labs of Bangalore, Coimbatore and Pantnagar to select the suitable strains for the region. Exotic isolate of Trichoderma harzianum (Th-8) obtained from Pantnagar was used for mass production of bioaged for field demonstration and trials.
Field demonstrations and trials. Large scale multilocational field demonstrations were conducted in farmers’ fields and Central State Farm, Suratgarh in cotton and chickpea crops in the fields having known history of root rot infestations. Seed treatment with Trichoderma-SD @ 4g kg-1 seed (talc-based formulation of 2 x 10⁷ cfu g-1) plus soil application of Trichoderma SD @ 5 kg ha-1 were found effective in controlling root rot in cotton and chickpea crops (Gangopadhyay and Joshi, 1997). This was the first bioagent based recommendation in the zone.
Development and refinement of technology Potent bioagent isolate of Trichoderma. Work on refinement of bioagent based technology was initiated during 1998 by Gaur and Sharma. Collection of soil samples from the zone -1b (Sriganganagar and Hanumangarh district) of Rajasthan were made to

Journal of Progressive Agriculture, Vol.3, No. 1: April 2012
2
isolate potent Trichoderma strains among 13 local isolates. Thereby during 1999, the commercial production of T. harzianum (Th-8) in bioagent production lab was substituted with potent local strain (TG-1) of T. harzianum (Gaur and Sharma, 1999).
Suitable substrates for Trichoderma multiplication. Ten substrates viz., wheat bran + 2% molasses, wheat bran + peat soil (3 : 10), Sugarcane bagasse + 2% molasses, gram shells, paddy husk, sorghum grains, sodium alginate granules impregnated with 2% molasses, farm yard manure (FYM), faecal pellets of goat & sheep, standard talk based formulation were evaluated for Trichoderma multiplication. Faecal pellets of goat and sheep, gram shell and FYM were identified as most suitable substrates for Trichoderma multiplication. Sorghum grain substrate of Trichoderma was found least suitable for bioagent multiplication (Gaur et al., 2005a). Shelf-life of talc based formulation of Trichoderma. The viability of Trichoderma in talc based powder formulation was estimated (1999-2000) at different storage temperature ranging between 0 to 40 oC for 180 days of storage (DOS). The initial mean population of Trichoderma on 0 day was 270 x 106 cfu g-1and after 180 DOS it declined to 20 x106 cfu g-1. Shelf - life of 90-105 days at 25 oC was worked out for commercial produce of Trichoderma (Gaur et al., 2005a). Delivery system of antagonist to seed and soil. The delivery system of antagonist to seed & soil was worked out during 1999-2000 to 2002-2003. Technique of soil application of Trichoderma was found significantly superior over seed treatment. Pre-incubation of Trichoderma in FYM 15 days before soil application gave better results than its alone application. Wheat bran based formulation of Trichoderma gave better control of disease than talc based formulation for soil application. Trichoderma @ 10 g kg-1 seed gave better control than the lower dose of 4 g kg-1 seed. Technique of seed dip, solid matrix priming did not prove effective (Gaur et al., 2005b). Seed treatment involving single bioagent with or without spray combination though provided significantly better control of disease in comparison with control but were found inferior when compared with mixture of two different bioagents (Gaur et al., 2010). Delivery system of antagonist for paint formulation. The delivery system of antagonist for paint formulation was also worked out (2004-05 to 2006-07) to find out environmentally accepted paint formulation, alternative to metalaxyl for the control of foot rot disease in kinnow. Different paint formulations of Trichoderma and Pseudomonas were explored against Phytophthora stem lesions in Kinnow Painting with talc based formulation of P. fluorescens (2 x 10⁹ cfu/g) or T. harzianum (2 x 10⁷ cfu/g) @ 100 g/l water followed by painting with linseed oil after 5 days provided significant recovery of Phytophthora lesion (Gaur et al., 2011).
Biocontrol agents isolated from different production system. Various types of biocontrol agents (mycoparasites) were isolated (2001-02 to 2002-03) from field rhizospheric soil collected from different production systems in the region in association with various pathogens (Gaur, 2004). Identity was confirmed by Indian Type Culture Collection, IARI, New Delhi and Agharkar Research Institute, Pune. (a) Khejri based production system. Soil samples collected below khejri (Prosopis cineraria) invariably yielded higher bioagent population. Among various species of Trichoderma isolates (harzianum, viride, koningii, hamatum), T. harzianum and T. viride were found to be widely distributed while T. koningii was found least distributed in soil. Other bioagents isolated from khejri based production system in the region were Gliocladium (virens, penicelloides), Chaetomium globosum, and Penicillium (pinophilum, funiculosum). Ber/Khejri + Chickpea production system harboured maximum Mycoparasites. (b) Kinnow based production system. Fruit bearing Kinnow orchards harboured more bioagents and soil borne pathogens compared to pre fruit bearing orchards. The Aspergillus group (versicolor, fumigatus, candidus, flavus, terreus) was predominant during kherif season when the mung and moth crop was taken as intercrop. Trichoderma harzianum was found widely distributed while Chaetomium globosum was found least distributed mycoparasites in soil.
Less dry root rot in chickpea under Khejri based production system. Studies were conducted at cultivator’s field. Chickpea crop grown under khejri (Prosopis cineraria) based production system and as a sole crop was observed during 2001-2002 to 2002-2003. During both the years, 4 fields each measuring 1 ha, was observed for dry root rot incidence. Dry root rot (R. bataticola) incidence was significantly less in chickpea under khejri based production system compared to sole crop of chickpea (Gaur, 2004). Development of new consortium formulation of bioagents. Systematic studies in laboratory, cage house and multilocational field trials were conducted (2002-03 to 2005-06) to find out the best consortium formulation of bioagents for controlling Sclerotinia rot (Sclerotinia sclerotiorum) of Indian mustard (Brassica juncea). Talc based consortium formulation (2 x 10⁷ cfu g-1) of T. hamatum (HP-20) + T. viride (Tv-1) in the ratio of 1 : 1 (w/w) was developed & commercialized (Gaur and Sharma, 2006). Isolation of new yeast bioagent. A new yeast bioagent Sporidiobolus pararoseus (KFY-1) was isolated from Kinnow fruit surface (Sharma et al., 2008b). This bioagent was found effective in controlling pre- and post-harvest rotting of Kinnow fruits (Sharma et al., 2008a; Gaur, 2009). Compatibility of bioagents with fungicides. Fungicides which are compatible with potential bioagents need to be identified for integration in disease management strategies. The compatibility of potential bioagents with recommended and newly

Journal of Progressive Agriculture, Vol.3, No. 1: April 2012
3
developed fungicides was therefore investigated during the year 2009. Metalaxyl, fosetyl-Al, mancozeb, cymoxanil 8% + mancozeb 64% mixture and copper oxychloride fungicides were found compatible with bioagent T. harzianum (TG-1) and tolerance limits (ED50) of these fungicides were >1000 µg/ml. Metalaxyl proved their compatibility with another potential bioagent T. viride also where even >1000 µg/ml concentration was under safe tolerance limit (ED50). Copper oxychloride, mancozeb, fosetyl-Al and cymoxanil 8% + mancozeb 64% mixture fungicides showed moderate to good compatibility with this bioagent (Gaur and Sharma, 2011). Recommendations provided for Package and Practices Various bio control based recommendations for plant disease management were provided for package and practices of Zone -1b (Sriganganagar and Hanumangarh districts) of Rajasthan during last ten years (2001-2010). Management of plant diseases viz., dry root rot of chickpea and cotton (Rhizoctonia bataticola), Sclerotinia stem rot of mustard (Sclerotinia sclerotiorum) and Phytophthora rot/gummosis (Phytophthora spp.), canker (Xanthomonas axonopodis pv. citri) and fruit dropping and post-harvest fruit decay in Kinnow was recommended through use of locally developed formulations of fungal bioagent Trichoderma (2 x 10⁷ cfu g-1), bacterial bioagent Pseudomonas fluorescens (1 x 10⁹ cfu g-1) or yeast bioagent Sporidiobolus pararoseus (109 cfu ml-1). Kinnow mandarin (Citrus reticulata Blanco.) Phytophthora rot. Integrated disease management studies on Phytophthora rot of Kinnow were carried out from 1999 to 2002 and recommendation was provided for its control. Stem painting with Metalaxyl 8% + Mancozeb 64% (Ridomil - MZ 72% WP) @ 20 g/l of linseed oil in association with soil drenching T. harzianum @ 60 g tree-1 in 30 - 40 lit of water twice in each month of February and August at 15 days interval was recommended for integrated management of Phytophthora rot of Kinnow. Besides eco-friendly this treatment gave higher net monitory return (Gaur et al., 2004). Citrus canker. Studies were conducted (2003-04 to 2005-06) for controlling citrus canker of Kinnow and foliar spray of talc based P. fluorescens @ 0.2 per cent during the month of February and August, twice in each month at 15 days interval was recommended for eco friendly management of canker disease in Kinnow (Gaur and Sharma, 2010). Foot rot/Gummosis (Phytophthora spp.). Field studies were conducted (2004-05 to 2006-07) to find out bio rational paint formulation, alternative to metalaxyl for the control of foot rot disease in kinnow. Stem painting with talc based P. fluorescens or T. harzianum @ 100 g lit-1 water subsequently followed by painting with linseed oil after 5 days at two times each during February and August gave significant
recovery in trunk lesion size of Phytophthora and enhanced fruit yield (Gaur et al., 2011). Pre-harvest dropping and post-harvest rotting of Kinnow fruits. Field and lab studies (2007-08 to 2008-09) were carried out for controlling pre-harvest dropping and post- harvest rotting of Kinnow fruits. Three sprays of locally isolated yeast bioagent, S. pararoseus in association with Gibberellic acid @ 20 ppm during the month of April, August and September and two sprays alone during March and October were recommended for bio effective management of these diseases of Kinnow fruits (Gaur, 2009). Cotton (Gossypium spp.) Dry root rot. Antagonistic behaviour of eighteen different native and exotic isolates of Trichoderma, Gliocladium and Chaetomium species was tested (1997-2002) against root rot (R. bataticola) of cotton under in vitro and in vivo conditions fruits and finally recommendation was provided in 2003 year. Trichoderma viride, Gliocladium virens and T. harzianum proved superior to other antagonists in reducing root rot. Pantnagar isolate of T. harzianum which was under commercial production in IPM lab till 2008 and Chaetomium globosum proved least effective (Gaur and Sharma, 2002a & b). Multilocation field studies conducted on the basis of preliminary green house results revealed that technique of soil application of Trichoderma was found significantly superior over seed treatment in controlling of dry root rot of cotton. Trichoderma @ 10 g kg-1 seed gave better control than the lower dose of 4 g kg-1 seed. Technique of seed dip, solid matrix priming did not prove effective. Conclusively, for effective and economic management of the dry root rot of cotton, seed treatment with T. harzianum @ 10 g kg-1 seed and soil application of T. harzianum @ 10 kg ha-1 pre-incubated in 200 kg of FYM for 10-15 days was recommended (Gaur et al., 2005c). Chickpea (Cicer arietinum) Dry root rot. Multilocational field studies were conducted (1999-2000 to 2002-03) to evolve best application technique of T. harzianum for controlling dry root rot (R. bataticola) of chickpea. Conclusively, for effective and economic management of the dry root rot of chickpea, seed treatment with T. harzianum @ 10 g kg-1 seed and soil application of T. harzianum @ 10 kg ha-1 pre-incubated in 200 kg of FYM for 10-15 days was recommended. Under rain fed situation seed treatment with Trichoderma in association with soil application of Zn So4 @ 25 kg/ha proved effective (Gaur et al., 2005b). Mustard (Brassica juncea) Sclerotinia stem rot. Systematic studies in laboratory, cage house and multilocational field trials were conducted (2002-03 to 2005-06) to find out the best consortium formulation of bioagents for controlling Sclerotinia stem rot (S. sclerotiorum) of Indian mustard. Seed treatment with consortium formulation of T. hamatum (HP-20) and T. viride (Tv-1) in the ratio of 1 : 1 (w/w) @ 10 g kg-1 of seed followed by foliar

Journal of Progressive Agriculture, Vol.3, No. 1: April 2012
4
spray of same bioagent combination @ 0.2 per cent at 50 DAS was recommended for effective management of disease (Gaur et al., 2010). Production of bio agents This centre has developed three talc based bioagent formulations of Trichoderma {Trichoderma SD (Th-8), Trichoderma SD (TG-1), Trichoderma Mixture} for commercial use against soil borne diseases prevalent in the area. Trichoderma SD (Th-8/TG-1). Production of this talc based formulation (2 x 10⁷ cfu g-1) of T. harzianum (Th-8) was under taken in 1995 in IPM bioagent production unit setup at this centre under the funding of DBT, Bangalore. During 1998, the commercial production of T. harzianum (Th-8) in bioagent production lab was substituted with local strain (TG-1) of T. harzianum. This formulation of bioagent is recommended for the control of root rot of cotton, gram, Phytophthora rot of kinnow and other soil borne diseases. During the year of 1995 when the production unit was established, the production of this bioagent was only 16 Kg. However in subsequent years, yearly production increased substantially reaching 873 kg in 2009 year. During the period between 1995 and 2009 this unit has produced a total of 8307 kg of Trichoderma SD (Fig. 1). Trichoderma Mixture. This talc based formulation (2 x 10⁷ cfu g-1) of two different strains of Trichoderma evolved during 2006 against Sclerotinia stem rot of mustard (Gaur and Sharma 2006). In this formulation, exotic strain of T. viride-1 (Tv-1) from Coimbatore and native strain of T. hamatum (HP-20) is used in the ratio of 1 : 1. A total of 1548 kg Trichoderma Mixture has been produced at this centre between 2007 and 2009 year (Fig. 1). Hence since establishment of bioagents production unit, a total of 9855 kg of Trichoderma formulations
has been produced for commercial sale to the cultivators and different Govt. and semi Govt. agencies. Income generation through technology developement The use of Trichoderma for the control of soil born diseases (dry root rot of chickpea and cotton, Sclerotinia stem rot of mustard, Phytophthora rot of Kinnow), a technology developed at the center and
recommended for this zone (zone-1b) after duly approval by research and extension wing of university and state, has given substantial source of income generation through direct commercial sale of Trichoderma to the cultivators and other Govt. and semi Govt. agencies by IPM production unit. The total income through sale of this product was only Rs. 960=00 when the production unit was established in 1995. However this income reached to the level of Rs. 1,10,760=00 (Rupees One lac ten thousand seven hundred sixty) during the period of 2009. Since the establishment of bio agent production unit, this center has already earned approximately Rs. 11,69,340 = 00 (Rupees Eleven lac sixty nine thousand three hundred forty only) during the period between 1995 and 2009 (Fig. 2). Popularization and impact of technology Bioagent use technology for the control of soil borne disease was transferred to cultivators systematically through front line, field and IPM based demonstration. Initially during 1996-98 technology was popularized through large scale (30-32 ha) IPM based demonstrations on cotton and chickpea and the bioagent was distributed among the farmers as a free incentive. Since establishment of bioagents production unit, a total of 9855 kg of Trichoderma formulations has been produced for commercial sale to the cultivators and different Govt. and semi Govt. agencies. This successful transfer of bioagent technology has led to generate interest of State (Rajasthan) Agricultural Department in establishing mini bioagent production unit in this zone. A growing number of private companies have now entered in market to meet out the growing demand of these bioagents. The commercial sale through these alternate sources in the zone between 2007-08 to 2009-10 was approximately 87 metric tonnes (Fig. 5). Area covered under the technology by research centre. Bioagents based technology developed at this centre has been accepted by the cultivators of this zone comprising Sriganganagar and Hanumangarh district of the Rajasthan. The response was quite encouraging. During the initial year of 1995-96, an approximate area of only 200 hectare was covered under this technology. However, after 15 year of journey on eco-friendly road approximately 13,633 ha area has been covered under this technology through commercial sale of bioagents by this centre (Fig. 3). This total covered area was shared by the prevailing crops like, Kinnow, cotton, chickpea and mustard as 249, 9085, 2423 and 1876 ha respectively (Fig. 4). Area covered under the technology by Govt. & Private agencies. Beside research centre, an area of about 1,23,142 ha has also been covered through commercial sale by Govt. and private agencies (Fig. 6). Out of this area, 2611, 95156 and 25375 ha was under the crop of Kinnow, cotton and chickpea accordingly. This clearly indicates impact of technology generated by this centre.

Journal of Progressive Agriculture, Vol.3, No. 1: April 2012
5
This successful transfer of bioagent technology has contributed significantly in managing soil borne diseases of the area and improving soil health.
Acknowledgement Authors are grateful to the Director Research, S. K. Rajasthan Agricultural University, Bikaner and Director, DBT, Govt. of India, Bangalore for providing fund and facilities during the development, production and popularization of biocontrol technology.
01000
2000
3000
4000
50006000
7000
8000
9000
199 5 1996 1997 1998 1999 2000 2001 200 2 2003 2004 2005 2006 2007 2008 2009
Production (Kg)
Year
F ig . 1 . C o m m ercia l p ro d u ctio n o f b ioa g en ts a t A g ricu ltu ral Resea rch S ta tio n (S K R A U ), S riga n g a n a g ar (R a ja sth a n )
Trich o d erm a SD Yea rly Trich o d erm a SD C u m u la tiveTrich o d erm a M ix tu re Y ea rly Trich o d erm a M ix tu re C u m u la tiv e
0
2 0 0 0 0 0
4 0 0 0 0 0
6 0 0 0 0 0
8 0 0 0 0 0
1 0 0 0 0 0 0
1 2 0 0 0 0 0
1 4 0 0 0 0 0
1 9 9 5 1 9 9 6 1 9 9 7 1 9 9 8 1 9 9 9 2 0 0 0 2 0 0 1 2 0 0 2 2 0 0 3 2 0 0 4 2 0 0 5 2 0 0 6 2 0 0 7 2 0 0 8 2 0 0 9
Income (Rs.)
Y e a r
F ig . 2 . I n c o m e g e n e r a t i o n th r o u g h b io c o n t r o l t e c h n o lo g y d e v e lo p e d a t R e s e a r c h C e n t r e o f S r ig a n g a n a g a r ( R a j a s th a n )
Y e a r ly C u m u la t iv e
0
2 0 0 0
4 0 0 0
6 0 0 0
8 0 0 0
1 0 0 0 0
1 2 0 0 0
1 4 0 0 0
1 6 0 0 0
1 9 9 5 1 9 9 6 1 9 9 7 1 9 9 8 1 9 9 9 2 0 0 0 2 0 0 1 2 0 0 2 2 0 0 3 2 0 0 4 2 0 0 5 2 0 0 6 2 0 0 7 2 0 0 8 2 0 0 9
Area (ha)
Y e a r
F i g . 3 . A r e a c o v e r e d u n d e r b i o c o n t r o l t e c h n o l o g y d e v e l o p e d a t R e s e a r c h C e n t r e o f S r i g a n g a n a g a r ( R a j a s t h a n )
Y e a r ly a r e a c o v e r e d ( h a ) C u m u la t iv e a r e a c o v e r e d ( h a )

Journal of Progressive Agriculture, Vol.3, No. 1: April 2012
6
2 6 . 2 1 2 8 .8 4 3 1 . 9 62 6 . 2 1
5 5 . 0 5
8 7 . 0 1
01 02 03 04 05 06 07 08 09 0
1 0 0
2 0 0 7 - 0 8 2 0 0 8 - 0 9 2 0 0 9 - 1 0
Sale (Tonnes)
Y e a r
F i g . 5 . C o m m e r c i a l s a l e o f T r i c h o d e r m a b y p r i v a t e & g o v t . a g e n c i e s i n Z o n e 1 b o f R a j a s t h a n
Y e a r ly C u m u la t iv e
0 . 0 0
2 0 0 0 0 . 0 0
4 0 0 0 0 . 0 0
6 0 0 0 0 . 0 0
8 0 0 0 0 . 0 0
1 0 0 0 0 0 . 0 0
1 2 0 0 0 0 . 0 0
1 4 0 0 0 0 . 0 0
2 0 0 7 - 0 8 2 0 0 8 - 0 9 2 0 0 9 - 1 0
Area (ha)
Y e a r
F i g . 6 . A r e a c o v e r e d u n d e r b i o c o n t r o l t e c h n o l o g y t h r o u g h p r i v a t e & g o v t . a g e n c i e s i n z o n e 1 b o f R a j a s t h a n
Y e a r l y a r e a c o v e r e d ( h a ) C u m u l a t i v e a r e a c o v e r e d ( h a )
2 4 9 . 2 0
9 0 8 5 . 2 4
2 4 2 2 . 7 31 8 7 6 . 3 7
01 0 0 02 0 0 03 0 0 04 0 0 05 0 0 06 0 0 07 0 0 08 0 0 09 0 0 0
1 0 0 0 0
K i n n o w C o t t o n C h i c k p e a M u s t a r d
Area (ha)
C r o p s
F i g . 4 . A r e a c o v e r e d t h r o u g h b i o c o n t r o l t e c h n o l o g y u n d e r d i f f e r e n t c r o p s b y R e s e a r c h C e n t r e o f S r i g a n g a n a g a r ( R a j a s t h a n )
A r e a c o v e r e d ( h a )

Journal of Progressive Agriculture, Vol.3, No. 1: April 2012
7
REFERENCES
Gangopadhyay, S. and Joshi, R.K. 1997. Efficacy of Trichoderma in controlling root-rot of cotton and chickpea. Indian Phytopathology, Golden Jubilee Proceeding, pp. 325-326.
Gaur, R.B. 2004. Develop IPM package for the arid-agri-silvi-horti-pastoral system. Final Progress Report (Sept. 2000 – Nov. 2004) under NATP Sub Project submitted to CAZRI (ICAR). pp. 1-172.
Gaur, R.B., Kaul, M.K., Sharma, R.N. and Sharma, R.R. 2004. Integrated disease management of Phytophthora rot of Kinnow. Journal of Mycology and Plant Pathology 34: 465-469.
Gaur, R.B. and Sharma, R.N. 1999. Efficacy of different strains of Trichoderma sp. in vitro and in vivo against Rhizoctonia bataticola, causal organism of root rot of chickpea. Seasonal Summary, Rabi 1998-99, Irrigated North Western Plain Zone–1b, Agric. Res. Station (SKRAU), Sriganganagar (Rajasthan), 9 p.
Gaur, R.B. and Sharma, R.N. 2002a. Efficacy of mycoparasite for Rhizoctonia root rot in cotton. Indian Phytopathology 55: 368 (Abstr.).
Gaur, R.B. and Sharma, R.N. 2002b. Studies on antagonism of Trichoderma, Gliocladium and Cheatomium species against Rhizoctonia bataticola of cotton. Indian Phytopathology 55: 372 (Abstr.).
Gaur, R.B. and Sharma, R.N. 2011. Biocontrol of root rot in cotton and compatibility of potential bioagents with fungicides. Indian Journal of Plant Protection 38 (2): 176.182.
Gaur, R. B. and Sharma, R. N. 2006. Biocontrol of Sclerotinia sclerotiorum causing stem rot of mustard. Seasonal summary Rabi 2005-06, Irrigated North Western Plain Zone–1b, Agric. Res. Station, Sriganganagar. pp: 12-13.
Gaur, R.B. and Sharma, R.N. 2010. Prevalence of canker in Kinnow (Citrus deliciosa Ten.) and its management. Indian Phytopathology 63: 345-347.
Gaur, R.B., Sharma, R.N., Gautam, V.S. and Dangi, R.P. 2010. Management of Sclerotinia rot of mustard through bioagents. Indian Phytopathology 63 (4). (Accepted).
Gaur, R.B., Sharma, R.N. and Kaul, M. K. 2011. Foot rot incidence in Kinnow (Citrus deliciosa) orchards and its management through biorational paint formulations. Indian Journal of Horticulture 68. (Accepted).
Gaur, R.B. 2009. Studies on physiological and pathological induced fruit dropping, post-harvest fruit decay and biochemical changes in kinnow fruits (Citrus deliciosa Ten.) in relation to pre- harvest spray scheduling. Final report of the Project submitted under National Horticulture Mission, Govt. of Rajsthan, Jaipur. pp. 1-73.
Gaur, R.B., Sharma, R.N. and Sharma, R.R. 2005a. Shelf-life of talc-based formulation of Trichoderma and soil application for biological control of dry root rot of chickpea. Journal of Mycology and Plant Pathology 35: 380-384.
Gaur, R.B., Sharma, R.N., Sharma, R.R. and Gautam, V.S. 2005b. Efficacy of Trichoderma for Rhizoctonia root rot control in chickpea. Journal of Mycology and Plant Pathology 35: 144-150.
Gaur, R.B., Sharma, R.N. and Singh, V. 2005c. Manipulations in the mycoparasite application techniques against Rhizoctonia root rot of cotton. Indian Phytopathology 58: 402-409.
Sharma, R.N., Maharshi, R.P. and Gaur, R.B. 2008a. Biocontrol of core rot in kinnow fruits with bioagents including an unrecorded genus of yeast (Sporidiobolus pararoseus). Journal of Mycology and Plant Pathology 38: 211-215.
Sharma, R.N., Maharshi, R.P. and Gaur, R.B. 2008b. Sporidiobolus pararoseus Fell & Tallman – an antagonistic yeast with biocontrol potential. Current Science 95: 1003-1004.

Journal of Progressive Agriculture, Vol.3, No. 1: April 2012
8
Assessment of local perceptions on climate change and coping strategies in Chotanagpur Plateau of Eastern India
JAIPAL S. CHOUDHARY, GOPAL SHUKLA, C.S. PRABHAKAR, SUDARSHAN MAURYA,
BIKASH DAS AND SHIVENDRA KUMAR ICAR, Research Complex for Eastern Region, Research Centre, Ranchi, Jharkhand (India) - 834010
e-mail: [email protected]; [email protected]
ABSTRACT
In the era of climate change, the Chotanagpur plateau is facing extreme climate change related events and its possible impact on ecosystem, livelihood, agriculture, livestock and biodiversity. The scientific community of region yet to start examining the views of farming communities on climate change and its possible impact in Chotanagpur plateau. Keeping this view’s the present study as attempted to understand the present perception’s of farmers about the climate change and also try to assess the indigenous knowledge to handle the impact of climate change. The perception of 355 respondents were examined through focus group discussion and recorded the opinion on climate change and its impact on ecosystem, agriculture, livelihood, livestock, biodiversity and well beings of human. Results of the study showed that farming communities of the Chotanagpur plateau have meager knowledge about the climate related change and its possible impact. It was also recorded that the farming communities of Chotanagpur plateau have indigenous knowledge to handle possible impact of climate change.
Key words: Chotanagpur plateau, Climate change, Indigenous knowledge, Farmers perception Climate is continually changing and with projected changes in rainfall patterns and temperature range are expected to affect many biological systems including agriculture. Climate related events such as droughts, cyclones, hailstorm, snowfall, erratic rainfall and fluctuations in temperature badly contributing to world food production and overall economy (IPCC 2007; Shukla et al. 2002; Dhaka et al. 2010). Farming communities are especially sensitive and vulnerable to adverse climate conditions, due to their strong dependence on agricultural production for their livelihood (Campbell 1999). The Chotanagpur plateau is a known for highly diversified region of India. It has been formed by continental uplift during the Cretaceous to embark on a 50-million-year journey was violently interrupted by the northern Eurasian continent (Anon 2010a). The region receives an annual average rainfall of around 1400 mm, which is less than the rain forested areas of India and more than 80 % (about 2, 287, 260 ha) of the arable land are rainfed (Dey and Sarkar 2011). The rainfall trend of last 10 years exhibited decreasing pattern. Drought is a recurrent phenomenon in Jharkhand and it affects the livelihoods of the majority of its people, particularly tribes and rural peoples living in this area. In today’s context of population explosion coupled with pollution, environmental degradation and climate change, the main concern is increased concentration of CO2 in the atmosphere and health of the global environment are topics of intense scientific, social and political concern (Shukla 2010). Although the pace of climate change in the Chotanagpur plateau may be fast and its impacts on nature and people are severe, the scientific community has been slow to examine the extent and consequences
of climate change. Researches on climate change in this region are meager and have received scarce attention by scientific community and policy makers. Meanwhile, public perception on climate change plays an increasingly important role in shaping environmental policy and management response systems (Brody et al. 2008). Farming communities have been coping with environmental change since the time immemorial. Thus they often have large knowledge about environmental change and means to cope with its consequences (Salick and Byg 2009; Byg and Salick 2009). Such knowledge can boost scientific inquiry and at the same time help design mitigation and adaptation measures to deal with climate change. Thus documentation of local knowledge about climate change adaptation is gaining popularity (Martello 2008; King et al. 2008). \Adaptation to climatic changes requires a combination of various individual responses at the farmer’s level and assumes that farmers have access to alternative practices and technologies available in their area (Charles and Rashid 2007). Adaptation of people to different hazards vary from household to households and region to region based on existing support system to increase the resilience of affected individuals. In the Chotanagpur plateau, no studied has been previously carried out about traditional knowledge concerning the impact of climate change on agriculture, livestock, livelihood and biodiversity even though the region is rich in biodiversity and traditional knowledge systems held by various ethnic groups. The present, assessment was aimed to generate primary information on perceptions of farming community of the Chotanagpur plateau about climate change. Here we illustrate local/indigenous knowledge about changes in climate
Journal of Progressive Agriculture, Vol.3, No. 1: April 2012
9
and probable impact of such changes on ecosystems, biodiversity, agriculture and livelihoods among local communities of the Chotanagpur plateau using focus group discussion. More specifically, this research tries to develop better understanding about what local farmers’ believed about climate change and would assist policy makers to decrease the vulnerability of farming communities to adverse impacts of climate change.
MATERIALS AND METHODS
Study area The present study conducted on Chotanagpur plateau under National Initiative on Climate Resilient Agriculture (NICRA) project of Indian Council of Agricultural Research (ICAR), New Delhi. This area is situated 23° 45' N latitude and 85° 30' E longitude at an elevation of 700 m. Its mean minimum and maximum temperature varies between 10o C and 37o C, respectively. This area is highly depended on rainfed agriculture. The area also characterized by erratic rainfall from last few years (Anon 2010b). The main rain occurs from June to September and sometimes it starts in May and stops in October and the wettest month is July/August.
Selection of respondents Selections of respondents were done based on Simple Random Techniques across the whole region of Chotanagpur plateau. In this way, 355 respondents were sampled from population of the Chotanagpur plateau and views of respondents towards the climate change were recorded. The data were collected from each respondent through Focus Group Discussion (FGD) with the help of pre-tested questionnaire.
Focus group discussion (FGD) Focus Group Discussion (FGD) were employed to generate information on the perception of the farmers on climate change, its related hazards and existing coping strategies according to Kumar, 1987. Twenty-one FGDs, each consisting 17 participants from different blocks, were held for climate related hazard identification, characterization, and prioritization of coping mechanisms. Tools such as hazard identification and characterization, hazard behavior story telling (time line), hazard ranking matrix and experiential stories telling on indigenous technologies and knowledge was used to acquire information on farmers’ perception on climate change trends, existing hazards and their severity on the community. The different coping strategies used by the community were also identified and analyzed for their effectiveness based on their satisfactory level, which is converted into percent for further assessment.
Data management and analysis Information was recorded using worksheets prepared for each category of discussion. Data collected on each parameter was expressed as percent of respondents.
Farmers’ perceptions on changes in long-term temperature and precipitation as well as various coping strategies used by farmers were analyzed and presented using simple descriptive statistics with standard error.
RESULTS AND DISCUSSION
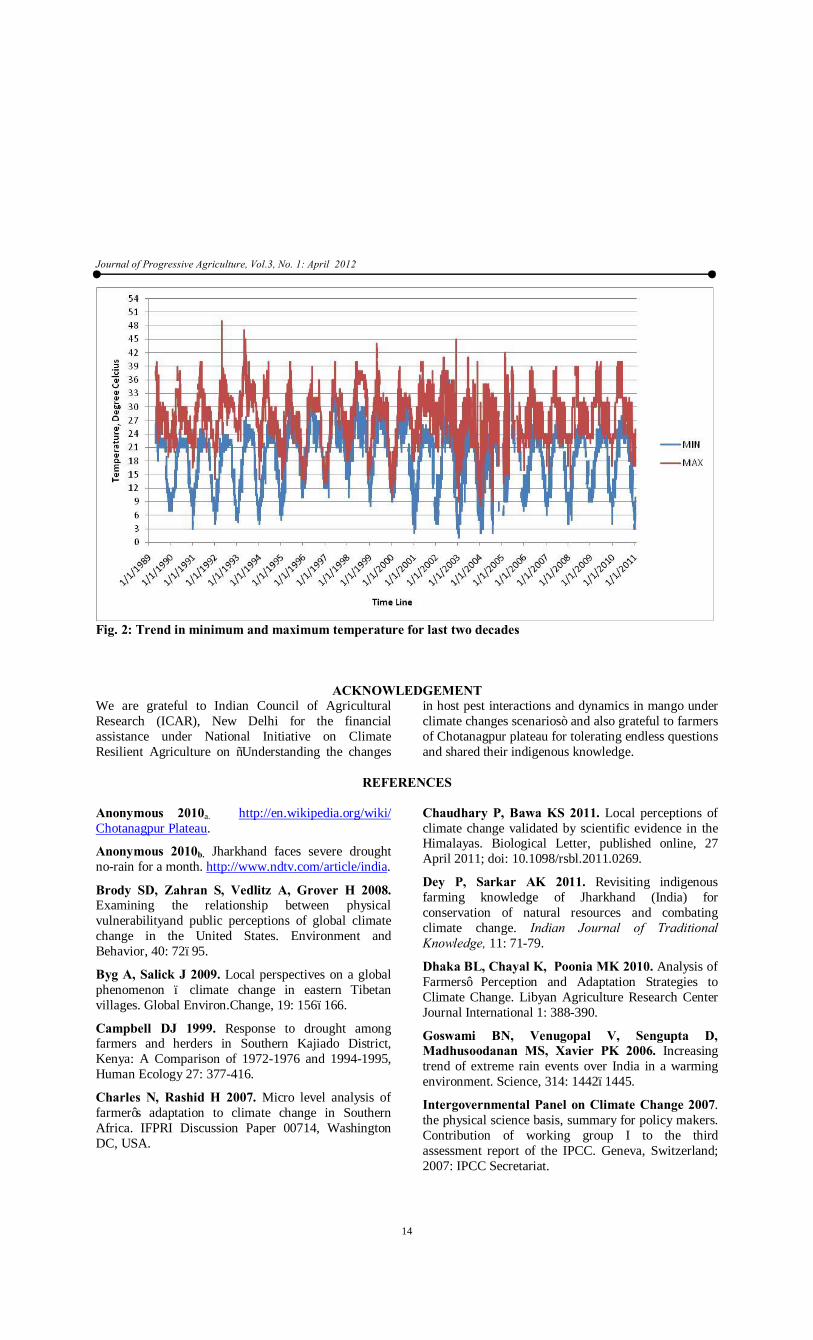
Farmer’s perception about climate change Perception of farmer’s community about weather relater parameters like temperature, rainfall and drought along with the rainfall pattern is predictable. Data on farmer’s responses regarding late onset of monsoon, early withdrawal of monsoon, uneven distribution of rainfall, changing seasons and long dry spell presented in table 1. About 61.29 % local farmers have agreed that temperature is increasing followed by 32.26 % farmers were don’t know anything about temperature rise whereas only 6.45 % farmer’s perception was opposite to the trends of rise in temperature. Around three fourth of respondents have the idea about temperature changes. Almost, similar trends were recorded about changing rainfall pattern. Most of farmers have little bit knowledge about uneven distribution of rainfall. Similar trends were again observed about the long dry spell. Most of the farmers agreed about the changing of season. Dhaka et al. (2010) carried out a similar study and reported from Bundi District of Rajasthan that majority of the farmers agreed that the temperature increased and precipitation decreased. Similar to our study Chaudhary et al. (2011) also reported that the 84.4% of the people believe that the weather is getting warmer and nearly 78.6% believe that onset of summer and monsoon has advanced during the last 10 years. Studies from different parts of the country also indicate temperature rise, shift in seasons, reduced severity of cold during winter and changes in the number of cloudy days; changes in timing, magnitude, and intensity of both rainfall and snowfall (Joshi and Joshi 2011; Byg and Salick 2009; Salick and Byg 2009; Xu et al. 2009; Vedwan and Rhoades 2008; Goswami et al. 2006). Last two decades temperature data received from the metrological station is (Fig. 1) revealed that this region has encountered frequent temperature extremities leading to early maturity of crops and fruits, reduction of water table, mortality of young mango plant due to unknown disease and pests.
Perception of farmer’s about climate related hazards Perception of farmer’s about climate related hazards on ecosystem function and process included incidents of drought, hail storm, wind pattern is getting warmer, wind storm getting stronger, water source and soil erosion has been presented in table 2. Climate related hazards, soil erosion including the level of soil fertility status ranked 1st with 52.90 % respondents fallowed by wind pattern and wind storm with 50.97 and 50.32 % respectively whereas 32.90 % farmer’s identified

Journal of Progressive Agriculture, Vol.3, No. 1: April 2012
10
water source related problem. However 37.42 % expressed that incident of drought is the major problem and 38.71 % advocated that the hail storm was the main concern. This is again justifying the increasing trends of mean temperature and rainfall which are directly or indirectly related to climate change (table 1). Similar finding were reported by authors like Chaudhary et al. (2011) and Dhaka et al (2010).
Climate change related effect on agriculture and livelihood Impact of climate change on agriculture and livelihood included Soil fertility status, early flowering and fruiting, changes of fruit/crop ripening, status of crop production, new insect pest and diseases incidence and changing of cropping pattern (table 3). Finding related to impact of climate change on agriculture and livelihood indicated that about 40 % farmers were having the knowledge on the early flowering and fruiting along with the status of production. Similar trends were recorded as 31.02 % farmers know about the changing of cropping pattern. Above 50 % farmers are in the opinion that crops mature early, however 14.19 % had negative response regarding the crops maturity. This may be attributed to the fact that increasing temperature is responsible for the early maturity of crops. Around 40 % farmers agreed that the new species of weed, insects and disease were observed in the field, but they could not identify these. These data of low perception may be due lack of knowledge, backwardness as well as lack of extension facility and awareness program. Soil fertility is the most important parts of the agriculture production, but only 36.13 % farmers have the opinion that the fertility of soil decreases. This may be due that the majority of farmers don’t have any knowledge about the status of soil fertility. A similar study was conducted by Chaudhary et al. (2011) and observed that the 56.8% of the people experienced early ripening or maturity of their crops and vegetables. The authors also reported that majority of the individuals 73.6% and 54.2%, respectively have seen new crop pests and new weeds in their fields. Impact of climate change on livestock and fish included different parameters like behavioral changes in livestock, change in fish species in rivers, incident of mosquito, occurrence of disease and change of milk production graphically presented in table 4. Near about 50% (i.e. 50.32 %) farmers viewed that the incidents of mosquito is increasing whereas 39.35 % don’t know whether the incidents of mosquito increased or decreased. Due to lack of scientific knowledge about the behavioral pattern of livestock and fish species identification it was evidence from the table 3 that majority of farmers don’t know the changing trends. Similar response was recorded for change in milk production. However, 48.39 % farmers had opinion that the occurrence of disease increased, but due to
lack of health facility at village level they don’t know the name of disease and their occurrences.
Climate change related effect on biodiversity in forest areas Perception of farmers about impact of climate change on early flowering, early budburst, shift in range of species, early singing of birds and deforestation has been depicted in table 5. 43.87 % farmers had positive view about the early flowering and 8.39 % farmers showed negative response about the early flowering. Due to lack of technical knowledge and experience about the shift in range of species and budburst more than 50 % don’t have any knowledge about the impact of climate change. Similar trends about the early singing of birds were also recorded. Deforestation is the important part of rising of temperature, but in the Chotanagpur plateau villagers totally depend upon forest for fuel wood collection. Due to this villager have biased response about the deforestation as 46.45 % don’t agreed weather the deforestation increased or decreased. However, 37.42 % farmers are concerned that the deforestation increased and 16.13% did not agree upon increasing the deforestation. In India, Hindi months are also indicators of weather forecasting and closely associated with agricultural activity in the rural areas. During the group discussion, different types of story was observed like sound of Koyal is the indicator for mango repining where as sound of frog is the indicator for rainy season. According to these indicator farmers started different agricultural activity like nursery preparation for Cole crops and paddy. Some of local festivals are also associated weather forecasting like Sarhul puja is celebrated in the month of Magh is indicator for spring arrivals and Karma puja is also very common climate indicator in Eastern Plateau and Hill region (Table 6).
Existing, coping and adaptation strategies to climate change Knowledge posses within the farmer’s community since the time immemorial showing it-self capable of responding to changing influences and of implementing adaptations and innovations as circumstance. Various scientific reports showed that there are a various actions that individual farmers can implement, some of which are specific to exacting enterprises or land and resources type and other have more general application (Charles and Rashid 2007; Loe et al. 2001; Maddison 2006). Unique knowledge is available within the farmer’s community in the region and farmer’s community used this knowledge to combat the impact of climate change on livelihood, agriculture, livestock and biodiversity (table. 6). More than 50 % farmers used different type (straw, leaf of plant, herbaceous plant and polythene) of mulching for conserving the soil moisture and help to control the soil temperature and after the decomposition of mulch, material improved the soil fertility. Whereas, 54.84 % farmers adopted traditional agroforestry system for
Journal of Progressive Agriculture, Vol.3, No. 1: April 2012
11
controlling the microclimate of the field, temperature during the summer season and diversify the cropping system. Rain water harvesting and soil conservation techniques were also used by the farmers to avoid the scarcity of water during the summer and control soil erosion with the help of locally available mulching material. For controlling the insect, pest and diseases about 50.32 % farmers used locally available material and technique like cow urine with water for controlling insect and disease also farmers prefer to use wood ash for controlling aphid in Cole crops and mustered during winter season. Most of the farmers were not aware about the scientific approaches to combat impact of climate change as evidenced in the data on the crop rotation, change in the time of farm operation, integrated farming, zero tillage, short duration crop varieties, drought tolerant crop and crop varieties, use of organic & inorganic products to control disease, insects & pests and innovative approaches to improve yield, control insect pest and diseases (table.1). The above finding confirmed that the extension system in Chotanagpur plateau is fragile and don’t have proper coordination between the scientists, extension functionary and farmers. This may be due to backwardness and lack of training program and awareness about the adoptive measure to combat impact of climate change in region. This invaluable information from local rural communities, acquired through generations of experience of working on the land, will also support policy makers and stakeholders in identifying adaptation and mitigation options.
CONCLUSION AND POLICY SUGGESTION
The farming communities of the region have noticed that their area is getting warmer, drier, increase in soil erosion and shift in the time of rains. Observed trends of climate support this perception. Hail storm, soil erosion and drought and water availability and changing wind pattern are among the major hazards
related to climate change. It was concluded from the present study that the climate change in the region, evidenced from the previous temperature record (Fig. 2). However, farmers are not aware of the phenomena of climate change on livelihood, agriculture, livestock and biodiversity due to lack of awareness programme and lack of coordination between scientific community and extension agency in the region. Moreover farmer’s community of the region used very innovative indigenous knowledge including various type of mulching, soil and water conservation technique along with tree based farming system to combat the impact of climate change. Due to erratic rainfall farmers are hesitated to adopt diversified farming system, however diversified farming is the best option to combat climate related hazards. Farmers also need to adjust their management practices to ensure that they make efficient use of the limited rainfall for better food production. Availability of climate information is prerequisite for mitigating the adverse effect of climate variability and capitalizing on beneficial effect, especially in the region where the agriculture and livelihood totally depend upon natural resources. Try to ensure that the farmers understand the information and can modify their agricultural activity. Addressing these issues to improve farmer’s knowledge and perception on climate related change and improve their understanding to manage their crops, livestock, fish and other resources during warmers and drier condition. It will be helpful to increase and sustain their productivity even under climate change scenario. Example of such policy measures include developing drought resistant crops, conducting awareness program and promoting farm level adaptation measures such as the use of irrigation technologies and adjusting planting dates. Such type of policy is utmost important for developing countries like India.
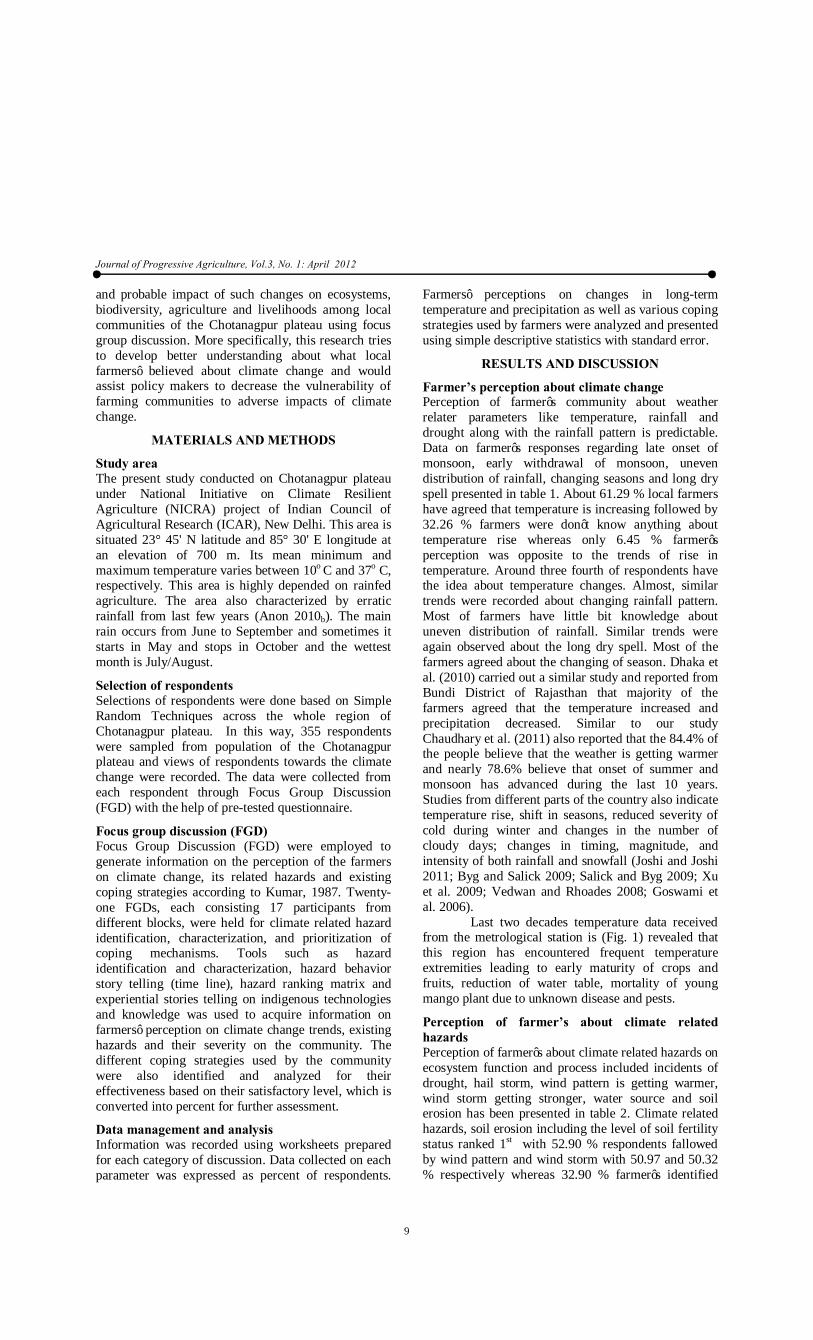
Table 1. Perception of farmers about climate change (N=355)
Parameters Yes (in per cent) No (%) Don’t No (%) Increasing of temperature 61.29 6.45 32.26 Rainfall pattern unpredictable 54.84 13.55 31.61
Late onset of monsoon 52.26 20.00 25.16 Early withdrawal of monsoon 49.68 16.77 33.55 Uneven distribution of rainfall 43.23 13.55 43.23 Seasons are changing 52.90 5.81 41.29 Long dry spell 57.42 18.71 29.03
Journal of Progressive Agriculture, Vol.3, No. 1: April 2012
12
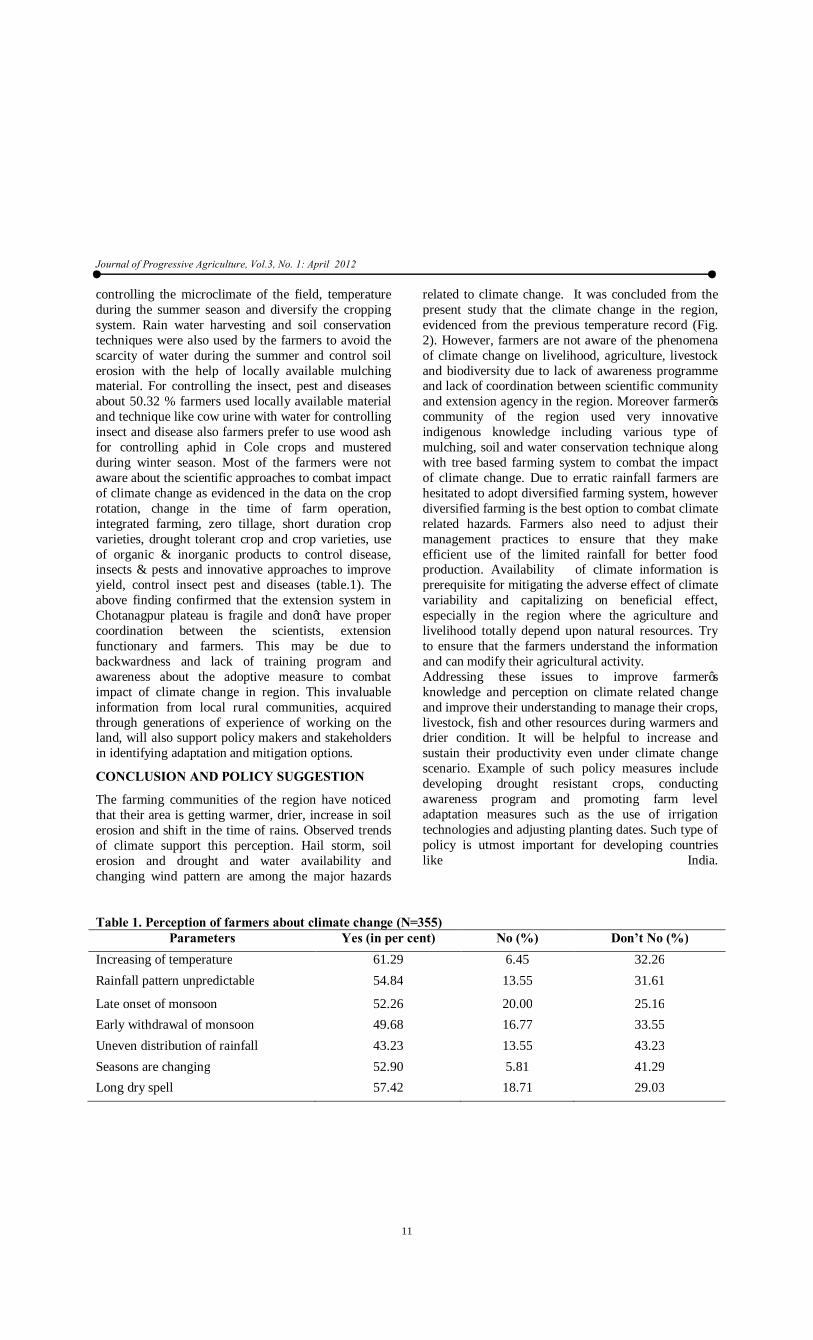
Table 2. Impact of climate change on ecosystem function and process(N=355) Parameters Yes (%) No (%) Don’t No (%)
Incidents of drought is increasing 37.42 23.23 39.35
Hail storm occur beyond autumn and spring season
38.71 25.16 36.13
Wind pattern is getting warmer 50.97 15.48 33.55
Wind storm getting stronger 50.32 32.90 16.77
Water source and availability increasing 30.32 32.90 36.77
Soil erosion 52.90 7.10 40.00
Table 3: Impact of climate change on agriculture and livelihood(N=355)
Parameters Yes (%) No (%) Don’t No (%) Soil fertility decreases 36.13 16.13 47.74 Early flowering and fruiting 43.87 16.13 60.00 Fruit/crop ripening 40.00 9.03 43.23 Early crop maturity 50.32 14.19 35.48 New insect observed 44.52 9.68 45.81 New disease observed 45.81 6.45 47.74 New weed observed 40.00 14.84 45.16 Change of cropping pattern 32.26 10.97 56.77 Impact on yield 32.90 6.45 60.65 Table 4. Impact of climate change on livestock and fish (N=355)
Parameters Yes (%) No (%) Don’t No (%) Behavioural changes in livestock 38.06 12.90 49.03 Change in Fish species in rivers 38.71 9.68 51.61 Change of milk production 38.70 9.03 52.26 Occurrence of disease 48.39 9.03 42.58 Incident of mosquito 50.32 10.32 39.35 Table5. Impact of climate change on biodiversity (N=355)
Parameters Yes (%) No (%) Don’t No (%) Early flowering 43.87 8.39 47.74 Early budburst 39.35 9.03 51.61 Shift in range of species 40.65 8.39 50.97 Early singing of birds 29.68 18.06 52.26 Deforestation 37.42 16.13 46.45

Journal of Progressive Agriculture, Vol.3, No. 1: April 2012
13
Table 6: Traditional weather indicators Month Description
Local Term Approximate Period Condition (Ideal) Condition (Present) Magh Jan 15 ‐ Feb 15 Cold with occasional fog, very less rain, celebration of Sarhul puja, leaves fall from
trees is the indication of spring season. Falgun Feb 15 ‐ Mar 15 Les cold (wheat harvest start), flowering in Sal (Shorea robusta) plant, full boom of
spring starts Chaitra Mar 15 ‐ Apr 15 Spring with pleasant atmosphere, later half little warm Dry and warm (wheat harvest
complete) Baishakh Apr 15 ‐ May15
First half dry, second half hot dry and very hot, stormy weather
Jeth May 15 ‐ Jun 15 Hot Very, hot and dry, loo, stormy loo, sound of koyal is the indication of mango repining start.
Aashadh Jun 15 ‐ Jul 15 mango harvesting complete is the indication for staring paddy sown, Onset of monsoon, rain, dry, delayed monsoon (paddy sown), sowing of Cole crops seed in nursery
Savan Jul 15 ‐ Aug 15 Sound of frog is the indication of rain season, rain Very humid, less rain (late paddy sown in first half), transplanting of Cole crops in main field
Bhadaun Aug 15 ‐ Sep 15
Total rainy days, celebration of karma puja, humid, early harvesting of Cole crops.
Kwar Sep 15 ‐ Oct 15 Paddy harvest is the indicator for winter arrivals, potato sowing, field preparation for wheat sowing.
Kartik Oct 15 ‐ Nov 15 Mostly clear weather, wheat sown and mustard sowing, celebration of chatah puja, Agahan Nov 15 ‐ Dec 15 full boom of winter, potato harvesting Paush Dec 15 ‐ Jan 15 First half cold, second half very cold with fog, celebration of Makar Sankrati Table 7: Coping and adoptive strategies measures adopted by the farmers to combat climate change (N=355)
Adopted Measures Yes (%) No (%) Don’t know (%) Pre-monsoon dry seeding 45.8 7.74 46.45 Agroforestry 36.77 8.39 54.84 Crop rotations 46.45 5.81 54.19 Change in time of farm operation 42.58 6.45 50.97 Integrated farming 35.48 7.74 56.77 Inter cropping 40.00 7.10 52.90 Mulching 30.97 12.90 56.13 Rain water harvesting 38.06 10.32 51.61 Zero tillage to conserve soil, moisture & save time 28.39 11.61 60.00 Use of short duration crop varieties 45.81 3.23 50.97 Drought tolerant crop and crop varieties 36.13 11.61 52.26 Soil conservation techniques 38.71 7.10 54.19 Use of water conservation techniques 37.42 12.26 50.32 ITK knowledge to control disease, insects & pests 40.00 9.68 50.32 Use of organic & inorganic products to control disease, insects & pests
42.58 8.39 49.03 Innovative approaches to improve yield, control disease, insects & pests
39.35 7.74 52.90
Journal of Progressive Agriculture, Vol.3, No. 1: April 2012
14
Fig. 2: Trend in minimum and maximum temperature for last two decades
ACKNOWLEDGEMENT We are grateful to Indian Council of Agricultural Research (ICAR), New Delhi for the financial assistance under National Initiative on Climate Resilient Agriculture on “Understanding the changes
in host pest interactions and dynamics in mango under climate changes scenarios” and also grateful to farmers of Chotanagpur plateau for tolerating endless questions and shared their indigenous knowledge.
REFERENCES
Anonymous 2010a. http://en.wikipedia.org/wiki/ Chotanagpur Plateau. Anonymous 2010b. Jharkhand faces severe drought no-rain for a month. http://www.ndtv.com/article/india.
Brody SD, Zahran S, Vedlitz A, Grover H 2008. Examining the relationship between physical vulnerabilityand public perceptions of global climate change in the United States. Environment and Behavior, 40: 72–95.
Byg A, Salick J 2009. Local perspectives on a global phenomenon – climate change in eastern Tibetan villages. Global Environ.Change, 19: 156–166.
Campbell DJ 1999. Response to drought among farmers and herders in Southern Kajiado District, Kenya: A Comparison of 1972-1976 and 1994-1995, Human Ecology 27: 377-416.
Charles N, Rashid H 2007. Micro level analysis of farmer’s adaptation to climate change in Southern Africa. IFPRI Discussion Paper 00714, Washington DC, USA.
Chaudhary P, Bawa KS 2011. Local perceptions of climate change validated by scientific evidence in the Himalayas. Biological Letter, published online, 27 April 2011; doi: 10.1098/rsbl.2011.0269.
Dey P, Sarkar AK 2011. Revisiting indigenous farming knowledge of Jharkhand (India) for conservation of natural resources and combating climate change. Indian Journal of Traditional Knowledge, 11: 71-79.
Dhaka BL, Chayal K, Poonia MK 2010. Analysis of Farmers’ Perception and Adaptation Strategies to Climate Change. Libyan Agriculture Research Center Journal International 1: 388-390.
Goswami BN, Venugopal V, Sengupta D, Madhusoodanan MS, Xavier PK 2006. Increasing trend of extreme rain events over India in a warming environment. Science, 314: 1442–1445.
Intergovernmental Panel on Climate Change 2007. the physical science basis, summary for policy makers. Contribution of working group I to the third assessment report of the IPCC. Geneva, Switzerland; 2007: IPCC Secretariat.

Journal of Progressive Agriculture, Vol.3, No. 1: April 2012
15
Joshi AK, Joshi PK 2011. A rapid inventory of indicators of climate change in the middle Himalaya. Current Science, 100: 831–832.
King DNT, Skipper A, Tawhai WB 2008. Mauori environmental knowledge of local weather and climate change in Aotearoa – New Zealand. Climate Change, 90: 385-409.
Kumar K 1987. Conducting focus group interviews in developing countries. A.I.D. Program Design and Evaluation Methodology Report No. 8. Washington, D.C. U.S. Agency for International Development.
Loe De, Kreutzwiser R, Moraru L 2001. Adaptation option for the near term: climate change and the Canadian water sector. Global Environment Change, 11: 231-245.
Maddison D 2006. The perception and adaptation to climate change in Africa. CEEP Discussion paper No. 10, Centre of Environmental Economics and Policy in Africa, University of Pretoria, Pretoria.
Martello ML 2008. Arctic indigenous peoples as representations and representatives of climate change. Soc. Stud. Sci., 38: 351–376.
Salick J, Byg A 2007. Indigenous peoples and climate change. Tyndall Center for Climate Change Research, Oxford.
Shukla G 2010. Biomass production and vegetation analysis of Chilapatta Reserve Forest Ecosystem of West Bengal Ph.D. Thesis. Uttar Banga Krishi Viswavidyalaya, West Bengal, India.
Shukla PR, Sharma SK, Venkata P, Ramana 2002. Climate change and India- issues, concerns and opportunities, Tata McGraw-Hill Publishing Company Limited, New Delhi, pp: 317.
Vedwan N, Rhoades RE 2001. Climate change in the Western Himalayas of India: a study of local perception and response. Climate Research, 19, 109–117.
Xu J, Grumbine RE, Shrestha A, Eriksson M, Yang X, Wang Y, Wilkes A 2009. The melting Himalayas: cascading effects of climate change on water, biodiversity, and livelihoods. Conservation Biology, 23, 520–530.

Journal of Progressive Agriculture, Vol.3, No. 1: April 2012
16
Probable Annual Maximum Rainfall for Barapani, Meghalaya
LALA I.P. RAY1, P.K. BORA2, V. RAM2, A.K. SINGH3, R. SINGH2, AND S.M. FEROZE3
2 Associate Professor, 3 Assistant Professor and 1 Assistant Professor (Water Resource Management), School of Natural Resource Management, College of post Graduate Studies, (Central Agricultural University),
Umiam, Barapani- 793103 Meghalaya Email: [email protected]
ABSTRACT
Annual daily rainfall data for 28 years (1983-2010) of Barapani, Meghalaya has been collected and frequency analysis of maximum daily rainfall has been attempted. The annual maximum daily rainfall data has been fitted to five different probability distribution functions i.e. Normal, Log-normal, Pearson Type-III, Log Pearson Type-III and Gumbel Type-I extreme. The probable rainfall value for different return periods has been estimated. These estimated values have been compared with the values obtained by Weibull`s Method. The analysis indicates that, the Gumbel distribution gives the closet fit to the observed data. Therefore this distribution may be used to predict maximum rainfall, which will be a great importance for economic planning and design of small and medium hydraulic structures.
Key words: Frequency analysis; maximum daily rainfall; rainfall and rainfall analysis. The study place, Barapani is located at 25041`21`` North Latitude and 91055`25`` East Longitude with an altitude of 1010 m above mean sea level. The behavioral pattern of rainfall with reference to the amount of rainfall and number of rainy days in a week at Barapani, Meghalaya from historic daily rainfall records (1983-2010) are calculated using probabilistic approach. Generally, areas with low rainfall are having high rainfall variability, the North East Hilly (NEH) region, by virtue of receipt of heavy rainfall falls in low rainfall variability category and it ranges from 8-15%. For Barapani, the normal annual rainfall ranges from 200- 300 cm, but the rainfall is highly erratic and occurrence of high intensity rainfall is somewhat common. Under such circumstances, probable maximum rainfall value is of great importance while designing hydraulic structures. Hydraulic and design engineers require maximum daily rainfall of different return periods for safe planning and design of small and medium hydraulic structures such as small dams, bridges, culvers drainage works etc. this would also be useful for forecasting the floods to downstream towns and villages. Prediction of maximum daily rainfall for
higher return periods is usually done by a probability distribution function which fit the observed rainfall data better. Probability analysis of one day rainfall has been attempted for different places (Sharda and Bhusan, 1985; Prakash and Rao, 1986; Aggarwal et. al., 1988; Bhatt et al., 1996 Mohanty et al., 1999; Kumar, 1999 and 2000; George and Kolappadan, 2002; Suresh, 2003; Dingre and Atre, 2005; Pandey and Bisht, 2006). An attempt has been made in this present study to estimate the probable maximum daily for different return periods for Barapani, Meghalaya by five different probability distribution functions and to select the best one.
MATERIALS AND METHOD
Annual maximum daily rainfall data of Barapani, for 28 years (1983-2010) were fitted to five probability distribution functions i.e. Normal, Log normal, Pearson type-III, Log Pearson type-III and Gumbel type-I extreme distribution to predict one day maximum rainfall. The five different probability distributions (Chow et.al., 1988) for fitting hydrologic data are given as follows:
Normal Distribution The probability density function of this distribution is given by:
( )
−−= 2
2
2exp
21
σµ
πσxf x … (1)
Where µ and σ are mean and standard deviation of variate ‘x’ respectively (Singh, 1994) Log Normal Distribution The probability density function of this distribution is given by:
( )
−−= 2
2
2exp
21
y
yx
xx
fσ
µπσ
… (2)
Where y = log x, µy and σy are mean and standard deviation of variate ‘x’ respectively (Singh, 1994)
Journal of Progressive Agriculture, Vol.3, No. 1: April 2012
17
Pearson type-III Distribution
( ) ( ) ( )Axn
x eAxn
f −−−−Γ
= ληλ 1 … (3)
Where λ = scale parameter; η is the shape parameter; Г is gamma function and A = location parameter. Log Pearson type-III Distribution
( ) ( ) ( )Axn
x eAxn
f −−−−Γ
= ln1ln ληλ … (4)
Where λ = scale parameter; η is the shape parameter; Г is gamma function and A = location parameter. Gumbel type-I extreme Distribution
( ) ( ) }{[ ]βαβαα −−−−−= xxfx expexp … (5) Where α = scale parameter and β = location parameter (Singh, 1994) All the five probability distribution functions are compared by chi-square (χ2) test of goodness of fit by the following equation
( )E
EO∑ −=
22χ … (6)
RESULTS AND DISCUSSION
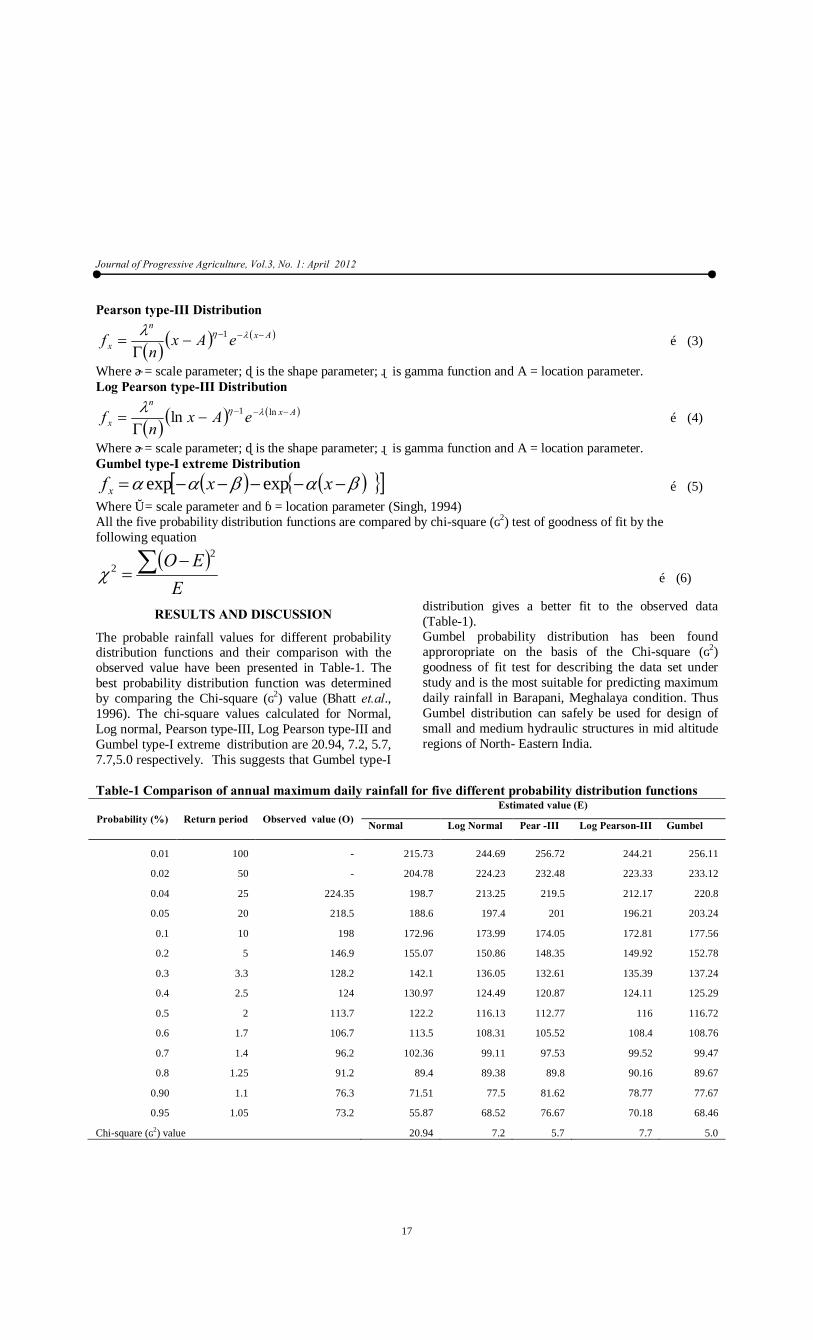
The probable rainfall values for different probability distribution functions and their comparison with the observed value have been presented in Table-1. The best probability distribution function was determined by comparing the Chi-square (χ2) value (Bhatt et.al., 1996). The chi-square values calculated for Normal, Log normal, Pearson type-III, Log Pearson type-III and Gumbel type-I extreme distribution are 20.94, 7.2, 5.7, 7.7,5.0 respectively. This suggests that Gumbel type-I
distribution gives a better fit to the observed data (Table-1). Gumbel probability distribution has been found approropriate on the basis of the Chi-square (χ2) goodness of fit test for describing the data set under study and is the most suitable for predicting maximum daily rainfall in Barapani, Meghalaya condition. Thus Gumbel distribution can safely be used for design of small and medium hydraulic structures in mid altitude regions of North- Eastern India.
Table-1 Comparison of annual maximum daily rainfall for five different probability distribution functions
Probability (%) Return period Observed value (O) Estimated value (E)
Normal Log Normal Pear -III Log Pearson-III Gumbel
0.01 100 - 215.73 244.69 256.72 244.21 256.11
0.02 50 - 204.78 224.23 232.48 223.33 233.12
0.04 25 224.35 198.7 213.25 219.5 212.17 220.8
0.05 20 218.5 188.6 197.4 201 196.21 203.24
0.1 10 198 172.96 173.99 174.05 172.81 177.56
0.2 5 146.9 155.07 150.86 148.35 149.92 152.78
0.3 3.3 128.2 142.1 136.05 132.61 135.39 137.24
0.4 2.5 124 130.97 124.49 120.87 124.11 125.29
0.5 2 113.7 122.2 116.13 112.77 116 116.72
0.6 1.7 106.7 113.5 108.31 105.52 108.4 108.76
0.7 1.4 96.2 102.36 99.11 97.53 99.52 99.47
0.8 1.25 91.2 89.4 89.38 89.8 90.16 89.67
0.90 1.1 76.3 71.51 77.5 81.62 78.77 77.67
0.95 1.05 73.2 55.87 68.52 76.67 70.18 68.46
Chi-square (χ2) value 20.94 7.2 5.7 7.7 5.0
Journal of Progressive Agriculture, Vol.3, No. 1: April 2012
18
REFERENCE
Aggarwal, M.C., Katiyar, V.S. and Ram Babu. 1988. Probability analysis of annual maximum daily rainfall of U.P. Himalayan. Indian J. Soil Cons., 16(1): 35-42.
Bhatt, V. K., Tiwari, A. K. and Sharma A. K. 1996. Probability models for prediction of annual maximum daily rainfall of data. Indian J. Soil Cons., 24(1):25-27.
Chow, V T., Maidment, D.R. and Mays, L .W. 1988. Applied Hydrology. McGraw Hill Book Company. 11, 12: 371-415.
Dingre, S., Atre, A. A. 2005. Probability analysis for prediction of annual maximum daily rainfall of Srinagar region (Kashmir valley). Indian J. of Soil Cons., 33(3):262-263.
George, C., Kolappadan, C. 2002. Probability analysis for prediction of annual maximum daily rainfall of Periyar basin in Kerala. Indian J. of Soil Cons., 30(3):273-276.
Jeevarathnam, K And Jaykumar, K. 1979. Probability analysis of annual maximum daily rainfall for Oota –Camund. Indian J. Soil Cons., 7(1) :10-16.
Kumar, A. 1999. Probability analysis for prediction of annual maximum daily rainfall for Pantnagar. Indian J. of Soil Cons., 27(2):171-173.
Kumar, A. 2000. Probability of annual maximum daily rainfall of Ranichuari (Tehri Garhwal) based on probability analysis. Indian J. of Soil Cons., 28(2):178-180.
Pandey, S.C. and Bisht, K.K.S. 2006. Probability analysis for prediction of annual maximum daily rainfall for Hawalbagh (Almora). Indian J. of Soil Cons., 34(1):75-76.
Prakash C and Rao D.H. 1986.Frequency analysis of rain data for crop planning (Kota). Indian J Soil Cons 14(2):23-26.
Sharda, V.N and Bhusan L.S. 1985. Probability analysis of annual maximum daily rainfall for Agra , Indian J .Soil Cons.13(1):16-20.
Singh, J and Dhillon, S. S. 1994. Physical determinants of agriculture patterns: In Agriculture Geography (2nd Edn.).Tata McGraw Hill Publication Co. New Delhi, pp 60 -72.
Suresh, R. 2003. Probability model for predicting annual maximum daily rainfall for Pus farm (Bihar). Indian J. of Soil Cons., 31(1):84-85.

Journal of Progressive Agriculture, Vol.3, No. 1: April 2012
19
Microbial biomass, enzyme activities and carbon stocks in soils as influenced by soil depth, organic and conventional management systems
M. VIJAY SANKAR BABU1, V.R. RAMAKRISHNA PARAMA
AND M.MADHAN MOHAN Dept. of Soil Science & Agril. Chemistry, College of Agriculture, GKVK Campus, UAS, Bangalore
1Present address: Scientist (Soil Science), Agricultural Research Station, ANGR Agricultural University, Anantapur, AP E mail: [email protected]
ABSTRACT
Many recent studies from around the world have compared organic and conventional farming systems in terms of soil properties. A field study was conducted to determine the distribution of different carbon fractions and the activity of acid Phosphatase, alkaline Phosphatase and Dehydrogenase enzymes in four representative soil profiles one each from < 3years, 3-6 years and > 6 years of organic farming practice and one profile from conventional farming system under central dry zone of Karnataka, India. The activity of dehydrogenase increased significantly in all three organic farming fields irrespective of cropping systems evaluated over conventional farming, with maximum activity being in the profile where organic farming is practicing for > 6years. The organic farming being practiced in < 3 years and 3-6 years fields recorded significantly lower levels of acid and alkaline phosphatase activities in the surface horizon when compared conventional farming system. Depth-distribution studies showed that all the three enzyme activities were concentrated in surface soils and decreased with depth.
Keywords: Profiles, Microbial biomass C, Dehydrogenase, Phosphatases, Carbon stock A growing number of studies show that organic farming leads to higher quality soil and more soil biological activity than conventional farming. Soils are a fundamental resource base for agricultural production system. Agricultural management systems have been historically adopted without recognizing consequences on soil conservation and environment quality, and therefore significant decline in soil quality has occurred worldwide. Since, soil biological and biochemical properties do respond rapidly and enzymatic activity is highly sensitive to external agents and easy to determine, measurement of the activity of numerous hydrolytic enzymes has been widely used in recent years to study the effect of changes in soil use on processes that affect of soil quality (Bandick and Dick 1999). Studies of enzyme activities in soil are important as they indicate the potential of the soil to support biochemical processes which are essential for the maintenance of soil fertility. Dehydrogenases represent a class of enzymes that give us information about the influence of natural environmental conditions of the microbial activities of the soil (Schäffer 1993). The objective of the present study was to determine the impact with different periods of organic farming practice and conventional farming approach on soil dehydrogenase, acid and alkaline phosphatase activity, microbial biomass and total carbon & nitrogen stocks along with soil profile depth.
MATERIAL AND METHODS
The study was conducted in central dry agro climatic zone of Karnataka, India. The zone comprises an area of 1.94 million ha. The annual rainfall ranges from 454 to 718 mm and more than 55% is received in kharif
season. The soils from different horizon depths were collected during 2008-09.A composite sample obtained from 8-10 cores of each horizon was thoroughly homogenized, stored under refrigerating conditions and analyzed for the activities of dehydrogenase and acid and alkaline phosphatases by adopting methods of Casida et al. (1964) and Tabatabai and Bremner (1969), respectively. Soil microbial biomass was estimated by following the fumigation and extraction method as proposed by Carter et al., (1999). Ninhydrin-reactive N released during the fumigation of soil was determined by using Ninhydrin reagent and was used as a measure of microbial biomass. The quantity of carbon stock in each depth was calculated following the method described by Batjes (1996). It involved multiplying bulk density (Mg m-3) of each layer, and thickness of each horizon (m) with the total carbon or total nitrogen (g C g-1 soil) in that layer.Total C or N stock (Mg ha-1) = Soil Tot C or N (g g-1) in that horizon x Bulk density (Mg m-3) x depth (m). Summation of C or N in all the horizons was taken as C or N stock for the individual profile, and expressed on a per hectare basis. The soils were classified as per keys to Soil Taxonomy (Soil Survey Staff 1998). All statistical analyses were performed with the program SPPS 11.0 for Windows (SPSS, 2001)
RESULTS AND DISCUSSION
Pedon 1: Organic Farming (0-3 yrs) Pedon 1 of studied in Babbur research farm, where organic farming is being practiced for over two years. The land was gently sloping plain with 1 to 3 per cent slope. The soil developed from weathered schist (Table. 1). The surface horizon (12 cm thick) was clay

Journal of Progressive Agriculture, Vol.3, No. 1: April 2012
20
with moderate subangular blocky structure, Consistence was dry hard, moist friable and wet sticky and plastic. The soil recorded strong alkaline reaction which was exhibited by strong effervescence with dilute acid. Subsoil horizons from 12 to 70 cm were dark brown clay with moderate subangular blocky structure. Other features were similar to surface horizon. Below 70 cm weathered rock was found. Organic carbon content (Table 2) of the surface soil was 11.7 g kg-1 and in the subsoil horizons it ranged from 0.9 to 10.2 g kg-1. The soil microbial biomass carbon and nitrogen contents in the surface horizon of the pedon was 362 and 52.24 μg g-1 respectively and decreased with the increase in depth of the pedon. The total carbon stock in the surface soil horizon was 26.75 Mg ha-1 and a total carbon stock in the entire pedon was of the order 57.73 Mg ha-1. Total nitrogen stock in the surface horizon was 1.06 Mg ha-1 and in the entire pedon (100cm) recorded 4.12 Mg ha-1. The biological activity of soil was measured by the activity of the enzymes dehydrogenase, alkaline phosphatase and acid phosphatase (Table 3). Dehydrogenase activity in the surface soil layer was 5245 μg TPF g-1 h-1, it declined to 154 in subsoil. Acid phosphatase activity was 49.78 μg p-NP g-1 h-1 in surface soil and in subsoil it was 14.62 μg p-NP g-1 h-1. Alkaline phosphatase activity in the surface soil was 44.92 μg p-NP g-1 h-1 and in subsoil layer 17.63 μg p-NP g-1 h-1.
Pedon 2: Organic Farming (3-6 yrs) Pedon 2 studied at Sultanipura village of Chitradurga region where the farmer is practicing organic farming system for the past five years. The well drained soil developed from weathered gneiss (Table 1) with a slope of 1-3% and was cultivated to maize- cotton rotation. The 19 cm thick surface horizon was sandy clay in texture. Soil structure was moderately subangular blocky and consistence slightly hard, firm, sticky and plastic. Subsoil horizons from 34 to76 cm were clay with medium subangular blocky structure. Thick patchy clay cutans were observed on ped surfaces. Organic carbon content of the surface layer was 14.1 g kg-1 and decreased gradually with depth (Table 2). The SMB-C and SMB-N contents in the surface horizon of the studied pedon were 364 and 56.9 μg g-1 respectively and decreased gradually with the depth. The total carbon stock in the surface soil horizon was 46.36 Mg ha-1 and a total carbon stock in the entire pedon was of the order 138.83 Mg ha-1. Total nitrogen stock in the surface horizon was 2.08 Mg ha-1 and in the entire pedon (100cm) it was 6.16 Mg ha-1. Microbial activity in soil was measured by the activity of dehydrogenase, Urease, acid and alkaline phosphatases. Dehydrogenase activity in the surfaces soil layer was 1048 μg TPF g-1 h-1 of soil day-1 which declined to 163 in subsoil. Acid phosphatase activity was 54.57 μg p-NP g-1 h-1in surface soil and in subsoil it was 6.88 μg p-NP g-1 h-1. Alkaline phosphatase
activity in the surface soil was 56.69 μg p-NP g-1 h-
1and in subsoil layer it was 25.04 μg p-NP g-1 h-1. Pedon 3: Organic Farming (>6 yrs) Pedon 3 was located in nearly leveled land in M.N.hally village of Chitradurga region in which the farmer was practicing organic farming for more than 7 years. The soil was developed from alluvium of granite gneiss origin (Table 1). The poorly drained soil on land with 0 to 1 per cent slope was very slightly eroded. The crops raised were maize and ragi in rotation with sunflower .The surface soil horizon was 14 cm thick, sandy clay in texture with moderate subangular blocky structure. Consistency was hard when dry, moist friable, sticky and plastic. The subsoil horizons to a depth of 80 cm were with sandy clay structure. Other features were similar to the surface soil. Below 80 cm weathered rock with 30% soil was found. Organic carbon content of the surface layer was 15.5 g kg-1 and which decreased gradually with depth (Table 2). The SMB-C and SMB-N contents in the surface horizon of the studied pedon were 482 and 54.3 μg g-1 respectively and were decreased gradually with the depth. The total carbon stock in the surface soil horizon was 48.38 Mg ha-1 and a total carbon stock in the entire pedon was of the order 150.31 Mg ha-1. Total nitrogen stock in the surface horizon was 1.92 Mg ha-1 and in the entire pedon (100cm) it was 7.19 Mg ha-1. Dehydrogenase activity in the surfaces soil layer was 1194 μg TPF g-1 h-1 which declined to 304 in subsoil (Table 3). Acid phosphatase activity was 57.12 in surface soil and in subsoil it was 24.39 μg p-NP g-1 h-1.
Alkaline phosphatase activity in the surface soil was 59.12 μg p-NP g-1 h-1and in subsoil layer it was 41.33μg p-NP g-1 h-1.
Pedon 4: Conventional Farming The pedon 4 studied for evaluating properties of conventional farming system is exposed in Babbur farm of Agricultural Research station, Babbur. The land parcel in which soil profile was exposed was cultivated with field crops like maize and sunflower. It had very gently sloping plain with 1 to 3 per cent slope (Table 1). The soils were developed from weathered schist. The 15 cm thick surface horizon was sandy clay with moderate subangular blocky structure and the consistence dry hard, moist friable and wet sticky and plastic. Subsoil horizons from 28 to 58 cm were gravel clay. Soil structure was moderate fine subangular blocky and consistence dry hard, moist friable and wet sticky and slightly plastic. Organic carbon content of the surface horizon was 9.6 g kg-1 and in the subsoil it ranged from 4.8 to 8.1 per cent (Table 2 ). The SMB-C and SMB-N contents in the surface horizon of the studied pedon were 284 and 36.24 μg g-1 respectively and were decreased gradually with the depth. The total carbon stock in the surface soil horizon was 27.77 Mg ha-1 and a total carbon stock in the entire pedon was of the order 96.33 Mg ha-1. Total nitrogen stock in the surface horizon was 1.37 Mg ha-1 and in the entire pedon (100cm) it was 5.06 Mg ha-1.

Journal of Progressive Agriculture, Vol.3, No. 1: April 2012
21
Dehydrogenase activity in the surfaces soil layer was 347 μg TPF g-1 h-1 which declined to 14.22 in subsoil. Acid phosphatase activity was 53.12 μg p-NP g-1 h-1in surfaces soil and in subsoil 12.96 μg p-NP g-1 h-1 . Alkaline phosphatase activity in the surface soil was 55.06 and in subsoil layer it was 14.75 μg p-NP g-1 h-1. Three pedons in organically managed systems and one pedon of conventional farming practice were opened in central dry zone of Karnataka. Colour of the soil horizons varied between the hues of 7.5YR and 10YR. The values ranged from 3 to 4, whereas chromas were 3 or less. The pedons exhibited sub-angular blocky structure throughout the depth (100cm) of profile. Higher values for microbial biomass carbon and nitrogen were recorded in pedon 3 (ORG >6years) followed by pedon 2 (ORG 3-6 years). The values decreased with increase in depth of all the pedons. The soils under organic farming practice had higher OC and N in the surface layers compared to lower layers. Further, in comparison to surface soils of conventional farming practice the organic carbon and other soil attributes were also low. Higher organic carbon content of 15.5 g kg-1 was recorded in surface horizon of pedon 3 followed by 14.1g kg-1 in pedon 2 and least was noticed in pedon 4 ( 9.6g kg-1) which was sourced from conventional farming practice. Soil microbial biomass-C and N also followed similar trend as that of organic carbon and registered a decreasing trend with increase in depth of the profiles irrespective of farming systems and periods of practice. Pedon 3 recoded higher total carbon and total nitrogen stocks followed by pedon 2, pedon 4. The
least carbon and nitrogen stocks were recorded in pedon 1. The enzyme activities (phosphatases and dehydrogenase) were consistently higher in the surface layer (AP horizon) in all the four representative profiles studied. Soil acid and alkaline phosphatases were significantly low in < 3 years and 3-6 years of organic farming practice when compared to conventional farming. However, in the field where organic farming being practiced over 6 years recorded highest acid and alkaline phosphatase activity. The dehydrogenase activity was increased significantly in all three organic farming fields irrespective of cropping systems evaluated over conventional farming, with maximum activity being in the field where organic farming is practicing for > 6years. Soil enzyme activities may be increased by incorporation of organic materials in the soil (Nannipieri et al. 1983) and this increased activity has generally been attributed to increased microbial biomass resulting from organic matter enrichment in the soil where organic farming is being practiced over 6 years. The activities of dehydrogenase, acid and alkaline phosphatase in our study decreased markedly with depth in organic as well as conventional farming systems. This decrease in dehydrogenase and phosphatase activities with depth was associated with decrease in organic matter content. The organic production systems received off farm organic inputs such as organic compost and composted manure which could be the reason for higher biological activity than for conventional soil pedon. This confirms the earlier findings of Chan et al., (2008) and Wells et al., (2000).
Table 1. Description of representative Profiles under Central dry agro climatic zone of Karnataka, India
Horizon
Depth (cm)
Matrix colour Texture Structure! Classification pH EC
(dSm-1) P#-1: (Organic farming 0-3yrs) Lat: 130 -57'-35.6" Longi: 760-38-51.1 Elevation: 635 MSL
A 0-12 10YR 3/3 sandyclay sb k Fine,mixed,iso hyperthermic, lithic
Haplustepts
8.45 0.32 BW1 12 - 24 10YR 3/2 sandyclay sb k 8.6 0.25 BW2 24-70 10 YR 3/2 sandyclay sb k 8.65 0.22
BW3 70-89 10 YR 3/2 sandyclay sb k 8.45 0.21 P-2: (Organic farming 3-6 yrs) Lat: 140 20' 20.4" Longi: 760 21' 14.3" Elevation: 666 MSL A 0-19 7.5YR 3/3 sandyclay sb k Fine, mixed,iso hyper
thermic, Typic Paleustals
8.15 0.18 BW1 19-34 7.5YR 3/3 sandyclay sb k 8.2 0.16 BW2 34-52 7.5YR 4/3 clay sb k 8.25 0.17 BW3 52-76 7.5YR 3/3 clay sb k 8.7 0.22
BC > 76 Weathered parent material P-3: (Organic farming >6yrs) Lat: 140 20' 36.9" Longi: 760 23' 25.6" Elevation: 708 MSL A 0-14 7.5YR 3/2 sandyclay sb k Fine, mixed,
isohyperthermic, Typic Haplustepts
7.35 0.12 BW1 14-35 7.5YR 3/3 sandyclay sb k 7.85 0.1 BW2 35-60 7.5YR 3/2 sandyclay sb k 8.15 0.14 BW3 60-80 7.5YR 4/2 sandyclay sb k 8.35 0.12
BC > 80 Weathered parent material P-4: (Conventional farming) Lat: 130 57' 39" Longi: 760 38' 51.4" Elevation: 662 MSL AP 0-16 10 YR 3/2 sandyclay sb k Clayey-skeletal,
mixed, isohyperthermic,Typi
c haplustepts
7.9 0.27 BW1 16-28 10 YR 3/2 sandyclay sb k 8.12 0.28
2BW1 28-75 10 YR 3/2 sandyclay sb k 8.4 0.3 2 BW2 75-89 10 YR 3/2 sandyclay sb k 8.74 0.28

Journal of Progressive Agriculture, Vol.3, No. 1: April 2012
22
BC > 89 Weathered parent material #P : Profile !sbk- subangular blocky Table 2. Carbon distribution in pedons of organic and conventional farming systems Horizon
Depth Organic-C MB-C MB-N Tot-C Tot-N Tot-C Stocks Tot-N Stocks (cm) (g kg-1) (µg g-1) (µg g-1) (g kg-1) (g kg-1) (Mg ha-1) (Mg ha-1)
Pedon -1: (Organic farming 0-3yrs) Fine,mixed,isohyper thermic,Lithic Haplustepts A 0-12 11.7 362 52.24 19.9 0.79 26.75 1.06
BW1 12-24 10.2 241 34.2 16.8 0.67 23.79 0.95 BW2 24-70 0.9 126 19.26 3.3 0.38 18.37 2.11
C 70-100 Weathered parent material TOTAL STOCKS 57.73 4.12 Pedon -2: (Organic farming 3-6 yrs) Fine, mixed,iso hyper thermic, Typic Paleustalfs
A 0-19 14.1 364 56.9 24.9 1.12 46.36 2.08 BW1 19-34 10.8 285 38.4 19.3 0.76 32.42 1.28 BW2 34-52 9.6 176 26.5 16.2 0.52 33.83 1.08 BW3 52-76 7.5 98 18.6 11.8 0.36 35.68 1.08 BW4 76-100 5.7 41 9.2 7.9 0.18 27.49 0.62
TOTAL STOCKS 138.83 6.16 Pedon -3: (Organic farming >6yrs) Fine, mixed, isohyperthermic, Typic Haplustepts
A 0-14 15.5 482 54.3 27 1.07 48.38 1.92 BW1 14-35 12.6 352 38.2 19.8 0.75 57.38 2.17 BW2 35-60 11.4 199 26.5 16.8 0.52 60.9 1.88 BW3 60-80 9.6 102 21.2 13.4 0.41 39.66 1.21
BC 80-100 Weathered parent material TOTAL
STOCKS 150.31 7.19 Pedon -4: (Conventional farming) Clayey-skeletal, mixed, isohyperthermic, Typic Haplustepts
AP 0-15 9.6 284 36.24 17.8 0.88 27.77 1.37 BW1 15-28 8.1 214 28.45 14.3 0.72 20.08 1.01 BW2 28-58 5.1 141 26.2 8.8 0.51 32.21 1.86 BC 58-75 4.8 62 19.4 7.6 0.38 16.28 0.81 C 75-100 Weathered parent material TOTAL STOCKS 96.33 5.06
Table 3a. Phosphatase and dehydrogenase activity in the plough layer (Ap horizon) as affected by different time periods of organic farming practice
Parameters
Enzyme activity Acid phosphatase ( µg p-
NP g-1 h-1) Alkaline phosphatase (µg p-
NP g-1 h-1) Dehydrogenase ( µg TPF
g-1 h-1) A. Organic farming
• < 3years 53.22 NS (0.001) 55.26 NS ( 0.003) 1060 * ( 58.6) • 3-6 years 54.57 NS (2.7) 56.69 NS (2.9) 1246 * (86.5) • > 6 years 57.12 * (7.5) 59.12 * (7.4) 1272 * (90.4)
B. Conventional farming
53.12 55.06
668
* p < 0.05, as compared to conventional farming; Figures in parenthesis show per cent increase/ decrease over conventional farming
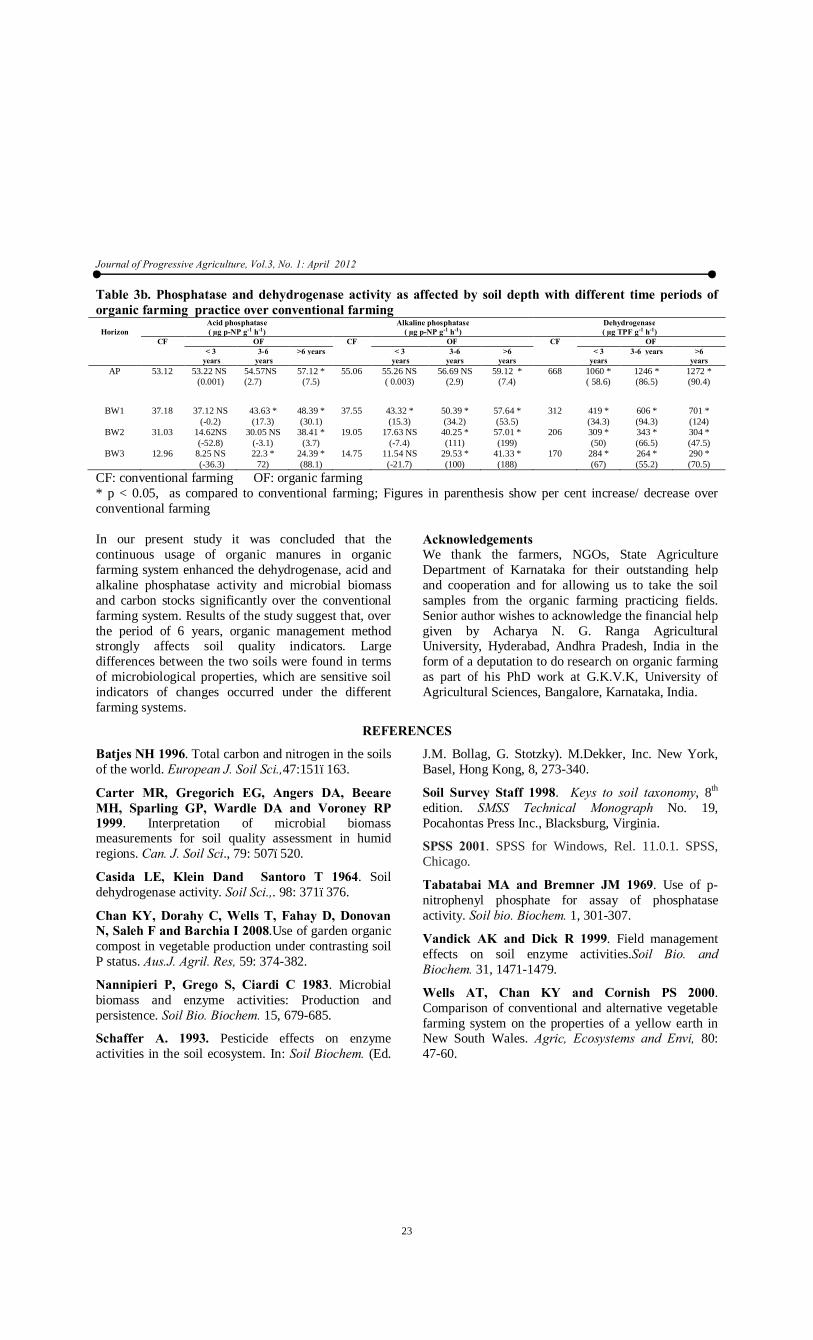
Journal of Progressive Agriculture, Vol.3, No. 1: April 2012
23
Table 3b. Phosphatase and dehydrogenase activity as affected by soil depth with different time periods of organic farming practice over conventional farming
Horizon
Acid phosphatase ( µg p-NP g-1 h-1)
Alkaline phosphatase ( µg p-NP g-1 h-1)
Dehydrogenase ( µg TPF g-1 h-1)
CF OF CF OF CF OF < 3
years 3-6
years >6 years < 3
years 3-6
years >6
years < 3
years 3-6 years >6
years AP 53.12 53.22 NS
(0.001) 54.57NS (2.7)
57.12 * (7.5)
55.06 55.26 NS ( 0.003)
56.69 NS (2.9)
59.12 * (7.4)
668 1060 * ( 58.6)
1246 * (86.5)
1272 * (90.4)
BW1 37.18 37.12 NS (-0.2)
43.63 * (17.3)
48.39 * (30.1)
37.55 43.32 * (15.3)
50.39 * (34.2)
57.64 * (53.5)
312 419 * (34.3)
606 * (94.3)
701 * (124)
BW2 31.03 14.62NS (-52.8)
30.05 NS (-3.1)
38.41 * (3.7)
19.05 17.63 NS (-7.4)
40.25 * (111)
57.01 * (199)
206 309 * (50)
343 * (66.5)
304 * (47.5)
BW3 12.96 8.25 NS (-36.3)
22.3 * 72)
24.39 * (88.1)
14.75 11.54 NS (-21.7)
29.53 * (100)
41.33 * (188)
170 284 * (67)
264 * (55.2)
290 * (70.5)
CF: conventional farming OF: organic farming * p < 0.05, as compared to conventional farming; Figures in parenthesis show per cent increase/ decrease over conventional farming In our present study it was concluded that the continuous usage of organic manures in organic farming system enhanced the dehydrogenase, acid and alkaline phosphatase activity and microbial biomass and carbon stocks significantly over the conventional farming system. Results of the study suggest that, over the period of 6 years, organic management method strongly affects soil quality indicators. Large differences between the two soils were found in terms of microbiological properties, which are sensitive soil indicators of changes occurred under the different farming systems.
Acknowledgements We thank the farmers, NGOs, State Agriculture Department of Karnataka for their outstanding help and cooperation and for allowing us to take the soil samples from the organic farming practicing fields. Senior author wishes to acknowledge the financial help given by Acharya N. G. Ranga Agricultural University, Hyderabad, Andhra Pradesh, India in the form of a deputation to do research on organic farming as part of his PhD work at G.K.V.K, University of Agricultural Sciences, Bangalore, Karnataka, India.
REFERENCES
Batjes NH 1996. Total carbon and nitrogen in the soils of the world. European J. Soil Sci.,47:151–163.
Carter MR, Gregorich EG, Angers DA, Beeare MH, Sparling GP, Wardle DA and Voroney RP 1999. Interpretation of microbial biomass measurements for soil quality assessment in humid regions. Can. J. Soil Sci., 79: 507–520.
Casida LE, Klein Dand Santoro T 1964. Soil dehydrogenase activity. Soil Sci.,. 98: 371–376.
Chan KY, Dorahy C, Wells T, Fahay D, Donovan N, Saleh F and Barchia I 2008.Use of garden organic compost in vegetable production under contrasting soil P status. Aus.J. Agril. Res, 59: 374-382.
Nannipieri P, Grego S, Ciardi C 1983. Microbial biomass and enzyme activities: Production and persistence. Soil Bio. Biochem. 15, 679-685.
Schaffer A. 1993. Pesticide effects on enzyme activities in the soil ecosystem. In: Soil Biochem. (Ed.
J.M. Bollag, G. Stotzky). M.Dekker, Inc. New York, Basel, Hong Kong, 8, 273-340.
Soil Survey Staff 1998. Keys to soil taxonomy, 8th edition. SMSS Technical Monograph No. 19, Pocahontas Press Inc., Blacksburg, Virginia.
SPSS 2001. SPSS for Windows, Rel. 11.0.1. SPSS, Chicago.
Tabatabai MA and Bremner JM 1969. Use of p-nitrophenyl phosphate for assay of phosphatase activity. Soil bio. Biochem. 1, 301-307.
Vandick AK and Dick R 1999. Field management effects on soil enzyme activities.Soil Bio. and Biochem. 31, 1471-1479.
Wells AT, Chan KY and Cornish PS 2000. Comparison of conventional and alternative vegetable farming system on the properties of a yellow earth in New South Wales. Agric, Ecosystems and Envi, 80: 47-60.

Journal of Progressive Agriculture, Vol.3, No. 1: April 2012
24
The effect of the use of macroelements on the capability of production of two variety of flue-cured tobacco
A.R. FARROKH1, I. AZIZOV2, A. FARROKH3 M, ESFAHANI4, M. RANGBARCHOBEH5
University Student, Ph.D. Course of Studies in the field of Plant Physiology1, Professor of Botany, Institute of Republic of Azerbaijan National Academy2 , Member of scientific board of Elamic Azad University Branch of Qazvin3 , Member of scientific board of Guilan University4 , Master of agronomy of Tobacco Research Institute5
ABSTRACT
In order to investigate the effect of macroelements on the capability of production of flue-cured tobacco, a factorial field experiment was conducted during 2008-2009 in tobacco research institute with tree replications and eight treatment. The used nitrogen fertilizer levels were 35-45-55-65 Kg N/ha as urea and the used potassium fertilizer levels were 150-200 Kg K2O/ha as potassium sulphat. The used cultivars in this experiment were Coker347 and K326. According to the results, the effect of nitrogen on Coker347 cultivar yield in first and second years was significantly at the %1 level (p<0.01). Also the effect of nitrogen on K326 cultivar yield in both of years was significantly at the %5 level (p<0.05). The effect of potassium on Coker347 cultivar yield in first and second years was significantly at the %1 level (p<0.01). Also the interaction between nitrogen and potassium on Coker347 cultivar yield was significant at the %1 level (p<0.01) in first year and %5 level (p<0.05) in second year.
Key words: macroelements, the capability of production and flue-cured tobacco. Different varieties of tobacco like other agricultural plants during lifetime and different processes of growth need an exact extent of different substances so that the resulted leaves would have a good quality in scent, taste and being briquette and also have appropriate weight and leaf size. It must be mentioned that chemical fertilizer consumption in tobacco is a very sensitive issue; therefore, consumption of it should be together with enough science, information and experience. On the one hand, nutritious needs of tobacco is variable depending on variety, weather conditions, soil and so on, and to determine appropriate amount of chemical fertilizer of tobacco it is necessary that investigation and research on variety or varieties would be done in cultivation place or at least those studies that have been done in similar conditions on the considered variety in other regions would be used as the source and resource (9). Among food elements, nitrogen and potassium are usually the most important elements for using most of plants like tobacco. Among features of nitrogen fertilizer we can point out instability and wastage of major part of it after consumption in soil, so that efficiency of nitrogen fertilizers consumption in Iran has been assessed almost 50%. It means that in consumption of nitrogen fertilizers, the extent and way of consumption should be notified carefully. Irregular consumption of nitrogen chemical fertilizers not only is economically remarkable but also because of pollution of surface and underground waters has created several difficulties (11). The aim of tobacco cultivation is to produce leaf with more or less components of foodstuffs elements with dominant amount that could be accordant to its standard and from this point of view need for nitrogen is different in different kinds of tobacco. Required tobacco in eastern and fragrant tobacco is low, in dry-
heat or flue-cured tobaccos is low to average, in Maryland tobacco is average, in barely tobacco and other tobaccos of dry weather, dry-heat, greenhouse and dry-fire is average to high (6). Potassium is among useful elements in most plant which is absorbed in form of ions. It is dynamic and moving in soil and plant but its mobility is between nitrogen and phosphor. Potassium which is absorbed by the plant is comparable to the extent of its required nitrogen (13). Potassium has a positive mutual effect (synergistic) with some food elements such as nitrogen, phosphor and sulfur (11,12). In spite of some of necessary elements, however, potassium exists in plants in high extent, but does not participate in any organic compounds (1,8). In an experiment in India, effects of 3 levels of nitrogen and 3 processes of topping on performance and quality of tobacco 6534 was studied for a period of 2 years. Results of compound analysis showed that average topping has a better significant yield toward low topping or lack of topping (1992 kg/ha) and common high level of topping (1413 kg/ha). Application of 60 kg of nitrogen per hectare had a better performance over application of 40 kg of nitrogen per hectare (2098 kg/ha) (2). Ramakishna and Krishnamorti during their studies found that there is a high and significant correlation between available potassium in surface soil (0-22.5) and potassium in tobacco leaf, while there is no significant correlation between potassium of lower soil (22.5-45) and potassium of tobacco leaf (7). The aim of fulfillment of this experiment was to study on effects of nitrogen and potassium and access to proper fertilizer level for application in flue-cured tobacco for increasing of yield.

Journal of Progressive Agriculture, Vol.3, No. 1: April 2012
25
MATERIALS AND METHODS
In order to study on effects of nitrogen and potassium fertilizers on yield features of flue-cured tobacco Coker347 and K326, an experiment in agricultural year 2008 and 2009 with different levels of 35 (N1), 45 (N2), 55 (N3) and 65 (N4) kg of net nitrogen from urea fertilizer source and 150 (K1) and 200 (K2) kg potassium per hectare from potassium sulphat (considering the common conditions of region and recommendation of the experts) in form of factorial at Rasht Tobacco Research Institute, located at Guilan Province with longitude of eastern 49° 3' and latitude of northern 37° 16' and altitude of 25 m from sea level. Tobacco leaves in farm, gradually and during growth processes begin to ripening from under the bush. Therefore, in industrial ripening process, the leaves were harvested via 4 mows. The harvested leaves in every mow, after carrying from farm to the injecting hall, first get weighted and weight of green leaves were noted for determination of yield of green leaves. Then leaves were installed on cassettes separately from petiole and transferred to bulk curing greenhouse in order to get dried and passed 3 processes of coloring, color fixation and drying. These processes were done for the yield product from every turn in 4 mows and separately. To perform analysis of variance and comparison of means SAS software were used.
RESULTS AND DISCUSSION
Effects of nitrogen on performance of Coker347 in first and second years in probability level of 1% have been very significant (Table 1). Also, effects of nitrogen on yield of K326 in probability level of 5% in first and second years have been significant (Table 1). Nitrogen is a structural element of amino acids, amids of nitrogen alkalis, such as purine, proteins and nucleoproteins. By increment of nitrogen amount, amount of nitrogen in plants is increased and this effect at once is occurred on solution compounds like amino acids and less on amount of protein and shows more effect of glutamic from amino acids than other amino acids influenced by improvement of nitrogen nutrition, so that amino acids are known as way of plant nutrition with nitrogen. I.e. every time glutamic acid increases, the plant has been fed with nitrogen well, and vice-versa (4). Effect of potassium on yield of Coker347 in probability level of 1% has been significant in first and second years (Table 1). Several actions which are done by potassium in botanic metabolism is reasonable via its two major qualities, first, absorption quality in huge extent selectively and second power for changing of enzymes forms (3). Potassium plays an important role in physiological processes of plant (including opening and closing of holes and resistance in undesired environmental conditions) (14). It is important in synthesis and transfer of carbohydrates and generally CO2 consumption and is necessary for creation of thick cell wall. Also, it increases reaction of plant to other
elements, especially to nitrogen (10). It has been specified that potassium solved in soil, at first moves in form of spreading and mass current toward cortex cell wall spaces of root and from there moves toward vases through plasma membrane inside of the root cortex and thereof plays its vital role in plant (10). Potassium can cause increment in number of holes in surface of leaf and its consequences are gas interchange and absorption of more CO2 and therefore increment in photosynthesis, growth and finally increment in yield (12). Also, mutual effect of nitrogen and potassium in probability level of 1% in first year and in probability level of 5% in second year on performance of Coker 347 has been significant (Table 1). Potassium in addition to aid to transfer photosynthesis products, plays an essential and important role in transfer of nitrogen and its synthesis to protein. When nitrate is absorbed by plant, its negative load is neutralized by positive load of potassium and moves toward leaves together with transpiration current and transmutes into protein. In upper part of plant, potassium ion combines with Malate and again moves toward root. Malate which is transferred to root, is decarboxilized and change into pyruvate and bicarbonate. Then bicarbonate is interchanged with soil nitrate and nitrate is absorbed by the plant. Therefore, potassium acts similar to nitrogen pump and improves its absorption from soil and also usage of it by the plant (5). According to Table for comparison of average simple effect of potassium in first year, increment of application of nitrogen causes increment in performance of tobacco Coker 347. According to this table the lowest yield belong to application of levels of 35 and 45 kg/ha of nitrogen with average yields of 1240.33 and 1367 kg/ha. Treatments with application of 55 and 65 kg/ha of nitrogen with average yields equal to 1663 and 1603.17 kg/ha respectively have shown the highest performance (Table 2). According to Table for comparison of average simple effect of nitrogen in second year, consumption of 55 kg of nitrogen per hectare have shown the highest performance of tobacco Coker347 with average 2022.3 kg/ha. After that, consumption of levels of 65 and 45 kg of nitrogen per hectare with average performance of 1795.2 and 1702.3 kg/ha are respectively in next ranks. The lowest performance with average of 1509.5 kg/ha is related to 35 kg of nitrogen per hectare (Table 2). According to Table for comparison of average simple effect of nitrogen, consumption of 55 kg/ha has allocated the highest yield of tobacco Coker347 in both years to itself and higher consumption of it in order to prevent pollution of living environment and decrease of economical expenses is not necessary. According to Table for comparison of average simple effect of potassium, increment of yield of potassium up to the level of 200 kg/ha in both years, has increased yield of tobacco Coker347 to 304.25 and 278.67 kg/ha toward level of 150 kg/ha in first and second year, respectively
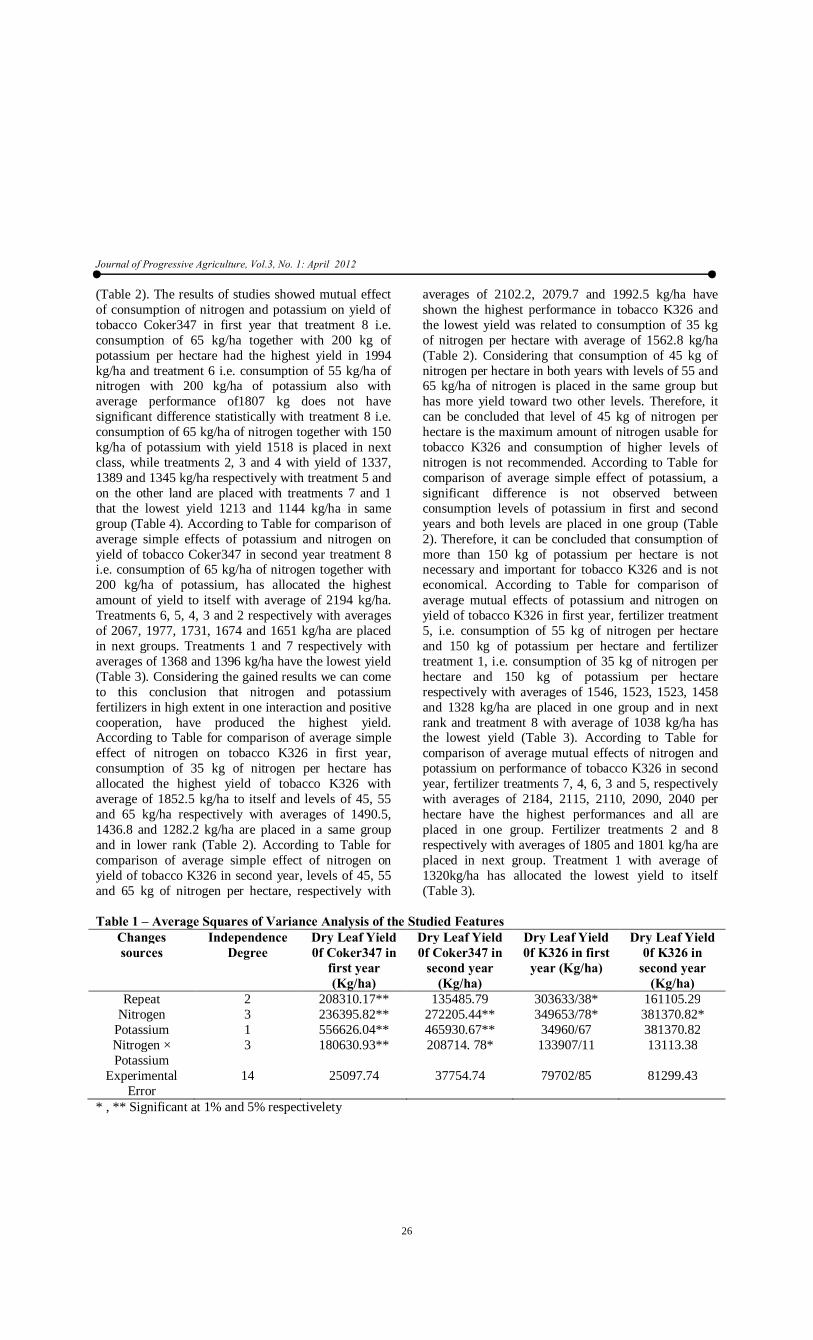
Journal of Progressive Agriculture, Vol.3, No. 1: April 2012
26
(Table 2). The results of studies showed mutual effect of consumption of nitrogen and potassium on yield of tobacco Coker347 in first year that treatment 8 i.e. consumption of 65 kg/ha together with 200 kg of potassium per hectare had the highest yield in 1994 kg/ha and treatment 6 i.e. consumption of 55 kg/ha of nitrogen with 200 kg/ha of potassium also with average performance of1807 kg does not have significant difference statistically with treatment 8 i.e. consumption of 65 kg/ha of nitrogen together with 150 kg/ha of potassium with yield 1518 is placed in next class, while treatments 2, 3 and 4 with yield of 1337, 1389 and 1345 kg/ha respectively with treatment 5 and on the other land are placed with treatments 7 and 1 that the lowest yield 1213 and 1144 kg/ha in same group (Table 4). According to Table for comparison of average simple effects of potassium and nitrogen on yield of tobacco Coker347 in second year treatment 8 i.e. consumption of 65 kg/ha of nitrogen together with 200 kg/ha of potassium, has allocated the highest amount of yield to itself with average of 2194 kg/ha. Treatments 6, 5, 4, 3 and 2 respectively with averages of 2067, 1977, 1731, 1674 and 1651 kg/ha are placed in next groups. Treatments 1 and 7 respectively with averages of 1368 and 1396 kg/ha have the lowest yield (Table 3). Considering the gained results we can come to this conclusion that nitrogen and potassium fertilizers in high extent in one interaction and positive cooperation, have produced the highest yield. According to Table for comparison of average simple effect of nitrogen on tobacco K326 in first year, consumption of 35 kg of nitrogen per hectare has allocated the highest yield of tobacco K326 with average of 1852.5 kg/ha to itself and levels of 45, 55 and 65 kg/ha respectively with averages of 1490.5, 1436.8 and 1282.2 kg/ha are placed in a same group and in lower rank (Table 2). According to Table for comparison of average simple effect of nitrogen on yield of tobacco K326 in second year, levels of 45, 55 and 65 kg of nitrogen per hectare, respectively with
averages of 2102.2, 2079.7 and 1992.5 kg/ha have shown the highest performance in tobacco K326 and the lowest yield was related to consumption of 35 kg of nitrogen per hectare with average of 1562.8 kg/ha (Table 2). Considering that consumption of 45 kg of nitrogen per hectare in both years with levels of 55 and 65 kg/ha of nitrogen is placed in the same group but has more yield toward two other levels. Therefore, it can be concluded that level of 45 kg of nitrogen per hectare is the maximum amount of nitrogen usable for tobacco K326 and consumption of higher levels of nitrogen is not recommended. According to Table for comparison of average simple effect of potassium, a significant difference is not observed between consumption levels of potassium in first and second years and both levels are placed in one group (Table 2). Therefore, it can be concluded that consumption of more than 150 kg of potassium per hectare is not necessary and important for tobacco K326 and is not economical. According to Table for comparison of average mutual effects of potassium and nitrogen on yield of tobacco K326 in first year, fertilizer treatment 5, i.e. consumption of 55 kg of nitrogen per hectare and 150 kg of potassium per hectare and fertilizer treatment 1, i.e. consumption of 35 kg of nitrogen per hectare and 150 kg of potassium per hectare respectively with averages of 1546, 1523, 1523, 1458 and 1328 kg/ha are placed in one group and in next rank and treatment 8 with average of 1038 kg/ha has the lowest yield (Table 3). According to Table for comparison of average mutual effects of nitrogen and potassium on performance of tobacco K326 in second year, fertilizer treatments 7, 4, 6, 3 and 5, respectively with averages of 2184, 2115, 2110, 2090, 2040 per hectare have the highest performances and all are placed in one group. Fertilizer treatments 2 and 8 respectively with averages of 1805 and 1801 kg/ha are placed in next group. Treatment 1 with average of 1320kg/ha has allocated the lowest yield to itself (Table 3).
Table 1 – Average Squares of Variance Analysis of the Studied Features
Changes sources
Independence Degree
Dry Leaf Yield 0f Coker347 in
first year (Kg/ha)
Dry Leaf Yield 0f Coker347 in
second year (Kg/ha)
Dry Leaf Yield 0f K326 in first
year (Kg/ha)
Dry Leaf Yield 0f K326 in
second year (Kg/ha)
Repeat 2 208310.17** 135485.79 303633/38* 161105.29 Nitrogen 3 236395.82** 272205.44** 349653/78* 381370.82*
Potassium 1 556626.04** 465930.67** 34960/67 381370.82 Nitrogen × Potassium
3 180630.93** 208714. 78* 133907/11 13113.38
Experimental Error
14 25097.74 37754.74 79702/85 81299.43
* , ** Significant at 1% and 5% respectivelety

Journal of Progressive Agriculture, Vol.3, No. 1: April 2012
27
Table 2 – Comparison of average simple effect of nitrogen and potassium fertilizers for the studied features Studied Qualities Dry Leaf Yield 0f
Coker347 in first year (Kg/ha)
Dry Leaf Yield 0f Coker347 in second
year (Kg/ha)
Dry Leaf Yield 0f K326 in first year
(Kg/ha)
Dry Leaf Yield 0f K326 in second
year (Kg/ha) Treatments
Nitrogen fertilizer 35 1240.33b 1509.5c 1852.5a 1562.8b 45 1367.00ab 1702.3bc 1490.5b 2102.2a 55 1663.00a 2022.3a 1436.8b 2079.7a 65 1603.17a 1795.2ab 1282.2b 1992.5a
Potassium fertilizer - - - - 150 1316.00b 1618.00b 1477.3a 1910.9a 200 1620.58a 1896.67a 1553.7a 1957.7a
Table 3 - Comparison of average mutual effects of nitrogen and potassium treatments for the studied features.
Treatment Nitrogen Potassium
Dry Leaf Yield of
Coker347 in first year (Kg/ha)
Dry Leaf Yield of
Coker347 in second year
(Kg/ha)
Dry Leaf Yield of
K326 in first year (Kg/ha)
Dry Leaf Yield of K326 in
second year (Kg/ha)
1 35 150 1144c 1368d 1837a 1320b 2 35 200 1337bc 1651cd 1523 ab 1805ab 3 45 150 1389bc 1731bcd 1328 ab 2090a 4 45 200 1345bc 1674cd 1526 ab 2115a 5 55 150 1518a 1977abc 1868 a 2049a 6 55 200 1807a 2067ab 1458 ab 2110a 7 65 150 1213c 1396d 1546 ab 2148a 8 65 200 1994a 2194a 1038 b 1801ab
REFRENCES
De Datta, S. K. and D. S. Mikkelson. 1985. Potassium nutrion of rice. P. 665-701 In: Munson, R. D. (ed). Potssium in agriculture. SSSA. Madison, WI.
Giridhar, K. 2000. Effect of levels of nitrogen and Topping on yield and quality of FCV tobacco in Karnataka. India. Tobacco research. 2000 Vol. 26. No. 2. 2000.
Hagh parast tanha, Mohammad Reza. 1990. plant Physiology. Guilan University.
Kavousi, Masoud. 2001. Study of intraction effects different levels of nitrogen and potassium on function of Rice. Rice Research Institute.
Mahmoudi, shahla and Masoud, Hiakimian 1998. Agrology Foundation. Tehran university.
Najafi, Gholamali and Abdolsamad, Moghaddasi. 1993. Effect of nutritional.
Ramakrishnaya, A. B. V and V. Krishnamurthy. 1990. Distribution pattern of potassium in flue-cured leaf. Indian J. Plant physiology. NO: 1-PP: 72-75.
Sabeti Amirdahandeh, Mohammad Ali. 2003. Study of effect of different levels and split of potassium on
quanity and quality of Flue cured Tobacco. MSc Agrology. Eslamic Azad University unit Ahvaz.
Ranjbar chobeh, Mehdi. 2005. Production, to ripen and evaluation of flue cured tobacco. Rasht Tobbacco Research Institute.
Saadati, Naser. 2002. Study of effect of sources of potassium and time of apply on yield of Rice in Mazandaran state. Rice Research Institute.
Shahdi Komele, Abbas. 1999. Review management of nutrition of Rice and soil fertility. Management of Education and Boosting of Agriculture Guilan.
Shahdi Komele, Abbas. 2002. Study of effect of potassium and zinc in obviation of disorder named Rice Dwarfism in Rice fields. Rice Research Institute.
Shamel, Rostami. Mohammad Taghi. 2000. Effect of split of potassium fertilizer on quanity and quality Virginia Tobacco. Tirtash Tobacco Research Institute.
Smith, W. D., and L. R. Fisher. 2005. 5. Nutrient management. P. 65-91. In W. D. Smith (ed.) 2005 Flue-cured tobacco information. North Carolina State Univ. Coop. Ext. Serv., Raleigh.
Journal of Progressive Agriculture, Vol.3, No. 1: April 2012
28
Evaluatuon of soil fetility status of available N, P and K in Inceptisol of Baloda block in Janjgir district of Chhattisgarh
G. K. JATAV AND V. N. MISHRA
Department of Soil Science and Agricultural Chemistry, Indira Gandhi Krishi Vishwavidyalaya, Raipur, Chhattisgarh, 492006
Email: [email protected]
ABSTRACT
Grid based (GPS) surface (0-15 cm) soil samples by systematic survey were collected from 87 villages in Baloda block where 1003 samples were identified from Inceptisol. These soil samples were analyzed for N, P and K and categorized as low medium and high as per criteria followed in the soil testing laboratory. Based upon the coefficient of correlation between macronutrients and soil properties, a significant and positive correlations observed between soil pH and available N, P, K. Electrical conductivity exhibited significant and positive relationship with available N, P, K and organic C showed significant and positive correlation with available N and K.
Key words: fertility status, major nutrients, Inceptisol In view of the finite nature of natural resources, their management in a sustained fashion has become an issue of primary concern. Sustainability of the agricultural production systems is the most crucial issue in this part of the green revolution. A system is sustainable when it improves or at least maintains the quality of soil, water and atmosphere. Application of chemical fertilizers has been rated as one of the most important production factor affecting the sustainability. The increasing population has forced farmers to make use of high doses of chemical fertilizers. Its unscientific use (nutrient imbalances, incorrect amounts) is a serious threat to sustainable agricultural production system. Soil test-based fertility management is an effective tool for increasing productivity of agricultural soils that have high degree of spatial variability resulting from the combined effects of physical, chemical or biological processes (Goovaerts, 1998). However, major constraints impede wide scale adoption of soil testing in most developing countries. In India, these include the prevalence of small holding systems of farming as well as lack of infrastructural facilities for extensive soil testing (Sen et al., 2008). Soil testing provides information regarding nutrient availability in soils which forms the basis for the fertilizer recommendations for maximizing crop yields. Soil testing program is beneficial to formulated specific fertilizer recommendations. Study Area Baloda is a town and a Nager Panchayat in Janjgir-Champa district in state of Chhattisgarh, India. It is located 22.15° North latitude, 82.48° East longitude with an altitude of 280 m above the mean sea level. The location of study area is shown in the map of Janjgir district of Chhattisgarh state. The Inceptisol
group of the soil covered under the different villages of the Baloda block in Janjgir district of Chhattisgarh has been taken for fertility evaluation on various aspects.
MATERIAL AND METHODS
Collection of soil samples Baloda is a Taluka comes under Janjgir district in the state of Chhattisgarh, and about 87 villages come under this Taluka. For evaluation of the soil fertility status in Inceptisol of Baloda block, a systematic survey was carried out. Surface (0-15 cm depth) soil samples were collected from different villages. Soil samples (15 cm) were collected with the help of soil auger and local spade with proper labels. Analysis of Samples Soil samples collected from the study area were dried and crushed with the help of wooden rod and passed through 2 mm sieve and then used for the determination of soil pH, organic matter, macronutrients and micronutrients content by adopting standard laboratory methods. Soil pH was determined by glass electrode pH (Piper 1967), EC with Solu-bridge method (Black 1965), OC by wet digestion method (Walkley and Black’s rapid titration method 1934), Available nitrogen was estimated by alkaline KMnO4 method (Subbiah and Asija 1956), Available phosphorus was extracted by 0.5M NaHCO3 solution buffer at pH 8.5 (Olsen et al.1954) and phosphorus in the extract was determined by ascorbic acid method (Watanabe and Olsen 1965), Available potassium was extracted by shaking with neutral normal ammonium acetate for 5 minutes (Hanway and Heidal 1952) and then K in the extract was estimated by flame photometer. The samples were categorized as per the rating limit given in Table 1.

Journal of Progressive Agriculture, Vol.3, No. 1: April 2012
29
Table 1: Limits for the soil test values used for rating the soil
Classification for pH values
Strongly acid Moderately acid Slightly acid Neutral <5.5 5.5-6.0 6.0-6.5 6.5-7.5
Classification for total soluble salt content (EC as dS m-1) No deleterious effect on
crop Critical for germination
Critical for salt sensitive crop
Injurious to most crops <1.0 1.0-2.0 2.0-3.0 >3.0
Parameters Low Medium High O.C. (%) 0.25-0.50 0.50-0.75 >0.75 Macronutrients Av. N (kg ha-1) <280 280-560 >560 Av. P (kg ha-1) <12.5 12.5-25 >25 Av. K (kg ha-1) <135 135-335 >335
RESULTS AND DISCUSSION
Soil reaction (pH): The Inceptisol samples of the study area were determined for pH (Table 2) and observed in the range of 4.7 - 7.50 with the mean value of 5.89. pH estimation from total 1003 soil samples of Baloda block and it was observed that nearly 38.98 % samples
under moderately acidic (5.5-6.0), 37.59 % under slightly acidic (6.0-6.5), 15.25 % under strongly acidic (<5.5) and only 8.18 % samples were categorized under neutral soil (Table 3). The relative low pH of the soils is due to low base saturation and light textured soil.
Table 2: Salient soil properties of study area Soil characteristics Range Mean S.D pH (1:2.5, Soil water) 4.7 - 7.50 5.89 0.42 E.C. (dS m-1) 0.05 - 0.37 0.13 0.04 O.C. (%) 0.23 - 0.83 0.44 0.10 Available N (kg ha-1) 112.9 - 338.69 185.16 34.10 Available P (kg ha-1) 4.13 - 23.35 8.86 4.10 Available K (kg ha-1) 104.27 - 481.15 212.62 48.70 Available Fe (mg kg-1) 4.54 - 68.70 30.18 14.64 Available Mn (mg kg-1) 3.72 - 59.58 26.08 9.88 Available Cu (mg kg-1) 0.2 - 8.78 2.79 1.37 Available Zn (mg kg-1) 0.06 - 3.34 0.68 0.45 Table 3: Limits for the soil test values used for rating the soil
Classification for pH values
Strongly acid Moderately acid Slightly acid Neutral 15.25 38.98 37.59 8.18
Classification for total soluble salt content (EC as dS m-1) No deleterious effect on crop Critical for germination Critical for salt sensitive crop Injurious to most crops
100 - - - Parameters Low Medium High O.C. (%) 78.36 19.54 2.09 Macronutrients Av. N (kg ha-1) 99.10 0.90 - Av. P (kg ha-1) 74.18 25.82 - Av. K (kg ha-1) 3.29 95.61 1.10

Journal of Progressive Agriculture, Vol.3, No. 1: April 2012
30
Salt concentration (EC) The total soluble salt content expressed as electrical conductivity (EC), varied from 0.05 to 0.37 dS m-1
with a mean value of 0.13 dS m-1 at 25oC (Table 2). The results have shown the EC values under normal range (<1.0 dS m-1). The normal EC may be ascribed to leaching of salts to lower horizons due to its light textured nature. Organic Carbon The organic carbon (OC) analyzed in all sampled Inceptisol exhibited in the range of 0.23 to 0.83 with a mean value of 0.44 % (Table 2). Thus, the Inceptisol of Baloda block is low in OC content. Distribution of soil samples with respect to organic C content indicates (Table 3) that about 78 % samples had low (<0.50 %) organic C, 20 % in medium (0.50-0.75%) and only 2 % samples had higher organic C (>0.75%). Use of almost nil to very low amount of organic wastes like farm yard manure and chemical fertilizers in imbalanced manner are the main reason for poor organic C resulted low productivity of the region. More over high temperature during summer (March to June) prevailing in the area may also be responsible for the rapid burning of organic matter, thus resulting in low organic C content of these soils. Since organic matter content is an indicator of available N status of soils, thus the soils of the area are also dominantly low in respect of their available N. Available N The available N content (Table 2) of Inceptisol ranged from 112.9 to 338.69 kg ha-1 with an average value of 185.16 kg ha-1. The majority of the sampled area (99.10 %) covering in Inceptisol of Baloda block fall under low status (<280 kg ha-1) in available N content (Table 3). Only 0.90% soil samples were categorized under medium (280-560 kg ha-1) status. In this way, almost all the soil samples tested were found to be deficient in N. It is fact that the available N analyzed by alkaline KMnO4 method as suggested by Subbiah and Asija (1956) do not exhibit the exact availability of N in dry soil. It is the measure of the oxidisable N in dry soil. It is quite obvious that being a mobile nature and low uptake recovery due to its losses through various mechanism like NH3 volatilization, nitrification, succeeding, denitrification, chemical and microbial fixation, leaching and runoff (De Datta and Buresh, 1989) residual/available N becomes poor in soil. Available P The available P varied from 4.13 to 23.35 kg ha-1 with a mean value 8.86 kg ha-1 in Inceptisol (Table 2). The study indicates that about 2/3rd of the sampled area exhibited low and 1/3rd under medium range of P content. Phosphorus is present in soil as solid phase with varying degree of solubility. When water soluble P is added to the soil, it is converted very quickly to insoluble solid phase by reacting with soil constituents. These may include calcium Cate (Olsen, 1953), Fe and Al oxides (Dean and Rubins, 1947 and Chu et.al.,
1962) and partly organic matter. The added P is more likely to be absorbed on hydrated Fe and Al oxides or on the edge of the clay minerals in neutral to acidic range of soils (Russell, 1988). These reactions affect the availability of P and as a result of these reactions, a very small amount of total P is present in soil solution at any time reflected by soil testing. However, a low to medium range of soils available P under study area may be mostly affected by past fertilization, pH, organic matter content, texture and various soil management and agronomic practices (Verma et al., 2005). Available K The available K content (Table 2) in Inceptisol ranged from 104.27 to 481.15 kg ha-1with an average value 212.62 kg ha-1. The data reveals that 95.61 % soil samples tested were in medium level of available K and only 3..29 % samples were tested under low range (Table 3). Adequate level of available K in Inceptisol of the study area may be attributed to the prevalence of K-rich clay minerals like illite and kaolinite. Relationship between soil properties and available macronutrients A significant positive correlation between available N and soil pH (r = 0.302**) was observed in this study as given in Table 4. This result indicates that available N increased with rise in pH from acidic to near neutral range. The availability of nitrogen becomes maximum at neutral soil reaction due to favorable microbial activity. The similar relationship was also found by Jain (1997). Available N resulted significant positive correlation with organic C (r = 0.578**) as presented in Table 4. Most of the soil nitrogen is estimated based on the organic matter present in the soil. There is a definite relation of organic C with available N because organic matter releases the mineralizable N in a proportionate amount present in the soil. Hence, organic carbon status of the soil can predict the available N which shows positive relationship. Kumar et al. (1995) also reported the identical results. Similarly, organic C level also markedly affects the soil N level and the results are in agreement with those of workers like Meena et al. (2006), Kumar et al. (2009), Sharma et al. (2008) and Kanthalia and Bhatt (1991). Available N showed a positive significant correlation with available P (r = 0.087**) while with that of available K exhibited positive but non-significant (r = 0.029) (Table 4). The positive relation among the major nutrients is the result of synergistic effects. Similar results were also reported by Kumar et al. (2009). A significant positive correlation was recorded between available P and pH (r = 0.251**). It is well established fact that P availability is strongly regulated by pH and since the Inceptisol under study had the pH trend in to the moderately acidic to neutral range. Hence, available P might be increased with rise in pH

Journal of Progressive Agriculture, Vol.3, No. 1: April 2012
31
level up to neutral range. Similar results were also reported by Singh and Singh (1985) in Beel soils of Assam. The relation between available P and organic C level could not exhibit the concurrent results. Kanthaliya and Bhatt (1991) have also recorded the similar results in soils of Mewar region of Rajasthan, respectively. A significant and positive correlation (r =0.306**) was found between available K and pH (Table 4). This may be attributed due to fact that the solubility of soil K enhanced by pH increment. Singh and Singh (1985) reported that a significant and positive correlation between available K and pH in Beel soils of Assam.
Similar results were obtained by Sharma et al. (2008) in Amritsar district. A significant positive correlation (r = 0.183**) was observed between organic C and available K content (Table 4). This might be due to creation of favorable soil environment with presence of high organic matter and release of potassium from organic complexes in soils solution. Similar results were also reported by Meena et al. (2006) and Sharma et al. (2008). A significant and positive correlation (r = 0.137**) was found between available K with soluble salt content (Table 4). Similar result was also observed by Sharma et al. (2008).
Table 4: Correlation coefficient (r) between physico-chemial properties and available N, P and K of Inceptisol of baloda block. PH EC OC N P K PH EC 0.507* OC 0.368* 0.234* N 0.302* 0.223* 0.578* P 0.251* 0.073** -0.005 0.087* K 0.306* 0.137* 0.183* 0.029 -0.112* *Significant at 1% level **Significant at 5% level It can be concluded from the results under study that the Inceptisol group of Baloda block in Janjgir-Champa district of Chhattisgarh is characterized under moderate to neutral in soil reaction, soluble salt content comes under safe limit for all crops. The organic carbon level exhibited low to medium. The Inceptisol of the area showed low in available N and P, and
medium level in available K. In general, the soil samples were tested sufficient in DTPA-extractable Fe, Mn and Cu. Whereas, Zn deficiency was observed in study area. Hence, the soils require attention regarding nutrient management practices and regular monitoring of soil health for better crop production.
REFERENCES
Black, C.A. 1965. Method of soil analysis American Agronomy Inc., Madison, Wisconsin, USA. pp.131-137.
Chu, C.R., Moschler, W.W. and Thomas, G.W. 1962. Rock phosphate transformation in acid soils. Soil Sci. Soc. Amer. Proc. 26: 471-478.
Dean, L.A. and Rubin, E.J. 1947. Anion Exchange in Soils. Exchangeable phosphorous and anion exchange capacity. Soil Sci. 63: 37-387.
De Datta, S.K. and Buresh, R.J. 1989. Integrated N management in irrigated rice. Adv. Agronomy 10: 143-169.
Goovaerts, P. 1998. Geo-statistical tools for characterizing the spatial variability of microbiological and physic-chemical soil properties. Biol. Fertil. Soil. 27: 315-334.
Hanway, J.J. and Heidel, H. 1952. Soil analysis methods as used in Iowa State. College soil testing laboratory. Bulletin. 57: 1-131.
Jain, S.C. 1997. Available macro and micro nutrient status in relation to their physico-chemical properties of I.G.K.V. Farm, Raipur. M.Sc.(Ag.) Thesis, I.G.K.V. Raipur (Chhattisgarh), pp.88-90.
Kanthalia, P.C. and Bhatt, P.L. 1991. Relation between organic carbon and available nutrients in some soils of sub-humid zone. J. Indian Soc. Soil Sci. 39:781-782.
Kumar, P., Sharma, S.P. and Sharma, P.D. 1995. Distribution at N, P and K in soan river valley soils of lower shiwaliks. J. Indian Soc. Soil Sci. 43 (3): 360-364.
Kumar, Rakesh, Sarkar, A.S., Singh, K.P., Agarwal, B.K. and Karmakar, S. 2009. Appraisal of available Nutrients status in Santhal Paraganas Rgion of Jharkhand. J. Indian Soc. Soil Sci. 57(3): 366-369.
Meena H.B., Sharma R.P. and Rawat U.S. 2006. Status of Macro and Micronutrients in some soils of Tonk District of Rajasthan. J. Indian Soc. Soil Sci. 54 (4): 508 -512.

Journal of Progressive Agriculture, Vol.3, No. 1: April 2012
32
Olsen, S.R., Cole, C.V., Watanabe, F.S. and Dean, L.A. 1954. Estimation of available phosphorus in soil by extraction with sodium bicarbonate. USDA, Circ. 939.
Olsen, S.R. 1953. Inorganic phosphorous in alkaline and calcareous soils In W.H Pierre and A.G Norman (ed. Soil and Fertilizer Phosphorous), Ame. Soc. Agron. Madison Wis., Agronomy 4: 81-122.
Piper, C.S. 1967. Soil and Plant analysis. Inter science publisher Inc., New York.
Russel, E.W. 1988. Recent advances in chickpea agronomy. Pages 89-96 in Proceeding of the International Workshop on Chickpea Improvement, 28 Feb-2 March, 1979, ICRISAT Centre, India. Patancheru , A.P. 502 324, India.
Sen, P., Majumdar, K. and Sulewski, G. 2008. Importance of spatial nutrient variability mapping to facilitate SSNM in small land holding systems. Indian J. Fert. 4(11): 43-50.
Sharma, P.K., Sood, Anil, Setia, R.K, Tur, N.S., Mehra, Deepak and Singh, Harpinder 2008.
Mapping of macronutrients in soils of Amritsar district (Punjab)- A GIS approach. J. Indian Soc. Soil Sci. 56(1):34-41.
Singh, R.K. and Singh, H.P. 1985. Nutrient status of Beel soils in Assam. J. Indian Soc. Soil Sci. 33(1): 175-176.
Subbiah, B.V. and Asija, G.L. 1956. A rapid procedure for the determination of available nitrogen in soil. Current Sci. 25: 259-260.
Verma, V.K., Patel, L.B., Toor, G.S. and Sharma, P.K. 2005. Spatial Distribution of Macronutrients in Soils of Arid Tract of Punjab, India. In. J. Agric. & Biology 7(2): 370- 372.
Walkley, A. and Black, C.A. 1934. An examination of the degtjareff method for determining the soil organic matter and a proposed modification of the chromic acid titration method. Soil Science 37: 29-38.
Watanable, F.S. and Olsan, S.R. 1965. Test of an ascorbic acid method for determining phosphorous in water and NaHCO3 extracts from soil. Soil Sci. Am. Proc. 29: 677-678.

Journal of Progressive Agriculture, Vol.3, No. 1: April 2012
33
Effect of Nitrogen and Phosphorus levels on Physiological, Biochemical parameters and Economics of Greengram in Eucalyptus tereticornis based Agrisilviculture system
K.S.AHLAWAT1, M.K.SINGH2, AVTAR SINGH3, O.P.LATHWAL1 AND V.K.SINGH4
1Krishi Vigyan Kendra, Kurukshetra, 2Department of Forestry,CCS HAU,Hisar, 3Regional Research Station, Bhatinda, PAU and 4Department of Agronomy,CCS HAU,Hisar-125001
ABSTRACT
A field experiment was conducted on sandy loam soil to study the response of various fertilizer levels on Vigna radiata (L.) in 5-6 year old Eucalyptus tereticornis sm. based agrisilviculture system. On the basis of average of two crop seasons, 32 and 24 % less photosynthesis, 40 and 51 % less transpiration, 33 and 31 % less stomatal conductance at 40 days after sowing and at harvest, respectively, were recorded under eucalypts sown greengram than sole greengram. Poor yield attributes of greengram under eucalypts resulted in 53 and 50 % reduction in grain and stover yield, respectively in greengram under Eucalyptus tereticornis as compared with sole greengram. Higher returns and cost/benefit ratio were recorded in agrisilviculture system than sole greengram.
Key words: Eucalyptus tereticornis, Vigna radiata, Stomatal conductance, Photosynthesis, Transpiration In, India, to maximize the production from per unit land area, trees and agricultural crops have been integrated in various forms. The importance of agroforestry for food, fuel, fodder, fruits, fertilizer, timber etc. and also in conservation of natural resources have been well recognized. Globally 46 % of agricultural land (over one billion hectares) has more than 10 % tree cover, while 17 % of farming land has more 30 % tree cover. This land with more than 10 % tree cover is occupied by 31 % of the people living in agricultural land (558 million) (Zomer et al, 2009). Eucalypts has more than 600 species, among which Eucalyptus tereticornis Smith are cultivated more among the farming communities in India. In north India there is large scale afforrestation of eucalypts along the canals, roadsides and farmers field on field bunds as well as in blocks. Block plantation of eucalypts has adverse effect on associated crops because being evergreen in nature, continues to compete for light, moisture and nutrient throughout the year and is also allelopathic in nature. Vigna radiata (L.) Wilczek commonly known as greengram is the most widely distributed of the six cultivated Asiatic Vigna species. The average yield of pulses including greengram is low because of its cultivation in soils of low in fertility, at prevailing intense heat and chronic moisture stress conditions. The strategy of fertilizer management is one of the important agronomic techniques for enhancing productivity and nitrogen and phosphorus play a pivotal role in the nourishment of greengram. The different authors reported variable performance of fertilizer requirement of crops in different agrisilviculture system (Osman et al., 1998 and Subrahmanyam, et al., 2001). The present study, therefore, was carried out to evaluate the optimum fertilizer requirement of greengram in eucalypts based agrisilviculture system and influence of fertilizer levels on physiological, biochemical parameters and
economics of greengram under Eucalyptus tereticornis based agrisilviculture system vis-à-vis sole crop.
MATERIAL AND METHODS
Present investigation was carried out at the research area of Agroforestry department, CCS Haryana Agricultural University, Hisar (20010/ N, 75046/E, 215 m above mean sea level), situated in the arid region of north-western India. The climate is subtropical-monsoonic with an average rainfall of 350-400 mm (70-80 percent of which occurs during July to September). The soil of the experimental fields was sandy loam in texture and available N, P, K were in low, medium and high range, respectively under both the agrisilviculture and sole cropping system. The total rainfall of 127 mm and 386 mm was received in entire growth period of crop during 2004 and 2005 respectively. Greengram was grown in a plot measuring 6 x 4 m during rainy season of 2004 and 2005 in between the rows of Eucalyptus tereticornis (planted in July, 1999 at a spacing of 6 x 2m ) and as sole crop (without eucalypts) in the field adjacent to eucalypts plantation. The eucalypts tree height was 12.38 m and 14.90 m, girth was 40.20 cm and 45.18 cm and canopy width 3.98 m and 4.09 m, respectively during July, 2004 and July, 2005. The experiment consisting of four fertilizer levels viz. F0 (control i.e. without fertilizer), F1 (75 percent of recommended dose of fertilizer i.e. 15 kg N + 30 kg P2O5/ha), F2 (100 percent of recommended dose of fertilizer i.e. 20 kg N + 40 kg P2O5/ha) and F3 (125 percent of recommended dose of fertilizer i.e. 25 kg N + 50 kg P2O5/ha), was laid out in randomized block design with four of replications with eucalypts and as sole crop. The recommended dose of fertilizer for greengram is 20 kg N + 40 Kg P2O5/ha. The entire amount of nitrogen and phosphorus was drilled at the time of sowing through urea (46 %) and single super phosphate (16%) respectively.

Journal of Progressive Agriculture, Vol.3, No. 1: April 2012
34
Green gram (cv. Asha) was sown in north-south direction on 6 July 2004 and 12 July 2005 by hand plough at a row spacing of 30 cm, using seed rate of 20 kg seed/ha in both the systems. The physiological parameters of greengram were recorded at various
growth stages in both the systems. The crop growth and relative growth rate were measured at 21-40, 41-60, 61-80 and 21-40, 41-60, 61-84 stages during 2004 and 2005, respectively and were calculated by using the following formula :
w2 - w1 CGR = –––––––––
t2 - t1
1 w2 – w1 RGR = –––– × ––––––––––
w1 t2 – t1 Where, w2 and w1 = Total dry matter at successive stages
t2 and t1 = Time interval Photosynthesis, transpiration and stomatal conductance were measured at 40 DAS (days after sowing) and at harvest of greengram with the help of portable steady photosynthetic apparatus (IRGA, CIRAS-1, PP system, U.K.). Photosynthesis, transpiration and stomatal conductance of fully expended leaves were recorded on clear sky day during 1100-1300 hours of day. Photosynthetic pigments were estimated according to the Hiscox and Isractstman (1979) using dimethyl sulphoxide (DMSO). Total soluble carbohydrates in grain were estimated by the colorimetrically method (Dubois et al., 1965). On the basis of nitrogen content in grains determined by Nessler’s reagent method (Linder, 1944), protein content was calculated by the following formula. Protein (%) = N (%) x 6.25 Cost of cultivation and gross income of various treatments were calculated on the basis of approved market rates for inputs and outputs. Net returns (Rs/ha) were worked out by subtracting the total cost of cultivation of each treatment from the gross income of the respective treatment. The cost and return of eucalypts based agrisilviculture system comprising of crop with life cycle of one growing season and eucalyptus with 8.5 years was computed for two experimental years on per hectare basis. The expected establishment and maintenance cost of eucalyptus was computed from the first year up to 8.5 years rotation of tree. The expected girth (60 cm) of the eucalyptus after 8.5 years was calculated on the basis of annual girth increment of 5 cm obtained during the course of experiment. The numbers of trees to be harvested (708) were calculated after taking into account 15 % mortality. The expected return from eucalyptus trees/ha was computed on the basis of market rates per tree (Rs.651) prevailing during December, 2005 and assuming the same rates after 8.5 years. Cost/benefit ratio was computed by, dividing discounted return by discounted cost. The experimental data collected during the course of investigation were subjected to statistical analysis by “Analysis of variance” technique by Fisher (1948) and Cochran and Cox (1959). Critical difference (CD at
5%) was worked out for differentiating the treatment effects from those of chance effects.
RESULTS AND DISCUSSION
Crop growth and relative growth rate Crop growth rate (CGR) as influenced by different fertilizer levels showed maximum CGR in greengram at 41-60 days interval and then decreased at harvest during both the years and in both the systems (Fig.1). In both the systems crop growth rate increased significantly with increase in fertilizer levels upto 75, 100 and 125 percent of recommended dose of fertilizer at 61-80 days, 21-40 days and 41-60 days interval, respectively. However, in sole greengram at 61-84 days interval, CGR increased significantly upto recommended dose of fertilizer during 2005. The maximum relative growth rate (RGR) of greengram crop was recorded at 21-40 days interval and then decreased upto harvest during both the years and in both the systems. RGR of greengram increased significantly with successive increase in fertilizer levels upto 75, 100 and 125 percent recommended dose of fertilizer at harvest, 21-40 days and 41-60 days interval, respectively in both the systems (Fig.2). However, in sole greengram at 41-60 days interval it increased significantly upto recommended dose of fertilizer during 2005. Sharma et al. (2003) reported that single and combined application of nitrogen and phosphorus led to substantial increase in crop growth, relative growth rate and photosynthetic efficiency at various stages of crop growth in greengram crop. Fertilizer application had positive effect on all the growth parameters of greengram both in agrisilviculture system and sole greengram during both the years. The beneficial effect increased with increase in fertilizer levels; however, the differences between successive fertilizer levels were not significant at some crop stages. At low levels of nitrogen, plants might have not received sufficient nitrogen, which ultimately resulted in stunted growth. At higher levels of N, crop absorbed sufficient amount of N resulting in better growth. With adequate supply of nitrogen and phosphorus, crop synthesized more carbohydrates

Journal of Progressive Agriculture, Vol.3, No. 1: April 2012
35
which were rapidly converted into proteins. These proteins, in turn are required for the formation of protoplasm resulting in more cell division and cell enlargement and favourable improvement in the growth of crop. Photosynthetic pigments, photosynthesis, transpiration and stomatal conductance Total chlorophyll and carotenoid content in greengram increased with the advancement of crop growth upto 60 DAS and thereafter showed a drastic decline at harvest in both the systems (Fig.3). At all crop growth stages except 20 DAS total chlorophyll and carotenoid content increased significantly with successive fertilizer levels upto recommended dose of fertilizer in both the systems. Patidar and Mali (2004) reported that application of 100 percent recommended dose of fertilizer significantly increased chlorophyll content in sorghum as compared to lower levels. Total chlorophyll and caroteniod content was less in agrisilviculture system as compared to sole greengram. On the basis of average of two crop seasons, 29.0 percent less chlorophyll and 25.6 percent less caroteniod contents at harvest were recorded under eucalypts sown greengram as compared to sole greengram. The rate of photosynthesis, transpiration and stomatal conductance was higher at early stages of crop growth as compared to maturity stage in both the systems (Fig.4). Photosynthesis, transpiration and stomatal conductance were more in the sole greengram as compared to the agrisilviculture system at both stages (40 DAS and at harvest). The rate of photosynthesis, transpiration and stomatal conductance increased significantly with increase in fertilizer levels upto recommended dose of fertilizer at 40 DAS and at harvest in both the systems. The positive response of these physiological characters to fertilizer particularly nitrogen application was due to its favorable effect on cell enlargement resulting in production of larger leaves which increased the photosynthetic area of plant canopy. On the basis of average of two crop seasons, 32 and 24 percent less photosynthesis, 40 and 51 percent less transpiration, 33 and 31 percent less stomatal conductance at 40 DAS and at harvest, respectively, were recorded under eucalypts sown greengram than sole greengram. Devasagayam and Ebenezar (1996) also reported lower stomatal conductance, transpiration rate and leaf temperature under Eucalyptus tereticornis grown crops (sorghum, cowpea, groundnut and blackgram) than the sole crops. The reduction in the physiological parameters under agrisilviculture was mainly due to reduced sunlight, competition for moisture and nutrients. The higher physiological efficiency of green in terms of higher photosynthesis rate, stomatal conductance, transpiration rate and chlorophyll content under
unshaded (control) conditions may be attributed mainly to more amount of PAR for longer duration. Protein content and total soluble carbohydrates In agrisilviculture system, protein content and total soluble carbohydrate content of greengram grains increased significantly only upto 75 percent of recommended dose of fertilizer, whereas in sole greengram, fertilizer levels had no effect on protein and total soluble carbohydrate content in greengram grain (Table-1) Grain yield and stover yield The grain and stover yield which are reflection of all the growth and yield attributes characters increased significantly with increase in fertilizer levels upto recommended dose of fertilizer during both the years in both the systems (Table-2). Increase in growth and yield attributes of greengram with the application of N and P has also been reported by Srinivas et al. (2002) and Singh et al. (2004). Further 25 percent increase in fertilizer levels did not produce significant difference in grain and stover yield over recommended dose of fertilizer. Favourable response of greengram to nitrogen and phosphorus application might be attributed to the fact that nitrogen application helps to meet the nitrogen requirement of plant until the time it fixes its own nitrogen (Bachchhav et al., 1994) and beneficial effect of phosphorus on nodulation (Singh et al., 1999). The combined application of these nutrients resulted in better vigour and superior yield attributes which ultimately produced more yield of greengram. Sharma et al. (2001) observed increase in biological yield and harvest yield of greengram with the application of fertilizer upto 20 kg N + 60 kg P2O5 ha-1. The seed yield is the ultimate objective of crop production, which depends upon source-sink relationship and also on different components of source (leaf area, number of branches and dry matter accumulation before anthesis) and sinks (pods per plant, seed per pod, 1000-seed weight and ultimately the seed yield per plant). In general superior growth and yield attributes was recorded during the second year due to higher (386 mm) rainfall than first year (127 mm) of experimentation. Poor yield attributes of greengram, resulted in 53 and 50 percent reduction in grain and stover yield, respectively in greengram under Eucalyptus tereticornis as compared with sole greengram. Vinayarai et al. (1990) also observed a yield reduction of 35 percent in sorghum and 17 percent in pearlmillet when grown as intercrops with eucalypts.
Economics Gross returns increased with increase in fertilizer doses with highest gross return of Rs. 67001 and Rs. 25449/ha recorded at 125 percent recommended dose of fertilizer in eucalypts based agrisilviculture and sole greengram, respectively (Table-3). Under both the land

Journal of Progressive Agriculture, Vol.3, No. 1: April 2012
36
use systems, maximum net returns and B/C ratio were recorded at recommended dose of fertilizer level. Higher returns and cost/benefit ratio were recorded in agrisilviculture system than sole greengram. This might be attributed to good average yearly income from eucalypts trees despite net loss from intersown crops. Similar findings have been reported by Pant and Bana (1998) in urd bean. Kumar (2006) also reported higher net returns from eucalypts + wheat than wheat alone.
From the above study it may be concluded that in eucalypts based agroforestry system, there may be loss in terms of crop yield but the loss is well compensated by the sale of eucalypts at the end of rotation. The maximum yield potential of greengram in combination with 5-6 years old eucalypts and as sole greengram could be achieved with the application of 100 percent of recommended fertilizer dose i.e. 20 kg N + 40 kg P2O5/ha.
Table 1: Effect of fertilizer levels on protein content (%) and total soluble carbohydrate content (%) of greengram
Treatments Protein content (%) Total soluble carbohydrate content (%) (Kg N + Kg P2O5
/ha)
Agrisilviculture Sole Greengram Agrisilviculture Sole Greengram
F0 (control) 23.45 21.67 60.07 59.97 F1 ( 15 + 30) 24.63 22.35 60.30 60.13 F2 ( 20 + 40) 25.11 22.51 60.38 60.28 F3 ( 25 + 50) 25.66 22.66 60.41 60.38 CD (P=0.05) 0.98 N.S. 0.17 N.S.
NS-Non-significant Table 2. Effect of fertilizer levels on grain and stover yield (kg/ha) of greengram in agrisilviculture and as sole greengram (pooled data of 2004 and 2005)
Treatments
(Kg N + Kg P2O5 /ha
Grain yield (kg/ha) Stover yield (kg/ha)
Agrisilviculture Sole greengram Agrisilviculture Sole greengram F0 (control) 407 1019 1212 2859
F1 ( 15 + 30) 583 1237 1720 3440 F2 ( 20 + 40) 640 1304 1881 3687 F3 ( 25 + 50) 663 1321 1986 3788 CD (P=0.05) 32 59 118 209
Table 3: Economics of greengram grown with Eucalyptus tereticornis and as sole crop influenced by various fertilizer levels (pooled data of 2004 and 2005) Agrisilviculture Sole greengram
Treatments (Kg N + Kg
P2O5 /ha)
Gross returns
(Rs. ha-1)
Cost of cultivation (Rs.ha-1)
Net returns (Rs.ha-1)
Cost/ benefit ratio
Gross returns
(Rs. ha-1)
Cost of cultivation (Rs.ha-1)
Net returns (Rs.ha-1)
Cost/benefit ratio
F0 (control) 62075 31690 30385 1:1.95 19636 15322 4314 1:1.28 F1 ( 15 + 30) 65443 32527 32916 1:2.00 23817 16208 7609 1:1.47 F2 ( 20 + 40) 66411 32845 33566 1:2.02 25109 16454 8655 1:1.52 F3 ( 25 + 50) 67001 33480 33521 1:1.99 25449 16828 8621 1:1.50 Mean 65232 32636 32596 1:1.99 23503 16203 7300 1:1.44
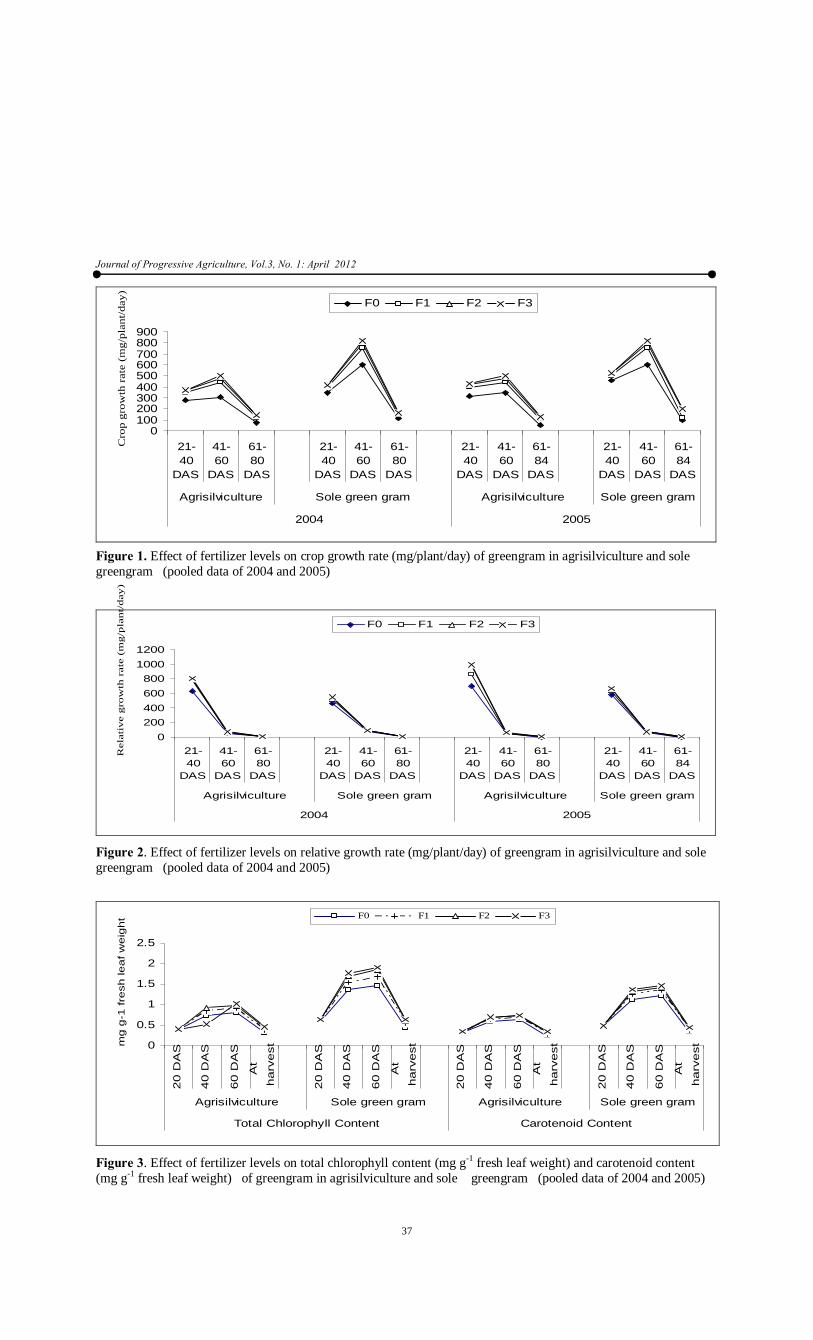
Journal of Progressive Agriculture, Vol.3, No. 1: April 2012
37
0100200300400500600700800900
21-40
DAS
41-60
DAS
61-80
DAS
21-40
DAS
41-60
DAS
61-80
DAS
21-40
DAS
41-60
DAS
61-84
DAS
21-40
DAS
41-60
DAS
61-84
DAS
Agrisilviculture Sole green gram Agrisilviculture Sole green gram
2004 2005
Cro
p gr
owth
rat
e (m
g/pl
ant/
day) F0 F1 F2 F3
Figure 1. Effect of fertilizer levels on crop growth rate (mg/plant/day) of greengram in agrisilviculture and sole greengram (pooled data of 2004 and 2005)
0200400600800
10001200
21-40
DAS
41-60
DAS
61-80
DAS
21-40
DAS
41-60
DAS
61-80
DAS
21-40
DAS
41-60
DAS
61-80
DAS
21-40
DAS
41-60
DAS
61-84
DAS
Agrisilviculture Sole green gram Agrisilviculture Sole green gram
2004 2005
Rel
ativ
e g
row
th r
ate
(mg
/pla
nt/
day
)
F0 F1 F2 F3
Figure 2. Effect of fertilizer levels on relative growth rate (mg/plant/day) of greengram in agrisilviculture and sole greengram (pooled data of 2004 and 2005)
0
0.5
1
1.5
2
2.5
20
DA
S
40
DA
S
60
DA
S
At
ha
rve
st
20
DA
S
40
DA
S
60
DA
S
At
ha
rve
st
20
DA
S
40
DA
S
60
DA
S
At
ha
rve
st
20
DA
S
40
DA
S
60
DA
S
At
ha
rve
st
Agrisilviculture Sole green gram Agrisilviculture Sole green gram
Total Chlorophyll Content Carotenoid Content
mg
g-1
fre
sh le
af
we
igh
t F0 F1 F2 F3
Figure 3. Effect of fertilizer levels on total chlorophyll content (mg g-1 fresh leaf weight) and carotenoid content (mg g-1 fresh leaf weight) of greengram in agrisilviculture and sole greengram (pooled data of 2004 and 2005)

Journal of Progressive Agriculture, Vol.3, No. 1: April 2012
38
02468
10121416
40 DAS At harvest 40 DAS At harvest
Agrisilviculture Sole greengram
Photosynthesis
µ m
ol
CO
2 m
-2 s
-1
F0 F1 F2 F3
0
0.5
1
1.5
2
2.5
40 DAS At harvest 40 DAS At harvest
Agrisilviculture Sole greengram
Transpiration
m m
ol H
2O m
-2 s
-1
F0 F1 F2 F3
05
1015202530354045
40 DAS At harvest 40 DAS At harvest
Agrisilviculture Sole greengram
Stomatal conductance
mol
m-2
s-1
F0 F1 F2 F3
Figure 4. Effect of fertilizer levels on photosynthesis (µ mol CO2 m-2 s-1), transpiration (m mol H2O m-2 s-1) and stomatal conductance (mol m-2 s-1) of greengram in agrisilviculture and sole greengram (pooled data of 2004 and 2005)
Journal of Progressive Agriculture, Vol.3, No. 1: April 2012
39
REFERENCES Bachchhav, S. M., Yadav, A. S., Naidu, T. R.V. and Bachchhav, M. 1994. Effect of irrigation and nitrogen on leaf area, nodulation and dry matter production in summer greengram. J. Maharasthra Agric. Univ. 19 (2):211-213.
Cochran, W.C. and Cox, G.M. 1959. Experimental Designs. Asia Publishing House, Bombay.
Devasagayam, M. M. and Ebenezar, E. G. 1996. Physiological changes of arable crops under Eucalyptus ecosystem. Journal of Ecobiology. 8(2):149-152.
Dubois, M., Gilles, K. A., Hamilton, J. K., Roberts, P. A. and Smith, F. 1956. A colorimetric method for determination of sugars and related substances. Analytic Chemistry. 28:350-356.
Fisher, R. A. 1948. Statistical methods for research workers. Ed.10. Oliver and Boyd, Edinburg and London.
Hiscox, J. D. and Isractstman, G. F. (1979). A method for the extraction of chlorophyll from leaf tissue without maceration. Can. J. Bot. 57:1332-1334.
Kumar, A. 2006. Effect of irrigation and fertilizer levels on wheat (Triticum aestivum L.) production in Eucalyptus tereticornis Sm. based agrisilviculture system. Ph.D. Thesis, CCS HAU, Hisar, Deptt. of Forestry.
Linder, R. C. 1944. Rapid analytical methods for some of the more common inorganic constituents of plant tissue. Plant Physiol. 19: 76-89.
Osman, M., Emminhgm, W.H. and Sharrrow, G.H. 1998. Growth and yield of sorghum and cowpea in an agrisiliviculture system in semi-arid India. Agroforestry systems. 42:91-105.
Pant A.K. and Bana, O.P.S. 1998. Crop productivity of wheat (Triticum aestivum) and urd (Phaseolus mungo) under plantation crops. Ind. J. Forestry. 21 (3): 238-241.
Patidar, M. and Mali, A.L. 2004. Effect of farmyard manure, fertility levels and bio-fertilizers on growth, yield and quality of sorghum (Sorghum bicolor). Indian J. Agron. 49 (2):117-120.
Sharma, S., Daramwal, N. S., Sharma, C. R., Upadhyay, R. G. and Sharma, S. 2001. Influence of various doses of nitrogen and phosphorus on protein content, yield and its attributes of mungbean (Vigna radiata (L.) Wilczek) Res. Crops. 2 (2):108-111.
Sharma, S., Upadhyay, R. G., Sharma, C. R. and Rameshwar 2003. Response of various levels of nitrogen and phosphorus application on growth, physiological parameters and yield of Vigna raiata (L.) Wilczek under rainfed and mid-hill conditions of Himachal Pradesh. Indian J. Agric. Res. 37 (1):52-55.
Singh, M., Sekhon, H. S. and Singh, J. 2004. Response of summer mungbean (Vigna radiata L.Wilczek) genotypes to different phosphorus levels. Environmental and Ecology. 22:13-17.
Srinivas, M., Mohammad, S. and Mohammad, S. 2002. Performance of greengram (Vigna radiata L. Wilczek) and response functions as influenced by different levels of nitrogen and phosphorus. Crop Research Hisar. 24(3):458-462.
Subrahmanyam, M. V. R., Sridevi, S., Radhika, K. and Bheemaiah, G. 2001. Studies on different crop management practices in Hardwickia binata based agroforestry system in dry lands. Indian Journal of Dryland Agricultural Research and Development. 16(1): 73-77.
Vinayarai, R. S., Swaminathan, C. and Surendran, C. 1990. Studies on inter-cropping with coppice shoots of Eucalyptus tereticornis. Journal of Tropical Forest Science. 3 (2):97-100.
Zomer, R.J; Trabucco, A, Coe, R and Place, F. 2009.Trees on farm. Analysis of global extent and geographical patterns of agroforestry.ICRAF.Working paper no.89.Nairobi Kenya.World Agroforestry Centre.

Journal of Progressive Agriculture, Vol.3, No. 1: April 2012
40
Interaction effect of nitrogen levels and stages of nitrogen application on grain and malt yield of malt barley (Hordeum vulgare L.)
JASVINDER SINGH1, S.S MAHAL2, S.S MANHAS3
Extension Specialist (Agronomy), PAU, FASS, Patiala1. Professor of Agronomy, Division of Agronomy, PAU, Ludhiana2, Assistant Agronomist, PAU, Regional Research Station, Batinda3
Email: [email protected]
ABSTRACT
A field experiment was conducted during 2006-07 and 2007-08 at Ludhiana to study the interaction effect of nitrogen levels and stages of nitrogen application on grain and malt yield of malt barley (Hordeum vulgare L.).Interaction effect of nitrogen levels and stages of nitrogen application on emergence count at 15 days after sowing and days taken for initiation and completion of emergence was found to be non-significant during both the years. Interactions effect of nitrogen levels and stages of nitrogen application on height and dry matter accumulation of plant at all stages of growth was also found to be non-significant during both the years. Although the maximum height and dry matter accumulation of plant at all stages of growth were found with 125 % of recommended N applied at three splits (50 % before sowing + 25 % at tillering + 25 % at booting stage) during both the years. 125 % of recommended N applied at three splits (50 % before sowing + 25 % at tillering + 25 % at booting stage) gave more grain and malt yield than all other treatment combinations during both the years. The recommended dose of nitrogen is 62.5 kg/ha. The interaction effects of nitrogen levels and stages of nitrogen application on N, P and K, concentration in grain and straw of malt barley were non-significant during both the years.
Key words: Grain, Interaction, Nitrogen, Malt barley and Malt yield. In India barley (Hordeum vulgare L.) is an important cereal crop in winter after wheat in both area and production. Due to its hardy nature, barley is successfully cultivated in adverse agro-environments like drought, salinity, alkalinity etc. in varied topographical condition like plains and hilly areas under rainfed and irrigated conditions. It is usually used as food for human beings and feed for animals and poultry. Consumption of barley is reported to reduce the cholesterol level in liver and plasma by inhibiting the rate limiting hepatic enzyme β-hydroxyl, β- methyl glutaryl CoA reductase. It also stimulates fatty acid synthesis in liver [1].It is also a valuable input for industries for extracting malt to be utilized for brewing, distillation, baby foods, coca malt drinks and ayurvedic medicines. The barley grains per 100 g comprises 10.6 g protein, 2.1 g fat, 64 g carbohydrate, 50 mg calcium, 6.0 mg iron, 0.31 mg vitamin B1, 0.10 mg vitamin B2 and 50 μg folate [2]. It is preferred over other cereals for malting purpose because of its glumes and hulls firmly cemented to the kernel, which remain attached to the grain after threshing. Hull protects the coleoptiles from damage during processing, as coleoptiles grows and elongates under the hull. Hull also acts as a filter for separation of soluble materials. The agronomic practices for malt grade barley are different from its grain crop. Nitrogen levels and stage of nitrogen application greatly affect the grain and malt yield of barley. Nitrogen is the most important element for realizing potential yield of crops. It is an integral part of chlorophyll, which is the primary absorber of light energy, needed for reduction of carbon dioxide to
produce assimilates by the process of photosynthesis. Assimilates are reflected in terms of yield. Nitrogen is the main constituent of amino acids which are precursor to protein. Moreover high protein content in grain is undesirable, because malt extract is inversely related to grain protein content [3]. Time of nitrogen application is an important cultural practice for realizing potential Nitrogen levels and stages of nitrogen application and production of barley yield of crop. Application of full dose of nitrogen at sowing may not be able to meet the nutritional requirements of the crop up to maturity and may result in lower yield and nitrogen content in grain. While split application of nitrogen may increase protein content of grain, thereby resulting in less malt recovery.[4] reported that two split application of N (1/3 at sowing + 2/3 at first irrigation) had higher value of yield components and resulted significantly higher grain yield (24.4 q/ha) over three splits (1/3 at sowing, 1/3 after first irrigation and 1/3 after second irrigation), but the protein content was significantly higher with 3 splits of nitrogen. Thus optimum application of nitrogen is required for production of malt barley. Keeping in view the above facts, a study on interaction effect of nitrogen levels and stages of nitrogen application on yield and quality of malt barley was conducted under Punjab condition.
MATERIALS AND METHODS
The field experiments were carried out at research farm, department of agronomy, Punjab Agricultural University, Ludhiana during rabi 2006-07 and 2007-

Journal of Progressive Agriculture, Vol.3, No. 1: April 2012
41
08. Ludhiana is situated at 30o 56' N latitude, 75o
52' E longitude and altitude of 247 m above mean sea level. Soil of experiment field was loamy sand in texture with normal soil reaction and electrical conductivity, low in organic carbon and available nitrogen, medium in available phosphorus and potassium. Treatments comprised of three nitrogen levels (100, 125, and 150% of recommended) and three stages of nitrogen application (100% before sowing; 50 % before sowing + 50 % at maximum tillering; 50 % before sowing + 25 % at tillering + 25 % at booting stage). The recommended dose of nitrogen was 62.5 kg/ha. Experiment was laid out in split-plot design Nitrogen levels and stages of nitrogen application and production of barley with three replications. Sowing was done at row spacing of
22.5cm. A uniform basal dose of 30 kg P2O5/ha in the form of super phosphate and 15 kg K2O/ha in the form of murate of potash were applied before sowing. Quantity and stage of nitrogen application was done as per treatments in the form of urea. Field was ploughed twice with a tractor drawn disc harrow and twice with a cultivator followed by planking. Growth parameters were recorded at the interval of 30 days. Crop harvested on 24 and 28 March respectively during 2006-07 and 2007-08 and threshed with the help of a thresher. The grain yield of net plot was converted into q/ha. Malting of barley grains were carried out as per the method suggested by [5]. N, P and K concentration in grain and straw of barley were estimated at harvest stage.
Table 1. Effect of nitrogen levels and stages of nitrogen application on Initiation of emergence, complete emergence and emergence count (15 days after sowing) of malt barley
Treatment Days taken for Initiation of emergence
Days taken for complete emergence
Emergence count/ m2
(15 days after sowing) 2006-07 2007-08 2006-07 2007-08 2006-07 2007-08 Nitrogen levels (% of recommendation*)
100 4.2 4.3 9.7 9.8 156.7 158.8 125 4.1 4.2 8.3 8.5 165.8 163.8 150 4.0 4.0 8.2 8.2 165.7 163.5
CD(p=0.05) NS NS NS NS NS NS Stages of N application
S1 3.8 4.0 8.2 8.4 163.0 162.8 S2 3.9 4.1 9.0 9.0 162.9 161.9 S3 4.6 4.7 9.0 9.1 162.3 161.5
CD(p=0.05) NS NS NS NS NS NS * 62.5 kgha-1 ; S1-100% before sowing; S2-50 % before sowing + 50 % at maximum tillering;S3-50 % before sowing + 25 % at tillering + 25 % at booting stage; Interaction effect non-significant Table 2. Effect of nitrogen levels and stages of nitrogen application on periodic plant height of malt barley
Plant height (cm) Treatment 30 DAS 60 DAS 90 DAS 120 DAS At harvest
2006-07 2007-08 2006-07 2007-08 2006-07 2007-08 2006-07 2007-08 2006-07 2007-08 Nitrogen levels (% of recommendation*)
100 26.1 25.2 37.8 36.8 51.0 47.7 84.2 89.2 93.5 86.6 125 27.3 26.7 40.8 39.9 56.1 52.8 99.9 95.0 99.3 102.3 150 28.5 27.2 42.9 42.0 58.4 55.1 103.9 98.6 103.7 106.3
CD(p=0.05) 1.8 1.5 2.7 2.6 3.7 2.4 4.0 3.5 3.2 3.4 Stages of N application
S1 28.3 27.3 40.6 39.7 51.3 49.4 89.2 88.0 94.0 91.6 S2 26.3 25.4 41.0 40.1 57.1 52.4 94.9 95.9 99.8 97.3 S3 27.3 26.4 39.8 39.0 57.2 53.8 103.9 98.9 102.6 106.3
CD(p=0.05) NS NS NS NS 4.6 1.5 3.7 2.6 2.5 2.8 * 62.5 kgha-1 ; S1-100% before sowing; S2-50 % before sowing + 50 % at maximum tillering;S3-50 % before sowing + 25 % at tillering + 25 % at booting stage; Interaction effect non-significant

Journal of Progressive Agriculture, Vol.3, No. 1: April 2012
42
Table 3. Effect of nitrogen levels and stages of nitrogen application on periodic dry matter accumulation of malt barley
Dry matter accumulation (g/ m2) Treatment 30 DAS 60 DAS 90 DAS 120 DAS At harvest
2006-07 2007-08 2006-07 2007-08 2006-07 2007-08 2006-07 2007-08 2006-07 2007-08
Nitrogen levels (% of recommendation*)
100 50.5 49.6 169.4 168.1 451.5 429.4 898.1 838.2 954.4 880.1 125 56.0 55.0 185.7 185.1 531.8 502.7 1050.2 990.2 1105.1 1031.1 150 60.7 59.8 199.9 198.6 574.6 552.9 1084.1 1024.2 1142.3 1061.3
CD(p=0.05) 0.9 2.6 6.2 7.1 19.6 20.9 20.6 17.1 30.0 27.1 Stages of N application
S1 57.5 56.5 186.8 185.5 499.9 478.2 977.8 917.8 1032.6 959.0 S2 52.9 52.0 190.8 189.6 520.9 499.2 1018.6 958.7 1075.4 1001.8 S3 56.8 55.8 177.3 176.7 537.2 507.7 1036.7 976.1 1093.8 1020.2
CD(p=0.05) NS NS 9.9 8.6 NS NS 21.8 43.4 32.1 40.3 * 62.5 kgha-1 ; S1-100% before sowing; S2-50 % before sowing + 50 % at maximum tillering;S3-50 % before sowing + 25 % at tillering + 25 % at booting stage; Interaction effect non-significant Table 4. Interaction effect of nitrogen levels and stages of nitrogen application on grain yield (q/ha) of malt barley during 2006-07
Stages of N application
Nitrogen levels (% of recommendation*)
Mean
100 125 150 S1 32.8 35.3 36.5 34.8 S2 36.8 42.6 46.0 41.8 S3 40.7 48.4 49.5 46.2
Mean 36.8 42.1 44.0 CD(p=0.05) Nitrogen levels (L) = 2.5;Nitrogen application stages (S) = 1.7; L X S = 2.9; * 62.5 kgha-1 ; S1-100% before sowing; S2-50 % before sowing + 50 % at maximum tillering;S3-50 % before sowing + 25 % at tillering + 25 % at booting stage Table 5. Interaction effect of nitrogen levels and stages of nitrogen application on grain yield (q/ha) of malt barley during 2007-08
Stages of N application
Nitrogen levels (% of recommendation*)
Mean
100 125 150 S1 35.6 41.3 39.9 39.0 S2 41.9 46.9 53.1 47.3 S3 45.4 51.7 51.9 49.7
Mean 41.0 46.6 48.3 CD(p=0.05) Nitrogen levels (L) = 3.3;Nitrogen application stages (S) = 2.1; L X S = 3.6; * 62.5 kgha-1 ; S1-100% before sowing; S2-50 % before sowing + 50 % at maximum tillering;S3-50 % before sowing + 25 % at tillering + 25 % at booting stage

Journal of Progressive Agriculture, Vol.3, No. 1: April 2012
43
Table 6. Interaction effect of nitrogen levels and stages of nitrogen application on malt yield (q/ha) of malt barley during 2006-07
Stages of N application
Nitrogen levels (% of recommendation*)
Mean
100 125 150 S1 28.4 28.5 28.8 28.6 S2 31.2 34.6 37.2 34.3 S3 33.5 40.8 40.7 38.3
Mean 31.0 34.6 35.6 CD(p=0.05) Nitrogen levels (L) = 2.6;Nitrogen application stages (S) = 1.5; L X S = 3.6; * 62.5 kgha-1 ; S1-100% before sowing; S2-50 % before sowing + 50 % at maximum tillering;S3-50 % before sowing + 25 % at tillering + 25 % at booting stage Table7. Interaction effect of nitrogen levels and stages of nitrogen application on malt yield (q/ha) of malt barley during 2007-08
Stages of N application
Nitrogen levels (% of recommendation*)
Mean
100 125 150 S1 29.9 33.1 31.3 31.4 S2 35.1 38.5 43.1 38.9 S3 37.5 43.4 42.7 41.2
Mean 34.1 38.3 39.0 CD(p=0.05) Nitrogen levels (L) = 2.6;Nitrogen application stages (S) = 1.6; L X S = 2.8; * 62.5 kgha-1 ; S1-100% before sowing; S2-50 % before sowing + 50 % at maximum tillering;S3-50 % before sowing + 25 % at tillering + 25 % at booting stage Table 8. Effect of nitrogen levels and stages of nitrogen application on nutrients concentration (%) in grain and straw of malt barley
Treatment
Nitrogen
Phosphorus
Potassium
Grain Straw Grain Straw Grain Straw
2006-07
2007-
08
2006-
07
2007-
08
2006-
07
2007-
08
2006-
07
2007-
08
2006-
07
2007-
08
2006-
07
2007-
08 Nitrogen levels (% of recommendation*)
100 1.69 1.59 0.38 0.38 0.29 0.27 0.25 0.37 0.54 0.45 1.58 2.00 125 1.77 1.68 0.39 0.39 0.30 0.28 0.26 0.38 0.57 0.47 1.67 2.06 150 1.86 1.74 0.40 0.40 0.31 0.29 0.27 0.39 0.59 0.49 1.70 2.08
CD(p=0.05) 0.07 0.05 0.01 0.01 NS NS NS NS 0.01 0.01 NS NS Stages of N application
S1 1.69 1.53 0.37 0.37 0.27 0.25 0.23 0.34 0.54 0.44 1.52 1.93 S2 1.79 1.68 0.39 0.39 0.30 0.28 0.26 0.38 0.57 0.47 1.65 2.04 S3 1.84 1.79 0.41 0.41 0.33 0.32 0.29 0.42 0.60 0.50 1.78 2.17
CD(p=0.05) 0.05 0.03 0.01 0.01 0.02 0.01 0.02 0.02 0.02 0.014 0.06 0.05 * 62.5 kgha-1 ; S1-100% before sowing; S2-50 % before sowing + 50 % at maximum tillering;S3-50 % before sowing + 25 % at tillering + 25 % at booting stage; Interaction effect non-significant
RESULTS AND DISCUSSIONS
Growth characters Emergence is one of the most important factor for determining the establishment and growth of the crop. Emergence count at 50 days after sowing of barley did not influence with levels and stages of N application during both the years of study. Although maximum emergence count at 50 days after sowing of barley was observed with 150 % of recommended N followed by
125 and 100% of recommended N during both the years. Maximum emergence count at 50 days after sowing of barley was observed with single application (100 % before sowing) followed by two splits application (50% before sowing +50% at maximum tillering) and three split (50% before sowing + 25% at tillering and 25% at booting) during 2006-07 and 2007-08, years of crop growth. Interaction effects

Journal of Progressive Agriculture, Vol.3, No. 1: April 2012
44
were of nitrogen levels and stages of N application on Nitrogen levels and stages of nitrogen application and production of barley emergence count at 50 days after sowing of barley were non-significant during both the years. Nitrogen levels and stages of N application did had non-significant affect on days taken for initiation and completion of emergence during both the years. All the interaction effects were non-significant. Although less days were taken for initiation and completion of emergence of barley with150 % of recommended N followed by 125 and 100% of recommended N during both the years. The application of 100 % N at before sowing also result less days for initiation and completion of emergence followed by two splits application (50% before sowing +50% at maximum tillering) and three split (50% before sowing + 25% at tillering and 25% at booting) during 2006-07 and 2007-08, years of crop growth. Interactions effects of nitrogen levels and stages of N application on days taken for initiation and completion of emergence were also found to be non-significant during both the years. Increase in nitrogen dose from 100 to 150% of recommended dose, increased plant height and dry matter accumulation at all the stages of crop growth during both the years of crop season. The maximum plant height and dry matter accumulation were observed with 150% of recommended N and lowest with 100% of recommended nitrogen. [6] found similar result that plant height and dry matter accumulation increased significantly with each successive increase in N level up to 90 kg /ha. The plant height and dry matter accumulation were similar with different stages of N application at 30 and 90 DAS during both the years of crop growth. However, there after plant height and dry matter accumulation were more with three split application of N (50% before sowing + 25% at tillering and 25% at booting) as compared to two split( 50%before sowing + 50%at maximum tillering) and single application (100% before sowing) during both the years of barley season. The split application of N showed synchronism of nitrogen demand with growth of plant which result more height and dry weight of plant. [7] reported the highest plant height and dry matter with three split. Interactions effect of nitrogen levels and stages of nitrogen application on height and dry matter accumulation of plant at all stages of growth was found to be non-significant during both the years.
Yield
The highest grain yield was obtained with 150% of recommended N, which was statistically at par with 125% of recommended N and significantly higher than 100% of recommended N during 2006-07 and 2007-08, years of crop growth. [8] reported a significant increase in grain yield from 38.4 q/ ha to 42.2 q/ ha with the increased in application of nitrogen from 60 to 100 kg/ha. Time of N application significantly affected the grain yield during both the years. The highest grain
yield was obtained with three splits (50% before sowing +25% at tillering+25% at booting), which was significantly higher than two splits (50% before sowing +50% at maximum tillering) and single application (100% before sowing )during 2006-07 and 2007-08, years of crop growth. This might be ascribed to better growth and development of barley crop in three and two splits than whole of nitrogen application before sowing. [9] reported similar result that split application of N gave the higher grain yield. The interactions effects of nitrogen levels and time of application on grain yield of barley were significant during both the years of crop growth. Three splits (50% before sowing +25% at tillering+25% at booting) application with 150% of recommended N gave significantly higher grain yield, which was statistically at par with three splits (50% before sowing +25% at tillering+25% at booting) with 125% of recommended N and statistically higher than all other Nitrogen levels and stages of nitrogen application and production of barley treatments. However, three splits (50% before sowing + 25% at tillering + 25% at booting) with 125% of recommended N also gave grain yield, which was statistically at par with two splits (50% before sowing +50% at maximum tillering) with 150% of recommended N and statistically higher than all other treatments during 2006-07. During 2007-08, two splits (50% before sowing +50% at maximum tillering) with 150% of recommended N gave significantly higher grain yield, which was statistically at par with two splits (50% before sowing +50% at maximum tillering) with 150% of recommended N and three splits with 125% of recommended N, but statistically higher than all other treatments. The highest malt yield was obtained with 150 % of recommended N which was statistically at par with125 % of recommended N and significantly higher than 100 % of recommended N during 2006-07 and 2007-08, years of crop growth. These results were in conformity with those of [10]. The variable stages of N application, however, evinced positive impact on malt yield of barley during both the years. The highest malt yield was obtained with three splits (50%before sowing +25% at tillering +25% at booting), which was significantly higher than two splits (50%before sowing and 50% at maximum tillering) and single application (100%before sowing)during 2006-07 and 2007-08, years of crop growth. The interaction effects of nitrogen levels and time of application on malt yield of barley were significant during both the years of crop growth. Three splits (50%before sowing +25% at tillering +25% at booting) application with 125 % of recommended N, gave significantly higher malt yield, which was statistically at par with three splits (50%before sowing +25% at tillering +25% at booting) with 150 % of recommended N and two splits (50%before sowing and 50% at Nitrogen levels and stages of nitrogen application and production of barley maximum

Journal of Progressive Agriculture, Vol.3, No. 1: April 2012
45
tillering) with 150 % of recommended N, while significantly higher than all other treatments during 2006-07. During 2007-08, two splits (50%before sowing and 50% at maximum tillering) with 150 % of recommended N gave significantly higher grain yield, which was statistically at par with three split (50% before sowing +25% at tillering +25% at booting) with 125 % of recommended N and two splits (50%before sowing and 50% at maximum tillering) with 150 % of recommended N, while significantly higher than all other treatments. Nutrients Grain N concentration was significantly increased with increase in nitrogen levels during both the years. The highest N concentration was observed with 150 % of recommended N, which was significantly higher than 125 and 100 % of recommended N during 2006-07 and 2007-08, years of crop growth. Grain N concentration was significantly influenced with the stages of N application during both the years. The highest N concentration was observed with three splits (50% before sowing +25% at tillering +25% at booting) which was significantly higher than two splits (50%before sowing and 50% at maximum tillering) and single application (100%before sowing) during 2006-07 and 2007-08, years of crop growth. Straw N concentration was significantly increased with increase in nitrogen levels during both the years. The highest N concentration was observed with 150 % of recommended N, which was statistically at par with 125 % of recommended N and significantly higher than 100 % of recommended N during 2006-07 and 2007-08, years of crop growth. Straw N concentration was significantly influenced with the stages of N application during both the years. The highest N concentration was observed with three splits (50% before sowing +25% at tillering +25% at booting) which was significantly Nitrogen levels and stages of nitrogen application and production of barley higher than two splits (50%before sowing and 50% at maximum tillering) and single application (100%before sowing) during 2006-07 and 2007-08, years of crop growth.
Phosphorus concentration in grain and straw of barley was improved with increase in nitrogen levels during both the years. The highest P concentration in grain and straw of barley was observed with 150 % of recommended N, followed by 125 and 100 % of recommended N during 2006-07 and 2007-08, years of crop. Phosphorus concentration in grain and straw of barley was significantly influenced with the stages of N application during both the years. The highest P concentration in grain and straw was observed with three splits (50% before sowing +25% at tillering +25% at booting), which was significantly higher than two splits (50% before sowing and 50% at maximum tillering) and single application (100%before sowing) during 2006-07 and 2007-08, years of crop growth. Potassium concentration in grain and straw of barley increased with increase in nitrogen levels during both the years. The highest K concentration was observed with 150 % of recommended N followed by 125 and 100 % of recommended N during 2006-07 and 2007-08, years of crop growth. Potassium concentration in grain and straw of barley was significantly influenced with the stages of N application during both the years. The highest K concentration in grain and straw was observed with three splits (50% before sowing +25% at tillering +25% at booting), which was significantly higher than two splits (50% before sowing and 50% at maximum tillering) and single application (100%before sowing) during 2006-07 and 2007-08, years of crop growth. The interaction effects of nitrogen levels and stages of nitrogen application Nitrogen levels and stages of nitrogen application and production of barley on N, P and K, concentration in grain and straw of malt barley were non-significant during 2006-07 and 2007-08, years of crop growth. It was concluded that 125 % of recommended N with three splits (50% before sowing +25% at tillering +25% at booting) gave more grain and malt yield than all other treatment combinations during both the years.
REFERENCES
Foster, E and Prentice N, 1987. Barley. In: Nutritive value of cereal Grains: Genetic and Agronomy Improvement .pp: 338-96.
Vaughan, J. G., Judd, P. A., Bellamy, D., 2006. The oxford book of health foods. http://books.google.co.in /books pp: 37.
Verma, R.P.S., Sharma, R.K. and Nagarajan, S. 2003.Influence of nitrogen and irrigation on malt and wort quality in barley.Cereal Res. Commu.31: 437-44.
Singh, R.K., Singh, R.K,. 2005. Effect of times and levels of nitrogen application on malt
barley(Hordeumvulgare). Indian Journal of Agron. 50: 137-39.
Singh, T. and Sorsulski, F.W. 1985.Malting of hullers barley (Hordeum vulgare) cultivars. J. of Food Sci. 50: 342.
Saini, J.P., Thakur, S.R., 1999. Response of barley (Hordeium vulgare L.) varieties to nitrogen under dry temperature conditions. Indian Journal of Agron.44: 123-125.
Singh, B., Sharma, P. K,, Singh, T., Gupta, S. K., 2006. Influence of time of sowing and nitrogen

Journal of Progressive Agriculture, Vol.3, No. 1: April 2012
46
application on grain and malt characterstics of barley cultivars. J. Res. PAU 43: 179-81.
Patel, A. M., Patel, D. R., Patel, G. R.,Thakor, D. M., 2004. Optimization of sowing and fertilizer requirement of barley (HordeumvulgareL.) under irrigated condition. Indian J.Agron.49: 171-73.
Elmobarak, A., Mohamed, M. A., Khair, M. A., Richter, A. C., 2007. Effects of irrigation interval,
sowing method and nitrogen application on forage and grain yield of barley in the gezira scheme, Sudan Tropentag, October 9-11, Witzenhausen.
Weston, D. T., Richard, D., Horsley, P. B., Schwaraz., Robert, J. G ., 1993. Nitrogen and planting date effect on low protein spring barley. Agron. J.85: 1170-74.

Journal of Progressive Agriculture, Vol.3, No. 1: April 2012
47
Correlation and Path Analysis of Yield and yield Attributes in Local Rice Cultivars (Oryza sativa L.)
BASAVARAJA, T1., GANGAPRASAD, S2., MALLIKARJUN, K1., VIJAY KUMAR,L1AND MAHESH
MEENA1 Department of Genetics and Plant Breeding, UAS, GKVK, Bangalore1
Department of Genetics and Plant Breeding, College of Agriculture, Navile, Shimoga 2
Email: [email protected]
ABSTRACT
The associations among the yield components and direct and indirect influence of yield components on the grain yield of local rice were investigated at Agricultural college farm, Navile, Shimoga. The experiment was laid out in a 10 x 10 Simple Lattice Design with two replications which consisted of 100 local genotypes during Kharif 2010. The correlation analysis indicated that grain yield was significantly associated with panicle length, test weight, number of tiller per plant, number of productive tiller per plant, number of spikelet per panicle, per cent spikelet fertility and amylase per cent. Path coefficient analysis revealed that days to 50 % flowering, plant height, panicle length, panicle number, number of productive tiller per plant, per cent spikelet fertility and amylase per cent had positive direct effect on grain yield. Hence, selection on these traits could be suggested to bring simultaneous improvement of yield and yield attributes.
Key words: Correlation, Path Analysis, Rice, Yield Grain yield and quality are complex characters and are associated with number of component characters which are themselves interrelated. Such independence often affects their relationship with yield, thereby making correlation ineffective. So, there is a need to path analysis is that it permits the partitioning of the correlation coefficient into its components, one component being the path coefficient that measures the direct effect of a predictor variable upon its response variable; the second component being the indirect effect(s) of a predictor variable on the response variable through another predictor variable (Dewey and Lu, 1959). Partition the correlation into direct and indirect effects to get the information on actual contribution of each character to yield. Therefore, the present investigation was undertaken to study the association and interrelationships of different yield and quality attributes in the selected lines of rice.
MATERIAL AND METHODS
The experimental material consisted of 100 diverse local genotypes of rice, which were grown at Agricultural college farm, Navile, Shimoga, in Kharif season 2010, in a 10 x 10 Simple Lattice Design with two replications Thirty days old seedlings were transplanted at the rate of one seedling per hill with a spacing of 30 × 20 cm. Recommended package of practices were followed to raise the crop. Observations were recorded on 13 yield and its attribute characters viz., days to 50 % flowering, days to maturity, plant height, panicle length, panicle number, test weight, number of tillers per plant, number of productive tillers per plant, number of spikelet per panicle, per cent of spikelet fertility, protein per cent, amylase per cent and grain yield per plant. The genotypic and phenotypic correlations were determined as per Johnson et al.
(1955). Path coefficient analysis was done as suggested by Wright (1921) and as described by Dewey and Lu (1959).
RESULTS AND DISCUSSION
The data in respect of correlation coefficient analysis between important characters, both phenotypic and genotypic are presented in Table 1. In general, the genotypic correlation coefficients were higher than phenotypic correlation coefficients and this is due to the masking effect of environment in genetic association between the characters (Johnson et al., 1955). The correlation of yield and yield contributing characters indicated that grain yield per plant was significantly associated with panicle length, test weight, number of tiller per plant, number of productive tiller per plant, number of spikelet per panicle, per cent spikelet fertility and amylase per cent. Eradasappa et al. (2007) reported similar findings for plant height, productive tillers per plant, panicle length, number of filled grains per panicle; Siva Kumar and Kannan Bapu (2005) for total number of tillers per plant, panicle length. It is desirable to select genotypes with more productive tillers per plant with more panicle length and per cent spikelet fertility coupled with optimum amylase content to develop high yielding quality rice. Path coefficient analysis (Table 2) revealed that days to 50 % flowering, plant height, panicle length, panicle number, number of productive tiller per plant, per cent spikelet fertility and amylase per cent exhibited high positive direct effect and significant positive association with grain yield. Similar findings were reported by Siva Kumar and Kannan Bapu (2005) for total number of tillers per plant; Panwar and Mashiat Ali (2007) for number of productive tillers per plant

Journal of Progressive Agriculture, Vol.3, No. 1: April 2012
48
and Panwar (2006) for number of filled grains per panicle. Among all these seven characters Days to 50 per cent flowering exhibited highest direct effect on grain yield followed by number of productive tiller per plant, panicle number, panicle length. This indicates that, if other factors are held constant, an increase in Days to 50 per cent flowering individually will reflect in an increased yield. Even number of spikelet per panicle had positive significant correlation with grain yield its direct effect on grain yield was negative. It is due to the maximum indirect effect of days to 50 % flowering which is nullifying its negative direct effect on grain yield. Hence, for improvement of this trait selection efforts would be more effective via days to
50 % flowering instead of selection based on number of spikelet per panicle alone. The residual effect (0.0854) was very low, indicating that much of the variation in yield has been accounted by the characters studied and that the choice of characters was appropriate. It could be suggested that more emphasis should be given on days to 50 % flowering, plant height, panicle length, panicle number, number of productive tiller per plant, per cent spikelet fertility and amylase per cent to bring simultaneous improvement of yield and it’s attributes among these 100 local rice genotypes as they showed high correlation in addition to maximum direct effects on yield.
Table 1: Estimates of genotypic (above diagonal) and phenotypic (below diagonal) correlation coefficients for 13 characters in local rice genotypes Traits X1 X2 X3 X4 X5 X6 X7 X8 X9 X10 X11 X12 X13
X1 1.000 0.001 0.441** 0.110* -1.111 -0.171 0.115* -0.003 0.102* 0.075 0.057 0.125* 0.073
X2 0.000** 1.000 0.443** 0.109* -1.103 -0.172 0.118* -0.002 0.103* 0.075 0.059 0.125* 0.075
X3 0.105* 0.105* 1.000 0.172** 0.861** -0.006 -0.092 -0.318 0.231** 0.017 0.001 -0.067 -0.019 X4 0.066 0.066 0.074 1.000 0.401** -0.006 0.038 0.517** 0.113* -0.306 -0.081 0.159** 0.422**
X5 -0.196 -0.195 -0.010 0.030 1.000 -1.071 -0.225 0.697** -1.062 0.312** -0.333 -0.555 -0.555
X6 -0.115 -0.115 0.014 -0.069 -0.048 1.000 0.051 0.443** -0.076 0.130* 0.036 0.014 0.116* X7 0.090 0.091 0.038 0.129* -0.042 0.030 1.000 0.792** 0.171** -0.083 0.111* -0.039 0.124*
X8 -0.053 -0.053 0.069 0.062 -0.015 0.170** 0.641** 1.000 0.273** -0.006 -0.138 0.098 0.409**
X9 0.088 0.089 0.154 ** 0.080 0.103* -0.072 0.129* 0.129* 1.000 0.002 -0.079 0.101* 0.163** X10 0.040 0.039 0.034 -0.120 -0.082 0.110* -0.016 0.001 0.003 1.000 -0.164 0.097 0.206**
X11 0.056 0.057 -0.000 -0.043 -0.008 0.029 0.071 -0.066 -0.080 -0.165 1.000 0.098 -0.229
X12 0.089 0.089 -0.041 0.094 -0.038 0.015 -0.021 0.046 0.097 0.095 0.098 1.000 0.168** X13 0.076 0.077 -0.032 0.018 0.036 0.076 0.053 0.208** 0.116* 0.155** -0.171 0.117* 1.000
** Significance at 1 %, * Significance at 5 % Where, X1 - Days to 50 per cent flowering X6 - Test weight (g) X11 - protein % X2 - Days to maturity X7 - No. of tiller per plant X12 - Amylose%
X3 - Plant height X8 - No. of Productive tiller per plant
X13 - Grain yield (g)
X4 - Panicle Length(cm) X9 - No. of spikelet per panicle X5 - Panicle No. X10 - per cent of spikelet fertility

Journal of Progressive Agriculture, Vol.3, No. 1: April 2012
49
Table 2: Estimates of direct and indirect effects of yield components on grain yield at genotypic level in local rice cultivars
Residual effect= 0.087 Where, X1 - Days to 50 per cent flowering X6 - Test weight (g) X11 - protein % X2 - Days to maturity X7 - No. of tiller per plant X12 - Amylose% X3 - Plant height X8 - No. of Productive tiller per plant X13 - Grain yield (g) X4 - Panicle Length(cm) X9 - No. of spikelet per panicle X5 - Panicle No. X10 - per cent of spikelet fertility
REFERENCES
Dewey D R and Lu K H 1959. A Correlation and Path Coefficient Analysis of Components of Crested Wheat Grass Seed Production. Agron. J. 51(9):515-518.
Eradasappa E Nadarajan N Ganapathy K N Shanthala J and Satish R G 2007. Correlation And Path Analysis for Yield and Its Attributing Traits in Rice (Oryza sativa L.). Crop Research. 34(1,2,3): 156-159.
Johnson H W Robinson H F and Comstock R E 1955 Estimates of genetic and environmental variability in soybean. Agronomy Journal 47(7): 314-318.
Panwar L L and Mashiat Ali 2007. Correlation and Path Analysis of Yield and Yield Components in Transplanted Rice. Oryza. 44(2): 115-120.
Panwar L L 2006. Character association and path analysis in rice (Oryza sativa L.). Annals Agricultural Research New series. 27(3): 257-260.
Siva Kumar P and Kannan Bapu J R 2005. Character Association in Inter Sub-Specific Rice Hybrids Involving Wide Compatible Gene. Crop Research. 30(2):208-210.
Wright, S. 1921. Correlation and Causation. Journal of Agricultural Research. 20: 557-585.
Traits X1 X2 X3 X4 X5 X6 X7 X8 X9 X10 X11 X12 ‘ r’ value X1 12.567 -12.337 0.002 0.005 -0.145 0.010 -0.043 -0.002 -0.011 0.022 -0.004 0.009 0.073 X2 12.568 -12.337 0.002 0.005 -0.144 0.011 -0.044 -0.002 -0.011 0.022 -0.005 0.009 0.075 X3 5.541 -5.459 0.005 0.008 0.112 0.000 0.034 0.237 -0.024 0.005 -0.000 -0.005 -0.019 X4 5.541 -1.350 0.001 0.049 0.052 0.008 -0.014 0.385 -0.012 -0.090 0.006 0.012 0.422** X5 -13.964 13.611 0.004 0.020 0.131 0.065 0.084 -0.070 -0.073 -0.314 -0.024 -0.024 -0.555 X6 -2.154 2.122 -0.000 -0.006 -0.140 -0.061 -0.019 0.329 0.008 0.038 -0.003 0.001 0.116* X7 1.450 -1.456 -0.000 0.002 -0.029 -0.003 -0.374 0.589 -0.018 -0.025 -0.009 -0.003 0.124* X8 -0.039 0.029 0.001 0.025 -0.012 -0.027 -0.297 0.744 -0.028 -0.002 0.011 0.007 0.409** X9 1.281 -1.269 -0.001 0.006 0.091 0.005 -0.064 0.203 -0.104 0.001 0.006 0.007 0.163** X10 0.946 -0.920 -0.000 -0.015 -0.139 -0.008 0.031 -0.004 -0.000 0.295 0.013 0.007 0.206** X11 0.716 -0.725 -0.000 -0.004 0.041 -0.002 -0.042 -0.103 0.008 -0.048 -0.077 0.007 -0.229 X12 1.574 -1.540 -0.000 0.008 -0.043 -0.001 0.015 0.073 -0.011 0.029 -0.008 0.072 0.168**

Journal of Progressive Agriculture, Vol.3, No. 1: April 2012
50
Genetic divergence in yield and yield contributing traits in chickpea
VIJAY PRAKASH AND U. S. SHEKHAWAT
Agricultural Research Station, (SK Rajasthan Agricultural University), Sriganganagar - 335001
ABSTRACT
Thirty genotypes of chickpea evaluated to know the genetic divergence for grain yield and yield contributing traits. Significant differences among the genotypes were observed for all the characters studied. Genotypes were grouped in to nine clusters based on D2 values. Cluster III and IX were more divergent. Genotype GNG 2000 formed mono genotypic cluster with earliest flowering and maturity. Pods per plant contributed most in genetic divergence followed by 100- seed weight and Days to 50 % flowering. The diverse genotypes such as GNG 2000, GNG 1581, GNG 469, CSG 8962, GNG 1999, GNG 2004, GNG 2010 can be used in breeding programme to generate the spectrum of variability.
Key words: D2 analysis, Divergence, Chickpea Chickpea (Cicer arietinum L.) is most important pulse crop of India. The yield potential of the crop can be exploited through varietal improvement programme. The role of genetic diversity and its significance has been recognized for the selection of desirable parents in breeding programme to obtain high heterotic response and transgressive segregants. Genetic diversity based on grain yield and its components traits has been studied and reported by many workers (Ram Krishna and Chaturvedi, 1998; Kumar et al. 1984 and Sandhu and Gumber, 1991). The D2 statistics is a powerful tool for quantifying the divergence (Rao, 1952). Therefore, in the present investigation genetic diversity among newly developed chickpea genotypes derived from various diverse varietal crosses was determined in order to select the potential parents for further breeding programme for improvement in grain yield of chickpea.
MATERIALS AND METHODS
Thirty diverse and newly developed chickpea genotypes of chickpea were evaluated in Randomized Complete Block Design with three replications during Rabi 2009-10 at Agricultural Research Station (SKRAU), Sriganganagar (Rajasthan). Each genotype was grown in 8 row plot of 6 m long with 30 x 10 cm spacings between and within rows, respectively. Data were recorded on grain yield per plot (kg). Observation on Days to 50% flowering, days to maturity and 100-seed weight was recorded on composite plot basis. Ten plants were drawn randomly from each plot for recording plant height (cm) and pods per plan. D2 analysis was carried out as per Mahalanobis, 1936. The genotypes grouped in various clusters based D2 values as per Tocher’s method.
RESULTS AND DISCUSSION
The genotypes differed significantly in all the traits. The estimated V-statistics was also found significant. The D2 value ranged between 4.22- 3002.96. Thirty genotypes grouped into nine clusters (Table 1). Cluster 1 had 15 genotypes followed by II, III, IV, V, VI, VII, VIII with two each. Cluster IX was monogenotypic cluster. The maximum inter cluster distance was recorded between cluster III and IX followed by cluster I and IX, I and VII and I and IV (Table 2). The genotypes grouped in these clusters can be used in breeding programme in order to get a wide spectrum of variability and transgressive segregants. The minimum distance between cluster II and V, VIII and V, III and IV indicate them to be genetically closer clusters. Selection of parents from such clusters should be avoided because it may result in narrow genetic base. The comparison of cluster means indicated that cluster VI had highest 100-seed weight and days to 50% flowering however, least pods per plant (Table 3). Cluster III had highest plot yield with least 100- seed weight. Pods per plant contributed most in genetic divergence followed by 100- seed weight and Days to 50 % flowering (Table 4). Grain yield per plot contributed least in genetic divergence. Genotype GNG 2000 formed monogenotypic cluster IX with average estimates of pods per plant, plant height and grain yield per plot however, it was earliest flowering and maturing genotype of the study. The present study suggests that genotypes such as GNG 2000, GNG 1581, GNG 469, CSG 8962, GNG 1999, GNG 2004, GNG 2010 can be used in breeding programme to generate the spectrum of variability for selection of transgressive segregants for chickpea improvement.

Journal of Progressive Agriculture, Vol.3, No. 1: April 2012
51
Table 1: Grouping of chickpea genotypes into clusters Cluster Genotypes
I GNG 1986, GNG 1987, GNG 1988, GNG 1989, GNG 1990, GNG 1991, GNG 1992, GNG 1993, GNG 1994, GNG 1995, GNG 1996, GNG 1997, GNG 1998, GNG 1999, GNG 2001
II GNG 2004, GNG 2009 III GNG 2003, GNG 2010 IV CSG 8962, DCP 92-3 V GNG 2007, GNG 2008 VI GNG 469, BG 256 VII GNG 2002, GNG 1581 VIII GNG 2005, GNG 2006 IX GNG 2000
Table 2: Inter and Intra (bold) cluster distances Cluster I II III IV V VI VII VIII IX
I 18.177 19.639 16.406 17.609 15.885 29.275 13.689 18.243 42.316 II 3.846 24.026 25.754 7.586 15.086 17.047 11.425 39.541 III 3.954 9.729 19.387 36.361 10.012 21.868 47.905 IV 5.564 20.543 37.574 12.790 21.583 41.932 V 5.736 18.559 12.160 8.700 36.960 VI 5.798 28.262 19.519 38.890 VII 8.508 14.473 41.974 VIII 11.930 33.782 IX 0.000
Table 3: Cluster means for different characters in chickpea
Cluster Number of genotypes included
Grain Yield per plot (kg)
Days to 50 %
flowering
Days to maturity
Plant Height (cm)
100-Seed weight (g)
Pods per plant
I 15 3.980 92.9 146.9 81.7 16.0 78.0 II 2 3.828 95.3 147 94.7 20.1 85.0 III 2 4.541 94.5 147.5 82 13.3 87.3 IV 2 3.854 88.8 144.8 83.2 13.6 84.5 V 2 4.287 92.8 147.8 88.5 18.7 82.5 VI 2 3.387 95.5 146.8 78.5 23.3 75.5 VII 2 4.403 93.7 147.3 78.0 15.8 88.0 VIII 2 4.141 90.7 147.2 82.0 19.4 92.5 IX 1 4.051 68.3 145.7 83.7 22.9 79.0
Table 4: Percent contribution of the traits towards genetic divergence
S. No Source Times ranked first Contribution (%) 1 Grain yield per plot (kg) 1 0.23 2 Days to 50 % flowering 67 15.4 3 Days to maturity 3 0.69 4 Plant Height (cm) 3 0.69 5 100-Seed weight (g) 117 26.90 6 Pods per plant 244 56.09
REFERANCES
Ram Krishna and Chaturvedi, S.K. 1998. Genetic divergence in chickpea. Indian J. Genet. 58(3): 337-342
Kumar, J., Behl, P.N. and Raju, D.B. 1984. Variability in relation to geographical distribution in chickpea. Indian J. Genet. 44(1):164-172.
Mahalanobis, P.C. 1936. On generalized distance in statistics. Proceedings National Institute of Science (India) 12: 49.
Vijay Prakash, 2006. Divergence analysis in kabuli chickpea (Cicer arietinum L.). Indian J. Genet., 66(3) : 241-42
Rao, C.R. 1952. Advanced statistical methods in biometrical research. John Wiley and Sons Inc. New York. Pp 390-395.
Sandhu, T.S. and Gumber, R.K. 1991. Genetic divergence in chickpea. International Chickpea Newsletter 21:18-19.

Journal of Progressive Agriculture, Vol.3, No. 1: April 2012
52
Heterosis for Leaf, Tassel Characters and Yield in Single Cross Hybrids of Maize (Zea mays L.)
T. SANDEEP KUMAR, D. M. REDDY, V. SAIDA NAIK and C. NAGARAJU Dept. of Genetics and Plant Breeding, S.V. Agricultural College, Tirupati-517502
ABSTRACT
The present experiment was undertaken with an objective to assess the heterosis for leaf, tassel characters and yield in the single cross hybrids of maize, which were generated from recycled elite inbred lines. Among all the traits, grain yield per plant displayed highest magnitude of heterosis followed by number of branches per tassel, leaf area index, tassel length and SPAD chlorophyll. Heterosis and heterobeltiosis studies also revealed that the hybrids BML 7 x BML 15 showed maximum heterosis for leaf area index, BML 6 x BML 15 for SPAD chlorophyll, CM 149 X BML 6 for tassel length, CM 133 x CM 148 for number of branches per tassel and CM 148 X BML 15 for grain yield per plant. These crosses offer the best possibilities of further exploitation to increase the maize productivity.
Keywords: Zea mays, heterosis, heterobeltiosis, yield per plant, hybrid Maize (Zea mays L.), being a highly cross pollinated crop, is believed to exhibit high range of heterosis/hybrid vigour than most other crops. In maize, hybrid vigour can be exploited more efficiently to push up yield improvement because maize is a C4 plant, possessing maximum physiological and biological potentials. Therefore, maize can prove to be the best candidate for heterotic use. As the demand of maize is rapidly increasing as feed for livestock, poultry and industrial raw material besides as staple food for several parts of the world, it has become essential to boost up the economical production of maize by developing new promising hybrids with improved yield potentials than the existing hybrids. To achieve this, there should be a continuous effort to assess the heterotic pattern of the newly recycled inbreds. Success in improving the grain yield can be achieved through exploitation of heterotic response for leaf, tassel characters and yield in maize. Leaf characters such as leaf area index gives an estimate of total light interception by the crop canopy and SPAD chlorophyll is an estimate of photosynthetic ability of the crop. Tassel morphology is an indication of potential pollen production ability in maize (Agustine et al. 2003). Hence, the heterotic pattern in these traits may help to further augment yield potentials in maize. Though studies on heterosis as yield and yield related traits are most common, limited studies were conducted as heterosis pattern of leaf and tassel characters. Keeping this in view, the present investgation was under taken to find out the heterotic response in twenty eight crosses of maize for leaf, tassel characters and yield and also to recommend the best crosses based on this study.
MATERIALS AND METHODS
The experimental material consisted of eight inbred lines of maize viz., CM 209, CM 132, CM 133, CM 148, CM 149, BML 6, BML 7 and BML 15 and their twenty eight single crosses (excluding reciprocals)
generated in a half diallel fashion during kharif, 2010 at Sri Venkateswara Agricutural College farm, Tirupati. The twenty eight single crosses along with their parents were sown in RBD with three replications durinng rabi, 2011. Each entry was planted in a single row plot of 4 m length and the row-to-row and plant to plant distance was maintained at 75 and 20 cm, respectively. Standard plant protection measures were adopted to minimize the effect of insect pests and diseases. The data were recorded on randomly selected five competitive plants on leaf area index, SPAD chlorophyll (measured using SPAD meter), tassel length, number of branches per tassel and grain yield per plant. The replication wise mean values of genotypes were subjected to statistical analysis using INDOSTAT software. Mean values of both parents and crosses were subjected to preliminary analysis of variance (Panse and Sukhatme, 1985) and the heterosis effects in F1 hybrids for above mentioned characters were calculated in percentage over the mid parent and better parent values by following the method suggested by Hallauer and Miranda (1988).
RESULTS AND DISCUSSION
Highly significant differences among genotypes were observed for all the characters studied (Table 1). It indicated the existence of genetic variability in the present breeding material which could be well utilized in future breeding programmes. The heterosis over mid parent (average heterosis), better parent (heterobeltiosis), number of hybrids showing significant desirable heterosis and per se performance of the hybrids are presented in Table 2. Heterosis over better parent for leaf area index and SPAD chlorophyll ranged from -10.81 to 68.68 and -23.03 to 29.19, respectively. Among 28 hybrids, significant positive heterosis was reported in thirteen hybrids for leaf area index, whereas only three hybrids viz., BML6 x BML 15, CM 132 x BML 6 and CM 132 x BML 15 exhibited significant positive heterosis for
Journal of Progressive Agriculture, Vol.3, No. 1: April 2012
53
SPAD chlorophyll. The maximum heterobeltiosis besides high per se performance was manifested in the hybrid BML 7 x BML 15 for leaf area index and BML 6 x BML 15 for SPAD chlorophyll. Therefore, maximum heterosis was produced by the hybrids involving BML 15 as one of the parents. Similar results were also reported for leaf area index by Wannows et al. (2010) and Iqbal et al. (2010) and for SPAD chlorophyll by Appunu et al. (2007). Leaf area index is an important growth parameter which has influence on light interception, crop-weed competition and soil erosion etc. Hence, genetic improvement of this trait has its own importance in contributing towards the final yield. Regarding SPAD chlorophyll, the genotypes exhibiting high heterosis for SPAD chlorophyll could be efficiently utilized in future breeding programmes to develop superior inbred lines with high chlorophyll content, which enhances the photosynthetic ability and ultimately the yield in maize. The perusal of the estimates of heterosis for tassel morphology revealed that, heterobeltiosis for tassel length and number of branches per tassel ranged from -8.60 to 46.41 and -12.00 to 119.23, respectively. Sixteen hybrids for tassel length and seventeen hybrids for number of branches per tassel expressed significant positive heterobeltiosis. The estimates of heterosis for tassel characters revealed that, the hybrids CM 149 x BML 6 and CM 133 x CM 148 exhibited maximum heterobeltiosis besides high per se performance for tassel length and number of branches per tassel, respectively. Similarly, high heterobeltiosis was reported by Appunu et al. (2007) for tassel length and Sherry et al. (2009) for number of branches per tassel. In hybrid seed production, availability of adequate pollen decides the final yield of that the particular hybrid. In maize, considerable importance has been noticed regarding effect of tassel morphology on grain yield. Tassel features such as tassel length and number of branches per tassel, which represents tassel area index are the potential indicators of pollen production. Hence, maize breeding programmes aimed to develop high yielding genotypes must assess the pollen production ability of a genotype by tracing the
inheritance behaviour of tassel features and hence the selection can be made effective. In the present study, the hybrids viz., CM 149 x BML 6 and CM 133 x CM 148 which exhibited high heterosis for tassel morphology could be successfully exploited in developing superior inbreds in future breeding programme. Grain yield per plant decides the final economic worth of hybrids and in the present study this trait exhibited highest range of heterosis compared to all other traits considered. Heterobeltiosis for this trait ranged from 20.40 to 268.76. All the hybrids except CM 133 x CM 149 recorded significant positive heterosis. However, the maximum per cent of heterobeltiosis in addition to high per se performance was manifested in the hybrids viz., CM 148 x BML 15 followed by CM 148 x BML 6. These results are greatly supported by the findings of Dornescu (1977) and Ojo et al. (2007) as they also reported greater heterosis for grain yield. High heterosis realized in these crosses might be due to complementary effects of the parents and also might be due to high genetic diversity among the parents being used in the crossing programme. These crosses could be successfully exploited for commercialization after testing their performance in multi-location trials in due course of time. Overall results of the present study revealed that, the highest range of heterosis was realized for grain yield followed by number of branches per tassel, leaf area index, tassel length and SPAD chlorophyll. Among the eight inbreds considered for heterotic studies, it is pertinent to observe that, inbred lines BML 7 and CM 148 produced highest heterotic combinations with most of the other inbreds for most of the traits considered. Hence, these inbreds could be well exploited for further improvement of leaf, tassel characters and grain yield in maize. However, the crosses BML 7 x BML 15 for leaf area index, BML 6 x BML 15 for SPAD chlorophyll, CM 149 X BML 6 for tassel length, CM 133 x CM 148 for number of branches per tassel and CM 148 X BML 15 for grain yield per plant could be successfully utilized in future breeding programme as they exhibited the highest magnitude of heterosis in the respective traits.
Table 1. Analysis of variance for leaf, tassel characters and yield in maize
Characters Source of Variation Replications (df=2) Genotypes (df=35) Error (df=70)
Leaf area index 0.34 2.41** 0.25 SPAD chlorophyll 24.74 83.41** 9.91 Tassel length 10.45 73.04** 6.62 No. of branches per tassel 9.08 40.67** 4.24 Yield per plant 500.31 3884.18** 206.91 ** Significant at 1% level

Journal of Progressive Agriculture, Vol.3, No. 1: April 2012
54
Table 3. Percentage of heterosis over mid parent, better parent and per se performance for leaf, tassel characters and yield in maize
Crosses Leaf area index SPAD chlorophyll Tassel length (cm) No. of branches per tassel Grain yield per plant (g)
MP BP Per se MP BP Per
se MP BP Per se MP BP Per
se MP BP Per se
CM 209 × CM 132 41.19* 19.28 3.07 5.02 -8.04 46.44 15.97* 9.51 31.47 23.60* 10.00 18.33 129.24** 117.37** 116.07
CM 209 × CM 133 25.82 2.73 2.88 4.66 3.46 53.48 11.6 4.82 30.47 32.26* 5.13 13.67 92.39** 46.50** 134.09
CM 209 × CM 148 46.14* 42.03 2.52 0.45 -0.16 50.42 18.66** 0.05 37.22 90.77** 58.97** 20.67 140.45** 105.68** 98.46
CM 209 × CM 149 67.48** 47.23** 3.45 5.85 3.22 54.86 23.49** 20.10* 30.67 37.78** 21.57* 20.67 103.86** 79.47** 112.94
CM 209 × BML 6 24.06 -9.54 3.51 27.13** 7.34 54.21 33.96** 30.29** 33.27 61.76** 41.03** 18.33 174.23** 161.05** 124.97 CM 209 × BML 7 12.77 -10.81 2.72 5.86 0.46 50.73 44.35** 42.56** 36.4 45.21** 35.9** 17.67 121.22** 90.24** 126.5 CM 209 × BML 15 50.79** 18.79 3.67 16.49** -4.43 48.27 32.33** 26.63** 32.33 26.58* 25.00 16.67 201.43** 179.01** 133.56
CM 132 × CM 133 46.01** 40.02** 3.93 9.88 -4.72 49.25 15.11* 14.45 33.27 34.25** -2.00 16.33 75.84** 39.21** 127.42
CM 132 × CM 148 77.59** 46.57** 3.78 18.26** 4.10 51.94 33.67** 18.46** 44.07 15.79 -12.00 14.67 173.87** 124.19** 119.71
CM 132 × CM 149 65.85** 58.34** 4.08 -10.19* -
23.03** 40.90 33.42** 22.74** 35.27 34.65** 33.33** 22.67 112.08** 96.01** 123.36
CM 132 × BML 6 28.20a 6.71 4.14 26.53** 21.25** 46.01 37.96** 26.91** 36.47 36.71** 8.00 18.00 165.98** 140.76** 128.56 CM 132 × BML 7 45.53** 34.17a 4.10 5.84 -2.79 44.08 42.2** 32.71** 38.13 28.57** 8.00 18.00 134.34** 111.25** 140.48 CM 132 × BML 15 34.79** 23.65 3.82 27.12** 17.77a 44.69 34.19** 21.58** 34.93 13.33 2.00 17.00 200.28** 164.72** 141.35
CM 133 × CM 148 46.62** 17.10 3.29 0.22 -1.52 50.9 21.13** 7.89 40.13 132.65** 119.23** 19.00 123.88** 53.55** 140.55
CM 133 × CM 149 27.64 17.10 3.29 -3.04 -4.37 50.82 12.03 2.52 29.80 24.32a -9.8 15.33 42.69** 20.40 110.2
CM 133 × BML 6 34.06** 15.56 4.48 15.83** -3.11 50.08 20.3** 10.09 32.00 100.00** 79.31** 17.33 96.67** 44.82** 132.55
CM 133 × BML 7 44.48** 38.65** 4.23 -8.55 -14.16** 44.37 28.23** 19.04a 34.6 85.96** 55.88** 17.67 89.08** 63.22** 149.4
CM 133 × BML 15 73.53** 65.66** 5.11 15.37** -6.19 48.49 23.92** 11.70 32.47 58.73** 25.00 16.67 122.93** 61.09** 147.44
CM 148 × CM 149 54.06** 32.15 3.10 3.05 -0.10 53.09 10.87 -8.60 34.00 92.21** 45.10** 24.67 158.45** 99.09** 125.29
CM 148 × BML 6 50.18** 7.57 4.17 25.96** 6.88 53.32 30.22** 7.35 39.93 67.27** 58.62** 15.33 258.58** 220.27** 138.58 CM 148 × BML 7 114.52** 66.16** 5.07 6.22 1.38 50.58 35.37** 12.99a 42.03 36.67a 20.59 13.67 131.62** 75.06** 116.41 CM 148 × BML 15 69.21** 30.56a 4.03 10.69 -8.75 45.52 14.76a -6.63 34.73 75.76** 45.00** 19.33 301.61** 268.47** 150.15
CM 149 × BML 6 22.51 -1.72 3.81 6.63 -11.79a 46.88 46.41** 46.41** 35.33 30.00** 1.96 17.33 217.43** 167.84** 168.56 CM 149 × BML 7 63.56** 44.54** 4.41 0.04 -7.30 49.26 46.84** 44.58** 36.00 48.24** 23.53a 21.00 90.4** 85.3** 123.22 CM 149 × BML 15 75.45** 54.32** 4.76 7.50 -
13.51** 45.96 42.70** 40.33** 33.87 42.86** 27.45** 21.67 206.38** 152.38** 158.83
BML 6 × BML 7 22.27a 9.29 4.24 12.15a -0.91 44.93 30.52** 28.51** 32.00 55.56** 44.12** 16.33 134.43** 93.49** 128.66 BML 6 × BML 15 42.46** 27.94** 4.96 33.84** 29.19** 44.93 42.13** 39.78** 33.73 53.62** 32.50a 17.67 217.9** 208.64** 133.55 BML 7 × BML 15 69.60** 68.68** 5.21 5.75 -9.38 41.09 41.26** 36.81** 34.07 37.84** 27.50a 17.00 163.29** 112.32** 141.18
* = significance at 5 % level and ** = significane at 1 % level
REFERENCES
Agustine EF. and Mark EW. 2003. Tassel morphology as an indicator of potential pollen production in maize. Crop Management, doi:10.1094/CM-2003-0804-01.
Appunu C Satyanarayana E and Rao, TN. 2007. Heterosis for grain yield and its components in maize (Zea mays L.). Journal of Research, ANGRAU, 35(1): 124-126.
Dornescu. 1997.Heterosis of yield components In maize. Cercetaria Agronomica in Maldova, 6: 63-69.
Hallauer AR and Miranda JB. 1988. Quantitative Genetics in Maize Breeding. 2nd edition. Iowa State University Press, Iowa, Ames. USA, 468.
Iqbal MK Khan H Rahman IH Khalil H Sher and Bakht J. 2010. Heterosis for morphological traits in subtropical maize (Zea mays L.). Maydica, 55: 41-48.
Ojo GOS Adedzwa DK. and Bello LL. 2007. Combining ability estimates and heterosis for grain yield components in maize (Zea mays L.).Journal of sustainable development in agriculture and Environment. 3: 49-57.
Panse VG and Sukhatme PV. 1985. Statistical Methods for Agricultural Workers. Indian Council of Agricultural Research, New Delhi, pp.100-174.
Sherry AF G Edward SB Peter T Elhan E and Nathan MS. 2009.Heterosis is prevalent for multiple traits in diverse maize germplasm. Plos One, 4(10): e7433.
Wannows AA Azzam HK and Al-Ahmad SA. 2010. Genetic variances, heritability, correlation and path coefficient analysis in yellow maize crosses (Zea mays L.). Agriculture and Biology Journal of North America, 1(4): 630-637.
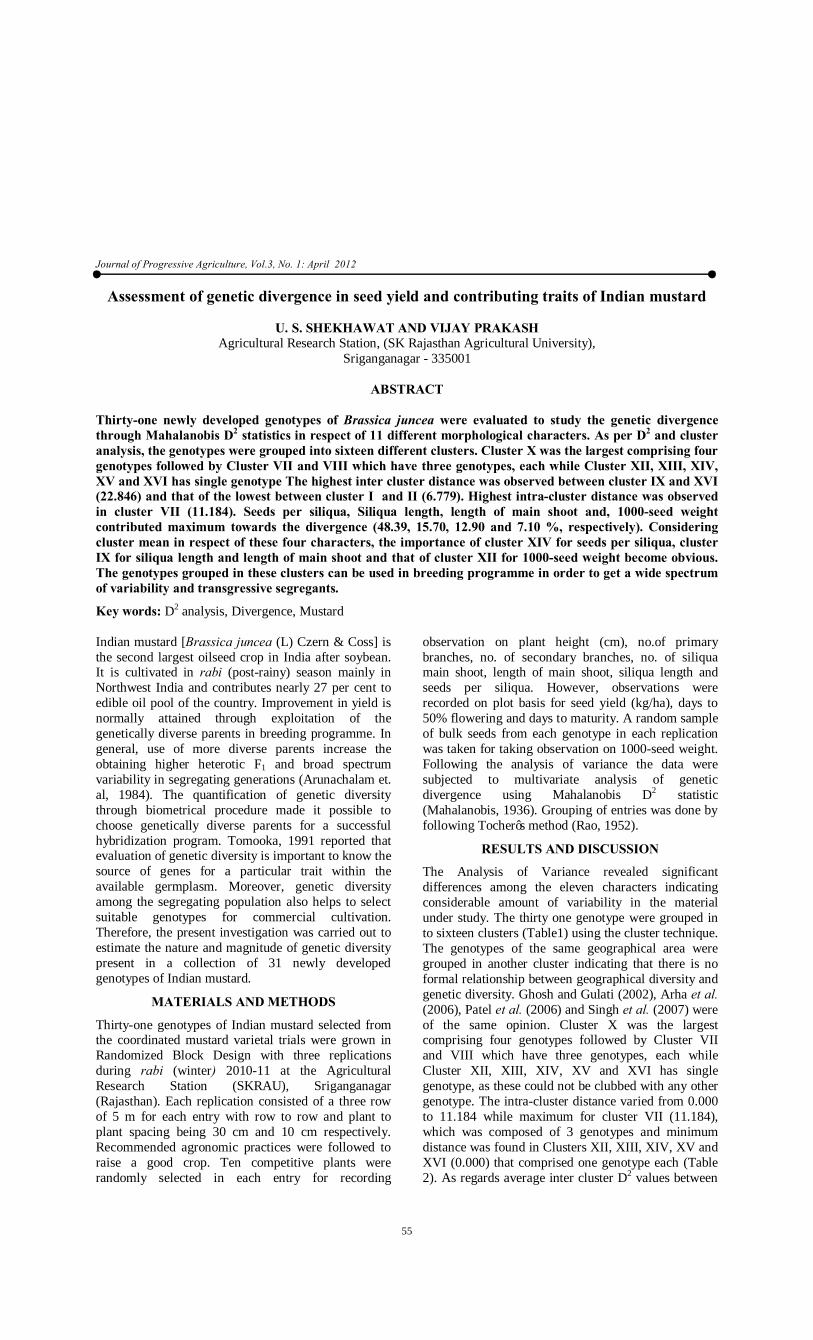
Journal of Progressive Agriculture, Vol.3, No. 1: April 2012
55
Assessment of genetic divergence in seed yield and contributing traits of Indian mustard
U. S. SHEKHAWAT AND VIJAY PRAKASH Agricultural Research Station, (SK Rajasthan Agricultural University),
Sriganganagar - 335001
ABSTRACT Thirty-one newly developed genotypes of Brassica juncea were evaluated to study the genetic divergence through Mahalanobis D2 statistics in respect of 11 different morphological characters. As per D2 and cluster analysis, the genotypes were grouped into sixteen different clusters. Cluster X was the largest comprising four genotypes followed by Cluster VII and VIII which have three genotypes, each while Cluster XII, XIII, XIV, XV and XVI has single genotype The highest inter cluster distance was observed between cluster IX and XVI (22.846) and that of the lowest between cluster I and II (6.779). Highest intra-cluster distance was observed in cluster VII (11.184). Seeds per siliqua, Siliqua length, length of main shoot and, 1000-seed weight contributed maximum towards the divergence (48.39, 15.70, 12.90 and 7.10 %, respectively). Considering cluster mean in respect of these four characters, the importance of cluster XIV for seeds per siliqua, cluster IX for siliqua length and length of main shoot and that of cluster XII for 1000-seed weight become obvious. The genotypes grouped in these clusters can be used in breeding programme in order to get a wide spectrum of variability and transgressive segregants.
Key words: D2 analysis, Divergence, Mustard Indian mustard [Brassica juncea (L) Czern & Coss] is the second largest oilseed crop in India after soybean. It is cultivated in rabi (post-rainy) season mainly in Northwest India and contributes nearly 27 per cent to edible oil pool of the country. Improvement in yield is normally attained through exploitation of the genetically diverse parents in breeding programme. In general, use of more diverse parents increase the obtaining higher heterotic F1 and broad spectrum variability in segregating generations (Arunachalam et. al, 1984). The quantification of genetic diversity through biometrical procedure made it possible to choose genetically diverse parents for a successful hybridization program. Tomooka, 1991 reported that evaluation of genetic diversity is important to know the source of genes for a particular trait within the available germplasm. Moreover, genetic diversity among the segregating population also helps to select suitable genotypes for commercial cultivation. Therefore, the present investigation was carried out to estimate the nature and magnitude of genetic diversity present in a collection of 31 newly developed genotypes of Indian mustard.
MATERIALS AND METHODS
Thirty-one genotypes of Indian mustard selected from the coordinated mustard varietal trials were grown in Randomized Block Design with three replications during rabi (winter) 2010-11 at the Agricultural Research Station (SKRAU), Sriganganagar (Rajasthan). Each replication consisted of a three row of 5 m for each entry with row to row and plant to plant spacing being 30 cm and 10 cm respectively. Recommended agronomic practices were followed to raise a good crop. Ten competitive plants were randomly selected in each entry for recording
observation on plant height (cm), no.of primary branches, no. of secondary branches, no. of siliqua main shoot, length of main shoot, siliqua length and seeds per siliqua. However, observations were recorded on plot basis for seed yield (kg/ha), days to 50% flowering and days to maturity. A random sample of bulk seeds from each genotype in each replication was taken for taking observation on 1000-seed weight. Following the analysis of variance the data were subjected to multivariate analysis of genetic divergence using Mahalanobis D2 statistic (Mahalanobis, 1936). Grouping of entries was done by following Tocher’s method (Rao, 1952).
RESULTS AND DISCUSSION
The Analysis of Variance revealed significant differences among the eleven characters indicating considerable amount of variability in the material under study. The thirty one genotype were grouped in to sixteen clusters (Table1) using the cluster technique. The genotypes of the same geographical area were grouped in another cluster indicating that there is no formal relationship between geographical diversity and genetic diversity. Ghosh and Gulati (2002), Arha et al. (2006), Patel et al. (2006) and Singh et al. (2007) were of the same opinion. Cluster X was the largest comprising four genotypes followed by Cluster VII and VIII which have three genotypes, each while Cluster XII, XIII, XIV, XV and XVI has single genotype, as these could not be clubbed with any other genotype. The intra-cluster distance varied from 0.000 to 11.184 while maximum for cluster VII (11.184), which was composed of 3 genotypes and minimum distance was found in Clusters XII, XIII, XIV, XV and XVI (0.000) that comprised one genotype each (Table 2). As regards average inter cluster D2 values between

Journal of Progressive Agriculture, Vol.3, No. 1: April 2012
56
cluster IX and XVI (22.846), suggesting wide diversity between them while the minimum divergence was between cluster I and II (6.779).The magnitude of D2 values suggested considerable diversity among the genotype. The character contributing maximum to the D2 values (Table 3) were given greater emphasis for deciding the clusters for the purpose of further selection and choice of parents for hybridization. Seeds per siliqua, Siliqua length, length of main shoot and, 1000-seed weight contributed maximum towards the divergence (48.39, 15.70, 12.90 and 7.10 %, respectively). On considering cluster mean in respect of these four characters, the importance of cluster XIV for seeds per siliqua, cluster IX for siliqua length and length of main shoot and that of cluster XII for 1000-
seed weight become obvious (Table 4). The genotypes grouped in these clusters can be used in breeding programme in order to get a wide spectrum of variability and transgressive segregants. Aunwinithul et al. (2004) and Verma et al. (2000) were of the same opinion. Number of primary branches and seed yield contributed least in genetic divergence. The cluster comprising only one cultivar with specific traits could also be used in hybridization programme for exploiting hybrid vigour. Thus, crosses between the cultivars of cluster I (KMR 10-1, RB-50), IV (NDRS 2003-3, HUJM 07-06) and IX (KM 9201, RH 555 B) and with that of Cluster XII, XIII, XIV, XV and XVI would exhibit high heterosis and is also likely to produce new recombinants with desired traits in Indian mustard.
Table 1: Distribution of thirty one Indian mustard genotypes to different clusters on the basis of D2 statistics
Cluster Genotypes Cluster Genotypes I KMR 10-1, RB-50 IX KM 9201, RH 555 B II KMR 10-2, RH 830 X SKM 8-817, PR 2008, RGN 282, RRN 722 III Kranti, RH 58 XI RL 2010, DRMR 2010-4 IV NDRS 2003-3, HUJM 07-06 XII NDRS 2017-1 V RRN 702, NPJ 146 XIII PBR 375 VI DRMRIJ 31, RH 735 XIV NPJ 141
VII RGN 281, DIVYA 44, RMM 09-3 XV CAN 83
VIII PR 2007-1, SKM 815, DRMR 868-3 XVI Parasmani 33
Table 2: Average Intra (Bold) and Inter cluster distance values in Indian mustard
Cluster I II III IV V VI VII VIII I 4.425 6.779 9.448 9.130 12.358 10.534 14.253 8.697 II 4.719 8.685 11.965 10.708 8.080 12.122 9.099 III 4.960 12.633 8.604 9.537 12.789 8.780 IV 5.174 12.378 12.337 15.566 9.879 V 5.225 8.802 10.981 10.732 VI 5.300 10.689 9.926 VII 11.184 14.052 VIII 10.374 IX X XI XII XIII XIV XV XVI
Cluster IX X XI XII XIII XIV XV XVI
I 11.713 13.689 10.466 17.993 12.921 22.480 11.186 20.277 II 11.223 11.878 8.096 15.713 12.560 22.233 12.475 18.834 III 13.258 10.270 10.690 10.310 12.513 19.536 12.440 15.671 IV 10.297 14.087 14.248 18.527 10.476 19.606 10.510 21.020 V 11.098 9.126 10.836 9.208 7.843 18.962 15.453 14.673 VI 11.600 10.627 9.441 13.825 10.069 19.339 12.220 18.799 VII 16.558 10.802 11.469 16.010 12.385 18.610 15.126 14.021 VIII 11.752 12.113 11.633 14.658 11.434 20.968 10.868 19.358 IX 7.497 14.885 14.420 16.498 10.880 22.456 16.378 22.846 X 10.821 11.953 12.360 11.223 18.296 14.281 13.701 XI 10.453 15.740 13.435 22.407 14.513 16.739 XII 0.000 14.014 21.579 19.450 15.957 XIII 0.000 21.272 15.366 18.760 XIV 0.000 17.455 18.363 XV 0.000 20.717 XVI 0.000
Journal of Progressive Agriculture, Vol.3, No. 1: April 2012
57
Table 4: Cluster means for different characters in mustard
Cluster SY DM SW DF PH I 3024.00 154.67 4.80 62.00 218.50 II 2899.83 153.50 5.20 60.50 234.00 III 2867.50 152.50 5.90 56.50 217.00 IV 2509.00 159.67 4.90 61.50 210.50 V 2598.33 157.00 6.40 63.00 230.83 VI 3316.67 153.00 5.60 57.50 234.00 VII 2963.22 155.00 5.07 64.67 232.67 VIII 2616.56 153.67 5.20 57.33 224.89 IX 2670.33 159.00 6.50 63.00 223.50 X 2646.58 153.75 5.55 60.25 229.00 XI 2507.00 156.50 5.20 61.50 243.00 XII 2351.67 154.00 7.40 55.00 236.00 XIII 3099.00 159.33 5.60 66.00 250.67 XIV 2662.00 153.00 5.80 54.00 138.00 XV 2299.67 150.00 3.80 52.00 200.00 XVI 1929.33 160.00 5.80 66.00 212.00
Cluster PB SB SMS LMS SL SS
I 7.50 76.00 70.00 107.00 4.65 14.50 II 6.50 73.00 64.00 104.00 5.50 15.50 III 7.00 66.5 62.50 97.50 4.70 16.50 IV 6.50 60.00 60.50 108.00 5.00 13.50 V 5.50 46.67 60.50 99.50 5.30 15.00 VI 6.00 43.50 63.00 107.50 5.65 16.00 VII 6.00 46.33 59.33 91.00 5.40 16.00 VIII 6.67 63.67 59.33 104.33 4.80 15.00 IX 7.00 59.5 55.00 117.00 6.55 14.50 X 6.50 52.25 55.25 90.25 5.25 14.75 XI 6.00 63.50 78.00 101.50 5.05 14.50 XII 6.00 47.00 51.00 94.00 5.10 17.00 XIII 6.00 38.00 43.00 101.00 5.10 14.00 XIV 4.00 31.00 66.00 89.00 6.50 18.00 XV 6.00 57.00 59.00 103.00 4.60 17.00 XVI 7.00 61.00 68.00 70.00 4.80 16.00
SY = Grain yield (kg/ha) DM= Days to maturity SW =1000-Seed weight (g) DF= Days to 50% flowering PH = Plant Height (cm) PB= Number of primary branches SB = Number of Secondary branches SMS= Number of siliqua per main shoot LMS = Length of main shoot (cm) SL= Siliqua length (cm) SS= Seeds per siliqua Table 3: Per cent contribution of different characters to total genetic divergence Source Times ranked first Contribution (%) Seed yield per ha (kg) 2 0.43 Days to maturity 0 0.00 1000-Seed weight (g) 33 7.10 Days to 50 % flowering 14 3.01 Plant Height (cm) 26 5.59 Number of primary branches 1 0.22 Number of Secondary branches 20 4.30 Number of siliqua per main shoot 11 2.37 Length of main shoot (cm) 60 12.90 Siliqua length (cm) 73 15.70 Seeds per siliqua 225 48.39
REFERENCES
Arha, M.D., Solanki, R.K. and Tomar, R.S. 2006.Genetic diversity in Indian mustard (B. juncea). J Oilseeds Res 23: 156-158.
Arunachalam, V., A. Bandyopadhyay, S.N. Nigam and R.W. Gibbon, 1984. Heterosis in relation to genetic divergence and specific combining ability in groundnut (Archic hypogaea L.). Euphytica, 33: 33-39
Aunwinithul, Shanti Patil, Charjan, S.U., Thakare, P.G. and Wankhade, M.2004, Genetic divergence studies in Indian mustard. Soil and Crops, 14(2): 297-304.
Patel, J.M., Patel, K.M., Patel, C.J. and Prajapati, K.P. 2006. Genetic variability of divergence in Indian mustard. Indian J Genet 66: 49- 50.

Journal of Progressive Agriculture, Vol.3, No. 1: April 2012
58
Mahalanobis, P. C. 1936. On the generalized distance in statistic. Proc. National Institute of Science 50: 803-806.
Rao, C. R. 1952. Advanced statistical methods in Biometrcal Research. John Wiey and Sons Inc, New York.
Singh, V., Bhajan, R. and Kumar, K. 2007. Genetic diversity in Indian mustard (B. juncea). Progressive Agriculture 7: 105-109.
Tomooka, N. 1991. Genetic diversity and landrace differenciation of mungbean an evaluation of its relatives as breeding materials. Tech. Bull. Trop. Res. Centre. Japan No. 28. Ministry of Agriculture, Forestry and Fisheries, japan., pp:1.
Verma, O.P., Kushwaha, G.D. and Singh, H.K., 2000, Heterosis in relation to genetic diversity on Indian mustard. No. 22 April 2000, Cruciferae Newslet., pp.93-94.
Journal of Progressive Agriculture, Vol.3, No. 1: April 2012
59
Solid state fermentation of Apple pomace as affected by combinations of enzymatic treatment and yeast strains
M. MAHAWAR1, A. SINGH2, B.K KUMBHAR2, M. SAHGAL3 AND KHAN CHAND2
1PhD scholar, Department of Agricultural engineering, IARI New Delhi-110012, India 2 Department of PHP&FE, 3 Department of Microbiology, GBPUA&T Pantnagar – 263145, Uttarakhand, India
E-mail: [email protected]
ABSTRACT
Apple pomace (AP) is main by-product of apple processing industries which accounts for 25% of original fruit mass and contains considerable amount of sugars. Cellulase and amylase enzymes were used to raise the initial sugar content of the AP sample. Fermentation of AP was conducted on laboratory scale in 250 ml flask at 300C at different pH levels of 4, 4.5 and 5.0 using the Y51 strain, Saccharomyces cerevisiae 3206 and their combination. Ethanol yield of 5.23% was obtained in the case where strain Y51 was used as inoculum, initial pH of the sample was 4.5 and the fermentation period of the sample was 72 hours. Fermentation efficiency in this case was found to be 82%. (Design Expert 7.1.6) was used to design the experiments and to analyze the obtained data.
Keywords: saccharomyces cerevisiae, Y51, cellulose and fermentation efficiency Apples are the fourth most widely produced fruit in the world after bananas, oranges and grapes. AP is the solid residue that remains after the extraction of juice from apple. Its disposal as such causes considerable economic (Miller et al., 1982) and environmental (Hang and Woodams 1986) problems. More than 500 food processing plants in India produces about 1.3million tonnes of AP annually which involves annual disposal expenditure of 5 crore rupees (Jewell et al., 1984). Hence there is a strong need to have an integrated approach for waste utilization and its treatment. Owing to the high carbohydrate content, AP is used as a substrate in a number of microbial processes for the production of organic acids, enzymes, single cell protein, ethanol, low alcoholic drinks and pigments (Bhushan et al., 2008). AP serves as the potential source of ethanol. Jain et al., (2006) has reported the ethanol yield of 4.074% in inoculated fermentation using Y51 strain when the initial pH of fermentation is 4.5 and the sample was kept for 72 hours of incubation at 300C. Kumar et al., (2008) reported the maximum ethanol of 5.02% when Y51 was inoculated to the substrate combination of 75% AP plus 25% molasses at 72 hours of fermentation. The present work has reported the highest yield of ethanol 5.23% from the 1:10 diluted AP sample when the Y51 strain was inoculated at initial pH of 4.5 and the fermentation period was kept for 72 hours. Fermentation efficiency of the process was found to be 82% which was highest among the previous work done.
MATERIAL AND METHODS
Substrate procurement and pretreatment Apples of Red delicious variety were procured from the local market of Pantnagar as per requirement and stored in the refrigerator40C until needed for experiments. AP was prepared using hydraulic press in
the bioconversion laboratory of the Department of PHPFE, GBPUAT Pantnagar. Sterilization of AP and glass vessels was done by using autoclave unit to kill the already available yeast and other microorganism at pressure of 15 psi (1210C) for 15-20 minutes.
Microorganisms used Yeast strain Saccharomyces cerevisiae 3206 was procured from IMTC Chandigarh while Y51 strain was procured by natural fermentation of AP in the bioconversion laboratory. These both strains were found to grow independently when inoculated in the same medium. It was confirmed by analyzing their growth in petri plate after 48 hours of streaking on YPD media. This proves that the growth of one doesn’t affect the growth of other.
Experimental design Design expert 7.1.6 software was used to design the experiments. The design used was Box- Behenken and the total number of experiments were came out to be 17. The variables selected are type of yeast (Y51, SC, and combination), pH (4.0, 4.5, and 5.0) and fermentation time (24, 48, 72 h). Some variables which were kept constant during the experiment are fermentation temperature (300C), agitation speed (55 rpm), dilution level (1:10), sample size (150 ml), amylase concentration (0.075 g), cellulase concentration (0.006 g), enzyme treatment (alpha-amylase + cellulase) and incubation period (1 h).
Sample preparation For making the required dilution level (1:10) sample 13.65 g of AP was diluted in 136.5 ml of distilled water. The sample was treated with the enzyme combination of amylase and cellulase and kept in the incubator shaker for proper mixing for 1 hour at 120rpm. Later, the samples were kept for study as per the levels of the independent variables obtained by the

Journal of Progressive Agriculture, Vol.3, No. 1: April 2012
60
design. Samples were withdrawn at the specified intervals and were tested for their sugar, ethanol, pH and viable count individually. Ethanol estimation Distillation unit maintained at 78-820C was used to extract ethanol produced from the samples withdrawn at specified interval. The ethanol content was estimated calorimetrically as reported by (Reid and Salmon 1955). Reducing sugar estimation Dinitrosalicylic acid (DNS) method was used to determine the reducing sugar percentage in the apple pomace sample before and also after fermentation was carried out (Miller 1972).
pH The pH value of sample was measured directly by digital pH meter (Triode India). The least count of pH meter is 0.01 and can work between temperature ranges of 0-1000C. The pH probe calibrated using standard buffer solution (pH 4 and 7) prior to measurement of pH of sample at 300C. Total viable counts Each petri plate was divided into four equal parts and then the colonies were counted in a single part and then multiplied by 4, this gives the total number of colonies in a single petri plate.
Colony Forming Unit (CFU) = No. of colonies x Dilution factor Aliquot sample Data analysis The data obtained during the experiment was statistically analyzed by using Design Expert 7.1.6 software. A full second order mathematical model was fitted into each response. The adequacy of the model was tested using coefficient of determination (R2) and
Fisher’s F-test. The effects of variables on responses were then interpreted, if the model was found adequate, the best fit equations were developed in order to draw contour plots for showing the effect of independent variables on those responses and to select the range of variables for an acceptable product.
Table 1: Data obtained during the experiment
Variables Responses Run Yeast
Strains pH Time
(h) Utilized Sugar Change in
pH Cell count
cfu/ml Ethanol
1 SC 5.0 24 1.24 1.32 90000 0.65 2 SC 4.0 72 7.65 0.53 1.5E+008 0.94 3 Y51 4.0 48 4.29 0.36 5.7E+007 3.95 4 SC 4.0 24 1.57 1.04 109000 0.75 5 COM 4.5 48 3.94 0.64 1.1E+008 1.26 6 SC 4.5 48 4.78 0.55 6.3E+007 0.98 7 COM 4.0 48 4.26 0.58 8.9E+006 1.09 8 SC 4.5 48 4.94 0.52 6.9E+007 1.05 9 SC 4.5 48 5.22 0.48 7.3E+007 1.12
10 COM 4.5 24 1.35 0.66 9.5E+006 0.58 11 COM 4.5 72 8.86 1.05 1.58E+008 1.43 12 Y51 4.5 72 8.61 0.76 1.56E+008 5.23 13 Y51 5.0 48 4.70 1.13 8.2E+007 4.86 14 SC 4.5 48 5.08 0.54 5.9E+007 1.17 15 Y51 4.5 24 1.52 1.31 103000 2.42 16 SC 4.5 48 4.64 0.45 6.7E+007 0.89 17 SC 5.0 72 7.85 1.14 1.46E+008 1.28
RESULTS AND DISCUSSION
Characteristics of Apple Pamace The total sugar concentration of Apple Pamace was in the range of 16.34 to 17.50%, while the reducing sugar concentration was in the range of 10.65 to 13.10% after the enzyme treatment. Apple Pamace was a poor
source of nitrogen. As per the result of micronutrient analysis the salts of the essential nutrients i.e. Ammonium sulphate 0.02g/150ml of sample was added before keeping it for fermentation.
Development of second order model A complete second order model was fitted to the data and adequacy of the model was tested considering R2

Journal of Progressive Agriculture, Vol.3, No. 1: April 2012
61
(the coefficient of multiple determination) and fisher’s F-test. The models were then used to interpret the effect of various parameters on the response.
Optimization of process parameters was carried out and contours were developed for selected parameters. A second order response function for three independent variables has the following general form:
Where, β0, βii, βij are constants Xi, Xj are variables (coded) The experimental data were then analyzed employing multiple regression technique to develop response functions and variable parameters optimized for best outputs. Sugar utilization The maximum sugar (8.86%) was utilized in the case of combination of yeast strains with the initial fermentation pH of 4.5 and the fermentation period of 72hours, it was due to the fact that colony forming units of yeast cells were maximum in this case as both the strains were inoculated in the sample. Sugar was metabolized by yeast cells for its growth and was subsequently converted into ethanol. Yeast favours an optimum value of pH (4.3-4.7) for their growth and hence utilize maximum amount of sugar during this range (Neuberg 1958). The coefficient of determination (R2) for the regression model for utilized sugar was 99.20%. Model was highly significant (p<0.05) with F as 95.92. Effect of independent variables was highly significant (p< 0.01) at linear level, while the level of significance at quadratic level was 5%. The model F- value was also found to be highly significant at 1% level of significance. Change in pH The value of change in pH was calculated by subtracting the final value of pH after fermentation from the initial value. Coefficient of determination (R2) was 97.43%, model was highly significant (p<0.05) with F value of 29.48. It was observed that all the 3 parameters viz. yeast strain, pH and fermentation time affected the change in pH at 1% level of significance. Cell count During the fermentation process throughout, an increasing pattern was observed for the cell count followed by a decrease. Yeast, during the log phase of their growth cycle utilized the nutrients and hence leads to ethanol production. Higher value indicates the conditions where sample of pomace was treated with combination of yeast strain at pH level of 4.5 and fermentation time was 72 hours. Fermentation time affected the cell concentration at 1% level of significance. There was no significant effect of yeast strain and pH.
Ethanol yield Maximum conversion of sugar into ethanol (5.23%) was observed when the sample was treated with Y51 strain at the pH level of 4.5 and for 72 hours of fermentation. The reason behind this is that strain Y51 converts the sugar into ethanol under the optimum initial pH of 4.5 which is favourable for yeast growth. Similar results for Y51 strain were obtained by Jain et al., (2006) and Kumar et al., (2008). Effect of independent variables on ethanol yield was highly significant (p< 0.01) at linear and quadratic level. Yeast strain affected the ethanol yield at 1% level of significance and fermentation time affected at 5% level of significance. Fermentation efficiency The alcohol production efficiency of the test organisms was calculated according to the method of Bhandari et al., (1979). Actual alcohol yield was determined by dividing the ethanol yield with the amount of total reducing sugars present in the sample initially. The theoretical yield was found to be 51.11% which is same as reported by Ngadi and Correia (1992). Maximum efficiency of 82% was found for the Y51 strain when kept at pH 4.5 for 72 hours of fermentation. The result was found better than as reported by Jain et al., (2006):74.55% and Kumar et al., (2008):73.77%. Apple Pamace sample when treated with the enzyme combination of α-Amylase and cellulase resulted in the higher initial sugar content of 12.50%. Initial pH of 4.5 and treatment of AP with combination of yeast stains resulted in highest sugar utilization (8.86%). Sample inoculated with Y51 results in highest production of ethanol (5.23 %), sugar utilization (8.61%), and maximum cell growth (1.56 X 10⁸ cfu ml-1) at 72 hours of fermentation. It also showed maximum fermentation efficiency of 82%. Initial pH of the sample and fermentation period both affected the process of ethanol production.
ACKNOWLEDGEMENT The author thanks all the co- authors for their support. Thanks also due for the Department of PHPFE, GBPUAT Pantnagar (Uttarakhand), INDIA.
∑∑∑ ∑=+== =
+++= 3
1 i
2iii
3
1ijj i ij
3
1i
2
1iii0 Xβ X Xβ Xβ β Y

Journal of Progressive Agriculture, Vol.3, No. 1: April 2012
62
REFERENCES
Bhandari HC, Malik BK, Junezer LR 1979. Plant scale trials on recovery and recycle of yeast for production of alcohol. Proceedings of 43rd Annual Convention of the sugar Technologists Association. 9-11 Oct. 1979 Kanpur. The sugar Technologists Association of India.
Hang YD, Lee CY, Woodams EE, Cooley HJ 1981. Production of alcohol from AP. Appl. Environ. Microbiology 42(6), 1128-29.
Hang YD, Woodams EE 1986. SSF of AP for citric acid production. Mircen. J. Applied Microbial Biotech 2, 283-287.
Harrison JS, Graham JG 1970. Optimum pH for brewer’s yeast. In; The Yeast. Rose, A.H. and Harrison, J.S. (ed.). London Academic Press, 283-344.
Jain A, Singh A 2006. Ethanol production from AP in natural and inoculated fermentation. Thesis, (M.Tech) G.B. Pant University of Agriculture and Technology.
Jewel WJ, Cumming KJ 1984. AP energy and solid recovery. J.Food Science. (48), 407
Joshi VK, Pandey A 1999. Biotechnology: Food Fermentation. (In) Biotechnology: Food Fermentation.
(Joshi, V.K. and Pandey, A., Eds). Educational Publish Distributors, New Delhi, (1), 124.
Kumar G, Sahgal M 2008. Production of ethanol from AP using yeast strain with improved fermentation under solid state. Thesis, (M.Sc Microbiology) G.B. Pant University of Agriculture and Technology.
Miller JL 1959. Use of Dinitrosalicylic acid reagent for determination of reducing sugars. Analytical biochemistry (31), 426- 28.
Miller JE, Weathers PJ, Mcconville FX, Goldberg M 1982. Saccharification and ethanol fermentation of AP. Biotechnology Bioengineering Symposium (12), 183-191
Neuberg C 1958. Mechanism of ethanol formation in alcoholic fermentation by yeast cells. Industrial Microbiology.
Ngadi MO, Correia LR .1992. Kinetics of solid-state ethanol fermentation from AP. Journal of Food Engineering (17), 97-116
Reid VM, Salmon DG 1955. The determination of ethanol by colorimetric method Analyst. (80), 704.

Journal of Progressive Agriculture, Vol.3, No. 1: April 2012
63
Role of thiourea and sulfuric acid in frost injury on mustard (Brassica juncea L.)
O.P. MEENA, M.L.REAGER1 AND DEEPAK CHATURVEDI Krishi Vigyan Kendra, Jaisalmer,1Krishi Vigyan Kendra, Jalore
Swami Keshwanand Rajasthan Agricultural University –Bikaner, Rajasthan, 345001
ABSTRACT
An on farm testing experiment was conducted during rabi 2006-07, 2007-08 and 2008-09 for three consecutive years at farmers field of Chandan and Bharwa villages of Jaisalmer district, to study the role of thiourea and solid acid in frost injury on mustard (Brassica juncea L.). The objective of the study was refinement of recommended practice of H2SO4 spray on mustard for controlling frost injury. Among the treatments 0.1 per cent spray of thiourea was significantly higher in yield attributes and grain yield (16.61q/ha) over other treatments and farmers practices (13.31q/ha) and it was 24.79 per cent higher over control. This treatment also resulted in the significantly higher economic benefits and gave an extra return of Rs 5,059 over farmer practice because to thiourea imparting frost tolerance in crop plants .The results imply that, thiourea can be considered as an important molecule for increasing stress tolerance of crops under field conditions.
Key words: Mustard, Thiourea, Yield attributes, Yield, Economic Mustard is an important oilseed crop of India and Rajasthan .It having first position in production (26.94,Lt ), area (20.62,Lha) and productivity (1306kg/ha) whereas, Jaisalmer district having 30090 ha area, 27562 tones production and 916 kg/ha productivity. Anonymous (2003-04). low productivity is due to very high temperature at ripening and very low temperature at grain filling stages. At reproductive stage temperature reached up to 1.0 C and crops are effected by frost injury. A biotic stress factors cause extensive losses to agriculture production worldwide. Globally, there has been extensive research concern to achieve stress tolerance in crop plants without compromising their yield. Presently, there is a greater research interest in identifying and employing molecules, which can be used to achieve the stress tolerance in crops under field conditions. In this direction, a thiol molecule whose application not only enhance crop productivity but also does not generate any kind of metabolic imbalances was identified. Thiol was selected as maintain the redox state (-SH) of the cell and its proper functioning under stress conditions. The results are in agreement with Srivastava et al.,2007. Thiourea was selected for further experimental investigations because of its cost effective and eco-friendly nature. All this experimental data supports the view that thiourea has the capability to serve as a potential molecule, to impart frost injury tolerance in plants under field conditions.
MATERIALS AND METHODS
An on farm testing experiment was conducted at farmers field of Chandan and Bherwa village of Jaisalmer district (26.52N 70.55E and 194.5 m altitude) under irrigated conditions, during the rabi (Winter) seasons of 2006-07, 2007-08 and 2008-09. The climate of the region is typically characterized by aridity of the atmosphere and salinity in the
photosphere with extremes of temperature both in summer (May-June) and potential evapo-transpiration are 188.1mm and 2064.0 mm, respectively. During the crop growth period 32, 13 and 08mm rainfall were received in 2006-07, 2007-08 and 2008-09, respectively. The soil of the experimental fields was sandy in texture and taxonomically classified as Typical Torripsamments. The sandy soils of the experimental field was medium in depth, having 0.12 per cent organic carbon, 82.80 kg/ha available N, 8.12 kg/ha available P,218.80kg/ha available K, with PH8.8. The experiment was laid out in Randomized Block Design with 5 replications and 4 treatments in the experiment .treatments comprising farmer practices (smoking, irrigation) as control, 0.1 per cent H2 SO4 spray at 50 DAS and 70 DAS as recommend practices, 0.05 per cent spray of thiourea at 50DAS and 70DAS as intervention point first, 0.1 per cent spray of thiourea at 50DAS and70DAS as intervention point second. The field were fellow during kharif and prepared by Ploughing with tractor drawn disc plough followed by a cross harrowing and planking to obtain thoroughly pulverized seed bed . After a pre-sowing irrigation, the mustard (bio-902) was sown for 3 successive years on 26 oct, 2006, 21 oct,2007 and 28 oct,2008 and harvested on 2 march,2007,01 march,2008 and 05 march,2009 respectively.
RESULTS AND DISCUSSION
Growth Three years data and pooled data showed (Table.1) that application of H2SO4 0.1 per cent and thiourea of 0.05 and 0.1 per cent spray have non significant effect on plant population and plant height whereas, significant impact was registered on numbers of branches per plant and siliquae per plant over farmers practice. The results on productivity under rainfed conditions are in

Journal of Progressive Agriculture, Vol.3, No. 1: April 2012
64
agreement with Anitha el al.(2004) . Yadav et al (2003) also recorded with beneficial effects of thiourea on growth and yield attributes of cowpea and suggested that it might be due to the better partitioning of dry matter.
Yield attributes and yield: The yield attributes like seed per siliquae, test weight, grain yield and stover yield were recorded (Table 2&3) significantly high with thiourea spray of 0.1 percent in pooled and experimental years over, farmers practices, H2SO4 Spray 0.1 percent and thiourea spray 0.05 percent at 50 DAS and 70 DAS. On an average, application of thiourea 0.1 percent spray at 50 DAS and 70 DAS seed per siliquae, test weight, grain yield , stover yield and Biological yield increase by 24.25, 4.70, 24.79,20.79 and 21.75 percent, respectively over control (farmer Practices). The result are in agreement with Rathore et al (2010) in cluster bean to foliar application of sulphydryl compounds . Intodia and Tomar (1994) are in agreement with grain yield enhancement of setaria italica due to thiourea treatment over control. Yadav etal (2010) also agreement with effect of thiourea and zinc on productivity of mung bean (Vigha radiata)
Economics The data on economics (Table 4) revealed that application of 0.1 percent spray of thiourea at 50 DAS and 70 DAS significantly increased net returns and B:C ratio as compared to control during experimental years and pooled basis. On an average (Pooled) recorded net return was Rs.16920/ ha with farmer practices, Rs.18730/ha with 0.1 per cent H2SO4 spray, Rs.21630 / ha with 0.05 percent spray of thiourea and Rs 22510/ha with 0.1 percent spray of thiourea at 50 DAS and 70 DAS. Thiourea spray 0.1 per cent results in to higher net return at the rate of 33.03 percent, 20.18 percent, 4.06 percent over respectively treatments. B:C ratio on pooled basis 2.90 under farmers practices 3.01 under H2SO4 spray 0.1 percent, 3.29 under thiourea spray 0.05 percent and 3.34 with Thiourea spray 0.1 percent at 50 DAS and 70DAS it was 15.17 percent higher over control. The results are in agreement with Bhadoria et al (2002) and Yadav et al (2003) on cowpea economics. It is concluded that application of Thiourea 0.1 percent spray at 50 DAS and 70 DAS is promising for overcoming frost injury in mustard and thus enhance its productivity.
Table 1: Effect of thiourea and Sulfuric acid on plant population, plant Height and number of branches per plant of mustard Treatment Plant population (000/ha) Plant Height(cm) Number of branches per plant
2006-07
2007-08
2008-09 Pooled
2006-07
2007-08
2008-09 Pooled
2006-07
2007-08
2008-09 Pooled
Control 263.86 268.06 270.56 267.49 156.12 171.36 164.82 164.10 5.06 5.12 5.30 5.16 H2 SO4 0.1 % 273.84 270.42 271.98 272.08 166.44 174.16 167.74 169.45 5.32 5.58 5.42 5.44 Thiourea 0.05 % 271.76 275.78 265.84 271.13 167.92 177.02 167.60 170.85 6.22 5.86 5.96 6.01 Thiourea 0.1 % 266.14 276.62 267.70 270.15 176.78 177.36 167.94 174.03 6.74 6.02 6.16 6.31 S.Em 4.322 3.059 2.669 1.976 3.183 0.541 0.486 1.088 0.046 0.066 0.056 0.033 CD 13.32 9.426 8.22 5.67 9.81 1.667 1.50 3.12 0.14 0.202 0.17 0.09 Spray at 50 &70DAS Table 2: Effect of thiourea and Sulfuric acid on siliquae per plant, seeds per siliqua and test weight of mustard Treatment Number of Siliquae per plant Number of Seeds per siliquae Test weight (g)
2006-07
2007-08
2008-09 Pooled
2006-07
2007-08
2008-09 Pooled
2006-07
2007-08
2008-09 Pooled
Control 224.80 223.80 226.20 224.93 10.50 10.64 10.90 10.68 3.56 3.66 3.61 3.61 H2 SO4 0.1 % 234.80 235.80 234.20 234.93 10.98 11.56 11.24 11.26 3.59 3.42 3.65 3.55 Thiourea 0.05 % 241.20 241.20 242.40 241.60 11.58 12.50 12.86 12.31 3.69 3.73 3.75 3.72 Thiourea 0.1 % 245.40 245.40 248.20 246.33 12.84 13.44 13.52 13.27 3.75 3.77 3.82 3.78 S.Em 0.982 1.083 1.232 0.637 0.127 0.091 0.104 0.063 0.013 0.110 0.013 0.037 CD 3.03 3.338 3.80 1.83 0.39 0.279 0.32 0.18 0.04 0.338 0.04 0.11 Spray at 50 &70DAS

Journal of Progressive Agriculture, Vol.3, No. 1: April 2012
65
Table 3: Effect of thiourea and Sulfuric acid on grain yield, stover yield and biological yield of mustard Treatment Grain yield(q/ha) Stover yield(q/ha) Biological yield(q/ha)
2006-07
2007-08
2008-09 Pooled
2006-07
2007-08
2008-09 Pooled
2006-07
2007-08
2008-09 Pooled
Control 13.22 13.40 13.32 13.31 37.54 44.28 44.00 41.94 50.76 57.68 57.32 55.25 H2 SO4 0.1 % 14.42 14.64 14.58 14.55 40.96 43.42 42.68 42.35 55.38 58.06 57.26 56.90 Thiourea 0.05 % 16.32 16.44 15.66 16.14 43.16 46.94 47.20 45.77 59.48 63.38 62.86 61.91 Thiourea 0.1 % 16.34 16.70 16.78 16.61 47.02 52.22 52.74 50.66 63.36 68.92 69.52 67.27 S.Em 0.098 0.062 0.117 0.055 0.266 0.455 0.561 0.257 0.253 0.431 0.629 0.268 CD 0.30 0.190 0.36 0.16 0.82 1.402 1.73 0.74 0.78 1.328 1.94 0.77 Spray at 50 &70DAS Table 4: Effect of thiourea and Sulfuric acid on cost of cultivation, gross returns, net returns and B:C ratio of mustard
Treatment Cost of cultivation(000/ha) Gross returns(000/ha) Net returns(000/ha) B:C ratio
2006-07
2007-08
2008-09
Pooled
2006-07
2007-08
2008-09
Pooled
2006-07
2007-08
2008-09
Pooled
2006-07
2007-08
2008-09
Pooled
Control 8.61 8.96 9.12 8.89 24.92 26.00 26.53 25.82 16.31 17.04 17.41 16.92 2.89 2.90 2.90 2.90 H2 SO4 0.1 % 8.68 9.17 10.19 9.35 27.18 28.22 28.84 28.08 18.50 19.05 18.65 18.73 3.13 3.07 2.83 3.01 Thiourea 0.05 % 8.81 9.36 10.26 9.48 30.67 31.63 31.02 31.11 21.86 22.27 20.76 21.63 3.47 3.37 3.02 3.29 Thiourea 0.1 % 8.96 9.59 10.35 9.63 30.82 32.28 33.33 32.14 21.86 22.69 22.98 22.51 3.44 3.36 3.21 3.34 S.Em 0.001 0.001 0.002 0.001 0.174 0.109 0.230 0.103 0.174 0.109 0.230 0.103 0.020 0.012 0.025 0.011 CD 0.003 0.003 0.006 0.002 0.53 0.336 0.71 0.29 0.53 0.336 0.71 0.29 0.06 0.038 0.08 0.03 Spray at 50 &70DAS
REFERENCES
Anonymous . 2003-04. Directorate of agriculture, Rajasthan, Jaipur. pp 56.
Anitha, S., Sreenivasan E., Purushotamum S.M 2004. Effect of thiourea application on cowpea (Vigna unguniculata(L) walp) productivity under rainfed conditions. Journal of Tropical agriculture 421-2:53-54
Bhadoreia, R.B.S, Kuswaha, H.S and Jadaun, R.S.2002 Effect of thiourea on yield and economics of cowpea (Vigna Unguiculata) under rainfed conditions. Extended summaries Vol.1:2nd International Agronomy Congress 26-30 Novemeber 2002, IARI, New Delhi, pp 453-453
Intodia,S.K. and tomar,O.P.1994. Effect of thiourea on growth and yield of foxtail millet. Annals of Arid Zone 32(2): 129-131
Rator,V.S., Nathawat,N.S, Birbal, Singh, J.P and Bharadawaj, S 2010. Response of cluster bean (Cyamophis tetragonooba) to foliar application of sulphydryl compounds in hot arid environment.
National Symposiaum on Resource management approaches towards livelihood security.2-4 December, 2010 Bengaluru, Karnataka.
Srivastav, A.K., Ramaswamy, N.K. and D’Souza, S.F. 2007. Bioregulatory role of thiourea in multi stress tolerance of the Indian mustard (Brassica Junciea). 18th Nov Phytologist symposium on calcium based signaling systems in plants held at Dublin, Ireland, December 5-7, 2007:pp113-118
Yadav, B.D., Joon, R.K. and Rana, D.S.2003. Effect of thiourea on cowpea productivity under rainfed condition. Advances in arid legumes research In: India arid legume Society, Scientific Publishers (India), Jodhpur pp 239-241
Yadav,L.R., Keshwa.,G.L., Sharma, O.P., Yadav, S.S., and Chodhary, G.L., 2010. Effect of thiourea and zinc on productivity of mungbean (vigna radita). National Symposium on resource Management Approaches towards livelihood Security 2-4 December, 2010, Bengaluru, Karnataka.

Journal of Progressive Agriculture, Vol.3, No. 1: April 2012
66
Bioefficacy of Spinetoram 12 % SC against Thrips and Boll worm Complex on Cotton
VICHITER SINGH1, JEEWA RAM VERMA2 D.S. BHATI2, SANJEEV KUMAR3 AND R.K.SANP3 Senior cotton Entomologist, Agricultural Research Station1, SMS, Krishi Vigyan Kendra, (SKRAU)2, Research
Fellow, ARS, Sriganganagar3 Email: [email protected], [email protected]
ABSTRACT
The new insecticides Spinetoram 12 % SC along with Profenophos 50 % EC, Novaluran 10 % EC and control were tested against Thrips(Thrips tabaci) and Bolloworm(Spodoptera) on cotton crop. The maximum reduction in the population of both the pest were recorded in the treatment of Spinetoram 12 % SC (42.4 %) @56 g a.i /ha and minimum in Novaluran 10 % EC @75 ml a.i./ha (24.7). Profenophos 50 % EC and Novaluran 10 % EC @75 ml a.i. /ha, which were on par with each other. In case of square damage, Spinetoram 12 % SC @ 56 g a.i./ ha was significantly effective with minimum square damage of 14.1 % against the check of 26.1 %. Maximum square damage 22.00 was found in case of Novaluran 10 % EC @75 ml a.i/ha. Regarding boll damage, the same insecticide was found most effective with 7.1 % open boll damage against control of 11.15 %. Maximum open and green boll damage (15.06 and 22.65 %) was recorded from Novaluran 10% EC @ 75 ml a.i./ha. In cases of Spodoptera, Spinetoram 12 % SC @ 56 g a.i./ha was found most effective in controlling the larvae population (12.2 %).Significantly higher seed cotton yield was obtained from Spinetoram 12 % SC@ 56 g a.i / ha with 24.03 qtl/ha as against control 16.79qtl/ha.
Key words: Gossipium hibiscus Thrips, Bioefficacy Cotton is a commercial fibre crop and is cultivated on 76.1 lac hectares with a production of 310 lac bales; the productivity of the crop is only 374 kg lint per hectare (Anonymous, 2003). Among sucking insect pests viz., whitefly (Bemisia tabaci), thrips (Thrips tabaci) and jassid (Amrasca biguttula) are the most serious pests and have recently attained the status of a regular cotton pest in India. They sucks cell sap from the lower side of the leaves and secretes honeydews on which sooty mold develops, which interferes with plant photosynthesis, ultimately reducing the yield. Whitefly adults transmit viral diseases. Among different control measures, the chemical control of insect pest is quick and rapid one. The present study is therefore, carried out on the comparative bio-efficacy of new molecules Spinetoram at four doses with other insecticides against thrips and boll worm.
MATERIALS AND METHODS A field trial was carried out to evaluate the bio-efficacy of Spinetoram 12% SC, against thrips, bollworm complex and Spodoptera on cotton during kharif 2008-09 and 2009-10 at Agricultural Research Station, Sriganganagar (Raj.). Cotton crop was raised followed recommended package of practices. Four applications of prescribed treatments were made at 12 days interval using hand operated, high volume Knapsack sprayer. Observations on sucking pest population, thrips was recorded before and after each application from three leaves selected from top, middle and bottom of ten randomly selected plants in each plots. To count the larval population of bollworms complex (3 &7 DAS) and Spodoptera (3, 7, 10 &15 DAS), 20 plants from each plot were randomly selected and tagged for recorded larval population from each applications. Per cent green boll damage and open boll
damage were recorded at picking stage. Seed cotton yield was recorded at picking time. Pooled data of two years recorded were subjected to statistical analysis.
RESULTS AND DISCUSSIONS Maximum reduction in the population of the pest was recorded in the treatment of Spinetoram 12% SC (42.42%) @ 56 g ai/ha. However, Spinetoram 12% SC @ 50g ai/ha (42.06%) and Spinetoram 12% SC @ 44 g ai/ha (40.72 %) were found at par. Novaluran 10 EC @ 75 ml ai/ha (24.79 %) found to be least effective against thrips among all insecticidal treatments. (Table1). Data presented in Table3 revealed that all the insecticidal treatments significantly reduced the larvae of bollworms as compared to untreated control. However, Spinetoram 12% SC @ 56 g ai/ha was at par with its lower doses @ 50 & 44 g ai/ha and Spinetoram 12% SC @ 56 g ai/ha found most effective against larvae of bollworms as recorded at 3 and 7 days after spray. Similarly, treatment Indoxacarb @ 75gm /ha and Novaluran 10 EC @ 75 ml /ha were at par with each other. Minimum damaged square was recorded in the plot treated with Spinetoram 12% SC @ 56 gm /ha (14.10%) which was at par with Spinetoram 12% SC @ 50gm /ha (14.35%) and Spinetoram 12% SC @ 44 gm/ha (15.50%). However maximum square damage recorded in Novaleuron 10% EC @ 44 ml/ha plot (Table 3). Data presented in Table 2 revealed that all the insecticidal treatments significantly reduced the boll damage green as well as open boll caused by bollworm complex as compared to untreated control. However, Spinetoram 12% SC @ 56 gm /ha was at par with its lower doses @ 50 & 44 gm/ha and Indoxacarb @

Journal of Progressive Agriculture, Vol.3, No. 1: April 2012
67
75gm /ha along with recorded minimum boll damage (green and opened boll). The maximum boll damage (green and opened boll) was recorded in Profenophos 50 % EC @ 500 ml/ha. Data presented in Table 3 revealed that all the insecticidal treatments significantly reduced the larvae of Spodoptera as compared to untreated control. However, Spinetoram 12% SC @ 56gm/ha was at par with its lower doses @ 50 & Novaluron 10 % EC @ 75 ml/ha. Spinetoram 12% SC @ 56gm/ha found most effective against larvae of Spodoptera sp. Where as treatment Indoxacarb 15 % SC @ 75 ml/ha was found least effective against Spodoptera. Seed cotton was observed significantly higher in all the insecticidal treated plots over untreated. Highest Seed
cotton was recorded in the plots treated with Spinetoram 12% SC @56 gm /ha (24.03 q/ha) and it was at par with its lower dose Spinetoram 12% SC @ 50 gm /ha (21.89 q/ha) and Spinetoram 12% SC @ 44 gm /ha (21.08 q/ha). Where as treatment Novaluron 10 % EC @ 75 ml/ha (18.0 q/ha) gave least seed cotton yield. (Table 2) It can be concluded from above study that effective management of against thrips and bollworm complex could be achieve through application Spinetoram 12% SC @ 56 g ai /ha and Spinetoram 12% SC @ 50 g ai /ha. Higher seed cotton yield could be achieved by application of the same treatment. These results are in agreement with Methew (1994), Razak et al (2003) and Singh and Chender. (2009).
Table: 1. Bio-efficacy of Spinetoram 12% against thrips on cotton.
ˠ Average of Two year population data # = Pooled data of four spray; * = Data in parentheses are √ +1 value **= Data in parentheses are angular transformed value Table: 2. Efficacy of Spinetoram 12% against Bollworms complex in cotton #
Treatments Formulations dose (g or ml. ai /ha)
Av. of two year Larval population/20plant* % Square damage **
3 DAS 7 DAS Spinetoram 12% SC 36 7.25 (2.69) 4.30 (2.07) 15.25 (22.95)
Spinetoram 12% SC 44 11.20 (3.34) 8.35 (2.88) 15.50 (23.18)
Spinetoram 12% SC 50 10.15 (3.18) 7.55 (2.74) 14.35 (22.22)
Spinetoram 12% SC 56 9.75 (3.12) 5.80 (2.40) 14.10 (22.06)
Profenophos 50 % EC 500 12.65 (3.55) 9.25 (3.04) 18.70 (25.62)
Indoxacarb 15% SC 75 16.20 (4.02) 11.90 (3.44) 16.20 (23.70)
Novaluran 10 EC 75 15.256 (3.90) 13.60 (3.68) 22.00 (27.97)
Control -- 18.10 (4.25) 16.45 (4.05) 26.10 (30.72)
CD (P=0.05) 1.05 1.80 1.95 # = Pooled data of three spray; * = Data in parentheses are √ +1 value **= Data in parentheses are angular transformed value
S. No
Treatments
Dose g or ml ai
/ha
Thrips/ 3 leaves ˠ Reduction %
Boll damage %* Yield q/ha BS AS Green Boll Open Boll
T1 Spinetoram 12% SC 36
28.64(5.34) 19.86(4.43)* 30.65 20.40 26.85)** 12.25 (20.44) 20.08
T2 Spinetoram 12% SC 44 34.67(5.89) 20.55(4.53) 40.72 16.58 (24.04) 10.71 (19.09)
21.08 T3 Spinetoram 12% SC 50
32.50(5.70) 18.83(4.32) 42.06 15.78 (23.42) 8.55 (16.95) 21.89
T4 Spinetoram 12% SC 56 25.35(5.03) 14.6 (3.82) 42.42 15.20 (22.95) 7.10 (15.45) 24.03 T5 Profenophos 50 % EC 500 28.30(5.31) 20.2(4.49) 28.62 22.65 (28.32) 13.45 (21.47) 19.59 T6 Indoxacarb 15% SC 75 28.30(5.31) 21.2(4.60) 25.09 19.15 (25.91) 9.85 (18.34) 22.55 T7 Novaluran 10 EC 75 35.50(5.95) 26.7(5.16) 24.79 20.48 (26.85) 15.06 (22.79) 18.60 T8 Control -- 38.76(6.18) 30.87(5.53) 20.35 29.49 (32.83) 11.55 (19.82) 16.79 S.Em ± 1.05 0.15 -- 1.68 1.19 1.68 CD (P=0.05) 3.08 0.45 -- 5.00 3.55 5.00 CV % 10.22 8.95 -- 10.38 13.32 10.38

Journal of Progressive Agriculture, Vol.3, No. 1: April 2012
68
Table: 3. Bio-efficacy of new formulations on population of Spodoptera in cotton
Treatments Formuln dose (g or ml./ha)
Larval population/20 plants*
Pre- Treatment count
Av. of two year Pooled data of four application
3 DAS 7 DAS 10 DAS 15 DAS Mean
Spinetoram 12% SC 36 17.3(5.2) 15.2(4.9) 15.0(4.9) 13.9(4.7) 13.2(4.6) 14.32
Spinetoram 12% SC 44 16.7(5.1) 14.5(4.8) 15.2(4.9) 14.8(4.8) 12.5(4.5) 14.25
Spinetoram 12% SC 50 15.0(4.9) 13.2(4.6) 11.3(4.4) 12.0(4.5) 9.4(4.1) 11.47 Spinetoram 12% SC 56 15.2(4.9) 12.5(4.5) 10.6(4.3) 11.6(4.4) 10.9(4.3) 11.40 Profenophos 50 % EC 500 16.7(5.1) 18.8(5.3) 17.8(5.2) 17.9(5.2) 18.1(5.3) 18.15 Indoxacarb 15% SC 75 18.6(4.31) 15.3(4.8) 10.10(4.2) 12.5(4.5) 12.1(4.6) 12.50 Novaluran 10 EC 75 17.0(5.1) 13.0(4.6) 12.7(4.6) 11.0(4.3) 10.5(4.2) 11.80
Control -- 21.5(4.63)
19.5(4.41)
18.6(4.31)
22.5(4.74)
12.6(3.54) 18.30
CD (P=0.05) NS 0.27 0.31 0.41 0.25 0.55
DAS= Days after spray; ** Data in parentheses are √ +1 value
REFERENCES Anonymous, 2003. Annual Report of All India Coordinated Cotton Improvement Project CICR Regional Station, Coimbatore. pp. 1-4.
Buttler, J. R.and Henneberry, T.J., 1994. Bemisia and Trialeurodes (Hemiptera: Aleyrodidae), insect Pests of cotton. CAB International, UK. Pp.325-335.
Mathew, G.A., 1994. Insect and Mite pests: General Introduction in. In: Mathews, G.A and J.P. Tunstall (eds.) Insect-pests of Cotton. CAB International. Wellington, UK.
Razaq, M., M. Aslam, Kashif Sharif, B, Salman, and Aleem, M. Faraz., 2003.Evaluation of insecticides against cotton whitefly, Bemicia tabaci (Genn.) (Homoptera : Aleyrodidae). J. res. Sci., 14 (2): 199-202.
Singh, V. and Ramesh Chender., 2009. Testing the new molecule POLO 50 WP (Diafenthiuron) against cotton whitefly, Bemisia tabaci (Genn.). Pestology, 33 (3) : 50-52.
Journal of Progressive Agriculture, Vol.3, No. 1: April 2012
69
Viability of Commercial Dairy Farming in Haryana
1NIRISH CHANDRA SAHU, 2JANCY GUPTA AND 3SHIV RAJ SINGH 1PhD Scholar, Dairy Extension NDRI, Karnal-Haryana, 2Head &Principal Scientist, Dairy Extension Division, NDRI, Karnal-Haryana and 3PhD Scholar, Dairy Economics Statistics & Management, NDRI, Karnal-Haryana.
Email: [email protected]
ABSTRACT A study to assess the viability of commercial dairy farming was conducted in Haryana state during the year 2009-2010. The sample dairy farms were categorized on the basis of milch herds. Proportion of investment on milch animals was found highest in large commercial dairy farms whereas proportion of investment on sheds and machinery was maximum in small commercial dairy farms. The net cost of milk production per litre for milking crossbred cattle on small, medium and large farms was estimated to be `10.68, `10.21 and `9.49 whereas for milch cow `10.89, `10.62 and `9.99 respectively. The net cost of milk production per litre for milking buffalo on small, medium and large farms was estimated to be `15.50, `15.01, and `14.96 whereas for milch buffalo `16.19, `15.62 and `15.73 respectively. Viability of large dairy farms was highest based on the investment pattern and estimates of cost and returns of milk production in comparison of medium and small commercial dairy farms.
Key words: Farm income, net cost, technical feasibility. The projected milk demand in India by 2020 will be 160-180MTs (Radha Krishna & Reddy 2007). To realize this “dairy vision” of 2021-22, milk production needs to continue growing at a rate of 4% annum (NDDB, 2008). Further the globalization of Indian economy has thrown open a large number of opportunities for dairying with increasing national per capital requirement of milk. On the other hand, we also have a large proportion of rural population, partially dependent upon livestock rearing, even though the availability of land is shrinking due to urbanization. Therefore, it can be safely stated that commercialization of dairying is not an option but a necessity to support rural economy. Dairying definitely offers itself as a prospective farm diversification means with immense commercial potential (Balaraman, 2004). Traditionally dairying has been a small holder’s enterprise, now it is passing through transition and farmers have taken up dairy farming as a commercial enterprise. These commercial dairy farms can only sustain if they are earning reasonable profit, which is the prime concern of the commercial enterprise. Therefore, it is very pertinent to study the viability of these herds, which demands a detailed analysis of the investment pattern and estimates of cost of milk production and returns of commercial dairy farms. The information on the profile of commercial dairy farms, cost and returns from milk production will provide useful insight into the parameters of profitability of dairy enterprise to the owner so that the full genetic potential of the animals can be tapped. Economic analysis of dairy farming provides the basis for delineating the possibilities of controlling costs of milk production and increasing the returns to make it a viable enterprise (Bhowmik and Sirohi 2008). Thus, in order to evaluate and explore the possibilities of commercial dairy farming as a viable enterprise in Haryana, a study was undertaken with focus on profile
of commercial dairy farms and estimation of the cost and returns of milk production.
MATERIALS AND METHODS
Sampling design A multistage sampling technique was used for the selection of zone, districts and respondents. Karnal, Kurukshetra, Yamuna Nagar and Kaithal districts of Haryana were purposively selected due to more number of commercial dairy farms and well developed infrastructure for dairy development. Further due to their location on the Grand Trunk Road and connectivity, commercial dairy farming is widely prevalent in this region. Keeping in view the discussion with the experts of animal science and preliminary study of different herds, commercial dairy farms for the present study were considered as those farms having a herd size of minimum 30 milch animals. The selected sample dairy farms were then categorized into small, medium and large categories. The commercial herds in the present study have been categorized on the basis of herd size for which the standard methodology of cumulative cube root frequency method of stratification was used. Various categories of dairy farms obtained were small (30- 44 milch animals), medium (45-69 milch animals) and large (> 69 milch animals). Accordingly, the sample commercial dairy farms selected in the present study comprised of 23 small, 14 medium and 8 large dairy farms constituting a total of 45 respondent dairy farms.
Analytical Framework Socio economic characteristic of dairy farm owner and average herd size of commercial dairy farm was estimated by using tabular analysis method. The income generating capacity of a dairy owner is reflected through investment pattern. The fixed investment on a dairy herd comprises of viz. investment on animals, investment on cattle shed and
Journal of Progressive Agriculture, Vol.3, No. 1: April 2012
70
stores, machinery and equipments. The proportionate investment on the above items was worked out separately for various categories of farms. It was felt pertinent to study the cost of milk production, since it enables to comprehend the intricate issues involved in milk production and is the most important indicator of economic efficiency of milk production. The various cost components identified were broadly classified into
‘fixed costs’ and ‘variable costs’. The cost and return structures were worked out by using the formula: 1. Gross Cost = Total Variable Cost + Total Fixed Cost a) Fixed Cost (FC): The fixed cost was apportioned on the basis of Standard Animal Units and it included interest on fixed capital and depreciation. The conversion co-efficient used for apportioning the fixed costs were:
Types of animal Conversion factor Adult Cross bred cattle (milch) 1.4
Milch Buffalo 1.25 Heifer 0.75 Local cattle (milch) 1.00
Working bovine 1.00 Young stock above 1 year 0.50
Young stock below 1 year 0.33
The interest on fixed capital was worked out at the prevailing rate (8%). The depreciation on milch
animals was calculated by straight line method. The rates of depreciation were:
Types of animal Depreciation (%) Productive life (years) CB Cows 8 12.5 Local cows 10 10 Buffalos 10 10 Depreciations on cattle shed, stores and dairy equipments were be calculated by using straight line method Particulars Percentage Particulars Percentage Pucca building 2 Chaff cutter (manual) 10 Kutcha building 5 Milk can 20 Bullock cart 10 Feed manger 20 b) Variable Cost: It included feed cost, labour cost, veterinary cost and miscellaneous cost. i) Feed and Fodder Cost: Cost on green fodder, dry fodder and concentrate were worked out by multiplying quantities of feeds and fodders with their respective prevailing prices in the study area. ii) Labour Cost: It included cost of family as well as hired labour. The cost of hired labour was calculated considering wages paid. In case of family labour, the imputed value obtained depends upon the time spend in dairying and prevailing wage rate of casual labour in the study area. iii) Veterinary Cost: It included the cost of breeding for Artificial Insemination (A.I) or service charge of bull as well as cost of vaccination and medicines iv) Miscellaneous Cost: It included the cost of repair, electricity, water charges, purchase of milk can, bucket, rope, etc. They were calculated on the basis of per day expenditure for different types of milch animals kept by the sample households. Interest on working capital was not calculated as income from sale of milk was regular. 2. Net Cost = Gross Cost - Value of dung
3. Cost per litre of milk production= the average net maintenance cost per household per day/ average milk production per household per day. 4. Gross Returns = Quantity of milk x Price of milk 5. Net Returns = Gross Returns - Net Cost
RESULTS AND DISCUSSION
1. Profile of commercial dairy farms: Results in Table-1 revealed that majority of the commercial dairy farmers were of medium age group i.e. 36 to 50 years. More than 50 percent of farmers were graduate and postgraduates and large commercial farmers constituted maximum (75%) of this category. There was no illiterate farmer among commercial dairy farmers under the study. Majority of the respondents were having joint family. Among all the categories, maximum (65.22%) of small farmers were found having low experience(less than 8 years) whereas, high experience (more than 14 years) was found among 37.50 percent of large commercial farmers. More than 80 percent of the respondents received some kind of training in dairying. It can also be observed from Table-1, that

Journal of Progressive Agriculture, Vol.3, No. 1: April 2012
71
50 percent of large commercial dairy farmers were having large land holding whereas, there was no landless or marginal farmer as per their land holding. For 62.50 percent of large farmers dairying was primary occupation whereas, 57.14 percent of medium and 43.48 of percent small dairy farmers considered dairying as primary occupation. It can be concluded that large commercial dairy farmers were most competitive based on socio-economic attributes as compared to medium and small dairy farmers. Commercial dairy farmers take care to maintain various compositions of dairy animals with the objective of profit maximization from dairy enterprise. Therefore, animals maintained by the owner of dairy farms were classified into milch animals, heifers and young stock. The average number of animals within each herd size category is presented in Table 2. Different species and types of animals were maintained in each individual household. As such a comparison of number of animals does not strictly hold good. In order to have a valid comparison, different species of animals maintained in a household were converted into standard animal units as discussed previously. On an average, a milk producer maintained 52.87 milch animals, 20.82 heifers, and 15.02 calves in the study area. The composition of the milch animals maintained revealed that crossbred cows were the major milch animals in the study area. On an average, the number of animals in standard animal unit was 93.89. The average number of milch animals across different herd size categories was found to be 35.87, 56.15 and 96 on small medium and large size groups respectively. The local cow was found in a few farms only indicating non preference towards the local cattle. Investment Pattern: The pattern of investment in fixed assets in dairy enterprise is an indicator of income generating capacity of the milk producing household. Therefore, total investments made on cattle shed and stores, dairy equipments and milch animals per households as well as per milch animal were worked out for different categories of commercial dairy farmers (Table 3).The total investment per household in small commercial dairy farms was `23.85 Lakhs whereas, for medium and large commercial dairy farms it was `37.09 lakhs and `63.75 lakhs, respectively. It indicates that commercial dairy farming is a highly capital intensive business. It was noted that the highest investment was made on milch animals followed by cattle shed and stores and dairy equipments accounting for 68.32, 21.37 and 10.31 percent of the total investment on the small farms, 71.53, 20.51 and 7.96 percent of the total investment on the medium farms and, 77.46, 15.46 and 7.08 percent of the total investment on large farms respectively. The Table-3 further revealed that the overall average investment per milch animal was
about `47975 which alone accounted for about 72 percent of total investment. Investment on milch animals was found increasing whereas on cattle shed & stores and dairy equipments was decreasing from small to medium to large commercial dairy farms. Cost and returns of milk production: Costs and returns from milk production were estimated for different milch animals maintained by various commercial dairy farms. The analysis was done separately for different species of milch animals to have a better insight of species wise economics of milk production and a detailed component wise analysis of cost of milk production was carried out. Maintenance cost and returns of crossbred cow The overall gross maintenance cost of milking crossbred cow in small, medium and large category of dairy farms was worked out to be `161.47, `175.07 and `185.12 per animal per day respectively and for milch cows `131.58, `151.08 and ` 160.96 per animal per day respectively (Table-4). Total fixed cost which included depreciation and interest was estimated as 15.46 percent, 14.77 percent and 14.30 percent respectively for milking crossbred cow in small, medium and large farms respectively. The total variable cost was 84.54 percent, 85.24 percent and 85.70 percent per animal per day for milking crossbred cow in small, medium and large farms respectively. The net cost of milk production per litre for milking crossbred cattle on small, medium and large farms was estimated to be `10.68, `10.21 and `9.49 and `10.89, `10.62 and `9.99 for milch crossbred cow respectively as per table-4. It can be concluded from the above analysis that net cost of milk production in case of crossbreds was highest on the small category of commercial farms and lowest in the large category. This was due to high feed and fodder cost on small and medium farms. These costs were fairly less on the large farms indicating that they were more economical in feeding as the milk yield doesn’t suggest underfeeding of animals. The large farms were also found to be more economical in terms of labour use. The net cost per litre on sample commercial farms was worked out to be lowest in the large category and highest in the small category. Another important aspect that emerged out from this analysis was that the miscellaneous cost (mainly for AI) component was high on the large category of farms. The cost of AI was found to be particularly high on these farms indicating that better quality of semen is used. A close perusal of its various components reveal that better healthcare and better management practices were adopted in large farms. Maintenance cost and returns of buffalo The overall gross cost of maintenance of milking buffalo in small, medium and large category of sample farms was worked out to be `151.12, `165.90 and ` 172.83 per animal per day respectively and for milch buffalo `122.04, `136.71 and `145.93 per

Journal of Progressive Agriculture, Vol.3, No. 1: April 2012
72
animal per day respectively. Total fixed cost which included depreciation and interest was estimated as 14.29 percent, 14.30 percent and 14.01 percent respectively for milking buffalo in small, medium and large farms respectively. The total variable cost was 87.16 percent, 87.07 percent and 87.34 percent per animal per day for milking buffalo in small, medium and large farms respectively. The net cost of milk production per litre for milking buffalo on small, medium and large farms was estimated to be `15.50, `15.01, and `14.96 respectively (Table-5). The analysis shows that the maintenance cost of buffalo was highest on the large farms and lowest on the small farms. Perusal of various cost components revealed that fixed cost component was higher on medium farms than other categories. Feed and fodder cost was found to be high in the large category. Also, the miscellaneous cost was found to be particularly high in large farms indicating more expenses incurred in, veterinary cost, medicines, detergents, water, other consumables etc.
CONCLUSIONS
Commercial dairy farming is an upcoming business in Haryana. With the stagnant growth of agriculture and high prices of land, the farmers now see it as a
profitable business. Across the commercial dairy farms there were differences in terms of socio-economic, cost and returns at farm level. Large herd size commercial dairy farmers were most competitive based on socio-economic and communication attributes when compared to medium and small commercial dairy farmers. It emerged from the study that rearing of small number of buffaloes in these dairy farms were mainly for home consumption, which clearly indicate the preference for buffalo milk over crossbred cow. Commercial dairy is a highly capital intensive business in Haryana. Maximum share of fixed capital investment was made in the dairy animals followed by cattle shed and stores and dairy equipments. On large farms, sizeable amount of fixed capital was invested in the dairy equipments required for commercial dairying. The net return per litre of crossbred cow milk was highest on the large farms and lowest on the small farms, suggesting that crossbred cow was most profitable for the large category followed by medium and small. Viability of large dairy farms was highest based on cost and returns of milk production in comparison to medium and small dairy farmers.
Table-1 Socio-economic profile of different kinds of commercial dairy farmers Characteristics Categories Small (%) Medium (%) Large (%) Overall Age (in years) Low(<36) 17.39 0.00 25.00 13.33
Medium(36-50) 69.57 57.14 62.50 64.44 High(>50) 13.04 42.86 12.50 22.22
Education Secondary(upto matric) 17.39 14.29 12.50 20 Higher secondary(upto12th) 26.09 21.43 12.50 24.44 Graduate and above 56.52 64.29 75.00 55.56
Experience in dairying(years)
Low(<8) 65.22 42.86 12.50 51.11 Medium(8-14) 30.43 28.57 50.00 28.89 High(>14) 4.35 28.57 37.50 20.00
Training Received 82.61 85.71 87.50 84.44 Land holding (ha)
Marginal(<1) - - - -
Small (1-2) 4.35 14.29 0.00 6.67
Semi-medium (2-4) 39.13 21.43 25.00 31.11
Medium (4-10) 30.43 21.43 25.00 26.67
Large (>10) 26.09 42.86 50.00 35.55
Occupation Dairying as primary 43.48 57.14 62.50 62.22 Dairying as secondary 56.52 42.86 37.50 37.78

Journal of Progressive Agriculture, Vol.3, No. 1: April 2012
73
Table 2- Average herd size per dairy farm
Table 3- Investment pattern on commercial dairy farms Land Size Category
Per Households (Lakh `) Total (Lakh `)
Per Milch Animal (Thousand `) Total (Thousand)
Cattle shed & Stores
Dairy Equipments
Milch Animals
Cattle shed & Stores
Dairy Equipments
Milch Animals
Small 5.09 (21.37)
2.46 (10.31)
16.30 (68.32)
23.85 14.21 6.86 45.43 66.50
Medium 7.61 (20.51)
2.95 (7.96)
26.54 (71.53)
37.10 13.56 5.26 47.26 66.07
Large 9.85 (15.46)
4.51 (7.08)
49.39 (77.46)
63.75 10.26 4.70 51.45 66.41
Overall 6.72 (19.18)
2.98 (8.49)
25.36 (72.33)
35.07
12.72 5.63 47.98 66.33
Figure in parenthesis indicate percentage to total
Table-4 Maintenance cost and Returns per Crossbred cattle (`/animal/day) Cost Components Small Medium Large
Milking Milch Milking Milch Milking Milch
Green fodder 25.12 (15.56)
23.10 (17.56)
27.91 (15.94)
26.01 (17.22)
28.52 (15.41)
26.10 (16.22)
Dry fodder 16.10 (9.97)
17.40 (13.23)
15.46 (8.83)
17.80 (11.78)
14.99 (8.10)
17.04 (10.59)
Concentrate 72.15 (44.68)
45.12 (34.29)
82.11 (46.90)
60.12 (39.79)
91.16 (49.24)
69.95 (43.46)
Total feed cost 113.37 (70.21)
85.62 (65.07)
125.48 (71.67)
103.93 (68.79)
134.67 (72.75)
113.09 (70.26)
Labour 17.11 (10.60)
15.01 (11.41)
17.29 (9.88)
15.18 (10.05)
17.08 (9.23)
15.14 (9.41)
Miscellaneous 6.02 (3.73)
5.98 (4.54)
6.45 (3.68)
6.12 (4.05)
6.89 (3.72)
6.26 (3.89)
Total variable cost 136.50 (84.54)
106.61 (81.03)
149.22 (85.24)
125.23 (82.89)
158.64 (85.70)
134.49 (83.56)
Depreciation on fixed capital
12.38 (7.67)
12.38 (9.41)
12.73 (7.27)
12.73 (8.43)
12.96 (7.00)
12.96 (8.05)
Interest on fixed capital 12.58 (7.79)
12.58 (9.56)
13.12 (7.49)
13.12 (8.68)
13.51 (7.30)
13.51 (8.39)
Total fixed cost 24.96 (15.46)
24.96 (18.97)
25.85 (14.77)
25.85 (17.11)
26.47 (14.30)
26.47 (16.45)
Particulars Small Medium Large Total In milk
Buffalo 2.09 7.14 4.5 4.09 Local cow - 0.86 0.25 0.31 Crossbred 23.04 33 59.25 32.58
Dry Buffalo 1 2 1.5 1.40 Local cow - 0.29 - 0.09 Crossbred 9.74 12.86 30.5 14.40 Milch animals 35.87 56.15 96 52.87 Heifer 15.26 22.71 33.5 20.82 Calves 10.43 17.29 24.25 15.02 Total animals 61.56 96.15 153.75 88.71 Standard Animal Units 64.80 99.97 166.82 93.89
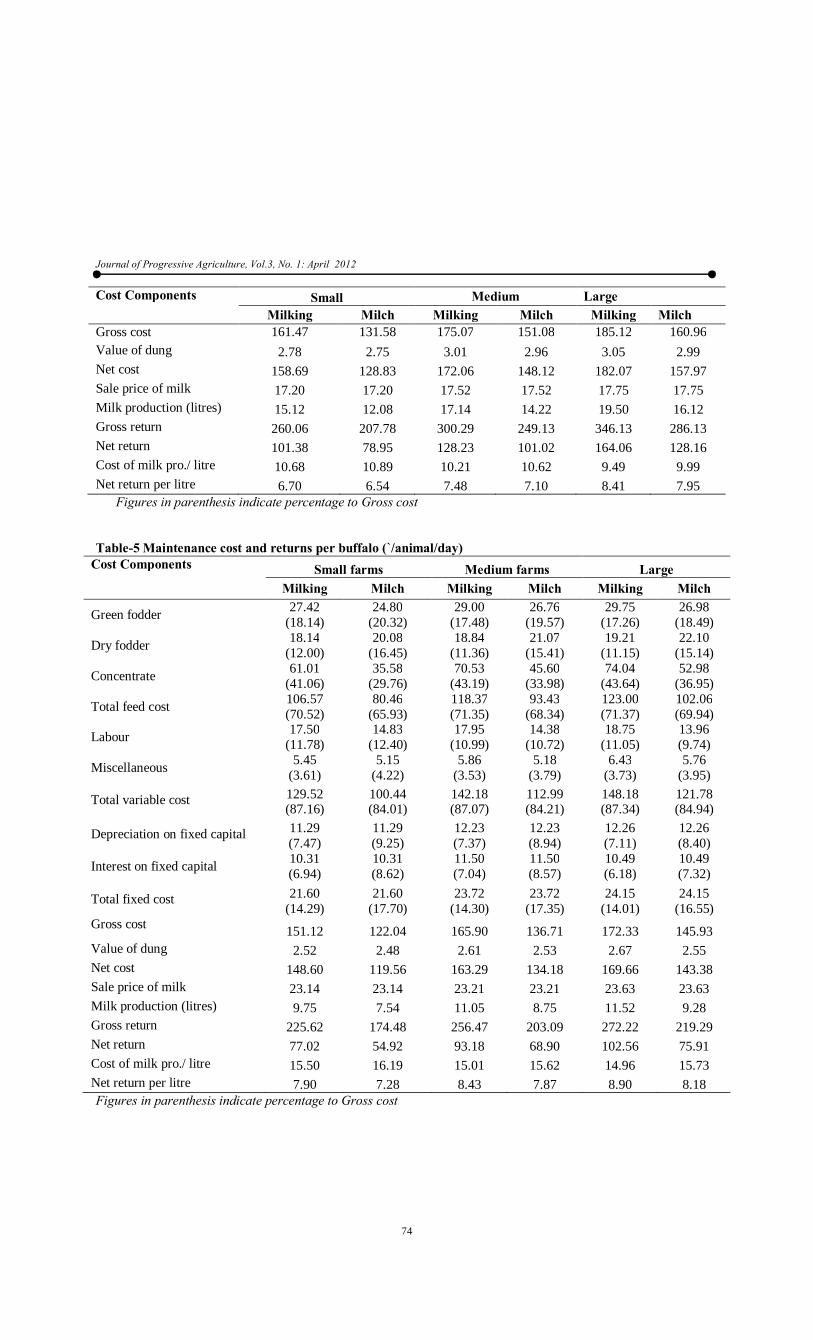
Journal of Progressive Agriculture, Vol.3, No. 1: April 2012
74
Cost Components Small Medium Large Milking Milch Milking Milch Milking Milch
Gross cost 161.47
131.58
175.07
151.08
185.12
160.96 Value of dung 2.78 2.75 3.01 2.96 3.05 2.99
Net cost 158.69 128.83 172.06 148.12 182.07 157.97 Sale price of milk 17.20 17.20 17.52 17.52 17.75 17.75 Milk production (litres) 15.12 12.08 17.14 14.22 19.50 16.12 Gross return 260.06 207.78 300.29 249.13 346.13 286.13 Net return 101.38 78.95 128.23 101.02 164.06 128.16 Cost of milk pro./ litre 10.68 10.89 10.21 10.62 9.49 9.99 Net return per litre 6.70 6.54 7.48 7.10 8.41 7.95 Figures in parenthesis indicate percentage to Gross cost Table-5 Maintenance cost and returns per buffalo (`/animal/day)
Cost Components Small farms Medium farms Large Milking Milch Milking Milch Milking Milch
Green fodder 27.42 (18.14)
24.80 (20.32)
29.00 (17.48)
26.76 (19.57)
29.75 (17.26)
26.98 (18.49)
Dry fodder 18.14 (12.00)
20.08 (16.45)
18.84 (11.36)
21.07 (15.41)
19.21 (11.15)
22.10 (15.14)
Concentrate 61.01 (41.06)
35.58 (29.76)
70.53 (43.19)
45.60 (33.98)
74.04 (43.64)
52.98 (36.95)
Total feed cost 106.57 (70.52)
80.46 (65.93)
118.37 (71.35)
93.43 (68.34)
123.00 (71.37)
102.06 (69.94)
Labour 17.50 (11.78)
14.83 (12.40)
17.95 (10.99)
14.38 (10.72)
18.75 (11.05)
13.96 (9.74)
Miscellaneous 5.45 (3.61)
5.15 (4.22)
5.86 (3.53)
5.18 (3.79)
6.43 (3.73)
5.76 (3.95)
Total variable cost 129.52 (87.16)
100.44 (84.01)
142.18 (87.07)
112.99 (84.21)
148.18 (87.34)
121.78 (84.94)
Depreciation on fixed capital 11.29 (7.47)
11.29 (9.25)
12.23 (7.37)
12.23 (8.94)
12.26 (7.11)
12.26 (8.40)
Interest on fixed capital 10.31 (6.94)
10.31 (8.62)
11.50 (7.04)
11.50 (8.57)
10.49 (6.18)
10.49 (7.32)
Total fixed cost 21.60 (14.29)
21.60 (17.70)
23.72 (14.30)
23.72 (17.35)
24.15 (14.01)
24.15 (16.55)
Gross cost 151.12 122.04 165.90 136.71 172.33 145.93 Value of dung 2.52 2.48 2.61 2.53 2.67 2.55 Net cost 148.60 119.56 163.29 134.18 169.66 143.38 Sale price of milk 23.14 23.14 23.21 23.21 23.63 23.63 Milk production (litres) 9.75 7.54 11.05 8.75 11.52 9.28 Gross return 225.62 174.48 256.47 203.09 272.22 219.29 Net return 77.02 54.92 93.18 68.90 102.56 75.91 Cost of milk pro./ litre 15.50 16.19 15.01 15.62 14.96 15.73 Net return per litre 7.90 7.28 8.43 7.87 8.90 8.18 Figures in parenthesis indicate percentage to Gross cost

Journal of Progressive Agriculture, Vol.3, No. 1: April 2012
75
REFERENCES
Balaraman, N.2004. Establishment of commercial dairy farm: challenges and opportunities. Paper presented in XXXIII dairy industry conference, 26 Sep. 2004, New Delhi.
Bhowmik, P. and Sirohi, S. 2008.Cost of milk production and returns from dairying in South Tripura. Indian journal of dairy science 61(4): 303-07.
NDDB. 2008. Annual report of National Dairy Development Board, Anand.
Radha Krishna and Reddy. 2007. Report of Planning Commission. New Delhi.
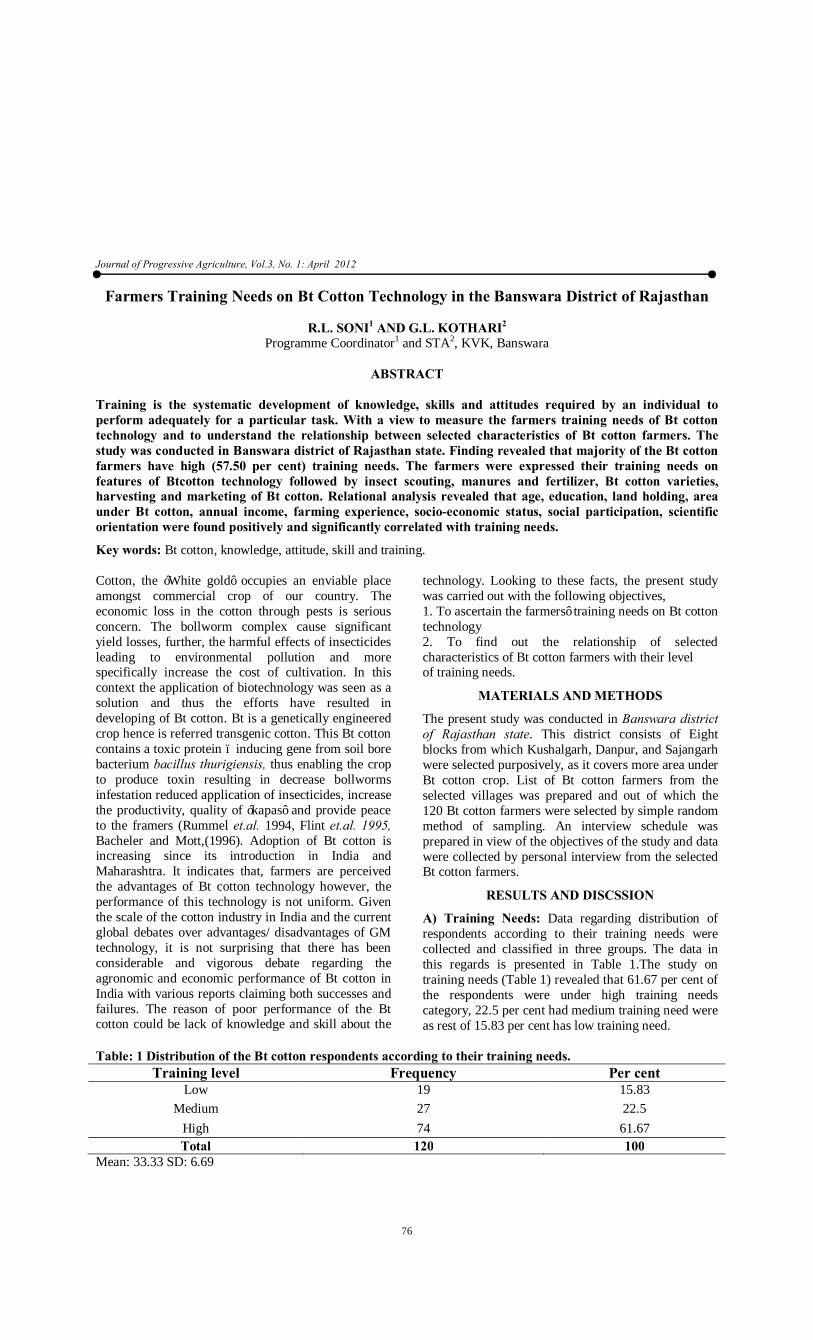
Journal of Progressive Agriculture, Vol.3, No. 1: April 2012
76
Farmers Training Needs on Bt Cotton Technology in the Banswara District of Rajasthan
R.L. SONI1 AND G.L. KOTHARI2 Programme Coordinator1 and STA2, KVK, Banswara
ABSTRACT
Training is the systematic development of knowledge, skills and attitudes required by an individual to perform adequately for a particular task. With a view to measure the farmers training needs of Bt cotton technology and to understand the relationship between selected characteristics of Bt cotton farmers. The study was conducted in Banswara district of Rajasthan state. Finding revealed that majority of the Bt cotton farmers have high (57.50 per cent) training needs. The farmers were expressed their training needs on features of Btcotton technology followed by insect scouting, manures and fertilizer, Bt cotton varieties, harvesting and marketing of Bt cotton. Relational analysis revealed that age, education, land holding, area under Bt cotton, annual income, farming experience, socio-economic status, social participation, scientific orientation were found positively and significantly correlated with training needs.
Key words: Bt cotton, knowledge, attitude, skill and training. Cotton, the ‘White gold’ occupies an enviable place amongst commercial crop of our country. The economic loss in the cotton through pests is serious concern. The bollworm complex cause significant yield losses, further, the harmful effects of insecticides leading to environmental pollution and more specifically increase the cost of cultivation. In this context the application of biotechnology was seen as a solution and thus the efforts have resulted in developing of Bt cotton. Bt is a genetically engineered crop hence is referred transgenic cotton. This Bt cotton contains a toxic protein – inducing gene from soil bore bacterium bacillus thurigiensis, thus enabling the crop to produce toxin resulting in decrease bollworms infestation reduced application of insecticides, increase the productivity, quality of ‘kapas’ and provide peace to the framers (Rummel et.al. 1994, Flint et.al. 1995, Bacheler and Mott,(1996). Adoption of Bt cotton is increasing since its introduction in India and Maharashtra. It indicates that, farmers are perceived the advantages of Bt cotton technology however, the performance of this technology is not uniform. Given the scale of the cotton industry in India and the current global debates over advantages/ disadvantages of GM technology, it is not surprising that there has been considerable and vigorous debate regarding the agronomic and economic performance of Bt cotton in India with various reports claiming both successes and failures. The reason of poor performance of the Bt cotton could be lack of knowledge and skill about the
technology. Looking to these facts, the present study was carried out with the following objectives, 1. To ascertain the farmers’ training needs on Bt cotton technology 2. To find out the relationship of selected characteristics of Bt cotton farmers with their level of training needs.
MATERIALS AND METHODS
The present study was conducted in Banswara district of Rajasthan state. This district consists of Eight blocks from which Kushalgarh, Danpur, and Sajangarh were selected purposively, as it covers more area under Bt cotton crop. List of Bt cotton farmers from the selected villages was prepared and out of which the 120 Bt cotton farmers were selected by simple random method of sampling. An interview schedule was prepared in view of the objectives of the study and data were collected by personal interview from the selected Bt cotton farmers.
RESULTS AND DISCSSION
A) Training Needs: Data regarding distribution of respondents according to their training needs were collected and classified in three groups. The data in this regards is presented in Table 1.The study on training needs (Table 1) revealed that 61.67 per cent of the respondents were under high training needs category, 22.5 per cent had medium training need were as rest of 15.83 per cent has low training need.
Table: 1 Distribution of the Bt cotton respondents according to their training needs.
Training level Frequency Per cent Low 19 15.83
Medium 27 22.5 High 74 61.67 Total 120 100
Mean: 33.33 SD: 6.69
Journal of Progressive Agriculture, Vol.3, No. 1: April 2012
77
It can be concluded that the majority of the Bt cotton farmers have high training needs. The inference in the study is in line with the findings of Ahire (2005). Data
regarding distribution of respondents according to their training needs in different subject matters are presented in Table 2
Table: 2 Training needs of Bt cotton farmers in different subject matter areas. Items Mean score Rank Features of Bt cotton technology 2.000 I Preparatory tillage 0.518 VII Bt cotton varieties/hybrids 1.400 V Seeds and sowing 1.039 VII Manures and fertilizers 1.552 III Insects scouting 1.854 II Plant protection 1.449 IV Irrigation 0.347 X Intercultural operation 0.438 IX Harvesting and Marketing 1.277 VI The data in Table 2 revealed that majority of the respondents had expressed their needs for training about features of Bt cotton technology (2.000), insects scouting (1.854), manures and fertilizers (1.552), plant protection (1.449), Bt cotton varieties (1.400) and harvesting and marketing (1.277). This means that the Bt cotton farmers gave highest emphasis these subject matters, as these information can help them to a grate extent while adopting Bt cotton in their fields. The reasons for ranking these items on top by the respondents may probably be Bt cotton is first genetically modified technology have recently introduced for farmers cultivation and farmers are more curious about features of Bt cotton technology and its cultivation practices. Retention of more number of bolls in Bt cotton and soil fertility gets depleted by continuous cropping pattern which ultimately effects the crop growth resulting in poor yield and Hence they need the adequate knowledge of manures and fertilizer management in Bt cotton. Insect scouting is one of the most important method to ascertain the population of the insect pests and their economic threshold level (ETL) that facilitate the farmers to take the spray decision on Bt cotton and able to reduce the pesticides sprays. Further, the respondents perceived the training needs in plant protection measures due to significant damage reported by the attack of pests like sucking pets, bollworm, sopdoptera and mealy bugs and
disease like grey mildew, reddening of leaves, wilting and bacterial blight. The farmers were not able to identify the symptoms in the plants caused by pest and diseases. They were also generally not aware of the control measures. These factors might have motivated them to assign the top rank to above items. Bt cotton farmers expressed their training needs about various Bt cotton hybrids available in the market, product features, management practices, environment compatibility are the important training areas expressed by the farmers. Most of the farmers found lack of knowledge about harvesting and marketing of the cotton. Hence, they require training about this subject matter. They are also require a training in descending order on Bt cotton varieties, harvesting and marketing, seed and sowing, preparatory tillage, intercultural operation and irrigation. B) Correlation between personal traits and their training needs : Personal, socio-economical, communication, and psychological characteristics play an important role in training needs on Bt cotton technology. With this in view, efforts were made to study the correlation, if any, between personal characteristics of the Bt cotton farmers and their training needs. To examine this relationship correlation coefficient (r) was computed, the results of which are presented in Table 3.
Table: 3 Correlation between selected characteristics of Bt cotton farmers with their training needs. Variables Correlation coefficient ‘r’ values Age 0.221** Education 0.214** Land holding 0.342** Area under Bt cotton 0.183* Annual income 0.163* Farming experience 0.471** Socio-economic status 0.181* Extension contact 0.147** Social participation 0.259** Scientific orientation 0.582** * - Significant at 0.05 probability level ** - Significant at 0.01 Probability level
Journal of Progressive Agriculture, Vol.3, No. 1: April 2012
78
The data depicted in Table 3 shows that among ten characteristic studied six characteristics namely, scientific orientation, farming experience, land holding, social participation, education and age found to have positively and significantly correlation with training needs at 0.01 level of probability. Whereas, under socioeconomic status, area under Bt cotton and annual income were correlated positively and significantly at 0.05 level of probability. Further, it was noticed that extension contact did not show any relationship with training needs. It can be concluded from the investigation that majority of the Bt cotton farmers had expressed their need for training on Bt cotton technology. The analysis of correlation of selected characteristics like age, education, land holding, area under Bt cotton, annual income, farming experience, socio-economic status, social participation, scientific orientation were found positively and significantly towards their training needs. It is also concluded that majority of Bt cotton farmers gave highest emphasis of training needs on
features of Bt cotton technology, as this information can help them to a grate extent while adopting in their fields. They are also require a training on insect scouting, detection of ETL of different pests, application of manures and fertilizer management, various Bt cotton varieties available in the market, hybrids features and its cultivation practices, harvesting and marketing of Bt cotton. So while preparing farmers training programmes for the area of training required by the Bt cotton farmers should be given due importance to support them to take decision regarding adoption of Bt cotton technology. The transfer of technology agents shall keep the results of this study in view while talking decisions as regards to what contents of the technological information regarding Bt cotton technology should be taken to which type of the farmers. Further, they should concentrate on major areas, identified by this study for deciding the content of the message to be prepared for the Bt cotton farmers.
REFERANCE
Ahire L. M. 2005. Assessments of training needs of the farmers of Krishna district of Andhra Pradesh with reference to Mango production technology. M. Sc. Thesis (Unpub.), YCMOU, Nasik.
Bacheler, J. S. and D.W. Mott 1996. Potential utility and susceptibility of transgenic BT Cotton against bollworms, European corn borers and stink bugs in NC. In Proc. Beltwide Cotton Conferences, Nashville TN, USA, January 9-12,1996, Memphis, USA, National Cotton council, 2: 927-931.
Flint, H. M., T. J. Henneberry, F. D. Wilson, E. Holguin, N. Parks and R. D. Buchler 1995. The effect of transgenic cotton, Gossypium hirsutum. L. containing Bacillus thuringiensis toxin gene for the control of pink bollworm (Pectinophora gossypiella) and other orthropodes. South Western Entomologist 20 (3):281-292.
Rummel, D. R., M. D. Arnold, J. R. Gannaway, D. F. Owne, S. C. Carrol and W. R. Deaton 1994. Evaluation of Bt cotton resistant to injury from bollworm: Implication for pest management in Texas southern high plains. South Western Entomologist 19 (3):199-207.
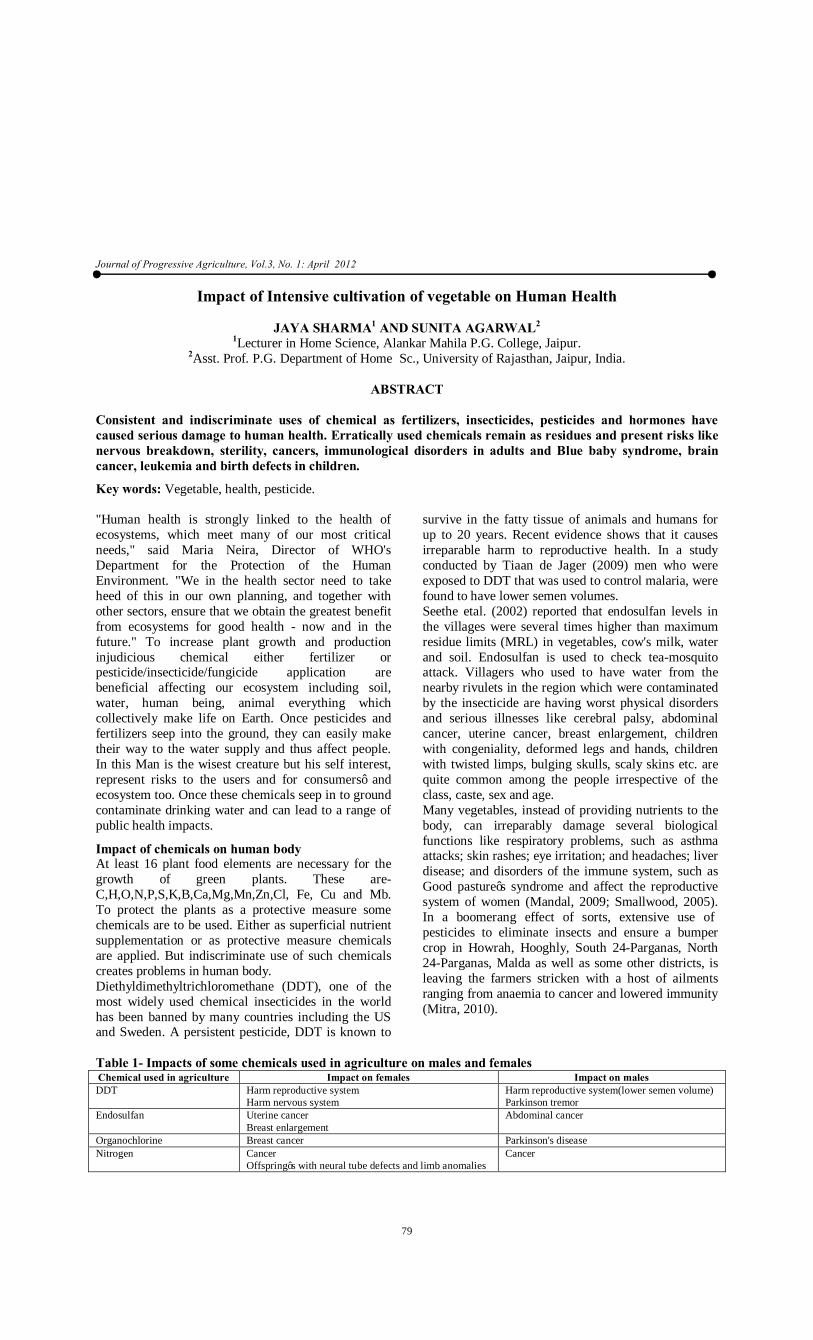
Journal of Progressive Agriculture, Vol.3, No. 1: April 2012
79
Impact of Intensive cultivation of vegetable on Human Health
JAYA SHARMA1 AND SUNITA AGARWAL2 1Lecturer in Home Science, Alankar Mahila P.G. College, Jaipur.
2Asst. Prof. P.G. Department of Home Sc., University of Rajasthan, Jaipur, India.
ABSTRACT
Consistent and indiscriminate uses of chemical as fertilizers, insecticides, pesticides and hormones have caused serious damage to human health. Erratically used chemicals remain as residues and present risks like nervous breakdown, sterility, cancers, immunological disorders in adults and Blue baby syndrome, brain cancer, leukemia and birth defects in children.
Key words: Vegetable, health, pesticide. "Human health is strongly linked to the health of ecosystems, which meet many of our most critical needs," said Maria Neira, Director of WHO's Department for the Protection of the Human Environment. "We in the health sector need to take heed of this in our own planning, and together with other sectors, ensure that we obtain the greatest benefit from ecosystems for good health - now and in the future." To increase plant growth and production injudicious chemical either fertilizer or pesticide/insecticide/fungicide application are beneficial affecting our ecosystem including soil, water, human being, animal everything which collectively make life on Earth. Once pesticides and fertilizers seep into the ground, they can easily make their way to the water supply and thus affect people. In this Man is the wisest creature but his self interest, represent risks to the users and for consumers’ and ecosystem too. Once these chemicals seep in to ground contaminate drinking water and can lead to a range of public health impacts.
Impact of chemicals on human body At least 16 plant food elements are necessary for the growth of green plants. These are-C,H,O,N,P,S,K,B,Ca,Mg,Mn,Zn,Cl, Fe, Cu and Mb. To protect the plants as a protective measure some chemicals are to be used. Either as superficial nutrient supplementation or as protective measure chemicals are applied. But indiscriminate use of such chemicals creates problems in human body. Diethyldimethyltrichloromethane (DDT), one of the most widely used chemical insecticides in the world has been banned by many countries including the US and Sweden. A persistent pesticide, DDT is known to
survive in the fatty tissue of animals and humans for up to 20 years. Recent evidence shows that it causes irreparable harm to reproductive health. In a study conducted by Tiaan de Jager (2009) men who were exposed to DDT that was used to control malaria, were found to have lower semen volumes. Seethe etal. (2002) reported that endosulfan levels in the villages were several times higher than maximum residue limits (MRL) in vegetables, cow's milk, water and soil. Endosulfan is used to check tea-mosquito attack. Villagers who used to have water from the nearby rivulets in the region which were contaminated by the insecticide are having worst physical disorders and serious illnesses like cerebral palsy, abdominal cancer, uterine cancer, breast enlargement, children with congeniality, deformed legs and hands, children with twisted limps, bulging skulls, scaly skins etc. are quite common among the people irrespective of the class, caste, sex and age. Many vegetables, instead of providing nutrients to the body, can irreparably damage several biological functions like respiratory problems, such as asthma attacks; skin rashes; eye irritation; and headaches; liver disease; and disorders of the immune system, such as Good pasture’s syndrome and affect the reproductive system of women (Mandal, 2009; Smallwood, 2005). In a boomerang effect of sorts, extensive use of pesticides to eliminate insects and ensure a bumper crop in Howrah, Hooghly, South 24-Parganas, North 24-Parganas, Malda as well as some other districts, is leaving the farmers stricken with a host of ailments ranging from anaemia to cancer and lowered immunity (Mitra, 2010).
Table 1- Impacts of some chemicals used in agriculture on males and females Chemical used in agriculture Impact on females Impact on males DDT Harm reproductive system
Harm nervous system Harm reproductive system(lower semen volume) Parkinson tremor
Endosulfan Uterine cancer Breast enlargement
Abdominal cancer
Organochlorine Breast cancer Parkinson's disease Nitrogen Cancer
Offspring’s with neural tube defects and limb anomalies Cancer
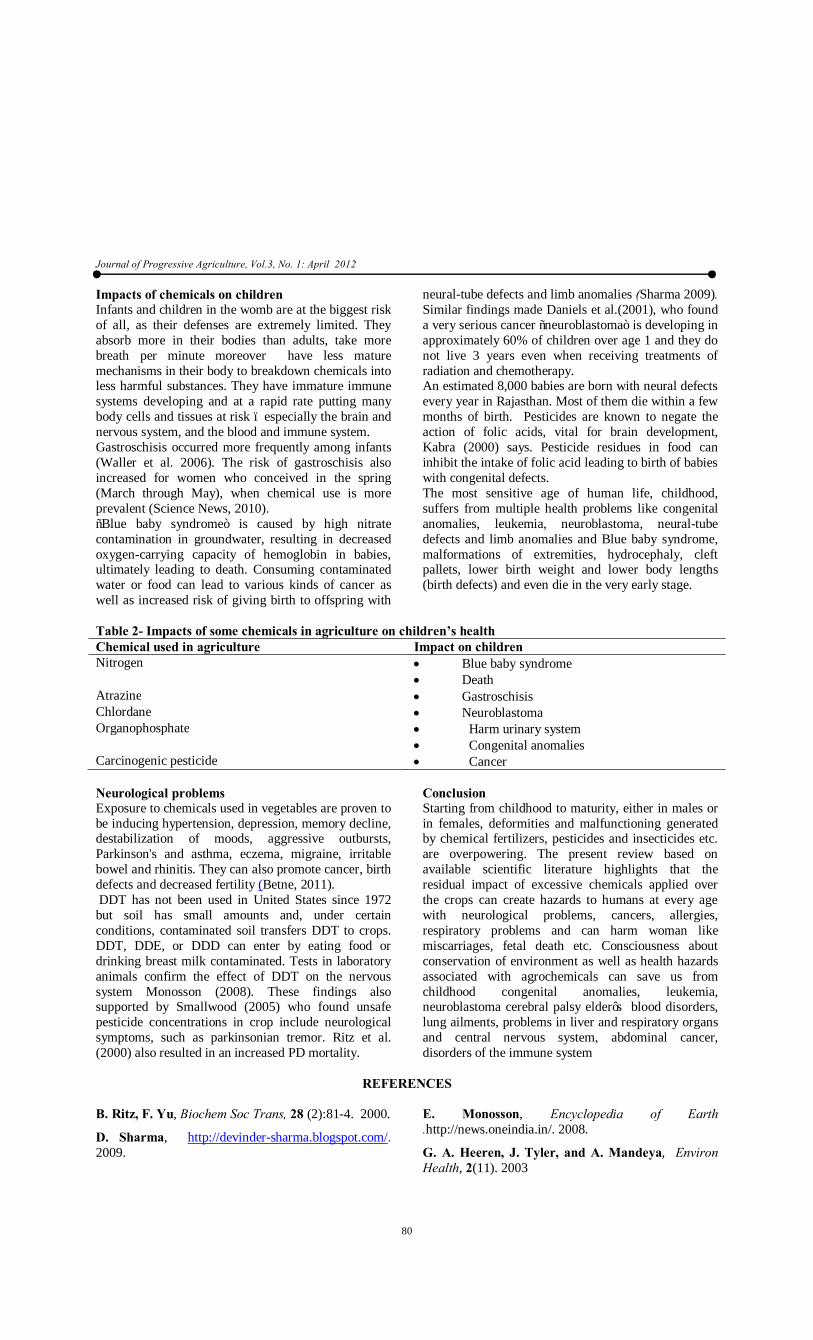
Journal of Progressive Agriculture, Vol.3, No. 1: April 2012
80
Impacts of chemicals on children Infants and children in the womb are at the biggest risk of all, as their defenses are extremely limited. They absorb more in their bodies than adults, take more breath per minute moreover have less mature mechanisms in their body to breakdown chemicals into less harmful substances. They have immature immune systems developing and at a rapid rate putting many body cells and tissues at risk – especially the brain and nervous system, and the blood and immune system. Gastroschisis occurred more frequently among infants (Waller et al. 2006). The risk of gastroschisis also increased for women who conceived in the spring (March through May), when chemical use is more prevalent (Science News, 2010). “Blue baby syndrome” is caused by high nitrate contamination in groundwater, resulting in decreased oxygen-carrying capacity of hemoglobin in babies, ultimately leading to death. Consuming contaminated water or food can lead to various kinds of cancer as well as increased risk of giving birth to offspring with
neural-tube defects and limb anomalies (Sharma 2009). Similar findings made Daniels et al.(2001), who found a very serious cancer “neuroblastoma” is developing in approximately 60% of children over age 1 and they do not live 3 years even when receiving treatments of radiation and chemotherapy. An estimated 8,000 babies are born with neural defects every year in Rajasthan. Most of them die within a few months of birth. Pesticides are known to negate the action of folic acids, vital for brain development, Kabra (2000) says. Pesticide residues in food can inhibit the intake of folic acid leading to birth of babies with congenital defects. The most sensitive age of human life, childhood, suffers from multiple health problems like congenital anomalies, leukemia, neuroblastoma, neural-tube defects and limb anomalies and Blue baby syndrome, malformations of extremities, hydrocephaly, cleft pallets, lower birth weight and lower body lengths (birth defects) and even die in the very early stage.
Table 2- Impacts of some chemicals in agriculture on children’s health Chemical used in agriculture Impact on children Nitrogen • Blue baby syndrome
• Death Atrazine • Gastroschisis Chlordane • Neuroblastoma Organophosphate • Harm urinary system
• Congenital anomalies Carcinogenic pesticide • Cancer Neurological problems Exposure to chemicals used in vegetables are proven to be inducing hypertension, depression, memory decline, destabilization of moods, aggressive outbursts, Parkinson's and asthma, eczema, migraine, irritable bowel and rhinitis. They can also promote cancer, birth defects and decreased fertility (Betne, 2011). DDT has not been used in United States since 1972 but soil has small amounts and, under certain conditions, contaminated soil transfers DDT to crops. DDT, DDE, or DDD can enter by eating food or drinking breast milk contaminated. Tests in laboratory animals confirm the effect of DDT on the nervous system Monosson (2008). These findings also supported by Smallwood (2005) who found unsafe pesticide concentrations in crop include neurological symptoms, such as parkinsonian tremor. Ritz et al. (2000) also resulted in an increased PD mortality.
Conclusion Starting from childhood to maturity, either in males or in females, deformities and malfunctioning generated by chemical fertilizers, pesticides and insecticides etc. are overpowering. The present review based on available scientific literature highlights that the residual impact of excessive chemicals applied over the crops can create hazards to humans at every age with neurological problems, cancers, allergies, respiratory problems and can harm woman like miscarriages, fetal death etc. Consciousness about conservation of environment as well as health hazards associated with agrochemicals can save us from childhood congenital anomalies, leukemia, neuroblastoma cerebral palsy elder’s blood disorders, lung ailments, problems in liver and respiratory organs and central nervous system, abdominal cancer, disorders of the immune system
REFERENCES
B. Ritz, F. Yu, Biochem Soc Trans, 28 (2):81-4. 2000.
D. Sharma, http://devinder-sharma.blogspot.com/. 2009.
E. Monosson, Encyclopedia of Earth .http://news.oneindia.in/. 2008.
G. A. Heeren, J. Tyler, and A. Mandeya, Environ Health, 2(11). 2003

Journal of Progressive Agriculture, Vol.3, No. 1: April 2012
81
J. L. Daniels, A. F. Olshan, K. Teschke, I. Hertz-Picciotto, D. A. Savitz, and J. Blatt, Epidemiology, 12(1):20-26.2001.
K.M. Seethi, and M. Reghunathan, KM SpecialReport, http://www.keralamonitor.com/gulfalert.html. 2002.
L. N. Smallwood, BMJ 331:656 doi:10.1136/bmj.331.7518.656-d. 2005.
R. Betna, Toxic Link, http://feedburner.com/ToxicLink_ArticleUpdates, 2011.
R. R. Manas, In: MANDAL, S. The Telegraph, Calcutta, India. 2009. S.G. Kabra, Down to Earth, In: Pesticide Post, 8 (3-4) 2000.
S. Waller, P. K. Kathleen, S. Peterson, and J. Hitti, Science Daily. Feb.7. 2010.
T. Mitra, The Statesman, Calcutta, India 2010.
V. Sharma, The Hindu, December, 05. 2009.

Journal of Progressive Agriculture, Vol.3, No. 1: April 2012
82
Reasons for Non-adoption of Recommended Cultivation Practices by Wheat Growers in Bidar District of North Karnataka
KAMALA KANT1, NAZAM KHAN2 AND N.R. GANGADHARAPPA3
1PhD. Students, Division of Dairy Extension, NDRI, Karnal-132001 2PhD. Students, Division of Dairy Cattle Nutrition, NDRI, Karnal-132001
3 Professor & state coordinator (KSFMBC Project), Forest Department of Karnataka, Aranya Bhavan, Melleshwaram Department of Agricultural Extension, University of Agricultural Sciences, GKVK, Bangalore
*Part of M.Sc. thesis submitted by the first author to University of Agricultural Sciences, GKVK, Bangalore-65 E-mail: [email protected]
ABSTRACT
The present research study was conducted in Humnabad taluk of Bidar district. Personal interview schedule was distributed to 100 wheat farmers. The study revealed that majors reasons for non-adoption of recommended wheat cultivation practices were low market price (94.00%), Exploitation by middlemen (90.00%), Lack of knowledge (87.00%) and Electricity ( for irrigation) (84.00%). However, Seed (variety) (78.00%) and Credits (68.00%), were perceived as other important reasons in adopting recommended practices by majority of wheat farmers in study area. Regression coefficient exhibited that three variables, land holding status, extension participation and mass media participation, had positive and significant contribution to knowledge level, whereas two, land holding and economic motivation, were significantly toward the adoption behaviour. Regression model tested all 10 independent variables together could explain 54.2 and 55.2 per cent of the variation in knowledge level and adoption behaviour, respectively of recommended wheat cultivation practices.
Key words: Non-adoption, recommended cultivation practices, wheat grower India is predominantly an agricultural country. However, agricultural production of almost all the crops obtained in the country is far less than that is achieved in developed countries. The crop production technologies developed through research system are there but their wider adoption remains quite limited. This situation calls for a system, which ensures efficient and effective information flow from researchers to the farmers and vice versa. This can revolutionize our agricultural economy and can place it on sound and stable lines. Along with rice, wheat is the most important food crop of India. In India, wheat crop is grown in 29.25 million hectares with production of 85.92 million tones. The average productivity of wheat in India is about 2938 kg/ha (Ministry of Agriculture, 2010). Wheat is cultivated mainly in six states of northern India, viz. Uttar Pradesh, Punjab, Haryana, Rajasthan, Madhya Pradesh and Bihar. These states together accounted for 87 per cent of area and 93 per cent of production of wheat in the country in 2006. Besides, wheat is also grown in some pockets of Maharashtra, Gujarat, Karnataka and West Bengal, but their area and production shares fluctuate widely. Considerable yield gaps are also observed in the Peninsular Zone (PZ) which includes Karnataka and Maharashtra (Kumar, 2008). The average wheat productivity in the Karnataka state (17-18 q/ha) is very low as compared to the average yields of Punjab and Haryana which is about 40 q/ha (Karnataka at a glance, 2005-2006). The yield gap in wheat production arises due to abiotic, biotic and socioeconomic problems. It is estimated that abiotic problems
(poor soil fertility, moisture stress, and delayed sowing) cause about 37 per cent of the existing yield gap; socioeconomic factors (poor knowledge of production technology, inadequate capital and non-availability of inputs in time) cause another 37 per cent, and the remaining 26 per cent of yield gap arises due to biotic factors like lack of location-specific varieties, weeds and diseases (Kumar, 2008). For boosting up the production of wheat, farmers should adopt the recommended practices of wheat cultivation. In spite of the availability of high yielding genotypes, scientific cultivation practices and modern implements, their adoption at the farm level was found to be lower. The experiences of Green Revolution are enough to prove that the genetic potential of a high yielding wheat variety can best be harnessed by adequate application of irrigation water and fertilizers. The research and extension efforts over the decades have generated location specific recommended practices for wheat cultivation. But unfortunately, majority of the farmers have not adopted these practices. Keeping in view these aspects, the present study was carried out in Bidar district to analyze reason for non-adoption of wheat growers, and contribution of independent variables towards knowledge level and adoption behaviour regarding recommended wheat cultivation practices.
MATERIALS AND METHODS
The study was purposively conducted in Bidar district of North Karnataka (2007-08), because it has maximum area (7.38 thousand hectares) under wheat

Journal of Progressive Agriculture, Vol.3, No. 1: April 2012
83
cultivation. It occupies a central position in Deccan Plateau, and comprises of 5 taluks viz: Humnabad, Bidar, Basavakalyan, Bhalki and Aurad. Among these taluks, Humnabad taluk was selected purposively considering the highest area under wheat cultivation (Karnataka at a glance, 2005-2006). Ten villages namely Hankuni, Welkhenddi, Itga, Phatmapur, Musturi, Udbal, Kudambal, Chituguppa, Hudgi and Changlera of the taluk were randomly selected for the present research study after conducting a preliminary survey regarding wheat cultivation practices. Ten wheat growers were selected randomly from each village. A simple random sample of 100 wheat growers was selected who had cultivated wheat in previous year. The independent variables were age, education, land holding status, extension participation, mass media participation, innovativeness, social participation, annual income, family type and economic motivation. The farmers were interviewed personally about recommended wheat cultivation practices. The data was analyzed by using percentage, frequency and Regression coefficient.
RESULTS AND DISCUSSION
Reason for non-adoption of recommended wheat cultivation practices An analysis of Table 1 indicates that, 94.00 per cent of wheat growers expressed low price of market. The main aim of the farmers is to produce more and get better price for their produce. But unfortunately, if the supply of product increase, the demand, the price of that particular produce decrease and vice-versa. Again 78.00 per cent of the respondents expressed that the non availability of improved variety/seed. 24.00 per cent of farmers also expressed that unavailability of chemical fertilizer is another reason for non-adoption of recommended wheat cultivation practices. The reason might be that, in recent year, Government hiked the prices of fertilizers by reducing the subsidy on them and naturally it worried many farmers especially small and medium farmers. 68.00 per cent of farmers expressed non-availability of sufficient credits is another reason for non-adoption of package of practices. The availability of credits is a constraint for small and medium land holding farmers than with the big farmers because loans are many a time lent based on the repaying capacity of the individual. 59.00 and 84.00 per cent of farmers expressed lack of irrigation facilities and electricity problem are other reasons for non adoption of practices. Due to rainfall, load shedding and short circuit so on. 87.00 per cent of respondents expressed the lack of knowledge. The participation of farmers in extension programmes was found to be very low and this might be the reason for not getting technical knowledge and guidance about recommended practices. 61.00 per cent of farmers expressed complexity of problems. 33.00 per cent of farmers expressed high initial cost. 43 per cent of farmers expressed high wages of labourers. The reason
might be growing of wheat involves several field operations which requires more labourers. If sufficient labourers were not available in the locality, the wheat growers have to bring the labourers from other villages and hence the labourers demand higher ways. 36.00 per cent of farmers expressed non-availability of labours. Due to irrigation facilities in the area, farmers were able to grow more than one crop in a year. This might have given employment to more people and higher wages for them, this might have also resulted in labour problems to wheat growers who usually give relatively lower wages as it require less physical power. Exploitation by middle men is another main problems in wheat production. Sometimes the growers have to sell their produce at throw away prices and were usually exploited by the middlemen. Other problems expressed by respondents were non-availability of manures (12.00%), chemical (21.00%) and high transportation cost (20.00%). This finding is in line with the finding of Singh and Rajput (2000), that lack of irrigation facility, non availability of desired seed, lack of technical knowledge, lack of marketing facilities, difficulty in getting fertilizer, lack of capital and lack of communication facility etc.
Extent of contribution of independent variables towards knowledge level A cursory look at Table 2 reveals that the 10 independent variables selected for the study explained about 54.6 per cent of variability in knowledge level of recommended practices of wheat among the respondents. Three independent variables namely land holding, extension participation and mass media participation significantly contributed towards variations in the knowledge level. This reflects that by manipulating these variables, congenial environment could be created for acquisition of more knowledge about recommended cultivation practices. Shinde et al. (2000), Gupta et al. (2001) and Sharma et al. (2005) too stated that land holding, extension participation and mass media participation were significantly contributed with adoption level. Extent of contribution of independent variables towards adoption behaviour Table 3 reveals that out of the 10 independent variables used for the study, land holding status and economic motivation made positive and significant contribution to adoption behaviour. When tested all 10 independent variables together could explain 55.2 per cent of the variation in adoption level of recommended wheat cultivation practices. This variable was found interlinked in a way that, knowledge gain was facilitated by extension activities and mass media participation. From the results it could be inferred that by manipulating this variable, high rate of adoption of recommended cultivation practices could be achieved. Gogoi and Phukan (2000), found that there is a high degree of association was found land holding and economic motivation with extent of adoption of improved rice cultivation practices

Journal of Progressive Agriculture, Vol.3, No. 1: April 2012
84
Table 1: Reason for non-adoption of recommended wheat cultivation practices by farmers
Problems Respondents Frequency Per cent Ranks
Seed (variety) 78 78.00 V Manures 12 12.00 XVI Chemical fertilizer 24 24.00 XIII Irrigation 59 59.00 VIII Chemicals 21 21.00 XV Credits 68 68.00 VI Electricity ( for irrigation) 84 84.00 IV Lack of knowledge 87 87.00 III Complexity of problems 61 61.00 VII High initial cost 33 33.00 XII High wages of labours 43 43.00 X Non-availability of labour 36 36.00 XI Transportation 20 20.00 XIV Storage 49 49.00 IX Low market price 94 94.00 I Exploitation by middlemen 90 90.00 II Table2: Extent of contribution of independent variables towards knowledge level
Independent variables Knowledge level
Regression coefficient Standard error ‘t’ value Age 0.0598 0.4558 0.1313NS
Education 0.2148 0.2855 0.7524 NS Land holding status 0.0925 0.0393 2.353* Extension participation 0.7075 0.3212 2.202* Mass media participation 0.7239 0.2051 3.529* Innovativeness 0.1827 0.1946 0.9390 NS Social participation 0.1193 0.0930 1.2834 NS Annual income 0.0030 0.0019 1.578 NS Family type 0.2093 0.5204 0.4021 NS Economic motivation -0.0110 0.0706 -0.1570 NS * Significant at 0.05% level R2=0.546 NS=Non-significant Table3: Extent of contribution of independent variables towards adoption behaviour
Independent variables Adoption level
Regression coefficient Standard error ‘t’ value Age 0.5600 0.4903 1.142 NS Education 0.0090 0.3071 0.0296 NS Land holding status 0.9246 0.3913 2.362* Extension participation 0.0559 0.1099 0.5085 NS Mass media participation 0.0464 0.0626 0.7420 NS Innovativeness 0.0548 0.2093 0.2621 NS Social participation 0.0864 0.1000 0.8637 NS Annual income 0.0034 0.0021 1.619 NS Family type 0.0319 0.5598 0.0571 NS Economic motivation 0.1343 0.0659 2.036* * Significant at 0.05% level R2=0.552 NS=Non-significant

Journal of Progressive Agriculture, Vol.3, No. 1: April 2012
85
REFERENCES
Anonymous, 2005, Karnataka at a glance 2005-2006. Government of Karnataka, Bangalore.
Gogoi, M. and Phukan, E., 2000. Extent of adoption of improved rice cultivation practices by farmers. Maharashtra Journal of Extension Education, XIX: 190-193.
Gupta, Vinod, Mankar, Dilip and Sundaraswamy, B., 2001. Knowledge of the farmers about improved cultivation practices of rice in Jammu. Maharashtra Journal of Extension Education, XX: 74-76.
Kumar, S., 2008. Raising Wheat Production by Addressing Supply-Side Constraints in India. PME Notes, National Centre for Agricultural Economics and Policy Research, 16: 1-4.
Ministry of Agriculture, Government of India., 2010. Agricultural Statistics at a Glance.
Sharma, Lakshmikant, Chandargi, D.M. and Sundaraswamy, B., 2005. A study on knowledge level of rain maize growers in Jammu district of Jammu and Kashmir state. Karnataka Journal of Agricultural Sciences, 15(4):1138-1139.
Shinde, P.S., Bhople, P.P. and Valekar, R.B., 2000. Factors associated with knowledge status of Rabi jowar in Maharashtra state. Maharashtra Journal of Extension Education, XIX: 202-205.
Singh, R.L. and Rajput, A.M., 2000. Constraints in adoption of wheat production technology. Maharashtra Journal of Extension Education, XIX: 303-304.
Journal of Progressive Agriculture, Vol.3, No. 1: April 2012
86
Scenario of foodgrains production in India as well as Haryana
MANISH SHARMA1 , SHARAD BHATNAGAR2 AND ANIL BHAT1 1Division of Agril. Economics and Statistics, FoA, SKUAST-J, Jammu
2CCS Haryana Agriculture University-Hisar, Harayana
ABSTRACT
Despite decrease in area of foodgrains in India, its production has increased due to increase in yield. For Haryana State, yield is also plays Key role to increase the production of foodgrains. For India, the growth rate of yield is higher than production where as it is found that growth rate of production is higher than area and yield in Haryana State.
Key Words: Linear function, Regression coefficient, Compound growth rate, significance, Green revolution was initiated during the mid sixties at a time when the country was whirling through the tyranny of food deficit. Beginning at the advent of introduction of dwarf wheat germplasm and the new dwarf high yielding variety of Rice, the foodgrains production in India has increased in manifold, which transformed the status from food deficit to a net food surplus country. The foodgrains production in India has increased 109.70 million tonnes in 1979-80 to 212.82 million tonnes of food grains in 2001-02. India has achieved self sufficiency in the food grains production, but food grains requirement is continuously growing up with the increase in population of the country. Despite of adverse agro-climatic conditions, its has achieved the height of 234.47 million tonnes during 2008-09 not only to meet the food requirement but also to develop a good export market of agricultural products. The contribution of Haryana state in foodgrains production was 2.94 per cent 1979-80 in national pool which has increased to 6.66 per cent during 2008-09. Jagdeep et al. (2002) have observed that the growth in food grain production and productivity trends in India have increased while food grains acreage has shown a decreasing trend during the post green revolution period i.e.1976-2001 as compared to pre-green revolution (1950-1966) and green revolution (1966-1976). Bhatnagar et al. (2010) have observed that the production of food grains in Haryana has increased 3.4 times during post green revolution period over pre
green revolution period. The growth rates of production is higher than the growth rates of area and yield of foodgrains in Haryana for 42 years from 1966-67 to 2007-08.Yield and its interaction with area of foodgrains crops have found to contribute effectively to increase its production. Keeping in view the contribution of Haryana State in the production of foodgrains in India, an attempt has been made to review the growth performance of foodgrains in Haryana and India.
MATERIALS AND METHODS
The secondary data of area, production and yield of foodgrains in Haryana and India for 30 years from1979-80 to 2008-09 were utilized for this study. The data were collected from Statistical Abstract of Haryana and Directorate of Economics and Statistics, Department of Agriculture and Cooperation. The data pertaining to India as a whole were collected from Economic Survey of India. Basically any change in production of crop depends on the change in its area and yield. If the production, yield and area are denoted by Qn, Yn and An for the current period and Q0, Y0 and A0 for base period, the increase in production Q = (Qn – Q0) in n years over base period is a function of change in area A = (An –A0) and yield Y = (Yn –Y0). Sharma (1977) defined the change in production function of a crop as
Q = A0Y + Y0 A + AY ----- 1 where, A0Y= Yield effect, Y0A = Area effect and AY = Interaction between area and yield.
Journal of Progressive Agriculture, Vol.3, No. 1: April 2012
87
To analyze the time series data following two functions were fitted. The linear function is Yt= a + b t ----- 2 where Yt= area/production/ average yield of food grains in tth year, a=Constant, b= Regression coefficient and t = Time variable in years (t= 1, 2, ---------, 30). The exponential function Yt = AB t ----- 3 Where, A = Constant and B = (1+r) with r as compound growth rate. It is in log form as log Yt = log A + t log B which is similar to linear equation (2). Compound growth rate (C.G.R) has been calculated as C.G.R. (%) = (Anti. Log B- 1) × 100. ------ 4 The projections of area and production of food grains have been worked out by using the exponential function.
RESULTS AND DISCUSSION
Area under foodgrain crops in India has declined from 125.2 million hectares in 1979-80 to 122.8 million hectares during 2008-09 showing a decrease of 1.90 per cent. Foodgrains area in Haryana has increased 23.3 per cent i.e. from 3.69 to 4.55 million hectares. Further, the production of foodgrains in India has increased 113.7 per cent from 109.7 to 234.5 million tonnes where as for Haryana state it is reported to increase 212.7 per cent from 5.0 to 15.8 million tonnes. Similarly, average yield of foodgrain crops in India has also increased 86.8 per cent from 1022 to 1909 Kg/ hectare. It shot up 1365 to 3464 Kg / hectare for Haryana State giving a rise of 153.8 per cent in this period. According to Table 1, average area of foodgrain crops in India has reduced 2.7 per cent from 127.1 to 123.5 million hectares by taking the triennium 1979 - 82 as base period and 2006 -2009 as current period. For Haryana State it increased 11.5 per cent from 4.0 to 4.5 million hectares. Despite decrease in area, the production of foodgrain crops in India has increased 83.2 per cent from 124.2 to 227.5 million tonnes. It is shot up from 5.7 to 15.3 million tonnes giving an increase of 167.8 per cent in Haryana State. Regarding average yield of foodgrains in India, is has increased 88.3 per cent from 978 to 1842 kg per hectare. Similarly, it has increased 140.08 per cent from 1427 to 3426 kg per hectare in Haryana. The contribution of yield, area and their interaction to increase the production has been studied and given in Table 2. Increase in production of foodgrain crops has been decomposed into three components, viz. yield, area and effect of their interaction. The production of foodgrains in India has increased 106.2 per cent due to
yield effect whereas area and its interaction with yield have negative effects i.e. - 3.3 and – 2.9 per cent, respectively on production. The contribution of yield was found to be 83.5 per cent whereas area and its interaction with yield are 6.9 and 9.6 per cent, respectively for Haryana State. So, yield plays key role to increase the production of foodgrains in India as well as Haryana State. The growth rates of area, production and yield of foodgrains in India as well as Haryana have been presented in Table3. In India, area of foodgrains has decreased with highly significant rate of 0.2 per cent giving a decrease of 0.1 million hectares area every year. Despite decrease in area the production of foodgrains has shown a highly significant growth rate of 2.0 per cent giving an increase of 3.4 million tonnes per year. Yield of foodgrains has also increased with highly significant rate of 2.2 per cent i.e. an annual increase of 30.6 kg per hectare. It depicts that production has increased more rapidly than area due to adoption of modern production technology at farmer’s field. In case of Haryana, area of foodgrains has increased with highly significant growth rate of 0.4 per cent i.e. 0.01 million hectares more area has been adopted foodgrains crops every year. The production of foodgrains has shown a highly significant growth rate of 3.5 per cent giving an increase of 0.3 million tonnes per year. Yield of foodgrains has also increased with highly significant rate of 3.0 per cent i.e. an annual increase of 70.2 kg per hectare. It depicts that production has increased more rapidly than area and av. yield in Haryana. For production and yield variables in India and Haryana, both the functions are found equally good fitted.

Journal of Progressive Agriculture, Vol.3, No. 1: April 2012
88
Table 1: Average area, production and yield of Foodgrains in base and current periods India/ Haryana Variables Base period
(1979-1982) Current period (2006-2009)
Change (%)
India Area (million hectare)
127.0 123.5 - 2.7
Production (million tonnes)
124.2 227.5 83.2
Yield (Kg/hectare)
978 1842 88.3
Haryana Area (million hectare)
4.0. 4.5 11.5
Production (million tonnes)
5.7 15.3 167.8
Yield (Kg/hectare)
1427 3426 140.1
Table 2: Contribution of area, yield and their interaction to change the production of food grains production
Variable effects Contribution (%) India Haryana
Yield 106.2 83.5 Area -3.3 6.9 Interaction between area and yield -2.9 9.6
Table 3: Growth rates of area, production and yield of food grains in India and Haryana from 1979-1980 to 2008-2009
India/ Haryana Variables Linear regression
coefficient R2 (%) Compound growth rate(%) R2 (%)
India Area (million hectare) -0.2** 35.7 -0.1** 35.0 Production (million tonnes) 3.4** 88.9 2.0** 86.7 Yield (Kg/hectare) 30.6** 94.0 2.2** 91.6
Haryana Area (million hectare) 0.0** 32.0 0.4** 29.9 Production (million tonnes) 0.3** 95.6 3.5** 93.1 Yield (Kg/hectare) 70.2** 95.5 3.0** 91.7
REFERENCES
Bhatnagar,S., Sharma Manish and Batra.,S.D. 2010. Dynamics of foodgrains production in Haryana: A temporal analysis. Haryana agricultural University Journal of Research. 40:15-17.
Gill K. Jagdeep, Sharma Manish and Mahmood A. 2002. Growth trends in Food grains Production. Productivity. 43(3):495-501.
Sharma,K.L.1977. Measure of the effects of area, yield and price in increased value of crop output in India. Agricultural Situation in India. 32:349-351.

Journal of Progressive Agriculture, Vol.3, No. 1: April 2012
89
Understanding the Effects of Chemical Fertilizers
SUNITA AGARWAL AND JASWANT RATHORE Asst. Prof. P.G. and Ph. D. Scholar Department of Home Sc., University of Rajasthan, Jaipur, India.
Email: [email protected] ,
The effects of chemical fertilizers are not widely spoken about. This is partially because they are largely untested. We understand there is a risk of groundwater contamination and the environmental issues that brings, but we're still not entirely sure what it mean for our own health.
What Is Fertilizer? Fertilizer is any substance used to add nutrients to the soil to promote soil fertility and increase plant growth. Notice how nothing in there mentions the actual soil health; that's because not all fertilizers are made the same and not all are healthy for the soil. Soil health relies on a balance of macronutrients and micronutrients, as well as microbial health. It's vastly more complicated then simply adding nitrogen, phosphorus and potassium (NPK) to the ground and calling it a day.
Why doesn't this work? Because science doesn't always get it right. In the past scientists once thought food only consisted of macronutrients, but have since discovered micronutrients, antioxidants and so on. The same goes for soil health: scientists have focused almost exclusively on NPK since their "discovery" in the mid-1800s. It's this reductionist science that has us assuming we understand the chemistry of Nature and soil and thinking we can solve it with a quick application of chemical fertilizers. Unfortunately, as unsustainable farming and gardening practices continue our soil is stripped of its health and we depend on amendments even greater. This leads to some pretty negative effects of chemical fertilizers. Negative Effects of Chemical Fertilizers Effect of chemicals on soil Application of nitrate fertilizers such as urea and ammonium sulphate to soil produces acid by two process, Firstly, the natural process of oxidation of ammonia ions to nitrate ions release acid. Secondly, since nitrate ions are not strongly absorbed by the soil they are liable to leach or move down through the soil. The negatively charged nitrate ions carry positively charged basic cations such as Ca, K, Mg and Na in order to maintain the electric charge on the soil particles. Over use of nitrate fertilizers leads to swindling of earthworms from the particular area, earthworms have always been consider a farmers friends and their absence mean loss to the soil fertility(Giri.G.K.,1990 a.) .contamination of soil by heavy metal through fertilizers such as cadmium from
phosphatic fertilizers is also getting increasing attention of environmentalists (Kostial, 1986).
Effect of chemicals on Groundwater The biggest issue facing the use of chemical fertilizers is groundwater contamination. Nitrogen fertilizers break down into nitrates and travel easily through the soil. Because it is water-soluble and can remain in groundwater for decades, the addition of more nitrogen over the years has an accumulative effect on popular fertilizer, urea, produces ammonia emanation, contributes to acid rain, groundwater contamination and ozone depletion due to release of nitrous oxide by denitrification process. The excessive accumulation of dissolve nutrients suchas phosphorus,nitrogen. Silicon and other element in water leads to an excess production of algal biomass. This requires a corresponding increased supply of oxygen for decomposition of organic materials when the algae and their remnants sink to bottom, reduced O2 content and eventually anaerobic condition may prevail. This is symptomatic a severe eutrophication and may leads to a serious loss of marine life, blockage and aquatic passages and a major reduction in real estate value of the affected areas. The normal N: P ratio in water is around 20:1 algal growth increase when this ratio drops to around 7:1 (Asmed, 1993).
Stratospheric changes Many research studies involved in the atmosphere may increase the rate of reaction in the stratosphere that to be the distraction of ozone layer. The stratosphere ozone layer shields the biosphere from the harmful ultraviolet radiation and also influences the earth’s temperature (Dahama,1997). Nitrogen loss to the atmosphere through denitrification may contribute to “Green house gases” in the atmosphere there by exacerbating the problems of the breaking down of ozone layer ( Asmed, 1993) .
Effect of chemicals on human health Groundwater contamination has been linked to gastric cancer, goiter, birth malformations, and hypertension, testicular cancer and stomach cancer, excessive air- and water –borne nitrogen from fertilizers may cause respiratory. Ailments, cardiac disease, and several cancers, as well as can “ inhibit crop growth” , increase allergenic pollen production, and potentially affect the dynamics of several vector- born diseases, including west Nile virus, malaria, and cholera. One of the Scariest effects of chemical fertilizers is something called methemoglobinemia . In infants it is alternatively know as Blue baby syndrome. Long term

Journal of Progressive Agriculture, Vol.3, No. 1: April 2012
90
exposure to small amount of pesticide residues in food commodities could lead to: increase in miscarriages and spontaneous abortions.Adverse effect on reproductive system (male) and initiation of early puberty in young girls. Effect on brain, liver and kidney. (Suresh N. Deshmukh’2011)The extensive use
of pesticides posses a more direct problem on farm workers. Epistemologies data shows that workers who handle pesticides more than 20 days a year have an increased risk of developing certain type of cancers (Dahama 1997).
Table 1- Effect of chemicals fertilizers on human health Chemicals used in agriculture Effect on human health Nitrogen Blue baby syndrome (infants), abdominal cramps,
vomiting, weakness, convulsion mental impairment, stomach cancer.
Endosulfan Uterine cancer, abdominal cancer, breast enlargement. Organochlorine Breast cancer, Parkinson’s disease. DDT Harm reproductive system, nervous system, Parkinson
tremor Conciusion Continuous use of chemicals in agriculture direct or indirect they are effected environment and human health. The present review based on available scientific literature highlight that the increased amount of nitrate in drinking water is due to excessive and improper use of nitrogen fertilizers, which is most important fertilizers related pollution issues. Nutrient enrichment, eutriphication of lakes and deterioration of surface water quality due to transportation of nutrients applied through fertilizer via leaching and/or runoff and sediment erosion are other problems. Contamination of soil by heavy metal through fertilizer such cadmium from phosphatic fertilizer which has been found to carcinogenic is also getting increasing attention of environments. Chemicals damaged to humans at every
age with neurological problems, cancers, allergies, respiratory problems and can harm woman like miscarriages, spontaneous abortions. Consciousness about conservation of environment soil fertility, marine life, groundwater and human life. What We Can Do About It: Knowing and understanding the effects of chemical fertilizers doesn't do us much good without action on our part. Knowing how to protect our health is what counts. If you're on well-water have your water tested regularly by a reputable lab. Support organic and sustainable agriculture. Know your farm and your farmer and understand their practices. Take part in safeguarding organic practices and standards.
REFERENCE
Asmed, S., 1993. Agriculture-Fertilizer Interference in Asia. Issue of Growth and Sustainability, Oxford and IBH Publishers, New Delhi, India.
Dahama, A.K., 1997. Organic Farming for Sustainable Agriculture, Ashila Offset Printers, Daruagung, New Delhi,India.
Giri, G.K. 1990. Pesticide Use and its Possible Effect on Environment, RECEMP, Kathmandu.
Kostial, K., Cadmium. In: W. Mertz (ed.) 1986. Trace Elements in Human and Animal Nutrition, Academic PRESS LONDON. Pp319-325.
Suresh N. Deshmukh and Shrikrishna D. Jadhav 2011, organic farming (Text Book).
U.Thapa & P. Tripathy, 2011. Organic farming in India , Problems and prospects . 2nd edition,. Agrotech publishing Academy, Udaipur, Rajasthan (India)
Wong’s 2012. essentials natural health website, Health Articles.
http:/www.Sustainablebabysteps.com/go-green-blog.html.2012.

Journal of Progressive Agriculture, Vol.3, No. 1: April 2012
91
Improving nutrient use efficiency for economical, environmental and sustainable yield levels- A review
1DAYANAND, 1D.K. YADAV, 1P.D. NITHARWAL AND 2D.S.BHATI
1Krishi Vigyan Kendra, Abusar- Jhunjhunu and 2 KVK, Sriganganagar, Rajasthan, India Nutrients play key role in increasing agricultural production through intensive cropping. Sustainable agriculture can be achieved by efficient utilization of this costly input. Nutrient use efficiency (NUE) may be defined as yield per unit input. In agriculture this is usually related to the input of fertilizer, whereas in scientific literature the NUE is often expressed as fresh weight or product yield per content of nutrient. Improvement of NUE is an essential pre-requisite for expansion of crop production into marginal lands with low nutrient availability. The nutrients most commonly limiting plant growth are N, P, K and S. NUE depends on the ability to efficiently take up the nutrient from the soil, but also on transport, storage, mobilization, usage within the plant, and even on the environment. However, NUE can be defined in many ways and is easily misunderstood and misrepresented. Efficient use of nutrients in agriculture may be defined differently when viewed from agronomic, economic, or environmental perspectives. Proper definitions for the intended use are essential to understand published values for meaningful discussion. Therefore, nutrient use efficiency can be expressed in several ways. (I) Agronomic efficiency may be defined as the nutrients accumulated in the above-ground part of the plant or the nutrients recovered within the entire soil-crop-root system. (II) Economic efficiency occurs when farm income is maximized as a result of proper use of nutrient inputs. This can be complex to predict when factors such as future yield responses, the cost of nutrient inputs, and crop prices may not be known in advance of the growing season. (III) Environmental nutrient efficiency is important since nutrients not used by the crop are at potential risk for loss. Environmental efficiency is site specific and can only be determined by studying local targets vulnerable to nutrient impact. Nutrients not used by the crop are at risk of loss to the environment, but the susceptibility of loss varies with the nutrient, soil and climatic conditions, and landscape. The susceptibility of loss varies among the essential plant nutrients, and their loss mechanisms are each unique. Considerable research has shown that nutrient loss is greatly enhanced when fertilizers or manures are added at rates beyond their agronomic need. The local conditions, such as rainfall, frozen snow, denitrification, leaching, and runoff potential all need to be assessed to determine the level of acceptable loss and environmental efficiency. As agronomic efficiency improves, economic and environmental efficiency will also benefit (Roberts, 2008).
Mosier et al (2004) described four different agronomic indices commonly used to describe nutrient use efficiency: • Partial factor productivity (PFP): kg crop yield per
kg nutrient applied. • Agronomic efficiency (AE): kg crop yield increase
per kg nutrient applied. • Apparent recovery efficiency (ARE): kg nutrient
taken up per kg nutrient applied. • Physiological efficiency (PE): kg yield increase
per kg nutrient taken up. • Crop removal efficiency (CRE): removal of
nutrient in harvested crop as % of nutrient applied. Objectives of the study and available data determine that which term is most suitable to describe nutrient use efficiency. Nutrient Use Efficiency (NUE) can be improved by checking the pathways of nutrient losses from soil-plant system, making integrated use of nutrients from all possible sources, optimum allocation of nutrients to crops and maximizing the utilization of applied and native nutrients by the crops.
Pathways of nutrient losses: Nutrients present in soil and added through fertilizers and manures are applied, but not taken up by the crop, lost by gaseous loss, leaching loss, run off/erosion losses and fixation in soil and denitrification or volatilization in the case of N, or they could be temporarily immobilized in soil. Efficient nutrient management demands understanding the pathways of nutrient losses and developing technologies to minimize these losses.
Loss of Nitrogen: Part of applied N is lost from soil by volatilization of ammonia and part of the nitrogen is lost as N2O and N2 gas by denitrification. Volatilization loss of ammonia can be minimized by mixing of nitrogen fertilizers in soil rather than broadcasting on soil surface, deep placement of urea super granules (USG) in puddle rice field, using urease inhibitors like thiourea, methyl urea, caprylohydroxamic acid, phenyl phosphorodiamidate (PPD), ammonium thiosulphate (ATS) etc. and adding inorganic salts of Ca, Mg or K with urea. Some coated materials like sulphur coated urea (SCU), gypsum coated urea (GCU),plastic coated urea (PCU), mud ball urea and synthetic slow release urea based fertilizers like crotonylidine diurea (CDU), isobutylidene diurea (IBDU) etc. may be used to retard the rate of urea hydrolysis and thereby, reducing ammonia volatilization.
Journal of Progressive Agriculture, Vol.3, No. 1: April 2012
92
Nitrous oxide (N2O) is mainly produced by denitrification of NO3 under anaerobic conditions, as in low-land rice fields. Nitrous oxide is one of the greenhouse gas that is believed to be forcing global climate change. Denitrification loss can be minimized by avoiding the use of NO3 form of nitrogeneous fertilizer like calcium ammonium nitrate, potassium nitrate etc. in rice and use of nitrification inhibitors viz. Dicyandiamide (DCD), N-serve, AM, coated calcium carbide (CCC), neem coated urea (NCU), deep placement of urea super granules (USG) in flooded rice field and efficient water management. Mobile nutrients like NO3
- are lost from the soil-plant system with the percolating water. Besides reducing the nutrient use efficiency these nutrients may pollute the groundwater also. The groundwater having more than 10 mg NO3- N/liter is unfit for drinking purpose (WHO). Leaching loss of NO3 can be minimized by balanced fertilization, split application of urea synchronizing with crop demand, manipulation of water application and rooting depth, appropriate crop rotations & use of slow release fertilizers and nitrification inhibitors like N-serve, DCD, AM, CCC and Neem coated urea. Despite the success of synthetic nitrification and urease inhibitors in research farms, they have poor acceptability among farmers because of higher cost. However, the use of products & byproducts of locally available plants like Neem for coating urea can be popularized among the farmers to increase N economy and minimize long term environmental consequences of denitrification and nitrate leaching. Many water soluble nutrients are lost through runoff. This loss can be minimized by proper land management and selection of proper crops and cropping systems, tillage and mulching. Nutrients sorbed on the surface of soil particles- clays and silts and soil organic matter are lost when the top soil is eroded by water or wind. Proper soil conservation measures should be adopted to minimize this loss.
Loss of phosphorus: In acid soils phosphorus is fixed as FeH and AH phosphates and in neutral and calcareous soils it gets fixed as CaH phosphate. The availability of these fixed phosphates is low. Phosphate fixation in acid soil can be reduced by combined vapplication of rock phosphate and single super phosphate and liming of acid soils. In both acid and calcareous soils phosphorus fixation can be minimized by band placement of phosphatic fertilizers along with crop rows. Use of rock phosphate alongwith acid forming materials like pyrites or phosphate solubilizing micro organisms help in solubilization of sparingly soluble rocks. Vesicular Arbuscular Mycorrhizal (VAM) fungi are helpful in mobilizing both applied and natural reserves. Fertigation system of irrigation and nutrient application results into efficient utilization of both resources. This will save water as well as reduces
nutrient leaching losses and thereby increased WUE as well as NUE. This will also increase the yield and quality of crops. There is saving of water and nutrient to the extent of 35 and 22%, respectively. This technology is to be propogate extensively on farmers field by motivating the illite and marginal farmers (Singh & Gautam, 2002).
Current situation of NUE: A recent review of data on N use efficiency for cereal crops from researcher managed experimental plots reported that single year fertilizer N recovery efficiency averaged 65% for corn, 57% for wheat and 46% for rice (Ladha et al, 2005). However, experimental plots do not accurately reflect the efficiencies obtainable on-farm. Differences in the scale of farming operations and management practices like seeding, tillage, irrigation, weed control; pest control and harvesting etc. usually result in lower nutrient use efficiency. Nitrogen recovery in crops grown by farmers rarely exceeds 50% and is often much lower. A review of best available information suggests average N recovery efficiency for fields managed by farmers’ ranges from about 20-30% under rainfed conditions and 30-40% under irrigated conditions. Phosphorus (P) efficiency is also of interest because it is one of the least available and least mobile mineral nutrient. First year recovery of applied fertilizer P ranges from less than 10% to as high as 30%. However, fertilizer P is considered immobile in the soil and reaction (fixation and/or precipitation) with other soil minerals is relatively slow. Long term recovery of P by subsequent crops can be much higher. There is little information available about potassium (K) use efficiency. However, it is generally considered to have a higher use efficiency than N & P because it is immobile in most soils and is not subject to the gaseous losses that N is or the fixation reactions that effect P. first recovery of applied K can range from 20-60%.
How to optimizing NUE: The basic way for optimizing the NUE is applying nutrients at the right time, at right rate and by right method as a best management practice for achieving higher nutrient use efficiency.
Right time: to improve nutrient use efficiency, greater synchrony between crop demand and nutrient supply is necessary, especially for nutrient N. split applications of N during the growing season, rather than a single (especially in light soils) rather than a single, large application prior to sowing as basal application, are known to be effective in increasing N use efficiency (Cassman et al, 2002). Tissue testing is a well known method used to assess N status of growing crops. Chlorophyll meters have proven useful in fine tuning in-season N management (Francis & Piekielek, 1999) and leaf color charts have been highly successful in

Journal of Progressive Agriculture, Vol.3, No. 1: April 2012
93
guiding split N application especially in cereals. Precision farming technologies have introduced and now commercialized. Use of N stabilizers and controlled release fertilizers is another approach to synchronize release of N from fertilizers. Nitrogen stabilizers like nitrapyrin, DCD (dicyandiamide), NBPT (n-butyl-thiophosphoric triamide) inhibit nitrification or urease activity, thereby slowing the conversion of the fertilizer to nitrate (Havlin et al, 2005). When soil and environmental conditions are favourable for nitrate losses, treatment with a stabilizer will often increase fertilizer N efficiency. Controlled-release fertilizers can be grouped into compounds of low solubility and coated water soluble fertilizers. Most slow release fertilizers are more expensive than water-soluble N fertilizers and have traditionally been used for high value horticultural crops. However, technology improvements have reduced manufacturing costs where controlled release fertilizers are used especially in cereals (Blaylock et al, 2005). The most promising for widespread agricultural use are polymer coated products that can be designed to release nutrients in a controlled manner.
Right rate: most crops are location and season specific, depending on cultivar, management practices, climate, etc. and so it is critical that realistic yield goals are established and that nutrients are applied to meet the target yield. Over or under application will result in reduced nutrient use efficiency or losses in yield or crop quality. Soil testing is one of the most important tools available for determining the nutrient supplying capacity of the soil, but for making appropriate fertilizer recommendations good calibration data is also necessary. Other techniques such as omission plots are proving useful in determining the amount of fertilizer required for attaining a yield target (Witt and Doberman, 2002). In this method, N, P and K are applied at sufficiently high rates to ensure that yield is not limited by an insufficient supply of the added nutrients. Target yields can be determined from plots with unlimited NPK. One nutrient is omitted from the plots to determine a nutrient –limited yield. The difference in grain yield between a fully fertilized plot and an N omission plot is the deficit between the crop demand for N and indigenous supply of N, which must be met by fertilizers. Right place: Application method of a fertilizer has always been critical in ensuring efficient use of nutrients. Determining the right placement is as important as determining the right application rate. So many placements methods are available, but most generally involve surface or sub-surface applications before or after planting. Prior to planting, nutrients can be broadcast i.e. applied uniformly on the soil surface and may or may not be incorporated, applied as a band on the surface, or applied as a subsurface band, usually
5 to 20 cm deep. Applied at planting, nutrients can be banded with the seed, or below and to the side of the seed. After planting, application is usually restricted to N and placement can be as top dress or a subsurface side dress. In general, nutrient recovery efficiency tends to be higher with banded applications because less contact with the soil lessens the opportunity for nutrient loss due to leaching or fixation reactions. Placement of a fertilizer/nutrient depends on the crop and soil conditions, which interact to influence nutrient uptake and availability. Balanced fertilization: Balanced fertilization is the key to achieve higher productivity and nutrient use efficiency. There is growing deficiencies of secondary and micronutrients such as S, Ca, Zn, Fe, and B due to intensive cropping with use of high analysis fertilizers. The glaring non-responsiveness to application of recommended or elevated levels of NPK is due to growing hidden hunger for secondary or micronutrients. Proper soil diagnosis and adoption of site-specific nutrient and crop management ushers in highest productivity, efficiency and profitability. Plant nutrients rarely work in isolation. Interactions among nutrients are important because a deficiency of one nutrient restricts the uptake and use of other nutrients. Studies revealed that interaction between N and other nutrients, primarily P and K, impact crop yields and N efficiency. Therefore, balanced fertilization helps in increasing crop yield and improving N efficiency. Adequate and balanced application of fertilizer nutrients is one of the most common practices for improving the efficiency of nutrients. Addition of sufficient amount of organic matter in the soil to meet out the nutrient requirement of plants may helpful in improving nutrient use efficiency. Nutrient management on cropping system basis: Applied nutrient use efficiency can be increased by following nutrient management strategies on the basis of cropping system, instead of individual crops. The potential advantages of nutrient management on cropping-system basis are 1. It allows for distribution of fertilizers (P&K) among the component crops according to their responsiveness; 2. The crop effect (legume-N fixation and leaf fall) can be accounted for; 3. Residual effects can be taken into account; and 4. It can provide a basis integrated use of organic and inorganic sources of nutrients. Nutrient use in the cropping system depends on the characteristics of the previous crop and the quantity and kind of fertilizers applied. Inclusion of legumes in cropping system: In non-leguminous type cropping systems, inclusion of leguminous crops in sequence may help in economize the N fertilizer/nutrient by 20-40 kg/ha (Hegde, 1998). The nutrient N equivalent of the residual effect of preceding legumes (Pigeonpea, cowpea, chickpea, groundnut, greengram and blackgram) on wheat ranges

Journal of Progressive Agriculture, Vol.3, No. 1: April 2012
94
from 12-68 kg/ha. Nutrient management has to be practiced on a system basis rather than on an individual crop or field basis for achieving higher efficiency and economy, which leads to greater sustainability. Sunflower yields even at 50% recommended NPK when rotated with groundnut was comparable with that at 150% recommended NPK in sunflower-sunflower sequence (Reddy and Sudhakar Babu, 1996). Conclusion: Nutrient use efficiency depends on several agronomic factors including tillage, time of sowing, crop variety, appropriate planting/seeding, water management, weed control, nutrient management and pest management. Balanced use of
plant nutrients improves nutrient deficiency, improves soil fertility, increase NUE, WUE, improve crop yield and farmer income per unit area and betters the crop and environmental quality. These factors largely influence to NUE either individually or collectively. Hence, all the crop management practices that promote better crop growth will invariably increase the NUE. The concept of plant nutrient efficiency is certainly not a new one – but it is still not adequately understood and practiced. It is time to move beyond the concept of managing single nutrients, but instead consider providing balanced crop nutrition for producing foods of high nutritional quality with sustainable economic and environmental yield levels.
REFERENCES
Blaylock, A.D.; Kaufmann, J. and Dowbenko, R.D. 2005. Nitrogen fertilizer technologies. In: proceedings of the western nutrient management conference, salt lake city, Utah, march, 3- 4,2005.Vol.6: 8-13.
Cassman, K.G.; Dobermann, A. and walters, D.T. 2002.Agroecosystems, nitrogen use efficiency and nitrogen management. Ambio.31: 132-140.
Francis, D.D. and Piekielek, W.P. 1999. Assessing crop nitrogen needs with chlorophyll meters. Site specific management guidelines. Potash and Phosphate institute. SSMG-12. Reference 99082/item# 10-1012.
Havlin, J.L; Beaton, J.D.; Tisdale, S.L. and Nelson, W.L. 2005. Soil fertility and fertilizers. An introduction to nutrient management. Pearson Education, Inc.,upper saddle river, New Jersey.
Hegde, D.M. 1998. Integrated nutrient management for production sustainability of oilseeds: a review. Journal of oilseed research 15(1): 1-17.
Ladha, J.K.; Pathak, H. Krupnik, T.J.; Six, J. and Van Kessel, C. 2005. Efficiency of fertilizer nitrogen in cereal production. Retrospect and prospects. Adv. Agron. 87: 85-156.
Mosier, A.R.; Syers, J.K and Freney, J.R. 2004. Agriculture and the nitrogen cycle. Assessing the impacts of fertilizer use on food production and the environment. Scope-65. Island press, London.
Reddy, B.N. and Sudhakara Babu, S.N. 1996. Production potential, land utilization and economics of fertilizer management in summer sunflower based crop sequences. Indian Journal of agricultural Sciences 66(1):16-19.
Roberts, Terry L. 2008. Improving nutrient use efficiency. Turk J. agric. 32: 177-182.
Singh, A.K. and Gautam, R.C. 2002. Water source of food security. Indian Farming, October 2002:24-28.
Witt, C. and Dobberman, A. 2002. A site specific nutrient management approach for irrigated low land rice in Asia. Better crops international. 16: 20-24.

Journal of Progressive Agriculture, Vol.3, No. 1: April 2012
95
DECLARATION Form IV
(See Rule 8) Statement about ownership and other particular of Journal of Progressive Agriculture
Place of publication : Ajmer, Rajasthan, India
Periodicity of publication : Half Yearly
Printer’s Name : Gopal Printing Press, Ajmer.
Nationality : Indian
Address : M/S Gopal Printing Press,
Kesar Ganj, Ajmer (Raj.)
Publisher’s name : Sh. Ram Singh Bhati
President of Samaj Kalyan Avam Samannvit Vikas Sanstha, Ajmer (Rajasthan)
Address : 316/A, Christian Ganj, Ajmer (Raj.) India
Editor’s name : Dr. D.S. Bhati
Secretary of Samaj Kalyan Avam Samannvit Vikas Sanstha, Ajmer (Rajasthan)
Nationality : Indian
Address : 316/A, Christian Ganj, Ajmer (Raj.) India
Name and address of individual who own the newspapers/journal partners and shareholders holding more than 1% of the total capital
Samaj Kalyan Avam Samannvit Vikas Sanstha, Ajmer (Rajasthan) India
I, Ram Singh Bhati, publisher, printer and owner of this journal hereby declare that particular given are true to the best of my knowledge and belief.
Sd/-
Dated: 18th April 2012 (Ram Singh Bhati)