big call - march 2012
TRANSCRIPT
400 W. Wilson Bridge Road, Suite 200, Worthington, OH, 43085 614-846-0146 [email protected]
PAM E L A G O O D F E L L O W C O N S U M E R I N S I G H T S D I R E C T O R , B I G I N S I G H T ™
M AR I A N N E B I C K L E , P H . D .
D I R E C T O R , C E N T E R F O R R E TAI L I N G U N I V E R S I T Y O F S O U T H C AR O L I N A
The BIG Call March 2012
© 2012, Prosper®
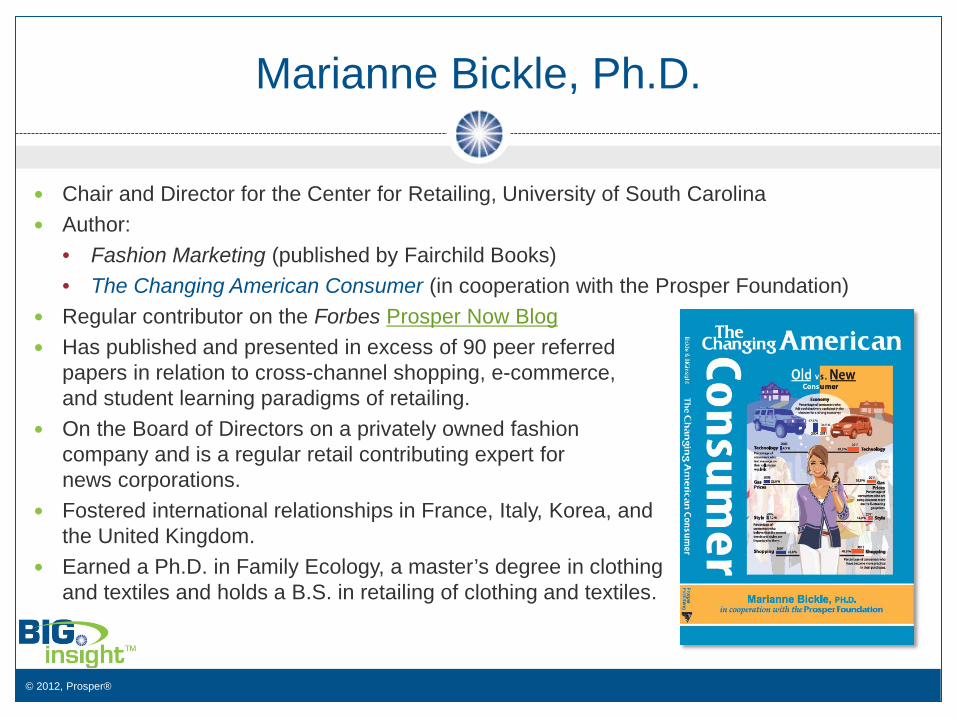
Marianne Bickle, Ph.D.
Chair and Director for the Center for Retailing, University of South Carolina Author:
• Fashion Marketing (published by Fairchild Books) • The Changing American Consumer (in cooperation with the Prosper Foundation)
Regular contributor on the Forbes Prosper Now Blog Has published and presented in excess of 90 peer referred
papers in relation to cross-channel shopping, e-commerce, and student learning paradigms of retailing.
On the Board of Directors on a privately owned fashion company and is a regular retail contributing expert for news corporations.
Fostered international relationships in France, Italy, Korea, and the United Kingdom.
Earned a Ph.D. in Family Ecology, a master’s degree in clothing and textiles and holds a B.S. in retailing of clothing and textiles.
© 2012, Prosper®
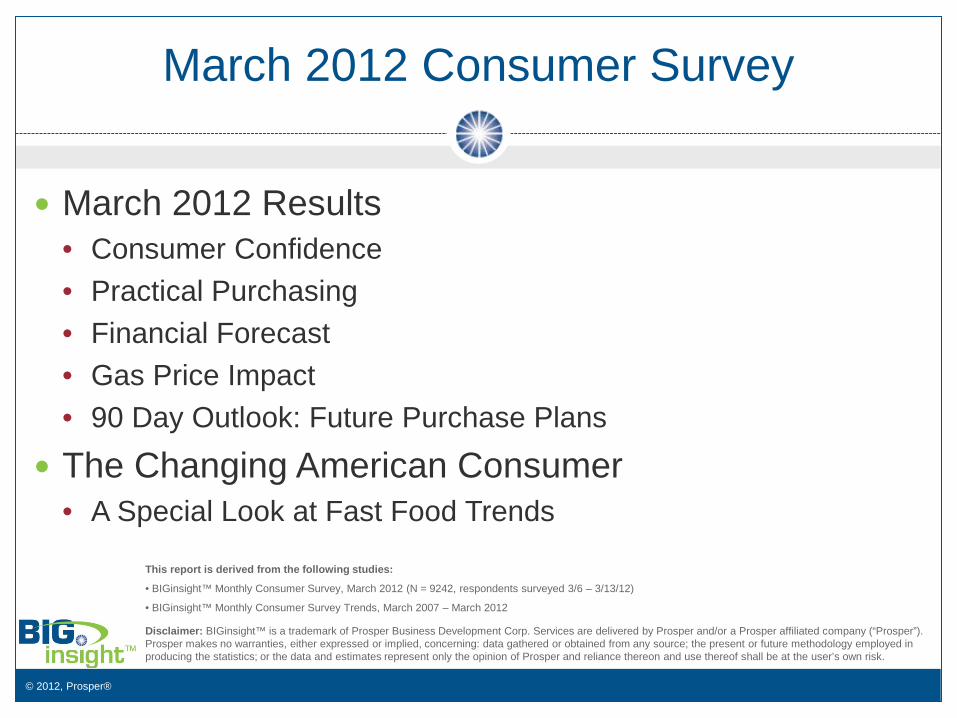
March 2012 Consumer Survey
Disclaimer: BIGinsight™ is a trademark of Prosper Business Development Corp. Services are delivered by Prosper and/or a Prosper affiliated company (“Prosper”). Prosper makes no warranties, either expressed or implied, concerning: data gathered or obtained from any source; the present or future methodology employed in producing the statistics; or the data and estimates represent only the opinion of Prosper and reliance thereon and use thereof shall be at the user’s own risk.
This report is derived from the following studies:
• BIGinsight™ Monthly Consumer Survey, March 2012 (N = 9242, respondents surveyed 3/6 – 3/13/12)
• BIGinsight™ Monthly Consumer Survey Trends, March 2007 – March 2012
March 2012 Results • Consumer Confidence • Practical Purchasing • Financial Forecast • Gas Price Impact • 90 Day Outlook: Future Purchase Plans
The Changing American Consumer • A Special Look at Fast Food Trends

© 2012, Prosper®
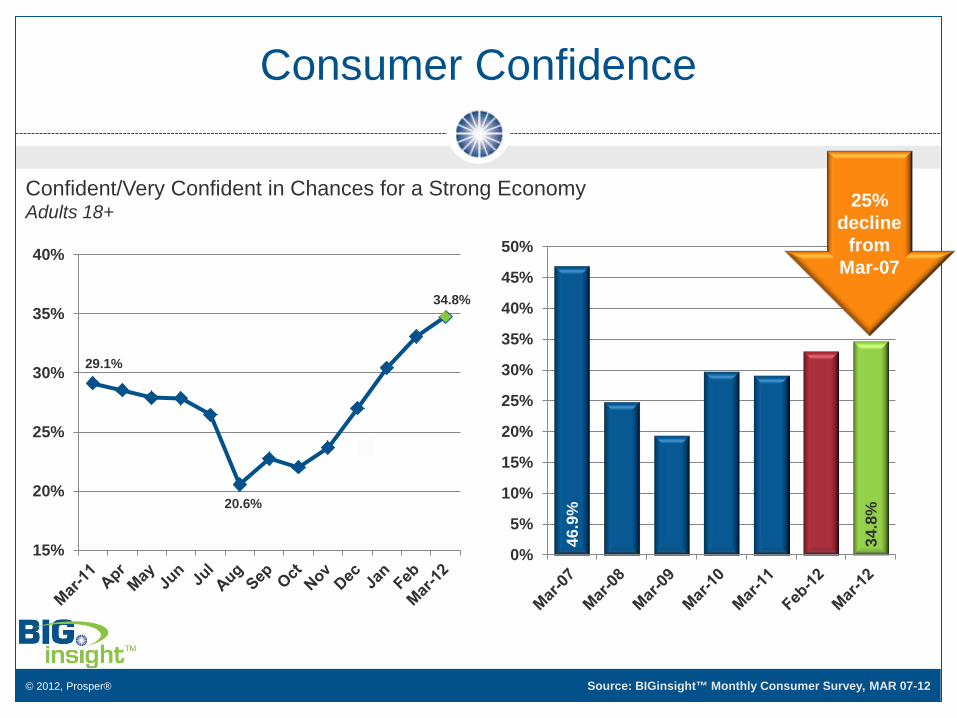
Confident/Very Confident in Chances for a Strong Economy Adults 18+
Consumer Confidence
Source: BIGinsight™ Monthly Consumer Survey, MAR 11-12
Highlights: • Confidence rises for fifth
consecutive month • Up nearly 20% from Mar-11 • Highest reading since the very
beginning of the recession Dec-07 = 37.0%
29.1%
20.6%
34.8%
15%
20%
25%
30%
35%
40%
© 2012, Prosper®
Confident/Very Confident in Chances for a Strong Economy Adults 18+
Consumer Confidence
Source: BIGinsight™ Monthly Consumer Survey, MAR 07-12
29.1%
20.6%
34.8%
15%
20%
25%
30%
35%
40%
46.9
%
34.8
%
0%
5%
10%
15%
20%
25%
30%
35%
40%
45%
50%
25%
decline from
Mar-07
© 2012, Prosper® Source: BIGinsight™ Monthly Consumer Survey, MAR 11-12
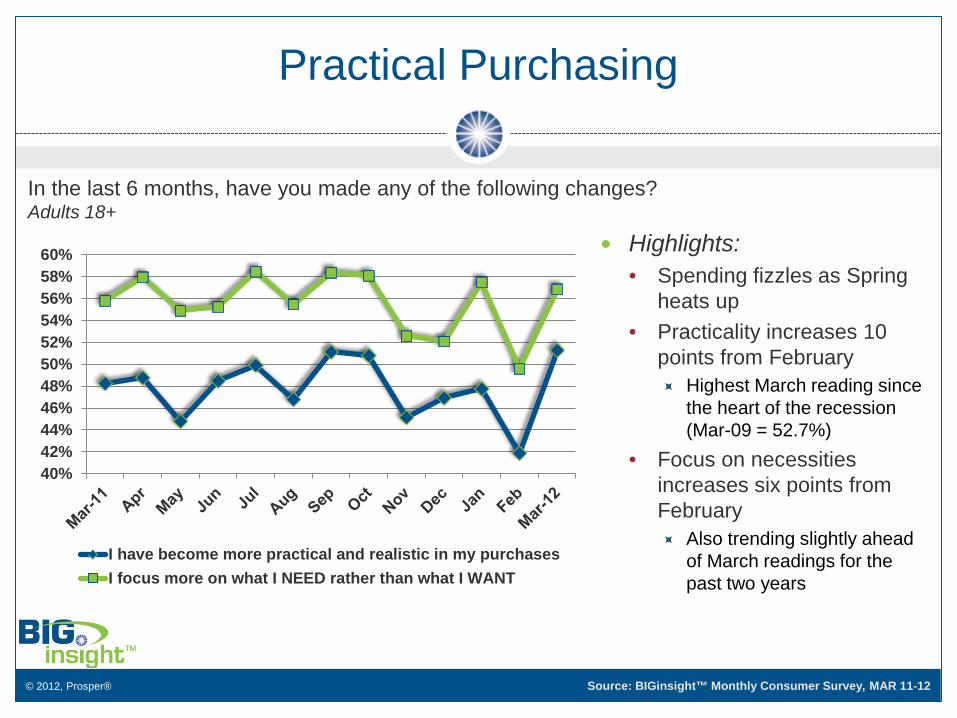
Practical Purchasing
In the last 6 months, have you made any of the following changes? Adults 18+
Highlights: • Spending fizzles as Spring
heats up • Practicality increases 10
points from February Highest March reading since
the heart of the recession (Mar-09 = 52.7%)
• Focus on necessities increases six points from February Also trending slightly ahead
of March readings for the past two years
40%42%44%46%48%50%52%54%56%58%60%
I have become more practical and realistic in my purchasesI focus more on what I NEED rather than what I WANT

© 2012, Prosper® Source: BIGinsight™ Monthly Consumer Survey, MAR 11-12
Financial Forecast
Which of the following financial steps are you planning to take in the next 3 months? Adults 18+
Highlights: • “Save-not-Squander”
Financial plans become more conservative compared to Mar-11 and Feb-12.
• Increasing Savings on the rise Typically see spikes in savings
in January (“Holiday Hangover”) Highest non-January reading
since Feb-07 (31.1%) Record number of taxpayers
saving their refunds this year • Are consumers bracing for
higher gas prices? 0% 10% 20% 30% 40%
Pay down debt
Increase savings
Pay with cash more often
Decrease overall spending
Mar-11 Feb-12 Mar-12
© 2012, Prosper® Source: BIGinsight™ Monthly Consumer Survey, MAR-12
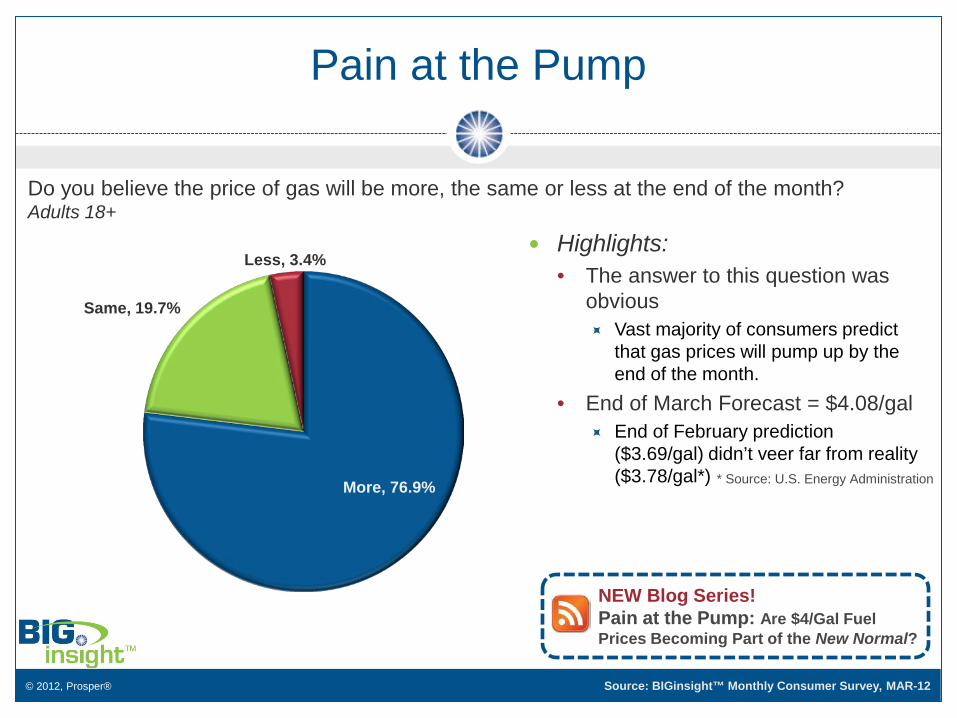
Pain at the Pump
Do you believe the price of gas will be more, the same or less at the end of the month? Adults 18+
Highlights: • The answer to this question was
obvious Vast majority of consumers predict
that gas prices will pump up by the end of the month.
• End of March Forecast = $4.08/gal End of February prediction
($3.69/gal) didn’t veer far from reality ($3.78/gal*) More, 76.9%
Same, 19.7%
Less, 3.4%
* Source: U.S. Energy Administration
NEW Blog Series! Pain at the Pump: Are $4/Gal Fuel Prices Becoming Part of the New Normal?
© 2012, Prosper® Source: BIGinsight™ Monthly Consumer Survey, MAR-12
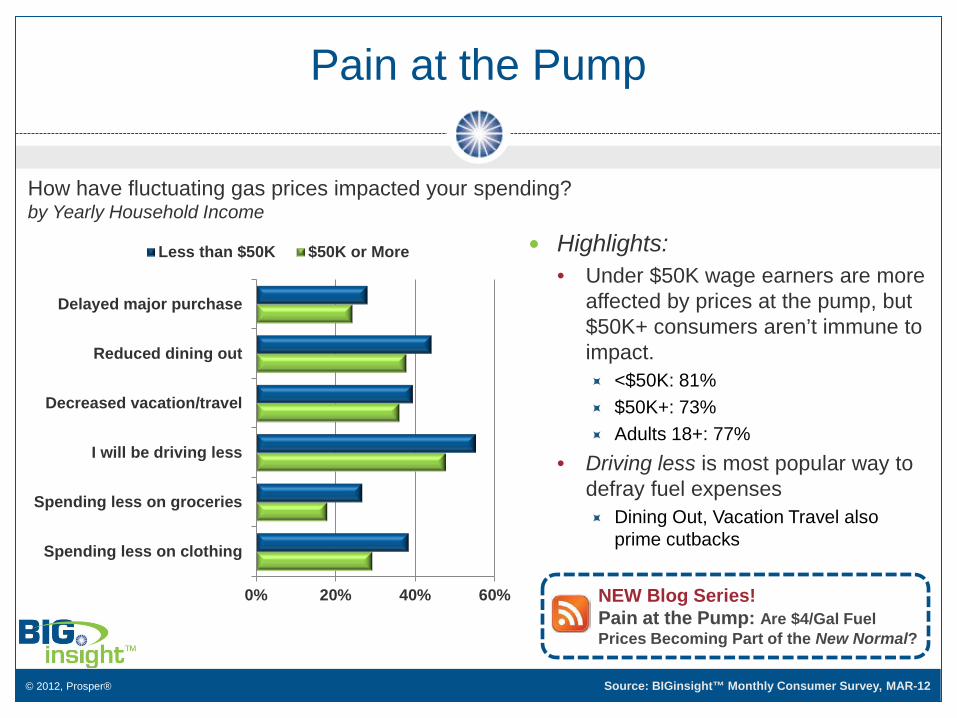
Pain at the Pump
How have fluctuating gas prices impacted your spending? by Yearly Household Income
Highlights: • Under $50K wage earners are more
affected by prices at the pump, but $50K+ consumers aren’t immune to impact. <$50K: 81% $50K+: 73% Adults 18+: 77%
• Driving less is most popular way to defray fuel expenses Dining Out, Vacation Travel also
prime cutbacks
0% 20% 40% 60%
Delayed major purchase
Reduced dining out
Decreased vacation/travel
I will be driving less
Spending less on groceries
Spending less on clothing
Less than $50K $50K or More
NEW Blog Series! Pain at the Pump: Are $4/Gal Fuel Prices Becoming Part of the New Normal?
© 2012, Prosper®
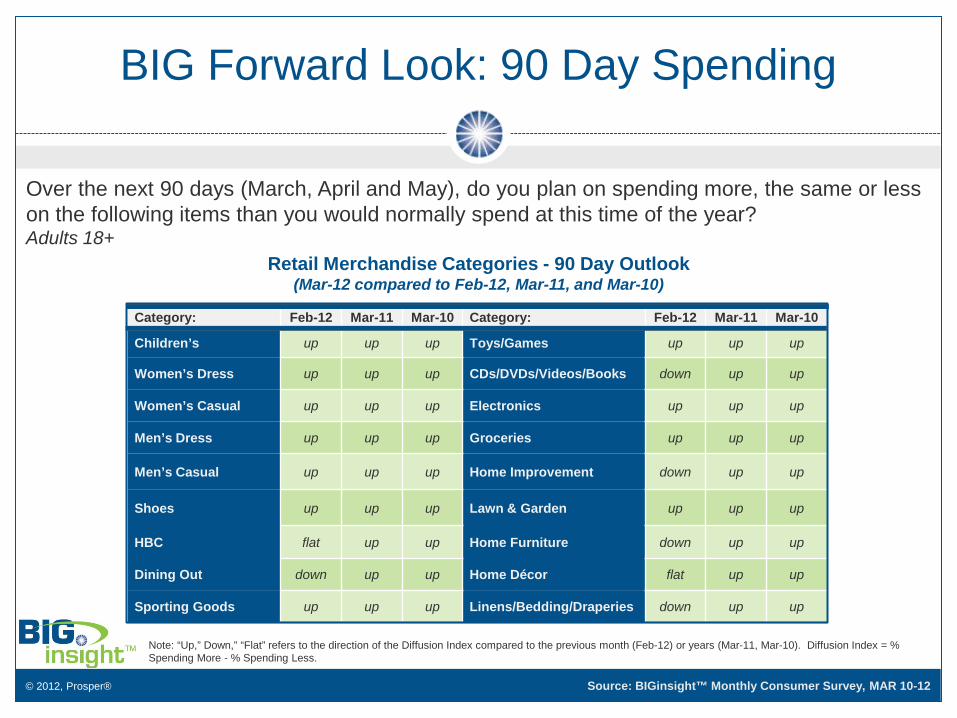
Category: Feb-12 Mar-11 Mar-10 Category: Feb-12 Mar-11 Mar-10
Children’s up up up Toys/Games up up up
Women’s Dress up up up CDs/DVDs/Videos/Books down up up
Women’s Casual up up up Electronics up up up
Men’s Dress up up up Groceries up up up
Men’s Casual up up up Home Improvement down up up
Shoes up up up Lawn & Garden up up up
HBC flat up up Home Furniture down up up
Dining Out down up up Home Décor flat up up
Sporting Goods up up up Linens/Bedding/Draperies down up up
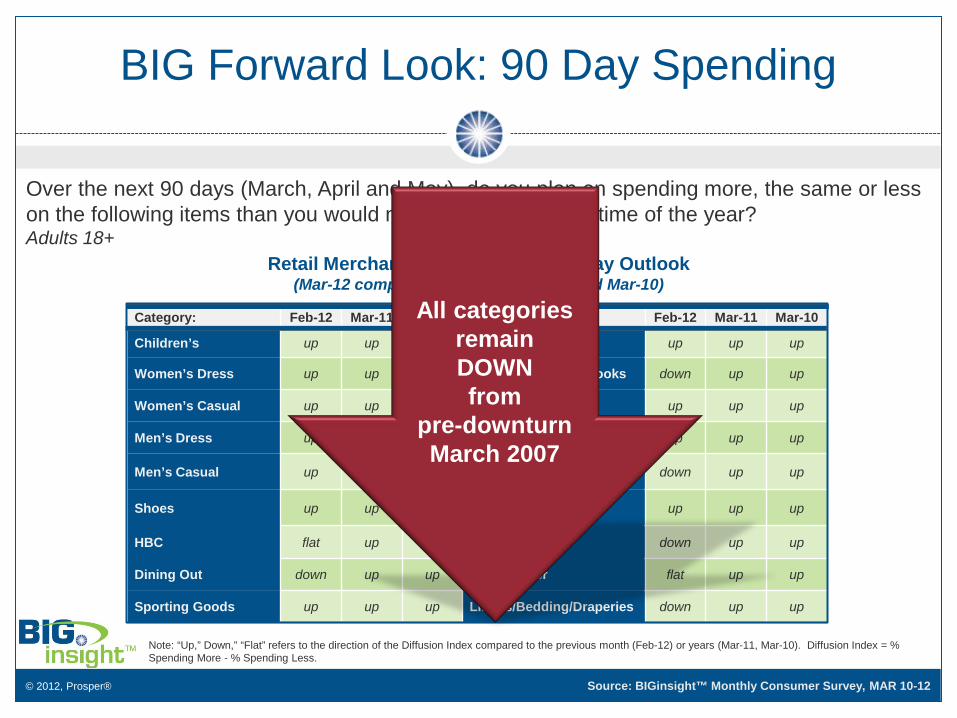
Retail Merchandise Categories - 90 Day Outlook (Mar-12 compared to Feb-12, Mar-11, and Mar-10)
Note: “Up,” Down,” “Flat” refers to the direction of the Diffusion Index compared to the previous month (Feb-12) or years (Mar-11, Mar-10). Diffusion Index = % Spending More - % Spending Less.
BIG Forward Look: 90 Day Spending
Source: BIGinsight™ Monthly Consumer Survey, MAR 10-12
Over the next 90 days (March, April and May), do you plan on spending more, the same or less on the following items than you would normally spend at this time of the year? Adults 18+
© 2012, Prosper®
Category: Feb-12 Mar-11 Mar-10 Category: Feb-12 Mar-11 Mar-10
Children’s up up up Toys/Games up up up
Women’s Dress up up up CDs/DVDs/Videos/Books down up up
Women’s Casual up up up Electronics up up up
Men’s Dress up up up Groceries up up up
Men’s Casual up up up Home Improvement down up up
Shoes up up up Lawn & Garden up up up
HBC flat up up Home Furniture down up up
Dining Out down up up Home Décor flat up up
Sporting Goods up up up Linens/Bedding/Draperies down up up
Retail Merchandise Categories - 90 Day Outlook (Mar-12 compared to Feb-12, Mar-11, and Mar-10)
Note: “Up,” Down,” “Flat” refers to the direction of the Diffusion Index compared to the previous month (Feb-12) or years (Mar-11, Mar-10). Diffusion Index = % Spending More - % Spending Less.
BIG Forward Look: 90 Day Spending
Source: BIGinsight™ Monthly Consumer Survey, MAR 10-12
Over the next 90 days (March, April and May), do you plan on spending more, the same or less on the following items than you would normally spend at this time of the year? Adults 18+
All categories remain DOWN from
pre-downturn March 2007
© 2012, Prosper®
National Trend
Increase in consumers’ weight Centers for Disease Control and Prevention:
• 34% of adults 20 years+ are obese • 68% of consumers are classified as overweight

© 2012, Prosper®
Battle of the sexes: Who is the fast food junky?
Feb 2012 survey of consumers who frequently eat fast food • 52.7% men • 47.3% women
These consumers patronized
fast food restaurants four or more times per week
New insights reveal consumers patterns are changing since 2005 (Source: The Changing American Consumer)
40.0%
45.0%
50.0%
55.0%
Male Female
Frequent Fast Food Restaurants Four or More Times per Month
Source: BIGinsight™ Monthly Consumer Survey, FEB-12

© 2012, Prosper®
Fast Food Frequency
Percentage of Adults 18+ who eat fast food four or more times a month is up from Feb-11, but trending downward from 2005
30.0%
35.0%
40.0%
45.0%
50.0%
Feb-05 Feb-06 Feb-07 Feb-08 Feb-09 Feb-10 Feb-11 Feb-12
Frequent Fast Food Restaurants Four or More Times per Month
Adults18+
Source: BIGinsight™ Monthly Consumer Survey, FEB 05-12
© 2012, Prosper®
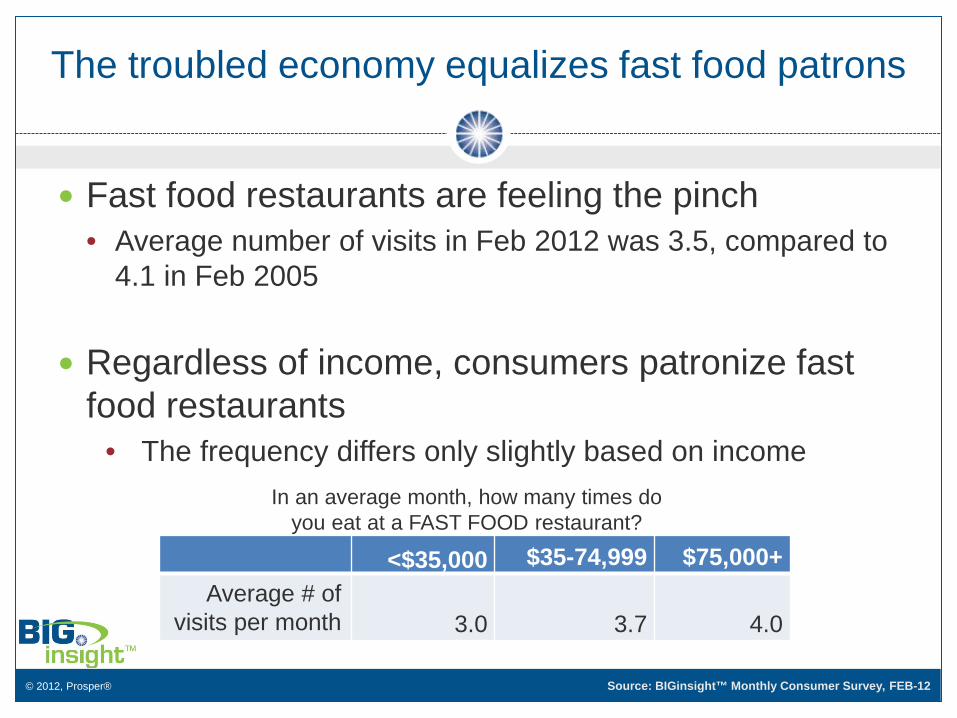
The troubled economy equalizes fast food patrons
Fast food restaurants are feeling the pinch • Average number of visits in Feb 2012 was 3.5, compared to
4.1 in Feb 2005
Regardless of income, consumers patronize fast food restaurants
• The frequency differs only slightly based on income
<$35,000 $35-74,999 $75,000+
Average # of visits per month 3.0 3.7 4.0
In an average month, how many times do you eat at a FAST FOOD restaurant?
Source: BIGinsight™ Monthly Consumer Survey, FEB-12
© 2012, Prosper®
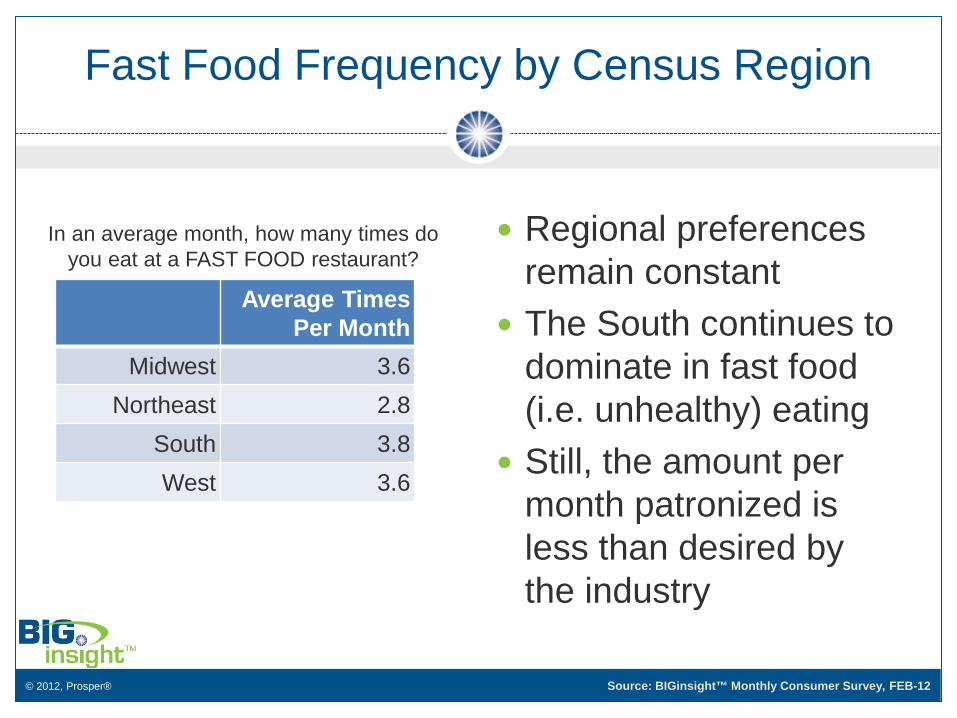
Regional preferences remain constant
The South continues to dominate in fast food (i.e. unhealthy) eating
Still, the amount per month patronized is less than desired by the industry
Average Times Per Month
Midwest 3.6 Northeast 2.8
South 3.8 West 3.6
Fast Food Frequency by Census Region
In an average month, how many times do you eat at a FAST FOOD restaurant?
Source: BIGinsight™ Monthly Consumer Survey, FEB-12
© 2012, Prosper®
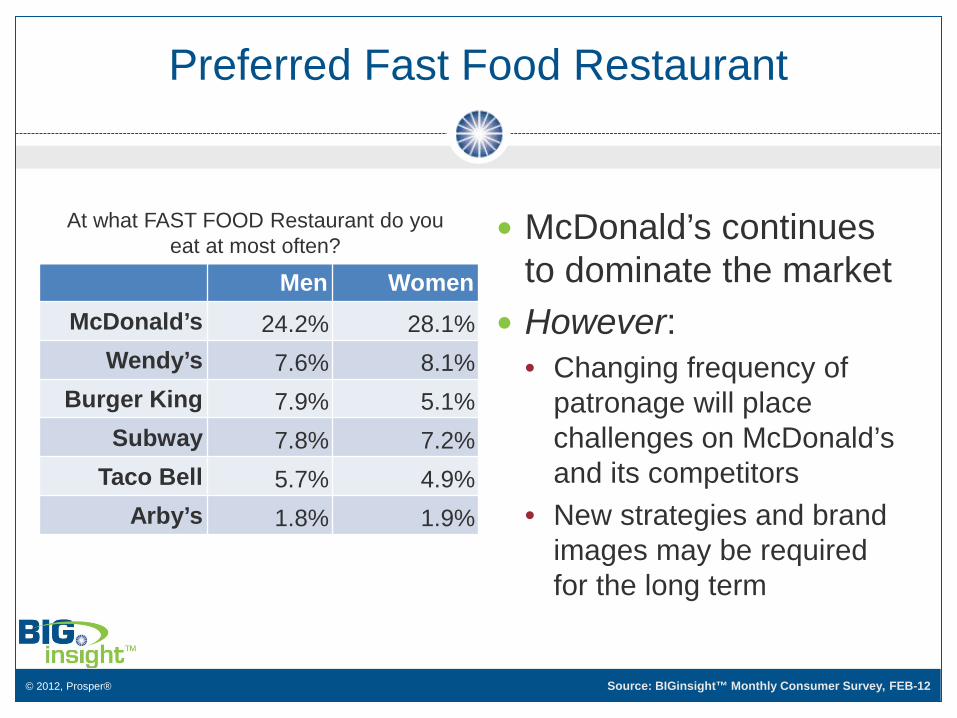
Preferred Fast Food Restaurant
Men Women McDonald’s 24.2% 28.1%
Wendy’s 7.6% 8.1% Burger King 7.9% 5.1%
Subway 7.8% 7.2% Taco Bell 5.7% 4.9%
Arby’s 1.8% 1.9%
McDonald’s continues to dominate the market
However: • Changing frequency of
patronage will place challenges on McDonald’s and its competitors
• New strategies and brand images may be required for the long term
At what FAST FOOD Restaurant do you eat at most often?
Source: BIGinsight™ Monthly Consumer Survey, FEB-12

© 2012, Prosper®
Top Reasons for Patronizing Fast Food Restaurants
Issues traditionally thought of with a restaurant (i.e. healthy food, cleanliness) are not as important
Regardless of income, consumers eat at fast food restaurants because of: • Price • Convenience

© 2012, Prosper®
Top Reasons for Patronizing Fast Food Restaurants
<$35,000 $35,000-
74,999 $75,000+ Price 50.6% 48.7% 40.1%
Location 43.5% 43.9% 43.3% Menu Selection 32.3% 34.2% 33.8%
Fast Service 37.0% 38.3% 36.6% Quality of Food 31.7% 33.9% 34.7%
Value Menu 24.8% 22.6% 16.0% Cleanliness 15.5% 14.7% 15.2%
Portion Sizes 12.4% 11.8% 10.2% Healthy Menu Options 11.9% 13.2% 15.8%
Which of the following are reasons why you eat there most often? (Check all that apply)
Source: BIGinsight™ Monthly Consumer Survey, FEB-12
© 2012, Prosper®
Snapshot
Fast food industry is experiencing changes in sales volume
Attributes desired are not typical of “eat in”
restaurants
Consumers’ income does not play as big of a role as it may originally have
© 2012, Prosper®
For More About Americans and Their Fast Food
McDonald’s, Taco Bell and Wendy’s Customers Most Unhappy with Their Health view Fast food frequenters’ wellbeing tied to personal behavior
rather than drive-thru of choice
The Changing American Consumer
Identifies consumer trends regarding the Fast Food Industry (Chapter 6: Make Mine Large)

© 2012, Prosper®
The Changing American Consumer
Some of the consumer trends identified in The Changing American Consumer include: Personal Finance | Chapter 1: America, Land of Plenty? Home Ownership | Chapter 3: Building the American Castle Auto Market |Chapter 4: Consumers’ Love Affair with Autos Online Shopping | Chapter 8: Shopping in Your Boxers, Briefs
or Bathrobe
Every chapter includes top five lessons learned
© 2012, Prosper®
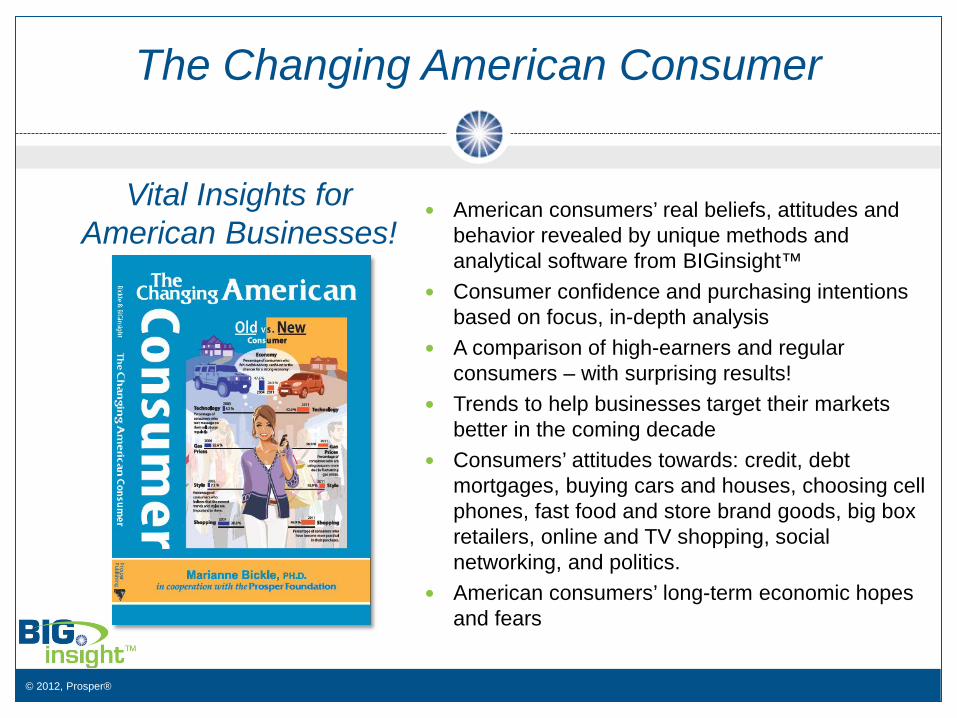
The Changing American Consumer
American consumers’ real beliefs, attitudes and behavior revealed by unique methods and analytical software from BIGinsight™
Consumer confidence and purchasing intentions based on focus, in-depth analysis
A comparison of high-earners and regular consumers – with surprising results!
Trends to help businesses target their markets better in the coming decade
Consumers’ attitudes towards: credit, debt mortgages, buying cars and houses, choosing cell phones, fast food and store brand goods, big box retailers, online and TV shopping, social networking, and politics.
American consumers’ long-term economic hopes and fears
Vital Insights for American Businesses!
© 2012, Prosper®
The Changing American Consumer
American consumers’ real beliefs, attitudes and behavior revealed by unique methods and analytical software from BIGinsight™
Consumer confidence and purchasing intentions based on focus, in-depth analysis
A comparison of high-earners and regular consumers – with surprising results!
Trends to help businesses target their markets better in the coming decade
Consumers’ attitudes towards: credit, debt mortgages, buying cars and houses, choosing cell phones, fast food and store brand goods, big box retailers, online and TV shopping, social networking, and politics.
American consumers’ long-term economic hopes and fears
Vital Insights for American Businesses!
For more information or to purchase, please visit:
www.ChangingConsumer.com/info
Kindle edition coming soon!

© 2012, Prosper®
BIG
Con
sum
er
Blo
g FYU: Shoes view
Generation Gap: Confidence Defined view
Is Pinterest Your New Obsession? view
It’s Me and Jamie Oliver Against the World view
Generation Gap: Yuck, It’s Tax Season view
State Superlatives: Dreamiest Destination, Finest Fare, Best Bet for a “Rerun” + more view
UPCOMING: The Award for Best Portrayal of an Ideal Model Family Goes to… view
“Fair is Fair” but is Square…well…Square? view

© 2012, Prosper®
Con
tact
400 W. Wilson Bridge Road Suite 200 Worthington, OH 43085 Ph: 614-846-0146 [email protected]
Dr. Marianne Bickle Center for Retailing, University of South Carolina [email protected] Forbes Prosper Now Blog
for complimentary insights, visit: www.BIGinsight.com