big call july 2012
TRANSCRIPT

400 W. Wilson Bridge Road, Suite 200, Worthington, OH, 43085 614-846-0146 [email protected]
PAM E L A G O O D F E L L O W
C O N S U M E R I N S I G H T S D I R E C TO R , B I G I N S I G H T ™
G U E S T C O N T R I B U TO R :
E L L E N D AV I S
S E N I O R V I C E P R E S I D E N T, N AT I O N A L R E TA I L F E D E R AT I O N
E X E C U T I V E D I R E C TO R , N R F F O U N D AT I O N
The BIG Call
July 2012

© 2012, Prosper®
July 2012 Consumer Survey
Disclaimer: BIGinsight™ is a trademark of Prosper Business Development Corp. Services are delivered by Prosper and/or a Prosper affiliated company (“Prosper”).
Prosper makes no warranties, either expressed or implied, concerning: data gathered or obtained from any source; the present or future methodology employed in
producing the statistics; or the data and estimates represent only the opinion of Prosper and reliance thereon and use thereof shall be at the user’s own risk.
This report is derived from the following studies:
• BIGinsight™ Monthly Consumer Survey, July 2012 (N = 8509, respondents surveyed 7/2 – 7/9/12)
• BIGinsight™ Monthly Consumer Survey Trends, July 2007 – July 2012
July 2012 Results
• Consumer Confidence
• Employment Outlook
• Practical Purchasing
• 90 Day Outlook: Future Purchase Plans
• Holiday 2012 Spending Preview
Back-to-School Overview with Ellen Davis, NRF SVP

© 2012, Prosper®
Confident/Very Confident in Chances for a Strong Economy Adults 18+
Consumer Confidence
Source: BIGinsight™ Monthly Consumer Survey, JUL 11-12
Highlights:
• Economic sentiment perks up
Up 1+ points from June
Ends two month confidence slide
• Highest confidence reading
headed into the Back-to-School
season since Jul-07 (47.8%)
26.5%
31.3%
32.8%
15%
20%
25%
30%
35%
40%

© 2012, Prosper®
Confident/Very Confident in Chances for a Strong Economy Adults 18+
Consumer Confidence
Source: BIGinsight™ Monthly Consumer Survey, JUL 07-12
26.5%
31.3%
32.8%
15%
20%
25%
30%
35%
40%
47.8
%
18.8
%
27.2
%
27.9
%
26.5
%
31.3
%
32.8
%
0%
5%
10%
15%
20%
25%
30%
35%
40%
45%
50%
Jul-07 Jul-08 Jul-09 Jul-10 Jul-11 Jun-12 Jul-12
30%+
decline
from
Jul-07

© 2012, Prosper®
Employment Outlook
Source: BIGinsight™ Monthly Consumer Survey, JUL 10-12
Regarding the U.S. employment environment, over the next 6 months, do you think that there
will be more, the same, or fewer layoffs than at present? Adults 18+
* U.S. Unemployment Rate for the previous month for each corresponding MMM-YY, as reported by the U.S. Bureau of Labor Statistics.
U.S
. U
ne
mp
loym
en
t R
ate
*
La
yo
ff P
red
icti
on
s
Highlights:
• One in four expecting “more”
layoffs over the next six months
Down slightly from June
Thinking bullishly headed into
holiday hiring season?
• Fewer than one in five calling
for “fewer” layoffs
Figure has remained relatively
stagnant over the past three
years
• Employment mantra = more of
the “same.”
Is more of the same “good”
when the unemployment rate
remains in 8-9% territory?
• Personal concerns about
becoming laid off uptick in July
30.8% 29.6% 27.0% 25.9%
55.4%
18.7%
7.6%
7.8%
8.0%
8.2%
8.4%
8.6%
8.8%
9.0%
9.2%
9.4%
9.6%
0%
10%
20%
30%
40%
50%
60%
70%
80%
90%
100%
Jul-10 Jul-11 Jun-12 Jul-12
More Same Fewer U.S. Unemployment Rate*
9.4%*
9.1%
8.2%
8.2%

© 2012, Prosper® Source: BIGinsight™ Monthly Consumer Survey, JUL 11-12
Practical Purchasing
In the last 6 months, have you made any of the following changes? Adults 18+
Highlights:
• Practicality off slightly from June
as more consumers cite
confidence in the economy
Nearly half pragmatic in
spending (47.8%)
Down a few points from Jul-
11 (49.9%)
• 56.1% are focused on just the
necessities
Up more than a point from
June, but down two points
from a year ago
• Spending Rebound?
Not so fast: indicators
remain well ABOVE rates
recorded before the “Great
Recession”
40%
42%
44%
46%
48%
50%
52%
54%
56%
58%
60%
Jul-11 Aug Sep Oct Nov Dec Jan Feb Mar Apr May Jun Jul-12
I have become more practical and realistic in my purchases
I focus more on what I NEED rather than what I WANT

© 2012, Prosper®
Category: Jun-12 Jul-11 Jul-10 Category: Jun-12 Jul-11 Jul-10
Children’s up up up Toys/Games down up up
Women’s Dress down up up CDs/DVDs/Videos/Books down up up
Women’s Casual down up up Electronics down up up
Men’s Dress down up up Groceries down up up
Men’s Casual down up up Home Improvement down up up
Shoes flat up up Lawn & Garden down up up
HBC up up up Home Furniture flat up up
Dining Out down up up Home Décor down up up
Sporting Goods down up up Linens/Bedding/Draperies down up up
Retail Merchandise Categories - 90 Day Outlook (Jul-12 compared to Jun-12, Jul-11, and Jul-10)
Note: “Up,” Down,” “Flat” refers to the direction of the Diffusion Index compared to the previous month (Jun-12) or years (Jul-11, Jul-10). Diffusion Index = %
Spending More - % Spending Less.
BIG Forward Look: 90 Day Spending
Source: BIGinsight™ Monthly Consumer Survey, JUL 10-12
Over the next 90 days (July, August, and September), do you plan on spending more, the same
or less on the following items than you would normally spend at this time of the year? Adults 18+
© 2012, Prosper® Source: BIGinsight™ Monthly Consumer Survey, JUL 09-12
Holiday 2012 Spending Preview
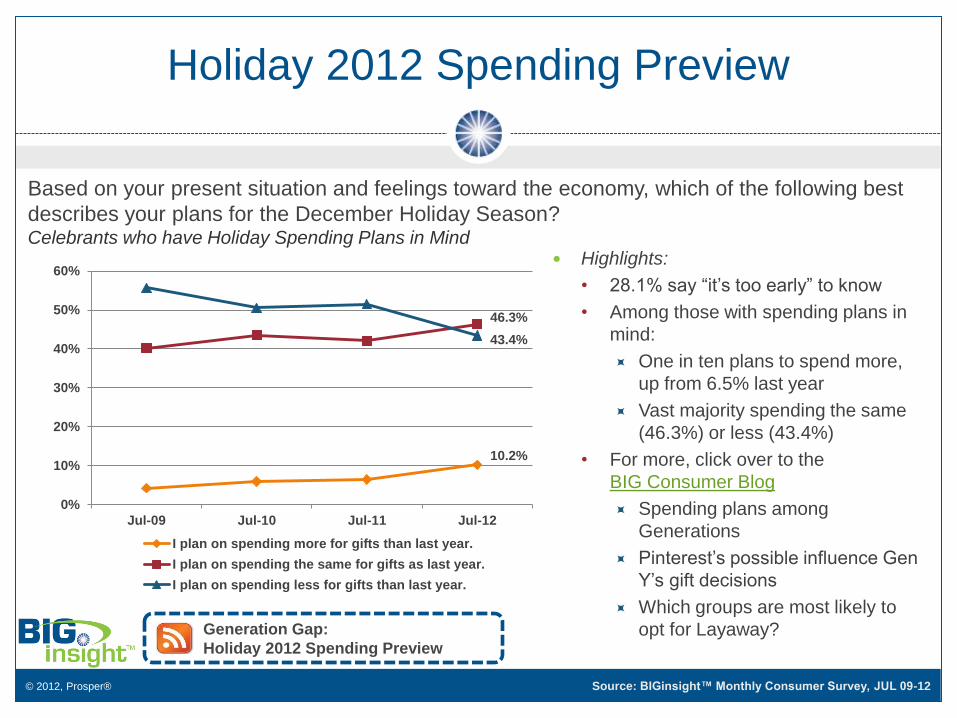
Based on your present situation and feelings toward the economy, which of the following best
describes your plans for the December Holiday Season? Celebrants who have Holiday Spending Plans in Mind
Highlights:
• 28.1% say “it’s too early” to know
• Among those with spending plans in
mind:
One in ten plans to spend more,
up from 6.5% last year
Vast majority spending the same
(46.3%) or less (43.4%)
• For more, click over to the
BIG Consumer Blog
Spending plans among
Generations
Pinterest’s possible influence Gen
Y’s gift decisions
Which groups are most likely to
opt for Layaway?
Generation Gap:
Holiday 2012 Spending Preview
10.2%
46.3%
43.4%
0%
10%
20%
30%
40%
50%
60%
Jul-09 Jul-10 Jul-11 Jul-12
I plan on spending more for gifts than last year.
I plan on spending the same for gifts as last year.
I plan on spending less for gifts than last year.

© 2012, Prosper®
The Economy: Where We’ve Been, Where We’re Going
Retail sales expected to grow 3.4%
this year
• First half 2012 sales grew 4.5%
• Factors behind growth
Warm weather
Inflation

© 2012, Prosper®
Back to School, Back to College 2012
Combined
spending to
total $84 billion
Average parent
of K-12 student
to spend about
$690
Average parent
of college
student to spend
about $900

© 2012, Prosper®
Why the increase?
Replenishment
• Replace what children
had to “make-do” with
last school season
Population growth
• More children entering
elementary and
middle school

© 2012, Prosper®
Economy Remains Top of Mind
More comparison
shopping online
Shopping earlier
• Begin shopping at
least two months
before the start of
school:
2007 = 14.6%
2012 = 22.3%
It’s not all bad news
© 2012, Prosper®
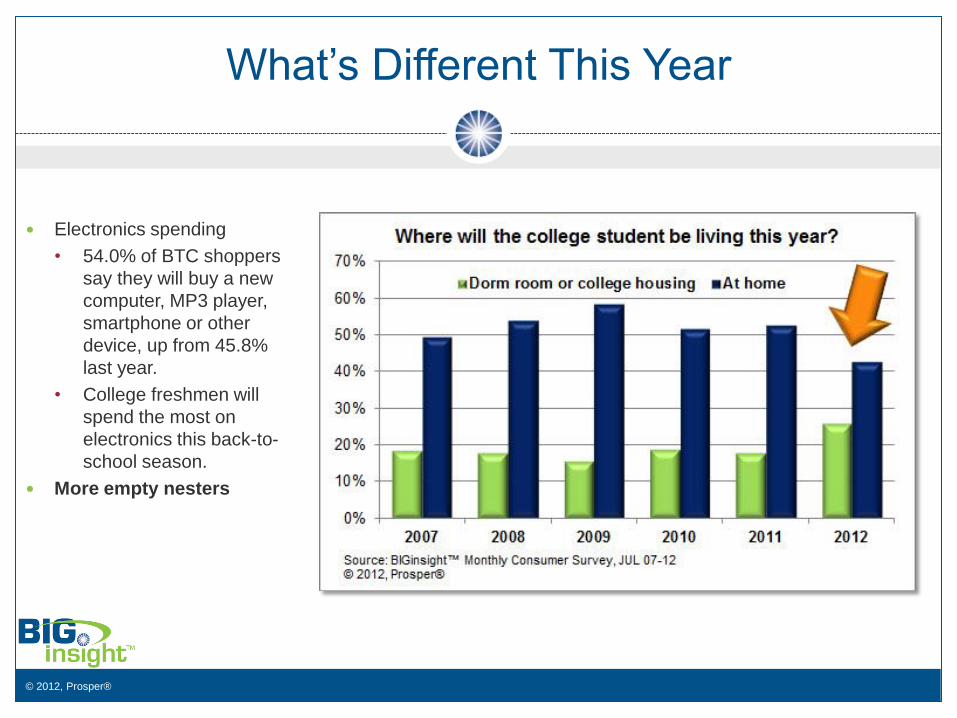
What’s Different This Year
Electronics spending
• 54.0% of BTC shoppers
say they will buy a new
computer, MP3 player,
smartphone or other
device, up from 45.8%
last year.
• College freshmen will
spend the most on
electronics this back-to-
school season.
More empty nesters

© 2012, Prosper®
Retailers’ Recipe for Success
Strong
promotions
Earlier
marketing
Lower
inventory

© 2012, Prosper®
Holiday Implications
What this tells us
What this doesn’t

© 2012, Prosper®
Co
nta
ct
400 W. Wilson Bridge Road
Suite 200
Worthington, OH 43085
Ph: 614-846-0146
for complimentary insights:
www.BIGinsight.com
National Retail Federation
Back-to-School Headquarters
www.nrf.com/backtoschool