any questions scholes hall, room 238 albuquerque, nm 87131 ... book/2007fb.pdf · the university of...
TRANSCRIPT

The University of New MexicoOffice of Institutional Research
Scholes Hall, Room 238Albuquerque, NM 87131-0001
MSC05-3420
For an electronic version of this book,visit our web site at www.unm.edu/~oir
Telephone: 505-277-5115Fax: 505-277-7655
E-mail: [email protected]
Any questionsconcerning material contained
in this book should be directed to:
Fact Book2007-2008

2007 - 2008 UNM Fact Book - Page ii
Introduction v Enrollment - Branch Campuses
Facts at a Glance Enrollment by Branch and Degree Status (Fall 2001 to Fall 2007) 27Enrollment, Gallup Branch (Fall 2003 to Fall 2007) 28
Historical Enrollment (Fall 1929-2007) 1 Community Outreach Programs, Gallup Branch 29Students (Fall 2007) 2 (2002-2003 to 2006-2007)Total Enrollment - All UNM Units Combined (Fall 2003-2007) 3 Enrollment, Los Alamos Branch (Fall 2003 to Fall 2007) 30Preparation, Retention, and Graduation Rates (Main Campus) 4 Community Outreach Programs, Los Alamos Branch 31Degrees Awarded (2006-2007 Academic Year) 5 (2002-2003 to 2006-2007)UNM Count of Employees as of October, 2007 6 Enrollment, Taos Branch (Fall 2003 to Fall 2007) 32FY 2007-2008 Budget Plan 7 Community Outreach Programs, Taos Branch 33
(2002-2003 to 2006-2007)Enrollment - Main Campus Enrollment, Valencia Branch (Fall 2003 to Fall 2007) 34
Community Outreach Programs, Valencia Branch 35Undergraduate Enrollment by Program (Fall 2001 to Fall 2007) 9 (2002-2003 to 2006-2007)Graduate/Professional Enrollment by Program 10 Branch Student Credit Hours by Course Level (Fall 2001 to 2007) 36
(Fall 2001 to Fall 2007) Branch Enrollment by Age (Fall 2003 to Fall 2007) 37-38On-Campus and Extended University Enrollment 11
(Fall 2001 to Fall 2007) Beginning Freshmen & Transfer Students -Total Enrollment (Fall 2003 to Fall 2007) 12 Main CampusUndergraduate Students (Fall 2003 to Fall 2007) 13Graduate Studies Students (Fall 2003 to Fall 2007) 14 Beginning Freshmen by Ethnicity (Fall 2003 to Fall 2007) 39AGSM Students (Fall 2003 to Fall 2007) 15 High School Performance Indicators of First-Time 40-41Law Students (Fall 2003 to Fall 2007) 16 Freshmen (Fall 1998 to Fall 2007)Medical Students (Fall 2003 to Fall 2007) 17 NM HS Graduates 2007 & UNM Beginning Freshmen 42PharmD. Students (Fall 2003 to Fall 2007) 18 (Fall 2007)Non-Degree Students (Fall 2003 to Fall 2007) 19 Residency of First-Time Freshmen by NM County 43Student Credit Hours by Course Level (Fall 2001 to Fall 2007) 20 (Fall 2003 to Fall 2007)Student Credit Hours by College & Course Level 21-22 Residency of First-Time Freshmen by US State 44
(Fall 2001 to Fall 2007) (Fall 2003 to Fall 2007)Enrollment by Age (Fall 2003 to Fall 2007) 23-25 Transfer Students to Main Campus (2002-2003 to 2006-2007) 45
Table of Contents

2007 - 2008 UNM Fact Book - Page iii
Degree Programs, Program Accreditation, Faculty by Highest Degree Earned, Total UNM (Fall 2007) 82-83Degrees Awarded & Alumni Faculty by College, Main Campus & SOM (Fall 2007) 84
Faculty Administrators, Main Campus & SOM (Fall 2007) 85Degree & Certificate Programs, Main Campus 47-50 IPEDS Faculty, Main Campus & SOM (Fall 2007) 86Accreditation at UNM, Institutional and Programmatic 51-54 Faculty Diversity - New Hires, Main Campus, 87-88
(as of 12/2007) not SOM (2003-2007)Degrees Awarded, Main Campus (1997-1998 to 2006-2007) 55 Faculty Diversity - New Hires, School of Medicine 89-90Degrees Awarded by Ethnicity, Main Campus 56 (2003-2007)
(2002-2003 to 2006-2007)Retention and Graduation Rates, Main Campus 57 Staff
(Fall 1997 to Fall 2006 Freshmen Classes)Degrees Awarded by Ethnicity, Branch Campuses 58-59 Regular Staff by Site (Fall 2003 to Fall 2007) 91
(2002-2003 to 2006-2007) Temporary Staff by Site (Fall 2003 to Fall 2007) 92UNM Alumni by State 60 Staff - All UNM (Fall 2003 to Fall 2007) 93UNM Alumni in New Mexico by County 61 Staff - Main Campus, not Health Sciences Center 94
(Fall 2003 to Fall 2007)Faculty Staff - Health Sciences Center 95
(Fall 2003 to Fall 2007)All Faculty Combined and Faculty Administrators 63 Staff - Total Main Campus (Fall 2003 to Fall 2007) 96
(Fall 2003 to Fall 2007) Staff - Gallup Branch (Fall 2003 to Fall 2007) 97IPEDS Faculty & Faculty Administrators by Site (Fall 2007) 64 Staff - Los Alamos Branch (Fall 2003 to Fall 2007) 98Tenure/Tenure-Track Faculty by Site (Fall 2003 to Fall 2007) 65 Staff - Taos Branch (Fall 2003 to Fall 2007) 99Non-Tenure-Track Faculty by Site (Fall 2003 to Fall 2007) 66 Staff - Valencia Branch (Fall 2003 to Fall 2007) 100
67 Staff - Total Branch (Fall 2003 to Fall 2007) 101All UNM Faculty (Fall 2003 to Fall 2007) 68-69 Student Employees by Site (Fall 2003 to Fall 2007) 102-103Main Campus Faculty, not SOM (Fall 2003 to Fall 2007) 70-71School of Medicine Faculty (Fall 2003 to Fall 2007) 72-73 Faculty Scholarship, Research & LibrariesGallup Branch Faculty (Fall 2003 to Fall 2007) 74-75Los Alamos Branch Faculty (Fall 2003 to Fall 2007) 76-77 Faculty Scholarship, All UNM (1997-1998 to 2006-2007) 105Taos Branch Faculty (Fall 2003 to Fall 2007) 78-79 UNM Centers & Institutes - All UNM (2007-2008) 106-107Valencia Branch Faculty (Fall 2003 to Fall 2007) 80-81 Contract & Grant Awards, UNM Total (FY 2007) 108
Table of Contents
Temporary Faculty by Site (Fall 2003 to Fall 2007)

2007 - 2008 UNM Fact Book - Page iv
Faculty Scholarship, Research & Libraries Staff Salary Profile - All UNM Campuses Combined 123(continued) (as reported in Fall 2007)
UNM Endowment Funds 124-125Contract & Grant Expenditures, UNM Total (FY 1995-FY 2007) 109 Gift Activity (FY 2003 to 2007) 126Economic Development Contributions 110 UNM Facilities (as of Sept. 2007) 127
(FY 2002-2003 to FY 2006-2007) Capital Outlay Projects (2008-2009) 128-129Information Technology Services (ITS) 111
(FY 2006-2007)UNM Main Campus Libraries (2006-2007) 112-113
Finance & Resource Data
Actual Current Fund Revenue - All UNM 115(FY 2006-2007)
Actual Current Fund Expenditures - All UNM 116(FY 2006-2007)
Financial Aid by Source and Type of Aid 117All UNM (2004-2005 to 2006-2007)
Financial Aid Recipients by Ethnicity, Sex & Level (Fall 2006) 118Scholarships, All UNM 119
(2002-2003 to 2006-2007) Full-Time Tuition & Fees, Main Campus 120
(2001-2002 to 2007-2008) Full-Time Tuition & Fees, Branch Campuses 121
(2001-2002 to 2007-2008) Comparative FT Instructional Faculty Salaries, Main Campus 122
(Fall 2001-2006)UNM Peer Institutions 122
Table of Contents

2007 - 2008 UNM Fact Book - Page v
UNM Facts2007-2008
IntroductionIn Fall 2007, the campuses of the University of New Mexico served 32,086 students; employed 3,306 faculty, 6,883 staff, and 5,002 students (an additional 4,949 staff work at University Hospital); and had a total operating and capital budget of about $1.84 billion. In the previous academic year, UNM awarded 5,046 degrees and certificates.
An additional unit of the University of New Mexico is the Division of Continuing Education and Community Services, which serves more than 35,000 students annually in various non-credit or certificate courses, workshops, and training sessions. Approximately 200,000 community and UNM participants use the Conference Center facility each year.
Los Alamos
Gallup
Taos
Main Campus
Valencia
This fact book presents data for all UNM campuses. UNM consists of a Main Campus located in Albuquerque, which includes the Health Sciences Center, Extended University, and Continuing Education, and four branch campuses, which have a two-year degree mission: UNM-Gallup, UNM-Los Alamos, UNM-Taos, and UNM-Valencia. The Extended University provides access to courses on-site and via technologies—including satellite broadcasts, videoconferencing, and on-line instruction—throughout the state. The Extended University also offers courses at centers located in Farmington, Gallup, Kirtland Air Force Base, Los Alamos, Santa Fe, Taos, Valencia, and UNM West (Rio Rancho). The UNM Health Sciences Center and its programs—which include the School of Medicine, College of Nursing, and College of Pharmacy—are sometimes reported in the Fact Book as part of the Main Campus and sometimes separately. Footnotes and labels should make it clear in each case what is included.

2007 - 2008 UNM Fact Book - Page vi

Facts at a Glance


2007 - 2008 UNM Fact Book - Page 1
Facts at a GlanceHistorical Enrollment, Fall 1929-2007
Note: Total UNM enrollment includes Main Campus, Extended University, and all four Branch Campuses.
Sources: Annual Report of the Office of Admissions and Records (1953-54; 1971-72; 1983-94); Official Enrollment Report, Registrar's Office (Fall 1995-1997), Fall 21-day enrollment files maintained by the Registrar's Office (Fall 1998-2007).
Fall 2007:32,086
Fall 2007:25,749
Historical EnrollmentFall 1929 to Fall 2007
0
5,000
10,000
15,000
20,000
25,000
30,000
35,00019
29
1932
1935
1938
1941
1944
1947
1950
1953
1956
1959
1962
1965
1968
1971
1974
1977
1980
1983
1986
1989
1992
1995
1998
2001
2004
2007
Hea
dcou
nt
Main Campus Enrollment Total UNM Enrollment

2007 - 2008 UNM Fact Book - Page 2
Facts at a GlanceStudents (Fall 2007)
Total Avg. Students Females Males Age FTE**
Main Campus* 25,749 14,703 11,046 26.5 20,307Branches 6,337 4,221 2,116 29.8 3,528
Total 32,086 18,924 13,162 27.1 23,835
* Includes Health Sciences Center (HSC) and Extended University.
** Includes FTE from the developmental courses offered on Main Campus by CNM.
Source: Fall 21-day enrollment files maintained by the Registrar's Office.
Fall 2007 Enrollment
Ethnicity - Main Campus*
White, non-Hispanic
48.4%
Hispanic31.2%
American Indian6.0%
No Response
4.3%
International3.4%
African American
2.9%
Asian/Pacific Islander
3.8%
Ethnicity - Total UNM
White, non-Hispanic43.8%
Hispanic31.6%
American Indian11.8%
No Response4.1%
International2.8%
African American
2.5%
Asian/Pacif ic Islander3.3%

2007 - 2008 UNM Fact Book - Page 3
Facts at a GlanceTotal Enrollment (Fall 2003 to 2007)
2003 2004 2005 2006 2007 2003 2004 2005 2006 2007Total Headcount 32,696 33,264 32,915 32,347 32,086Full-time * 19,879 20,215 20,345 20,142 20,190 60.8 60.8 61.8 62.3 62.9Part-time 12,817 13,049 12,570 12,205 11,896 39.2 39.2 38.2 37.7 37.1
Avg. Hrs. per Sem. * 10.7 10.7 10.8 10.9 10.9Full-Time Equivalent * 23,963 24,357 24,396 24,123 24,078
2003 2004 2005 2006 2007 2003 2004 2005 2006 2007Average Age 28.3 28.2 27.9 27.8 27.6
Females 19,457 19,909 19,753 19,219 18,921 59.5 59.9 60.0 59.4 59.0Males 13,239 13,355 13,162 13,128 13,160 40.5 40.1 40.0 40.6 41.0
African American/Black 678 703 732 755 799 2.1 2.1 2.2 2.3 2.5American Indian 3,925 4,163 3,938 3,830 3,791 12.0 12.5 12.0 11.8 11.8Asian/Pacific Islander 933 946 958 999 1,046 2.9 2.8 2.9 3.1 3.3Hispanic 9,755 9,977 10,055 9,998 10,154 29.8 30.0 30.5 30.9 31.6White/non-Hispanic 14,738 14,636 14,315 14,345 14,050 45.1 44.0 43.5 44.3 43.8International 950 936 903 890 927 2.9 2.8 2.7 2.8 2.9No Response 1,717 1,903 2,014 1,530 1,319 5.3 5.7 6.1 4.7 4.1
* Calculations include credit hours for IS courses taught by CNM faculty at UNM Main Campus.
Source: Fall 21-day CHE enrollment files maintained by the Registrar's Office
Percentages
Percentages
Total Fall Enrollment (Main, HSC, Branches, and Extended University)
Student Demographics

Facts at a GlancePreparation, Retention, and Graduation Rates (Main Campus)
Year % % Freshmen AdmittedMatriculated Retained Fall Avg. HS GPA Under Plan A*
1999 71.6% 2000 3.30 89.4%2000 73.4% 2001 3.32 87.5%2001 76.3% 2002 3.31 88.3%2002 76.2% 2003 3.31 88.3%2003 75.2% 2004 3.35 87.5%2004 76.0% 2005 3.34 90.1%2005 74.4% 2006 3.33 93.4%2006 76.6% 2007 3.35 91.8%
Note: Retention is shown from one fall semester to the next fall *Plan A - College preparatory curriculumsemester. For example, of the 3,017 full-time beginning freshmenin fall 2005, 74.4% of these students returned in fall 2006.
Year All Plan AMatriculated Freshmen Freshmen
1995 45.2% 47.6%1996 45.8% 47.7%1997 42.5% 45.0%1998 40.1% 42.2%1999 41.0% 42.9%2000 43.2% 44.7%2001 44.0% 45.1% See "Retention and Graduation Rates, Main Campus" in "Degree Programs."
* Includes students enrolled in the PharmD program in 4th fall semester. By federal definition, these are considered completers.
Source: Freshman Cohort Tracking Database, Office of Institutional Research
PreparationEntering Full-Time Freshmen
Graduation Rates*Full-Time Freshmen Graduating after 6 Years
Beginning Full-Time FreshmenRetention to 2nd Fall Semester
6-Year Graduation RatesFull-time Freshmen
0%
20%
40%
60%
80%
100%
1995 1996 1997 1998 1999 2000 2001Year Matriculated
% G
radu
atin
gaf
ter 6
Yrs
.
All FT Freshmen
Plan A FT Freshmen
2007 - 2008 UNM Fact Book - Page 4

2007 - 2008 UNM Fact Book - Page 5
Facts at a GlanceDegrees Awarded (2006-2007 Academic Year)
Degree Main* Gallup Alamos Taos Valencia Total
Undergraduate Certificates 6 54 6 12 9 87Associate Degrees 10 157 45 37 96 345Bachelors 2,999 2,999Masters 1,110 1,110Professional 293 293Doctorate 185 185Post-Masters Certificates 6 6Graduate Certificates 5 5Educ. Specialist Certificates 16 16
Total 4,630 211 51 49 105 5,046
Sources: Main: Fall 2007 Official Enrollment Report, Registrar's Office; Branches: 2006-2007 IPEDS Completions Survey* Includes degrees from HSC and the Extended University.
Total Degrees AwardedPost-Masters
Certificate0%
Doctorate4%
Professional6%
Masters22%
Certificates2%
Graduate Certificates
0%
Associate Degrees7%
Bachelors59%
Education Specialist
0%

2007 - 2008 UNM Fact Book - Page 6
Facts at a GlanceUNM Count of Employees as of October, 2007
UNM HospitalFaculty Students Staff Total Staff
3,306 5,002 6,883 15,191 4,949 20,140
1,989 0 4,979 6,968 3,786 10,7541,317 5,002 1,904 8,223 1,163 9,386
2,020 0 5,250 7,270 4,837 12,1071,286 5,002 1,633 7,921 112 8,033
1,799 3,913 4,227 9,939 0 9,9391,002 894 2,322 4,218 4,949 9,167
505 195 334 1,034 0 1,034
Source: Office of Institutional Research
*** Includes Nursing, Pharmacy, Basic Medical Sciences, and Clinical Health Sciences
Health Sciences Center***Branch Campuses
** Includes Extended University and Continuing Educatio* UNM Hospital defines full-time as an FTE of .8 or greater; UNM classfies full-time as an FTE of 1.0.
UNM UNM & UNM Hospital CombinedCategory
Full-Time *
Employee Totals
Part-Time
RegularTemporary
Main Campus**

2007 - 2008 UNM Fact Book - Page 7
Facts at a GlanceFY 2007-2008 Budget Plan*
Revenue $ (million)Sales & Services $702.4State Appropriations - Operating $349.9Grants & Contracts $246.3Tuition & Fees $122.7Other ** $120.4Use of Balance $72.9Local Government Appropriations $105.0Private $46.4State Bonds $30.9Federal Appropriations $27.8Institutional Bonds $4.6State Appropriations - Capital $11.4Total $1,840.7
Expenditures $ (million)Main Campus $585.9Health Sciences Center (HSC) $478.3UNM Hospital $516.0Plant Funds $219.3Branch Campuses $41.2Total $1,840.7
* UNM consolidated revenue and expenditures. Includes branch campuses, the HSC, and UNM Hospital.** "Other" revenue includes numerous sources of revenue, including land leases, rentals, and parking permits and fees.
Source: UNM Budget Office, 2007-2008 Operating and Capital Budget Plan
Expenditures
Branch Campuses2.2%
Plant Funds11.9% Main Campus
31.8%
UNM Hospital28.0%
Health Sciences Center (HSC)
26.0%
Revenue
Private2.5%
State Bonds1.7% Federal
Appropriations1.5%
Sales & Services38.2%
State Appropriatios-
Operating18.9%
Grants & Contracts
13.4%
Tuition & Fees6.7%
Other **6.5%
State Appropriations -
Capital0.6%Use of Balance
4.0%
Institutional Bonds0.2%
Local Government
Appropriations5.7%

2007 – 2008 UNM Fact Book - Page 8

Enrollment - Main Campus


2007 - 2008 UNM Fact Book - Page 9
Undergraduate Enrollment by ProgramMain Campus1 (Fall 2001 to Fall 2007)
2001 2002 2003 2004 2005 2006 2007Anderson School of Mgmt. 974 1,051 1,102 986 946 995 961Architecture & Planning 116 127 139 153 159 151 166Arts & Sciences 4,014 4,429 4,883 4,984 5,017 5,036 5,417Education 1,101 1,064 1,004 1,025 1,109 1,117 1,107Engineering 1,111 1,110 1,081 954 950 996 1,016Fine Arts 554 562 568 573 550 570 535Univ College/BUS 765 719 687 656 699 716 676Univ College/Undergrad Studies 6,897 7,237 7,546 8,123 8,407 8,080 7,731Assoc. & Cert. Programs 2 67 83 75 75 61 46 70
Sub-total 15,599 16,382 17,085 17,529 17,898 17,707 17,679
Nursing 286 281 308 336 329 299 384SOM/Dental Programs 56 55 46 49 47 50 50SOM/Misc. Allied Health 101 88 106 113 113 143 146
Health Sciences Sub-total 443 424 460 498 489 492 580
Total Undergraduate 16,042 16,806 17,545 18,027 18,387 18,199 18,259
1 Reported enrollments include all Extended Services enrollments.2 Branch Campus students in associate degree and certificate programs taking courses on the Main Campus.
Source: Fall 21-day enrollment files maintained by the Registrar's Office.
Main Campus Undergraduate Enrollment by Program

2007 - 2008 UNM Fact Book - Page 10
Graduate/Professional Enrollment by ProgramMain Campus1 (Fall 2001 to Fall 2007)
2001 2002 2003 2004 2005 2006 2007Architecture & Planning 195 200 212 189 198 205 208Arts & Sciences 1,359 1,384 1,437 1,476 1,488 1,478 1,411Education 1,159 1,099 1,290 1,476 1,283 1,233 1,194Engineering 559 676 735 693 611 578 583Fine Arts 181 177 174 168 175 193 186SOM/Medical Science 181 225 255 268 284 269 270Nursing 83 88 115 146 198 213 222Pharmacy 16 20 16 16 13 9 8Public Administration 154 160 154 129 142 140 146Univ College/Water Resources 35 41 46 49 46 44 41Misc Programs 4 20Graduate Studies Sub-total 3,922 4,070 4,434 4,610 4,438 4,366 4,289Anderson Grad. School of Mgmt. 430 481 511 474 466 469 466Law 339 333 319 344 361 344 344Medicine 302 304 303 298 292 306 304PharmD. 386 351 360 339 365 359 360Total Graduate/Professional 5,379 5,539 5,927 6,065 5,922 5,844 5,763
Undergraduate 16,042 16,806 17,545 18,027 18,387 18,199 18,259Graduate/Professional 5,379 5,539 5,927 6,065 5,922 5,844 5,763Non-Degree 2,438 2,360 2,321 2,247 1,971 1,774 1,727Grand Total 23,859 24,705 25,793 26,339 26,280 25,817 25,7491 Reported enrollments include all Extended Services enrollments.
Source: Fall 21-day enrollment files maintained by the Registrar's Office.
Main Campus Graduate/Professional Enrollment by Program
Total Main Campus Enrollment

2007 - 2008 UNM Fact Book - Page 11
On-Campus & Extended University1 EnrollmentMain Campus (Fall 2001 to Fall 2007)
2001 2002 2003 2004 2005 2006 2007Exclusively On-CampusUndergraduate 15,054 15,676 16,526 16,834 16,827 16,811 16,568Graduate/Professional 5,223 5,303 5,583 5,741 5,503 5,420 5,318Non-Degree 2,171 2,119 2,079 2,030 1,769 1,577 1,531
Total 22,448 23,098 24,188 24,605 24,099 23,808 23,417
On-Campus and Extended UniversityUndergraduate 741 879 768 923 1,263 838 993Graduate/Professional 79 146 149 111 184 188 188Non-Degree 41 47 51 50 43 23 17
Total 861 1,072 968 1,084 1,490 1,049 1,198
Exclusively Extended UniversityUndergraduate 247 251 251 270 297 550 698Graduate/Professional 77 90 195 213 235 236 257Non-Degree 226 194 191 167 159 174 179
Total 550 535 637 650 691 960 1,134
Undergraduate 16,042 16,806 17,545 18,027 18,387 18,199 18,259Graduate/Professional 5,379 5,539 5,927 6,065 5,922 5,844 5,763Non-Degree 2,438 2,360 2,321 2,247 1,971 1,774 1,727
Grand Total 23,859 24,705 25,793 26,339 26,280 25,817 25,749
Source: Enrollment and course files maintained by the Registrar's Office, and course records provided by Extended University.
Enrollment by Student Level and On-Campus and/or Extended University
Total Main Campus Enrollment
1 Extended University enrollment represents an unduplicated count of all students taking online courses, courses delivered through interactive television (ITV), and courses delivered live at off-campus sites in Farmington, Gallup, Kirtland Airforce Base, Los Alamos, Santa Fe, Taos, Rio Rancho (UNM West), and Valencia.
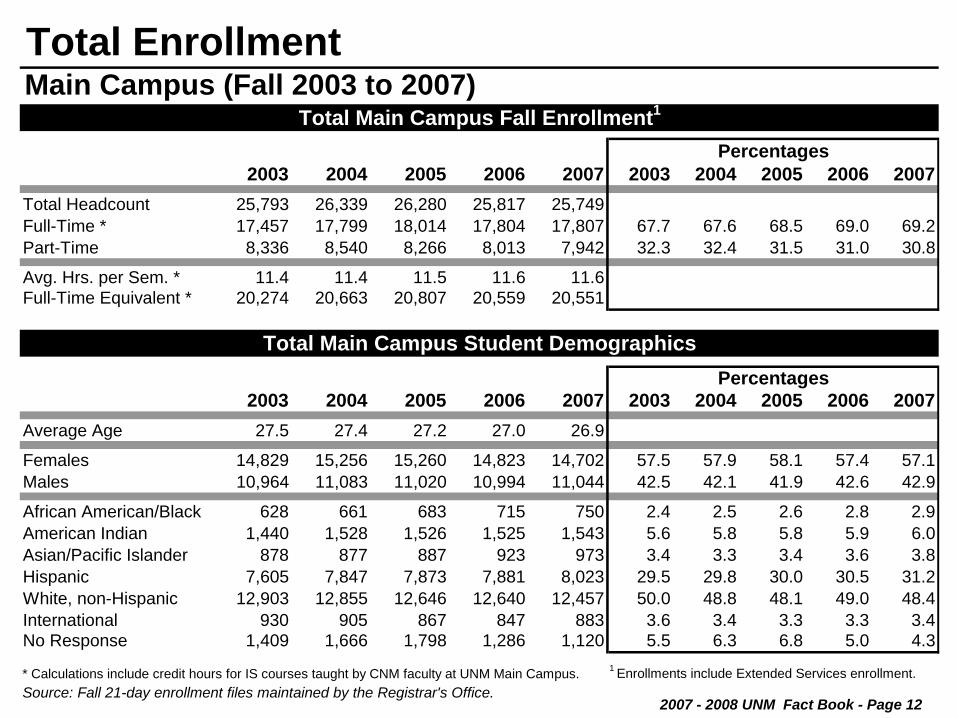
Total EnrollmentMain Campus (Fall 2003 to 2007)
2003 2004 2005 2006 2007 2003 2004 2005 2006 2007Total Headcount 25,793 26,339 26,280 25,817 25,749Full-Time * 17,457 17,799 18,014 17,804 17,807 67.7 67.6 68.5 69.0 69.2Part-Time 8,336 8,540 8,266 8,013 7,942 32.3 32.4 31.5 31.0 30.8
Avg. Hrs. per Sem. * 11.4 11.4 11.5 11.6 11.6Full-Time Equivalent * 20,274 20,663 20,807 20,559 20,551
2003 2004 2005 2006 2007 2003 2004 2005 2006 2007Average Age 27.5 27.4 27.2 27.0 26.9
Females 14,829 15,256 15,260 14,823 14,702 57.5 57.9 58.1 57.4 57.1Males 10,964 11,083 11,020 10,994 11,044 42.5 42.1 41.9 42.6 42.9
African American/Black 628 661 683 715 750 2.4 2.5 2.6 2.8 2.9American Indian 1,440 1,528 1,526 1,525 1,543 5.6 5.8 5.8 5.9 6.0Asian/Pacific Islander 878 877 887 923 973 3.4 3.3 3.4 3.6 3.8Hispanic 7,605 7,847 7,873 7,881 8,023 29.5 29.8 30.0 30.5 31.2White, non-Hispanic 12,903 12,855 12,646 12,640 12,457 50.0 48.8 48.1 49.0 48.4International 930 905 867 847 883 3.6 3.4 3.3 3.3 3.4No Response 1,409 1,666 1,798 1,286 1,120 5.5 6.3 6.8 5.0 4.3
* Calculations include credit hours for IS courses taught by CNM faculty at UNM Main Campus. 1 Enrollments include Extended Services enrollment.Source: Fall 21-day enrollment files maintained by the Registrar's Office.
Total Main Campus Fall Enrollment1
Percentages
Total Main Campus Student DemographicsPercentages
2007 - 2008 UNM Fact Book - Page 12

2007 - 2008 UNM Fact Book - Page 13
Undergraduate StudentsMain Campus1 (Fall 2003 to 2007)
2003 2004 2005 2006 2007 2003 2004 2005 2006 2007Total Headcount 17,545 18,027 18,387 18,199 18,259Full-Time * 14,050 14,420 14,758 14,574 14,575 80.1 80.0 80.3 80.1 79.8Part-Time 3,495 3,607 3,629 3,625 3,684 19.9 20.0 19.7 19.9 20.2
Avg. Hrs. per Sem. * 13.0 13.0 13.0 13.0 13.0Full-Time Equivalent * 15,236 15,601 15,945 15,804 15,822
2003 2004 2005 2006 2007 2003 2004 2005 2006 2007Average Age 24.2 24.1 24.0 23.8 23.9
Females 10,098 10,429 10,730 10,459 10,407 57.6 57.9 58.4 57.5 57.0Males 7,447 7,598 7,657 7,740 7,852 42.4 42.1 41.6 42.5 43.0
African American/Black 481 524 554 566 584 2.7 2.9 3.0 3.1 3.2American Indian 1,128 1,183 1,192 1,189 1,207 6.4 6.6 6.5 6.5 6.6Asian/Pacific Islander 574 592 630 682 711 3.3 3.3 3.4 3.7 3.9Hispanic 6,032 6,258 6,354 6,361 6,471 34.4 34.7 34.6 35.0 35.4White, non-Hispanic 8,274 8,269 8,417 8,387 8,361 47.2 45.9 45.8 46.1 45.8International 129 109 127 149 159 0.7 0.6 0.7 0.8 0.9No Response 927 1,092 1,113 865 766 5.3 6.1 6.1 4.8 4.2* Calculations include credit hours for IS courses taught by CNM faculty at UNM Main Campus. 1 Enrollments include Extended Services enrollment.Source: Fall 21-day enrollment files maintained by the Registrar's Office.
Undergraduate Fall Enrollment
Percentages
Undergraduate Student DemographicsPercentages

2007 - 2008 UNM Fact Book - Page 14
Graduate Studies1 StudentsMain Campus2 (Fall 2003 to 2007)
2003 2004 2005 2006 2007 2003 2004 2005 2006 2007Total Headcount 4,434 4,610 4,438 4,366 4,289Full-Time 2,108 2,130 1,997 1,926 1,949 47.5 46.2 45.0 44.1 45.4Part-Time 2,326 2,480 2,441 2,440 2,340 52.5 53.8 55.0 55.9 54.6
Avg. Hrs. per Sem. 7.8 7.7 7.6 7.5 7.5Full-Time Equivalent 2,873 2,961 2,811 2,732 2,682
2003 2004 2005 2006 2007 2003 2004 2005 2006 2007Average Age 34.2 34.5 34.8 34.8 34.8
Females 2,557 2,712 2,600 2,513 2,473 57.7 58.8 58.6 57.6 57.7Males 1,877 1,898 1,838 1,853 1,816 42.3 41.2 41.4 42.4 42.3
African American/Black 77 82 70 81 92 1.7 1.8 1.6 1.9 2.1American Indian 156 169 179 194 199 3.5 3.7 4.0 4.4 4.6Asian/Pacific Islander 101 112 101 108 110 2.3 2.4 2.3 2.5 2.6Hispanic 770 773 776 775 787 17.4 16.8 17.5 17.8 18.3White, non-Hispanic 2,475 2,564 2,307 2,430 2,350 55.8 55.6 52.0 55.7 54.8International 654 639 601 554 556 14.7 13.9 13.5 12.7 13.0No Response 201 271 404 224 195 4.5 5.9 9.1 5.1 4.51 See page titled "Graduate/Professional Enrollment by Program" for list of graduate programs included.2 Enrollments include Extended Services enrollment.
Source: Fall 21-day enrollment files maintained by the Registrar's Office.
Graduate Studies Fall EnrollmentPercentages
Graduate Studies Student DemographicsPercentages
2007 - 2008 UNM Fact Book - Page 15
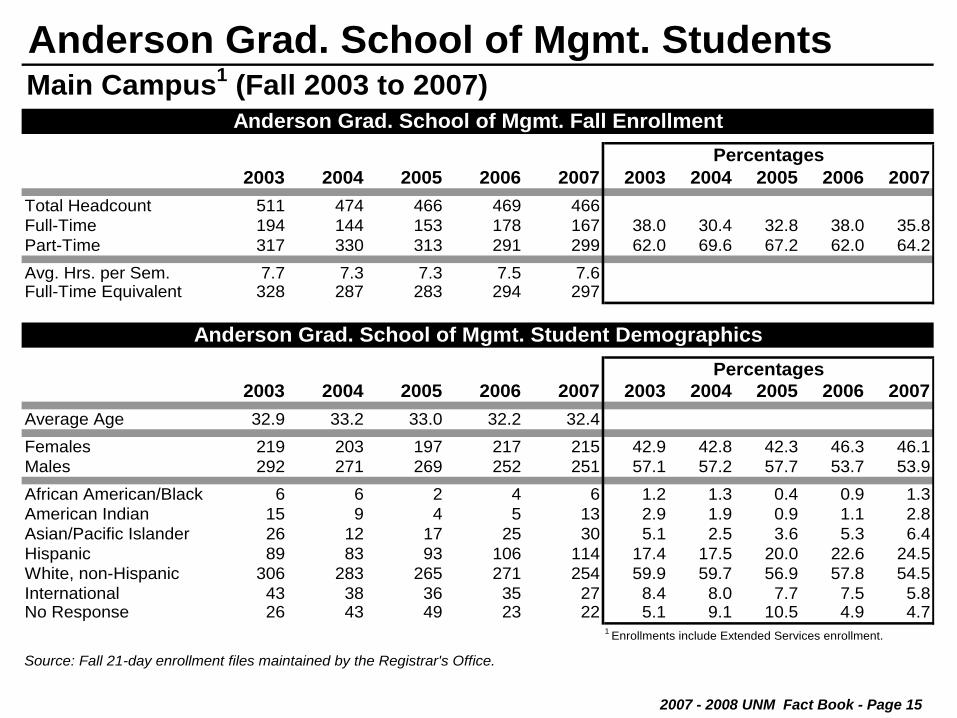
Anderson Grad. School of Mgmt. StudentsMain Campus1 (Fall 2003 to 2007)
2003 2004 2005 2006 2007 2003 2004 2005 2006 2007Total Headcount 511 474 466 469 466Full-Time 194 144 153 178 167 38.0 30.4 32.8 38.0 35.8Part-Time 317 330 313 291 299 62.0 69.6 67.2 62.0 64.2Avg. Hrs. per Sem. 7.7 7.3 7.3 7.5 7.6Full-Time Equivalent 328 287 283 294 297
2003 2004 2005 2006 2007 2003 2004 2005 2006 2007Average Age 32.9 33.2 33.0 32.2 32.4Females 219 203 197 217 215 42.9 42.8 42.3 46.3 46.1Males 292 271 269 252 251 57.1 57.2 57.7 53.7 53.9African American/Black 6 6 2 4 6 1.2 1.3 0.4 0.9 1.3American Indian 15 9 4 5 13 2.9 1.9 0.9 1.1 2.8Asian/Pacific Islander 26 12 17 25 30 5.1 2.5 3.6 5.3 6.4Hispanic 89 83 93 106 114 17.4 17.5 20.0 22.6 24.5White, non-Hispanic 306 283 265 271 254 59.9 59.7 56.9 57.8 54.5International 43 38 36 35 27 8.4 8.0 7.7 7.5 5.8No Response 26 43 49 23 22 5.1 9.1 10.5 4.9 4.7
1 Enrollments include Extended Services enrollment.
Source: Fall 21-day enrollment files maintained by the Registrar's Office.
Anderson Grad. School of Mgmt. Fall EnrollmentPercentages
Anderson Grad. School of Mgmt. Student DemographicsPercentages

2007 - 2008 UNM Fact Book - Page 16
Law StudentsMain Campus (Fall 2003 to 2007)
2003 2004 2005 2006 2007 2003 2004 2005 2006 2007Total Headcount 319 344 361 344 344Full-Time 313 338 353 338 338 98.1 98.3 97.8 98.3 98.3Part-Time 6 6 8 6 6 1.9 1.7 2.2 1.7 1.7Avg. Hrs. per Sem. 14.3 14.3 14.4 14.5 14.4Full-Time Equivalent 380 409 432 416 414
2003 2004 2005 2006 2007 2003 2004 2005 2006 2007Average Age 29.9 29.6 29.5 29.9 29.8
Females 189 191 181 172 173 59.2 55.5 50.1 50.0 50.3Males 130 153 180 172 171 40.8 44.5 49.9 50.0 49.7
African American/Black 6 10 13 12 10 1.9 2.9 3.6 3.5 2.9American Indian 26 34 36 33 29 8.2 9.9 10.0 9.6 8.4Asian/Pacific Islander 4 7 7 9 6 1.3 2.0 1.9 2.6 1.7Hispanic 72 76 88 93 106 22.6 22.1 24.4 27.0 30.8White, non-Hispanic 197 205 183 162 162 61.8 59.6 50.7 47.1 47.1International 2 2 1 2 0 0.6 0.6 0.3 0.6 0.0No Response 12 10 33 33 31 3.8 2.9 9.1 9.6 9.0
Source: Fall 21-day enrollment files maintained by the Registrar's Office.
Law Fall Enrollment
Percentages
Law Student DemographicsPercentages

2007 - 2008 UNM Fact Book - Page 17
Medical StudentsMain Campus (Fall 2003 to 2007)
2003 2004 2005 2006 2007 2003 2004 2005 2006 2007Total Headcount 303 298 292 306 304Full-Time 303 298 292 306 304 100.0 100.0 100.0 100.0 100.0Part-Time 0 0 0 0 0 0.0 0.0 0.0 0.0 0.0
Avg. Hrs. per Sem. 20.9 20.4 19.4 20.4 18.4Full-Time Equivalent 303 298 292 306 304
2003 2004 2005 2006 2007 2003 2004 2005 2006 2007Average Age 28.5 28.5 28.4 28.3 27.7
Females 175 181 172 166 162 57.8 60.7 58.9 54.2 53.5Males 128 117 120 140 141 42.2 39.3 41.1 45.8 46.5
African American/Black 2 3 3 5 5 0.7 1.0 1.0 1.6 1.6American Indian 11 12 9 10 11 3.6 4.0 3.1 3.3 3.6Asian/Pacific Islander 20 22 19 19 21 6.6 7.4 6.5 6.2 6.9Hispanic 76 78 81 78 78 25.1 26.2 27.7 25.5 25.7White, non-Hispanic 181 174 173 183 176 59.7 58.4 59.2 59.8 57.9International 0 0 1 1 1 0.0 0.0 0.3 0.3 0.3No Response 13 9 6 10 12 4.3 3.0 2.1 3.3 3.9
Source: Fall 21-day enrollment files maintained by the Registrar's Office.
Medical Fall Enrollment
Percentages
Medical Student DemographicsPercentages

2007 - 2008 UNM Fact Book - Page 18
PharmD. StudentsMain Campus (Fall 2003 to 2007)
2003 2004 2005 2006 2007 2003 2004 2005 2006 2007Total Headcount 360 339 365 359 360Full-Time 318 311 326 338 335 88.3 91.7 89.3 94.2 93.1Part-Time 42 28 39 21 25 11.7 8.3 10.7 5.8 6.9Avg. Hrs. per Sem. 13.4 13.7 13.3 14.7 15.5Full-Time Equivalent 402 388 406 438 464
2003 2004 2005 2006 2007 2003 2004 2005 2006 2007Average Age 30.1 28.7 29.1 28.2 28.2Females 214 205 222 235 222 59.4 60.5 60.8 65.5 61.7Males 146 134 143 124 138 40.6 39.5 39.2 34.5 38.3African American/Black 5 4 4 8 9 1.4 1.2 1.1 2.2 2.5American Indian 16 15 19 19 20 4.4 4.4 5.2 5.3 5.6Asian/Pacific Islander 82 64 45 36 41 22.8 18.9 12.3 10.0 11.4Hispanic 107 104 109 112 106 29.7 30.7 29.9 31.2 29.4White, non-Hispanic 135 137 165 165 169 37.5 40.4 45.2 46.0 46.9International 3 3 2 2 1 0.8 0.9 0.5 0.6 0.3No Response 12 12 21 17 14 3.3 3.5 5.8 4.7 3.9
Source: Fall 21-day enrollment files maintained by the Registrar's Office.
PharmD. Fall Enrollment
Percentages
PharmD. Student Demographics*Percentages
2007 - 2008 UNM Fact Book - Page 19
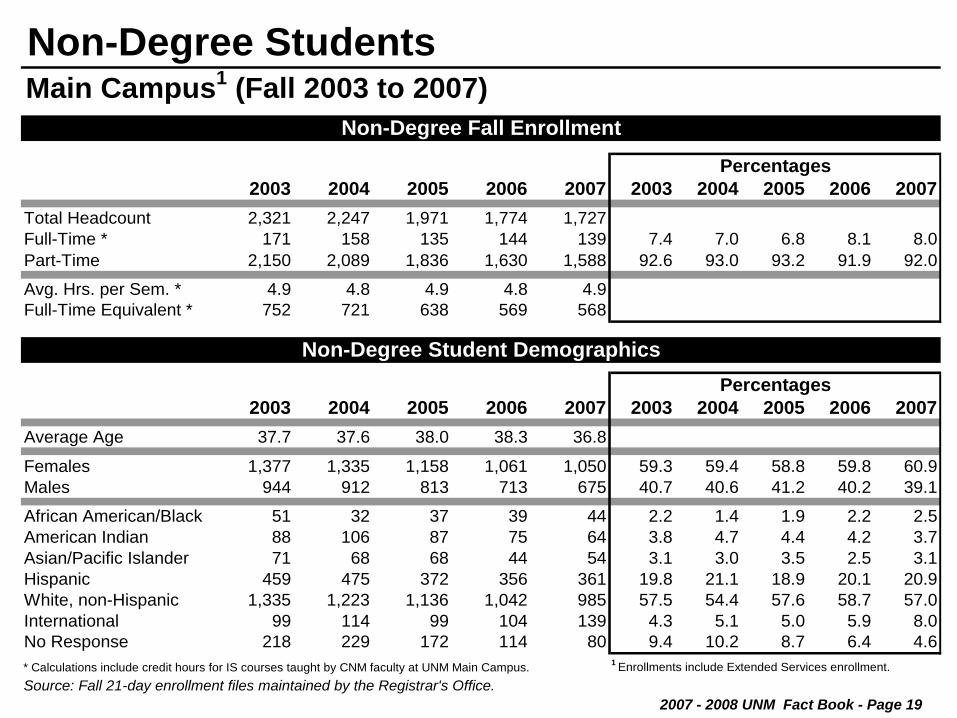
Non-Degree StudentsMain Campus1 (Fall 2003 to 2007)
2003 2004 2005 2006 2007 2003 2004 2005 2006 2007Total Headcount 2,321 2,247 1,971 1,774 1,727Full-Time * 171 158 135 144 139 7.4 7.0 6.8 8.1 8.0Part-Time 2,150 2,089 1,836 1,630 1,588 92.6 93.0 93.2 91.9 92.0
Avg. Hrs. per Sem. * 4.9 4.8 4.9 4.8 4.9Full-Time Equivalent * 752 721 638 569 568
2003 2004 2005 2006 2007 2003 2004 2005 2006 2007Average Age 37.7 37.6 38.0 38.3 36.8
Females 1,377 1,335 1,158 1,061 1,050 59.3 59.4 58.8 59.8 60.9Males 944 912 813 713 675 40.7 40.6 41.2 40.2 39.1
African American/Black 51 32 37 39 44 2.2 1.4 1.9 2.2 2.5American Indian 88 106 87 75 64 3.8 4.7 4.4 4.2 3.7Asian/Pacific Islander 71 68 68 44 54 3.1 3.0 3.5 2.5 3.1Hispanic 459 475 372 356 361 19.8 21.1 18.9 20.1 20.9White, non-Hispanic 1,335 1,223 1,136 1,042 985 57.5 54.4 57.6 58.7 57.0International 99 114 99 104 139 4.3 5.1 5.0 5.9 8.0No Response 218 229 172 114 80 9.4 10.2 8.7 6.4 4.6* Calculations include credit hours for IS courses taught by CNM faculty at UNM Main Campus. 1 Enrollments include Extended Services enrollment.Source: Fall 21-day enrollment files maintained by the Registrar's Office.
Non-Degree Fall Enrollment
Percentages
Non-Degree Student DemographicsPercentages

Student Credit Hours by Course LevelMain Campus (Fall 2001 to Fall 2007)*
Level 2001 2002 2003 2004 2005 2006 2007
Developmental 3,122 3,486 3,528 3,591 3,717 4,095 3,687Freshman 96,588 102,295 108,368 110,157 111,431 111,041 109,351Sophomore 35,322 36,871 39,220 42,441 41,860 41,306 42,584Junior 52,584 55,231 56,976 56,271 58,394 56,096 56,275Senior 29,939 29,853 31,520 31,805 33,338 32,628 33,028Grad/Prof 51,058 51,506 54,402 55,156 52,886 53,273 52,851Total 268,613 279,242 294,014 299,421 301,626 298,439 297,776
Developmental = "IS 100" courses taught on Junior = 300 level courses campus by CNM, administered by UNM. Senior = 400 level coursesFreshman = 100 level courses Grad/Prof = 500 and 600 level coursesSophomore = 200 level courses and professional courses in
Medicine, Law, and Pharmacy.
* Includes Health Sciences Center and Extended University credit hours.
Source: 21-Day Course Census Files, Office of Institutional Research
Student Credit Hours by Course Level
Student Credit Hours by Course LevelFall Semesters 2001-2007
0
50,000
100,000
150,000
200,000
250,000
300,000
350,000
2001
2002
2003
2004
2005
2006
2007
Tota
l Cre
dit H
ours Grad/Prof
SeniorJuniorSophomoreFreshmanDevelopmental
2007 - 2008 UNM Fact Book - Page 20

2007 - 2008 UNM Fact Book - Page 21
Student Credit Hrs. by College & Course LevelMain Campus (Fall 2001 to Fall 2007)1
Level 2001 2002 2003 2004 2005 2006 2007 Level 2001 2002 2003 2004 2005 2006 2007
Freshman 77,855 81,835 86,386 88,808 89,444 89,636 87,674 Freshman 5,017 5,203 5,312 5,605 5,602 5,672 6,071Sophomore 23,749 24,850 26,610 29,513 30,274 30,210 30,666 Sophomore 1,814 1,873 1,945 2,321 2,263 2,416 2,422Junior 26,665 28,174 29,450 30,215 35,538 30,282 31,613 Junior 5,913 5,939 6,885 6,306 6,267 5,942 5,647Senior 10,338 9,560 10,915 11,193 10,993 12,829 12,589 Senior 6,750 6,833 6,844 6,810 7,589 7,443 7,462Graduate 10,766 10,861 11,217 12,093 11,850 11,918 11,301 Graduate 8,961 8,501 9,937 10,499 8,848 8,159 8,002Subtotal 149,373 155,280 164,578 171,822 178,099 174,875 173,843 Subtotal 28,455 28,349 30,923 31,541 30,569 29,632 29,604
Level 2001 2002 2003 2004 2005 2006 2007 Level 2001 2002 2003 2004 2005 2006 2007
Freshman 2,816 2,807 2,580 2,377 2,146 2,198 2,081 Freshman 9,028 9,656 10,768 9,968 10,217 9,974 9,850Sophomore 1,858 1,874 1,831 1,637 1,412 1,280 1,536 Sophomore 3,910 3,970 4,112 4,291 4,508 4,117 4,220Junior 3,500 3,919 3,683 3,456 3,106 3,190 3,461 Junior 3,215 3,415 2,944 2,687 2,819 2,926 2,759Senior 2,813 2,859 2,922 2,689 2,388 2,202 2,051 Senior 1,956 2,039 2,281 2,368 2,377 2,422 2,406Graduate 4,076 4,766 5,068 4,704 4,020 4,026 4,328 Graduate 1,373 1,349 1,292 1,361 1,291 1,414 1,411Subtotal 15,063 16,225 16,084 14,863 13,072 12,896 13,457 Subtotal 19,482 20,429 21,397 20,675 21,212 20,853 20,646
Level 2001 2002 2003 2004 2005 2006 2007 Level 2001 2002 2003 2004 2005 2006 2007
Freshman 258 177 315 267 333 342 348 FreshmanSophomore 1,731 1,872 1,929 1,923 1,095 735 1,131 SophomoreJunior 8,909 9,387 9,245 8,318 8,649 8,520 8,022 JuniorSenior 3,795 4,002 4,022 3,746 3,387 3,486 3,910 Senior Graduate 4,084 4,416 4,525 4,098 4,022 4,009 4,132 Graduate 899 891 850 670 832 833 819Subtotal 18,777 19,854 20,036 18,352 17,486 17,092 17,543 Subtotal 899 891 850 670 832 833 8191 Credit hours in ROTC programs, which are included in the totals on the previous page, are not separately reported in this table.
Source: 21-Day Course Census Files, Office of Institutional Research
The Robert O. Anderson Schools of Management Public Administration
College of Arts and Sciences College of Education
School of Engineering College of Fine Arts

Student Credit Hrs. by College & Course LevelMain Campus (Fall 2001 to Fall 2007)
Level 2001 2002 2003 2004 2005 2006 2007 Level 2001 2002 2003 2004 2005 2006 2007
Develop.1 3,122 3,486 3,528 3,591 3,717 4,095 3,687Freshman 480 690 1,002 1,089 1,068 1,095 1,215 Freshman 780 1,507 1,567 1,651 1,993 1,558 1,596Sophomore 711 726 723 660 666 672 711 Sophomore 655 436 607 480 650 607 605Junior 597 793 734 843 711 732 795 Junior 1,271 875 912 1,120 1,067 916 1,118Senior 600 654 577 768 762 530 548 Senior 423 405 414 477 495 675 450Graduate 1,636 1,792 2,156 1,900 1,906 2,029 2,036 Graduate 123 130 144 184 154 114 83Subtotal 4,024 4,655 5,192 5,260 5,113 5,058 5,305 Subtotal 6,374 6,839 7,172 7,503 8,076 7,965 7,539
Level 2001 2002 2003 2004 2005 2006 2007 Level 2001 2002 2003 2004 2005 2006 2007
Freshman FreshmanSophomore Sophomore Junior Junior Senior Senior 12 12 17Professional 4,852 4,789 4,522 4,870 5,124 4,990 4,922 Grad/Prof 4,905 4,224 4,503 4,399 4,641 5,271 5,601Subtotal 4,852 4,789 4,522 4,870 5,124 4,990 4,922 Subtotal 4,905 4,236 4,515 4,399 4,641 5,288 5,601
Level 2001 2002 2003 2004 2005 2006 2007 Level 2001 2002 2003 2004 2005 2006 2007
Freshman Freshman 253 328 293 242 289 375 386Sophomore 633 1,002 1,259 1,371 672 1,060 850 Sophomore 228 219 104 155 161 116 330Junior 1,466 1,350 1,718 1,829 1,861 1,897 1,507 Junior 882 1138 1,266 1,353 1,269 1,563 1,172Senior 1,475 1,760 1,707 2,009 3,444 2,026 2,586 Senior 1,629 1,597 1,665 1,650 1,720 876 933Graduate 908 908 1,151 1,277 1,427 1,421 1,333 Grad/Prof 8,471 8,874 9,033 9,097 8,767 9,091 8,806Subtotal 4,482 5,020 5,835 6,486 7,404 6,404 6,276 Subtotal 11,463 12,156 12,361 12,497 12,206 12,021 11,6271 Developmental courses, Introductory Studies 100, are offered by contract with CNM and are administered by University College.
Source: 21-Day Course Census Files, Office of Institutional Research
College of Nursing School of Medicine
School of Architecture and Planning University College
School of Law College of Pharmacy
2007 - 2008 UNM Fact Book - Page 22

2007 - 2008 UNM Fact Book - Page 23
Enrollment by Age, Fall 2003-2007First-Time Freshmen & Undergraduates, Main Campus
Age 2003 2004 2005 2006 2007 2003 2004 2005 2006 2007Under 18 182 176 182 189 159 201 186 198 208 18418 2,575 2,689 2,687 2,570 2,532 2,738 2,882 2,862 2,757 2,71819 200 179 190 219 174 2,452 2,502 2,634 2,579 2,52120 15 17 16 18 18 2,166 2,363 2,419 2,480 2,40021 9 8 8 10 7 2,106 2,134 2,303 2,284 2,40622 6 5 5 8 6 1,768 1,745 1,769 1,868 1,91923 3 2 1 2 3 1,059 1,052 1,062 1,088 1,12624 6 2 1 3 3 697 769 718 727 72925 3 1 - 2 1 507 548 596 558 54726 2 4 - - 1 410 435 415 477 45727 1 - - - - 356 343 356 334 35128 - - 1 2 1 304 310 336 302 29229 - - - - 2 237 259 286 258 27430-39 2 2 - 3 2 1,449 1,431 1,418 1,369 1,39040-49 - 1 - - 1 776 729 683 611 61550-64 - - - - - 301 321 312 274 305Over 64 - - - - - 18 17 19 25 25Unavailable - - - - - - 1 1 - -
Total 3,004 3,086 3,091 3,026 2,910 17,545 18,027 18,387 18,199 18,259<= 24 years 99.7% 99.7% 100.0% 99.8% 99.7% 75.2% 75.6% 76.0% 76.9% 76.7%25-29 years 0.2% 0.2% 0.0% 0.1% 0.2% 10.3% 10.5% 10.8% 10.6% 10.5%30-39 years 0.1% 0.1% 0.0% 0.1% 0.1% 8.3% 7.9% 7.7% 7.5% 7.6%40+ years 0.0% 0.0% 0.0% 0.0% 0.0% 6.2% 5.9% 5.5% 5.0% 5.2%Median Age 18.5 18.5 18.5 18.5 18.5 21.6 21.5 21.5 21.5 21.5Mean Age 18.6 18.6 18.5 18.6 18.6 24.2 24.1 24.0 23.8 23.9* Includes first-time freshmen.
Source: Fall 21-day enrollment files maintained by the Registrar's Office.
First-Time Freshmen Undergraduates *

2007 – 2008 UNM Fact Book - Page 24
Enrollment by Age, Fall 2003-2007Graduate/AGSM Students & Professional Students*, Main Campus
Age 2003 2004 2005 2006 2007 2003 2004 2005 2006 2007Under 18 - - - - - - - - - -18 1 - - - - - - 1 - 219 - 1 - - - 1 - 3 2 -20 3 - 2 - 3 10 9 4 7 1321 30 23 15 18 13 26 37 30 24 2322 145 109 97 110 122 53 57 60 81 6023 290 282 218 223 199 93 98 97 97 11824 314 344 326 278 291 108 116 123 110 11025 321 318 347 345 305 105 110 114 110 11226 320 320 299 325 332 75 94 105 106 10327 273 319 290 292 297 75 54 75 81 8728 290 256 283 274 271 63 60 49 57 5429 251 287 233 249 236 48 49 48 34 4230-39 1,466 1,483 1,486 1,459 1,474 235 219 235 231 21440-49 782 841 775 753 701 64 59 50 54 5350-64 445 484 518 494 499 26 19 24 15 16Over 64 14 17 15 14 12 - - - - -Unavailable - - - 1 - - - - - 1
Total 4,945 5,084 4,904 4,835 4,755 982 981 1,018 1,009 1,008<= 24 years 15.8% 14.9% 13.4% 13.0% 13.2% 29.6% 32.3% 31.2% 31.8% 32.3%25-29 years 29.4% 29.5% 29.6% 30.7% 30.3% 37.3% 37.4% 38.4% 38.5% 39.5%30-39 years 29.6% 29.2% 30.3% 30.2% 31.0% 23.9% 22.3% 23.1% 22.9% 21.2%40+ years 25.1% 26.4% 26.7% 26.1% 25.5% 9.2% 8.0% 7.3% 6.8% 6.8%Median Age 31.1 31.3 31.4 31.5 31.4 27.3 26.7 26.7 26.8 26.7Mean Age 34.1 34.4 34.7 34.6 34.6 29.5 29.0 29.0 28.8 28.6
* Professional students include those in Law, Medicine, and PharmD.
Source: Fall 21-day enrollment files maintained by the Registrar's Office.
Graduate & AGSM Students Professional Students*

2007 - 2008 UNM Fact Book - Page 25
Enrollment by Age, Fall 2003-2007Non-Degree and Total, Main Campus
Age 2003 2004 2005 2006 2007 2003 2004 2005 2006 2007Under 18 36 42 33 26 30 237 228 231 234 214 18 6 4 4 5 3 2,745 2,886 2,867 2,762 2,723 19 23 13 20 21 16 2,476 2,516 2,657 2,602 2,537 20 40 46 41 33 40 2,219 2,418 2,466 2,520 2,456 21 46 57 34 47 37 2,208 2,251 2,382 2,373 2,479 22 86 80 72 57 87 2,052 1,991 1,998 2,116 2,188 23 121 133 113 84 103 1,563 1,565 1,490 1,492 1,546 24 112 126 117 99 91 1,231 1,355 1,284 1,214 1,221 25 101 79 88 64 98 1,034 1,055 1,145 1,077 1,062 26 102 97 84 69 77 907 946 903 977 969 27 64 61 64 73 60 768 777 785 780 795 28 66 59 55 69 59 723 685 723 702 676 29 79 67 47 51 52 615 662 614 592 604 30-39 531 514 430 380 402 3,681 3,647 3,569 3,439 3,480 40-49 455 423 350 295 229 2,077 2,052 1,858 1,713 1,598 50-64 335 345 294 280 243 1,107 1,169 1,148 1,063 1,063 Over 64 118 101 125 121 100 150 135 159 160 137 Unavailable - - - - - - 1 1 1 1
Total 2,321 2,247 1,971 1,774 1,727 25,793 26,339 26,280 25,817 25,749
<= 24 years 20.2% 22.3% 22.0% 21.0% 23.6% 57.1% 57.7% 58.5% 59.3% 59.7%25-29 years 17.8% 16.2% 17.1% 18.4% 20.0% 15.7% 15.7% 15.9% 16.0% 15.9%30-39 years 22.9% 22.9% 21.8% 21.4% 23.3% 14.3% 13.8% 13.6% 13.3% 13.5%40+ years 39.1% 38.7% 39.0% 39.2% 33.1% 12.9% 12.7% 12.0% 11.4% 10.9%Median Age 34.3 34.2 34.3 34.3 32.5 23.6 23.6 23.4 23.2 23.2Mean Age 37.7 37.6 38.0 38.3 36.8 27.5 27.4 27.2 27.0 26.9
Source: Fall 21-day enrollment files maintained by the Registrar's Office.
Non-Degree Total Main Campus

2007 - 2008 UNM Fact Book - Page 26

Enrollment - Branch Campuses


2007 - 2008 UNM Fact Book - Page 27
Branch Campus EnrollmentBy Campus and Degree Status (Fall 2001 to Fall 2007)
2001 2002 2003 2004 2005 2006 2007Gallup Branch CampusUndergraduate 1,687 2,004 2,148 2,260 2,101 2,319 2,026Non-Degree 828 854 812 854 773 429 662Total 2,515 2,858 2,960 3,114 2,874 2,748 2,688
Los Alamos Branch CampusUndergraduate 519 569 598 587 524 518 414Non-Degree 364 321 361 358 256 275 234Total 883 890 959 945 780 793 648
Taos Branch CampusUndergraduate 587 690 655 619 594 751 561Non-Degree 644 942 601 502 713 602 633Total 1,231 1,632 1,256 1,121 1,307 1,353 1,194
Valencia Branch CampusUndergraduate 1,269 1,348 1,360 1,422 1,335 1,534 1,428Non-Degree 291 362 368 323 339 102 379Total 1,560 1,710 1,728 1,745 1,674 1,636 1,807
Undergraduate 4,062 4,611 4,761 4,888 4,554 5,122 4,429Non-Degree 2,127 2,479 2,142 2,037 2,081 1,408 1,908Grand Total 6,189 7,090 6,903 6,925 6,635 6,530 6,337Source: Fall 21-day enrollment files maintained by the Registrar's Office.
Enrollment by Degree-Seeking and Non-Degree Status
Total Branch Campus Enrollment

2007 - 2008 UNM Fact Book - Page 28
Enrollment, Fall 2003-2007Gallup Branch Campus
2003 2004 2005 2006 2007 2003 2004 2005 2006 2007Total Headcount 2,960 3,114 2,874 2,748 2,688Full-Time 1,055 1,088 1,117 1,111 1,118 35.6 34.9 38.9 40.4 41.6Part-Time 1,905 2,026 1,757 1,637 1,570 64.4 65.1 61.1 59.6 58.4
Avg. Hrs. per Sem. 8.2 8.2 8.6 8.9 8.9Full-Time Equivalent 1,608 1,694 1,652 1,630 1,601
2003 2004 2005 2006 2007 2003 2004 2005 2006 2007Average Age 30.3 30.3 29.7 29.2 28.3
Females 1,960 2,046 1,948 1,860 1,784 66.2 65.7 67.8 67.7 66.4Males 1,000 1,068 926 888 903 33.8 34.3 32.2 32.3 33.6
African American/Black 15 14 17 13 13 0.5 0.4 0.6 0.5 0.5American Indian 2,280 2,456 2,223 2,117 2,076 77.0 78.9 77.3 77.0 77.2Asian/Pacific Islander 11 13 23 27 24 0.4 0.4 0.8 1.0 0.9Hispanic 295 274 264 258 267 10.0 8.8 9.2 9.4 9.9White, non-Hispanic 308 311 307 268 250 10.4 10.0 10.7 9.8 9.3International 1 5 11 21 19 0.0 0.2 0.4 0.8 0.7No Response 50 41 29 44 39 1.7 1.3 1.0 1.6 1.5
Source: Fall 21-day enrollment files maintained by the Registrar's Office.
Students Enrolled in Credit Courses Percentages
Student DemographicsPercentages

2007 - 2008 UNM Fact Book - Page 29
Community Outreach ProgramsGallup Branch Campus, 2002-2003 to 2006-2007
02-03 03-04 04-05 05-06 06-07 02-03 03-04 04-05 05-06 06-07
Number of Students 672 785 832 807 580
Female 379 408 436 404 326 56.4 52.0 52.4 50.1 56.2Male 293 377 396 403 254 43.6 48.0 47.6 49.9 43.8
African American/Black 3 3 3 3 7 0.4 0.4 0.4 0.4 1.2American Indian 561 657 714 711 480 83.5 83.7 85.8 88.1 82.8Asian/Pacific Islander 2 6 7 4 3 0.3 0.8 0.8 0.5 0.5Hispanic 85 91 91 73 61 12.6 11.6 10.9 9.0 10.5White, non-Hispanic 21 28 17 16 29 3.1 3.6 2.0 2.0 5.0No Response 0 0 0 0 0 0.0 0.0 0.0 0.0 0.0
Program 02-03 03-04 04-05 05-06 06-07
Non-Credit Community Education 137 193 218 321 287Customized/Specialized Training 462 332 679 728 743Small Business Development Center 671 556 830 605 758
Source: Gallup Branch Campus, Office of the Director
Adult Basic Education (ABE)
Other Non-Credit Community Outreach Programs
Number of Students Completing Objectives and/or 12+ Hours of Instruction*
Number of Students/Clients Served
PercentageNumber
Adult Basic Education (ABE) programs provide adults with the opportunity to acquire and improve basic reading, writing, and math skills, as well as English as a second language skills, citizenship skills, employability skills, and General Educatoin Diploma (GED) preparation.
*These figures only reflect the number of students completing 12+ hrs. of ABE instruction and/or completing their educational objectives during the annual reporting period, as reported to the State of New Mexico for funding purposes. The State does not currently fund instructional and support services for other ABE students.

2007 - 2008 UNM Fact Book - Page 30
Enrollment, Fall 2003-2007Los Alamos Branch Campus
2003 2004 2005 2006 2007 2003 2004 2005 2006 2007Total Headcount 959 945 780 793 648Full-Time 255 235 217 191 155 26.6 24.9 27.8 24.1 23.9Part-Time 704 710 563 602 493 73.4 75.1 72.2 75.9 76.1
Avg. Hrs. per Sem. 7.3 7.0 7.5 7.0 6.8Full-Time Equivalent 465 440 391 371 295
2003 2004 2005 2006 2007 2003 2004 2005 2006 2007Average Age 31.8 32.6 31.7 32.7 32.5
Females 573 573 465 493 407 59.7 60.6 59.6 62.2 62.8Males 386 372 315 300 241 40.3 39.4 40.4 37.8 37.2
African American/Black 8 3 2 3 2 0.8 0.3 0.3 0.4 0.3American Indian 49 51 53 54 30 5.1 5.4 6.8 6.8 4.6Asian/Pacific Islander 21 25 23 22 23 2.2 2.6 2.9 2.8 3.5Hispanic 358 380 320 302 246 37.3 40.2 41.0 38.1 38.0White, non-Hispanic 447 420 335 362 306 46.6 44.4 42.9 45.6 47.2International 14 12 10 10 11 1.5 1.3 1.3 1.3 1.7No Response 62 54 37 40 30 6.5 5.7 4.7 5.0 4.6
Source: Fall 21-day enrollment files maintained by the Registrar's Office.
Students Enrolled in Credit Courses
Percentages
Student DemographicsPercentages

2007 - 2008 UNM Fact Book - Page 31
Community Outreach ProgramsLos Alamos Branch Campus, 2002-2003 to 2006-2007
02-03 03-04 04-05 05-06 06-07 02-03 03-04 04-05 05-06 06-07
Number of Students 270 320 276 258 273
Female 165 201 189 171 182 61.1 62.8 68.5 66.3 68.5Male 105 119 87 87 91 38.9 37.2 31.5 33.7 31.5
African American/Black 6 7 0 2 0 2.2 2.2 0.0 0.8 0.0American Indian 11 4 9 11 12 4.1 1.3 3.3 4.3 4.4Asian/Pacific Islander 24 37 35 31 19 8.9 11.6 12.7 12.0 7.0Hispanic 154 207 184 142 179 57.0 64.7 66.7 55.0 65.6White, non-Hispanic 73 65 46 72 63 27.0 20.3 16.7 27.9 23.1No Response 2 0 2 0 0 0.7 0.0 0.7 0.0 0.0
Program 02-03 03-04 04-05 05-06 06-07
Non-Credit Community Education 992 983 422 423 689 Customized/Specialized Training 1,248 936 480 456 244 Small Business Development Center 444 504 273 226 294
Source: Los Alamos Branch Campus, Office of the Director
Adult Basic Education (ABE)Number of Students Completing Objectives and/or 12+ Hours of Instruction*
Other Non-Credit Community Outreach ProgramsNumber of Students/Clients Served
PercentageNumber
*These figures only reflect the number of students completing 12+ hrs. of ABE instruction and/or completing their educational objectives during the annual reporting period, as reported to the State of New Mexico for funding purposes. The State does not currently fund instructional and support services for other ABE students.
Adult Basic Education (ABE) programs provide adults with the opportunity to acquire and improve basic reading, writing, and math skills, as well as English as a second language skills, citizenship skills, employability skills, and General Educatoin Diploma (GED) preparation.

2007 - 2008 UNM Fact Book - Page 32
Enrollment, Fall 2003-2007Taos Branch Campus
2003 2004 2005 2006 2007 2003 2004 2005 2006 2007Total Headcount 1,256 1,121 1,307 1,353 1,194Full-Time 310 289 278 307 283 24.7 25.8 21.3 22.7 23.7Part-Time 946 832 1,029 1,046 911 75.3 74.2 78.7 77.3 76.3
Avg. Hrs. per Sem. 6.9 6.9 6.7 6.7 6.9Full-Time Equivalent 579 517 584 606 552
2003 2004 2005 2006 2007 2003 2004 2005 2006 2007Average Age 34.4 34.8 34.1 34.7 35.3
Females 867 805 909 933 822 69.0 71.8 69.5 69.0 68.9Males 389 316 398 420 371 31.0 28.2 30.5 31.0 31.1
African American/Black 3 6 10 9 10 0.2 0.5 0.8 0.7 0.8American Indian 101 71 78 89 81 8.0 6.3 6.0 6.6 6.8Asian/Pacific Islander 10 17 8 7 13 0.8 1.5 0.6 0.5 1.1Hispanic 567 521 646 638 562 45.1 46.5 49.4 47.2 47.1White, non-Hispanic 434 421 475 508 440 34.6 37.6 36.3 37.5 36.9International 0 1 0 2 0 0.0 0.1 0.0 0.1 0.0No Response 141 84 90 100 88 11.2 7.5 6.9 7.4 7.4Source: Fall 21-day enrollment files maintained by the Registrar's Office.
Students Enrolled in Credit Courses Percentages
Student DemographicsPercentages

2007 - 2008 UNM Fact Book - Page 33
Community Outreach ProgramsTaos Branch Campus, 2002-2003 to 2006-2007
02-03 03-04 04-05 05-06 06-07 02-03 03-04 04-05 05-06 06-07
Number of Students 164 123 192 160 252
Female 85 63 103 95 131 51.8 51.2 53.6 59.4 52.0Male 79 60 89 65 121 48.2 48.8 46.4 40.6 48.0
African American/Black 1 1 0 1 2 0.6 0.8 0.0 0.6 0.8American Indian 20 12 22 15 28 12.2 9.8 11.5 9.4 11.1Asian/Pacific Islander 5 3 4 0 1 3.0 2.4 2.1 0.0 0.4Hispanic 99 79 132 113 180 60.4 64.2 68.8 70.6 71.4White, non-Hispanic 39 28 34 28 41 23.8 22.8 17.7 17.5 16.3No Response 0 0 0 3 0 0.0 0.0 0.0 1.9 0.0
Program 02-03 03-04 04-05 05-06 06-07
Non-Credit Community Education 0 0 48 42 576Customized/Specialized Training 0 0 34 20 0
Source: Taos Branch, Office of the Director
Other Non-Credit Community Outreach ProgramsNumber of Students/Clients Served
Adult Basic Education (ABE)Number of Students Completing Objectives and/or 12+ Hours of Instruction*
Number Percentage
Adult Basic Education (ABE) programs provide adults with the opportunity to acquire and improve basic reading, writing, and math skills, as well as English as a second language skills, citizenship skills, employability skills, and General Education Diploma (GED) preparation.
*These figures only reflect the number of students completing 12+ hrs. of ABE instruction and/or completing their educational objectives during the annual reporting period, as reported to the State of New Mexico for funding purposes. The State does not currently fund instructional/support services for other ABE students.

2007 - 2008 UNM Fact Book - Page 34
Enrollment, Fall 2003-2007Valencia Branch Campus
2003 2004 2005 2006 2007 2003 2004 2005 2006 2007Total Headcount 1,728 1,745 1,674 1,636 1,807Full-Time 802 804 719 729 827 46.4 46.1 43.0 44.6 45.8Part-Time 926 941 955 907 980 53.6 53.9 57.0 55.4 54.2
Avg. Hrs. per Sem. 9.0 9.0 8.6 8.8 9.0Full-Time Equivalent 1,037 1,042 962 956 1,079
2003 2004 2005 2006 2007 2003 2004 2005 2006 2007Average Age 29.1 29.5 29.7 30.4 29.0
Females 1,228 1,229 1,171 1,110 1,206 71.1 70.4 70.0 67.8 66.7Males 500 516 503 526 601 28.9 29.6 30.0 32.2 33.3
African American/Black 24 19 20 17 24 1.4 1.1 1.2 1.0 1.3American Indian 55 57 58 45 61 3.2 3.3 3.5 2.8 3.4Asian/Pacific Islander 13 14 17 20 13 0.8 0.8 1.0 1.2 0.7Hispanic 930 955 952 928 1,056 53.8 54.7 56.9 56.7 58.4White, non-Hispanic 646 629 552 573 597 37.4 36.0 33.0 35.0 33.0International 5 13 15 10 14 0.3 0.7 0.9 0.6 0.8No Response 55 58 60 43 42 3.2 3.3 3.6 2.6 2.3
Source: Fall 21-day enrollment files maintained by the Registrar's Office.
Students Enrolled in Credit Courses Percentages
Student DemographicsPercentages

2007 - 2008 UNM Fact Book - Page 35
Community Outreach ProgramsValencia Branch Campus, 2002-2003 to 2006-2007
02-03 03-04 04-05 05-06 06-07 02-03 03-04 04-05 05-06 06-07
Number of Students 901 927 944 786 926
Female 544 559 592 501 587 60.4 60.3 62.7 63.7 63.4Male 357 368 352 285 339 39.6 39.7 37.3 36.3 36.6
African American/Black 2 6 8 15 15 0.2 0.6 0.8 1.9 1.6American Indian 34 40 46 47 33 3.8 4.3 4.9 6.0 3.6Asian/Pacific Islander 7 7 2 2 9 0.8 0.8 0.2 0.3 1.0Hispanic 626 690 684 556 663 69.5 74.4 72.5 70.7 71.6White, non-Hispanic 232 184 202 167 206 25.7 19.8 21.4 21.2 22.2No Response 0 0 0 0 0 0.0 0.0 0.0 0.0 0.0
*These figures only reflect the number of students completing 12+ hrs. of ABE instruction and/or completing their educational objectives during the annual reporting period,as reported to the State of New Mexico for funding purposes. The State does not currently fund instructional/support services for other ABE students.
Adult Basic Education (ABE) programs provide adults with the opportunity to acquire and improve basic reading, writing, and math skills, as well as English as a secondlanguage skills, citizenship skills, employability skills, and General Education Diploma (GED) preparation.
Program 02-03 03-04 04-05 05-06 06-07
Non-Credit Community Education 1,406 1,103 899 699 538Customized/Specialized Training ** 4,538 5,084 5,090 2,643 2,659Small Business Development Center ** 449 515 428 384 384
** Duplicated headcount
Source: Valencia Branch Campus, Office of the Director
Adult Basic Education (ABE)Number of Students Completing Objectives and/or 12+ Hours of Instruction*
Other Non-Credit Community Outreach ProgramsNumber of Students/Clients Served
PercentageNumber

2007 - 2008 UNM Fact Book - Page 36
Student Credit Hrs. by Course LevelBranch Campuses (Fall 2001 to Fall 2007)
Level 2001 2002 2003 2004 2005 2006 2007 Level 2001 2002 2003 2004 2005 2006 2007
Develop. 2,754 3,754 4,087 4,166 4,219 4,334 4,223 Develop. 602 616 799 537 526 541 270
Freshman 13,277 15,720 15,556 16,489 15,736 15,590 15,924 Freshman 4,200 4,461 4,962 4,901 4,262 3,927 3,230
Sophomore 3,711 3,679 4,483 4,752 4,831 4,528 3,881 Sophomore 1,200 1,051 1,212 1,165 1,076 1,104 919
Subtotal 19,742 23,153 24,126 25,407 24,786 24,452 24,028 Subtotal 6,002 6,128 6,973 6,603 5,864 5,572 4,419
Level 2001 2002 2003 2004 2005 2006 2007 Level 2001 2002 2003 2004 2005 2006 2007
Develop. 456 519 390 383 434 542 604 Develop. 2,431 2,791 2,860 2,756 2,334 2,408 3,339
Freshman 4,959 5,401 5,576 5,199 5,584 5,418 4,929 Freshman 9,755 10,494 10,883 10,913 9,942 9,711 10,417
Sophomore 2,543 4,290 2,715 2,171 2,736 3,136 2,748 Sophomore 2,108 1,897 1,805 1,967 2,153 2,219 2,429
Subtotal 7,958 10,210 8,681 7,753 8,754 9,096 8,281 Subtotal 14,294 15,182 15,548 15,636 14,429 14,338 16,185
Source: 21-Day Course Census Files, Office of Institutional Research
Taos Branch Campus Valencia Branch Campus
Gallup Branch Campus Los Alamos Branch Campus
Developmental = courses numbered 100 and below, non-college credit coursesFreshman = 100 level coursesSophomore = 200 level courses

Enrollment by Age, Fall 2003-2007Gallup & Los Alamos Branch Campuses
Age 2003 2004 2005 2006 2007 2003 2004 2005 2006 2007
Under 18 317 353 327 275 353 42 42 38 55 42 18 226 255 264 291 273 112 83 79 62 49 19 210 232 219 234 253 69 72 77 55 43 20 169 183 198 185 191 59 61 47 45 40 21 127 164 156 153 140 50 55 36 39 30 22 120 118 118 131 128 32 44 35 25 28 23 102 91 78 92 97 30 31 27 31 19 24 89 90 72 74 76 29 32 26 29 16 25 83 80 88 79 71 17 20 19 25 23 26 79 82 67 66 61 27 18 17 15 19 27 79 72 66 54 51 23 19 14 19 14 28 59 69 71 65 64 12 14 23 18 14 29 48 54 59 60 59 22 13 15 20 16 30-39 573 543 470 407 380 168 152 122 134 111 40-49 433 433 355 342 287 162 161 100 91 94 50-64 214 261 241 224 183 88 109 83 109 74 Over 64 32 34 25 15 21 17 19 22 21 16 Unavailable - - - - - - - - - -
Total 2,960 3,114 2,874 2,747 2,688 959 945 780 793 648
<= 24 years 45.9% 47.7% 49.8% 52.2% 56.2% 44.1% 44.4% 46.8% 43.0% 41.2%25-29 years 11.8% 11.5% 12.2% 11.8% 11.4% 10.5% 8.9% 11.3% 12.2% 13.3%30-39 years 19.4% 17.4% 16.4% 14.8% 14.1% 17.5% 16.1% 15.6% 16.9% 17.1%40+ years 22.9% 23.4% 21.6% 21.2% 18.3% 27.8% 30.6% 26.3% 27.9% 28.4%Median Age 26.5 25.9 25.0 24.1 23.1 27.5 27.6 26.4 27.9 28.2Mean Age 30.3 30.3 29.7 29.2 28.3 31.8 32.6 31.7 32.7 32.5
Source: Fall 21-day enrollment files maintained by the Registrar's Office.
Gallup Branch Campus Los Alamos Branch Campus
2007 - 2008 UNM Fact Book - Page 37

2007 - 2008 UNM Fact Book - Page 38
Enrollment by Age, Fall 2003-2007Taos & Valencia Branch Campuses
Age 2003 2004 2005 2006 2007 2003 2004 2005 2006 2007
Under 18 243 187 290 290 247 206 131 145 97 166 18 49 45 66 76 60 149 190 192 188 218 19 52 46 48 45 52 175 185 157 162 160 20 43 37 46 41 35 120 138 141 132 141 21 40 25 28 33 27 92 90 90 88 106 22 26 32 21 26 29 60 90 70 72 86 23 37 29 28 21 26 65 43 66 49 65 24 25 34 25 31 25 55 55 44 61 56 25 27 27 32 29 19 48 52 45 39 60 26 24 18 21 16 19 34 39 35 41 52 27 17 20 27 22 17 38 41 35 34 42 28 20 16 17 26 18 30 37 36 38 36 29 20 19 23 28 21 32 26 27 26 28 30-39 169 173 164 186 156 263 249 218 234 239 40-49 201 171 183 173 161 219 219 204 197 177 50-64 219 207 239 231 195 115 130 126 123 128 Over 64 44 35 49 78 86 27 30 43 55 47 Unavailable - - - 1 1 - - - - -
Total 1,256 1,121 1,307 1,353 1,194 1,728 1,745 1,674 1,636 1,807
<= 24 years 41.0% 38.8% 42.2% 41.6% 42.0% 53.4% 52.8% 54.1% 51.9% 55.2%25-29 years 8.6% 8.9% 9.2% 8.9% 7.9% 10.5% 11.2% 10.6% 10.9% 12.1%30-39 years 13.5% 15.4% 12.5% 13.7% 13.1% 15.2% 14.3% 13.0% 14.3% 13.2%40+ years 36.9% 36.8% 36.0% 35.6% 37.0% 20.9% 21.7% 22.3% 22.9% 19.5%Median Age 30.5 31.1 29.1 29.8 30.1 24.0 24.1 23.6 24.6 23.4Mean Age 34.4 34.8 34.1 34.7 35.3 29.1 29.5 29.7 30.4 29.0
Source: Fall 21-day enrollment files maintained by the Registrar's Office.
Taos Branch Campus Valencia Branch Campus

Beginning Freshmen & Transfer Students - Main Campus


2007 - 2008 UNM Fact Book - Page 39
Beginning FreshmenMain Campus (Fall 2003 to Fall 2007)
Percentages2003 2004 2005 2006 2007 2003 2004 2005 2006 2007
African American/Black 93 114 86 114 97 3.1 3.7 2.8 3.8 3.3American Indian 142 182 143 164 169 4.7 5.9 4.6 5.4 5.8Asian/Pacific Islander 103 100 119 137 125 3.4 3.2 3.8 4.5 4.3Hispanic 1,122 1,154 1,188 1,110 1,097 37.4 37.4 38.4 36.7 37.7White, non-Hispanic 1,386 1,353 1,418 1,380 1,305 46.1 43.8 45.9 45.6 44.8International 17 12 20 21 24 0.6 0.4 0.6 0.7 0.8No Response 141 171 117 100 93 4.7 5.5 3.8 3.3 3.2Total 3,004 3,086 3,091 3,026 2,910 100.0 100.0 100.0 100.0 100.0
Percentages2003 2004 2005 2006 2007 2003 2004 2005 2006 2007
African American/Black 58 76 61 76 64 2.2 2.8 2.2 2.9 2.5American Indian 122 161 128 144 146 4.7 5.9 4.7 5.5 5.7Asian/Pacific Islander 88 90 99 121 115 3.4 3.3 3.6 4.6 4.5Hispanic 1,046 1,089 1,124 1,035 1,023 40.0 40.1 41.3 39.2 39.7White, non-Hispanic 1,172 1,147 1,203 1,179 1,138 44.9 42.3 44.2 44.7 44.1International 1 2 2 4 12 0.0 0.1 0.1 0.2 0.5No Response 125 148 104 79 81 4.8 5.5 3.8 3.0 3.1Total 2,612 2,713 2,721 2,638 2,579 100.0 100.0 100.0 100.0 100.0* "Recent Graduates" are those students who graduated from high school within one academic year prior to enrollment at UNM.
Source: Freshman Cohort Tracking Database, Office of Institutional Research
Ethnicity - UNM All Beginning Freshmen
Beginning Freshmen (Recent Graduates from NM High Schools)*

2007 - 2008 UNM Fact Book - Page 40
High School Performance IndicatorsFirst-Time Freshmen, Main Campus (Fall Semesters 1998-2007)
1998 1999 2000 2001 2002 2003 2004 2005 2006 2007
Admission Plan (Percent Admitted to UNM Under Each Plan) *Plan A 87.3 87.3 89.1 87.5 88.0 88.1 87.4 90.0 93.4 91.8Plan B 9.9 8.9 8.1 9.1 9.1 9.2 10.3 8.7 5.2 7.4Plan C 2.8 3.8 2.8 3.4 2.9 2.7 2.3 1.3 1.5 0.9Total Number 2,669 2,764 2,639 2,405 2,821 3,004 3,086 3,091 3,026 2,910
High School GPA >=4.00 7.6 7.6 9.1 9.9 8.5 8.5 10.0 10.3 9.9 10.53.75-3.99 12.2 12.4 12.2 12.9 13.3 13.0 12.9 14.2 13.2 13.73.50-3.74 14.7 15.0 16.1 16.2 17.2 17.3 17.8 16.8 16.6 17.33.00-3.49 32.4 35.1 33.9 35.2 34.8 34.6 35.7 32.2 35.4 33.52.50-2.99 27.1 25.4 25.1 22.3 22.5 23.5 20.9 23.9 21.6 21.6<2.50 5.9 4.6 3.6 3.5 3.8 3.1 2.8 2.7 3.3 3.5Number Reporting 2,595 2,709 2,602 2,344 2,753 2,941 3,042 3,032 2,929 2,794Average HS GPA 3.25 3.27 3.29 3.32 3.31 3.31 3.34 3.33 3.33 3.34
High School Rank>= 90% 16.8 16.5 20.1 19.2 17.7 18.5 18.2 20.5 19.9 22.275-89% 28.2 28.2 25.9 28.5 28.4 27.4 28.7 27.7 26.2 26.850-74% 33.9 34.0 33.8 34.0 33.2 34.0 33.8 30.2 33.3 32.025-49% 16.6 16.8 16.7 15.1 17.3 16.9 15.6 18.1 17.2 15.7<25% 4.4 4.5 3.4 3.3 3.4 3.2 3.7 3.5 3.4 3.2Number Reporting 2,405 2,484 2,348 2,049 2,401 2,589 2,707 2,720 2,684 2,540Average HS Rank 68 68 69 69 68 69 69 69 69 70
** Plan A (college preparatory curriculum with a specified minimum GPA); Plan B (a combination of ACT score and high school rank); Plan C (does not meet ** requirements under Plans A and B, but admitted under special consideration).
Percentages

2007 - 2008 UNM Fact Book - Page 41
High School Performance IndicatorsFirst-Time Freshmen, Main Campus (Fall Semesters 1998-2007)
1998 1999 2000 2001 2002 2003 2004 2005 2006 2007
ACT Composite Score27-36 14.1 12.6 13.1 12.5 11.1 11.4 12.0 13.1 12.8 13.225-26 13.1 12.7 13.3 11.7 12.3 10.8 11.6 11.1 12.7 12.223-24 16.7 17.1 15.1 15.8 17.2 15.5 15.8 16.5 16.6 17.221-22 20.5 18.8 19.2 19.0 18.0 19.1 18.6 18.8 17.4 19.119-20 16.5 18.2 19.0 18.7 19.2 19.9 18.1 18.3 17.0 18.71-18 19.2 20.6 20.3 22.4 22.2 23.3 23.9 22.1 23.4 19.6Number Reporting 2,350 2,510 2,446 2,192 2,579 2,712 2,816 2,808 2,748 2,651Average ACT Score 22.1 21.9 21.9 21.7 21.6 21.5 21.6 21.7 21.7 21.9
SAT Total Score1210-1600 22.5 18.3 26.1 21.3 22.4 20.5 20.5 21.6 21.0 23.91130-1200 16.1 19.9 15.3 17.2 17.5 17.7 15.1 15.7 17.1 12.41060-1120 18.6 17.7 14.6 15.6 18.5 16.3 17.2 18.8 15.7 15.6980-1050 19.1 18.9 16.7 13.7 16.1 16.6 17.7 17.3 16.4 16.6900-970 10.6 10.9 13.9 11.4 12.3 13.2 13.9 12.3 15.3 15.6<= 890 13.0 14.4 13.5 20.8 13.2 15.7 15.8 14.3 14.4 15.9Number Reporting 601 679 570 577 697 718 787 740 713 628Average SAT Score 1077 1068 1082 1061 1078 1068 1065 1074 1070 1069
Source: Freshman Cohort Tracking Database, Office of Institutional Research
Percentages
2007 - 2008 UNM Fact Book - Page 42
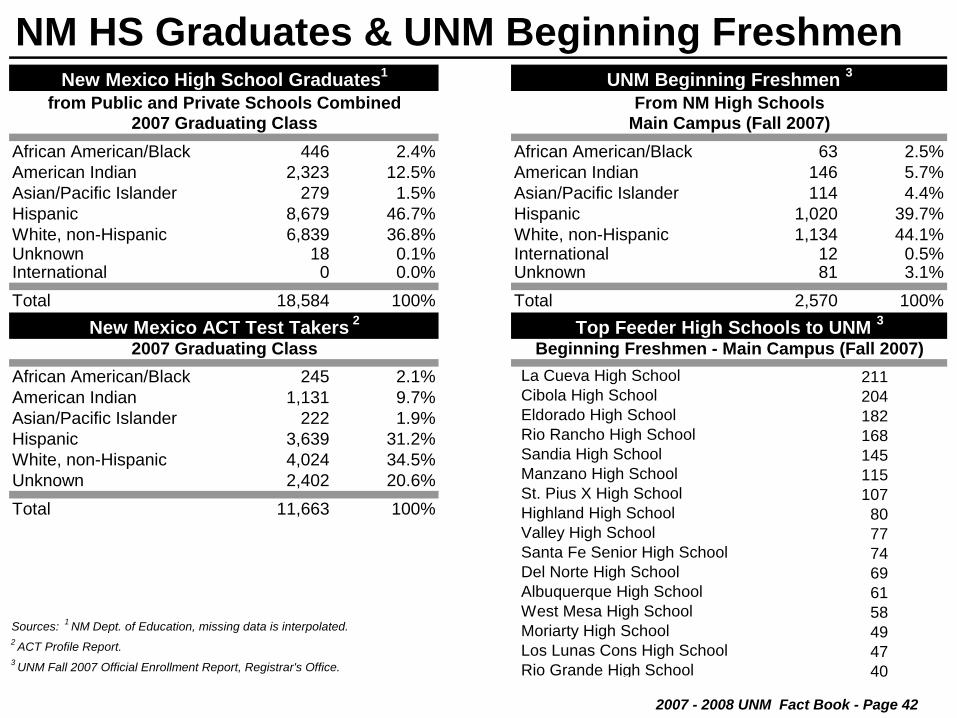
NM HS Graduates & UNM Beginning Freshmen
African American/Black 446 2.4% African American/Black 63 2.5%American Indian 2,323 12.5% American Indian 146 5.7%Asian/Pacific Islander 279 1.5% Asian/Pacific Islander 114 4.4%Hispanic 8,679 46.7% Hispanic 1,020 39.7%White, non-Hispanic 6,839 36.8% White, non-Hispanic 1,134 44.1%Unknown 18 0.1% International 12 0.5%International 0 0.0% Unknown 81 3.1%Total 18,584 100% Total 2,570 100%
African American/Black 245 2.1%American Indian 1,131 9.7%Asian/Pacific Islander 222 1.9%Hispanic 3,639 31.2%White, non-Hispanic 4,024 34.5%Unknown 2,402 20.6%Total 11,663 100%
Sources: 1 NM Dept. of Education, missing data is interpolated.2 ACT Profile Report.3 UNM Fall 2007 Official Enrollment Report, Registrar's Office.
2007 Graduating Class Beginning Freshmen - Main Campus (Fall 2007)
New Mexico High School Graduates1 UNM Beginning Freshmen 3
New Mexico ACT Test Takers 2 Top Feeder High Schools to UNM 3
From NM High SchoolsMain Campus (Fall 2007)
from Public and Private Schools Combined2007 Graduating Class
211204182168145115107
807774696158494740
La Cueva High SchoolCibola High SchoolEldorado High SchoolRio Rancho High SchoolSandia High School Manzano High SchoolSt. Pius X High SchoolHighland High School Valley High SchoolSanta Fe Senior High School Del Norte High SchoolAlbuquerque High SchoolWest Mesa High SchoolMoriarty High SchoolLos Lunas Cons High SchoolRio Grande High School
2007 - 2008 UNM Fact Book - Page 43
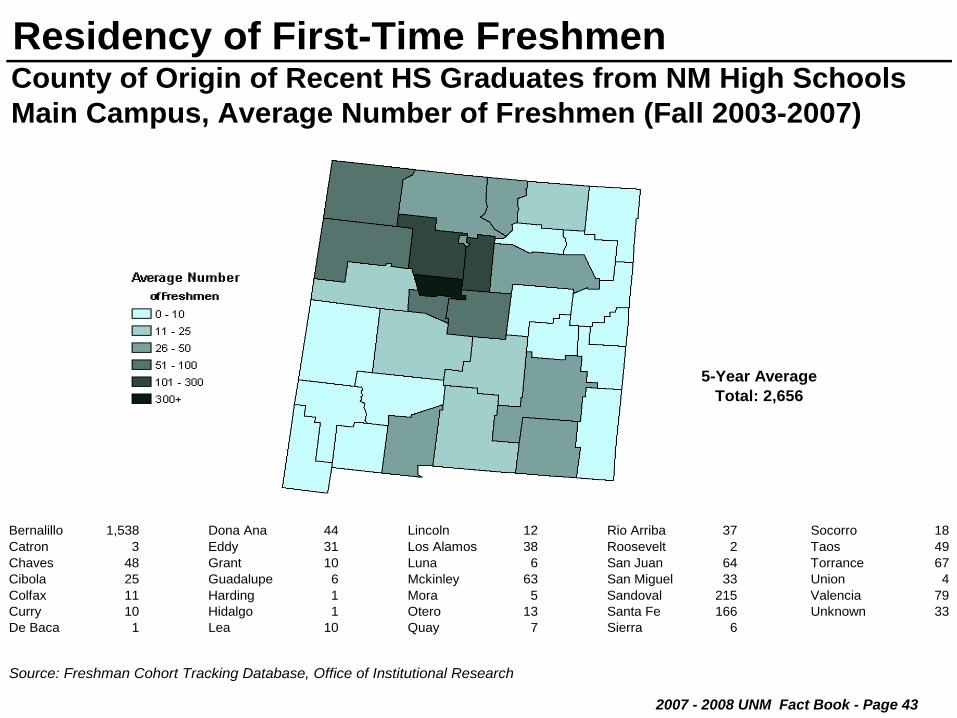
Residency of First-Time FreshmenCounty of Origin of Recent HS Graduates from NM High SchoolsMain Campus, Average Number of Freshmen (Fall 2003-2007)
Bernalillo 1,538 Dona Ana 44 Lincoln 12 Rio Arriba 37 Socorro 18Catron 3 Eddy 31 Los Alamos 38 Roosevelt 2 Taos 49Chaves 48 Grant 10 Luna 6 San Juan 64 Torrance 67Cibola 25 Guadalupe 6 Mckinley 63 San Miguel 33 Union 4Colfax 11 Harding 1 Mora 5 Sandoval 215 Valencia 79Curry 10 Hidalgo 1 Otero 13 Santa Fe 166 Unknown 33De Baca 1 Lea 10 Quay 7 Sierra 6
Source: Freshman Cohort Tracking Database, Office of Institutional Research
5-Year AverageTotal: 2,656

2007 - 2008 UNM Fact Book - Page 44
Residency of First-Time FreshmenState of Origin for Graduates from HS in Previous YearMain Campus, Average Number of Freshmen (Fall 2003-2007)
Alabama 2 Hawaii 3 Michigan 2 North Carolina 1 Utah 4Alaska 3 Idaho 1 Minnesota 4 North Dakota 1 Vermont 1Arizona 19 Illinois 11 Mississippi 1 Ohio 4 Virginia 5Arkansas 1 Indiana 2 Missouri 3 Oklahoma 4 Washington 8California 35 Iowa 1 Montana 2 Oregon 3 West Virginia 0Colorado 41 Kansas 2 Nebraska 2 Pennsylvania 6 Wisconsin 2Connecticut 3 Kentucky 1 Nevada 4 Rhode Island 1 Wyoming 2Delaware 0 Louisiana 1 New Hampshire 1 South Carolina 1 International 15District of Columbia 0 Maine 2 New Jersey 3 South Dakota 2 Unknown 5Florida 5 Maryland 3 New Mexico 2,653 Tennessee 2Georgia 2 Massachusetts 3 New York 3 Texas 51
Source: Freshman Cohort Tracking Database, Office of Institutional Research
5-Year AverageTotal: 2,937

2007 - 2008 UNM Fact Book - Page 45
Transfer Students to Main Campus 2002-03 to 2006-07*Transfers to UNM Main Campus1
Undergraduate, Degree-Seeking Only
Transferred From 02-03 03-04 04-05 05-06 06-07 02-03 03-04 04-05 05-06 06-07CNM 678 687 731 763 694 30.3 30.4 31.9 34.9 34.0Other NM 2-year 232 259 254 212 233 10.4 11.5 11.1 9.7 11.4NM 4-year 294 255 246 254 221 13.1 11.3 10.7 11.6 10.8Other States 948 938 935 871 776 42.4 41.5 40.8 39.8 38.0International 86 121 126 86 120 3.8 5.4 5.5 3.9 5.9Total 2,238 2,260 2,292 2,186 2,044 100.0 100.0 100.0 100.0 100.01Does not include undergraduate transfers from UNM branch campuses.
UNM Branch Campus Transfers to UNM Main Campus
Branch Campus 02-03 03-04 04-05 05-06 06-07 02-03 03-04 04-05 05-06 06-07Gallup 92 100 119 114 118 31.0 26.5 33.4 29.2 33.1Los Alamos 59 72 72 91 76 19.9 19.1 20.2 23.3 21.3Taos 45 56 51 46 53 15.2 14.9 14.3 11.8 14.8Valencia 101 149 114 139 110 34.0 39.5 32.0 35.6 30.8Total from Branches 297 377 356 390 357 100.0 100.0 100.0 100.0 100.0
*Reflects an academic year, which includes summer, fall, and the following spring semester.Source: Native/Transfer/Branch Transfer Database, Office of Institutional Research
Percentages
Undergraduate, Degree-Seeking Only Percentages

2007 - 2008 UNM Fact Book - Page 46

Degree Programs, Program Accreditation, Degrees Awarded & Alumni


2007 - 2008 UNM Fact Book - Page 47
Degree & Certificate Programs (Main Campus)
Baccalaureate Degree Programs
Anderson Schools of Management Criminology (BA) Mathematics (BS) +Business Administration (BBA) 1 * Earth & Planetary Sciences (BA, BS) Philosophy (BA)
School of Architecture and Planning Economics (BA) Physics (BS)Architecture (BAA) Economics-Philosophy (BA) Physics and Astrophysics (BA)Environment, Planning and Design (BAEPD) English (BA) * Political Science (BA) +
College of Arts and Sciences English-Philosophy (BA) Portuguese (BA) Africana Studies (BA) Environmental Science (BS) Psychology (BA, BS) *American Studies (BA) * European Studies (BA) Religious Studies (BA) *Anthropology (BA, BS) + French (BA) Russian (BA) Art (BA) Geography (BA, BS) Russian Studies (BA) Asian Studies (BA) German (BA) Signed Language Interpreting (BS) Astrophysics (BS) Health, Medicine and Human Values (BA) Sociology (BA) +Biochemistry (BA, BS) History (BA) * Spanish (BA) *Biology (BA, BS) + Journalism (BA) * Speech and Hearing Sciences (BA) *Chemistry (BA, BS) + Languages (BA) Statistics (BS)Classical Studies (BA) Latin American Studies (BA) Women's Studies (BA) Communication (BA) * Linguistics (BA) Comparative Literature & Cultural Studies (BA) Mass Communication (BA)*
Sources: Registrar's Office, Graduate Studies, and Evening and Weekend Degree Programs
UNM's Main Campus offers over 215 degree and certificate programs. There are 94 baccalaureate, 71 masters, and 37 doctoral level degree programs. Many of the degree programs have additional concentrations and options; for example, the Bachelors in Business Administration degree has a number of concentrations. (See the UNM catalog for information on degree concentrations.) In addition, there are 3 first-professional degree programs—in law, medicine, and pharmacy—as well as 5 education specialist certificates (graduate programs beyond the masters level), 7 graduate certificate programs, 1 undergraduate certificate program, and 1 associate degree program. The University offers an Evening and Weekend Degree Program (EWDP) in which nearly 40 complete degree programs are available, and core courses are offered in a number of additional degree programs. About 1,000 classes are offered each semester after 4:00 p.m. or on weekends. Approximately 12,000 non-traditional, working students attend UNM at night each semester. The following list of degree programs are marked with an * if the entire program is available in the EWDP and with a + if several core courses in a program are offered through EWDP.

2007 - 2008 UNM Fact Book - Page 48
Degree & Certificate Programs (Main Campus)College of Education College of Fine Arts College of Arts and SciencesArt Education (BAED) + Art History (BAFA) + American Studies (MA)Athletic Training (BS) Art Studio (BFA, BAFA) + Anthropology (MA, MS)Bilingual Education (BAED) * Dance (BA) + Biology (MS)Communicative Arts Education (BAED) + Design for Performance (BA) Chemistry (MS)Early Childhood Multicultural Education (BS) Media Arts (BA) * Communication (MA)Earth Science Education (BSED) Music (BA, BM) + Comparative Lit. & Cultural Studies (MA)Elementary Education (BSED) + Music Education (BME) Creative Writing (MFA)Exercise Science (BS) Theatre (BA) + Earth & Planetary Sciences (MS)Family Studies (BS) School of Medicine Economics (MA)Health Education (BSED) + Dental Hygiene (BSDH) English (MA) *Human Development & Family Relations (BS) Emergency Medical Services (BS) French (MA)Life Science Education (BSED) Medical Laboratory Sciences (BSML) Geography (MS)Mathematics Education (BSED) + Physician Assistant Studies (BS) German Studies (MA)Nutrition and Dietetics (BS) Radiologic Sciences (BS) History (MA)Physical Education (BSED) + College of Nursing Latin American Studies (MA)Physical Science Education (BSED) Nursing (BSN) Linguistics (MA)Social Studies Education (BAED) University College Mathematics (MS)Special Education (BSED) * Native American Studies (BA) Nanoscience and Microsystems (MS)4
Teaching English as a Second Lang (BAED) + University Studies (BUS) * Optical Science and Engineering (MS) 2
Technology and Training (BS) * Philosophy (MA)School of Engineering Master Degree Programs Physics (MS)
Chemical Engineering (BSCHE) Political Science (MA)Civil Engineering (BSCE) Anderson Schools of Management Portuguese (MA)Computer Engineering (BSCPE) Accounting (MACCT) Psychology (MS)Computer Science (BSCS) Business Administration (MBA) 1+ Sociology (MA)Construction Engineering (BSCNE) School of Architecture and Planning Spanish (MA)Construction Management (BS) Architecture (MARCH) + Speech-Language Pathology (MS) *Electrical Engineering (BSEE) Community & Regional Planning (MCRP) + Statistics (MS)Mechanical Engineering (BSME) Landscape Architecture (MLA) +Nuclear Engineering (BSNE)
Sources: Registrar's Office, Graduate Studies, and Evening and Weekend Degree Programs

2007 - 2008 UNM Fact Book - Page 49
Degree & Certificate Programs (Main Campus)College of Education College of Fine Arts Chemistry (PhD)
Art Education (MA) + Art History (MA) Communication (PhD)Counseling (MA) + Art Studio (MFA) Earth & Planetary Sciences (PhD)Educational Leadership (MA) + Dance (MFA) Economics (PhD)Educational Psychology (MA) + Dramatic Writing (MFA) English (PhD)Elementary Education (MA) + Music (MMU) French Studies (PhD)Family Studies (MA) + Theatre & Dance (MA) History (PhD)Health Education (MS) + School of Medicine Latin American Studies (PhD)Lang., Literacy, & Sociocultural Studies (MA) Biomedical Sciences (MS) Linguistics (PhD)Nutrition (MS) Clinical Laboratory Sciences (MS) Mathematics (PhD)Org. Learning and Instruc. Tech. (MA) + Dental Hygiene (MS) Nanoscience and Microsystems (PhD)4
Physical Education (MS) Occupational Therapy (MOT) Optical Science and Engineering (PhD) 2
Secondary Education (MA) + Physical Therapy (MPT) Philosophy (PhD)Special Education (MA) + Public Health (MPH) Physics (PhD)
School of Engineering College of Nursing Political Science (PhD)Chemical Engineering (MS) Nursing (MSN) Psychology (PhD)Civil Engineering (MS) College of Pharmacy Sociology (PhD)Computer Engineering (MS) Pharmaceutical Science (MS) Spanish and Portuguese (PhD)Computer Science (MS) Public Administration Statistics (PhD)Construction Management (MCM) Public Administration (MPA) * College of EducationElectrical Engineering (MS) University College Counseling (PhD) +Hazardous Waste Engineering (MEHWE) Water Resources (MWR) Educational Leadership (EDD) +Manufacturing Engineering (MEME) Educational Linguistics (PhD)Mechanical Engineering (MS) Doctoral Degree Programs Educational Psychology (PhD) +Nanoscience and Microsystems (MS)4 Family Studies (PhD) +Nuclear Engineering (MS) College of Arts and Sciences Lang., Literacy, & Sociocultural Studies (PhD)Optical Science and Engineering (MS) 2 American Studies (PhD) M-Cult. Teacher & Childhood Educ. (EDD, PhD) +
Anthropology (PhD) Org. Learning and Instruc. Tech. (PhD) +Biology (PhD) Physical Educ.,Sports,and Exercise Science (PhD)
Special Education (EDD, PhD) +
Sources: Registrar's Office, Graduate Studies, and Evening and Weekend Degree Programs

2007 - 2008 UNM Fact Book - Page 50
Degree & Certificate Programs (Main Campus)School of Engineering First-Professional Degree Programs Grad. & Post-Grad. Certificate Programs
Engineering (PhD) 3 School of Law Computational Science & Engineering (GCEComputer Science (PhD) Law (JD) Historic Preservation & Regionalism (GCERNanoscience and Microsystems (PhD)4 School of Medicine Instruction for Students with Intensive SociaOptical Science and Engineering (PhD) 2 Medicine (DM) Language and Behavioral Needs (GCERT
College of Fine Arts College of Pharmacy Post-MBA Certificate Programs (MGTCP) 1
Art History (PhD) Doctor of Pharmacy (PHARD) Post-Masters Certificate in Nursing (NURCPSchool of Medicine System's Engineering (GCERT)
Biomedical Sciences (PhD) Other Degree and Certificate Programs Town Design (GCERT)College of Nursing Associate Degree Programs Women's Studies (GCERT)
Nursing (PhD) Radiography (ASR) Education Specialist Certificate ProgramsCollege of Pharmacy Undergraduate Certificate Programs Curriculum & Instruction (EDSPC) +
Pharmaceutical Science (PhD) Nuclear Medicine Imaging (CERT) Educational Leadership (EDSPC)Peace and Justice Studies(CERT) Org. Learning and Instruc. Tech. (EDSPC)
Special Education (EDSPC)
1
2
3
4 An MS and a PhD in Nanoscience and Microsystems are offered as a collaborative effort among several departments in the college of Arts and Sciences andthe School of Engineering. Degrees are awarded in both Colleges.
Sources: Registrar's Office, Graduate Studies, and Evening and Weekend Degree Programs
NOTE: Degree programs are marked with an * if the entire program is available in the Evening and Weekend Degree Program (EWDP) and with a + if several core courses in a program are offered through EWDP.
Anderson Schools of Management offers a BBA, an MBA, and a Post-MBA Certificate in several degree concentrations. See the current UNM catalog or ASM's web page for details on these degree concentrations.
The School of Engineering offers a PhD in Engineering; students can concentrate in Chemical, Civil, Electrical, Mechanical, or Nuclear Engineering. See the
An MS and a PhD in Optical Science and Engineering are offered by the Department of Physics and Astronomy in the College of Arts and Sciences and by the Department of Electrical and Computing Engineering in the School of Engineering.

2007 - 2008 UNM Fact Book - Page 51
Accreditation at UNMInstitutional and Programmatic (as of 12/2007)Department Program or Major Accreditation Body Latest Review Next Review
Institutional The Higher Learning Commission of the North 1999 2009Central Association of Colleges & Schools
ASM Bachelor of Business Administration, The Association to Advance Collegiate 2005 2010Master of Business Administration Schools of Business International(Traditional, Executive and Professional)Master of Accounting
School of Architecture and PlanningArchitecture Program Master of Architecture National Architectural 1/1/2007 Spring 2012
Accrediting Board (NAAB)Community & Regional Master of Community & Planning Accreditation Board (PAB) 1/1/2008 Spring 2014Planning Program Regional PlanningLandscape Architecture Master of Landscape Landscape Architectural 8/15/2003 Spring 2009
Architecture Accreditation Board (LAAB)College of Arts and SciencesChemistry & Chemical Biology Undergraduate Program American Chemical Society 2004 2009Communication & Journalism Undergraduate Program Accrediting Council on Education in Journalism 2002 Spring 2008
and Mass CommunicationPsychology Ph.D. Clinical Psychology American Psychological Association 2004 Fall 2007Speech and Hearing Sciences M.S. in Speech-Language 2004 March 2012
PathologyCollege of EducationEducational Leadership & M.A., Ed.S. Certificate, Ed.D. National Council for Accreditation of 2007 2014Organizational Learning and Professional Preparation for Teacher Education (NCATE)(ELOL) Administrative Licensure
New Mexico Public Education Department 2007 2014
University Council for Educational 2008 2013Administration (UCEA)
Educational Specialties (ES) B.A.Ed., B.S.Ed., Post Bac., M.A., National Council for Accreditation of 2007 2014EdSpec. Certificate, Ed.D. & Ph.D. Teacher Education (NCATE)
Language, Literacy & and Professional Education for Sociocultrual Studies (LLSS) Teachers - Initial & Advanced New Mexico Public Education Department 2007 2014
Teachers Field Endorsements New Mexico Public Education Department 2007 2014
Source: Office of Institutional Research Survey of Colleges and Schools
University of New Mexico
Anderson School of Management
American Speech-Language-Hearing Association

2007 - 2008 UNM Fact Book - Page 52
Department Program or Major Accreditation Body Latest Review Next ReviewTeacher Education B.A.Ed., M.A., Elementary National Council for Accreditation of 2007 2014
Education and Secondary Teacher Education (NCATE)Education New Mexico Public Education Department 2007 2014
Individual Family & Community M.A. & Ph.D., Counselor Education Council for Accreditation of 2005 2012Education (IFCE) Counseling & Related Education
Programs (CACREP)B.S., M.S., Nutrition Commission on Accreditation for 2000 2010Post B.S. Dietetics Internship Dietetics Education (CADE) of the American B.S Dietetics Internship Dietetic Association (ADA)
National Council for Accreditation of Teacher Education (NCATE)New Mexico Public Education Department 2000 2007
B.S., M.A., Ph. D Family Studies National Council on Family Relations 2002 2007Family Life Educator Program
Health, Exercise M.S. Physical Education National Association for Sport & Physical 2000 2007and Sport Sciences (HESS) Ph.D.Health Physical Education & Education/Sport Management Program
Recreation (HPER), Sports Review Council (NASPE/SMPRC)Administration ConcentrationB.S. Athletic Training Program Commission on Accreditation of Allied 2004 2008
Training Education (CAATE)B.S. Exercise Science American Society of Exercise 2002 2012
Physiologists (ASEP)B.S. Ed. Physical Education National Council for Accreditation of Teacher 2000 2007
Education (NCATE)New Mexico Public Education Department 2000 N/A
School of Public AdministrationSchool of Public Administration Masters of Public Administration National Association of Schools of Public Affairs
and Administration (NASPAA) 2006 2011-12
Chemical and Nuclear B.S. Chemical Engineering Engineering Accreditation 2004-2005 2010-2011Engineering B.S. Nuclear Engineering Commission of the Accreditation Board
for Engineering & Technology (ABET)Civil Engineering B.S. Civil Engineering Engineering Accreditation 2004-2005 2010-2011
Commision of the Accreditation BoardB.S. Construction Engineering for Engineering & Technology (ABET)
Electrical and Computer B.S. Electrical EngineeringEngineering B.S. Computer EngineeringMechanical Engineering B.S. Mechanical Engineering 2004-2005 2010-2011Civil Engineering B.S. Construction Management American Council for Construction Education 2005-2006 2011-2012Computer Science B.S. Computer Science Computing Accreditation Commission of ABET 2005-2006 2011-2012Source: Office of Institutional Research Survey of Colleges and Schools
School of Engineering
2004-2005 2010-2011
B.S. Early Childhood Multicultural Education (ECME)
2000 2007

2007 - 2008 UNM Fact Book - Page 53
Department Program or Major Accreditation Body Latest Review Next Review
Music B.M., B.A., B.M.E. & M.M. Music National Association of 2002 2011-2012Schools of Music (NASM)
Theatre and Dance B.A. & M.A. Theatre National Association of Schools of Theatre 2002 2012(NAST)
B.A. and M.A. Dance National Association of Schools of Dance 2002 2012(NASD)
MFA Dance National Association of Schools of Dance 2002 2012(NASD)
MFA Dramatic Writing National Association of Schools of Theatre 2002 2012(NAST)
College of Nursing Nursing Commission on Collegiate Nursing Education 2002 2012College of Nursing M.S.N. with a concentration in American College of Nurse- 2006 2017Graduate Program Nurse Midwifery Midwives, Division of Accreditation
College of Pharmacy Pharm.D. Accreditation Council for Pharmacy Education 2005 2009
School of Medicine M.D. Medicine Undergraduate Liaison Committee on Medical Educ. 2003 2010Medical Education Curriculum representing the Assoc. of American
Medical Colleges & the AmericanMedical Association
Dept. of Emergency Medicine Part of a B.S. degree program & also Committee on Accreditation of 2005 N/AEmergency Medical Services a certificate program. Educational Programs for the Academy Paramedic Course Emergency Medical Services
ProfessionDept. of Family & Community B.S. and certification of completion Commission on Accreditation of 2005 2011Medicine Physician Assistant Physician Assistant Education Allied Health Education ProgramsProgramDept. of Family & Community Masters in Pubic Health in Medicine, Council on Education for Public 2001Health Program, Masters in through Biomedical Sciences Health Public Health Graduate ProgramDept. of Orthopaedics Masters of Occupational Therapy Accreditation Council for 2001 N/AOccupational Therapy Program Occupational Therapy EducationDept. of Orthopaedics Division Masters of Physical Therapy Commission on Accreditation in Physical 2005 2015of Physical Therapy Therapy EducationDept. of Pathology, Medical B.S. or certificate for those with National Accrediting Agency for Clinical 2007 2014Laboratory Sciences Program a B.S. Degree, Med. Laboratory Laboratory Sciences
Source: Office of Institutional Research Survey of Colleges and Schools
2008
Health Sciences Center - School of Medicine
College of Fine Arts
Health Sciences Center - College of Nursing
Health Sciences Center - College of Pharmacy

2007 - 2008 UNM Fact Book - Page 54
Department Program or Major Accreditation Body Latest Review Next ReviewDepartment of Surgery B.S. Dental Hygiene Commission on Dental Accreditation 1997 2009Division of Dental Hygiene
School of Law Law American Bar Association 2001 2008Association of American Law Schools
Branch Campuses Department Program or Major Accreditation Body Latest Review Next ReviewUNM-GallupGallup Branch Associate Degree Medical National Accreditation Agency for 2001 2007Health Careers Department Laboratory Technician Clinical Laboratory Sciences
Associate Degree Health American Health Information 2006 Self Study SentInformation Technology Management Association Every OctoberAssociate Degree Human Council for Standards for Human New Program Anticipated 2008Services Services EducationCertificate Dental Assisting American Dental Association 2002 May 2008
Council on Dental EducationNursing Department Associate Degree Nursing National League of Nurses App. Sent Anticipated 2009
Accrediting Commission Oct. 2006New Mexico Board of Nursing 2002 2010
Certificate Nursing Assistant New Mexico Department of 2006 Dec 2009Health Licensing & Certification
Applied Technology AAS Cosmetology New Mexico State Board of 2005 Random -Cosmetology Cosmetology/Barbering
AAS Cosmetology Instruction New Mexico State Board of 2005 RandomCosmetology/Barbering
Instructor's License New Mexico State Board of 2005 RandomCosmetology/Barbering
-Auto Tech Automobile - National Institute for Automotive 2005 Dec 2009Brakes, Electrical Electronic Service Excellence - NationalSystems, Engine Performance, Automotive TechniciansSuspension & Steering Education Foundation
-Construction Technology Construction Technology National Center for Construction 2007 TBAEducation and Research (NCCER)
Several academic and technical programs leading to AA, AS, and AAS degrees are offered, as well as one-year certificates and customized training.
Several vocational/technical programs are offered which upon completion result in the Associate of Applied Science degree and which generallyhave an accompanying certificate. Source: Office of Institutional Research Survey of Colleges and Schools
UNM-Taos
UNM-Valencia
School of Law
UNM-LA offers six AA, three AS, and 10 AAS degrees, as well as 15 certificates.UNM-Los Alamos

2007 - 2008 UNM Fact Book - Page 55
Degrees Awarded, 1997-1998 to 2006-2007Main Campus*
97-98 98-99 99-00 00-01 01-02 02-03 03-04 04-05 05-06 06-07Bachelors 2,733 2,780 2,723 2,548 2,513 2,684 2,777 2,818 2,890 2,999Masters 1,083 1,026 976 1,035 1,030 1,046 1,073 1,197 1,215 1,110Professional 185 167 226 249 286 246 243 250 250 293Doctorate 204 190 184 174 189 162 195 205 181 185Post-Masters Certificate 6 5 5 10 8 7 4 8 15 11Education Specialist 35 33 22 20 7 10 14 5 26 16Associate/Certificate 36 30 7 8 3 0 10 12 13 16
Total 4,282 4,231 4,143 4,044 4,036 4,155 4,316 4,495 4,590 4,630
*Includes HSC degrees
Source: Fall 2007 Official Enrollment Report, Registrar's Office; 2006-2007 IPEDS Completions Survey
Degrees Awarded
Degrees Awarded1997-1998 to 2006-2007
0500
1,0001,5002,0002,5003,0003,5004,0004,5005,000
97-98 98-99 99-00 00-01 01-02 02-03 03-04 04-05 05-06 06-07
Year
Num
ber o
f Deg
rees
DoctorateProfessionalMastersBachelors

2007 - 2008 UNM Fact Book - Page 56
Degrees Awarded, by EthnicityMain Campus (2002-2003 to 2006-2007)1
02-03 03-04 04-05 05-06 06-07 02-03 03-04 04-05 05-06 06-07
African American/Black 53 62 62 65 66 14 11 22 19 12American Indian 153 145 168 169 172 27 33 41 41 40Asian/Pacific Islander 97 90 81 75 93 24 29 31 33 29Hispanic 843 872 933 911 968 169 222 240 263 230White, non-Hispanic 1,444 1,505 1,406 1,482 1,501 609 604 683 651 626International 20 28 30 22 34 134 127 136 141 100No Response 74 75 138 166 165 69 47 44 67 73
Total 2,684 2,777 2,818 2,890 2,999 1,046 1,073 1,197 1,215 1,110
02-03 03-04 04-05 05-06 06-07
African American/Black 4 9 1 2 6American Indian 3 3 2 2 3Asian/Pacific Islander 4 4 5 9 8Hispanic 14 20 25 16 20White, non-Hispanic 111 116 116 91 106International 23 38 44 51 38No Response 3 5 12 10 4
Total 162 195 205 181 185
1Includes HSC degrees.
Source: 2002-2003 through 2006-2007 IPEDS Completions Surveys; Fall 2007 Official Enrollment Report, Registrar's Office
Bachelors Masters
Doctorate
2Also includes Certificates, Assoc., Educ. Specialist, Post-Masters Certif., and Professional Degrees.
Total Degrees 2006-20072
(by Ethnicity)
White, non-Hispanic
52%
American Indian
5%
African American /
Black2% Asian /
Pacific Islander
3%
Hispanic28%
No Response6%
International4%

2007 - 2008 UNM Fact Book - Page 57
Retention and Graduation Rates1
Main Campus2
FreshmanClass
1 Yr. 2 Yrs. 3 Yrs. 4 Yrs. 5 Yrs. 6 Yrs. 7 Yrs. 8 Yrs. 9 Yrs. 10 Yrs.
1997 71.5 63.0 56.0 12.4 33.9 42.5 46.5 48.7 50.4 51.21998 70.1 59.4 53.7 11.4 32.7 40.1 43.7 46.4 47.7 .1999 71.6 61.3 55.1 10.5 32.7 41.0 44.8 46.8 . .2000 73.4 62.4 57.6 12.8 34.4 43.2 47.0 . . .2001 76.3 66.1 60.1 12.6 34.6 44.0 . . . .2002 76.2 64.7 58.8 12.0 35.6 . . . . .2003 75.2 64.2 57.6 10.7 . . . . . .2004 76.0 64.5 59.2 . . . . . . .2005 74.4 63.8 . . . . . . .2006 76.6
1Graduation rates include baccalaureate degrees & PharmD students. 2Includes HSC undergraduate students. 3Registered for 12 or more main campus credit hrs. in 1st semester.
Source: Freshman Cohort Tracking Database, Office of Institutional Research
After By
Retention and Graduation Rates of First-Time, Full-Time3 Freshmen
Retention Rate Cumulative Graduation Rate(Fall 1997 to Fall 2006 Freshman Classes)
Fall 1997 Freshman Class1 to 10 Year Retention and
Cumulative Graduation Rates
0102030405060708090
100
1 2 3 4 5 6 7 8 9 10Years Following Initial Year
Perc
ent % Retained
% Graduated

2007 - 2008 UNM Fact Book - Page 58
Degrees Awarded, by EthnicityBranch Campuses (2002-2003 to 2006-2007)
02-03 03-04 04-05 05-06 06-07 02-03 03-04 04-05 05-06 06-07
African American/Black - - - - - - 1 1 - -American Indian 30 30 43 40 46 106 112 122 118 124Asian/Pacific Islander 1 - - 1 1 - - 1 4Hispanic 1 4 1 3 3 8 18 12 22 13White, non-Hispanic 2 4 - 4 8 12 18 20 13International - - - - - - - 1 - 1No Response 1 1 - - 2 2 4 1 2
Total 31 38 49 43 54 125 145 158 162 157
02-03 03-04 04-05 05-06 06-07 02-03 03-04 04-05 05-06 06-07
African American/Black - - - - - - - - - -American Indian 1 1 - - - 1 - 2 4 4Asian/Pacific Islander - - - - 1 3 - 1 - 2Hispanic 5 8 - 9 3 15 22 35 26 26White, non-Hispanic 1 3 3 2 1 8 28 10 13 13International - 1 - - - - - - - -No Response - - - - 1 - - 1 2 -
Total 7 13 3 11 6 27 50 49 45 45
Source: IPEDS Completions Surveys, 2002-2003 to 2006-2007
Gallup Branch Campus
Los Alamos Branch CampusCertificates Associate Degrees
Certificates Associate Degrees
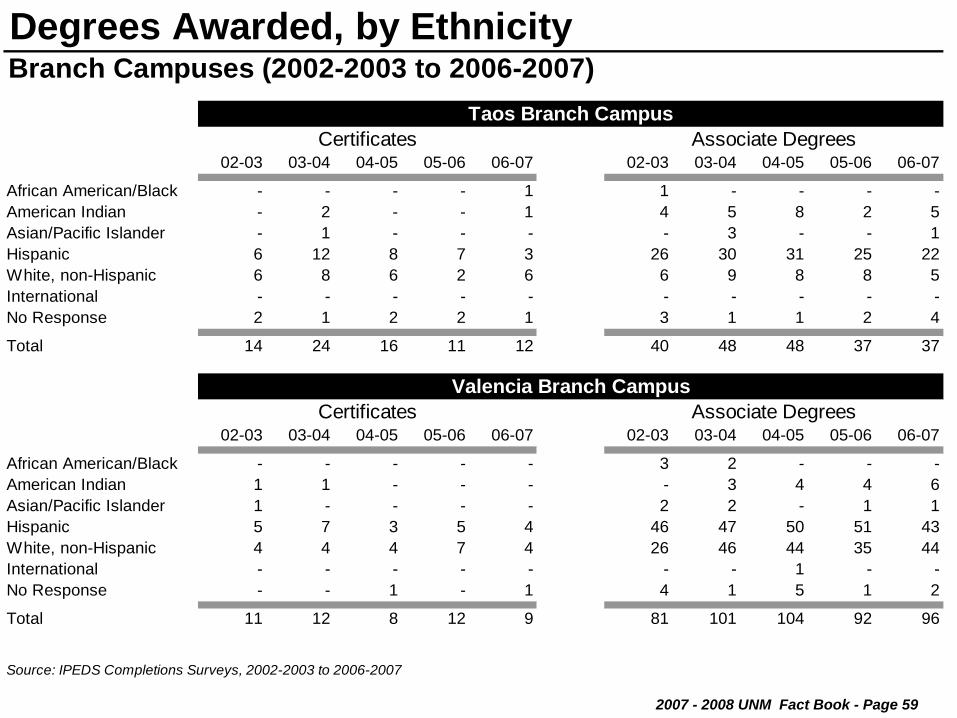
2007 - 2008 UNM Fact Book - Page 59
Degrees Awarded, by EthnicityBranch Campuses (2002-2003 to 2006-2007)
02-03 03-04 04-05 05-06 06-07 02-03 03-04 04-05 05-06 06-07
African American/Black - - - - 1 1 - - - -American Indian - 2 - - 1 4 5 8 2 5Asian/Pacific Islander - 1 - - - - 3 - - 1Hispanic 6 12 8 7 3 26 30 31 25 22White, non-Hispanic 6 8 6 2 6 6 9 8 8 5International - - - - - - - - - -No Response 2 1 2 2 1 3 1 1 2 4
Total 14 24 16 11 12 40 48 48 37 37
02-03 03-04 04-05 05-06 06-07 02-03 03-04 04-05 05-06 06-07
African American/Black - - - - - 3 2 - - -American Indian 1 1 - - - - 3 4 4 6Asian/Pacific Islander 1 - - - - 2 2 - 1 1Hispanic 5 7 3 5 4 46 47 50 51 43White, non-Hispanic 4 4 4 7 4 26 46 44 35 44International - - - - - - - 1 - -No Response - - 1 - 1 4 1 5 1 2
Total 11 12 8 12 9 81 101 104 92 96
Source: IPEDS Completions Surveys, 2002-2003 to 2006-2007
Certificates Associate Degrees
Taos Branch CampusCertificates Associate Degrees
Valencia Branch Campus

2007 - 2008 UNM Fact Book - Page 60
UNM Alumni by State *Main and Branch Campus Alumni Combined
Alabama 244 Illinois 1,166 Montana 352 Rhode Island 72Alaska 328 Indiana 382 Nebraska 216 South Carolina 251Arizona 4,164 Iowa 259 Nevada 969 South Dakota 142Arkansas 227 Kansas 524 New Hampshire 152 Tennessee 469California 7,409 Kentucky 236 New Jersey 589 Texas 6,070Colorado 4,795 Louisiana 299 New Mexico 70,295 Utah 549Connecticut 329 Maine 167 New York 1,212 Vermont 112Delaware 59 Maryland 814 North Carolina 708 Virginia 1,424District of Columbia 195 Massachusetts 645 North Dakota 72 Washington 1,934Florida 1,655 Michigan 520 Ohio 708 West Virginia 92Georgia 606 Minnesota 538 Oklahoma 657 Wisconsin 473Hawaii 290 Mississippi 111 Oregon 1,198 Wyoming 240Idaho 469 Missouri 568 Pennsylvania 798 US Territories & Military 382
* The numbers reported here reflect those for whom Alumni Relations has valid addresses.
Source: UNM Alumni Relations, November 2007
Total USA: 117,135International Alumni: 1,274Total Alumni: 118,409

2007 - 2008 UNM Fact Book - Page 61
UNM Alumni in New Mexico by County *Main and Branch Campus Alumni Combined
Bernalillo 45,328 Grant 228 Mora 55 Sierra 98Catron 31 Guadalupe 29 Otero 274 Socorro 402Chaves 411 Harding 6 Quay 55 Taos 940Cibola 450 Hidalgo 13 Rio Arriba 883 Torrance 318Colfax 160 Lea 180 Roosevelt 78 Union 43Curry 161 Lincoln 181 San Juan 1,429 Valencia 3,296De Baca 8 Los Alamos 1,412 San Miguel 304Dona Ana 1,008 Luna 75 Sandoval 4,635Eddy 314 McKinley 2,996 Santa Fe 4,494
* The numbers reported here reflect those for whom Alumni Relations has valid addresses.
Source: UNM Alumni Relations, November 2007
Total Alumni in New Mexico: 70,295

2007 - 2008 UNM Fact Book - Page 62

Faculty


2007 - 2008 UNM Fact Book - Page 63
UNM Faculty by Site All Faculty Combined and Faculty Administrators (Fall 2003 to 2007)*
Site 2003 2004 2005 2006 2007 2003 2004 2005 2006 2007
Main Campus, not SOM1 1,797 1,837 1,832 1,849 1,912 69 74 70 77 76School of Medicine2 794 815 825 839 889 4 3 1 1 1Total Main Campus 2,591 2,652 2,657 2,688 2,801 73 77 71 78 77
Gallup Branch 158 166 174 180 161 3 3 3 3 2Los Alamos Branch 111 120 119 126 117 1Taos Branch 105 96 109 111 115 2 2 2 2 2Valencia Branch 111 110 124 116 112 1 1 1 1 1Total Branch 485 492 526 533 505 6 6 6 6 6
Total UNM 3,076 3,144 3,183 3,221 3,306 79 83 77 84 83
* As of October 31 of each year.
** Includes all active individuals with faculty appointments, including tenured/tenure-track, non-tenure-track, and temporary faculty. Faculty administrators are also included.
*** Includes all faculty whose primary assignment is administrative or professional, including the President, Provost, Associate Provosts, and Deans.
These individuals all have faculty appointments, but they are reported as Administrators or Professional staff in the University's Affirmative Action Plan.
1 Includes Extended University, Continuing Education, Nursing, and Pharmacy.2 Includes Basic Medical and Clinical Health Sciences.
Source: Office of Institutional Research
All Faculty Combined** Faculty Administrators***

2007 - 2008 UNM Fact Book - Page 64
UNM Faculty by Site IPEDS* Faculty and Faculty Administrators** in Fall 2007***
Site1 TotalTenure /
Tenure-Track2Non-Tenure-
Track3 Temporary4
Main Campus, not SOM 872 708 164School of Medicine 46 45 1Branch Campuses 113 58 55
Main Campus, not SOM 964 59 116 789School of Medicine 842 187 534 121Branch Campuses 386 10 376
Main Campus, not SOM 76 63 13School of Medicine 1 1Branch Campuses 6 5 1
Total Across All Sites 3,306 1,126 894 1,286
*Full-time instructional Faculty are reported annually to the National Center for Education Statistics in the IPEDS (Integrated Post-secondary Education Data System) Faculty Salary Survey. These are basically the same faculty whose salaries are compared with Peer salaries (see Comparative Salaries, Full-Time Faculty.) School of Medicine Clinical faculty are not reported on the IPEDS survey; School of Medicine faculty in the Basic Medical Sciences are included.** Includes all faculty whose primary assignment is administrative. Administrative faculty are not reported on the IPEDS survey.*** As of October 31, 2007.1 "Main Campus, not SOM" includes Extended University, Continuing Education, Nursing, and Pharmacy; "School of Medicine" includes Basic Medical and Clinical Health Sciences; and "Branch Campuses" includes the total of the faculty at Gallup, Los Alamos, Taos, and Valencia.2 All faculty who have tenure or who are on a contract that can lead to tenure.3 All faculty with regular appointments but who are not on a contract that can lead to tenure. This includes Clinician Educators, visiting faculty, lecturers, and research faculty.4 Includes all faculty on a temporary contract. This includes temporary adjunct faculty, retired faculty who are hired back on temporary contracts, and post-doctoral fellows.
Source: Office of Institutional Research
Reported to IPEDS
Faculty AdministratorsN
ot R
epor
ted
to
IPED
S
Faculty Contract Types
Faculty
Reporting Status

2007 - 2008 UNM Fact Book - Page 65
UNM Faculty by SiteTenure / Tenure-Track Faculty (Fall 2003 to 2007)*
Site 2003 2004 2005 2006 2007 2003 2004 2005 2006 2007
Main Campus, not SOM1 209 191 194 200 211 625 629 631 611 619School of Medicine2 56 54 42 35 36 198 197 206 202 196Total Main Campus 265 245 236 235 247 823 826 837 813 815
Gallup Branch 32 31 25 21 16 13 15 16 20 20Los Alamos Branch 1Taos Branch 1 1 8 3 1 6Valencia Branch 4 4 3 4 6 11 11 11 12 11Total Branch 36 36 29 33 25 24 26 27 33 38
Total UNM 301 281 265 268 272 847 852 864 846 853
* As of October 31 of each year.
** Tenured or Tenure-Track Faculty with the Rank of Assistant Professor (in a very few cases Instructors may be Tenure-Track), Faculty Administrators are included.
*** Tenured or Tenure-Track Faculty with the Rank of Professor or Associate Professor, Faculty Administrators are included.
1 Includes Extended University, Continuing Education, Nursing, and Pharmacy.2 Includes Basic Medical and Clinical Health Sciences.
Source: Office of Institutional Research
Junior Faculty** Senior Faculty***
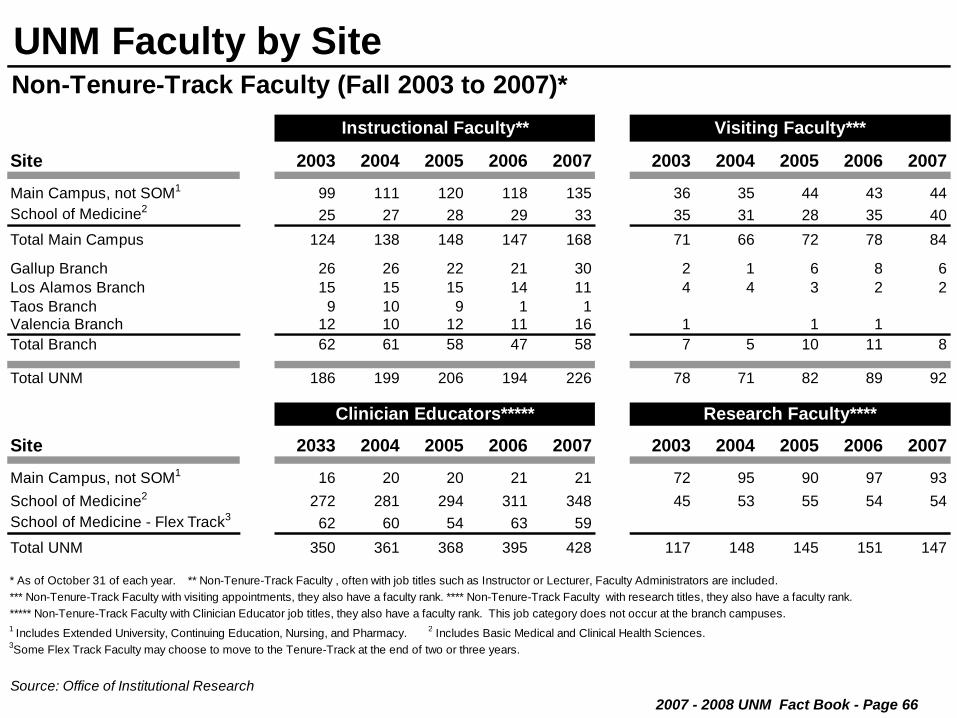
2007 - 2008 UNM Fact Book - Page 66
UNM Faculty by SiteNon-Tenure-Track Faculty (Fall 2003 to 2007)*
Site 2003 2004 2005 2006 2007 2003 2004 2005 2006 2007
Main Campus, not SOM1 99 111 120 118 135 36 35 44 43 44School of Medicine2 25 27 28 29 33 35 31 28 35 40Total Main Campus 124 138 148 147 168 71 66 72 78 84
Gallup Branch 26 26 22 21 30 2 1 6 8 6Los Alamos Branch 15 15 15 14 11 4 4 3 2 2Taos Branch 9 10 9 1 1Valencia Branch 12 10 12 11 16 1 1 1Total Branch 62 61 58 47 58 7 5 10 11 8
Total UNM 186 199 206 194 226 78 71 82 89 92
Site 2033 2004 2005 2006 2007 2003 2004 2005 2006 2007
Main Campus, not SOM1 16 20 20 21 21 72 95 90 97 93School of Medicine2 272 281 294 311 348 45 53 55 54 54School of Medicine - Flex Track3 62 60 54 63 59Total UNM 350 361 368 395 428 117 148 145 151 147
* As of October 31 of each year. ** Non-Tenure-Track Faculty , often with job titles such as Instructor or Lecturer, Faculty Administrators are included.*** Non-Tenure-Track Faculty with visiting appointments, they also have a faculty rank. **** Non-Tenure-Track Faculty with research titles, they also have a faculty rank. ***** Non-Tenure-Track Faculty with Clinician Educator job titles, they also have a faculty rank. This job category does not occur at the branch campuses.1 Includes Extended University, Continuing Education, Nursing, and Pharmacy. 2 Includes Basic Medical and Clinical Health Sciences.3Some Flex Track Faculty may choose to move to the Tenure-Track at the end of two or three years.
Source: Office of Institutional Research
Instructional Faculty** Visiting Faculty***
Research Faculty****Clinician Educators*****

2007 - 2008 UNM Fact Book - Page 67
UNM Faculty by SiteTemporary Faculty (Fall 2003 to 2007)*
Site 2003 2004 2005 2006 2007 2003 2004 2005 2006 2007
Main Campus, not SOM1 657 663 649 676 710 83 93 84 83 79School of Medicine2 55 72 74 75 72 46 40 44 35 48Total Main Campus 712 735 723 751 782 129 133 128 118 127
Gallup Branch 85 93 105 110 89Los Alamos Branch 92 101 101 110 103Taos Branch 96 85 99 101 105Valencia Branch 83 85 97 88 79Total Branch 356 364 402 409 376 0 0 0 0 0
Total UNM 1,068 1,099 1,125 1,160 1,158 129 133 128 118 127
* As of October 31 of each year.
** Faculty with temporary appointments, many are Temporary Adjuncts, others are retired faculty hired back to teach one or two courses, others teach non-credit courses.
*** Post-Doctoral Fellows hired on temporary appointments, primarily to conduct research in externally funded projects.
1 Includes Extended University, Continuing Education, Nursing, and Pharmacy.2 Includes Basic Medical and Clinical Health Sciences.
Source: Office of Institutional Research
Temporary Faculty** Post-Doctoral Fellows***

2007 - 2008 UNM Fact Book - Page 68
FacultyAll UNM (Fall 2003 to 2007)*
2003 2004 2005 2006 2007 2003 2004 2005 2006 2007Tenure/Tenure-Track Faculty Professor 495 499 496 487 498 16.1 15.9 15.6 15.1 15.1 Assoc. Professor 352 353 368 359 356 11.4 11.2 11.6 11.1 10.8 Asst. Professor 287 266 253 254 260 9.3 8.5 7.9 7.9 7.9 Instructor1 14 15 12 14 12 0.5 0.5 0.4 0.4 0.4Non-Tenure-Track Faculty 731 779 801 829 894 23.8 24.8 25.2 25.7 27.0Temporary Faculty2 1,197 1,232 1,253 1,278 1,286 38.9 39.2 39.4 39.7 38.9
Total Faculty 3,076 3,144 3,183 3,221 3,306 100.0 100.0 100.0 100.0 100.0
2003 2004 2005 2006 2007 2003 2004 2005 2006 2007Total Tenure/Tenure-Track Faculty 1,148 1,133 1,129 1,114 1,126
Females 437 437 440 449 473 38.1 38.6 39.0 40.3 42.0Males 711 696 689 665 653 61.9 61.4 61.0 59.7 58.0
African American/Black 10 9 13 12 17 0.9 0.8 1.2 1.1 1.5American Indian 25 26 30 29 26 2.2 2.3 2.7 2.6 2.3Asian/Pacific Islander 71 74 76 79 84 6.2 6.5 6.7 7.1 7.5Hispanic 111 109 116 119 126 9.7 9.6 10.3 10.7 11.2White, non-Hispanic 922 907 882 860 856 80.3 80.1 78.1 77.2 76.0No Response 9 8 12 15 17 0.8 0.7 1.1 1.3 1.5
*As of October 31 of each year. 1 Includes ABD faculty hired for the T/TT. 2 Includes post-doctoral fellows.
Source: Office of Institutional Research
Percentages
Percentages
All Faculty
Tenure/Tenure-Track Faculty Demographics

2007 - 2008 UNM Fact Book - Page 69
FacultyAll UNM (Fall 2003 to 2007)*
2003 2004 2005 2006 2007 2003 2004 2005 2006 2007Total Non-Tenure-Track Faculty 731 779 801 829 894Females 348 372 392 410 448 47.6 47.8 48.9 49.5 50.1Males 383 407 409 419 446 52.4 52.2 51.1 50.5 49.9African American/Black 16 14 18 21 17 2.2 1.8 2.2 2.5 1.9American Indian 21 17 22 20 23 2.9 2.2 2.7 2.4 2.6Asian/Pacific Islander 44 46 53 59 68 6.0 5.9 6.6 7.1 7.6Hispanic 74 91 77 80 87 10.1 11.7 9.6 9.7 9.7White, non-Hispanic 562 600 620 632 675 76.9 77.0 77.4 76.2 75.5No Response 14 11 11 17 24 1.9 1.4 1.4 2.1 2.7
2003 2004 2005 2006 2007 2003 2004 2005 2006 2007Total Temporary Faculty1 1,197 1,232 1,253 1,278 1,286Females 583 634 667 683 673 48.7 51.5 53.2 53.4 52.3Males 614 598 586 595 613 51.3 48.5 46.8 46.6 47.7African American/Black 18 19 23 19 18 1.5 1.5 1.8 1.5 1.4American Indian 34 31 44 38 42 2.8 2.5 3.5 3.0 3.3Asian/Pacific Islander 56 63 66 73 75 4.7 5.1 5.3 5.7 5.8Hispanic 161 163 171 192 188 13.5 13.2 13.6 15.0 14.6White, non-Hispanic 899 931 921 920 891 75.1 75.6 73.5 72.0 69.3No Response 29 25 28 36 72 2.4 2.0 2.2 2.8 5.6*As of October 31 of each year. 1 Includes post-doctoral fellows.
Source: Office of Institutional Research
Percentages
Non-Tenure-Track Faculty Demographics
Temporary Faculty1 Demographics
Percentages

2007 - 2008 UNM Fact Book - Page 70
FacultyMain Campus, not SOM (Fall 2003 to 2007)*
2003 2004 2005 2006 2007 2003 2004 2005 2006 2007Tenure/Tenure-Track Faculty Professor 367 367 356 345 346 20.4 20.0 19.4 18.7 18.1 Assoc. Professor 258 262 275 266 273 14.4 14.3 15.0 14.4 14.3 Asst. Professor 205 188 191 196 206 11.4 10.2 10.4 10.6 10.8 Instructor1 4 3 3 4 5 0.2 0.2 0.2 0.2 0.3Non-Tenure-Track Faculty 223 261 274 279 293 12.4 14.2 15.0 15.1 15.3Temporary Faculty2 740 756 733 759 789 41.2 41.2 40.0 41.0 41.3Total Faculty 1,797 1,837 1,832 1,849 1,912 100.0 100.0 100.0 100.0 100.0
2003 2004 2005 2006 2007 2003 2004 2005 2006 2007Total Tenure/Tenure-Track Faculty 834 820 825 811 830Females 320 319 324 330 359 38.4 38.9 39.3 40.7 43.3Males 514 501 501 481 471 61.6 61.1 60.7 59.3 56.7African American/Black 9 8 11 9 12 1.1 1.0 1.3 1.1 1.4American Indian 19 19 23 22 22 2.3 2.3 2.8 2.7 2.7Asian/Pacific Islander 49 50 50 56 61 5.9 6.1 6.1 6.9 7.3Hispanic 87 89 95 96 100 10.4 10.9 11.5 11.8 12.0White, non-Hispanic 664 647 636 616 621 79.6 78.9 77.1 76.0 74.8No Response 6 7 10 12 14 0.7 0.9 1.2 1.5 1.7*Includes all Main Campus units except for the School of Medicine, as of October 31 of each year. 1 Includes ABD faculty hired for the T/TT. 2 Includes post-doctoral fellows.
Source: Office of Institutional Research
Percentages
Percentages
All Faculty
Tenure/Tenure-Track Faculty Demographics

2007 - 2008 UNM Fact Book - Page 71
FacultyMain Campus, not SOM (Fall 2003 to 2007)*
2003 2004 2005 2006 2007 2003 2004 2005 2006 2007Total Non-Tenure-Track Faculty 223 261 274 279 293Females 102 120 131 128 141 45.7 46.0 47.8 45.9 48.1Males 121 141 143 151 152 54.3 54.0 52.2 54.1 51.9African American/Black 6 5 9 9 7 2.7 1.9 3.3 3.2 2.4American Indian 8 8 9 6 8 3.6 3.1 3.3 2.2 2.7Asian/Pacific Islander 8 10 11 13 20 3.6 3.8 4.0 4.7 6.8Hispanic 28 37 27 31 30 12.6 14.2 9.9 11.1 10.2White, non-Hispanic 169 197 214 215 222 75.8 75.5 78.1 77.1 75.8No Response 4 4 4 5 6 1.8 1.5 1.5 1.8 2.0
2003 2004 2005 2006 2007 2003 2004 2005 2006 2007Total Temporary Faculty1 740 756 733 759 789Females 356 379 390 418 420 48.1 50.1 53.2 55.1 53.2Males 384 377 343 341 369 51.9 49.9 46.8 44.9 46.8African American/Black 11 10 14 13 14 1.5 1.3 1.9 1.7 1.8American Indian 12 10 12 11 15 1.6 1.3 1.6 1.4 1.9Asian/Pacific Islander 35 41 41 51 49 4.7 5.4 5.6 6.7 6.2Hispanic 73 79 75 88 104 9.9 10.4 10.2 11.6 13.2White, non-Hispanic 596 606 576 579 568 80.5 80.2 78.6 76.3 72.0No Response 13 10 15 17 39 1.8 1.3 2.0 2.2 4.9*Includes all Main Campus units except for the School of Medicine, as of October 31 of each year. 1 Includes post-doctoral fellows.
Source: Office of Institutional Research
Percentages
Non-Tenure-Track Faculty Demographics
Temporary Faculty1 Demographics
Percentages

2007 - 2008 UNM Fact Book - Page 72
FacultySchool of Medicine (Fall 2003 to 2007)*
2003 2004 2005 2006 2007 2003 2004 2005 2006 2007Tenure/Tenure-Track Faculty Professor 117 120 128 129 139 14.7 14.7 15.5 15.4 15.6 Assoc. Professor 81 77 78 73 58 10.2 9.4 9.5 8.7 6.5 Asst. Professor 56 54 42 35 36 7.1 6.6 5.1 4.2 4.0 Instructor1 0.0 0.0 0.0 0.0 0.0Non-Tenure-Track Faculty 439 452 459 492 535 55.3 55.5 55.6 58.6 60.2Temporary Faculty2 101 112 118 110 121 12.7 13.7 14.3 13.1 13.6Total Faculty 794 815 825 839 889 100.0 100.0 100.0 100.0 100.0
2003 2004 2005 2006 2007 2003 2004 2005 2006 2007Total Tenure/Tenure-Track Faculty 254 251 248 237 233Females 83 84 85 82 81 32.7 33.5 34.3 34.6 34.8Males 171 167 163 155 152 67.3 66.5 65.7 65.4 65.2African American/Black 1 1 2 2 2 0.4 0.4 0.8 0.8 0.9American Indian 1 2 2 2 1 0.4 0.8 0.8 0.8 0.4Asian/Pacific Islander 20 22 23 20 21 7.9 8.8 9.3 8.4 9.0Hispanic 18 15 16 16 19 7.1 6.0 6.5 6.8 8.2White, non-Hispanic 213 210 203 196 189 83.9 83.7 81.9 82.7 81.1No Response 1 1 2 1 1 0.4 0.4 0.8 0.4 0.4*As of October 31 of each year. Includes Basic Medical & Clinical Health Sciences. 1 Includes ABD faculty hired for the T/TT. 2 Includes post-doctoral fellows.
Source: Office of Institutional Research
Percentages
Percentages
All Faculty
Tenure/Tenure-Track Faculty Demographics

2007 - 2008 UNM Fact Book - Page 73
FacultySchool of Medicine (Fall 2003 to 2007)*
2003 2004 2005 2006 2007 2003 2004 2005 2006 2007Total Non-Tenure-Track Faculty 439 452 459 492 535Females 206 216 223 249 268 46.9 47.8 48.6 50.6 50.1Males 233 236 236 243 267 53.1 52.2 51.4 49.4 49.9African American/Black 9 8 8 11 10 2.1 1.8 1.7 2.2 1.9American Indian 7 6 9 10 8 1.6 1.3 2.0 2.0 1.5Asian/Pacific Islander 36 36 42 46 47 8.2 8.0 9.2 9.3 8.8Hispanic 37 42 39 39 46 8.4 9.3 8.5 7.9 8.6White, non-Hispanic 340 354 355 375 409 77.4 78.3 77.3 76.2 76.4No Response 10 6 6 11 15 2.3 1.3 1.3 2.2 2.8
2003 2004 2005 2006 2007 2003 2004 2005 2006 2007Total Temporary Faculty1 101 112 118 110 121Females 37 50 51 39 45 36.6 44.6 43.2 35.5 37.2Males 64 62 67 71 76 63.4 55.4 56.8 64.5 62.8African American/Black 1 0.8American IndianAsian/Pacific Islander 16 16 16 15 20 15.8 14.3 13.6 13.6 16.5Hispanic 12 12 11 15 13 11.9 10.7 9.3 13.6 10.7White, non-Hispanic 70 81 88 77 85 69.3 72.3 74.6 70.0 70.2No Response 3 3 2 3 3 3.0 2.7 1.7 2.7 2.5*As of October 31 of each year. Includes Basic Medical & Clinical Health Sciences. 1 Includes post-doctoral fellows.
Source: Office of Institutional Research
Percentages
Non-Tenure-Track Faculty Demographics
Temporary Faculty1 Demographics
Percentages

2007 - 2008 UNM Fact Book - Page 74
FacultyGallup Branch Campus (Fall 2003 to 2007)*
2003 2004 2005 2006 2007 2003 2004 2005 2006 2007Tenure/Tenure-Track Faculty Professor 5 6 6 6 6 3.2 3.6 3.4 3.3 3.7 Assoc. Professor 8 9 10 14 14 5.1 5.4 5.7 7.8 8.7 Asst. Professor 22 19 16 11 9 13.9 11.4 9.2 6.1 5.6 Instructor 10 12 9 10 7 6.3 7.2 5.2 5.6 4.3Non-Tenure-Track Faculty 28 27 28 29 36 17.7 16.3 16.1 16.1 22.4Temporary Faculty 85 93 105 110 89 53.8 56.0 60.3 61.1 55.3Total Faculty 158 166 174 180 161 100.0 100.0 100.0 100.0 100.0
2003 2004 2005 2006 2007 2003 2004 2005 2006 2007Total Tenure/Tenure-Track Faculty 45 46 41 41 36Females 25 25 22 24 21 55.6 54.3 53.7 58.5 58.3Males 20 21 19 17 15 44.4 45.7 46.3 41.5 41.7African American/Black 1 2.8American Indian 5 5 4 4 2 11.1 10.9 9.8 9.8 5.6Asian/Pacific Islander 2 2 3 3 2 4.4 4.3 7.3 7.3 5.6Hispanic 4 3 2 2 1 8.9 6.5 4.9 4.9 2.8White, non-Hispanic 32 36 32 31 29 71.1 78.3 78.0 75.6 80.6No Response 2 1 1 4.4 2.4 2.8*As of October 31 of each year.
Source: Office of Institutional Research
Percentages
Percentages
All Faculty
Tenure/Tenure-Track Faculty Demographics

2007 - 2008 UNM Fact Book - Page 75
FacultyGallup Branch Campus (Fall 2003 to 2007)*
2003 2004 2005 2006 2007 2003 2004 2005 2006 2007Total Non-Tenure-Track Faculty 28 27 28 29 36Females 16 14 14 16 19 57.1 51.9 50.0 55.2 52.8Males 12 13 14 13 17 42.9 48.1 50.0 44.8 47.2African American/Black 1 3.4American Indian 6 3 4 4 7 21.4 11.1 14.3 13.8 19.4Asian/Pacific Islander 1 2.8Hispanic 1 4 2 2 4 3.6 14.8 7.1 6.9 11.1White, non-Hispanic 21 20 22 21 22 75.0 74.1 78.6 72.4 61.1No Response 1 2 3.4 5.6
2003 2004 2005 2006 2007 2003 2004 2005 2006 2007Total Temporary Faculty 85 93 105 110 89Females 47 54 62 56 48 55.3 58.1 59.0 50.9 53.9Males 38 39 43 54 41 44.7 41.9 41.0 49.1 46.1African American/Black 4 5 4 3 2 4.7 5.4 3.8 2.7 2.2American Indian 18 15 24 21 20 21.2 16.1 22.9 19.1 22.5Asian/Pacific Islander 2 1 2 3 1 2.4 1.1 1.9 2.7 1.1Hispanic 9 12 10 13 9 10.6 12.9 9.5 11.8 10.1White, non-Hispanic 49 54 61 64 48 57.6 58.1 58.1 58.2 53.9No Response 3 6 4 6 9 3.5 6.5 3.8 5.5 10.1*As of October 31 of each year.
Source: Office of Institutional Research
Percentages
Non-Tenure-Track Faculty Demographics
Temporary Faculty Demographics
Percentages

2007 - 2008 UNM Fact Book - Page 76
FacultyLos Alamos Branch Campus (Fall 2003 to 2007)*
2003 2004 2005 2006 2007 2003 2004 2005 2006 2007Tenure/Tenure-Track Faculty Professor 1 0.0 0.0 0.0 0.0 0.9 Assoc. Professor Asst. Professor Instructor Non-Tenure-Track Faculty 19 19 18 16 13 17.1 15.8 15.1 12.7 11.1Temporary Faculty 92 101 101 110 103 82.9 84.2 84.9 87.3 88.0Total Faculty 111 120 119 126 117 100.0 100.0 100.0 100.0 100.0
2003 2004 2005 2006 2007 2003 2004 2005 2006 2007Total Tenure/Tenure-Track Faculty 0 0 0 0 1Females Males 1 100.0African American/Black 1 100.0American Indian Asian/Pacific Islander Hispanic White, non-Hispanic No Response *As of October 31 of each year.
Source: Office of Institutional Research
Percentages
Percentages
All Faculty
Tenure/Tenure-Track Faculty Demographics

2007 - 2008 UNM Fact Book - Page 77
FacultyLos Alamos Branch Campus (Fall 2003 to 2007)*
2003 2004 2005 2006 2007 2003 2004 2005 2006 2007Total Non-Tenure-Track Faculty 19 19 18 16 13Females 11 11 11 10 10 57.9 57.9 61.1 62.5 76.9Males 8 8 7 6 3 42.1 42.1 38.9 37.5 23.1African American/BlackAmerican IndianAsian/Pacific IslanderHispanic 3 3 3 3 1 15.8 15.8 16.7 18.8 7.7White, non-Hispanic 16 16 15 13 12 84.2 84.2 83.3 81.3 92.3No Response
2003 2004 2005 2006 2007 2003 2004 2005 2006 2007Total Temporary Faculty 92 101 101 110 103Females 46 49 55 63 58 50.0 48.5 54.5 57.3 56.3Males 46 52 46 47 45 50.0 51.5 45.5 42.7 43.7African American/Black 3 2 1 3.0 2.0 0.9American Indian 1 2 2 2 3 1.1 2.0 2.0 1.8 2.9Asian/Pacific Islander 2 3 4 2 3 2.2 3.0 4.0 1.8 2.9Hispanic 15 15 17 17 9 16.3 14.9 16.8 15.5 8.7White, non-Hispanic 70 76 76 84 76 76.1 75.2 75.2 76.4 73.8No Response 4 2 4 12 4.3 2.0 3.6 11.7*As of October 31 of each year.
Source: Office of Institutional Research
Percentages
Non-Tenure-Track Faculty Demographics
Temporary Faculty Demographics
Percentages

2007 - 2008 UNM Fact Book - Page 78
FacultyTaos Branch Campus (Fall 2003 to 2007)*
2003 2004 2005 2006 2007 2003 2004 2005 2006 2007Tenure/Tenure-Track Faculty Professor Assoc. Professor 1 6 0.0 0.0 0.0 0.9 5.2 Asst. Professor 1 1 8 3 0.0 1.0 0.9 7.2 2.6 Instructor 0.0Non-Tenure-Track Faculty 9 10 9 1 1 8.6 10.4 8.3 0.9 0.9Temporary Faculty 96 85 99 101 105 91.4 88.5 90.8 91.0 91.3Total Faculty 105 96 109 111 115 100.0 100.0 100.0 100.0 100.0
2003 2004 2005 2006 2007 2003 2004 2005 2006 2007Total Tenure/Tenure-Track Faculty 0 1 1 9 9Females 3 3 0.0 0.0 33.3 33.3Males 1 1 6 6 100.0 100.0 66.7 66.7African American/Black 1 1 11.1 11.1American IndianAsian/Pacific IslanderHispanic 2 2 22.2 22.2White, non-Hispanic 1 1 5 5 100.0 100.0 55.6 55.6No Response 1 1 11.1 11.1*As of October 31 of each year.
Source: Office of Institutional Research
Percentages
Percentages
All Faculty
Tenure/Tenure-Track Faculty Demographics

2007 - 2008 UNM Fact Book - Page 79
Taos Branch Campus (Fall 2003 to 2007)*
2003 2004 2005 2006 2007 2003 2004 2005 2006 2007Total Non-Tenure-Track Faculty 9 10 9 1 1Females 5 5 4 55.6 50.0 44.4 0.0 0.0Males 4 5 5 1 1 44.4 50.0 55.6 100.0 100.0African American/Black 1 1 1 11.1 10.0 11.1American IndianAsian/Pacific IslanderHispanic 3 3 3 1 1 33.3 30.0 33.3 100.0 100.0White, non-Hispanic 5 5 4 55.6 50.0 44.4No Response 1 1 10.0 11.1
2003 2004 2005 2006 2007 2003 2004 2005 2006 2007Total Temporary Faculty 96 85 99 101 105Females 49 48 49 50 53 51.0 56.5 49.5 49.5 50.5Males 47 37 50 51 52 49.0 43.5 50.5 50.5 49.5African American/Black 2 1 2 2 2 2.1 1.2 2.0 2.0 1.9American Indian 2 3 3 3 3 2.1 3.5 3.0 3.0 2.9Asian/Pacific Islander 1 2 2 1 1 1.0 2.4 2.0 1.0 1.0Hispanic 29 21 26 30 26 30.2 24.7 26.3 29.7 24.8White, non-Hispanic 59 55 63 61 68 61.5 64.7 63.6 60.4 64.8No Response 3 3 3 4 5 3.1 3.5 3.0 4.0 4.8*As of October 31 of each year.
Source: Office of Institutional Research
Percentages
Non-Tenure-Track Faculty Demographics
Temporary Faculty Demographics
Percentages
Faculty

2007 - 2008 UNM Fact Book - Page 80
Valencia Branch Campus (Fall 2003 to 2007)*
2003 2004 2005 2006 2007 2003 2004 2005 2006 2007Tenure/Tenure-Track Faculty Professor 6 6 6 7 6 5.4 5.5 4.8 6.0 5.4 Assoc. Professor 5 5 5 5 5 4.5 4.5 4.0 4.3 4.5 Asst. Professor 4 4 3 4 6 3.6 3.6 2.4 3.4 5.4 Instructor 0.0Non-Tenure-Track Faculty 13 10 13 12 16 11.7 9.1 10.5 10.3 14.3Temporary Faculty 83 85 97 88 79 74.8 77.3 78.2 75.9 70.5Total Faculty 111 110 124 116 112 100.0 100.0 100.0 100.0 100.0
2003 2004 2005 2006 2007 2003 2004 2005 2006 2007Total Tenure/Tenure-Track Faculty 15 15 14 16 17Females 9 9 9 10 9 60.0 60.0 64.3 62.5 52.9Males 6 6 5 6 8 40.0 40.0 35.7 37.5 47.1African American/BlackAmerican Indian 1 1 1 7.1 6.3 5.9Asian/Pacific IslanderHispanic 2 2 3 3 4 13.3 13.3 21.4 18.8 23.5White, non-Hispanic 13 13 10 12 12 86.7 86.7 71.4 75.0 70.6No Response *As of October 31 of each year.
Source: Office of Institutional Research
Percentages
Percentages
All Faculty
Tenure/Tenure-Track Faculty Demographics
Faculty

2007 - 2008 UNM Fact Book - Page 81
Valencia Branch Campus (Fall 2003 to 2007)*
2003 2004 2005 2006 2007 2003 2004 2005 2006 2007Total Non-Tenure-Track Faculty 13 10 13 12 16Females 8 6 9 7 10 61.5 60.0 69.2 58.3 62.5Males 5 4 4 5 6 38.5 40.0 30.8 41.7 37.5African American/BlackAmerican IndianAsian/Pacific IslanderHispanic 2 2 3 4 5 15.4 20.0 23.1 33.3 31.3White, non-Hispanic 11 8 10 8 10 84.6 80.0 76.9 66.7 62.5No Response 1 6.3
2003 2004 2005 2006 2007 2003 2004 2005 2006 2007Total Temporary Faculty 83 85 97 88 79Females 48 54 60 57 49 57.8 63.5 61.9 64.8 62.0Males 35 31 37 31 30 42.2 36.5 38.1 35.2 38.0African American/Black 1 1.2American Indian 1 1 3 1 1 1.2 1.2 3.1 1.1 1.3Asian/Pacific Islander 1 1 1 1.0 1.1 1.3Hispanic 23 24 32 29 27 27.7 28.2 33.0 33.0 34.2White, non-Hispanic 55 59 57 55 46 66.3 69.4 58.8 62.5 58.2No Response 3 1 4 2 4 3.6 1.2 4.1 2.3 5.1*As of October 31 of each year.
Source: Office of Institutional Research
Percentages
Non-Tenure-Track Faculty Demographics
Temporary Faculty Demographics
Percentages
Faculty

2007 - 2008 UNM Fact Book - Page 82
Total UNM (Fall 2007)*
Asst.2 Assoc.
Highest Degree Earned Prof. Prof.
Doctorate 656 166 209 281 159 246Prof. Doctorate Degree 48 6 12 30 22 34Other Terminal Degree** 34 5 18 11 6 36Master's Degree 84 31 33 20 84 259Other (includes Not Reported) 8 3 1 4 22 214Total 830 211 273 346 293 789
Doctorate 77 18 22 37 99 55Prof. Doctorate Degree 141 11 32 98 370 41Other Terminal Degree** 0Master's Degree 7 4 1 2 27 5Other 8 3 3 2 39 20Total 233 36 58 139 535 121
Doctorate 11 1 6 4 4 1Prof. Doctorate Degree 1 1 5Other Terminal Degree** 3 2 1 3Master's Degree 17 9 7 1 11 41Other 4 4 21 39Total 36 16 14 6 36 89* As of October 31 of each year. ** Other Terminal Degrees include degrees such as the Masters of Fine Arts (MFA).1 Faculty reported at Main includes Extended University and Continuing Education as well as Nursing and Pharmacy.2 Includes ABD faculty hired for the T/TT on Main Campus, and T/TT faculty at Gallup with the job title of Technical Instructor.
Source: Office of Institutional Research
Main Campus, not SOM1
School of Medicine
Gallup Branch2
Non-Tenure-Track Faculty
Temporary FacultyProf.
Total T/T-Track Faculty
Tenure / Tenure-Track Faculty
Faculty by Highest Degree Earned

2007 - 2008 UNM Fact Book - Page 83
Total UNM (Fall 2007)*
Asst. Assoc.
Highest Degree Earned Prof. Prof.
Doctorate 1 1 5 30Prof. Doctorate Degree 0 2Other Terminal Degree** 0 3Master's Degree 0 6 37Other (includes Not Reported) 0 2 31Total 1 0 0 1 13 103
Doctorate 1 1 12Prof. Doctorate Degree 0Other Terminal Degree** 2 1 1 1 10Master's Degree 5 1 4 41Other 1 1 42Total 9 3 6 0 1 105
Doctorate 13 3 4 6 2 10Prof. Doctorate Degree 0 1Other Terminal Degree** 0 2Master's Degree 4 3 1 6 37Other 0 6 31Total 17 6 5 6 16 79* As of October 31 of each year. ** Other Terminal Degrees include degrees such as the Masters of Fine Arts (MFA).
Source: Office of Institutional Research
Los Alamos Branch
Taos Branch
Valencia Branch
Non-Tenure-Track Faculty
Temporary FacultyProf.
Total T/T-Track Faculty
Tenure / Tenure-Track Faculty
Faculty by Highest Degree Earned

2007 - 2008 UNM Fact Book - Page 84
Main Campus and SOM (Fall 2007)*
Asst.2 Assoc.
College1 Prof. Prof.
Anderson Schools of Mgmt. 42 10 17 15 10 46Architecture & Planning 23 4 11 8 7 30Arts & Sciences 375 89 106 180 118 216Education 98 32 48 18 32 77Engineering 93 27 22 44 36 37Fine Arts 70 20 22 28 20 82Law 38 6 4 28 10 4Public Administration 5 1 4 2 1University College 6 2 4 8 21General Library 27 4 16 7 4 7Research Centers 0 24Extended University 0 33Continuing Education 0 172
Nursing 17 5 6 6 28 21Pharmacy 31 7 16 8 18 18SOM - Basic Medical 46 7 16 23 13 32SOM - Clinical 187 29 42 116 522 89* As of October 31 of each year.1 Faculty are assigned to colleges based on their tenure department, which may not correspond to their primary assignment department. For example, this will often be the case for faculty administrators. 2 Includes ABD faculty hired for the T/TT.
Source: Office of Institutional Research
Units Reporting to the Provost
Units Reporting to the Executive Vice President for the Health Sciences Center
Non-Tenure-Track
FacultyTemporary
FacultyProf.Total T/T-Track
Faculty
Tenure / Tenure-Track Faculty
Faculty by College

2007 - 2008 UNM Fact Book - Page 85
Faculty Administrators, Main Campus and SOM (Fall 2007)*
Asst. Assoc.
College1 Prof. Prof.
Anderson Schools of Mgmt. 1 1Architecture & Planning 4 2 2Arts & Sciences 19 2 17 4Education 8 4 4 3Engineering 9 9Fine Arts 4 1 2 1Law 6 1 1 4 2Public Administration 0 1University College 1 1 1General Library 4 1 3Research Centers 0Extended Univ / Cont Educ 0
Nursing 3 3 1Pharmacy 4 2 2 1SOM - Basic Medical 0SOM - Clinical 1 1* As of October 31 of each year. 1 Faculty are assigned to colleges based on their tenure department, which may not correspond to their primary assignment department. For example, this will often be the case for faculty administrators.
Source: Office of Institutional Research
Units Reporting to the Provost
Units Reporting to the Executive Vice President for the Health Sciences Center
Non-Tenure-Track Faculty
Temporary FacultyProf.
Total T/T-Track Faculty
Tenure / Tenure-Track Faculty
Faculty by College
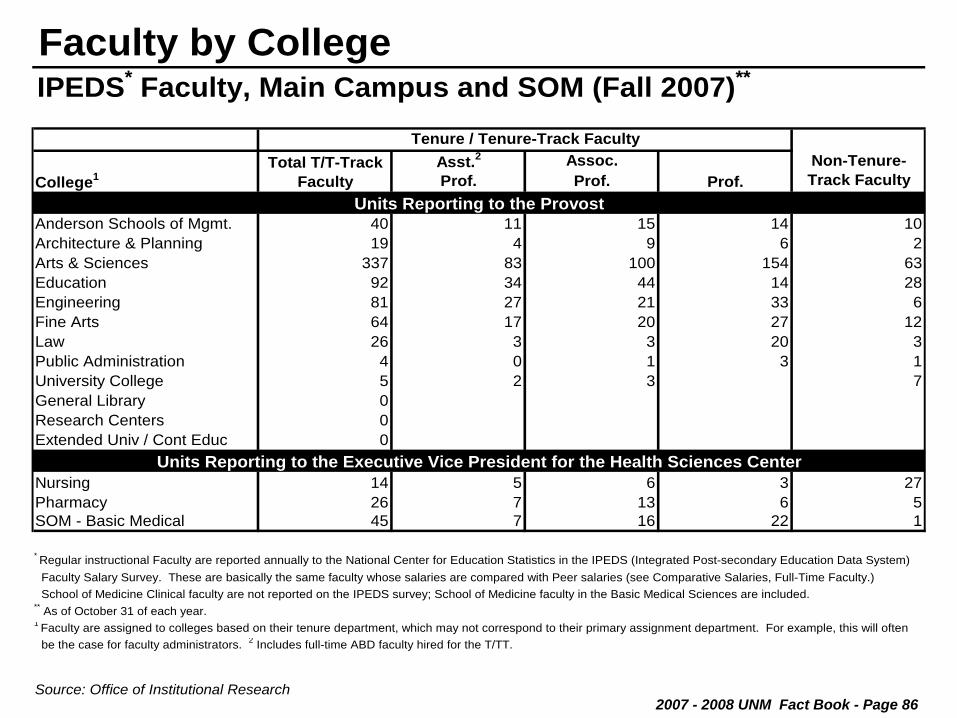
2007 - 2008 UNM Fact Book - Page 86
IPEDS* Faculty, Main Campus and SOM (Fall 2007)**
Asst.2 Assoc.
College1 Prof. Prof.
Anderson Schools of Mgmt. 40 11 15 14 10Architecture & Planning 19 4 9 6 2Arts & Sciences 337 83 100 154 63Education 92 34 44 14 28Engineering 81 27 21 33 6Fine Arts 64 17 20 27 12Law 26 3 3 20 3Public Administration 4 0 1 3 1University College 5 2 3 7General Library 0Research Centers 0Extended Univ / Cont Educ 0
Nursing 14 5 6 3 27Pharmacy 26 7 13 6 5SOM - Basic Medical 45 7 16 22 1
* Regular instructional Faculty are reported annually to the National Center for Education Statistics in the IPEDS (Integrated Post-secondary Education Data System) Faculty Salary Survey. These are basically the same faculty whose salaries are compared with Peer salaries (see Comparative Salaries, Full-Time Faculty.) School of Medicine Clinical faculty are not reported on the IPEDS survey; School of Medicine faculty in the Basic Medical Sciences are included.** As of October 31 of each year.1 Faculty are assigned to colleges based on their tenure department, which may not correspond to their primary assignment department. For example, this will often be the case for faculty administrators. 2 Includes full-time ABD faculty hired for the T/TT.
Source: Office of Institutional Research
Units Reporting to the Provost
Units Reporting to the Executive Vice President for the Health Sciences Center
Non-Tenure-Track FacultyProf.
Total T/T-Track Faculty
Tenure / Tenure-Track Faculty
Faculty by College
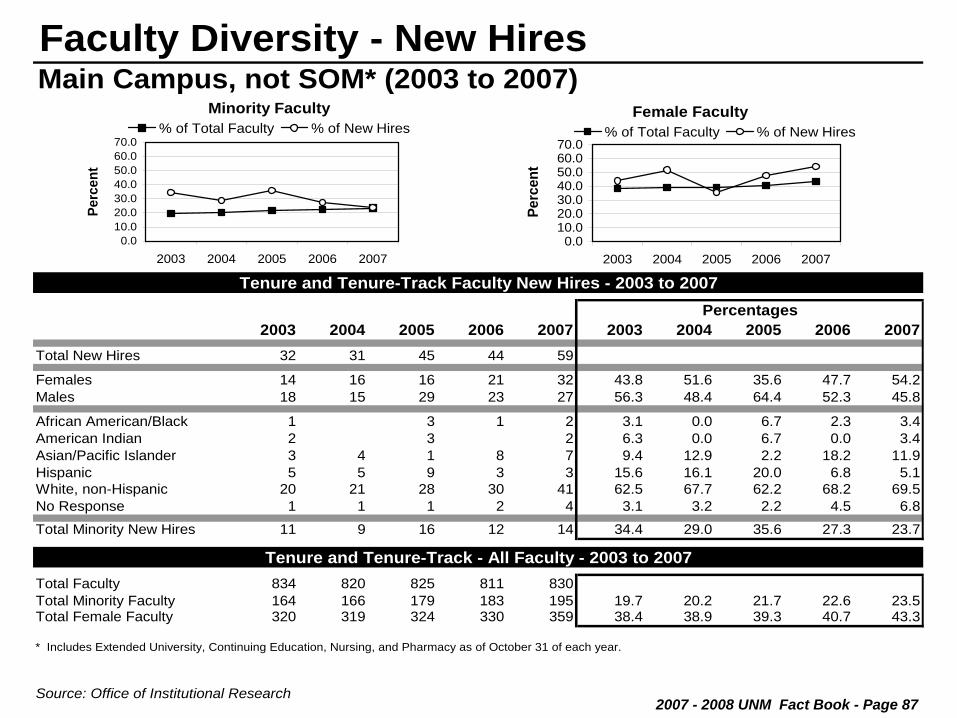
Main Campus, not SOM* (2003 to 2007)
2003 2004 2005 2006 2007 2003 2004 2005 2006 2007Total New Hires 32 31 45 44 59
Females 14 16 16 21 32 43.8 51.6 35.6 47.7 54.2Males 18 15 29 23 27 56.3 48.4 64.4 52.3 45.8
African American/Black 1 3 1 2 3.1 0.0 6.7 2.3 3.4American Indian 2 3 2 6.3 0.0 6.7 0.0 3.4Asian/Pacific Islander 3 4 1 8 7 9.4 12.9 2.2 18.2 11.9Hispanic 5 5 9 3 3 15.6 16.1 20.0 6.8 5.1White, non-Hispanic 20 21 28 30 41 62.5 67.7 62.2 68.2 69.5No Response 1 1 1 2 4 3.1 3.2 2.2 4.5 6.8Total Minority New Hires 11 9 16 12 14 34.4 29.0 35.6 27.3 23.7
Total Faculty 834 820 825 811 830Total Minority Faculty 164 166 179 183 195 19.7 20.2 21.7 22.6 23.5Total Female Faculty 320 319 324 330 359 38.4 38.9 39.3 40.7 43.3
* Includes Extended University, Continuing Education, Nursing, and Pharmacy as of October 31 of each year.
Source: Office of Institutional Research
Tenure and Tenure-Track Faculty New Hires - 2003 to 2007
Tenure and Tenure-Track - All Faculty - 2003 to 2007
Percentages
Faculty Diversity - New HiresMinority Faculty
0.010.020.030.040.050.060.070.0
2003 2004 2005 2006 2007
Perc
ent
% of Total Faculty % of New HiresFemale Faculty
0.010.020.030.040.050.060.070.0
2003 2004 2005 2006 2007
Perc
ent
% of Total Faculty % of New Hires
2007 - 2008 UNM Fact Book - Page 87

Main Campus, not SOM* (2003 to 2007)
2003 2004 2005 2006 2007 2003 2004 2005 2006 2007Total New Hires 26 38 40 33 41
Females 14 16 20 18 21 53.8 42.1 50.0 54.5 51.2Males 12 22 20 15 20 46.2 57.9 50.0 45.5 48.8
African American/Black 2 2 1 0.0 0.0 5.0 6.1 2.4American Indian 2 2 3 2 7.7 5.3 7.5 0.0 4.9Asian/Pacific Islander 1 2 2 1 6 3.8 5.3 5.0 3.0 14.6Hispanic 2 8 2 7 7 7.7 21.1 5.0 21.2 17.1White, non-Hispanic 20 26 30 21 24 76.9 68.4 75.0 63.6 58.5No Response 1 1 2 1 3.8 0.0 2.5 6.1 2.4Total Minority New Hires 5 12 9 10 16 19.2 31.6 22.5 30.3 39.0
Total Faculty 223 261 274 279 293Total Minority Faculty 50 60 56 59 65 22.4 23.0 20.4 21.1 22.2Total Female Faculty 102 120 131 128 141 45.7 46.0 47.8 45.9 48.1
* Includes Extended University, Continuing Education, Nursing, and Pharmacy as of October 31 of each year.
Source: Office of Institutional Research
Non-Tenure-Track Faculty New Hires - 2003 to 2007
Non-Tenure-Track - All Faculty - 2003 to 2007
Percentages
Faculty Diversity - New Hires
Female Faculty
0.010.020.030.040.050.060.070.0
2003 2004 2005 2006 2007
Perc
ent
% of Total Faculty % of New HiresMinority Faculty
0.010.020.030.040.050.060.070.0
2003 2004 2005 2006 2007
Perc
ent
% of Total Faculty % of New Hires
2007 - 2008 UNM Fact Book - Page 88

School of Medicine* (2003 to 2007)
2003 2004 2005 2006 2007 2003 2004 2005 2006 2007Total New Hires 6 13 13 1 6
Females 2 4 5 4 33.3 30.8 38.5 0.0 66.7Males 4 9 8 1 2 66.7 69.2 61.5 100.0 33.3
African American/Black 1 0.0 0.0 7.7 0.0 0.0American Indian 0.0 0.0 0.0 0.0 0.0Asian/Pacific Islander 2 2 2 33.3 15.4 15.4 0.0 0.0Hispanic 1 2 0.0 7.7 0.0 0.0 33.3White, non-Hispanic 4 10 10 1 4 66.7 76.9 76.9 100.0 66.7No Response 0.0 0.0 0.0 0.0 0.0
Total Minority New Hires 2 3 3 0 2 33.3 23.1 23.1 0.0 33.3
Total Faculty 254 251 248 237 233Total Minority Faculty 40 40 43 40 43 15.7 15.9 17.3 16.9 18.5Total Female Faculty 83 84 85 82 81 32.7 33.5 34.3 34.6 34.8
* Includes Basic Medical and Clinical Health Sciences as of October 31 of each year.
Source: Office of Institutional Research
Tenure and Tenure-Track Faculty New Hires - 2003 to 2007
Tenure and Tenure-Track - All Faculty - 2003 to 2007
Percentages
Faculty Diversity - New HiresMinority Faculty
0.010.020.030.040.050.060.070.0
2003 2004 2005 2006 2007
Perc
ent
% of Total Faculty % of New HiresFemale Faculty
0.010.020.030.040.050.060.070.0
2003 2004 2005 2006 2007
Perc
ent
% of Total Faculty % of New Hires
2007 - 2008 UNM Fact Book - Page 89

School of Medicine* (2003 to 2007)
2003 2004 2005 2006 2007 2003 2004 2005 2006 2007Total New Hires 50 46 42 37 58
Females 25 23 21 20 30 50.0 50.0 50.0 54.1 51.7Males 25 23 21 17 28 50.0 50.0 50.0 45.9 48.3
African American/Black 2 2 1 3 1 4.0 4.3 2.4 8.1 1.7American Indian 1 2 1 1 2.0 4.3 2.4 2.7 0.0Asian/Pacific Islander 4 7 7 6 5 8.0 15.2 16.7 16.2 8.6Hispanic 4 5 1 4 6 8.0 10.9 2.4 10.8 10.3White, non-Hispanic 36 30 32 19 43 72.0 65.2 76.2 51.4 74.1No Response 3 4 3 6.0 0.0 0.0 10.8 5.2
Total Minority New Hires 11 16 10 14 12 22.0 34.8 23.8 37.8 20.7
Total Faculty 439 452 459 492 535Total Minority Faculty 89 92 98 106 111 20.3 20.4 21.4 21.5 20.7Total Female Faculty 206 216 223 249 268 46.9 47.8 48.6 50.6 50.1
* Includes Basic Medical and Clinical Health Sciences as of October 31 of each year.
Source: Office of Institutional Research
Non-Tenure-Track Faculty New Hires - 2003 to 2007
Non-Tenure-Track - All Faculty - 2003 to 2007
Percentages
Faculty Diversity - New HiresMinority Faculty
0.010.020.030.040.050.060.070.0
2003 2004 2005 2006 2007
Perc
ent
% of Total Faculty % of New HiresFemale Faculty
0.010.020.030.040.050.060.070.0
2003 2004 2005 2006 2007
Perc
ent
% of Total Faculty % of New Hires
2007 - 2008 UNM Fact Book - Page 90

Staff


Regular Staff (Fall 2003 to 2007)*
Site 2003 2004 2005 2006 2007 2003 2004 2005 2006 2007
Main Campus, not HSC1 2,711 2,853 2,833 2,856 2,826 274 263 261 266 258Health Sciences Center2 1,596 1,588 1,550 1,545 1,615 224 231 221 234 238Total Main Campus 4,307 4,441 4,383 4,401 4,441 498 494 482 500 496
Gallup Branch 126 125 122 115 121 8 12 12 12 13Los Alamos Branch 34 33 35 36 31 9 5 8 5 7Taos Branch 35 34 31 34 35 5 6 5 3 6Valencia Branch 89 87 79 83 88 7 10 7 16 12Total Branch 284 279 267 268 275 29 33 32 36 38
Total Regular Staff 4,591 4,720 4,650 4,669 4,716 527 527 514 536 534
* As of October 31 of each year.1 Includes the Extended University and Continuing Education.2 Includes School of Medicine, College of Nursing, and College of Pharmacy. Does not include UNM Hospital.
Source: Office of Institutional Research
Regular StaffFull-Time Part-Time
UNM Staff by Site
2007 - 2008 UNM Fact Book - Page 91

Temporary Staff (Fall 2003 to 2007)*
Site 2003 2004 2005 2006 2007 2003 2004 2005 2006 2007
Main Campus, not HSC1 409 419 370 335 253 963 998 679 677 637Health Sciences Center2 6 3 4 2 3 675 763 754 739 719Total Main Campus 415 422 374 337 256 1,638 1,761 1,433 1,416 1,356
Gallup Branch 3 2 1 5 7 1Los Alamos Branch 16 14 7 6 6Taos Branch 1 5 5 5 10 7Valencia Branch 5 3 1 1Total Branch 3 2 1 6 7 26 22 12 18 14
Total Temporary Staff 418 424 375 343 263 1,664 1,783 1,445 1,434 1,370
* As of October 31 of each year.1 Includes the Extended University and Continuing Education.2 Includes School of Medicine, College of Nursing, and College of Pharmacy. Does not include UNM Hospital.
Source: Office of Institutional Research
Temporary StaffFull-Time Part-Time
UNM Staff by Site
2007 - 2008 UNM Fact Book - Page 92

2007 - 2008 UNM Fact Book - Page 93
All UNM (Fall 2003 to 2007)*
2003 2004 2005 2006 2007 2003 2004 2005 2006 2007
Regular Staff Total 5,118 5,247 5,164 5,205 5,250
Females 3,373 3,458 3,389 3,447 3,509 65.9 65.9 65.6 66.2 66.8Males 1,745 1,789 1,775 1,758 1,741 34.1 34.1 34.4 33.8 33.2
African American/Black 107 109 98 97 110 2.1 2.1 1.9 1.9 2.1American Indian 285 298 261 256 268 5.6 5.7 5.1 4.9 5.1Asian/Pacific Islander 110 113 120 125 123 2.1 2.2 2.3 2.4 2.3Hispanic 1,698 1,757 1,759 1,767 1,786 33.2 33.5 34.1 33.9 34.0White, non-Hispanic 2,842 2,890 2,839 2,836 2,793 55.5 55.1 55.0 54.5 53.2No Response 76 80 87 124 170 1.5 1.5 1.7 2.4 3.2
2003 2004 2005 2006 2007 2003 2004 2005 2006 2007
Temporary Staff Total 2,082 2,207 1,820 1,777 1,633
Females 1,137 1,254 986 947 901 54.6 56.8 54.2 53.3 55.2Males 945 953 834 830 732 45.4 43.2 45.8 46.7 44.8
African American/Black 57 53 41 35 27 2.7 2.4 2.3 2.0 1.7American Indian 71 69 70 86 63 3.4 3.1 3.8 4.8 3.9Asian/Pacific Islander 25 25 25 17 19 1.2 1.1 1.4 1.0 1.2Hispanic 620 688 541 502 452 29.8 31.2 29.7 28.2 27.7White, non-Hispanic 1,234 1,287 1,077 1,034 961 59.3 58.3 59.2 58.2 58.8No Response 75 85 66 103 111 3.6 3.9 3.6 5.8 6.8*As of October 31 of each year
Source: Office of Institutional Research
Temporary Staff Percentages
Regular StaffPercentages
Staff

2007 - 2008 UNM Fact Book - Page 94
Main Campus, not HSC (Fall 2003 to 2007)*
2003 2004 2005 2006 2007 2003 2004 2005 2006 2007
Regular Staff Total 2,985 3,116 3,094 3,122 3,084
Females 1,715 1,809 1,803 1,828 1,808 57.5 58.1 58.3 58.6 58.6Males 1,270 1,307 1,291 1,294 1,276 42.5 41.9 41.7 41.4 41.4
African American/Black 65 65 58 54 67 2.2 2.1 1.9 1.7 2.2American Indian 125 135 123 125 122 4.2 4.3 4.0 4.0 4.0Asian/Pacific Islander 57 64 71 74 69 1.9 2.1 2.3 2.4 2.2Hispanic 1,042 1,106 1,096 1,089 1,075 34.9 35.5 35.4 34.9 34.9White, non-Hispanic 1,654 1,700 1,691 1,695 1,643 55.4 54.6 54.7 54.3 53.3No Response 42 46 55 85 108 1.4 1.5 1.8 2.7 3.5
2003 2004 2005 2006 2007 2003 2004 2005 2006 2007Temporary Staff Total 1,372 1,417 1,049 1,012 890
Females 771 858 622 588 532 56.2 60.6 59.3 58.1 59.8Males 601 559 427 424 358 43.8 39.4 40.7 41.9 40.2
African American/Black 52 46 33 27 19 3.8 3.2 3.1 2.7 2.1American Indian 53 53 53 66 46 3.9 3.7 5.1 6.5 5.2Asian/Pacific Islander 19 17 17 11 10 1.4 1.2 1.6 1.1 1.1Hispanic 506 550 407 362 308 36.9 38.8 38.8 35.8 34.6White, non-Hispanic 690 696 501 474 454 50.3 49.1 47.8 46.8 51.0No Response 52 55 38 72 53 3.8 3.9 3.6 7.1 6.0*As of October 31 of each year
Source: Office of Institutional Research
Temporary Staff Percentages
Regular StaffPercentages
Staff

2007 - 2008 UNM Fact Book - Page 95
Health Sciences Center (Fall 2003 to 2007)*
2003 2004 2005 2006 2007 2003 2004 2005 2006 2007
Regular Staff Total 1,820 1,819 1,771 1,779 1,853
Females 1,445 1,434 1,391 1,420 1,488 79.4 78.8 78.5 79.8 80.3Males 375 385 380 359 365 20.6 21.2 21.5 20.2 19.7
African American/Black 40 41 36 39 38 2.2 2.3 2.0 2.2 2.1American Indian 89 91 71 69 78 4.9 5.0 4.0 3.9 4.2Asian/Pacific Islander 51 47 47 50 53 2.8 2.6 2.7 2.8 2.9Hispanic 536 537 548 557 584 29.5 29.5 30.9 31.3 31.5White, non-Hispanic 1,078 1,077 1,041 1,030 1,044 59.2 59.2 58.8 57.9 56.3No Response 26 26 28 34 56 1.4 1.4 1.6 1.9 3.0
2003 2004 2005 2006 2007 2003 2004 2005 2006 2007
Temporary Staff Total 681 766 758 741 722
Females 345 377 355 343 353 50.7 49.2 46.8 46.3 48.9Males 336 389 403 398 369 49.3 50.8 53.2 53.7 51.1
African American/Black 5 7 8 8 8 0.7 0.9 1.1 1.1 1.1American Indian 17 16 16 17 13 2.5 2.1 2.1 2.3 1.8Asian/Pacific Islander 6 7 7 6 9 0.9 0.9 0.9 0.8 1.2Hispanic 107 130 129 131 136 15.7 17.0 17.0 17.7 18.8White, non-Hispanic 523 577 570 549 498 76.8 75.3 75.2 74.1 69.0No Response 23 29 28 30 58 3.4 3.8 3.7 4.0 8.0*As of October 31 of each year
Source: Office of Institutional Research
Temporary Staff Percentages
Regular StaffPercentages
Staff

2007 - 2008 UNM Fact Book - Page 96
Total Main Campus (Fall 2003 to 2007)*
2003 2004 2005 2006 2007 2003 2004 2005 2006 2007
Regular Staff Total 4,805 4,935 4,865 4,901 4,937
Females 3,160 3,243 3,194 3,248 3,296 65.8 65.7 65.7 66.3 66.8Males 1,645 1,692 1,671 1,653 1,641 34.2 34.3 34.3 33.7 33.2
African American/Black 105 106 94 93 105 2.2 2.1 1.9 1.9 2.1American Indian 214 226 194 194 200 4.5 4.6 4.0 4.0 4.1Asian/Pacific Islander 108 111 118 124 122 2.2 2.2 2.4 2.5 2.5Hispanic 1,578 1,643 1,644 1,646 1,659 32.8 33.3 33.8 33.6 33.6White, non-Hispanic 2,732 2,777 2,732 2,725 2,687 56.9 56.3 56.2 55.6 54.4No Response 68 72 83 119 164 1.4 1.5 1.7 2.4 3.3
2003 2004 2005 2006 2007 2003 2004 2005 2006 2007
Temporary Staff Total 2,053 2,183 1,807 1,753 1,612
Females 1,116 1,235 977 931 885 54.4 56.6 54.1 53.1 54.9Males 937 948 830 822 727 45.6 43.4 45.9 46.9 45.1
African American/Black 57 53 41 35 27 2.8 2.4 2.3 2.0 1.7American Indian 70 69 69 83 59 3.4 3.2 3.8 4.7 3.7Asian/Pacific Islander 25 24 24 17 19 1.2 1.1 1.3 1.0 1.2Hispanic 613 680 536 493 444 29.9 31.1 29.7 28.1 27.5White, non-Hispanic 1,213 1,273 1,071 1,023 952 59.1 58.3 59.3 58.4 59.1No Response 75 84 66 102 111 3.7 3.8 3.7 5.8 6.9*As of October 31 of each year
Source: Office of Institutional Research
Percentages
Regular StaffPercentages
Temporary Staff
Staff

2007 - 2008 UNM Fact Book - Page 97
Gallup Branch (Fall 2003 to 2007)*
2003 2004 2005 2006 2007 2003 2004 2005 2006 2007
Regular Staff Total 134 137 134 127 134
Females 90 92 87 83 93 67.2 67.2 64.9 65.4 69.4Males 44 45 47 44 41 32.8 32.8 35.1 34.6 30.6
African American/Black 1 1 2 2 3 0.7 0.7 1.5 1.6 2.2American Indian 65 68 63 58 65 48.5 49.6 47.0 45.7 48.5Asian/Pacific Islander Hispanic 30 29 32 31 29 22.4 21.2 23.9 24.4 21.6White, non-Hispanic 35 36 35 33 35 26.1 26.3 26.1 26.0 26.1No Response 3 3 2 3 2 2.2 2.2 1.5 2.4 1.5
2003 2004 2005 2006 2007 2003 2004 2005 2006 2007
Temporary Staff Total 3 2 1 6 7
Females 2 2 3 5 66.7 100.0 50.0 71.4Males 1 1 3 2 33.3 100.0 50.0 28.6
African American/BlackAmerican Indian 1 1 3 3 33.3 100.0 50.0 42.9Asian/Pacific IslanderHispanic 2 28.6White, non-Hispanic 2 2 3 2 66.7 100.0 50.0 28.6No Response *As of October 31 of each year
Source: Office of Institutional Research
Percentages
Regular StaffPercentages
Temporary Staff
Staff
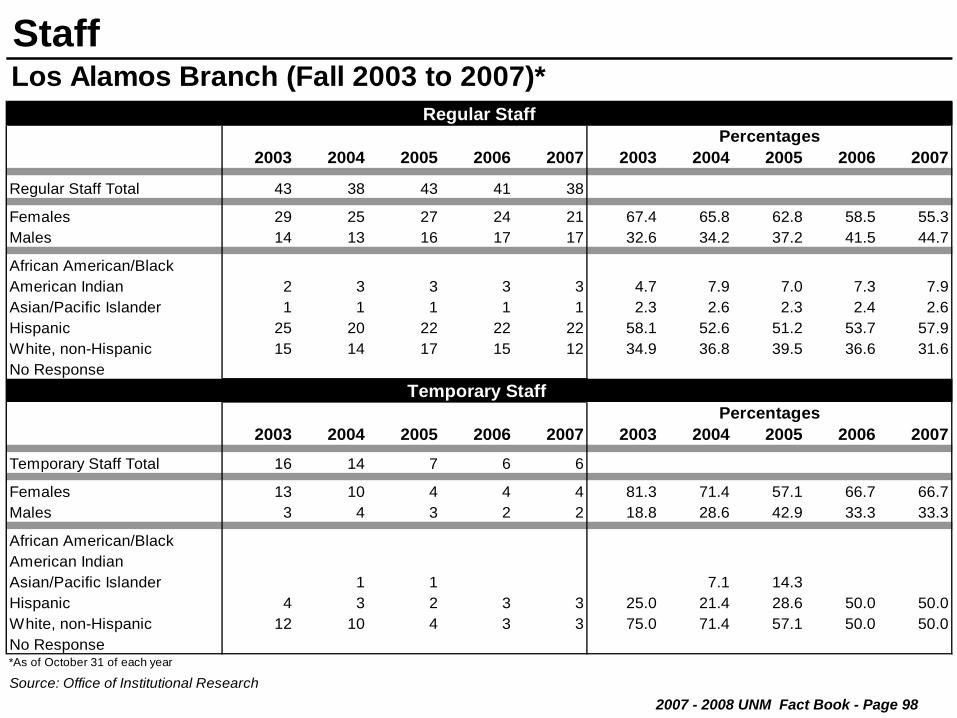
2007 - 2008 UNM Fact Book - Page 98
Los Alamos Branch (Fall 2003 to 2007)*
2003 2004 2005 2006 2007 2003 2004 2005 2006 2007
Regular Staff Total 43 38 43 41 38
Females 29 25 27 24 21 67.4 65.8 62.8 58.5 55.3Males 14 13 16 17 17 32.6 34.2 37.2 41.5 44.7
African American/BlackAmerican Indian 2 3 3 3 3 4.7 7.9 7.0 7.3 7.9Asian/Pacific Islander 1 1 1 1 1 2.3 2.6 2.3 2.4 2.6Hispanic 25 20 22 22 22 58.1 52.6 51.2 53.7 57.9White, non-Hispanic 15 14 17 15 12 34.9 36.8 39.5 36.6 31.6No Response
2003 2004 2005 2006 2007 2003 2004 2005 2006 2007
Temporary Staff Total 16 14 7 6 6
Females 13 10 4 4 4 81.3 71.4 57.1 66.7 66.7Males 3 4 3 2 2 18.8 28.6 42.9 33.3 33.3
African American/BlackAmerican IndianAsian/Pacific Islander 1 1 7.1 14.3Hispanic 4 3 2 3 3 25.0 21.4 28.6 50.0 50.0White, non-Hispanic 12 10 4 3 3 75.0 71.4 57.1 50.0 50.0No Response*As of October 31 of each year
Source: Office of Institutional Research
Percentages
Regular StaffPercentages
Temporary Staff
Staff

2007 - 2008 UNM Fact Book - Page 99
Taos Branch (Fall 2003 to 2007)*
2003 2004 2005 2006 2007 2003 2004 2005 2006 2007
Regular Staff Total 40 40 36 37 41
Females 25 25 22 22 26 62.5 62.5 61.1 59.5 63.4Males 15 15 14 15 15 37.5 37.5 38.9 40.5 36.6
African American/Black 1 1 1 2.5 2.8 2.7American Indian 2 1 5.0 2.5Asian/Pacific IslanderHispanic 25 24 23 22 27 62.5 60.0 63.9 59.5 65.9White, non-Hispanic 10 11 11 14 13 25.0 27.5 30.6 37.8 31.7No Response 3 3 1 1 7.5 7.5 2.8 2.4
2003 2004 2005 2006 2007 2003 2004 2005 2006 2007
Temporary Staff Total 5 5 5 11 7
Females 3 5 5 8 7 60.0 100.0 100.0 72.7 100.0Males 2 3 40.0 27.3
African American/BlackAmerican Indian 1 14.3Asian/Pacific Islander Hispanic 3 5 3 6 3 60.0 100.0 60.0 54.5 42.9White, non-Hispanic 2 2 4 3 40.0 40.0 36.4 42.9No Response 1 9.1*As of October 31 of each year
Source: Office of Institutional Research
Percentages
Regular StaffPercentages
Temporary Staff
Staff

2007 - 2008 UNM Fact Book - Page 100
Valencia Branch (Fall 2003 to 2007)*
2003 2004 2005 2006 2007 2003 2004 2005 2006 2007
Regular Staff Total 96 97 86 99 100
Females 69 73 59 70 73 71.9 75.3 68.6 70.7 73.0Males 27 24 27 29 27 28.1 24.7 31.4 29.3 27.0
African American/Black 1 1 1 1 2 1.0 1.0 1.2 1.0 2.0American Indian 2 1 1 2.1 1.2 1.0Asian/Pacific Islander 1 1 1 1.0 1.0 1.2Hispanic 40 41 38 46 49 41.7 42.3 44.2 46.5 49.0White, non-Hispanic 50 52 44 49 46 52.1 53.6 51.2 49.5 46.0No Response 2 2 1 2 3 2.1 2.1 1.2 2.0 3.0
2003 2004 2005 2006 2007 2003 2004 2005 2006 2007
Temporary Staff Total 5 3 0 1 1
Females 3 2 1 60.0 66.7 100.0Males 2 1 1 40.0 33.3 100.0
African American/BlackAmerican IndianAsian/Pacific IslanderHispanic White, non-Hispanic 5 2 1 1 100.0 66.7 100.0 100.0No Response 1 33.3*As of October 31 of each year
Source: Office of Institutional Research
Percentages
Regular StaffPercentages
Temporary Staff
Staff

2007 - 2008 UNM Fact Book - Page 101
Total Branch (Fall 2003 to 2007)*
2003 2004 2005 2006 2007 2003 2004 2005 2006 2007
Regular Staff Total 313 312 299 304 313
Females 213 215 195 199 213 68.1 68.9 65.2 65.5 68.1Males 100 97 104 105 100 31.9 31.1 34.8 34.5 31.9
African American/Black 2 3 4 4 5 0.6 1.0 1.3 1.3 1.6American Indian 71 72 67 62 68 22.7 23.1 22.4 20.4 21.7Asian/Pacific Islander 2 2 2 1 1 0.6 0.6 0.7 0.3 0.3Hispanic 120 114 115 121 127 38.3 36.5 38.5 39.8 40.6White, non-Hispanic 110 113 107 111 106 35.1 36.2 35.8 36.5 33.9No Response 8 8 4 5 6 2.6 2.6 1.3 1.6 1.9
2003 2004 2005 2006 2007 2003 2004 2005 2006 2007
Temporary Staff Total 29 24 13 24 21
Females 21 19 9 16 16 72.4 79.2 69.2 66.7 76.2Males 8 5 4 8 5 27.6 20.8 30.8 33.3 23.8
African American/BlackAmerican Indian 1 1 3 4 3.4 7.7 12.5 19.0Asian/Pacific Islander 1 1 4.2 7.7Hispanic 7 8 5 9 8 24.1 33.3 38.5 37.5 38.1White, non-Hispanic 21 14 6 11 9 72.4 58.3 46.2 45.8 42.9No Response 1 1 4.2 4.2*As of October 31 of each year
Source: Office of Institutional Research
Percentages
Regular StaffPercentages
Temporary Staff
Staff

2007 - 2008 UNM Fact Book - Page 102
by Site (Fall 2003 to 2007)*
Site 2003 2004 2005 2006 2007 2003 2004 2004 2006 2007
Main Campus, not HSC1 4,062 4,041 3,907 3,750 3,859 2,420 2,391 2,374 2,251 2,384Health Sciences Center2 939 952 906 908 914 297 274 254 241 235Total Main Campus 5,001 4,993 4,813 4,658 4,773 2,717 2,665 2,628 2,492 2,619
Gallup Branch 111 116 99 94 89 110 115 99 93 89Los Alamos Branch 30 19 21 22 16 30 17 19 21 16Taos Branch 44 31 33 31 39 44 31 33 31 38Valencia Branch 90 72 74 79 85 89 70 71 77 83Total Branch 275 238 227 226 229 273 233 222 222 226
Total 5,276 5,231 5,040 4,884 5,002 2,990 2,898 2,850 2,714 2,845
* As of October 31 of each year.1 Includes the Extended University and Continuing Education.2 Includes School of Medicine, College of Nursing, and College of Pharmacy. Does not include UNM Hospital.
Source: Office of Institutional Research
All Student Employees Work Study & Student Employees
Student Employees

2007 - 2008 UNM Fact Book - Page 103
by Site (Fall 2003 to 2007)*
Site 2003 2004 2005 2006 2007 2003 2004 2005 2006 2007
Main Campus, not HSC1 855 876 939 918 903 590 580 524 531 522Health Sciences Center2 15 17 19 18 11 144 159 140 139 137Total Main Campus 870 893 958 936 914 734 739 664 670 659
Gallup Branch 1 1 1Los Alamos Branch 2 1 1 1Taos Branch 1Valencia Branch 1 2 3 2 2Total Branch 2 5 4 3 2 0 0 1 1 1
Total 872 898 962 939 916 734 739 665 671 660
Site 2003 2004 2005 2006 2007 2003 2004 2005 2006 2007
Main Campus, not HSC1 197 194 70 50 50Health Sciences Center2 1 1 1 482 501 493 509 531Total Main Campus 198 195 70 51 50 482 501 493 509 531
* As of October 31 of each year.1 Includes the Extended University and Continuing Education.2 Includes School of Medicine, College of Nursing, and College of Pharmacy. Does not include UNM Hospital.3 These are students, primarily in Education programs, who are paid by their employer to go to school and who are run through the payroll system as student employees.
Source: Office of Institutional Research
Graduate & Teaching Assistants Research & Project Assistants
Grants/Fellows/Stipends3 Resident Physicians
Student Employees

2007 - 2008 UNM Fact Book - Page 104

Faculty Scholarship, Research & Libraries


2007 - 2008 UNM Fact Book - Page 105
UNM (Including HSC and Branches), 1997-1998 to 2006-2007
Number of Number Average FulbrightAcademic Faculty with of Award Scholars
Year Sponsored Awards 1 Awards 1 Amount 1 from UNM 2
1997-1998 687 1,279 $137,451 41998-1999 653 1,330 $164,361 31999-2000 691 1,500 $144,933 32000-2001 702 1,502 $154,460 52001-2002 654 1,507 $164,322 32002-2003 681 1,607 $159,134 42003-2004 709 1,622 $171,641 12004-2005 625 1,507 $196,019 42005-2006 640 1,832 $162,984 32006-2007 627 1,655 $176,168 8
Scholarly Papers and Articles 1,355Books 74Book Chapters 164Reviews 67Creative Works 102Patented Works 11
Sources: 1 Office of the Vice President for Research and Economic Development; 2 International Programs & Studies
Faculty Research and Scholarship
Publications and Creative Works (2006) 1
Faculty Scholarship

2007 - 2008 UNM Fact Book - Page 106
College of EducationSchool of Architecture & Planning Center for Family and Community Partnerships 277-9382Design & Planning Assistance Center (DPAC) 277-8526 Family Development Program 277-5800Resource Center for Raza Planning (RCRP) 277-8526 Institute for American Indian Education 277-0577
Institute for Professional Development 277-1999College of Arts & Sciences Latin American Programs in Education 277-4972Alfonso Ortiz Center for Intercultural Studies 277-2251 Multicultural Education Center 277-7768Albuquerque Teachers' Institute 277-5027 New Mexico Research & Study Council 277-2621Center for Advanced Studies 277-8602Center for Environmental/Infomatics and Art (CERIA) 277-1360Center for Rapid Environmental Assessment 277-2644 School of Engineering
and Terrain Evaluation (CREATE) Alliance for Transportation Research Institute (ATR) 246-6410Center for Research in Ecological Science & Technology 277-2551 Center for Biomedical Engineering (BCME) 277-6395
(CREST) Center for Nuclear Non-proliferation Science and Tech.(CN2ST) 277-5431Center for Science, Technology and Policy (CSTP) 277-3115 Institute for Space & Nuclear Power Studies (ISNPS) 277-5442Center for the Southwest 277-7688 Manufacturing Training & Technology Center (MTTC) 272-7150Consortium of the Americas for Interdisciplinary Science 277-0848Earth Data Analysis Center (EDAC) 277-3622 College of Fine ArtsFeminist Research Institute 277-1198 Tamarind Institute 277-3901Institute for American Indian Research (IfAIR) 277-1753Institute for Astrophysics 277-2616 School of LawInstitute for Medieval Studies 277-2252 American Indian Law Center, Inc. (an independent corporation 277-5462Institute for Meteoritics 277-1644 with close ties to the School of Law)Institute for Public Policy 277-1099 Institute of Public Law: 277-5006Institute for Social Research 277-4257 Center for Wildlife LawInternational Studies Institute 277-3833 Corinne Wolfe Children's Law CenterNew Mexico Center for Particle Physics 277-2616 Government Regulation CenterOffice of Contract Archeology 277-5853 Rozier E. Sanchez Judicial Education Center of NMPeace Studies 277-5564 Transportation Safety Law CenterResource Geographic Information System (RGIS) 277-3622 Utton Transboundary Resources Center 277-7809
Main Campus
UNM Centers & Institutes* 2007-2008
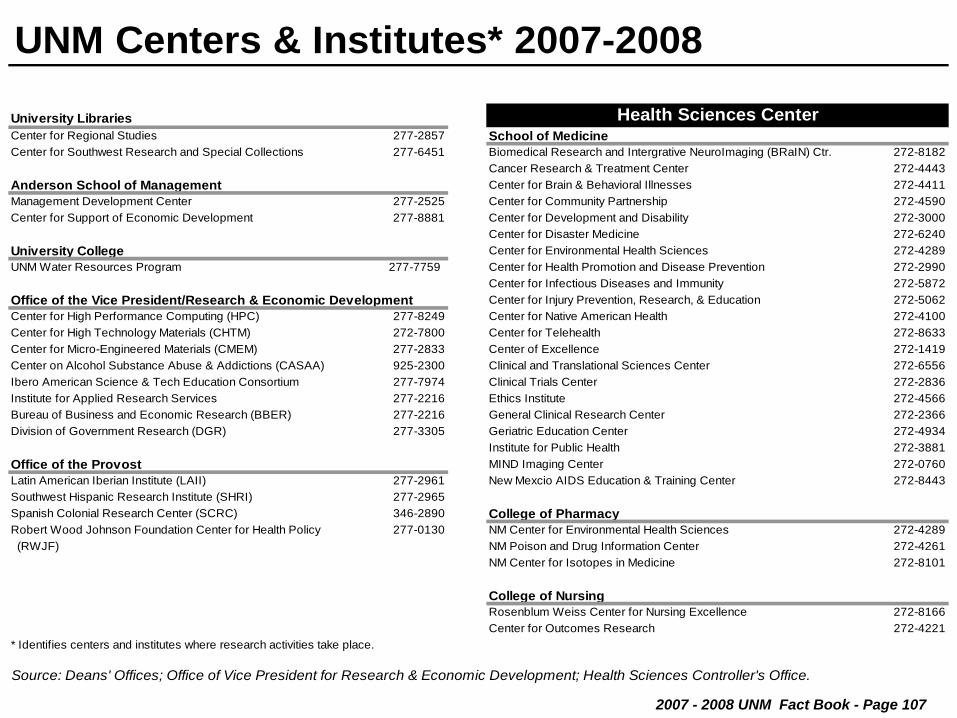
2007 - 2008 UNM Fact Book - Page 107
University LibrariesCenter for Regional Studies 277-2857 School of MedicineCenter for Southwest Research and Special Collections 277-6451 Biomedical Research and Intergrative NeuroImaging (BRaIN) Ctr. 272-8182
Cancer Research & Treatment Center 272-4443Anderson School of Management Center for Brain & Behavioral Illnesses 272-4411Management Development Center 277-2525 Center for Community Partnership 272-4590Center for Support of Economic Development 277-8881 Center for Development and Disability 272-3000
Center for Disaster Medicine 272-6240University College Center for Environmental Health Sciences 272-4289UNM Water Resources Program 277-7759 Center for Health Promotion and Disease Prevention 272-2990
Center for Infectious Diseases and Immunity 272-5872Office of the Vice President/Research & Economic Development Center for Injury Prevention, Research, & Education 272-5062Center for High Performance Computing (HPC) 277-8249 Center for Native American Health 272-4100Center for High Technology Materials (CHTM) 272-7800 Center for Telehealth 272-8633Center for Micro-Engineered Materials (CMEM) 277-2833 Center of Excellence 272-1419Center on Alcohol Substance Abuse & Addictions (CASAA) 925-2300 Clinical and Translational Sciences Center 272-6556Ibero American Science & Tech Education Consortium 277-7974 Clinical Trials Center 272-2836Institute for Applied Research Services 277-2216 Ethics Institute 272-4566Bureau of Business and Economic Research (BBER) 277-2216 General Clinical Research Center 272-2366Division of Government Research (DGR) 277-3305 Geriatric Education Center 272-4934
Institute for Public Health 272-3881Office of the Provost MIND Imaging Center 272-0760Latin American Iberian Institute (LAII) 277-2961 New Mexcio AIDS Education & Training Center 272-8443Southwest Hispanic Research Institute (SHRI) 277-2965Spanish Colonial Research Center (SCRC) 346-2890 College of PharmacyRobert Wood Johnson Foundation Center for Health Policy 277-0130 NM Center for Environmental Health Sciences 272-4289 (RWJF) NM Poison and Drug Information Center 272-4261
NM Center for Isotopes in Medicine 272-8101
College of NursingRosenblum Weiss Center for Nursing Excellence 272-8166Center for Outcomes Research 272-4221
* Identifies centers and institutes where research activities take place.
Source: Deans' Offices; Office of Vice President for Research & Economic Development; Health Sciences Controller's Office.
Health Sciences Center
UNM Centers & Institutes* 2007-2008

2007 - 2008 UNM Fact Book - Page 108
UNM Total* (FY 2007)Contract & Grant Awards
Source of Funds Amt. (in mil.)Foundations $21.0National Labs $6.4Industry $23.2Other $16.8State of New Mexico $61.7Federal Agencies $151.0
Total $280.1
Units Awarded Amt. (in mil.)UNM Centers (Category II) $1.9College of Education $4.2Branches $5.4UNM Centers (Category III) $14.8School of Engineering $17.0Other $29.3College of Arts & Sciences $32.4Financial Aid $51.8Health Sciences Center $123.30
Total $280.1
Source: Office of the Vice President for Research and Economic Development
Contract & Grant Awards
Awards by Unit
Health Sciences Center44.0%
Financial Aid18.5%
College of Arts & Sciences
11.6%
Other10.5%
UNM Centers (Category II)
0.7%
School of Engineering
6.1%
UNM Centers (Category III)
5.3%
College of Education
1.5%
Branches1.9%
Source of Funds
National Labs2.3%
Federal Agencies
53.9%
State of New Mexico22.0%
Industry8.3%
Other6.0%
Foundations7.5%
*Includes Main, HSC, Branches, Extended University, and Continuing Education.

2007 - 2008 UNM Fact Book - Page 109
UNM Total** (FY 1995 to FY 2007)
PublicFY Research Service Instruction
1995 $84.4 $62.5 $11.51996 $69.2 $68.7 $10.71997 $67.8 $71.7 $9.91998 $74.3 $68.1 $10.01999 $73.5 $73.9 $11.42000 $86.8 $61.8 $11.52001 $96.5 $83.0 $13.22002 $88.1 $73.5 $14.52003 $90.5 $68.4 $15.02004 $97.1 $68.0 $16.42005 $105.3 $54.6 $16.72006 $110.4 $49.7 $13.82007 $105.3 $46.5 $13.4
* Direct costs only. Does not include state or federal student financial aid.**Includes Main, HSC, Branches, Extended University, and Continuing Education.
Source: Office of the Vice President for Research and Economic Development
Contract & Grant Expenditures(In millions)
Contract & Grant Expenditures*
Contract & Grant ExpendituresFY 1995 to FY 2007
$0$20$40$60$80
$100$120$140$160$180$200
1995
1996
1997
1998
1999
2000
2001
2002
2003
2004
2005
2006
2007
Year
Expe
nditu
res
(in
mill
ions
)
Research Public Service Instruction

2007 - 2008 UNM Fact Book - Page 110
Fiscal Years 2002-2003 to 2006-2007
2002-03 2003-04 2004-05 2005-06 2006-07Issued U.S. Patents 28 19 15 13 11License/Option Agreements 9 16 18 30 25Start-up Companies 1 3 5 7 8Venture Capital Visits to STC - 52 52 73 93
Source: Science & Technology Corporation @ UNM
Totals for Each Fiscal Year
Economic Development Contributions
0102030405060708090
100
2002-03 2003-04 2004-05 2005-06 2006-07
Fiscal Year
Issued U.S. Patents
License/Option Agreements
Start-up Companies
Venture Capital Visits to STC
Patents, License/Option Agreements, Start-ups & Venture Capital Visits

• ITS supports, monitors and manages the UNM voice and data networks, compute and storage resources.• ITS supports and manages computing environments and services such as WebCT, Portal, computer pods, departmental software
purchasing, hardware maintenance, course evaluation and test scoring.•
Finance, as well as Hyperion reporting, Degree Audit and other non-Banner applications.• ITS provides and manages UNM NetID authenticated access to the systems above, as well as email, Web services and Internet.
Mission
% Change from FY 2006
10% Seven Pods and 11 classrooms (481 Windows and Macintosh computers)168% FastInfo (web service): 395,282; Walk-in, telephone contacts: 93,588
8% 69,835 computer / email accounts for individuals and groups30% 335 server-class units20% 1,533,000,000/year, 200,000 average/day into UNM (additional 4,000,000 spam/day removed) 0%
11% 1,202,000 average daily hits45% 76 terabytesN/A
12%2% 460,000 pages scanned for test scoring, faculty evaluations, surveys, questionnaires
10% 20,000 phone lines, with the addition of the Richardson Hospital Pavillion-13% 243, down from 280, including regular, Project LINK, student, term and temp staff
Source: 2007 Annual Report, Office of the Chief Information Officer (CIO)
Campus Computing Facilities
ITS Statistical Overview for Fiscal Year 2007
23 site-license/volume contracts to sell Microsoft, Adobe, SAS and other software at >50% savings over Bookstore, ~80% savings over suggested retail to UNM Depts
ServersNetIDsITS Support Ctr Client Assists
ScanningVoice NetworkStaff
Disk SpaceSoftware Sales to Departments
Business Functions 46 functions supported across Finance, Student, Financial Aid, Payroll and other applications
Mail Messages/DayInternet Bandwidth 463Mbps (megabits per second)UNM Web Hits
The mission of ITS is to provide leadership for the effective use of information technologies to achieve the University of New Mexico’s vision and mission in education, research, and public service, and to support the effective management and administration of those functions.
Information Technology ServicesCIO : Computing Services : Communications Network Services Information Technology Services under Barney Maccabe, Interim CIO, is responsible for the University of New Mexico’s enterprise computer and networking systems used by students, staff, and faculty.
ITS supports Banner applications such as Student Admissions, Registration, Financial Aid, Human Resources, Payroll, and
ITS Web Sites: cio.unm.edu its.unm.edu fastinfo.unm.edu my.unm.edu
2007 - 2008 UNM Fact Book - Page 111

2007 - 2008 UNM Fact Book - Page 112
CollectionsUniversity Libraries Law Health
Sciences Other Total
Volumes added during 2006-07 44,696 1,665 1,338 0 47,699Volumes in Library 2,192,349 235,592 162,384 84,757 2,675,082Serials Received 19,243 3,281 1,790 9 24,323Electronic Books 173,122 NA 99 0 173,221Electronic Journals 62,818 860 1,616 0 65,294Microform Units 3,800,531 908,386 1 0 4,708,918Government Documents 655,766 0 0 163 655,929Manuscripts and Archives (linear ft.) 13,577 0 1,827 0 15,404Cartographic 220,460 0 0 75 220,535Audio, Film and Video 30,554 0 3,454 1,688 35,696
Source: UNM Libraries
UNM Main Campus Libraries
2006-2007 Library Statistics
UNM Main Campus (Albuquerque) libraries include the University Libraries, the Health Sciences Library & Informatics Center (HSLIC), and the Law Library, representing three administratively distinct organizations. The University Libraries encompass four libraries:
* Zimmerman Library * Centennial Science and Engineering Library * Parish Memorial Library * Fine Arts & Design Library
University Libraries is comparable to a non-departmentalized college within the University and is administered by the Dean of University Libraries who reports to the Provost and Executive VP for Academic Affairs. HSLIC reports to the Executive VP for Health Sciences. The Law Library reports to the Dean of the School of Law.
Other libraries (Other) include the following main campus libraries: Bunting Visual Resources Library, Tireman Learning Materials Library, and the Native American Studies Center Library.

2007 - 2008 UNM Fact Book - Page 113
Services General LawHealth
Sciences Other Total
Service hours (number of hours library is open per week) 100 96 95 45 336Gate count (number of persons entering/exiting library) 1,200,000 NA NA NA 1,200,000Number of Reference Transactions 40,629 3,975 8,530 5,694 58,828Total Number of Circulations 269,865 9,999 10,006 34,133 324,003Interlibrary Loan Requests Received from other Libraries 20,795 268 1,932 0 22,995Interlibrary Loan Requests Sent to other Libraries 20,383 377 2,780 0 23,540
Facilities
Number of patron PC workstations 360 64 138 NA 562Network ports available to patrons 100 150 200 NA 450
YearUNM
Ranking*Total
Ranked
1998-99 55 1111999-00 57 1122000-01 58 1132001-02 66 1142002-03 62 1132003-04 69 1132004-05 86 1132005-06 79 113
* where 1 is the highest rank
Source: UNM Libraries
UNM Main Campus Libraries
ARL Library RankingThe UNM main campus libraries represent the largest academic collections in the state. Materials are collected in a wide variety of formats in addition to books and journals— including electronic journals and books, manuscripts, recordings, and photographs among others. Access to our collections and the collections of other libraries in the state is available on-line via the LIBROS electronic catalog. The LIBROS catalog is hosted by the University Libraries for the state, serving 25 academic and special library collections in New Mexico. Instruction on research strategies and use of library resources is provided for faculty, students, and staff through formal classes and one-on-one instruction. UNM Libraries is the only library system in the state that maintains membership in the Association of Research Libraries (ARL) . UNM holds membership in the largest information scientific and technology consortium in America—the Alliance for Innovation in Science and Technology Information. The University Libraries is also a Federal Depository, an Official Patent and Trademark Library, and houses the Map and Geographic Information Center. The libraries' lending network includes the OCLC (network of 41,555 libraries in 112 countries), the Greater Western Library Alliance (31 libraries), the National Network of Libraries of Medicine (5,432 libraries)—a program of the National Library of Medicine, and the Amigos network (754 libraries).

2007 - 2008 UNM Fact Book - Page 114

Finance & Resource Data

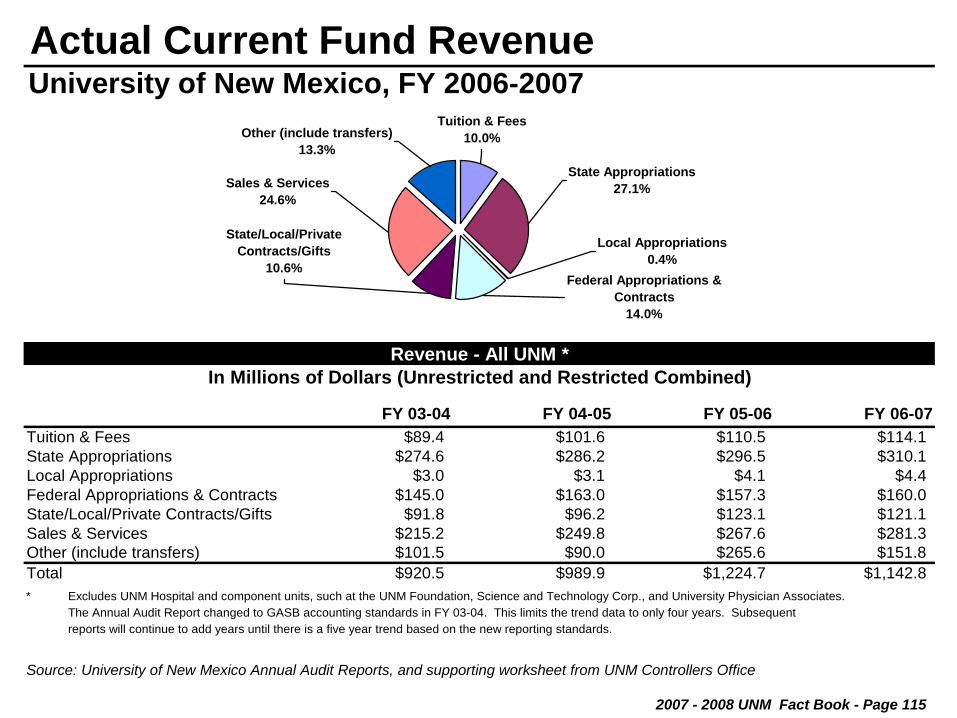
2007 - 2008 UNM Fact Book - Page 115
University of New Mexico, FY 2006-2007
FY 03-04 FY 04-05 FY 05-06 FY 06-07Tuition & Fees $89.4 $101.6 $110.5 $114.1State Appropriations $274.6 $286.2 $296.5 $310.1Local Appropriations $3.0 $3.1 $4.1 $4.4Federal Appropriations & Contracts $145.0 $163.0 $157.3 $160.0State/Local/Private Contracts/Gifts $91.8 $96.2 $123.1 $121.1Sales & Services $215.2 $249.8 $267.6 $281.3Other (include transfers) $101.5 $90.0 $265.6 $151.8Total $920.5 $989.9 $1,224.7 $1,142.8*
The Annual Audit Report changed to GASB accounting standards in FY 03-04. This limits the trend data to only four years. Subsequentreports will continue to add years until there is a five year trend based on the new reporting standards.
Source: University of New Mexico Annual Audit Reports, and supporting worksheet from UNM Controllers Office
Actual Current Fund Revenue
Revenue - All UNM *In Millions of Dollars (Unrestricted and Restricted Combined)
Excludes UNM Hospital and component units, such at the UNM Foundation, Science and Technology Corp., and University Physician Associates.
Federal Appropriations & Contracts
14.0%
State/Local/Private Contracts/Gifts
10.6%
Sales & Services24.6%
Other (include transfers)13.3%
Tuition & Fees10.0%
State Appropriations27.1%
Local Appropriations0.4%

2007 - 2008 UNM Fact Book - Page 116
University of New Mexico, FY 2006-2007
FY 03-04 FY 04-05 FY 05-06 FY 06-07Instruction $179.2 $187.7 $196.3 $208.6Instructional Support $125.3 $149.7 $155.3 $163.8Research $149.7 $142.1 $142.5 $141.8Public Service $202.2 $227.3 $235.6 $253.7Student Aid $65.7 $68.4 $68.5 $73.8Other University/Independent Ops $139.7 $146.2 $147.8 $156.6Plant (all budgeted at Main) $102.4 $96.3 $124.9 $148.5Total $964.2 $1,017.7 $1,070.9 $1,146.8*
The Annual Audit Report changed to GASB accounting standards in FY 03-04. This limits the trend data to only four years. Subsequentreports will continue to add years until there is a five year trend based on the new reporting standards.
Source: University of New Mexico Annual Audit Reports, and supporting worksheet from UNM Controllers Office
Actual Current Fund Expenditures
Expenditures - All UNM *In Millions of Dollars (Unrestricted and Restricted Combined)
Excludes UNM Hospital and component units, such at the UNM Foundation, Science and Technology Corp., and University Physician Associates.
Research12.4%
Instructional Support14.3%
Instruction18.2%Plant (all budgeted at Main)
12.9%
Other University/Independent Ops
13.7%
Student Aid6.4%
Public Service22.1%

All UNM Units Combined, 2004-2005 to 2006-2007
FinancialAid Year Source of Aid Grant Scholarship Job* Loan Total
2004-2005 Federal $26,199,133 $901,317 $2,253,658 $77,582,482 $106,936,588State $3,404,359 $19,333,678 $2,249,699 $398,683 $25,386,418Institutional $9,491,260 $27,000 $9,518,260Private $4,804,011 $308,708 $5,112,718Total $29,603,491 $34,530,266 $4,503,356 $78,316,872 $146,953,985
2005-2006 Federal $24,091,103 $1,007,219 $2,311,487 $76,200,199 $103,610,009State $4,198,370 $21,641,972 $2,191,876 $287,300 $28,319,519Institutional $11,191,881 $29,500 $11,221,381Private $4,771,532 $1,054,951 $5,826,483Total $28,289,473 $38,612,604 $4,503,363 $77,571,950 $148,977,391
2006-2007 Federal $23,870,536 $941,076 $2,417,036 $79,183,123 $106,411,772State $3,360,383 $25,656,039 $2,008,098 $158,000 $31,182,520Institutional $1,405,921 $19,882,141 $17,000 $21,305,062Private $5,220,794 $974,353 $6,195,147Total $28,636,840 $51,700,049 $4,425,135 $80,332,476 $165,094,500
* Jobs include Work Study, but do not include Institutional Student Employment.
Source: FAM Extract Files, Office of Institutional Research
Type of Aid
Financial Aid by Source and Type of Aid
Type of Financial Aid by Source2006-2007
$0
$15,000,000
$30,000,000
$45,000,000
$60,000,000
$75,000,000
$90,000,000
Grant Scholarship Job* Loan
PrivateInstitutionalStateFederal
2007 - 2008 UNM Fact Book - Page 117

2007 - 2008 UNM Fact Book - Page 118
Fall 2006 Financial Aid Recipients
Gallup Los Alamos Taos ValenciaEthnicity Main Campus* Branch Campus Branch Campus Branch Campus Branch Campus
African American/Black 78.4% 53.8% 33.3% 33.3% 38.9%American Indian 80.1% 58.9% 47.3% 65.2% 71.1%Asian/Pacific Islander 67.9% 33.3% 18.2% 28.6% 55.0%Hispanic 74.9% 45.0% 48.2% 43.3% 71.5%White, non-Hispanic 66.2% 29.2% 27.1% 18.7% 57.4%International 66.7% 23.8% 10.0% - 20.0%No Response 61.4% 22.7% 24.3% 29.0% 39.0%Total 69.9% 53.6% 36.1% 34.2% 64.9%
Sex
Female 71.9% 57.5% 37.6% 37.3% 67.8%Male 67.1% 45.4% 33.6% 27.4% 58.6%Total 69.9% 53.6% 36.1% 34.2% 64.9%
Level
Year 1: Freshman 86.4% 65.9% 58.3% 59.9% 73.5%Year 2: Sophomore 79.3% 70.4% 40.0% 72.6% 73.3%Year 3: Junior 77.0% - - - -Year 4: Senior 70.6% - - - -Non-Degree 9.0% 3.1% 19.0% 1.5% 24.7%Masters 50.0% - - - -Professional/Doctoral 64.7% - - - -Total 69.9% 53.6% 36.1% 34.2% 64.9%
* Includes School of Medicine and Extended University.
Source: Fall 21-day enrollment files maintained by the Registrar's Office and UNM FAM Financial Aid Data for 2006-2007
Financial Aid by Ethnicity, Sex, and LevelPercentage of Students Receiving Financial Aid
Financial Aid

2007 - 2008 UNM Fact Book - Page 119
All UNM Units Combined, 2002-2003 to 2006-2007 Academic Years
Scholarship 02-03 03-04 04-05 05-06 06-07 02-03 03-04 04-05 05-06 06-07
Regents Scholars $9,728 $9,971 $10,673 $11,648 $11,926 60 57 58 58 63Presidential $4,217 $4,635 $4,915 $5,293 $5,913 412 413 427 425 463UNM Scholars $3,000 $3,240 $3,649 $3,944 $4,599 524 511 468 484 486NM Scholars $3,687 $3,855 $4,409 $4,616 $5,153 116 130 82 88 59Amigo 2 $576 $446 $460 $456 $466 412 425 417 435 385Bridge to Success 3 $999 $1,000 $1,000 $1,000 $1,000 2,067 2,260 2,342 2,368 2,301Success (Lottery) Scholarships $1,882 $1,970 $2,271 $2,480 $2,597 6,060 6,789 7,264 7,654 8,105Other Scholarships 4 $2,753 $1,926 $1,712 $1,824 $2,518 8,290 6,427 7,495 7,810 10,407
Scholarship 02-03 03-04 04-05 05-06 06-07 02-03 03-04 04-05 05-06 06-07
Regents Scholars 31.5 29.2 29.7 29.8 30.0 4.0 4.0 4.0 4.0 4.0Presidential 27.3 28.0 28.0 28.3 27.3 3.9 4.0 4.0 4.0 4.0UNM Scholars 26.1 26.5 26.6 27.1 26.4 3.9 3.9 3.9 3.9 3.9NM Scholars 24.4 24.9 NA 5 25.7 23.0 3.7 3.7 NA 5 3.6 4.0Amigo 25.7 25.3 25.8 26.4 26.1 3.7 3.7 3.7 3.7 3.7Bridge to Success 20.9 20.8 20.9 20.9 21.1 3.3 3.3 3.3 3.3 3.3Success (Lottery) Scholarships 21.8 21.7 22.0 22.1 22.1 3.4 3.4 3.4 3.4 3.4Other Scholarships 21.8 21.4 21.7 21.6 21.6 3.4 3.4 3.5 3.4 3.41 Average award is less than the typical full-year award due to some attrition in the spring semester.2 The Amigo Award is for non-residents, and also provides in-state instead of out-of-state tuition rates.3 The low number of Bridge to Success recipients in 2001-2002 was due to a one-time change in scholarship requirements for fall 2001.4 The other Scholarship category includes athletic awards, departmental awards, and third-party awards from outside of UNM.5 NM Scholars program awards not granted to first-time freshmen in 2004-2005.
Source: FAM Data Extracts and Institutional Research's Freshman Cohort Tracking Database
Scholarships
Average Entering ACT Score Average Entering High School GPA
Scholarship Awards - All Recipients CombinedAverage Amount of Award Paid1 Number of Scholarship Recipients
Preparation of Incoming Freshman Scholarship Recipients

2007 - 2008 UNM Fact Book - Page 120
Main Campus (2001-2002 to 2007-2008)
Year Resident Non-Resident Resident Non-Resident
01-02 $3,026 $11,424 $3,341 $11,77702-03 $3,169 $11,436 $3,485 $11,77703-04 $3,313 $11,954 $3,643 $12,31104-05 $3,738 $12,500 $4,110 $12,85105-06 $4,109 $13,438 $4,517 $13,81406-07 $4,335 $14,177 $4,765 $14,57407-08 $4,571 $14,942 $5,023 $15,361.
% Increase Since 01-02 51.1% 30.8% 50.3% 30.4%
Year Resident Non-Resident Resident Non-Resident Resident Non-Resident Resident Non-Resident
01-02 $5,544 $18,559 $5,114 $18,049 $9,105 $25,843 $3,341 $11,77702-03 $6,098 $18,559 $5,334 $18,049 $9,466 $27,135 $3,485 $11,77703-04 $6,708 $19,400 $5,576 $18,866 $10,413 $29,849 $3,643 $12,31104-05 $7,567 $19,901 $6,290 $19,400 $11,975 $34,326 $4,110 $12,85105-06 $8,816 $21,394 $6,913 $20,856 $12,893 $37,072 $5,717 $15,01406-07 $9,566 $23,213 $11,159 $25,868 $13,331 $38,194 $6,031 $15,84007-08 $10,561 $24,467 $11,552 $27,056 $13,995 $40,101 $6,358 $16,696
% Increase Since 01-02 90.5% 31.8% 125.9% 49.9% 53.7% 55.2% 90.3% 41.8%
*Fall & Spring Semesters** Anderson Graduate School of Management's tuition was increased differentially starting in 2005-2006
Source: UNM Budget Office
AGSM**
Full-Time Tuition & Fees*
Medicine
Undergraduate Graduate
Law PharmD.
Full-Time ResidentUndergraduate Tuition and Fees
Main Campus
$1,000
$1,500
$2,000
$2,500
$3,000
$3,500
$4,000
$4,500
$5,000
01-0
2
02-0
3
03-0
4
04-0
5
05-0
6
06-0
7
07-0
8
Tuiti
on a
nd F
ees

Branch Campuses (2001-2002 to 2007-2008)
Non- Non- Non- Non-Year Resident Resident Resident Resident Resident Resident Resident Resident
2001-2002 $960 $1,608 $816 $2,280 $912 $2,016 $912 $2,2562002-2003 $960 $1,608 $816 $2,280 $912 $2,016 $912 $2,2562003-2004 $1,032 $2,088 $864 $2,424 $960 $2,136 $984 $3,0962004-2005 $1,104 $2,256 $924 $2,580 $1,032 $2,304 $1,056 $3,0962005-2006 $1,200 $3,048 $1,152 $3,132 $1,272 $3,000 $1,152 $3,0962006-2007 $1,344 $3,096 $1,176 $3,228 $1,320 $3,120 $1,248 $3,3362007-2008 $1,438 $3,190 $1,200 $3,228 $1,344 $3,192 $1,248 $3,336
% Increase Since 01-02 49.8% 98.4% 47.1% 41.6% 47.4% 58.3% 36.8% 47.9%
Source: UNM Budget Office
Full-Time Tuition & Fees*
Valencia BranchTaos Branch
* Fall & Spring Semesters
Gallup Branch Los Alamos Branch
Full-Time Resident UndergraduateTuition and Fees Per Academic Year
$0
$300
$600
$900
$1,200
$1,500
01-02 02-03 03-04 04-05 05-06 06-07 07-08
Tuiti
on a
nd F
ees
Gallup Branch
Los Alamos Branch
Taos Branch
Valencia Branch
2007 - 2008 UNM Fact Book - Page 121

2007 - 2008 UNM Fact Book - Page 122
Main Campus (Fall 2001-2006)
Rank 2001 2002 2003 2004 2005 2006UNM Avg. Salary Professor $79,000 $79,900 $82,900 $87,800 $89,800 $92,600
Assoc. Professor $58,400 $58,900 $61,400 $62,800 $64,900 $68,200Asst. Professor $50,300 $51,200 $52,800 $56,100 $57,600 $60,700All Ranks $64,434 $65,313 $68,090 $71,755 $73,269 $76,112
UNM % of Peers Professor 89.7% 88.8% 89.9% 91.8% 89.8% 88.5%Assoc. Professor 94.2% 92.8% 95.1% 93.4% 92.4% 92.6%Asst. Professor 94.5% 93.3% 94.0% 95.4% 93.7% 94.0%All Ranks** 92.0% 90.9% 92.1% 92.9% 91.3% 90.8%
* Excludes Medical School faculty, except for Basic Medical Sciences. Includes Pharmacy and Nursing faculty.** Peer average salaries for all ranks combined are weighted by UNM's faculty rank distribution.
University of Arizona University of Oklahoma, NormanUniversity of Arkansas, Fayetteville University of OregonUniversity of Colorado, Boulder University of South Carolina, ColumbiaUniversity of Iowa University of Tennessee, KnoxvilleUniversity of Kansas - Main University of Texas, AustinUniversity of Kentucky University of UtahUniversity of Missouri, Columbia University of Virginia - MainUniversity of Nebraska, Lincoln University of Washington
Sources: AAUP Academe, March/April 2002-2007; Office of Institutional Research
Average Salary
Comparison of UNM and UNM Peer Average Faculty Salaries
UNM Peer Insitutions
Comparative Salaries, FT Instructional Faculty*
Peer institutions are set by the New Mexico Higher Education Department, after consultation with UNM, for use in the funding formula and for making salary comparisons. The peers were chosen as institutions with a similar mix of programs , size and mission as UNM.

All UNM Campuses Combined (as Reported in Fall 2007) *Number Average
of UNM FTE CompaGrade Employees Base Pay Minimum Midpoint** Maximum Ratio***
190 6 $195,240 $105,227 $150,218 $195,208 1.30180 40 $128,929 $88,213 $125,174 $162,157 1.03170 54 $123,337 $73,944 $104,312 $134,701 1.18160 127 $94,200 $61,963 $86,923 $111,883 1.08150 302 $78,264 $51,938 $72,446 $92,955 1.08140 459 $64,916 $43,514 $60,362 $77,230 1.08130 482 $54,604 $36,462 $50,315 $64,147 1.09120 482 $47,729 $33,322 $45,718 $58,115 1.04110 509 $42,394 $30,451 $41,558 $52,686 1.02100 688 $38,842 $27,643 $37,086 $46,530 1.05090 378 $34,373 $25,251 $33,717 $42,162 1.02080 526 $31,900 $23,067 $30,638 $38,210 1.04070 518 $28,542 $21,091 $27,872 $34,653 1.02060 121 $26,135 $19,240 $25,314 $31,387 1.03050 240 $23,680 $17,451 $22,589 $27,726 1.05040 38 $22,907 $15,954 $20,530 $25,126 1.12030 262 $19,334 $14,560 $18,658 $22,755 1.04020 10 $17,817 $13,853 $16,973 $20,072 1.05
Average 1.07Grade Descriptions: 18-19, Executive; 15-17, Directors & Associate VP's; 13-14, Managerial; 10-12, Professional; 8-9, Technical/Paraprofessional; 5-8, Clerical/Secretarial; 7-9, Skilled Crafts; 3-7, Service/Maintenance; 1-2, Helpers.* Regular staff only. Does not include temporary or on-call employees. Does not include University of New Mexico Hospital staff.
Does not include administrative employees with faculty appointments.** The midpoint corresponds to the median salary in the outside market of like positions clustered in a grade.*** Compa Ratio = The ratio of the average UNM FTE base pay in a grade to the midpoint of that grade.
Source: Human Resources, Compensation for most current "Pay Ratio by Structure Report"
Grade Pay Range
Staff Salary Profile
2007 - 2008 UNM Fact Book - Page 123

2007 - 2008 UNM Fact Book - Page 124
Fiscal Years 1998 to 2007
Source: UNM Foundation
UNM Endowment Funds
178188 197
181167
196
222234
266
324
020406080
100120140160180200220240260280300320340
1998 1999 2000 2001 2002 2003 2004 2005 2006 2007
Fiscal Year
Valu
e in
Mill
ions
* Includes combined UNM & UNM Foundation endowment funds, exclusive of the University's share of the State Permanent Fund.
Consolidated Investment Fund (CIF)*(Long-term Permanent Endowment Investments)
Growth in ValueFY 1998 to 2007
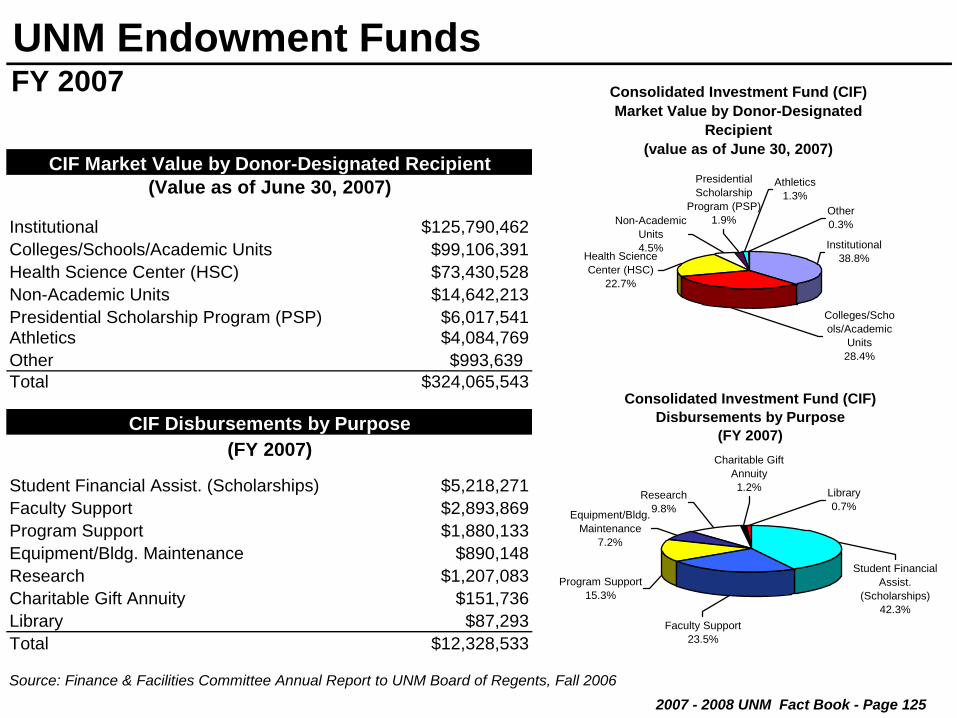
2007 - 2008 UNM Fact Book - Page 125
FY 2007
Institutional $125,790,462Colleges/Schools/Academic Units $99,106,391Health Science Center (HSC) $73,430,528Non-Academic Units $14,642,213Presidential Scholarship Program (PSP) $6,017,541Athletics $4,084,769Other $993,639Total $324,065,543
Student Financial Assist. (Scholarships) $5,218,271Faculty Support $2,893,869Program Support $1,880,133Equipment/Bldg. Maintenance $890,148Research $1,207,083Charitable Gift Annuity $151,736Library $87,293Total $12,328,533
Source: Finance & Facilities Committee Annual Report to UNM Board of Regents, Fall 2006
UNM Endowment Funds
CIF Disbursements by Purpose(FY 2007)
CIF Market Value by Donor-Designated Recipient(Value as of June 30, 2007)
Consolidated Investment Fund (CIF)Disbursements by Purpose
(FY 2007)Charitable Gift
Annuity1.2%
Student Financial Assist.
(Scholarships)42.3%
Faculty Support23.5%
Program Support15.3%
Equipment/Bldg. Maintenance
7.2%
Research9.8%
Library0.7%
Consolidated Investment Fund (CIF) Market Value by Donor-Designated
Recipient(value as of June 30, 2007)
Other0.3%
Presidential Scholarship
Program (PSP)1.9%
Athletics1.3%
Non-Academic Units4.5%
Health Science Center (HSC)
22.7%
Colleges/Schools/Academic
Units28.4%
Institutional38.8%

2007 - 2008 UNM Fact Book - Page 126
Fiscal Years 2003 to 2007
2003 2004 2005 2006 2007Foundation Gifts $17,150,901 $18,595,264 $17,167,613 $18,908,796 $42,784,824Bequests Received $4,845,349 $3,945,711 $4,718,927 $5,063,891 $6,416,134Department Reported Gifts** $20,189,271 $19,218,423 $21,662,022 $24,584,585 $23,430,918
Total Private Support $42,185,521 $41,759,398 $43,548,562 $48,557,272 $72,631,876
* Includes gifts and bequests made to UNM Main, Branches, and the HSC.** Gifts received directly by UNM departments (other than the Foundation) and subsequently reported to the Foundation for record keeping.
Source: UNM Foundation
Gift Activity by Fiscal YearUniversity of New Mexico Foundation, Inc.
Gift Activity*
$0
$10,000,000
$20,000,000
$30,000,000
$40,000,000
$50,000,000
$60,000,000
$70,000,000
$80,000,000
2003 2004 2005 2006 2007
Fiscal Year
Tota
l Gift
s
Foundation Gifts Bequests Received Department Reported Gifts**

2007 - 2008 UNM Fact Book - Page 127
As of September 2007
Campus AcreageNumber of Buildings
Total Square Footage1
Central Campus (Albuquerque)2 211 acres3 191 5,107,173North Campus (Albuquerque) 269 acres3 50 1,496,002South Campus (Albuquerque) 289 acres3 82 1,185,397Gallup Campus 80 acres3 13 309,280Los Alamos Campus All land is leased 8 77,689Valencia Campus 124 acres3 11 175,378Taos Campus 80 acres 3 38,441
1 Excludes parking structures.2 The Central Campus includes buildings and acreage between Lomas and the south side of Central Avenue; the North Campus includes buildings and acreage north of Lomas; and the South Campus includes the UNM Research Park and the Sports Complex.3 Approximation.
Source: UNM Department of Facility Planning
UNM Facilities by Campus
UNM Facilities
Dane Smith Hall

2007 - 2008 UNM Fact Book - Page 128
Current Year Request (2008-2009)Estimated
Project Cost
2008 State Appropriation
RequestPrevious
AppropriationPrivate Funds
Other Funds
Federal Funds
Institution WideLife Safety Code Compliance $5,300,000 $4,440,000 $860,000 $0 $0 $0ADA Compliance (Recurring) $6,800,000 $600,000 $4,370,000 $0 $0 $0
Main Campus AcademicCollege of Education Renewal - PHASE II $17,300,000 $17,300,000 $0 $0 $0 $0Renovation & Expansion of Existing Biology $12,700,000 $9,911,000 $2,789,000 $0 $0 $0Building - Phase II (LFF)*Film & Digital Media BLDG @ Mesa Del Sol $8,000,000 $4,300,000 $3,700,000 $0 $0 $0Learning Center $6,000,000 $2,000,000 $4,000,000 $0 $0 $0Sevilleta Research Station- Ph III (LFF)* $7,872,908 $1,100,000 $227,394 $0 $0 $6,545,514
Health Sciences CenterCRTC - PHASE II (Admin. Wing/Shell Buildout) $18,700,000 $18,700,000 $0 $0 $0 $0Health Education Building - PHASE III (LFF)* $19,900,000 $9,950,000 $0 $0 $0 $0Neurosciences Research Building (LFF)* $8,500,000 $2,400,000 $0 $0 $2,100,000 $4,000,000Stem Cell Research Facility $3,000,000 $3,000,000 $0 $0 $0 $0AthleticsUNM Arena Improvements- PHASE III $60,000,000 $8,000,000 $12,000,000 $20,000,000 $20,000,000 $0
(Leveraged by UNM and private funds)
Football Stadium Phase V (S.E Corner) $5,000,000 $5,000,000 $0 $0 $0 $0
Improvements to Parking Lots/ Landscaping $4,000,000 $4,000,000 $0 $0 $0 $0Auxiliary / OtherTamarind Facility Renewal $3,500,000 $1,569,000 $930,100 $1,000,900 $0 $0Data Center Expansion $4,536,000 $4,536,000 $0 $0 $0 $0
* LFF: Leveraged by Federal Funds
Capital Outlay Projects

2007 - 2008 UNM Fact Book - Page 129
Current Year Request (2008-2009)Estimated
Project Cost
2008 State Appropriation
RequestPrevious
AppropriationPrivate Funds
Other Funds
Federal Funds
Branch CampusesGallup:Technology Center & Classroom Building $8,000,000 $0 $2,605,000 $0 $5,395,000 $0Infrastructure - Calvin Hall Structural Repair $1,500,000 $900,000 $400,000 $0 $200,000 $0& Mechanical ReplacementLos Alamos:Bernalillo Educational Center (Planning) $2,500,000 $75,000 $0 $0 $0 $0Taos:Classroom Completion Phase IV $3,842,401 $3,342,401 $0 $0 $500,000 $0Learning Center (Career Technology PH II) $2,750,000 $1,500,000 $1,250,000 $0 $0 $0Valencia:Campus Renewal and Security Improvements $3,100,000 $1,325,000 $1,000,000 $0 $775,000 $0
Total All Campuses $212,801,309.00 $103,948,401.00 $34,131,494.00 $21,000,900.00 $28,970,000.00 $10,545,514.00
Source: UNM Office of the University Architect
Capital Outlay Projects

2007 - 2008 UNM Fact Book - Page 130