analysis of climate variability and agricultur al
TRANSCRIPT

ANALYSIS OF CLIMATE VARIABILITY AND AGRICULTUR-AL PRODUCTIVITY IN MIZORAM, NORTHEAST INDIAGABRIEL LALCHHANDAMA, BENJAMIN L. SAITLUANGA*, P. RINAWMA
1Mizoram University, Aizawl, Mizoram, IndiaEmail: [email protected]
Received 15 March 2021, accepted in revised form 10 July 2021
AbstractMountainous regions are considered highly vulnerable to the effects of climate change. The extent of change and variability of climatic parameters is still unexamined in many remote mountainous areas. This paper aims to understand the change in pattern of rainfall and temperature during 1986-2015 in the Himalayan state of Mizoram, India. Time series analysis of climatic parameters is carried out by us-ing Coefficient of Variation (CV), Mann-Kendall (M-K)and Sen’s Slope estimator. The analysis revealed that during the entire study period, the highest seasonal rainfall variation occurs during winter and the highest seasonal temperature variation occurs during spring. Mann-Kendall test showed a significant change in rainfall with November showing the highest negative trend of rainfall. The temperature trend analysis in the study also reveals drastic change of temperature over 2˚C in the last 30 years. Lastly, linear regression analysis shows that changes in the climate variables have significant effect on the production of maize and ginger at 0.05 significance level with r²=0.49 and 0.24 respectively.
Keywords: Climate change, Climate Variability, Mann-Kendall,Sens’s Slope Trend Analysis, Regression, Agriculture, Mizoram
1. Introduction
Climate change and variability are among the biggest challenges of the world today. Climate change refers to the unprecedented permanent or long-term change of the earth’s atmospheric conditions. It is a long-term continuous change, usually at least 30 years (WTO-UNEP, 2009). Climate variability, on the other hand, refers to variation from climate means (Tam, 2012). It has been estimated that the global average temperature has increased by 0.3°C to 0.6°C over the past 100 years (IPCC, 1990), and is projected to rise by 1.8°C to 4.0°C by 2100 (IPCC, 2007).
The reported rise of global surface temperature by 0.6°C is found to be highly
comparable to the rise of mean annual temperature over India (Dash et al., 2007). During the past century, different climatic zones in the country have experienced an increase in maximum temperature ranging from 0.5 to 1.2°C (Dash et al., 2007). Rainfall pattern has also changed from increasing trend in the first half of the 20th century to a significant decrease of Monsoon from the decade 1971-1980 onwards (Guhathakurta & Revadekar, 2017). The Intergovernmental Panel on Climate Change (IPCC, 2007) has projected an increasing temperature, a significant change in Monsoon and water stress in India by the 2020s.
Because of its diverse geography and dependency of agricultural sector on
Landscape & Environment 15 (2) 2021. 53-64DOI: 10.21120/LE/15/2/5

Monsoon, India ranks among the most vulnerable countries with respect to climate change (Brenkert & Malone, 2005). Millions of population belonging to climate sensitive zones and primary sector without having appropriate knowledge on coping strategies and adaptive measures are at risk to climate change (Panda, 2009; Patnaik & Narayanan, 2009; Ravindranath et al., 2011).Climate change has significant effect on the growth and productivity of crops (Tao et al., 2003; Lobells et al., 2008). A number of studies in India have shown that decrease in intensity of Monsoon is negatively affecting agricultural productivity in both irrigated and rainfed areas (Ashrit et al., 2001; Chung & Ramanathan, 2006; Soora et al., 2013). Moreover, climate related hazards like cyclone, landslide, flood and drought are expected to intensify at regional or local level resulting in the disruption of the livelihood of poorer sections of population (Panda, 2009; Brenkert & Malone, 2005).
Highlands and mountainous areas are considered as one of the most vulnerable ecosystems to climate change due to fragile environment, dependence on traditional economy and relatively low level of development (see Ives & Messerli, 1989; Koenig & Abegg, 1997; Beniston, 2003; Beniston, 2005; Viviroli et al., 2011; Kohler et al., 2014; Fort, 2015; Finaev et al., 2016). A slight change in temperature and rainfall pattern in hill areas may easily induce frequent occurrence of natural hazards, disruption of ecological system, reduction of crops, availability of water, and, after all, the well-being of the natural and human environment. The north-eastern Himalayan region of India is also highly vulnerable to climate related water-induced disasters as it has been experiencing rapid decrease in rainfall during the last three decades (Das, 2009; Jain at al.,2013; Choudhury et al., 2019). Rainfall deficiency was the largest during the decade 2001–2010 for northeast India (Guhathakurta & Revadekar, 2017). Moreover, it is estimated that the magnitude of increase in maximum temperature in the
region is one of the highest in India (Dash et al., 2007).
Owing to its high rainfall and other geo-environmental factors, Northeast India is highly suitability for production of crops like maize and ginger. The region is one of the most important ginger producing regions in the country. Parthasarathy et al. (2008) did not find any significant change for ginger production in Northeast India under the changing climatic scenario in their assessment of land suitability of ginger. At the same time, decreasing rainfall in the region is found to affect productivity of maize (Zea mays) in rainfed areas (Byjesh et al., 2010; Ravindranath et al., 2011; Deb et al., 2015; Duncan et al., 2016).
No proper study has been conducted on the relationship between climate variability and agricultural productivity in Mizoram till today. The agricultural system in the state is highly dependent on seasonal rainfall (Singh et al., 2016) as the majority of cultivable land in the state falls under the rainfed areas. No proper examination on climate change in Mizoram has also been conducted till today. A few descriptive studies have observed increasing temperature and decreasing rainfall in the post-Monsoon period during the past few years (GoM, 2012 & Sahoo et al., 2018; Singh et al., 2016).Guhathakurta et al.(2020) observed significant increase of dry days in the state while Tiwari (2006) noticed an increase in mean maximum temperature by 1.8˚C in a span of 5 years, and a decreasing rainfall during 1992-2000.
2. Objectives of the Study
The present study is an attempt to determine change and variability in temperature and rainfall patterns in Mizoram and its impacts on the production of two important crops - ginger and maize. Our result is expected to give insight into the current knowledge of change and variability of climate in the region which has not been properly investigated.
Landscape & Environment 15 (2) 2021. 53-6454
3. The Study Area
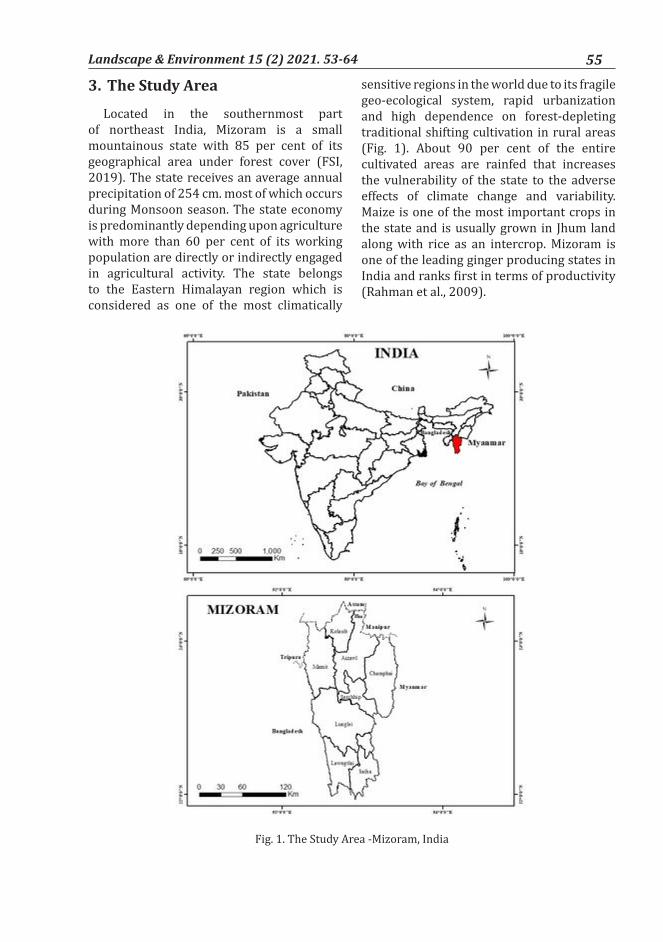
Located in the southernmost part of northeast India, Mizoram is a small mountainous state with 85 per cent of its geographical area under forest cover (FSI, 2019). The state receives an average annual precipitation of 254 cm. most of which occurs during Monsoon season. The state economy is predominantly depending upon agriculture with more than 60 per cent of its working population are directly or indirectly engaged in agricultural activity. The state belongs to the Eastern Himalayan region which is considered as one of the most climatically
sensitive regions in the world due to its fragile geo-ecological system, rapid urbanization and high dependence on forest-depleting traditional shifting cultivation in rural areas (Fig. 1). About 90 per cent of the entire cultivated areas are rainfed that increases the vulnerability of the state to the adverse effects of climate change and variability.Maize is one of the most important crops in the state and is usually grown in Jhum land along with rice as an intercrop. Mizoram is one of the leading ginger producing states in India and ranks first in terms of productivity (Rahman et al., 2009).
Fig. 1. The Study Area -Mizoram, India
Landscape & Environment 15 (2) 2021. 53-64 55

4. Materials and Method
Climatic parameters like rainfall and temperature data for a period of 1986-2015 were obtained from Indian Meteorological Department (IMD) while a time series data of 25 years (1994-2019) for ginger and maize production in the state were obtained from Directorate of Agriculture, Government of Mizoram.
Three statistical techniques were applied to measure variability of recorded climate data. Firstly, Coefficient of Variation (CV) is used to determine decadal variation of the collected data. This technique has been popularly used to measure variation from the
mean (see Asare-Nuamah & Botchway, 2019; Gemeda et al., 2020). The formula of CV is
Where, σ = standard deviation, and µ = mean.Secondly, following Yue et al. (2002),
Jaiswal et al. (2015), Atta-ur-Rahman& Dawood (2017), Yadav et al. (2014), Guhathakurta & Revadekar (2017) and Getachew (2018), the non-parametric Mann-Kendall (M-K) test have been applied to find out the changing trend of the climate variables by classifying the time series data into three categories -monthly, seasonal and annual data sets.
Fig 3. Maize are usually grown along with Rice in Mizoram
Fig. 2. Ginger cultivation in the hills of Mizoram
Landscape & Environment 15 (2) 2021. 53-6456
The equation for Mann-Kendall test is given as
Here, S denotes Mann-Kendall (M-K) test while xJ and xk represent parameter values in years j and k, j>k, respectively. The positive and negative values of n denote increasing and decreasing trend respectively (Salmi et al., 2002).
Thirdly, the non-parametric technique of Sen’s Slope method is calculated to estimate the true slope. The slope ‘Q’ is calculated by using the following equation:
Where xJ and xk are the data value at time j and k (j>K) respectively (for detailed discussion, see Raja et al., 2018).
Lastly, linear regression is employed to assess the relationship between climatic variables and productivity of ginger and maize during 1994-2019.
5. Results and Discussion
Rainfall Variation
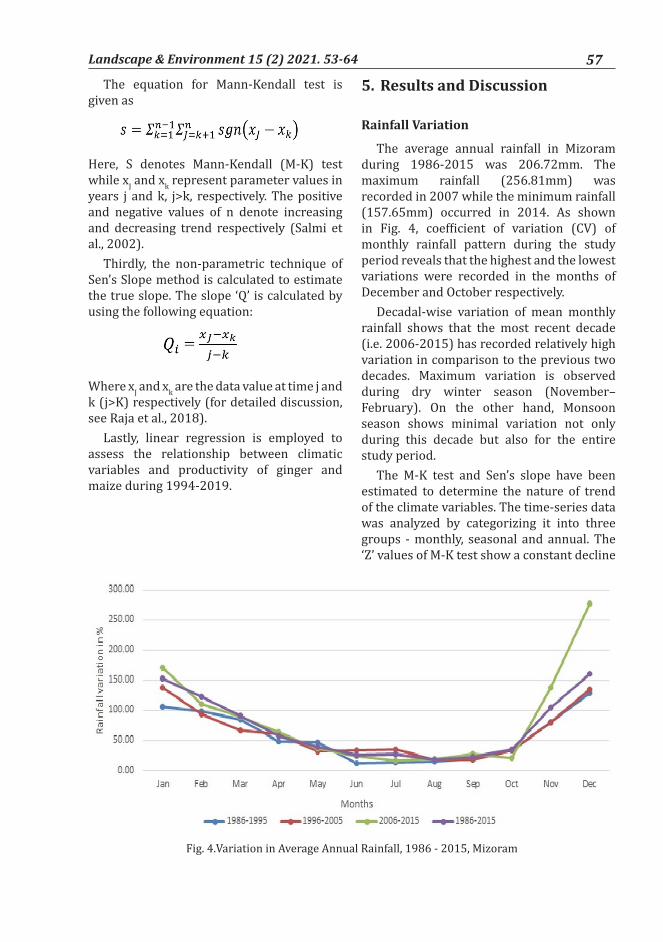
The average annual rainfall in Mizoram during 1986-2015 was 206.72mm. The maximum rainfall (256.81mm) was recorded in 2007 while the minimum rainfall (157.65mm) occurred in 2014. As shown in Fig. 4, coefficient of variation (CV) of monthly rainfall pattern during the study period reveals that the highest and the lowest variations were recorded in the months of December and October respectively.
Decadal-wise variation of mean monthly rainfall shows that the most recent decade (i.e. 2006-2015) has recorded relatively high variation in comparison to the previous two decades. Maximum variation is observed during dry winter season (November–February). On the other hand, Monsoon season shows minimal variation not only during this decade but also for the entire study period.
The M-K test and Sen’s slope have been estimated to determine the nature of trend of the climate variables. The time-series data was analyzed by categorizing it into three groups - monthly, seasonal and annual. The ‘Z’ values of M-K test show a constant decline
Fig. 4.Variation in Average Annual Rainfall, 1986 - 2015, Mizoram
Landscape & Environment 15 (2) 2021. 53-64 57

of precipitation for almost all the months, all seasons and total annual rainfall (Table 1). However, the change is significant only in the
months of October, November, December and in winter season which is also indicated by the Sen’s slope or Q values (Fig. 5).
Table 1. M-K and Sen’s Slope statistics of Rainfall in Mizoram, 1986-2015
Month/Season Test Z Q B SignificanceJanuary -0.58 -0.011 4.21
February -1.87 -0.750 25.93 +March -1.75 -1.606 70.62 +April -0.71 -1.075 135.64 May 0.64 1.909 274.00 June -1.00 -2.236 429.20 July -1.43 -2.942 452.29
August 0.18 0.369 414.50 September -0.54 -0.963 376.66
October -2.11 -3.695 269.82 *November -2.55 -1.805 55.518 *December -2.07 -0.089 2.3556 *
Spring -1.32 -3.695 269.41 Summer 0.18 0.438 1646.3 Autumn -1.53 -3.962 636.3 Winter -2.43 -2.435 85.772 *Total -1.43 -8.994 2657.9
(Note: + and * indicate significance at 0.1 and 0.5level of significance respectively)
Fig.5.Variation in Total Annual Rainfall, 1986-2015, Mizoram
Landscape & Environment 15 (2) 2021. 53-6458

Temperature variation
The analysis of both the maximum and minimum temperatures reveal a huge variation of temperature in all the decades. During the entire period, the maximum temperature shows a moderate monotonic nature. Low coefficients of variation are detected in March and July while May and September show relatively higher values of variation (Fig.6). The average monthly minimum temperature, on the other hand, shows a higher variation in the month of January which gradually declines in the later months but abruptly increases in the month of December (Fig.7).
Relatively higher fluctuation in maximum temperature was observed during 2006-
2015 as compared to the previous decades (Fig. 6). During this decade, the highest variation is observed in the month of August. High anomalies were recorded in the months of May to October in all the three decades. The minimum temperature, on the other hand, has shown maximum variations during winter season (Fig.7).
The seasonal temperature variation of maximum and minimum shows a high monotonic characteristic in all the seasons. Spring season has recorded the highest maximum rainfall variation from its mean while showing declining trend with time. Recently, increasing variation in maximum temperature is observed during winter (Fig. 8). Similar pattern is observed for minimum
Fig.6.Variation in Average Maximum Temperature, 1986-2015, Mizoram
Fig.7.Variation in Average Minimum Temperature,1986-2015, Mizoram
Landscape & Environment 15 (2) 2021. 53-64 59

Fig. 8. Seasonal maximum temperature variation, 1986-2015, Mizoram
Fig. 9. Seasonal Minimum Temperature Variation, 1986-2015, Mizoram
Fig. 10. M-K trend and Sen’s slope of average maximum average temperature, June, 1986-2015
Landscape & Environment 15 (2) 2021. 53-6460
temperature. Winter and spring seasons have recorded relatively higher variations as compared to summer and autumn seasons. For all seasons, variations in minimum temperature are found to be declining with time (Fig. 9).
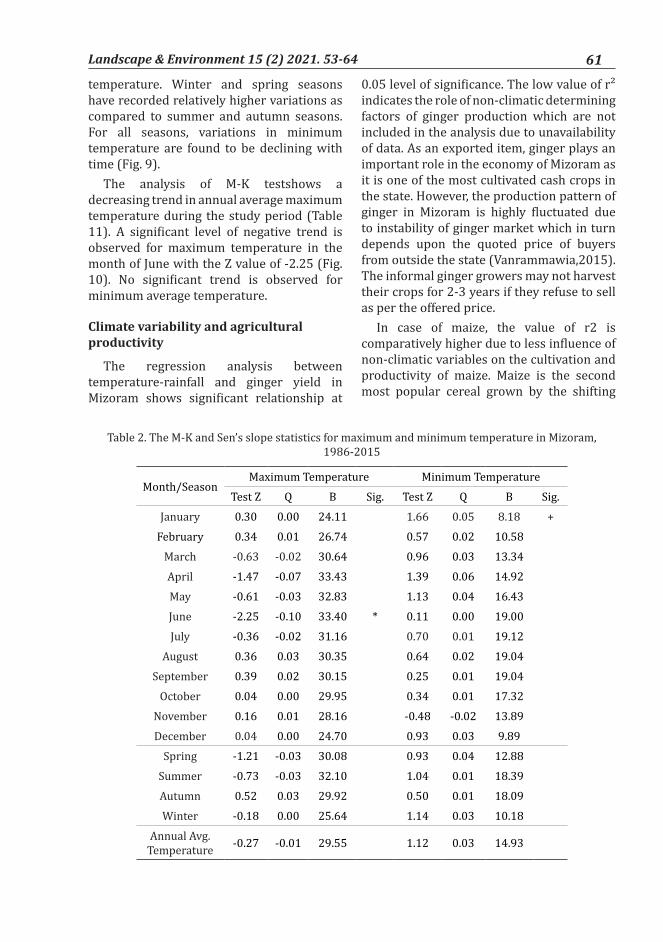
The analysis of M-K testshows a decreasing trend in annual average maximum temperature during the study period (Table 11). A significant level of negative trend is observed for maximum temperature in the month of June with the Z value of -2.25 (Fig. 10). No significant trend is observed for minimum average temperature.
Climate variability and agricultural productivity
The regression analysis between temperature-rainfall and ginger yield in Mizoram shows significant relationship at
0.05 level of significance. The low value of r² indicates the role of non-climatic determining factors of ginger production which are not included in the analysis due to unavailability of data. As an exported item, ginger plays an important role in the economy of Mizoram as it is one of the most cultivated cash crops in the state. However, the production pattern of ginger in Mizoram is highly fluctuated due to instability of ginger market which in turn depends upon the quoted price of buyers from outside the state (Vanrammawia,2015). The informal ginger growers may not harvest their crops for 2-3 years if they refuse to sell as per the offered price.
In case of maize, the value of r2 is comparatively higher due to less influence of non-climatic variables on the cultivation and productivity of maize. Maize is the second most popular cereal grown by the shifting
Month/SeasonMaximum Temperature Minimum Temperature
Test Z Q B Sig. Test Z Q B Sig.January 0.30 0.00 24.11 1.66 0.05 8.18 +
February 0.34 0.01 26.74 0.57 0.02 10.58March -0.63 -0.02 30.64 0.96 0.03 13.34April -1.47 -0.07 33.43 1.39 0.06 14.92May -0.61 -0.03 32.83 1.13 0.04 16.43June -2.25 -0.10 33.40 * 0.11 0.00 19.00July -0.36 -0.02 31.16 0.70 0.01 19.12
August 0.36 0.03 30.35 0.64 0.02 19.04September 0.39 0.02 30.15 0.25 0.01 19.04
October 0.04 0.00 29.95 0.34 0.01 17.32November 0.16 0.01 28.16 -0.48 -0.02 13.89December 0.04 0.00 24.70 0.93 0.03 9.89
Spring -1.21 -0.03 30.08 0.93 0.04 12.88Summer -0.73 -0.03 32.10 1.04 0.01 18.39Autumn 0.52 0.03 29.92 0.50 0.01 18.09Winter -0.18 0.00 25.64 1.14 0.03 10.18
Annual Avg. Temperature -0.27 -0.01 29.55 1.12 0.03 14.93
Table 2. The M-K and Sen’s slope statistics for maximum and minimum temperature in Mizoram, 1986-2015
Landscape & Environment 15 (2) 2021. 53-64 61

cultivators in the state. As shown in Table 3, maize cultivation is highly dependent upon both rainfall and temperature as compared to ginger. Sowing of maizeis mostly done during the month of March to May and its growth and productivity is thus highly determined by rain water availability (Hnamte, 2009). The r² value indicates 49 per cent of the variation in the productivity of the maize yield can be attributed to the rainfall and temperature. A decreasing trend of rainfall by 23.7 per cent from its mean annual average rainfall in the last 30 years could possibly have an adverse impact on the production of maize.
6. Conclusion
Understanding the adverse impacts of climate change on agriculture is imperative to seek attention to the need for limiting and minimizing the effects. Further, it may help in the assessment of socio-economic and physical impacts of climate change in an underdeveloped, mountainous and rainfed-agricultural area like Mizoram.
The time series data of rainfall and temperature reveals a changing and a varying characteristic through time. Analysis of Coefficient variation (CV) shows a high variation of rainfall from its mean in all the three decades and the M-K and Sen’s slope estimators analysis helps in having a better understanding with the trend characteristics, revealing a significantly negative trend with a decline of 49.1mm of rainfall compared to the total average rainfall of 206.7mm, with a declining trend of precipitation since last decade. Likewise, the analysis of temperature shows a positively high variation in the decadal temperature with negative trend
in the maximum temperature and a much constant trend in minimum temperature. Although the temperature trend analysis doesn’t give a much significant result, which could be attributed to the short availability of the time series data. The regression analysis shows that rainfall and temperature have significant influence over the yields of maize and ginger in Mizoram.
7. ReferencesAsare-Nuamah P., Botchway E. (2019). Understanding
climate variability and change: analysisof temperature and rainfall across agroecological zones in Ghana. Heliyon, 5, e02654.
Ashrit R.G., Kumar K.R., Kumar K.K. (2001). ENSO-Monsoon Relationship in Greenhouse Warming Scenario. Geophysical Research Letters, 28(9): 1727-30
Atta-ur-Rahman.,Dawood M. (2017). Spatio-statistical analysis of temperature fluctuation using Mann–Kendall and Sen’s slope approach. Climate Dynamics, 48,783-797.
Beniston M. (2003). Climatic Change in Mountain Regions: A Review of Possible Impacts. Climatic Change, 59, 5–31. https://doi.org/10.1023/A:1024458411589
Beniston M. (2005). The risks associated with climatic change in mountain regions. In: U. Huber, H. Bugmann and M. Reasoner (eds.) Global change and mountain regions: an overview of current knowledge (pp. 511-520). Springer: Dordrecht.
Brenkert A.L., Malone E.L. (2005). Modeling Vulnerability and Resilience to Climate Change: A Case Study of India and Indian States. Climatic Change, 72, 57–102.
Byjesh K., Kumar S.N., Aggarwal, P.K. (2010). Simulating impacts, potential adaptation and vulnerability of maize to climate change in India. Mitigation and Adaptation Strategies for Global Change, 15, 413–431.
Independent variables Dependent variable R Square p-value Significance
RainfallMax. Temperature Ginger 0.24 .049 Yes
Rainfall Max. Temperature Maize 0.49 .001 Yes
Table 3. Regression analysis of climatic variables and crop productivity
Landscape & Environment 15 (2) 2021. 53-6462
Choudhury B. A., Saha S. K., Konwar M., Sujith K., Deshamukhya A. (2019). Rapid drying of Northeast India in the last three decades: Climate change or natural variability? Journal of Geophysical Research: Atmospheres, 124, 227–237.
Chung C.E., RamanathanV. (2006).Weakening of North Indian SST Gradients and the Monsoon Rainfall in India and the Sahel.Journal of Climate.19: 2036-45.
Das P.J. (2009). Water and climate induced vulnerability in northeast India: concerns for environmental security and sustainability. WATCH Research Report 1. AARANYAK, Guwahati.
Dash S.K., Jenamani R.K., KalsiS.R., Panda S.K. (2007). Some evidence of climate change in twentieth-century India.Climate Change, 85:299-321.
Deb P., Kiem A.S., Babel M.S., Chu S.T, Chakma, B. (2015). Evaluation of climate change impacts and adaptation strategies for maize cultivation in the Himalayan foothills of India. Journal of Water and Climate Change, 6(3): 596–614.
Duncan J., Saikia S., Gupta N., Biggs E. (2016). Observing climate impacts on tea yield in Assam, India. Appl.Geogr., 77, 64–71.https://doi.org/10.1016/j.apgeog.2016.10.004.
Finaev A.F., Shiyin L., Weijia B., Li J. (2016). Climate Change and Water Potential of the Pamir Mountains. Geography, Environment, Sustainability. 9(3): 88-105.
Forest Survey of India (FSI) (2019). State of Forest Report 2019. Ministry of Environment Forest and Climate Change, Dehradun, India.
Fort M. (2015). Impact of climate change on mountain environment dynamics. Journal of Alpine Research, 103 (2), 1-7.
Gemeda D.O., Feyssa D.H., Garedew, W. (2020) Meteorological data trend analysis and local community perception towards climate change: a case study of Jimma City, Southwestern Ethiopia. Environ Dev Sustain. https://doi.org/10.1007/s10668-020-00851-6.
Getachew B. (2018). Trend analysis of temperature and rainfall in south Gonder zone, Ethiopia.
Journal of Degraded and Mining Lands Management, 5(2):1111-1125. DOI:10.15243/jdmlm.2018.052.1111.
Government of Mizoram (GoM) (2012). State Action Plan on Climate Change: Mizoram 2012-2017.Department of Science & Technology, Government of Mizoram.Accessed from https://forest.mizoram.gov.in/uploads/attachments/eaca54828e34ef7b4472fd5c985fd31b/pages-202-sapc-mizoram-2012-17.pdf.
Guhathakurta P., Revadekar, J.V. (2017). Observed variability and long-term trends of rainfall over India. In: M. Rajeevan & S. Nayak (eds.), Observed climate variability and change over the Indian region (pp. 1– 15). Singapore: Springer.
Guhathakurta P., Bandgar A., Menon P., Prasad A.K., Sangwan N., Advani S.C. (2020). Observed Rainfall Variability and Changes over Mizoram State.Climate Research and Services, Indian Meteorological Department, Ministry of Earth Sciences, Pune.
Hnamte L. (2009). Comparative Study of Growth and Productivity of Maize (Zea Mays L.)Under Different Jhum Cycles of Mizoram.Department of Forestry, Mizoram University, Mizoram.
Intergovernmental Panel on Climate Change (IPCC) (1990). Climate Change: The IPCC Scientific Assessment [J. T. Houghton, G. J. Jenkins and J. J. Ephraums (eds.)]. Cambridge University Press, Cambridge, United Kingdom and New York, NY, USA.
Intergovernmental Panel on Climate Change (IPCC) (2007).Climate Change 2007: The Physical Science Basis. Contribution of Working Group I to the Fourth Assessment Report of the Intergovernmental Panel on Climate Change (IPCC) [Solomon, S., D. Qin, M. Manning, Z. Chen, M. Marquis, K. B. Averyt, M. Tignor and H. L. Miller (eds.)]. Cambridge University Press, Cambridge, United Kingdom and New York, NY, USA.
Intergovernmental Panel on Climate Change (IPCC) (2018).Global Warming of 1.5°C.An IPCC Special Report on the impacts of global warming of 1.5°C above pre-industrial levels and related global greenhouse gas emission pathways, in the context of strengthening the global response to the threat of climate change, sustainable development, and efforts to eradicate poverty [Masson-Delmotte, V., P. Zhai, H.-O. Pörtner, D. Roberts, J. Skea, P.R. Shukla, A. Pirani, W. Moufouma-Okia, C. Péan, R. Pidcock, S. Connors, J.B.R. Matthews, Y. Chen, X. Zhou, M.I. Gomis, E. Lonnoy, T. Maycock, M. Tignor, and T. Waterfield (eds.)]. In Press.
Ives J.D. & Messerli B. (1989).The Himalayan Dilemma: Reconciling Development and conservation. Routledge: New York.
Jain S.K., Kumar V., Saharia M. (2013). Analysis of rainfall and temperature trends in Northeast India. International Journal of Climatology, 33: 968–978.
Jaiswal R.K., Lohani A.K., Tiwari H.L. (2015). Statistical Analysis for Change Detection and Trend Assessment in Climatological Parameters. Environmental Processes, 2, 729–749.
Landscape & Environment 15 (2) 2021. 53-64 63

Koenig U., Abegg B. (1997). Impacts of Climate Change on Winter Tourism in the Swiss Alps. Journal of Sustainable Tourism, 5(1), 46-58. DOI: 10.1080/09669589708667275.
Kohler T., Wehrli A., Jurek M. (eds.) (2014). Mountains and climate change: A global concern. Sustainable Mountain Development Series. Bern, Switzerland, Centre for Development and Environment (CDE), Swiss Agency for Development and Cooperation (SDC) and GeographicaBernensia.
Lobells D.B., Burke M.B., Tabaidi C., Mastrandrea M.D., Falcon W.P., NaylorR.L. (2008). Prioritizing climate change adaptation need for foodsecurity in 2030. Science, 319:607–610
Panda A. (2009). Assessing Vulnerability to Climate Change in India. Economic and Political Weekly, 44 (16), 105-107.
Parthasarathy U., Jayarajan K., Johny A.K., Parthasarathy V.A. (2008). Identification of suitable areas and effect of climate change on Ginger - a GIS study. Journal of Spices and Aromatic Crops, 17(2), 61–68.
Patnaik U., Narayanan K. (2009). Vulnerability and Climate Change: An Analysis of the Eastern Coastal Districts of India. Munich Personal RePEcArchive.https://mpra.ub.uni-muenchen.de/22062/
Rahman H., Karuppaiyan R., Kishore K., Denzongpa R. (2009). Traditional practices of ginger cultivation in Northeast India. Indian Journal of Traditional Knowledge, 8(1), 23-28.
Ravindranath N., Rao S., Sharma N., Nair M., Gopalakrishnan R., Rao A.S., Malaviya S., Tiwari R., Sagadevan A., Munsi M., Krishna N., Bala G. (2011). Climate change vulnerability profiles for North-East India. Current Science, 101: 384–404.
Sahoo, U.K., Singh S.L., Lalnundanga., Lalnuntluanga., Devi A.S., Zothanzama, J. (2018). Climate Change Impacts on Forest and its Adaptation study in Mizoram, Mizoram University, Aizawl.
Salmi T., Maatta A., Anttila P., Ruoho-Airola T., Amnell, T. (2002). Detecting Trends of Annual Values of Atmospheric Pollutants by the Mann-Kendall Test and Sen’s Slope Estimates—The Excel Template Application MAKESENS. Finnish Meteorological Institute.Publications on Air Quality No. 31, Helsinki.
Singh S.B., Boopathi T., Singh A.R., Saha S., Lungmuana, Devi M.T. (2016). Climate Change and Agriculture in Mizoram: Issues, Constraints and Strategies. In: S.V.Ngachan, R.K. Singh, U.S. Saikia, B.K. Sethy & D.J. Rajkhowa (eds.), Technological options for Climate Resilient Hill
Agriculture (Pp. 58-77), ICAR Complex for NEH Region, Umiam.
Soora N. K., Aggarwal P.K., Saxena R., Rani S., Jain S., Chauhan N. (2013). An Assessment of regional vulnerability of rice to climate change in India.Climatic Change.118:683-699. DOI: 10.1007/s10584-013-0698-3.
Tiwari, R.S (2006). Analytical Study on variation of climatic parameters at Aizawl, Mizoram (India). Bulletin of Forest Research, 22(1&2), 33-39
Tam, B. (2012).The Effects of Weather and Climate Variability on the Well Being of a Rural and Urban Aboriginal Group in Ontario, Canada.Department of Geography, University of Toronto, Canada.
Tao F, Yokozawa M, Hayashi Y, Lin E (2003) Future climate change, theagricultural water cycle, and agricultural productions in China. Agric Ecosyst Environ, 95:203–215
Vanrammawia K. (2015). Agricultural Marketing Efficiency in Mizoram.Social Change and Development,12(1), 977-108.
Viviroli D., Archer D.R., Buytaert W., Fowler H.J., Greenwood G.B., Hamlet A.F., Huang Y., Koboltschnig G., Litaor M.I., Lopez-Moreno J.I., Lorentz S., Schadler B., Schreier H., Schwaiger K., Vuille M., Woods R. (2011). Climate change and mountain water resources: overview and recommendations for research, management and policy. Hydrol. Earth Syst. Sci., 15, 471–504. http://dx.doi.org/10.5194/hess-15-471-2011.
World Trade Organization-United Nations Environment Programme ((WTO-UNEP) (2009) Trade and climate change WTO-UNEP report. Accessed from https://www.wto.org/english/res_e/booksp_e/trade_climate_change_e.pdf.
Yadav R., Tripathi S.K., Pranuthi G., Dubey S.K. (2014). Trend analysis by Mann-Kendall test for precipitation and temperature for thirteen districts of Uttarakhand. Journal of Agrometeorology, 16 (2), 164-171.
Yue S., Pilon P., Cavadias G. (2002). Power of the Mann–Kendall and Spearman’s rho tests for detecting monotonic trends in hydrological series. Journal of Hydrology, 259 (1–4), 254-271. https://doi.org/10.1016/S0022-1694(01)00594-7.
Landscape & Environment 15 (2) 2021. 53-6464