analysis and characterization of consumer products atr …
TRANSCRIPT

ANALYSIS AND CHARACTERIZATION OF CONSUMER PRODUCTS
BY FTIR, RAMAN, CHEMOMETRICS, AND TWO DIMENSIONAL
ATR-FTIR CORRELATION SPECTROSCOPY
by
JUN ZHANG
A Dissertation submitted to the
Graduate School-New Brunswick
Rutgers, the State University of New Jersey
In partial fulfillment of the requirements
For the degree of
Doctor of Philosophy
Graduate Program in Chemistry and Chemical Biology
Written under the direction of
Professor Eugene S. Hall
And approved by
New Brunswick, New Jersey
May, 2009

ii
ABSTRACT OF THE DISSERTATION
Analysis and Characterization of Consumer Products by FTIR, Raman,
Chemometrics, and Two Dimensional ATR-FTIR Correlation Spectroscopy
By Jun Zhang
Dissertation Director:
Dr. Gene Hall
My research focused on two projects using Fourier Transform Infrared (FTIR),
Micro-Raman spectroscopy, Chemometrics (Principle Component Analysis, PCA), and
two-dimensional (2D) ATR-FTIR correlation spectroscopic techniques.
Project one involves method development and validation for the simultaneous
determination of dimethicone and cyclomethicone in skin protectant ointments by FTIR.
A unique FTIR method that utilizes two absorbance bands (1260 cm-1
and 808 cm-1
) to
determine the concentrations of dimethicone and cyclomethicone using two simultaneous
equations was first time developed. The absorbances at two fixed wave numbers 1258.50
cm-1
and 800.00 cm-1
were used to calculate the concentrations of dimethicone and
cyclomethicone. A series of comprehensive method validation experiments were
designed and carried out. The simultaneous equation approach employed in the method
was shown to be linear, accurate, precise, and specific.
Project two is to characterize fish oil supplements using ATR-FTIR, Micro-
Raman, Principle Components Analysis, and 2D ATR-FTIR Correlation Spectroscopy.
Most of the fish oil supplements claim active ingredient EPA and DHA on the labels, but
the actual chemical forms (ethyl ester or triglyceride) are not indicated. A fast qualitative
ATR-FTIR method was developed to distinguish between the ethyl ester and the
iii
triglyceride forms of fatty acids using the carbonyl band position. Chemometrics
approach - Principal Component Analysis (PCA) was used to classify fish oil
supplements successfully by grouping the FTIR and Raman spectra. PCA was also
demonstrated as a powerful tool to screen fish oil supplements and identify the products
that may be made by the same manufacturers with the same quality, but sold with
different prices. A fish oil FTIR spectral library was also created for rapid searching and
product comparison. In addition, an ATR-FTIR standard addition method was evaluated
for quantitative analysis of active ingredients EPA and DHA esters in fish oil products.
Lastly, two-dimensional FTIR correlation spectroscopy was first time used as a new
technique to study temperature dependent spectral characteristics of fatty acids such as
EPA and DHA esters to provide further spectral information of these polyunsaturated
omega-3 fatty acids.

iv
Acknowledgement
I would like to sincerely thank Dr. Gene Hall for having me as his student and for
his continues guidance, support, kindness, and always being there for discussions and
ideas during the course of my graduate research.
I would like also to thank Dr. Jing Li and Dr. Ralf Warmuth, for serving on my
thesis committee and for their interest in my projects, their suggestions for my research
work, and support throughout this process. Thank Dr. Ed Castner who served as a
member of my proposal defense committee.
I am deeply grateful to Dr. Ken Karaisz, who is my J&J colleague and supervisor,
for discussing with me on the projects and for his suggestions and continues
encouragement during my graduate study and for serving on my thesis committee.
Many thanks to my J&J colleagues Dr. Jane Cai and Dr. Ming Bai for their
understanding and great support during my graduate study. Special thanks to my
previous J&J colleague Dr. Jian Chen for his constant encouragement.
Finally, I would like express my sincere appreciation to my husband Dr. Zhuying
Wang, my daughter Betty Wang, and my son Benjamin Wang for their constant
understanding and support during the past years when I spent countless family time
(weekends and nights) on my graduate study.

v
Table of Contents
Abstract of the dissertation……………………………………………………………....ii
Acknowledgement……………………………………………………………………....iv
Table of Contents………………………………………………………………………..v
List of Tables……………………………………………………………………………ix
List of Illustrations……………………………………………………………………...xi
Chapter 1 - Instrumentation Techniques Overview……..…………………………..….1
1.1 Fourier Transform Infrared (FTIR) Spectroscopy……………………………...1
1.1.1 Theory of Infrared Absorption………………………………………………….1
1.1.2 Development of FTIR…………………………………………………………..3
1.1.3 Sampling and Instrumentation………………………………………………….4
1.1.4 Application of FTIR…………………………………………………………….7
1.2 Two-Dimentional Infrared (2D-IR) Spectroscopy……………………………...8
1.2.1 Introduction of Generalized 2D Correlation Spectroscopy……………………..8
1.2.2 Generalized 2D Correlation Analysis…………………………………………...9
1.2.3 Applications of 2D Correlation Spectroscopy………………………………….14
1.3 Raman Spectroscopy…………………………………………………………...14
1.3.1 Theory of Raman Spectroscopy…………………………………..…………....14
1.3.2 Development of Raman Spectroscopy…………………………………………17
1.3.3 Sampling and Instrumentation………………………………………………….19
1.3.4 Applications of Raman Spectroscopy…………………………………………..20
1.4 Chemometrics – Principle Components Analysis (PCA)……………………....21
1.4.1 Introduction to Chemometrics…………………………………….…………....21
vi
1.4.2 Principle Components Analysis (PCA)………………………………………....23
1.4.3 Case Study………………………………………………………………………25
1.5 Outline of Research Projects in This Thesis…………………………………….28
Chapter 1 References……………………………………………………………28
Chapter 2 - Method Development and Validation for the Simultaneous Quantitation
of Dimethicone and Cyclomethicone in Skin Protective Ointments by FTIR………….32
2.1 Background/Objective…………………………………………………………..32
2.2 Method Development…………………………………………………………...35
2.3 Method Procedures……………………………………………………………...42
2.4 Method Validation……………………………………………………………....43
2.4.1 Additive Absorbance Responses for Dimethicone and Cyclomethicone……….44
2.4.2 Linearity…………………………………………………………………………46
2.4.3 Accuracy………………………………………………………………………...54
2.4.4 Precision………………………………………………………………………...56
2.4.5 Specificity……………………………………………………………………….57
2.4.6 Standard Material Lot to Lot Variation…………………………………………64
2.4.7 Standard and Sample Solution Stability………………………………………...64
2.5 Conclusion………………………………………………………………………65
Chapter 2 References…………………………………………………………...66
Chapter 3 - Characterization of Fish Oil Supplements…………………………………67
3.1 Introduction of Fish Oil Supplements…………………………………………..67
3.1.1 Background……………………………………………………………………..67
3.1.2 Natural triglyceride and ethyl esters of EPA and DHA………………………...68
vii
3.1.3 Fish Oil Production……………………………………………………………..70
3.1.4 Fish Oil Absorption – Bioavailability…………………………………………..71
3.2 Objective of Fish Oil Supplement Characterization…………………………....72
3.3 Qualitative Characterization of Fish Oil Supplements by ATR-FTIR………....75
3.3.1 Fish Oil Samples and Reference Material……………………………………...75
3.3.2 ATR-FTIR Instrumentation and Spectral Acquisition………………………....75
3.3.3 Software Assistance…………………………………………………………....76
3.3.4 ATR-FTIR Spectra Analysis and Discussion………………………………….76
3.3.5 Principle Components Analysis (PCA) of FTIR Spectra………………………83
3.3.6 IR Spectra Library of Fish Oil Supplements…………………………………...95
3.4 Qualitative Characterization of Fish Oil Supplements by Micro-Raman……...97
3.4.1 Fish Oil Samples and Reference Material……………………………………...97
3.4.2 Micro-Raman Instrumentation and Spectral Acquisition………………………97
3.4.3 Software Assistance…………………………………………………………….98
3.4.4 Micro-Raman Spectra Analysis and Discussion………………………………..98
3.4.5 Principle Components Analysis of Raman Spectra…………………………....102
3.5 Quatitative Characterization of Fish Oil Supplements by ATR-FTIR……..….108
3.5.1 Principle………………………………………………………………………..108
3.5.2 ATR-FTIR Instrumentation and Spectral Acquisition…………………………110
3.5.3 Materials………………………………………………………………………..111
3.5.4 Fish Oil Samples……………………………………………………………….111
3.5.5 Procedures and Results………………………………………………………...112
3.5.6 Summary……………………………………………………………………….120
viii
3.6 Two-Dimensional FTIR Spectral Correlation Analysis of Omega-3
Fatty Acids (EPA Esters)………………………………………………………121
3.6.1 Objective……………………………………………………………………….121
3.6.2 Materials……………………………………………………………………….121
3.6.3 Instrumentation and Data Acquisition…………………………………………121
3.6.4 2D Correlation Analysis……………………………………………………….122
3.6.5 Results and discussion…………………………………………………………124
3.7 Conclusion……………………………………………………………………..144
Chapter 3 References…………………………………………………………..145
Chapter 4 – Summary………………………………………………………………….149
Curriculum Vitae………………………………………………………………………150

ix
List of Tables
Table 1-1 Case study……………………………………………………………….26
Table 2-1 Absorbance Response Data Comparison………………………………..45
Table 2-2 Absorbance Response Data Comparison………………………………..46
Table 2-3 Linearity Data of Dimethicone without Cyclomethicone……………....48
Table 2-4 Linearity Data of Cyclomethicone without Dimethicone……………….49
Table 2-5 Linearity Data of Dimethicone with Constant Cyclomethicone
Concentration…………………………………………………………....49
Table 2-6 Linearity Data of Cyclomethicone with Constant Dimethicone
Concentration………………………………………………………...….50
Table 2-7 Summary of Accuracy Results…………………………………………..55
Table 2-8 Summary of Accuracy Results…………………………………………..56
Table 2-9 Summary of Repeatability Results……………………………………....56
Table 2-10 Summary of Repeatability Results……………………………………....57
Table 2-11 Summary of Placebo Stress Conditions and Results…………………….59
Table 2-12 Summary of Standard and Sample Stress Conditions and Results……...59
Table 2-13 Assay Results by Different Lots Standards……………………………...64
Table 3-1 Fish Oil Supplement Sample List………………………………………..77
Table 3-2 Major Characteristic IR absorption Bands of Fish Oils………………....79
Table 3-3 Fish Oil Supplements in Group I by PCA Analysis……………………..87
Table 3-4 Fish Oil Supplements in Group II by PCA Analysis…………………….89
Table 3-5 Fish Oil Supplements in Group III by PCA Analysis……………………91
Table 3-6 Fish Oil Supplements in the Group IV by PCA Analysis……………….92

x
Table 3-7 Identified Chemical Forms of Fish Oil Supplements…………………...94
Table 3-8 Major Raman Band Assignments of Fish Oils…………………………100
Table 3-9 Fish Oil Supplements in the Group I, II, and III by Raman PCA……..106
Table 3-10 Fish Oil Supplements in the Group IV by Raman PCA……………….107
Table 3-11 Composition of in-house blended fish oil sample……………………..108
Table 3-12 Details of Standard Addition Sample Preparations……………………113
Table 3-13 Absorbance Results of Each Sample Preparation (in-house made)…...114
Table 3-14 Details of Standard Addition Sample Preparations (MaxEPA)……….116
Table 3-15 Absorbance Results of Each Sample Preparation (MaxEPA)…………117
Table 3-16 Details of Standard Addition Sample Preparations (Omarcor)………..119
Table 3-17 Absorbance Results of Each Sample Preparation (Omarcor)………….119

xi
List of Illustrations
Figure 1-1 Vibrational energy diagram…………………………….………………..1
Figure 1-2 Six different vibrations of CH2 groups……………………………….….2
Figure 1-3 Diagram of a typical FTIR instrumentation……………………………..5
Figure 1-4 IR beam interaction with ATR and sample……………………………...7
Figure 1-5 Basic diagram for a 2D correlation experiment………………………….9
Figure 1-6 Contour map of a synchronous 2D correlation spectrum…………….…11
Figure 1-7 Contour map of an asynchronous 2D correlation spectrum…………….12
Figure 1-8 Energy level diagram showing the states involved in Raman signal…...15
Figure 1-9 Diagram of a dispersive Raman spectrometer…………………………..19
Figure 1-10 Diagram of PC-coordinate data system………………………………....24
Figure 1-11 Scores plot of the first two PCs for the case study……………………...27
Figure 1-12 Loading plot of the first two PCs for the case study…………………....27
Figure 2-1 Chemical structure of dimethicone……………………………………...32
Figure 2-2 Chemical structure of cyclomethicone……………………………….....32
Figure 2-3 FTIR spectrum of dimethicone in o-xylene solvent………………….....34
Figure 2-4 FTIR spectrum of cyclomethicone in o-xylene solvent………………....34
Figure 2-5 A typical IR spectrum of a skin protective ointment sample in o-xylene.38
Figure 2-6 IR spectrum of a placebo sample in o-xylene……………………….......38
Figure 2-7 Linearity of dimethicone without cyclomethicone at 1258.50 cm-1
….....50
Figure 2-8 Linearity of dimethicone without cyclomethicone at 800.00 cm-1
……...51
Figure 2-9 Linearity of cyclomethicone without dimethicone at 1258.50 cm-1
…….51
Figure 2-10 Linearity of cyclomethicone without dimethicone at 800.00 cm-1
……...52

xii
Figure 2-11 Linearity of dimethicone with constant cyclomethicone
concentration at 1258.50 cm-1
…………………………………………...52
Figure 2-12 Linearity of dimethicone with constant cyclomethicone
concentration at 800.00 cm-1
…………………………………………….53
Figure 2-13 Linearity of cyclomethicone with constant dimethicone
concentration at 1258.50 cm-1
………………………………………......53
Figure 2-14 Linearity of cyclomethicone with constant dimethicone
concentration at 800.00 cm-1
……………………………………………54
Figure 2-15 IR spectrum of placebo stored at 70ºC / 7 days………………………...60
Figure 2-16 IR spectrum of placebo stored under light / 7 days…………………….60
Figure 2-17 IR spectrum of dimethicone standard stored at 70ºC / 7 days………….61
Figure 2-18 IR spectrum of dimethicone standard under light / 7 days…………......61
Figure 2-19 IR Spectrum of cyclomethicone standard at 70ºC / 7 days…………….62
Figure 2-20 IR spectrum of cyclomethicone standard under light / 7 days…………62
Figure 2-21 IR spectrum of sample stored at 70ºC / 7 days………………………...63
Figure 2-22 IR spectrum of sample stored under light / 7 days……………………..63
Figure 3-1 Chemical structure of EPA……………………………………………..68
Figure 3-2 Chemical structure of DHA…………………………………………....68
Figure 3-3 TAG where R’s are EPA or DHA or combinations……………………69
Figure 3-4 Ethyl ester of EPA……………………………………………………...69
Figure 3-5 A typical fish oil product label…………………………………………73
Figure 3-6 An example of correct label…………………………………………….73
Figure 3-7 A typical FTIR spectrum of fish oil supplements……………………...79

xiii
Figure 3-8 FTIR spectra of samples MaxEPA Fish Oil Concentration and Jean
Carpers Omega T formula……………………………………………....80
Figure 3-9 FTIR spectra of ethyl esters of EPA and DHA………………………....81
Figure 3-10 FTIR spectra of triglycerides of EPA and DHA………………………..81
Figure 3-11 The carbonyl bands of the four reference standards…………………....82
Figure 3-12 Differentiate fish oil supplements with –C=O (ester) bands……………83
Figure 3-13 Overlay spectra of the MaxEPA Fish Oil Concentrate
analyzed at different time……………………………………………….84
Figure 3-14 Subtracted spectra of MaxEPA fish oil r2_04-14-17and MaxEPA fish
oil_03-19-07 against reference spectrum of MaxEPA fish oil
r1_04-14-17……………………………………………………………..85
Figure 3-15 PCA scores plot (PC1 vs. PC2) of FTIR spectra of
fish oil supplements…………………………………………………….86
Figure 3-16 PCA loading plot (PC1 vs. PC2)……………………………………….86
Figure 3-17 FTIR spectra of six fish oil samples in group I…………………………88
Figure 3-18 FTIR spectra of fish oil samples in group II……………………………90
Figure 3-19 IR spectra of fish oil samples in group III………………………………91
Figure 3-20 FTIR spectra of 6 fish oil samples in group IV…………………………93
Figure 3-21 An example of spectral ID library search……………………………....97
Figure 3-22 Raman spectra of ethyl ester of EPA collected on glass and Al slides…99
Figure 3-23 Raman spectra of 4 reference standards………………………………...99
Figure 3-24 Examples of Raman spectra of fish oil supplements…………………..100
Figure 3-25 Comparison of IR and Raman spectra of ethyl ester of EPA……….....101

xiv
Figure 3-26 PCA scores plot (PC1 vs. PC2) of Raman spectra…………………......103
Figure 3-27 PCA loading plot (PC1 vs. variables)……………………………….....103
Figure 3-28 PCA scores plot (PC1 vs. PC3)………………………………………...104
Figure 3-29 PCA scores plot (PC1 vs. PC4)………………………………………...104
Figure 3-30 PCA scores plot (PC1 vs. PC5)………………………………………...105
Figure 3-31 PCA scores plot (PC1 vs. PC6)………………………………………...105
Figure 3-32 Overlay of IR Spectra of ethyl esters of EPA and oleic acid…………..110
Figure 3-33 Overlay of IR spectra of ethyl EPA and mineral oil…………………...113
Figure 3-34 Standard addition calibration plot (In-house made sample analysis).....115
Figure 3-35 Standard addition calibration plot (MaxEPA sample analysis)…….....117
Figure 3-36 Standard addition calibration plot (Omarcor sample analysis)………..119
Figure 3-37 Spectra measurement of sample placed on the Al heating block……...123
Figure 3-38 FTIR spectra overlay of ethyl EPA (a), and triglyceride EPA (b), at
temperatures ranging from 10⁰C to 150⁰C…………………………….126
Figure 3-39 PCA scores plot of ethyl EPA IR spectra (a), and PCA scores plot of
triglyceride EPA IR spectra (b), at different temperatures…………….127
Figure 3-40 1D IR (a), 2D IR Synchronous (b), and 2D IR Asynchronous (c),
spectra of ethyl EPA in 3080 - 2760 cm-1
region………………………129
Figure 3-41 1D IR (a), 2D IR Synchronous (b), and 2D IR Asynchronous (c),
spectra of ethyl EPA in 1830 - 1620 cm-1
region………………………132
Figure 3-42 Overlap spectra of ethyl EPA at 20⁰C and 20⁰C – return…………......133
Figure 3-43 1D IR (a), 2D IR Synchronous (b), and 2D IR Asynchronous (c),
spectra of ethyl EPA in 1120 - 850 cm-1
region……………………….135
xv
Figure 3-44 1D IR (a), 2D IR Synchronous (b), and 2D IR Asynchronous (c),
spectra of ethyl EPA in 850 - 1120 cm-1
region………………………..137
Figure 3-45 1D IR (a), 2D IR Synchronous (b), and 2D IR Asynchronous (c)
spectra of triglyceride EPA in 3080 - 2760 cm-1
region……………….139
Figure 3-46 1D IR (a), 2D IR Synchronous (b), and 2D IR Asynchronous (c),
spectra of triglyceride EPA in 1830 - 1620 cm-1
region……………….141
Figure 3-47 1D IR (a), 2D IR Synchronous (b), and 2D IR Asynchronous (c)
spectra of triglyceride EPA in 1280 - 840 cm-1
region…………………143
1
Chapter 1: Analytical Techniques Overview
1.1 Fourier Transform Infrared (FTIR) Spectroscopy
1.1.1 Theory of Infrared Absorption
Infrared spectroscopy utilizes the fact that molecules have specific frequencies at
which they rotate or vibrate corresponding to discrete energy levels (vibrational modes).
The far-infrared, approximately 400-10 cm-1
, has low energy and may be used for
rotational spectroscopy. The mid-infrared, the region of most interest for chemical
analysis, which corresponds to changes in vibrational energies within molecules
approximately 4000-400 cm-1
may be used to study the fundamental vibrations and
associated rotational-vibrational structure. The higher energy near-IR, approximately
13300-4000 cm-1
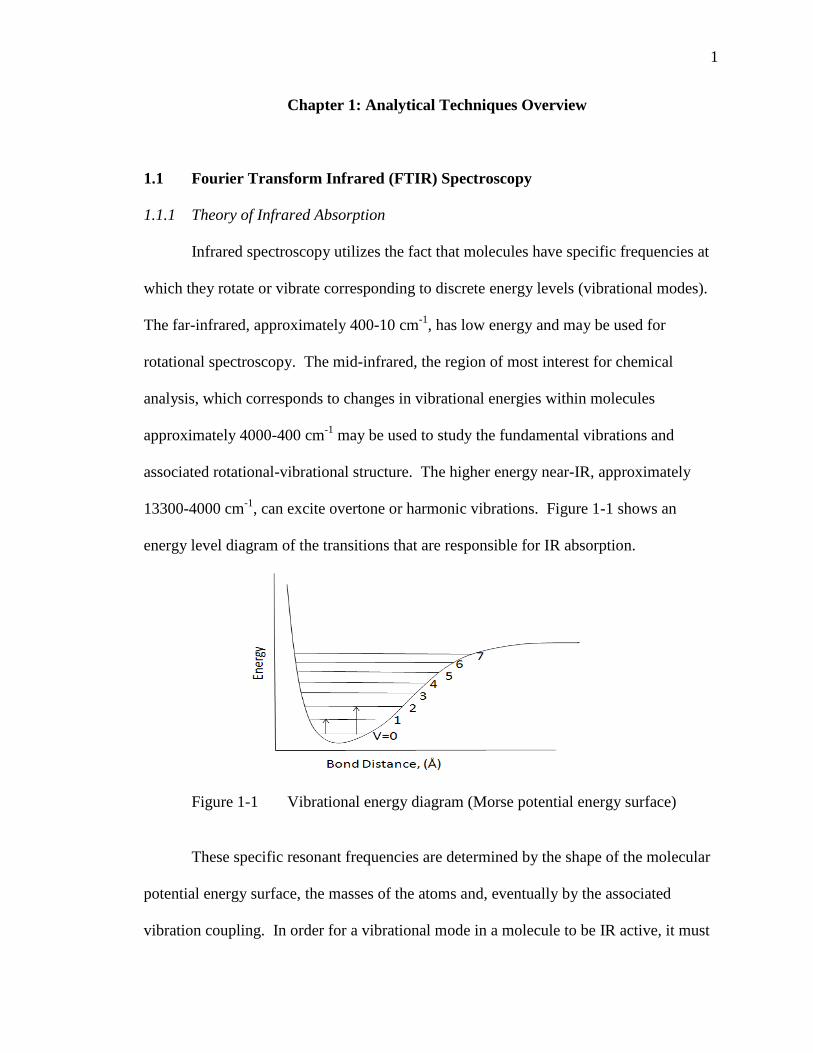
, can excite overtone or harmonic vibrations. Figure 1-1 shows an
energy level diagram of the transitions that are responsible for IR absorption.
Figure 1-1 Vibrational energy diagram (Morse potential energy surface)
These specific resonant frequencies are determined by the shape of the molecular
potential energy surface, the masses of the atoms and, eventually by the associated
vibration coupling. In order for a vibrational mode in a molecule to be IR active, it must

2
be associated with changes in the permanent dipole moment. Equation (1-1) shows that
the dipole moment µ is related to the bond distance r, and Equation (1-2) shows that the
IR energy transition probability R is related to a change in dipole moment (Əµ/Ər).
(1-1)
R = ∫ Ψi [ µ0 + (r-re) (Əµ/Ər)0 ] Ψi dτ (1-2)
The number of predicted vibrational modes in a molecule with N atoms can be
determined by 3N-6 for non-linear molecules and 3N-5 for linear molecules. Under
experimental conditions, the number of observed absorption bands will be more or less
and will depend on the instrumentation and the physical properties of the molecule and its
state of matter. Simple diatomic molecules have only one bond, which may stretch.
More complex molecules have many bonds, and vibrations can be conjugated, leading to
infrared absorptions at characteristic frequencies that may be related to chemical groups.
For example, the atoms in a CH2 group, commonly found in organic compounds can
vibrate in six different ways: symmetrical and antisymmetrical stretching, scissoring,
rocking, wagging and twisting as shown in Figure 1-2.
Figure 1-2 Six different vibrations of CH2 group
....)r
()r-r(2
1)
r)(r-r(= o2
22
eoeo

3
The infrared spectrum of a sample is collected by passing a beam of infrared light
through the sample. Examination of the transmitted light reveals how much energy was
absorbed at each wavelength. Analysis of these absorption characteristics reveals details
about the molecular structure of the sample. This technique works almost exclusively on
samples with covalent bonds. Simple spectra are obtained from samples with few IR
active bonds and high levels of purity. More complex molecular structures lead to more
absorption bands and more complex spectra. Thus, IR spectroscopy is an important and
popular tool for structural elucidation and compound identification.
1.1.2 Development of FTIR
The development of FTIR would have been impossible without the use of the
Michelson interferometer (The instrument used to interfere the waves together is called
an interferometer) which was invented by Albert Abraham Michelson in 1880 1.
Unfortunately, the time consuming calculation needed to convert an interferogram into a
spectrum made the usage of an interferometer to obtain spectra impractical. The
invention of computers and advances in how computers perform mathematical operations
made Fourier transform IR a reality. The major advance in this area was made by
J.W.Cooley and J.W. Tukey, who invented Fast Fourier Transform (FFT, Cooley-Tukey
Algorithm)2-3
. This algorithm quickly performs Fourier transforms on a computer and
the marriage of the FFT algorithm and minicomputers was the breakthrough that made
FTIR possible.
The first commercially available FTIRs were manufactured by Digilab, a
company of Block Engineering in Cambridge, Massachusetts in 1960s 4. These
instruments made feasible acquiring high resolution data in a short period of times, and
4
established the advantages of FTIR over previous means of obtaining IR spectra. Since
the 1960s many other companies have begun manufacturing and selling FTIRs in United
States. Nicolet Instruments was introduced in mid-1970, and quickly became one of the
largest FTIR manufactures. Perkin-Elmer FTIR instrumentation was introduced to
market in the early 1980s, and these FTIRs were amongst the first to be used in quality
control labs due to their low cost, and opened up a whole new market for FTIR.
The advantages of FTIR quickly gave rise to adaptation of attenuated total
reflectance (ATR) 5 and diffuse reflectance (DRIFTS)
6 for the rapid and reproducibility
analysis of liquids and solids. A major advance in the kinds of samples that can be
analyzed by FTIR occurred with the introduction of the FTIR microscopy in the early
1980s7. This allows the IR spectra of the samples as small as 10 microns in diameter to
be obtained.
The current status of FTIR technology is very exciting. A new GC-FTIR
interface using cryogenic trapping8 has pushed the minimum amount of material an FTIR
can detect to less than 100 picograms. Development of dynamic alignment and step
scanning interferometers allow microsecond kinetic studies, photoacoustic depth
profiling, and two-dimensional IR spectroscopy to be performed. Finally, the number of
applications of the more established techniques is constantly growing, making FTIR more
and more useful.
1.1.3 Sampling and Instrumentation
Infrared spectra can be obtained by different sampling techniques. Liquid
samples can be sandwiched between two plates of a high purity salt (commonly sodium
chloride, sometime other salts such as potassium bromide or calcium fluoride are also

5
used). The plates are transparent to the infrared light and will not introduce any
interference onto the spectra. Some salt plates are soluble in water, and so the sample
and washing reagents must be anhydrous (without water). For solid samples, the
common way is to grind a quantity of the sample with a purified salt (usually potassium
bromide) finely. This powder mixture is then crushed in a mechanical die press to form a
translucent pellet through which the beam of the spectrometer can pass. Gaseous samples
require little preparation beyond purification, but a sample cell with a long path length
(typically 5-10 cm) is normally needed, as gases show relatively weak absorbances.
Spectra obtained from different sample preparation methods will look slightly different
from each other due to the different physical states the sample is in.
Figure 1-3 shows a typical FTIR spectrometer. It consists of a source,
Interferometer (beamsplitter and two mirrors), sample compartment, and a detector. The
IR light is guided through an Interferometer. After passing through the sample, where
some energy is absorbed and some is transmitted. The transmitted portion reaches the
detector, which records the total intensity. The measured signal is the interferogram.
This signal is digitized and processed using a computer by performing a mathematical
Fourier Transform on this signal results in a spectrum. The final spectrum can be
presented as transmittance (%T) or absorbance, the computer easily performs this
conversion.
Source Interferometer Sample Detector Computer
Figure 1-3 Diagram of a typical FTIR instrumentation
6
Another commonly used sampling technique is attenuated total reflectance (ATR)
where solid and liquid samples can be analyzed without sample preparation. In ATR, the
IR beam contacts the sample by a diamond or other crystal (germanium, etc.) with a high
index of refraction and penetrates the sample a few microns depending on the refractive
index of the sample. The depth of penetration (dp) can be determined using the following
equation (1-3):
(1-3)
where nsp and np are the ratio of the refractive indices of the sample vs the support and the
support respectively. Theta is the angle of incidence and λ is the wavelength. For ZnSe
and a polymer sample, depth is 2.0 mm at 1,000 cm-1.
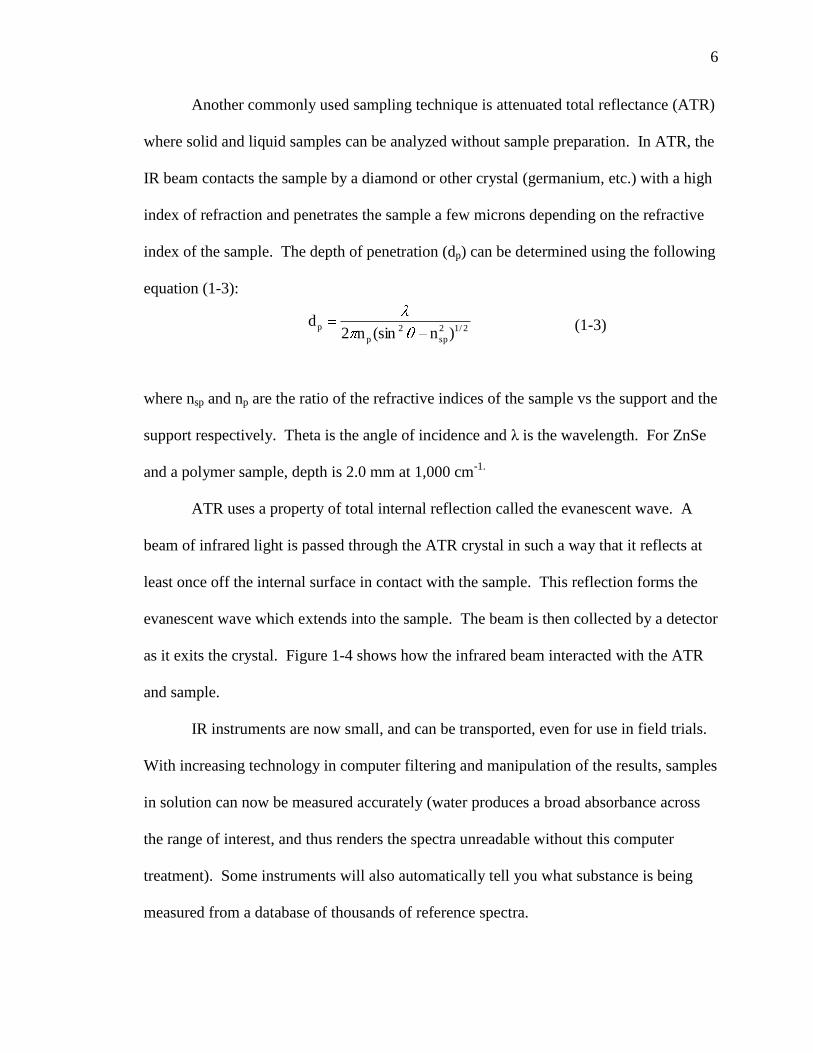
ATR uses a property of total internal reflection called the evanescent wave. A
beam of infrared light is passed through the ATR crystal in such a way that it reflects at
least once off the internal surface in contact with the sample. This reflection forms the
evanescent wave which extends into the sample. The beam is then collected by a detector
as it exits the crystal. Figure 1-4 shows how the infrared beam interacted with the ATR
and sample.
IR instruments are now small, and can be transported, even for use in field trials.
With increasing technology in computer filtering and manipulation of the results, samples
in solution can now be measured accurately (water produces a broad absorbance across
the range of interest, and thus renders the spectra unreadable without this computer
treatment). Some instruments will also automatically tell you what substance is being
measured from a database of thousands of reference spectra.
2/12
sp
2
p
p)n(sinn2
d
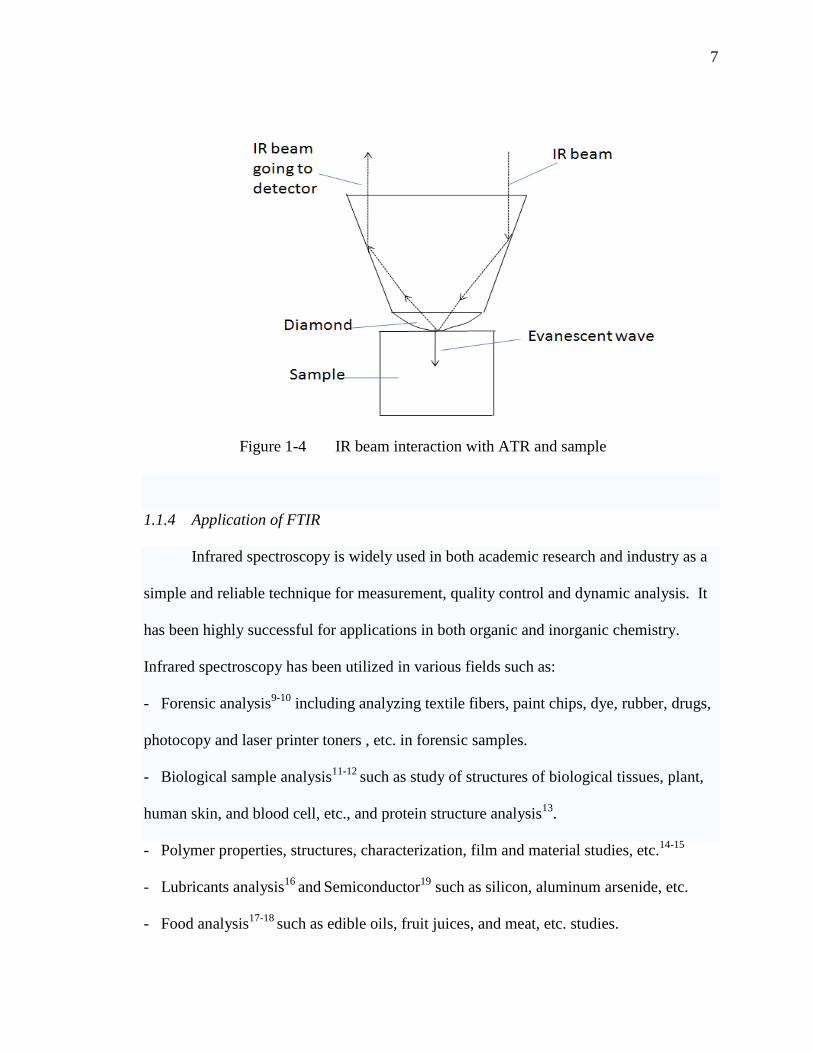
7
Figure 1-4 IR beam interaction with ATR and sample
1.1.4 Application of FTIR
Infrared spectroscopy is widely used in both academic research and industry as a
simple and reliable technique for measurement, quality control and dynamic analysis. It
has been highly successful for applications in both organic and inorganic chemistry.
Infrared spectroscopy has been utilized in various fields such as:
- Forensic analysis9-10
including analyzing textile fibers, paint chips, dye, rubber, drugs,
photocopy and laser printer toners , etc. in forensic samples.
- Biological sample analysis11-12
such as study of structures of biological tissues, plant,
human skin, and blood cell, etc., and protein structure analysis13
.
- Polymer properties, structures, characterization, film and material studies, etc.14-15
- Lubricants analysis16
and Semiconductor
19 such as silicon, aluminum arsenide, etc.
- Food analysis17-18
such as edible oils, fruit juices, and meat, etc. studies.

8
1.2 Two-Dimentional Infrared (2D-IR) Spectroscopy
1.2.1 Introduction of Generalized 2D Correlation Spectroscopy
The success of 2D NMR motivated the desire to extend this powerful concept into
other optical spectroscopy applications. However, it was very difficult to implement the
experimental approach based on multiple pulses in optical wavelengths, which has been
so successfully employed in 2D NMR using radio frequency excitations. The
characteristic time scale of molecular vibration observed in IR absorption spectroscopy is
on the order of picosecond, compared to the micro to millisecond ranges usually
encountered in NMR. Nowadays, it has become possible to conduct certain experiments
based on ultrafast femosecond optical pulse in a fashion analogous to pulse-based 2D
NMR experiments. However, optical 2D spectroscopy using a conventional commercial
spectrometer might not be quite feasible if one is forced to employ the same approach
used in NMR.
A conceptual breakthrough in the development of practical optical 2D
spectroscopy was first proposed by Noda in 198620 - 22
. Later the concept evolved into
the so-called generalized 2D correlation spectroscopy that has become a powerful tool for
the detailed analysis of various spectral data23
. The 2D experiments in optical
spectroscopy can be carried out with a conventional spectrometer by introducing a
relatively slow external perturbation applied to the system of interest. When a certain
perturbation (such as temperature, pressure, concentration, stress, electrical field, etc) is
applied to a sample, various chemical constituents of the system are selectively excited or
transformed. The perturbation-induced changes, such as excitation and subsequent
relaxation toward the equilibrium, can be monitored with electromagnetic probes such as
9
an IR beam or laser (Raman) to generate so-called dynamic spectra. The intensity
changes, band shifts, and changes in the band shapes are typical spectral variations
observed under external perturbation. In a typical 2D experiment, a series of
perturbation-induced dynamic spectra are collected in some sequential order. Such a set
of spectra may be readily manipulated mathematically, with the use of a simple scheme
of correlation analysis, to yield desired 2D correlation spectra24 - 25
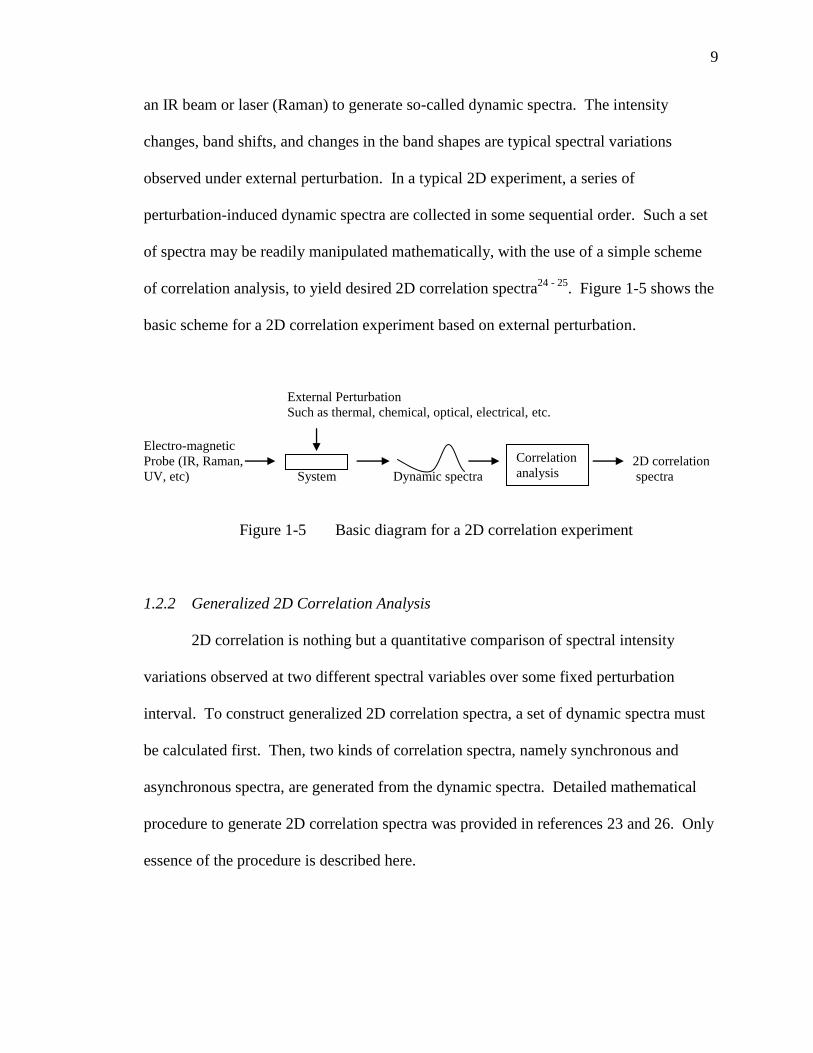
. Figure 1-5 shows the
basic scheme for a 2D correlation experiment based on external perturbation.
External Perturbation
Such as thermal, chemical, optical, electrical, etc.
Electro-magnetic
Probe (IR, Raman, 2D correlation
UV, etc) System Dynamic spectra spectra
Figure 1-5 Basic diagram for a 2D correlation experiment
1.2.2 Generalized 2D Correlation Analysis
2D correlation is nothing but a quantitative comparison of spectral intensity
variations observed at two different spectral variables over some fixed perturbation
interval. To construct generalized 2D correlation spectra, a set of dynamic spectra must
be calculated first. Then, two kinds of correlation spectra, namely synchronous and
asynchronous spectra, are generated from the dynamic spectra. Detailed mathematical
procedure to generate 2D correlation spectra was provided in references 23 and 26. Only
essence of the procedure is described here.
Correlation
analysis

10
For a spectral intensity variation y (v, t) observed as a function of a spectral
variable v during an interval of some additional variable t between Tmin and Tmax, the
dynamic spectrum ỹ (v, t) is defined as:
y(v, t) – ў(v) for Tmin ≤ t ≤ Tmax
ỹ (v, t) =
0 otherwise (1-4)
where ў is the reference spectrum of the system. The selection of a reference spectrum is
not strict, but in most of cases, ў(v) is the averaged spectrum defined by the following
equation:
1
ў(v)= (v, t) dt (1-5)
Tmax - Tmin
A formal definition of the generalized 2D correlation spectrum X (v1, v2) is given by:
X (v1, v2) = Φ(v1, v2)+ iΨ(v1, v2) = (1-6)
where the two orthogonal components Φ(v1, v2) and Ψ(v1, v2) are the synchronous and
asynchronous 2D correlation intensity, respectively. The synchronous 2D correlation
intensity Φ(v1, v2) represents the overall similarity between two separate spectral intensity
variations measured at different spectral variables when an external perturbation is
applied. The asynchronous 2D correlation intensity Ψ(v1, v2), on the other hand, is
regarded as a measure of dissimilarity of the spectral intensity variations. The term
Ŷ1( ) is the Fourier transform of the spectral intensity ỹ (v1, t) observed at some spectral
variable v1 and likewise, Ŷ2( ) is the Fourier transform of the spectral intensity ỹ (v2, t)
observed at some spectral variable v2.
11
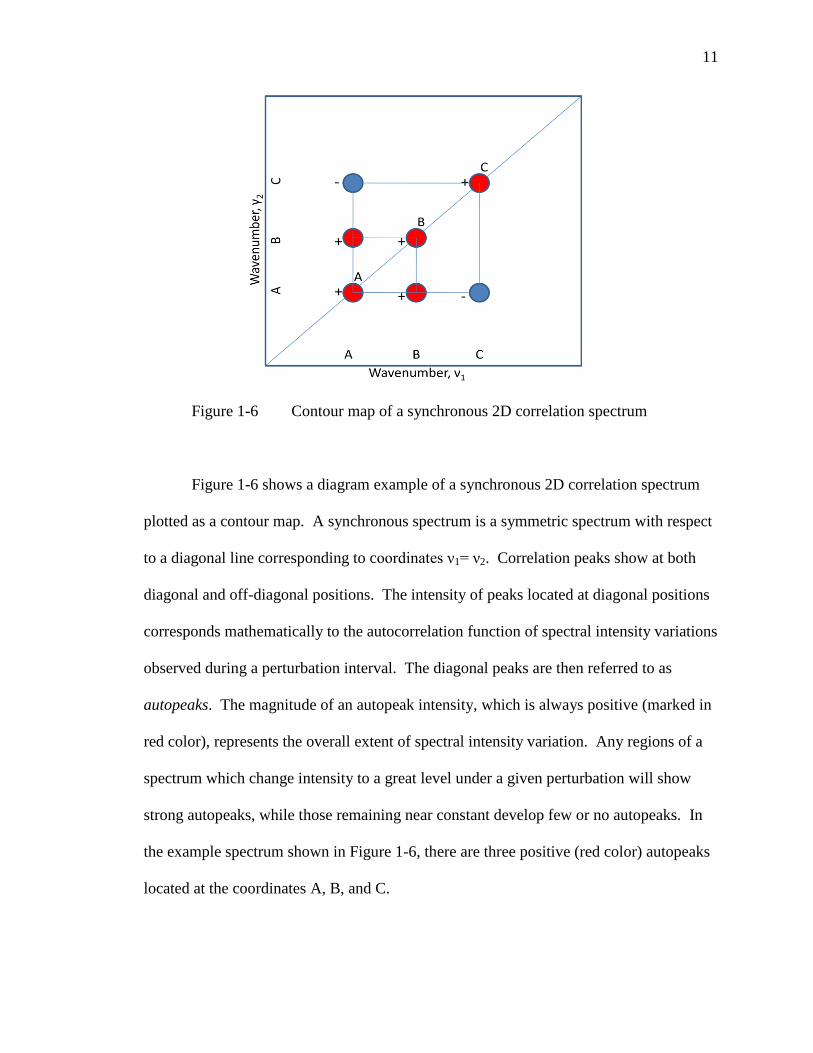
Figure 1-6 Contour map of a synchronous 2D correlation spectrum
Figure 1-6 shows a diagram example of a synchronous 2D correlation spectrum
plotted as a contour map. A synchronous spectrum is a symmetric spectrum with respect
to a diagonal line corresponding to coordinates ν1= ν2. Correlation peaks show at both
diagonal and off-diagonal positions. The intensity of peaks located at diagonal positions
corresponds mathematically to the autocorrelation function of spectral intensity variations
observed during a perturbation interval. The diagonal peaks are then referred to as
autopeaks. The magnitude of an autopeak intensity, which is always positive (marked in
red color), represents the overall extent of spectral intensity variation. Any regions of a
spectrum which change intensity to a great level under a given perturbation will show
strong autopeaks, while those remaining near constant develop few or no autopeaks. In
the example spectrum shown in Figure 1-6, there are three positive (red color) autopeaks
located at the coordinates A, B, and C.
12
Cross peaks located at the off-diagonal positions of a synchronous 2D spectrum
represent concurrent or coincidental changes of spectral intensities observed at two
different spectral variables, ν 1 and ν 2. Such a synchronized change suggests the
possible existence of a coupled or related origin of the spectral intensity variations.
While the sign of autopeaks is always positive, the sign of cross peaks can be either
positive (in red color) or negative (in blue color). The sign of synchronous cross peaks
becomes positive if the spectral intensities at the two spectral variables corresponding to
the coordinates of the cross peak are either increasing or decreasing together as functions
of the external variable during the observation interval. On the other hand, a negative
sign of cross peaks indicates that one of the spectral intensities is increasing while the
other is decreasing. In the example spectrum Figure 1-6, the sign of cross peaks at
coordinates A and B is positive, indicating that the spectral intensities at both bands A
and B increase (or decrease) together. The sign of cross peaks at coordinates A and C is
negative, indicating that intensity at one band is increasing while the other one is
decreasing.
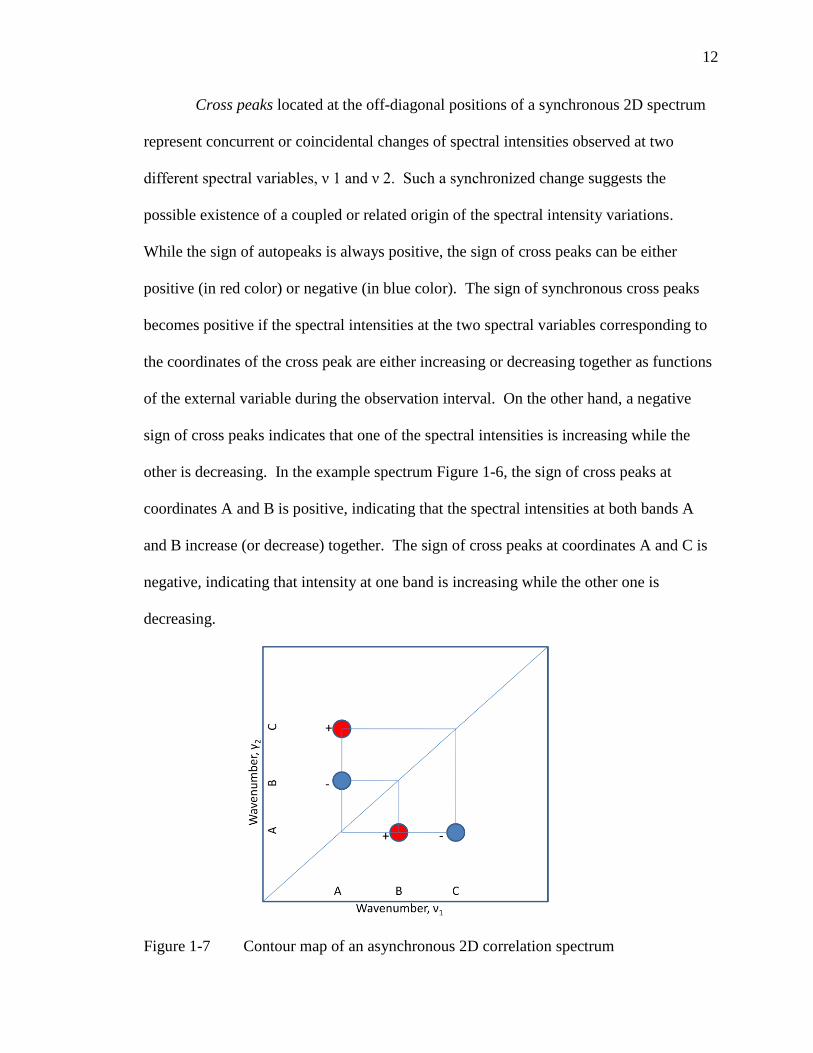
Figure 1-7 Contour map of an asynchronous 2D correlation spectrum
13
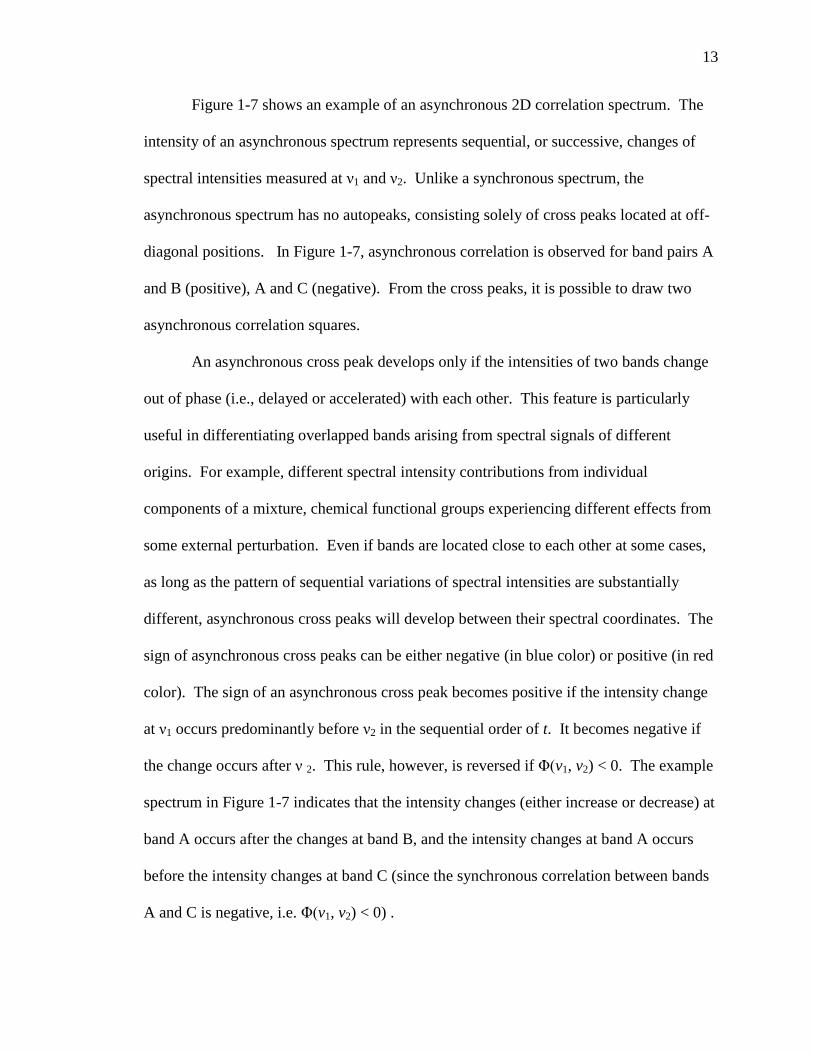
Figure 1-7 shows an example of an asynchronous 2D correlation spectrum. The
intensity of an asynchronous spectrum represents sequential, or successive, changes of
spectral intensities measured at ν1 and ν2. Unlike a synchronous spectrum, the
asynchronous spectrum has no autopeaks, consisting solely of cross peaks located at off-
diagonal positions. In Figure 1-7, asynchronous correlation is observed for band pairs A
and B (positive), A and C (negative). From the cross peaks, it is possible to draw two
asynchronous correlation squares.
An asynchronous cross peak develops only if the intensities of two bands change
out of phase (i.e., delayed or accelerated) with each other. This feature is particularly
useful in differentiating overlapped bands arising from spectral signals of different
origins. For example, different spectral intensity contributions from individual
components of a mixture, chemical functional groups experiencing different effects from
some external perturbation. Even if bands are located close to each other at some cases,
as long as the pattern of sequential variations of spectral intensities are substantially
different, asynchronous cross peaks will develop between their spectral coordinates. The
sign of asynchronous cross peaks can be either negative (in blue color) or positive (in red
color). The sign of an asynchronous cross peak becomes positive if the intensity change
at ν1 occurs predominantly before ν2 in the sequential order of t. It becomes negative if
the change occurs after ν 2. This rule, however, is reversed if Φ(v1, v2) < 0. The example
spectrum in Figure 1-7 indicates that the intensity changes (either increase or decrease) at
band A occurs after the changes at band B, and the intensity changes at band A occurs
before the intensity changes at band C (since the synchronous correlation between bands
A and C is negative, i.e. Φ(v1, v2) < 0) .

14
It is obvious that the 2D correlation spectrum consists of much sharper and better
resolved peaks than the corresponding 1D spectrum. The enhancement of resolution is a
direct outcome of spreading highly overlapped peaks along the second dimension. The
appearance of positive and negative cross peaks located at the off-diagonal positions of a
2D spectrum indicates various forms of correlation features among spectral bands.
Correlation among bands that belong to, for instance, the same chemical group, or groups
interacting strongly, can be well investigated by 2D spectra.
1.2.3 Applications of 2D Correlation Spectroscopy
Nowadays, 2D correlation spectroscopy is used in various field including
analytical and physical chemistry, material, biological, medical, food and agriculture
science and technology, and chemical industries. The technique is establishing itself as a
powerful general tool for the analysis of spectroscopic data. It is applied to investigations
of inter and intramolecular interactions27-30
, denaturation of protein31-32
, melting behavior
of polymers33
, chemical reactions
34-35, electrochemistry
36, adsorption
37, photochemistry
38,
rheology39
, and many more40
.
1.3 Raman Spectroscopy
1.3.1 Theory of Raman Spectroscopy
Raman spectroscopy is a spectroscopic technique based on inelastic scattering of
monochromatic light, usually from a laser source. Inelastic scattering means that the
frequency of photos in monochromatic light changes upon interaction with sample.
Photos of the laser light are absorbed by the sample and then reemitted. Frequency of the
reemitted photons is shifted up or down in comparison with the original monochromatic
15
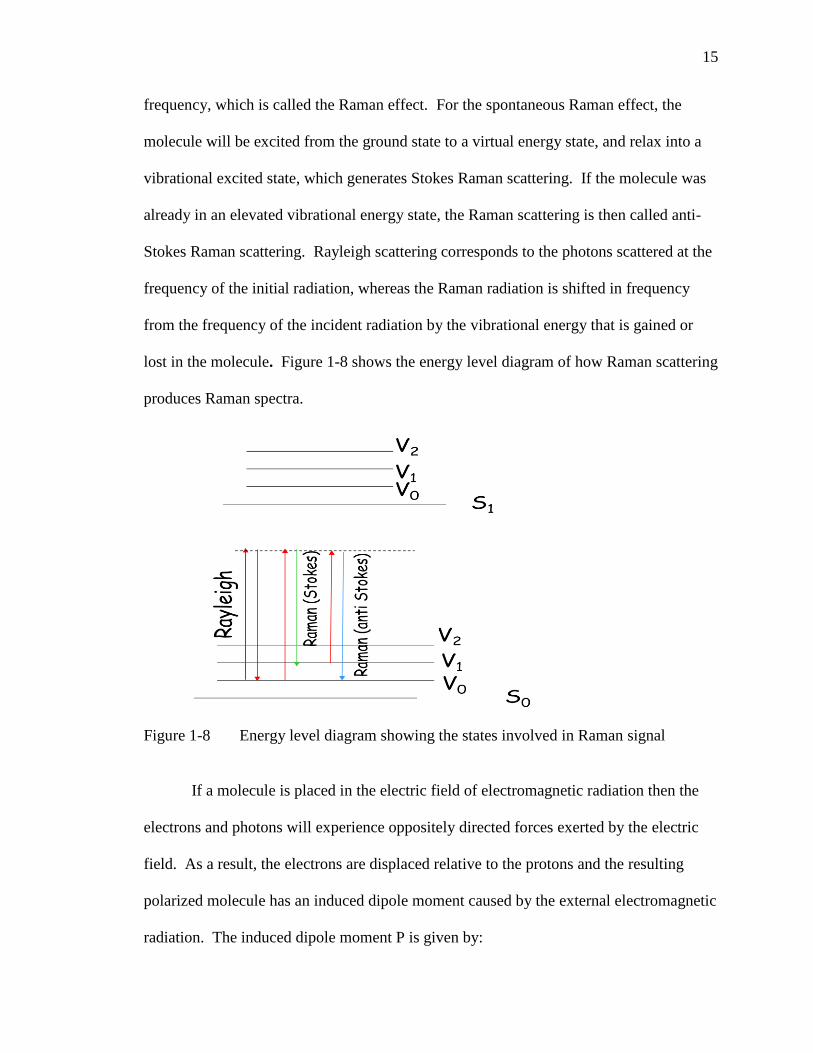
frequency, which is called the Raman effect. For the spontaneous Raman effect, the
molecule will be excited from the ground state to a virtual energy state, and relax into a
vibrational excited state, which generates Stokes Raman scattering. If the molecule was
already in an elevated vibrational energy state, the Raman scattering is then called anti-
Stokes Raman scattering. Rayleigh scattering corresponds to the photons scattered at the
frequency of the initial radiation, whereas the Raman radiation is shifted in frequency
from the frequency of the incident radiation by the vibrational energy that is gained or
lost in the molecule. Figure 1-8 shows the energy level diagram of how Raman scattering
produces Raman spectra.
Figure 1-8 Energy level diagram showing the states involved in Raman signal
If a molecule is placed in the electric field of electromagnetic radiation then the
electrons and photons will experience oppositely directed forces exerted by the electric
field. As a result, the electrons are displaced relative to the protons and the resulting
polarized molecule has an induced dipole moment caused by the external electromagnetic
radiation. The induced dipole moment P is given by:

16
P= E= E0 cos 2 t
= 0E0 cos 2 t + (Ə /Əq)0 q0E0 cos 2 t cos 2 t
= 0E0 cos 2 t
+ (Ə /Əq)0 q0E0{ cos [2 t] + cos [2 t]} (1-7)
According to classical theory, the first term describes an oscillating dipole which radiates
light of frequency (Rayleigh scattering). The second term gives Raman scattering of
frequencies + i (anti-Stokes) and – i (Stokes). If there is no change in
polarizability, the second term disappears. Therefore, there must be a change in
polarizability during the vibration in order for Raman scattering to occur. The amount of
the polarizability change will determine the Raman scattering intensity, whereas the
Raman shift is equal to the vibrational level that is involved. The scattered light intensity
(vibrational transition m to n) is given by:
(1-8)
where N is number of molecules, v0 is incident light frequency, vmn is vibration
frequency, is polarizability, and E is electric field strength.
Different vibrational modes include: symmetrical stretch, asymmetrical stretch,
bending, and twisting. Raman spectroscopy is ideal for organic and inorganic
compounds that contain symmetrical bonds such as C=C. Raman and IR are
complimentary vibrational spectroscopic techniques. If a vibrational mode is strong in
the IR due to a large change in dipole moment, then it is weak in Raman because a small
change in the polarizability . If a vibrational mode is strong in the Raman due to a large
2
,
4
0 )()(ji
jmnimnmn ENI
mni )(

17
change in the polarizability, then it is weak in the IR because of a small change in the
dipole moment. By using the two analytical techniques, detailed information of the
molecular structure of a molecule can be elucidated.
1.3.2 Development of Raman Spectroscopy
The Raman effect was named after one of its discoverers, the Indian scientist C.
V. Raman who observed the effect by means of sunlight in 192841
together with K. S.
Krishnan and independently by Russian scientist Grigory Landsberg and Leonid
Mandelstam. Raman won the Nobel Prize in Physics in 1930 for this discovery
accomplished using sunlight, a narrow band photographic filter to create monochromatic
light and a "crossed" filter to block this monochromatic light. He found that light of
changed frequency passed through the "crossed" filter.
Systematic pioneering theory of Raman effect was developed by George Placzek
in 1930-193442
. Subsequently the mercury arc became the principal light source, first
with photographic detection and then with spectrophotometric detection.
The development of lasers in the 1960's spurred interest in the Raman technique
but acceptance was mainly limited to research laboratories. The old style of
instrumentation was based on dispersive grating systems which require skilled operators
just to collect simple spectra. These system need to be constantly maintained and
calibrated since the wavelength scale will drift with changing ambient conditions — such
processes as reliable subtractions and library searches were unthinkable.
In addition to these difficulties, Raman spectroscopy was also afflicted by
fluorescence. Fluorescence is a strong light emission from the sample which interferes
with — and often completely swamps — the weak Raman signal. However, the chance
18
of an unknown sample exhibiting fluorescence is strongly dependent on the wavelength
of the laser used for excitation. Dispersive Raman usually employs visible laser
radiation. Typical laser wavelengths are 780 nm, 633 nm, 532 nm, and 473 nm, although
others are common. The intensity of Raman scatter is proportional to 1/λ4, so there is a
strong enhancement as the excitation laser wavelength becomes shorter.
In 1986, near-infrared excitation and a commercial interferometer-based FT-IR
spectrometer were combined to record a Raman spectrum. This has lead to a number of
advantages. Near-infrared laser excitation (around 1 micron wavelength) greatly reduces
the number of samples prone to fluorescence and allows higher laser powers to be used
without photo decomposition.
Following the demonstration of FT Raman spectroscopy in 1986, the use of
Nd:YAG lasers operating at 1064 nm has been generalized to decrease the fluorescence
level. Optoelectronic devices have progressed dramatically in the past decade as a
consequence of major achievements in solid-state technology. As a result diode lasers
are now available from the visible to the infrared that have been demonstrated to work
properly in Raman instruments in combination with suitable filter sets.
FT-Raman's interferometric data collection produces throughput and multiplex
advantages similar to its counterpart, FT-IR spectroscopy. This can dramatically increase
the speed of data collection and makes sample alignment trivial. Accurate spectral
libraries and quantitative analysis are available for FT-Raman.
Micro-Raman spectroscopy has evolved rapidly from 1966 when it was revealed
that the intensity of Raman light should be independent of sample volume and should
remain essentially constant with decreasing sample size down to the dimension

19
determined by the diffraction limit, and hence the wavelength, of the laser excitation.
With routine limits of detection in the nanogram range and high molecular selectivity,
micro-Raman spectroscopy has now become a major analytical technique of application
in both industry and research. Confocal optical designs and imaging capabilities have
further extended the power of this approach. In nanotechnology, a Raman Microscope
can be used to analyze nanowires to better understand the composition of the structures.
1.3.3 Sampling and Instrumentation
The Raman spectra can be obtained directly on solids, liquids, powders, tablets,
slurries, gels, and suspensions etc. without further sample preparations. There is no
problem for aqueous solution analysis, which is a major advantage for Raman analysis.
There are two main types of Raman spectrometers: dispersive Raman and FT-Raman
spectrometers. Dispersive Raman uses visible lasers such as 785 nm, 632.8 nm, and 532
nm. Dispersion occurs by grating or prism, and detector is a multi-element Silicon CCD
(charged Coupled Device) array. FT-Raman uses NIR laser (predominantly 1064 nm),
spectrum is encoded by interferometer, and the detector is a single element InGaAs or
Ge. Figure 1-9 shows a diagram of a dispersive Raman spectrometer.
Figure 1-9 Diagram of a dispersive Raman spectrometer

20
1.3.4 Applications of Raman Spectroscopy
Raman technique was initially used to examine inorganics, it grew extensively in
polymer analysis. Recently there has been a growth in pharmaceutical applications,
while other applications have been successfully established in semiconductors, art,
archaeology and biotech areas. There have also been advances in forensic and process
analysis. Raman Spectroscopy is a very good tool for the examination of inorganic
materials or those containing inorganic components. Raman spectroscopy can identify
both the purity and physical form of elemental carbon, germanium, sulphur, and silicon.
Particulates in urban dust43
have been identified and characterized with Raman technique.
By examining the Raman spectra of paintings44
and archaeologically artfacts such as
pottery45
the age of the work can be determined. A publication46
devoted 10 chapters to
the analysis of polymers with Raman spectroscopy. Polymers have been studied for
identification, structure, composition, cure and degree of polymerization in the solid,
melt, film, and emulsion, etc. In a recent review47
, different applications of Raman
spectroscopy in the field of process analytical of pharmaceutical solid dosage forms are
summarized. Applications of Raman spectroscopy on biological sample analysis and
diagnosis and its use for medical applications were critically reviewed48
. Raman method
is also very useful in the forensic science49
. Advances in dispersive optical elements
have allowed Raman imaging to become a stand-alone instruments capable of acquiring
images with high spatial and spectral resolution50
. In summary, comparing to many other
analytical techniques Raman spectroscopy is reviewed by many as a niche technique, and
its applications are fast growing.

21
1.4 Chemometrics – Principle Components Analysis (PCA)
1.4.1 Introduction to Chemometrics
A data collection task, whether in science, business or engineering, usually
involves many measurements made on many samples. Such multivariate data has
traditionally been analyzed using one or two variables at a time. However, this way
misses the point to discover the relationships among all samples and variables efficiently.
Chemometrics 51-52
is the field of extracting information from multivariate chemical data
using statistics and mathematics tools and is a growing field with pertinent applications in
analytical chemistry53-54
. Chemometrics can study and model data gained from complex
chemical systems, improve the accuracy of current data interpretation methods, and
provide an easier and more efficient way to perform the vast calculations that result from
the analyses of large data sets.
Chemometrics has developed over the last two decades from a rather theoretical
subject to one that is applied in a wide range of sciences. It became organized as a
discipline in the 1980s. Early applications were primarily to analytical chemical data
sets, often quite simple in nature, for example a set of UV/visible mixture spectra. In the
1990s the application of Chemometrics started expanding, with emphasis on certain
industries specially the pharmaceutical industry. A new and exciting stage has emerged
from the late 1990s, involving very complex data sets, due to the capacity of analytical
instruments to acquire large amounts of data rapidly and the developments of software
that can perform fast mathematical calculation.
Chemometrics is typically used for one or more of three main purposes:
To explore patterns of relationship in data

22
Patterns of association exist in many data sets, but the relationships between
samples can be difficult to discover when the data matrix exceeds three or more features.
Exploratory data analysis can reveal hidden patterns in complex data by reducing the
information to a more understandable form. Such a chemometric analysis can explain
possible outliers and indicate whether there are patterns or trends in the data. Exploratory
algorithms such as principal component analysis (PCA) and hierarchical cluster analysis
(HCA) are designed to reduce large complex data sets into a series of optimized and
interpretable view. These views emphasize the natural groupings in the data and show
which variables most strongly influence those patterns.
To track properties of materials on a continuous basis
In many applications, it is expensive, time consuming or difficult to measure a
property of interest directly. Such cases require the analyst to predict something of
interest based on related properties that are easier to measure. Chemometric regression
analysis is to develop a calibration model which correlates the information in the set of
known measurements to the desired property. The mathematic algorithms for performing
regression include partial least squares (PLS) and principal component regression (PCR).
Because the regression algorithms used are based in factor analysis, the entire group of
known measurements is considered simultaneously, and information about correlations
among the variables is automatically built into the calibration model. Chemometric
regression lends itself practically to on-line monitoring and process control industry,
where fast and inexpensive systems are needed to test, predict and make decisions about
product quality.
To prepare and use multivariate classification models
23
Many applications require that samples be assigned to predefined categories, or
"classes". This may involve determining whether a sample is good or bad, or predicting
an unknown sample as belonging to one of several distinct groups. A classification
model is used to predict a sample's class by comparing the sample to a previously
analyzed experience set, in which categories are already known. K-nearest neighbor
(KNN) and soft independent modeling of class analogy (SIMCA) are primary
chemometric approaches. When these techniques are used to create a classification model,
the answers provided are more reliable and include the ability to reveal unusual samples
in the data.
1.4.2 Principle Components Analysis (PCA)
PCA is probably the most widespread multivariate statistical technique used in
Chemometrics, and because of the importance of multivariate measurement in chemistry,
it is regarded by many as the technique that most significantly changed the chemist’s
view of data analysis. PCA is used in all forms of analysis - from neuroscience to
computer graphics - because it is a simple, non-parametric method of extracting relevant
information from confusing data sets. With minimal additional effort PCA provides a
roadmap for how to reduce a complex data set to a lower dimension to reveal the
sometimes hidden, simplified dynamics that often underlie it.
PCA is mathematically manipulation of data matrix that transforms original
measurement variables into new uncorrelated variables called principal components
(PCs). For an original data matrix X, the PCA transformation may take the form:
X = T P (1-9)

24
where T are called the scores, and P are loadings. Scores and loadings are the
characteristics of principal components. Usually the scores relate to the objects or
samples and the loadings relate to the variables or measurements (e.g. the spectra).
The principal components are generated from linear combination of original
measurement variables as follows:
(1-10)
where Sc – scores; i – observation; pc – principal component; b – loading (-1 to 1); and k
– variable.
The original variables (e.g. 100) are reduced to a number of significant PCs (e.g. 3
or 4) each of which is orthogonal to each other. Figure 1-10 shows a diagram of PC-
coordinate system. The first Principal component (PC1) covers as much of the variation
in the data as possible. The second principal component (PC2) is orthogonal to the first
and covers as much of the remaining variation as possible, and so on. By plotting the
principal components, one can view interrelationships between different variables, and
detect and interpret sample patterns, groupings, similarities or differences.
Figure 1-10 Diagram of PC-coordinate data system
kikpcipciipcpci XbXbXbSc ,,2,2,1,,, ..

25
The detail theory of PCA mathematic transform is beyond the scope of this thesis.
But it is important to understand how to apply PCA. The following case study will
demonstrate an example of the applications of PCA.
1.4.3 Case Study55
In this case study five physical constants are measured for 27 different elements,
namely melting point (m.p), boiling point (b.p), density, oxidation number and
electronegativity, to form a 27x5 matrix, whose rows correspond to elements and whose
columns to constants. The data are presented in Table 1-1. The aims are to see which
elements group together and also which physical constants are responsible for the
grouping.
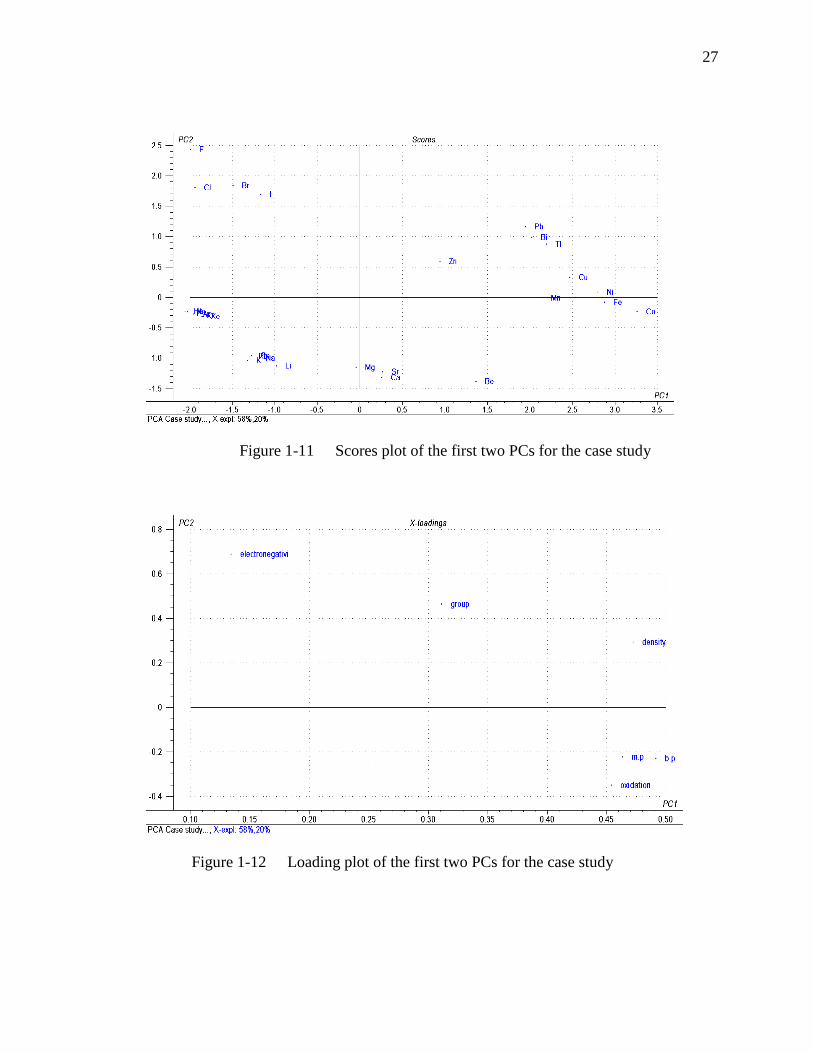
Figure 1-11 illustrates the PCA scores plot for this case study to determine where
the main groups are. The plot shows that the halides cluster together at the top left, and
the inert gases in the bottom left. The metals are primarily clustered according to their
groups in periodic table. This suggests that there are definitive patterns in the data which
can be summarized graphically using PCs.
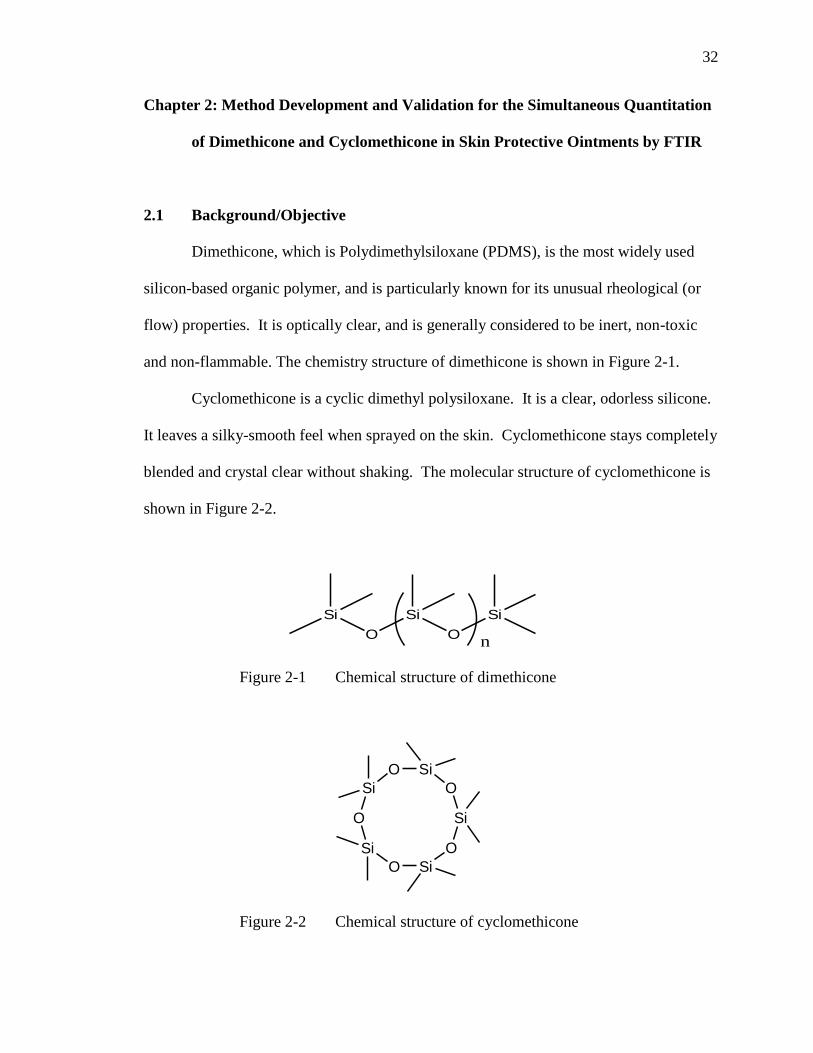
The loading plot for this study is shown in Figure 1-12. The melting point,
boiling point and density seem closely clustered. This suggested that these three
parameters measure something very similar, as the higher the melting point, the higher
the boiling point in most cases. The density (at room temperature) should have some
relationship to m.p and b.p. The eletronegativity is in quite a different place, and this
suggests it follows entirely different trends.
By reviewing the scores and loadings plots, it is clear that the more dense, high
melting point, elements are on the right in the scores plot, and the more electronegative

26
elements at the top end, so one can look at which variable influences which object by
looking at both plots.
Table 1-1 Case study
Element Group m.p (K) b.p (K)
Density
(mg/cm3)
Oxidation
number Electronegativity
Li 1 453.69 1615 534 1 0.98
Na 1 371 1156 970 1 0.93
K 1 336.5 1032 860 1 0.82
Rb 1 312.5 961 1530 1 0.82
Cs 1 301.6 944 1870 1 0.79
Be 2 1550 3243 1800 2 1.57
Mg 2 924 1380 1741 2 1
Ca 2 1120 1760 1540 2 1
Sr 2 1042 1657 2600 2 0.95
F 3 53.5 85 1.7 -1 3.98
Cl 3 172.1 238.5 3.2 -1 3.16
Br 3 265.9 331.9 3100 -1 2.96
I 3 386.6 457.4 4940 -1 2.66
He 4 0.9 4.2 0.2 0 0
Ne 4 24.5 27.2 0.8 0 0
Ar 4 83.7 87.4 1.7 0 0
Kr 4 116.5 120.8 3.5 0 0
Xe 4 161.2 166 5.5 0 0
Zn 5 692.6 1180 7140 2 1.6
Co 5 1765 3170 8900 3 1.8
Cu 5 1356 2868 8930 2 1.9
Fe 5 1808 3300 7870 2 1.8
Mn 5 1517 2370 7440 2 1.5
Ni 5 1726 3005 8900 2 1.8
Bi 6 544.4 1837 9780 3 2.02
Pb 6 600.61 2022 11340 2 1.8
Tl 6 577 1746 11850 3 1.62
27
Figure 1-11 Scores plot of the first two PCs for the case study
Figure 1-12 Loading plot of the first two PCs for the case study

28
1.5 Outline of Research Projects in This Thesis
My thesis focuses on two projects. Project one involves a unique method
development and validation for the simultaneous determination of dimethicone and
cyclodimethicone in skin protectant ointments using FTIR. Project two is to develop
analytical methods to rapidly screen and analyze fish oil supplement products on the
market using ATR-FTIR, Micro-Raman, PCA, and to characterize temperature dependent
IR spectra of the active components omega-3 fatty acids such as ethyl and triglyceride of
eicosapentaenoic acid (EPA) using 2D IR correlation analysis.

29
Chapter 1 References
1. D. M. Livingston, The Master of Light: A Biography of Albert A. Michelson, biography
by Michelson's daughter, 1973.
2. J.W. Cooley, and J.W. Tukey, Math. Comput. 19, 297–301 (1965).
3. J.W. Cooley, P.W. Lewis, and P.D. Welch, IEEE Trans. on Audio and
Electroacoustics 15 (2), 76–79 (1967).
4. J. Comerford, and A. Hind, Varian RT-IR spectrometers, The history of Varian FT-IR
spectrometers, at www.varianinc.com.
5. Harrick, N.J., Internal Reflection Spectroscopy. John Wiley & Sons Inc, 342. 1967.
6. M. P. Fuller and P. R. Griffiths, Anal. Chem., 1906 (1978).
7. M. Viktorin, S. Firth, et al., LaborPraxis, 13(9), 752, 754, 755-6 (1989).
8. D. Johnson, J. Powell, K. Krishnan, Proceedings of SPIE-The International Society for
Optical Engineering, 2089 (9TH INTERNATIONAL CONFERENCE ON FOURIER
TRANSFORM SPECTROSCOPY), 322-3 (1993).
9. C. Roux, P. Maynard, M. Dawson, Chemistry in Australia, 66(2), 1-15 (1999).
10. C. Ricci, K.L. Chan, A. Kazarian, et al., Applied Spectroscopy, 60(9), 1013-1021
(2006).
11. Z. Movasaghi, S. Rehman, I. Rehman, Applied Spectroscopy Reviews, 43(2), 134-179
(2008).
12. M. P. Fuller, R.J. Rosenthal, Practical Spectroscopy, 6(Infrared Microspectrosc.),
153-78 (1988).
13. M. Van De Weert, J.A. Hering, P. Haris, Biotechnology: Pharmaceutical Aspects,
3(Methods for Structural Analysis of Protein Pharmaceuticals), 131-166 (2005).
14. N. Mandal, S. Chakraborty, R. Ameta, S. Bandyopadhyay, S. Dasgupta, et al., Rubber
World, 235(3), 36-40 (2006).
15. H.W. Siesler, Advances in Chemistry Series, 236(Structure-Property Relations in
Polymers), 41-87 (1993).
16. Anon. USA. IP.com Journal, 5(8A), 18 (2005).
17. J. Sedman, F.R. Van De Voort, A. Ismail, et al., New Techniques and Applications in
Lipid Analysis, 283-324 (1997).

30
18. S. Bureau, M. Reich, C. Marfisi, J.M. Audergon, G. Albagnac, Acta Horticulturae,
717 (Proceedings of the XIIIth International Symposium on Apricot Breeding and
Culture), 347-349 (2006).
19. K.L. Hanley, R.K.H. Lowry, American Laboratory (Shelton, Connecticut), 30(6), 28-
31 (1998).
20. I. Noda, Bull. Am. Phys. Soc., 31, 520 (1986).
21. I. Noda, J. Am. Chem Soc., 111, 8116 (1989).
22. I. Noda, Appl. Spectroscopy, 44, 550 (1990).
23. I. Noda, Appl. Spectroscopy, 47, 1329 (1993).
24. I.Noda, Y.liu, Y. Ozaki, and M.A. Czarnecki, J. Phys.Chem., 99, 3068 (1995).
25. Y.liu, Y. Ozaki, and I. Noda, J. Phys. Chem., 100, 7326 (1996).
26. I. Noda, Appl. Spectroscopy, 54, 994 (2000).
27. I. Noda, Y.liu, Y. Ozaki, and M.A. Czarnecki, J. Phys.Chem., 99, 3068 (1995).
28. Y. Ozaki, Y. Liu, and I. Noda, Appl.Spectrosc., 51, 526 (1997).
29. Y.liu, Y. Ozaki, and I. Noda, J. Phys. Chem., 100, 7326 (1996).
30. Y. Ozaki, Y. Liu, and I. Noda, Macromolecules, 30, 2391 (1997).
31. H. Fabian, H. H. Mantsch, and C. P. Schultz, Proc. Natl Acad. Sci. USA, 96, 13153
(1999).
32. F. Ismoyo, Y. Wang, and A. A. Ismail, Appl. Spectrosc., 54, 930 (2000).
33. G. Tian, Q. Wu, S. Sun, I. Noda, and G. Q. Chen, Appl. Spectrosc., 55, 888 (2001).
34. Y. Wu, K. Murayama, and Y. Ozaki, J. Phys. Chem. B, 105, 6251-6259 (2001).
35. T. Amari and Y. Ozaki, Macromolecules, 35, 8020-8028 (2002).
36. Y. Kim, Y. M. Jung, S. B. Kim, and S. M. Park, Analytical Chemistry, 76(17), 5236-
5240 (2004).
37. Z. Zhong, G. Wang, and M. L. Geng, Journal of Molecular Structure, 799(1-3), 204-
210 (2006).

31
38. B. Chae, S. W. Lee, M. Ree, Y. M. Jung, and S. B. Kim, Langmuir, 19(3), 687-695
(2003).
39. H. Wang, R. Palmer, J. Schoonover, and D. K. Graff, AIP Conference Proceedings
503(Two-Dimensional Correlation Spectroscopy), 31-40 (2000).
40. I. Noda, Journal of Molecular Structure, 799, 2-15 (2006).
41. C.V. Raman and K.S. Krishnan, Nature, 121, 501 (1928).
42. Placzek G.: "Rayleigh Streeung und Raman Effekt", In: Hdb. Der Radiologie, Vol.
VI., 2, p. 209, 1934.
43. P. Dhamelincourt, F. Wallart, M. LeClerq, A.T. N’Guyon and D.O. landon, Anal.
Chem., 51, 414A (1979).
44. F.R. Perez, H.G.M. Edwards, A. Rivas and L. Drummond, J. Raman Spectrosc., 30,
301 (1999).
45. J. Zuo, C. Xu, C. Wang and Z. Yushi, J. Raman Spectrosc., 30, 1053 (1999).
46. J. Chalmers and P.Griffiths, handbook of Vibrational Spectroscopy, vol. 4, John
Wiley & Sons, Inc., New York, 2001.
47. J. Rantanen, Journal of Pharmacy and Pharmacology , 59 (2), 171-177, 2007.
48. L. Moreira, L.Silveira, F.V.Santos, J. Lyon, et al., Spectroscopy (Amsterdam,
Netherlands, 22(1), 1-19 (2008).
49. N. Macleod, P. Matousek, Pharmaceutical Research, 25(10), 2205-2215 (2008).
50. D. Pappas, B. Smith, J. Winefordner, Applied Spectroscopy Reviews, 35(1 & 2), 1-
23 (2000).
51. H. Martens, T. Næs, Multivariate Calibration, 2nd ed.; John Wiley & Sons: New
York, 1991.
52. D. Massart, B.G.M. Vandegonste, L. M. C. Buydens, et al., J. Handbook of
Chemometrics and Qualimetrics; Elsevier: Amsterdam, 1997.
53. F. Vogt, M. Tacke, M. Jakusch, B. Mizaikoff, Anal. Chim. Acta., 422, 187–198
(2000).
54. F. Vogt, H. Steiner, K. Booksh, B. Mizaikoff, Appl. Spectrosc., 58, 683–692 (2004).
55. R.G. Brereton, Applied Chemometrics for Scientists, John Wiley & Sons, Inc., 2007.
32
Chapter 2: Method Development and Validation for the Simultaneous Quantitation
of Dimethicone and Cyclomethicone in Skin Protective Ointments by FTIR
2.1 Background/Objective
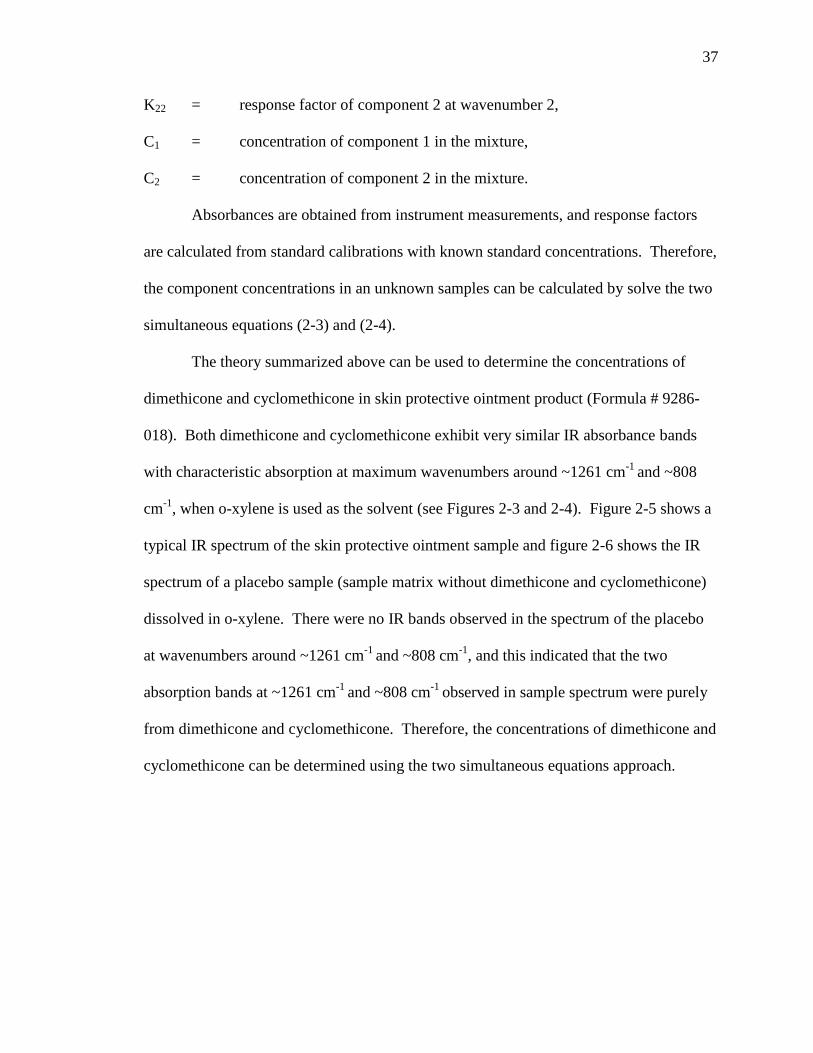
Dimethicone, which is Polydimethylsiloxane (PDMS), is the most widely used
silicon-based organic polymer, and is particularly known for its unusual rheological (or
flow) properties. It is optically clear, and is generally considered to be inert, non-toxic
and non-flammable. The chemistry structure of dimethicone is shown in Figure 2-1.
Cyclomethicone is a cyclic dimethyl polysiloxane. It is a clear, odorless silicone.
It leaves a silky-smooth feel when sprayed on the skin. Cyclomethicone stays completely
blended and crystal clear without shaking. The molecular structure of cyclomethicone is
shown in Figure 2-2.
Si
O
Si
O
Si
n
Figure 2-1 Chemical structure of dimethicone
SiO
O
Si
O
SiO
Si
O
Si
Figure 2-2 Chemical structure of cyclomethicone

33
Silicone compounds are versatile materials. They are very inert and have
excellent biocompatibility. Dimethicone and cyclomethicone are two common types of
silicones used in cosmetic products. Common applications include dry oil sprays, hair
conditioners, and lotions. The use rates vary widely depending upon the application.
Dimethicones has a wide variety of properties based upon the length of the chain.
Relative chain length is often differentiated by viscosity. The ultra-light ones are often
blended with cyclomethicones for very quick soak-in. The medium weight oils are
commonly used to improve the feel of lotion products and can act as skin protectants.
As a very common monograph over the counter (OTC) active ingredient in skin
protectant products, dimethicone often needs to be analyzed quantitiatively. One of the
current methods for analyzing dimethicone is by FTIR1. The infrared spectrum of
dimethicone has a characteristic band at ~1260 cm-1
which is due to the symmetrical
deformation vibration of the methyl group attached to the silicon atom (CH3-Si). This
band is commonly used for quantitation. However, for the formulations also contain
cyclomethicone, which exhibits very similar characteristic bands in the IR spectrum, the
quantitation of dimethicone is very problematic. The FTIR spectra of dimethicone and
cyclomethicone in o-xylene solvent are shown in the Figure 2-3 and Figure 2-4.

34
Figure 2-3 FTIR spectrum of dimethicone in o-xylene solvent
Figure 2-4 FTIR spectrum of cyclomethicone in o-xylene solvent
Dimethicone is an ingredient that is very difficult to analyze using typical
chromatographic methods. It contains no UV chromophores and therefore UV detection
is not possible. Since dimethicone is a mixture of different molecular weights of
80
6.6
3
12
60
.86
0.0
0.2
0.4
0.6
0.8
1.0
1.2
1.4
1.6
1.8
2.0
Ab
so
rba
nce
700 800 900 1000 1100 1200 1300
Wavenumbers (cm-1)
80
8.9
4
12
60
.28
0.0
0.2
0.4
0.6
0.8
1.0
1.2
1.4
1.6
1.8
2.0
Ab
sorb
an
ce
700 800 900 1000 1100 1200 1300
Wavenumbers (cm-1)

35
polydimethylsiloxane oligomers, these oligomers can be separated in the High-
performance liquid chromatography (HPLC) column with gradient mobile phase and
Evaporative Light Scattering detector (ELSD) but show many peaks2. Some of the peaks
are often interfered by the components from sample matrix and it is very difficult to
separate them. Often samples containing dimethicone also have similar components such
as cyclomethicone or dimethicone copolyol. The extraction and recovery of only
dimethicone from a sample containing similar components can be very challenging. In
addition, high molecular weight dimethicone is non-volatile organic polymers, to analyze
it using a gas chromatographic method is virtually impossible.
Therefore, the goal of this research project is to first-time develop an analytical
method that can determine the concentration of dimethicone in the presence of
cyclomethicone in skin protective ointment product (Formula # 9286-018) and to further
demonstrate that the developed method is accurate through a series of carefully designed
validation experiments. To date, no methods were reported on this subject matter.
2.2 Method Development
In this research project, a unique FTIR method that utilizes two IR absorbance
bands (Maximum ~1260 cm-1 and ~808 cm-1 ) to determine the concentrations of
dimethicone and cyclomethicone in skin protective ointment product (F# 9826-018,
contains ~ 9% of dimethicone and ~ 33.8% of cyclomethicone) using two simultaneous
equations has been developed. The theory and development are discussed below.
Quantitative IR spectrometry is based on the Beer’s law, which is expressed as:
A = bc (2-1)

36
where:
A = absorbance of the sample at a specified wavenumber,
= absorptivity of the component at this wavenumber,
B = sample path length,
C = concentration of the component.
The absorbance of a component is proportional to its concentration when the cell
path length are kept constant during the sample analysis in a certain concentration range,
and this can be expressed as A = KC, in which K is a component specific constant (called
response factor in this study), and C is the component concentration in the sample.
Hence, for a mixture of two independently absorbing components at a single
wavenumber, the total absorbance is:
A = K1C1 + K2C2 (2-2)
In order to solve for the two component concentrations C1 and C2, two independent
equations containing 2 absorbances measured at 2 different wavenumbers are necessary.
This can be expressed as follows:
A1 = K11C1 + K12C2 (2-3)
A2 = K21C1 + K22C2 (2-4)
where
A1 = total absorbance at wavenumber 1,
A2 = total absorbance at wavenumber 2,
K11 = response factor of component 1 at wavenumber 1,
K12 = response factor of component 2 at wavenumber 1,
K21 = response factor of component 1 at wavenumber 2,
37
K22 = response factor of component 2 at wavenumber 2,
C1 = concentration of component 1 in the mixture,
C2 = concentration of component 2 in the mixture.
Absorbances are obtained from instrument measurements, and response factors
are calculated from standard calibrations with known standard concentrations. Therefore,
the component concentrations in an unknown samples can be calculated by solve the two
simultaneous equations (2-3) and (2-4).
The theory summarized above can be used to determine the concentrations of
dimethicone and cyclomethicone in skin protective ointment product (Formula # 9286-
018). Both dimethicone and cyclomethicone exhibit very similar IR absorbance bands
with characteristic absorption at maximum wavenumbers around ~1261 cm-1
and ~808
cm-1
, when o-xylene is used as the solvent (see Figures 2-3 and 2-4). Figure 2-5 shows a
typical IR spectrum of the skin protective ointment sample and figure 2-6 shows the IR
spectrum of a placebo sample (sample matrix without dimethicone and cyclomethicone)
dissolved in o-xylene. There were no IR bands observed in the spectrum of the placebo
at wavenumbers around ~1261 cm-1
and ~808 cm-1
, and this indicated that the two
absorption bands at ~1261 cm-1
and ~808 cm-1
observed in sample spectrum were purely
from dimethicone and cyclomethicone. Therefore, the concentrations of dimethicone and
cyclomethicone can be determined using the two simultaneous equations approach.

38
Figure 2-5 A typical IR spectrum of a skin protective ointment sample in o-xylene
Figure 2-6 IR spectrum of a placebo sample in o-xylene
80
0.0
0,
0.5
67
5
80
8.8
9
95
0.0
0,
0.0
13
3
12
58
.50
, 0
.92
62
12
60
.36
13
25
.00
, 0
.01
26
0.0
0.2
0.4
0.6
0.8
1.0
1.2
1.4
1.6
1.8
2.0
2.2
2.4
Ab
so
rba
nce
700 800 900 1000 1100 1200 1300
Wavenumbers (cm-1)
0.0
0.2
0.4
0.6
0.8
1.0
1.2
1.4
1.6
1.8
2.0
Ab
so
rba
nce
700 800 900 1000 1100 1200 1300
Wavenumbers (cm-1)

39
The next step of the method development is to choose the appropriate
wavenumbers for the absorbance measurements and baseline corrections. The following
factors were considered for vavenumber selections:
In order to obtain solutions (calculate C1 and C2) from the two simultaneous linear
equations (2-3) and (2-4), the slope of the two equations must not be the same, ie,
K11 ⁄ K12 ≠ K21 ⁄ K22. So response factors of the two components at the selected
wavenumbers should meet this condition.
The maximum absorbance wavenumbers shift slightly from sample to sample
depending on concentration, so fixed wavenumbers should be considered.
The absorbance values at the selected wavenumbers should fall within the
acceptable accurate range of the spectrometer used. In general, it is in the range
of 0.2 – 0.8 absorbance units (AU) for quantitation purpose. However, the
sensitivity of FTIR spectrometer is such that lower absorbance values can be used
quite effectively, but the accuracy should be proved through validation.
Absorbance greater than 1.5 AU should be avoided due to instrumental non-linear
effect.
The correction of raw absorbance data for baseline absorbance is necessary.
Since the bands of interest are baseline resolved, one baseline point should be
suitable for baseline correction. The guiding factor in the selection of the
wavenumbers for baseline correction is the reproducibility of the results, and this
can be proved through method validation.
Based on all the factors summarized above and a series of experimental runs of
evaluating different wavenumbers, the method was finalized as follows:

40
Two bands at fixed wave numbers 1258.50 cm-1
and 800.00 cm-1
, with baseline
correction at 1325.00 cm-1
and 950.00 cm-1
respectively, were used to determine the
concentrations of dimethicone and cyclomethicone using two simultaneous linear
equations:
A1258.50 = K
di (1258.50) C di-sp + K
cyclo (1258.50) Ccyclo-sp (2-5)
A800.00 = K
di (800.00) C di-sp. + K
cyclo (800.00) Ccyclo-sp (2-6)
where,
A1258.50 = sample absorbance at 1258.50 cm
-1 with the baseline correction at 1325.00 cm
-1,
A 800.00 = sample absorbance at 800.00 cm
-1 with the baseline correction at 950.00 cm
-1,
Kdi(1258.50) = response factor of dimethicone at 1258.50 cm
-1,
Kdi(800.00) = response factor of dimethicone at 800.00 cm
-1,
Kcyclo(1258.50) = response factor of cyclomethicone at 1258.50 cm
-1,
Kcyclo(800.00) = response factor of cyclomethicone at 800.00 cm
-1,
Cdi-sp = concentration of dimethicone in sample solution,
Ccyclo-sp = concentration of cyclomethicone in sample solution.
By solving the two simultaneous equations, the concentration of dimethicone and
cyclomethicone in the sample solution can be calculated as follows:
)00.1258()00.800()00.800()50.1258(
)00.1258(00.800)00.800(50.1258 ''
cyclodicyclodi
cyclocyclospdi
KKKK
KAKA = C
(2-7)
)00.800()50.1258()00.1258()00.800(
)00.1258(00.800)00.800(50.1258 ''
cyclodicyclodi
didispcyclo
KKKK
KAKA = C
(2-8)
in which, A 1258.50 = A1258.50 – A1325.00, A 800.00 = A800.00– A950.00
where, A 1258.50 = Net absorbance of sample solution at 1258.50 cm
-1,

41
A1258.50 = Absorbance of sample solution at 1258.50 cm-1
,
A1325.00 = Absorbance of sample solution at 1325.00 cm-1
(baseline),
A 800.00 = Net absorbance of sample solution at 800.00 cm-1
,
A800.00 = Absorbance of sample solution at 800.00 cm-1
,
A950.00 = Absorbance of sample solution at 950.00 cm-1
(baseline).
C
AA = K
di
dididi
)( )00.1325()50.1258()50.1258(
C
AA = K
di
dididi
)( )00.950()00.800()00.800(
C
AA = K
cyclo
cyclocyclocyclo
)( )00.1325()50.1258()50.1258(
C
AA = K
cyclo
cyclocyclocyclo
)( )00.950()00.800()00.800(
where, Kdi (1258.50) = Response factor of dimethicone at 1258.50 cm
-1,
Adi(1258.50) = Absorbance of dimethicone standard at 1258.50 cm-1
,
Adi(1325.00) = Absorbance of dimethicone standard at 1325.00 cm
-1 (baseline),
Kdi (800.00) = Response factor of dimethicone at 800.00 cm-1
,
Adi(800.00) = Absorbance of dimethicone standard at 800.00 cm-1
,
Adi(950.00) = Absorbance of dimethicone standard at 950.00 cm-1
(baseline),
Kcyclo (1258.50) = Response factor of cyclomethicone at 1258.50 cm-1
,
Acyclo(1258.50) = Absorbance of cyclomethicone standard at 1258.50 cm-1
,
Acyclo(1325.00) = Absorbance of cyclomethicone standard at 1325.00 cm-1
(baseline),
Kcyclo (800.00) = Response factor of cyclomethicone at 800.00 cm-1
,
Acyclo(800.00) = Absorbance of cyclomethicone standard at 800.00 cm-1
,
Acyclo(950.00) = Absorbance of cyclomethicone standard at 950.00 cm-1
(baseline),
Cdi = concentration of dimethicone standard in mg/mL,
Ccyclo = concentration of cyclomethicone standard in mg/mL.

42
2.3 Method Procedures
2.3.1 Materials
Dimethicone, NF, Dow Corning Q7-9170, 100 cst.
Cyclomethicone, Dow Corning 345 Fluid.
Sample solvent, o-Xylene, HPLC grade, CAS# 95-47-6, Sigma-Aldrich
Skin protective ointment product, Formula # 9286-018, Lab batch # 9884-106.
Placebo containing no added dimethicone and cyclomethicone, NB# 10217/070.
Placebo containing no added dimethicone, NB# 10217/071.
2.3.2 Instrumentation and Instrument Settings
Infrared spectrophotometer, single beam – Nicolet Magna IR 550.
Liquid cell (KBr), 0.2 mm path length -- Wilmad Cat. #l05A4W
Scans: 32 scans
Resolution: 2 cm-1
Velocity: 0.6329
Aperture: 69
Range: 1375 to 650 cm-1
Collect background every 60 minutes
2.3.3 Standard and Sample Preparation
Approximately 50 5 mg of dimethicone reference standard were weighed into
25 mL volumetric flask, diluted to volume with o-xylene.
Approximately 187.5 10 mg of cyclomethicone reference were weighed into a
25 mL volumetric flask, diluted to volume with o-xylene.
Approximately 550 30 mg of Skin protective ointment sample were weighed
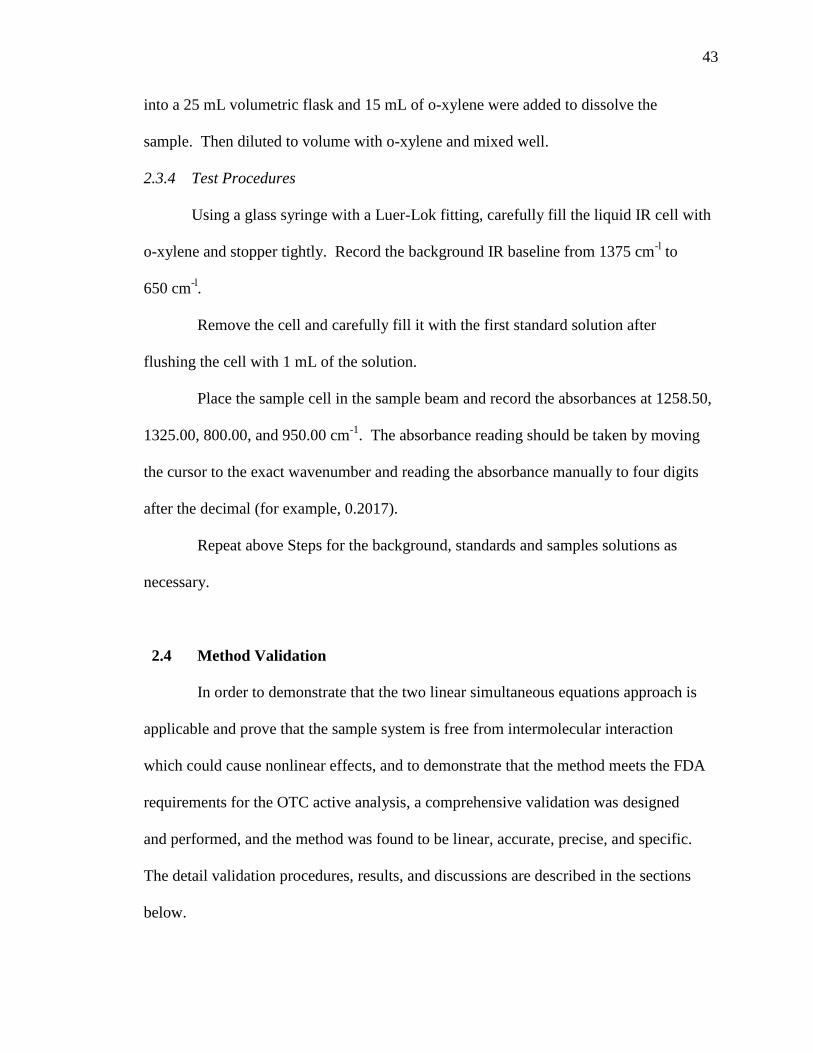
43
into a 25 mL volumetric flask and 15 mL of o-xylene were added to dissolve the
sample. Then diluted to volume with o-xylene and mixed well.
2.3.4 Test Procedures
Using a glass syringe with a Luer-Lok fitting, carefully fill the liquid IR cell with
o-xylene and stopper tightly. Record the background IR baseline from 1375 cm-l to
650 cm-l.
Remove the cell and carefully fill it with the first standard solution after
flushing the cell with 1 mL of the solution.
Place the sample cell in the sample beam and record the absorbances at 1258.50,
1325.00, 800.00, and 950.00 cm-1
. The absorbance reading should be taken by moving
the cursor to the exact wavenumber and reading the absorbance manually to four digits
after the decimal (for example, 0.2017).
Repeat above Steps for the background, standards and samples solutions as
necessary.
2.4 Method Validation
In order to demonstrate that the two linear simultaneous equations approach is
applicable and prove that the sample system is free from intermolecular interaction
which could cause nonlinear effects, and to demonstrate that the method meets the FDA
requirements for the OTC active analysis, a comprehensive validation was designed
and performed, and the method was found to be linear, accurate, precise, and specific.
The detail validation procedures, results, and discussions are described in the sections
below.

44
2.4.1 Additive Absorbance Responses for Dimethicone and Cyclomethicone
Both dimethicone and cyclomethicone exhibit very similar IR absorption bands
with characteristic maximum absorptions around 1261 cm-1
and 808 cm-1
, when
o-xylene is used as the solvent. The absorbances at two fixed wavenumbers 1258.50 cm-1
and 800.00 cm-1
(with baseline correction at 1325.00 cm-1
and 950.00 cm-1
, respectively)
are used to determine the concentrations of dimethicone and cyclomethicone by solving
two simultaneous equations (Ref. section 2.2). In order for the simultaneous equations to
be valid, the absorbance responses of dimethicone and cyclomethicone must be additive.
Three individual dimethicone (Di) and three individual cyclomethicone (Cyclo)
standard solutions were prepared at 75%, 100%, and 125% of the target standard
concentration of 2.0 mg/mL of dimethicone and 7.5 mg/mL of cyclomethicone. Three
standard mixtures (Di + Cyclo) of dimethicone and cyclomethicone solutions were also
prepared containing exactly the same concentrations of dimethicone and cyclomethicone
as that in the corresponding individual solutions. The absorbance response additive
property was evaluated by comparing the absorbance of the standard mixture with the
calculated total absorbance of the individual dimethicone and cyclomethicone solutions
for the same concentration levels. The % differences between the absorbances were
calculated and the results are presented in Table 2-1. The % differences of absorbances
at both 1258.50 cm-1
and 800.00 cm-1
were within 1.0% for all the three concentration
levels. This demonstrated that the absorbance responses are additive at the two
absorbance wavenumbers.
The absorbance response additive property was further verified by preparing five
standard mixtures of dimethicone and cyclomethicone solutions at 50%, 75%, 100%,

45
125%, and 156% of the target concentrations of 2.0 mg/mL of dimethicone and 7.5
mg/mL of cyclomethicone. The absorbances of the five mixtures were calculated from the
response factors and concentrations of dimethicone and cyclomethicone according to the
two equations. Then the % differences (%diff) between the calculated absorbance
(Cal.Abs) and the experimental absorbance (Exp. Abs) of the mixtures were evaluated.
The results are presented in Table 2-2.
Table 2-1 Absorbance Response Data Comparison
Concentration Level – 75% Absorbance
at 1258.50 cm-1
Absorbance
at 800.00 cm-1
Di (1.4970 mg/mL) 0.1352 0.1227
Cyclo (5.6251 mg/mL) 0.5486 0.2943
Di (1.4970 mg/mL) + Cyclo (5.6251mg/mL) 0.6828 0.4175
Calculated Total Absorbance* 0.6838 0.4170
% Difference** 0.15 0.12
Concentration Level – 100% Absorbance
at 1258.50 cm-1
Absorbance
at 800.00 cm-1
Di (1.9959 mg/mL) 0.1805 0.1642
Cyclo (7.5001 mg/mL) 0.7275 0.3901
Di (1.9959 mg/mL) + Cyclo (7.5001mg/mL) 0.9000 0.5522
Calculated Total Absorbance 0.9080 0.5543
% Difference 0.88 0.38
Concentration Level – 125% Absorbance
at 1258.50 cm-1
Absorbance
at 800.00 cm-1
Di (2.4949 mg/mL) 0.2256 0.2058
Cyclo (9.3751mg/mL) 0.9047 0.4869
Di (2.4949mg/mL) + Cyclo (9.3751mg/mL) 1.1236 0.6928
Calculated Total Absorbance 1.1303 0.6927
% Difference 0.59 0.01
* Calculated Total Absorbance:
The total absorbance of individual dimethicone and cyclomethicone solutions.
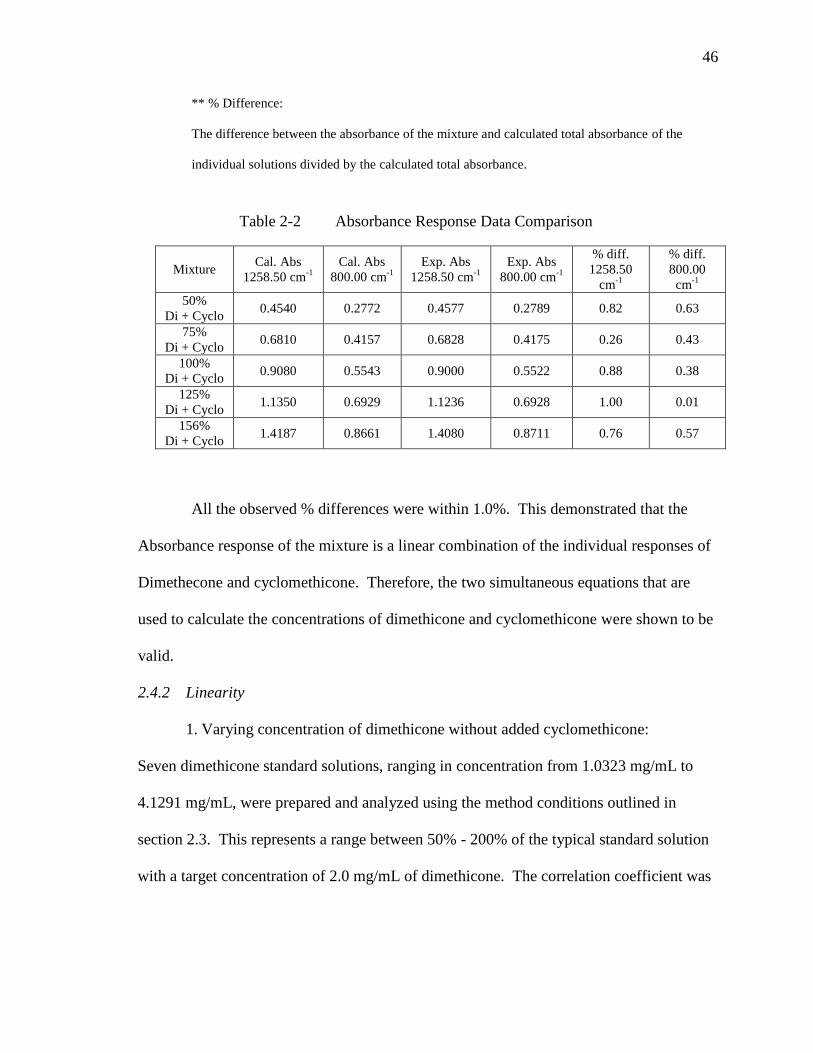
46
** % Difference:
The difference between the absorbance of the mixture and calculated total absorbance of the
individual solutions divided by the calculated total absorbance.
Table 2-2 Absorbance Response Data Comparison
Mixture Cal. Abs
1258.50 cm-1
Cal. Abs
800.00 cm-1
Exp. Abs
1258.50 cm-1
Exp. Abs
800.00 cm-1
% diff.
1258.50
cm-1
% diff.
800.00
cm-1
50%
Di + Cyclo 0.4540 0.2772 0.4577 0.2789 0.82 0.63
75%
Di + Cyclo 0.6810 0.4157 0.6828 0.4175 0.26 0.43
100%
Di + Cyclo 0.9080 0.5543 0.9000 0.5522 0.88 0.38
125%
Di + Cyclo 1.1350 0.6929 1.1236 0.6928 1.00 0.01
156%
Di + Cyclo 1.4187 0.8661 1.4080 0.8711 0.76 0.57
All the observed % differences were within 1.0%. This demonstrated that the
Absorbance response of the mixture is a linear combination of the individual responses of
Dimethecone and cyclomethicone. Therefore, the two simultaneous equations that are
used to calculate the concentrations of dimethicone and cyclomethicone were shown to be
valid.
2.4.2 Linearity
1. Varying concentration of dimethicone without added cyclomethicone:
Seven dimethicone standard solutions, ranging in concentration from 1.0323 mg/mL to
4.1291 mg/mL, were prepared and analyzed using the method conditions outlined in
section 2.3. This represents a range between 50% - 200% of the typical standard solution
with a target concentration of 2.0 mg/mL of dimethicone. The correlation coefficient was

47
found to be 0.99997 for the absorbance response at 1258.50 cm-1
and 0.99995 at 800.00
cm-1
. The linearity results are presented in Table 2-3 and Figures 2-7 and 2-8.
2. Varying concentration of cyclomethicone without added dimethicone:
Six cyclomethicone standard solutions, ranging in concentration from 3.7505 mg/mL to
13.1274 mg/mL, were prepared and analyzed using the method conditions. This
represents a range between 50% - 175% of the typical standard solution with a target
concentration of 7.5 mg/mL of cyclomethicone. The correlation coefficient was found to
be 0.99990 for the absorbance response at 1258.50 cm-1
and 0.99982 at 800.00 cm-1
. The
linearity results are presented in Table 2-4 and Figures 2-9 and 2-10.
3. Varying the concentration of dimethicone while maintaining a constant
cyclomethicone concentration:
Five mixtures of dimethicone and cyclomethicone solutions were prepared with varying
concentrations of dimethicone, ranging from 1.0070 mg/mL to 3.0210 mg/mL, while
maintaining the concentration of cyclomethicone constant at 7.5016 mg/mL. The
mixtures were analyzed using the conditions. This represents a range between 50% -
150% of the typical standard solution with a target concentration of 2.0 mg/mL of
dimethicone. The correlation coefficient was found to be 0.99160 for the absorbance
response at 1258.50 cm-1
and 0.99727 at 800.00 cm-1
. The linearity results are presented
in Table 2-5 and Figures 2-11 and 2-12.
4. Varying the concentration of cyclomethicone while maintaining a constant
dimethicone concentration:
Five mixtures of dimethicone and cyclomethicone solutions were prepared with varying
concentrations of cyclomethicone, ranging from 3.7508 mg/mL to 11.2524 mg/mL, while

48
maintaining the concentration of dimethicone constant at 2.0140 mg/mL. The mixtures
were analyzed using the method conditions. This represents a range between 50% - 150%
of the typical standard solution with a target concentration of 7.5 mg/mL of
cyclomethicone. The correlation coefficient was found to be 0.99996 for the absorbance
response at 1258.50 cm-1
and 0.99998 at 800.00 cm-1
. The linearity results are presented
in Table 2-6 and Figures 2-13 and 2-14.
All the correlation coefficient results (> 0.99) in the above four sets of
experiments demonstrated a linear absorbance response over a concentration range
between 50% - 150% of the expected dimethicone and cyclomethicone concentrations in
the samples.
Table 2-3 Linearity Data of Dimethicone without Cyclomethicone
Dimethiocne
Concentration (mg/mL)
Absorbance
at 1258.50 cm-1
Absorbance
at 800.00 cm-1
1.0323 0.0932 0.0846
1.5484 0.1412 0.1283
2.0646 0.1859 0.1692
2.5807 0.2337 0.2124
3.0968 0.2799 0.2538
3.6130 0.3264 0.2973
4.1291 0.3729 0.3400
Slope 0.09019 0.08227
Intercept 0.00055 -0.00011
R2 0.99997 0.99995

49
Table 2-4 Linearity Data of Cyclomethicone without Dimethicone
Cyclomethicone
Concentration (mg/mL)
Absorbance
at 1258.50 cm-1
Absorbance
at 800.00 cm-1
3.7505 0.3694 0.1979
5.6259 0.5467 0.2926
7.5012 0.7210 0.3861
9.3765 0.9080 0.4887
11.2518 1.0891 0.5877
13.1274 1.2623 0.6838
Slope 0.09566 0.05206
Intercept 0.00883 0.00010
R2 0.99990 0.99982
Table 2-5 Linearity Data of Dimethicone with Constant
Cyclomethicone Concentration
Dimethicone
Concentration
(mg/mL)
Cyclomethicone
Concentration
(mg/mL)
Absorbance
at 1258.50 cm-1
Absorbance
at 800.00 cm-1
1.0070 7.5016 0.8155 0.4732
1.5105 7.5016 0.8675 0.5182
2.0140 7.5016 0.9104 0.5587
2.5175 7.5016 0.9516 0.5994
3.0210 7.5016 0.9821 0.6324
Slope - 0.08286 0.07936
Intercept - 0.73853 0.39654
R2 - 0.99160 0.99727

50
Table 2-6 Linearity Data of Cyclomethicone with Constant
Dimethicone Concentration
Dimethicone
Concentration
(mg/mL)
Cyclomethicone
Concentration
(mg/mL)
Absorbance
at 1258.50 cm-1
Absorbance
at 800.00 cm-1
2.0140 3.7508 0.5508 0.3641
2.0140 5.6262 0.7274 0.4600
2.0140 7.5016 0.9104 0.5587
2.0140 9.3770 1.0870 0.6561
2.0140 11.2524 1.2630 0.7536
- Slope 0.095126 0.05199
- Intercept 0.19412 0.16846
- R2 0.99996 0.99998
Figure 2-7 Linearity of dimethicone without cyclomethicone at 1258.50 cm-1
y=0.09019x+0.00055
R2=0.99997
0.00
0.05
0.10
0.15
0.20
0.25
0.30
0.35
0.40
0.0 1.0 2.0 3.0 4.0 5.0
Dimethisone Concentration (mg/mL)
Ab
s
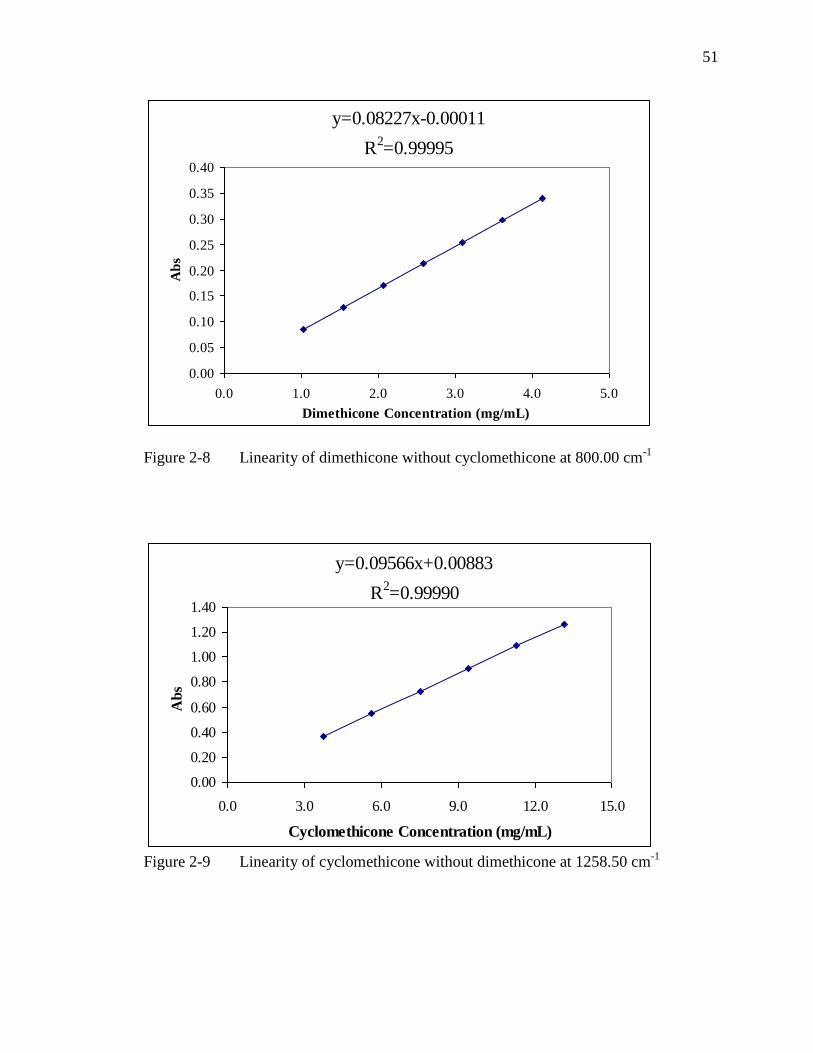
51
Figure 2-8 Linearity of dimethicone without cyclomethicone at 800.00 cm-1
Figure 2-9 Linearity of cyclomethicone without dimethicone at 1258.50 cm-1
y=0.08227x-0.00011
R2=0.99995
0.00
0.05
0.10
0.15
0.20
0.25
0.30
0.35
0.40
0.0 1.0 2.0 3.0 4.0 5.0
Dimethicone Concentration (mg/mL)
Ab
s
y=0.09566x+0.00883
R2=0.99990
0.00
0.20
0.40
0.60
0.80
1.00
1.20
1.40
0.0 3.0 6.0 9.0 12.0 15.0
Cyclomethicone Concentration (mg/mL)
Ab
s

52
Figure 2-10 Linearity of cyclomethicone without dimethicone at 800.00 cm-1
Figure 2-11 Linearity of dimethicone with constant cyclomethicone
concentration at 1258.50 cm-1
y=0.05206x+0.00010
R2=0.99982
0.00
0.10
0.20
0.30
0.40
0.50
0.60
0.70
0.80
0.0 3.0 6.0 9.0 12.0 15.0Cyclomethicone Concentration (mg/mL)
Ab
s
y=0.08286x+0.73853
R2=0.99160
0.00
0.20
0.40
0.60
0.80
1.00
1.20
0.0 0.5 1.0 1.5 2.0 2.5 3.0 3.5
Dimethicone Concentration (mg/mL)
Ab
s

53
Figure 2-12 Linearity of dimethicone with constant cyclomethicone
concentration at 800.00 cm-1
Figure 2-13 Linearity of cyclomethicone with constant dimethicone
concentration at 1258.50 cm-1
y=0.079364x+0.39654
R2=0.99727
0.00
0.10
0.20
0.30
0.40
0.50
0.60
0.70
0.0 1.0 2.0 3.0 4.0
Dimethicone Concentration (mg/mL)
Ab
s
y=0.09513x+0.19412
R2=0.99996
0.00
0.20
0.40
0.60
0.80
1.00
1.20
1.40
0.0 2.0 4.0 6.0 8.0 10.0 12.0
Cyclomethicone Concentraton (mg/mL)
Ab
s

54
Figure 2-14 Linearity of cyclomethicone with constant dimethicone
concentration at 800.00 cm-1
2.4.3 Accuracy
A placebo sample of the Skin protactive ointment formulation, containing no
added dimethicone (Di) and cyclomethicone (Cyclo), was spiked with five concentration
combinations of 80% Di + 80% Cyclo, 80% Di + 120% Cyclo, 100% Di + 100% Cyclo,
120% Di + 80% Cyclo, and 120% Di + 120% Cyclo, of the expected dimethicone
concentration of 2.0 mg/mL and cyclomethicone concentration of 7.5 mg/mL. The spiked
placeboes were analyzed using the method conditions outlined in Section 2.3. The
average recovery was found to be 102.12% (1.17 % RSD) for dimethicone and 99.93%
(0.54% RSD) for cyclomethicone, and the individual recoveries were found to be between
99.48% - 105.47% for dimethicone and 98.62% - 101.18% for cyclomethicone. The
recovery results are presented in Table 2-7.
Since dimethicone is the active that is required to be tested, the accuracy of
y=0.05199x+0.16846
R2=0.99998
0.00
0.10
0.20
0.30
0.40
0.50
0.60
0.70
0.80
0.0 2.0 4.0 6.0 8.0 10.0 12.0
Cyclomethicone Concentration (mg/mL)
Ab
s

55
the method for the dimethicone analysis was further verified. This was done by spiking a
placebo, containing no added dimethicone, with 80%, 100%, and 120% of the expected
dimethicone concentration of 2.0 mg/mL. The spiked placebo samples were then
analyzed using the method conditions. The average recovery of dimethicone was found
to be 99.09% (1.34% RSD), and the individual recoveries were found to be between
96.00% - 100.60%. The results are summarized in Table 2-8.
All the average recovery results were between 98% - 102%. All the individual
recovery results were between 96% - 105%, which is acceptable for a typical FTIR
quantitation method. This demonstrated satisfactory accuracy over a range of
concentrations between 80% - 120% of the target dimethicone and cyclomethicone
concentrations for a typical sample solution.
Table 2-7 Summary of Accuracy Results
Concentration Combinations % Recovery of
Dimethicone
% Recovery of
Cyclomethicone
1. 80% Di + 80% Cyclo, *n=2 101.91
99.48
100.57
101.18
2. 120% Di + 80% Cyclo, n=2
101.56
100.78
100.17
100.52
3. 100% Di + 100% Cyclo, n=2
101.97
101.27
99.47
99.72
4. 80% Di + 120% Cyclo, n=2
103.42
101.88
99.70
99.87
5. 120% Di + 120% Cyclo, n=2
103.46
105.47
99.49
98.62
Global Average 102.12 99.93
Global RSD % 1.17 0.54
* n = number of preparations

56
Table 2-8 Summary of Accuracy Results
Concentrations % Recovery of Dimethicone
1. 80% Di, * n=3
100.05
98.77
98.48
2. 100% Di, n=3
96.00
99.54
99.32
3. 120% Di, n=3
99.15
100.60
99.91
Global Average 99.09
Global RSD % 1.34 * n = number of preparations
2.4.4 Precision
- Repeatability:
The repeatability of the method with respect to the formulation under this study
was evaluated by analyzing six sample preparations of a sample (Batch# 9884-106). The
relative standard deviation of the dimethicone assay results was found to be 1.02% for the
six sample preparations. The results are summarized in Table 2-9. The results
demonstrated a satisfactory precision (≤2.0% RSD) for the sample analysis.
Table 2-9 Summary of Repeatability Results
Sample Replicate Dimethicone (% w/w)
1 8.6539
2 8.8001
3 8.8611
4 8.8908
5 8.8944
6 8.8271
Average 8.8212 RSD % 1.02
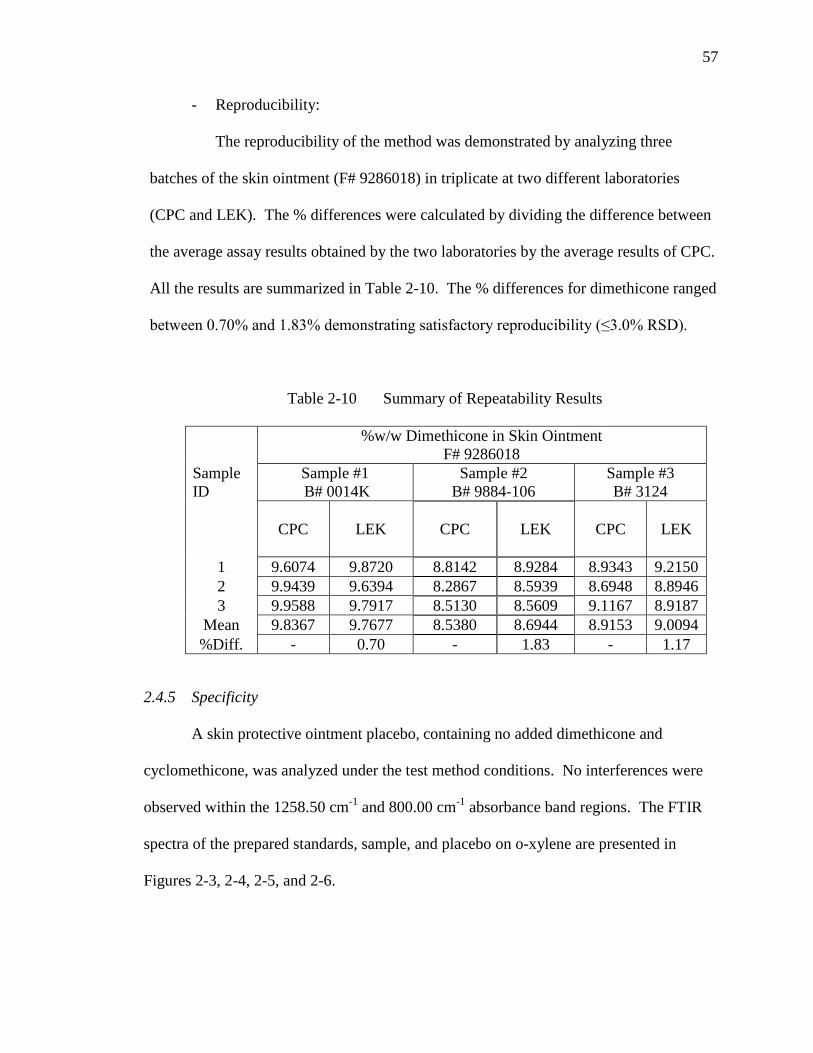
57
- Reproducibility:
The reproducibility of the method was demonstrated by analyzing three
batches of the skin ointment (F# 9286018) in triplicate at two different laboratories
(CPC and LEK). The % differences were calculated by dividing the difference between
the average assay results obtained by the two laboratories by the average results of CPC.
All the results are summarized in Table 2-10. The % differences for dimethicone ranged
between 0.70% and 1.83% demonstrating satisfactory reproducibility (≤3.0% RSD).
Table 2-10 Summary of Repeatability Results
%w/w Dimethicone in Skin Ointment
F# 9286018
Sample
ID
Sample #1
B# 0014K
Sample #2
B# 9884-106
Sample #3
B# 3124
CPC
LEK
CPC
LEK
CPC
LEK
1 9.6074 9.8720 8.8142 8.9284 8.9343 9.2150
2 9.9439 9.6394 8.2867 8.5939 8.6948 8.8946
3 9.9588 9.7917 8.5130 8.5609 9.1167 8.9187
Mean 9.8367 9.7677 8.5380 8.6944 8.9153 9.0094
%Diff. - 0.70 - 1.83 - 1.17
2.4.5 Specificity
A skin protective ointment placebo, containing no added dimethicone and
cyclomethicone, was analyzed under the test method conditions. No interferences were
observed within the 1258.50 cm-1
and 800.00 cm-1
absorbance band regions. The FTIR
spectra of the prepared standards, sample, and placebo on o-xylene are presented in
Figures 2-3, 2-4, 2-5, and 2-6.

58
A skin protective ointment placebo, containing no added dimethicone and
cyclomethicone, was subjected to elevated temperature and photodegradation conditions
for a period of 7 days. The stressed placebo samples were then prepared and analyzed
under the test method conditions. No degradant/impurity bands were found within the
1258.50 cm-1
and 800.00 cm-1
absorbance band regions. The stress conditions and results
are summarized in Table 2-11 and the FTIR spectra of the stressed placebo samples are
presented in Figures 2-15 and 2-16.
The dimethicone (Di) and cyclomethicone (Cyclo) standard materials, and
a sample (Batch# 9884-106) of skin protective ointment were also subjected to the
elevated temperature and photodegradation stress conditions for a period of 7 days. The
stressed standards and sample were then prepared and analyzed using the method
conditions. The two wavenumbers (cm-1
) at the maximum absorbance were evaluated.
In addition, the assay results of the stress standards and samples were calculated. All the
results are summarized in Table 2-12. The FTIR spectra of the stressed standard and
sample solutions are presented in Figures 2-17, 2-18, 2-19, 2-20, 2-21, and 2-22.
The results showed that the two wavenumbers at the maximum band absorption of
the stressed standards and samples were very consistent with that of their corresponding
controls. No band shifts, which would indicate dimethicone polymer chain degradation
and/or degradation of cyclomethicone, were observed. This demonstrated that
dimethicone and cyclomethicone were very stable both in the pure material and in the
product formulation, and there were no evidence of degradants. The assay results of the
stressed standards and samples further confirmed that both dimethicone and
cyclomethicone are very stable.

59
The results for all conducted experiments demonstrated that there were no
degradants and /or impurities interfering with the analysis of dimethicone. The method
has been shown to be specific and selective for the analysis of dimethicone in the skin
protective ointment formulation under this study.
Table 2-11 Summary of Placebo Stress Conditions and Results
Conditions Evidence of Interference
Control No
Elevated Temperature 70 C / 7 days No
Light Chamber / 25 C / 7 days No
Table 2-12 Summary of Standard and Sample Stress Conditions and Results
Sample/Conditions
Di Assay
%w/w
Cyclo Assay
%w/w
Max.
Abs.
cm-1
Max.
Abs.
cm-1
Evidence of
Degradation
Di Standard
Control - - 1260.86 806.63 -
Di Standard
70 C / 7 days
99.4 -
1260.87
806.69
No
Di Standard
light Chamber /7
days
99.8 -
1260.87
806.51 No
Cyclo Standard
Control - - 1260.28 808.94 -
Cyclo Standard
70 C / 7 days - 100.7 1260.28 808.94 No
Cyclo standard
light Chamber /7
days
- 100.5 1260.27 808.96 No
Lab Batch Sample
Control 8.821 33.85 1260.36 808.89 -
Lab Batch Sample
70 C / 7 days 8.987 33.67 1260.36 808.86 No
Lab Batch Sample
light Chamber /7
days
8.978 33.89 1260.36 808.89 No

60
Figure 2-15 IR spectrum of placebo stored at 70ºC / 7 days
Figure 2-16 IR spectrum of placebo stored under light / 7 days
0.0
0.2
0.4
0.6
0.8
1.0
1.2
1.4
1.6
1.8
2.0
Ab
so
rba
nce
700 800 900 1000 1100 1200 1300
Wavenumbers (cm-1)
0.0
0.2
0.4
0.6
0.8
1.0
1.2
1.4
1.6
1.8
2.0
Ab
so
rba
nce
700 800 900 1000 1100 1200 1300
Wavenumbers (cm-1)
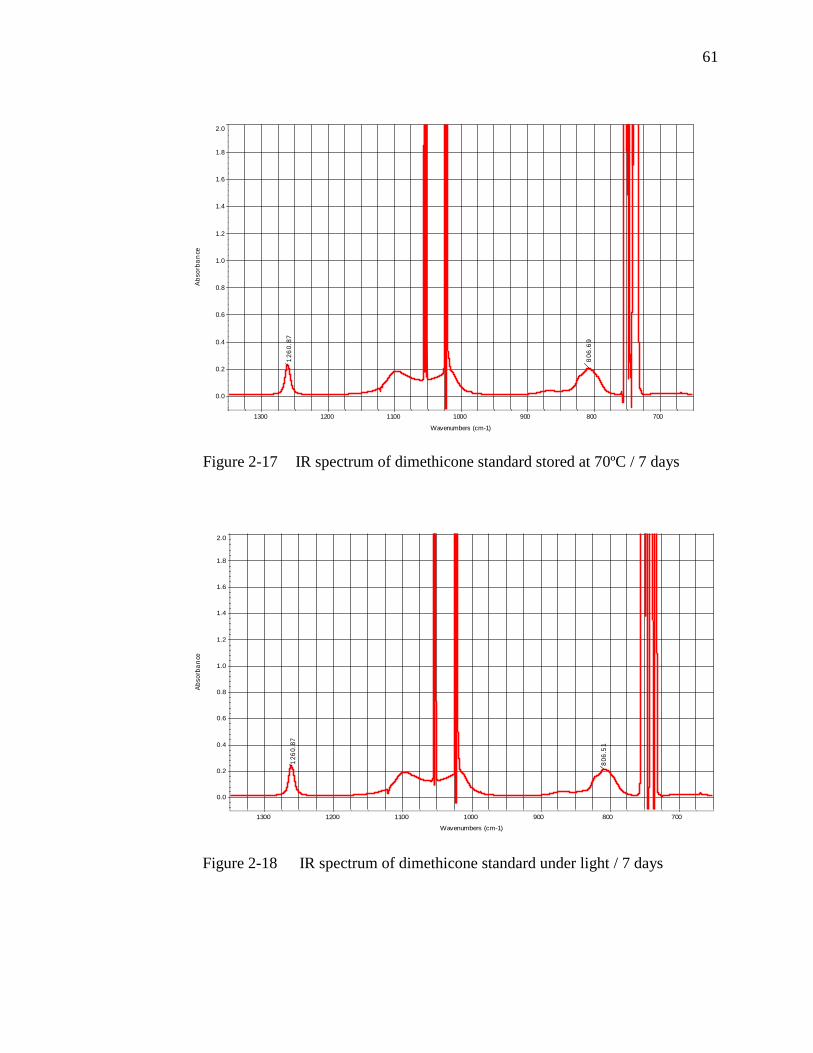
61
Figure 2-17 IR spectrum of dimethicone standard stored at 70ºC / 7 days
Figure 2-18 IR spectrum of dimethicone standard under light / 7 days
80
6.6
9
12
60
.87
0.0
0.2
0.4
0.6
0.8
1.0
1.2
1.4
1.6
1.8
2.0
Ab
so
rba
nce
700 800 900 1000 1100 1200 1300
Wavenumbers (cm-1)
80
6.5
1
12
60
.87
0.0
0.2
0.4
0.6
0.8
1.0
1.2
1.4
1.6
1.8
2.0
Ab
so
rba
nce
700 800 900 1000 1100 1200 1300
Wavenumbers (cm-1)

62
Figure 2-19 IR Spectrum of cyclomethicone standard at 70ºC / 7 days
Figure 2-20 IR spectrum of cyclomethicone standard under light / 7 days
80
8.9
4
12
60
.28
0.0
0.2
0.4
0.6
0.8
1.0
1.2
1.4
1.6
1.8
2.0
Ab
so
rba
nce
700 800 900 1000 1100 1200 1300
Wavenumbers (cm-1)
80
8.9
6
12
60
.27
0.0
0.2
0.4
0.6
0.8
1.0
1.2
1.4
1.6
1.8
2.0
Ab
so
rba
nce
700 800 900 1000 1100 1200 1300
Wavenumbers (cm-1)
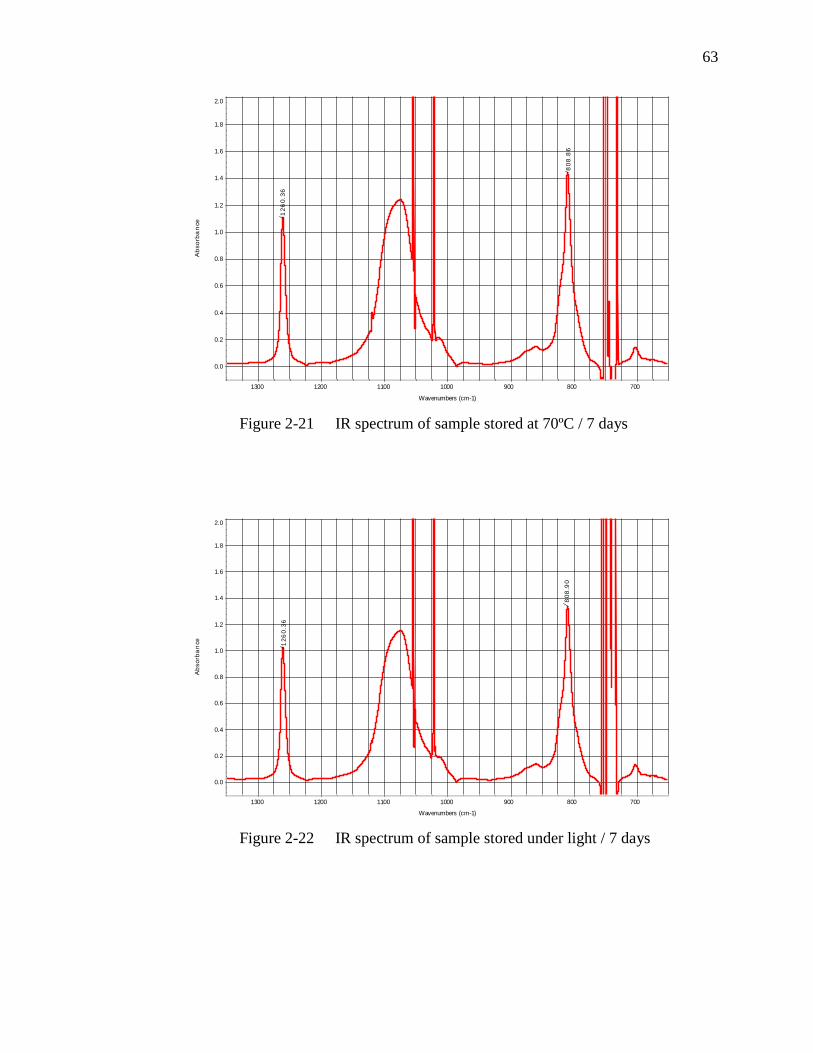
63
Figure 2-21 IR spectrum of sample stored at 70ºC / 7 days
Figure 2-22 IR spectrum of sample stored under light / 7 days
80
8.8
6
12
60
.36
0.0
0.2
0.4
0.6
0.8
1.0
1.2
1.4
1.6
1.8
2.0
Ab
so
rba
nce
700 800 900 1000 1100 1200 1300
Wavenumbers (cm-1)
80
8.9
0
12
60
.36
0.0
0.2
0.4
0.6
0.8
1.0
1.2
1.4
1.6
1.8
2.0
Ab
so
rba
nce
700 800 900 1000 1100 1200 1300
Wavenumbers (cm-1)

64
2.4.6 Standard Material Lot to Lot Variation
Two different lots of dimethicone and cyclomethcone standard material of the
same grade were used as standards for the assay of dimethicone on the same sample
solutions (Batch # 0014K). All the standard and sample solutions were prepared at the
same day and tested in the same sequence. The assay results are summarized in Table
2-13.
Significant difference (14.9%) between the average assay results using different
lots of standard material were observed. This indicated that the quantitative results of
dimethicone are sensitive to the lot of standard material that was used for the testing.
This was especially true for cyclomethicone. Therefore, it was concluded that the same
lot of the raw material that was used in the formulation should be used as the reference
standard material for the testing of the products.
Table 2-13 Assay Results by Different Lots Standards
Dimethicone
Standard
Cyclomethicone
Standard
% w/w of
Dimethicone
Lot # 0001349098 Lot# 0001693756
9.6074
9.9439
9.9588
Avg. 9.8367
LEK Lot# 89013
LEK Lot# 00358
8.2376
8.5779
8.5966
Avg. 8.4707
- - % difference 14.9
2.4.7 Standard and Sample Solution Stability
The standard and sample solution stability was evaluated by analyzing a
dimethicone standard solution, a cyclomethicone standard solution, and a sample solution
65
after they were made and stored at the ambient laboratory conditions up to 5 days relative
to the freshly made standard solutions. The recovery results of 100.3% (dimethicone
standard solution), 100.2% (cyclomethicone standard solution), and 99.2%(dimethicone
in the sample solution) demonstrated that the standard and sample solutions were stable
up to 5 days when they were stored at ambient laboratory conditions.
2.5 Conclusion
The results of the experiments outlined in this study indicated that the unique IR
method developed for simultaneous quantitation of dimethicone and cyclomethicone
using two simultaneous absorbance – concentration equations at two fixed wavenumbers
of 1258.50 cm-1
and 800.00 cm-1
(with baseline correction at 1325.00 cm-1
and 950.00 cm-
1, respectively) is applicable. The method has been successfully validated for the analysis
of dimethicone and cyclomethicone in consumer products such as skin protective
ointment (Formula # 9286-018, contains ~ 9% of dimethicone and ~ 33.8% of
cyclomethicone). The method was shown to be linear, accurate, precise, and specific.

66
Chapter 2 References
1. G.Torrado, A. Garcia-Arieta, F. de los Rios, J.C. Menendez, Journal of
Pharmaceutical and Biomedical Analysis, 19, 285-292 (1999).
2. Alltech Application Note #0048E, Alltech Associates, Inc.

67
Chapter 3: Characterization of Fish Oil Supplements
3.1 Introduction of Fish Oil Supplements
3.1.1 Background
Fish oil is oil derived from the tissues of oily fish such as sardines and mackerel,
etc. Fish oil is recommended for a healthy diet because it contains the omega-3 fatty
acids. Omega-3 is the single most important essential nutrient that is almost entirely
missing from our diets today. There is now overwhelming scientific evidence from
thousands of clinical studies1-12
that omega-3 can improve health and help prevent
disease including lowering triglycerides, general heart benefits, improving brain
functioning, as well as helping with diabetes, strokes, depression, arthritis, allergies,
circulation problems, ADHD (Attention-deficit hyperactivity disorder), Alzheimer's, skin
disorders, gout, and many others. In fact, the American Heart Association states
―Healthy people, people at high risk of Cardiovascular Disease (CVD) and patients with
preexisting CVD all benefit‖ and that ―some people with high triglyceride (blood fats)
and patients with CVD may benefit from more Omega-3 fatty acids than they can easily
get from diet alone. These people should talk to their doctor about taking supplements to
reduce heart disease risk.‖ Because of the health benefits of the omega-3 fatty acids,
there are loads of fish oil supplements under different brands on the market today.
Omega-3 fatty acids are a family of polyunsaturated fatty acids that have in
common a final carbon–carbon double bond in the n-3 position, that is, the third bond
from the methyl end of the fatty acid (See Figures 3-1 and 3-2). Important nutritionally
essential n-3 fatty acids are: α-linolenic acid (ALA), eicosapentaenoic acid (EPA), and
docosahexaenoic acid (DHA), all of which are polyunsaturated. These three

68
polyunsaturates have either 3, 5 or 6 double bonds in a carbon chain of 18, 20 or 22
carbon atoms, respectively. All double bonds are in the cis-configuration, i.e. the two
hydrogen atoms are on the same side of the double bond.
All the fish oil supplements claim active ingredients omega-3 fatty acids – EPA
and DHA. EPA and DHA play different roles in human body. DHA is important
component of cellular membranes and is highly concentrated in all nervous systems.
EPA is a precursor to a class of hormone-like chemicals called eicosanoids that reduce
inflammation throughout the body. The chemical structure of EPA is shown in Figure
3-1 and the chemical structure of DHA is shown in Figure 3-2.
Figure 3-1 Chemical structure of EPA
Figure 3-2 Chemical structure of DHA
Fatty fish like mackerel, lake trout, herring, sardines, albacore tuna and salmon
are high in omega-3 fatty acids, but these species are often predators, which can
accumulate toxic substances due to their position at the top of the food chain. For this
reason, many people have turned to fish oil supplements to get adequate omega-3 fatty
acids.
3.1.2 Natural triglyceride and ethyl esters of EPA and DHA

69
Natural triacylglycerol (TAG), it is also called triglyceride (TG), and ethyl ester
concentrates are different chemical forms that supply the active ingredients of EPA and
DHA in fish oil supplements that are currently available on the market. The chemical
structures of triglyceride and ethyl ester of EPA are shown in Figures 3-3 and 3-4,
respectively.
Figures 3-3 TAG where R’s are EPA or DHA or combinations
Figure 3-4 Ethyl ester of EPA
The term natural fish oil denotes that no synthetic chemicals are used/added
during the processing and the omega-3 fatty acids remain in their natural state, the
triglyceride form. Most natural fish oils have omega-3 content between 20-30%.
The ethyl ester concentrates are produced in a purification process where crude
fish oil is reacted with ethanol to form a synthetic substrate called an omega-3 ethyl ester.
Under vacuum, the solution is heat distilled (―molecular distillation‖) to separate the
volatile component, the omega-3 ethyl ester. The resulting condensate is a concentrated
omega-3 ethyl ester solution. The concentration of the omega-3 fatty acids depends on

70
the variables of the distillation process but normally results in a 50-70% omega-3
solution.
3.1.3 Fish Oil Production
Not all fish oil is created equal and it’s important to understand the basics of fish
oil production in order to understand which fish oil dietary supplement is the best. In fish
oil production, fish oil is taken from the tissues of fatty fish and is then processed into the
supplements that consumers take. If the fish oil product process includes a refining
process, the label is likely to say that the fish oil supplement is ―pharmaceutical grade‖ or
that it is ―molecularly distilled‖. An example process13
of fish oil production is shown in
the following steps:
1. Harvesting – Choose fish that provides fish oil with high EPA and DHA.
2. Washing – Wash out free fatty acids and other water soluble proteins.
3. Freezing – Get rid of excess saturated fats.
4. Filtration – Remove proteins and other volatiles that can make the oil smell bad. Also,
any heavy metals or toxins are removed at this stage.
5. Steam-washing – Final clean and deodorization.
6. Natural Oil – Makes natural fish oil. No synthetic elements or chemicals have been
added, and any environmental pollutants have been cleaned out. It is oil in nature form
that is as a triglyceride.
7. Concentration – Triglyceride is difficult to concentrate, it also degrades easily. So to
concentrate, a process of deconstruction and reconstruction need to be done.
8. Esterification – Break off the glycerol, and marries some ethanol to free fatty acid to
form ethyl ester, a synthenic oil form that is easy to concentrate.

71
9. Molecular Distillation – This is vital stage of concentration. The ethyl esters are
distilled at specific temperature that will evaporate unwanted fatty acids. So a certain
heat will be good for long chain EPA and DHA, and the resulting distilled EPA and DHA
is concentrated.
10. Reconstruction – Some manufacturers sell ethyl esters, but this synthetic format is
not very bioavailable. So a further step is needed to reconstituting the synthetic ethyl
esters back into natural form triglycerides. This can be done by mixing the ethyl esters
with natural glycerol, and at a certain temperature the elements marry.
11. Super Refining –Further clean any remaining volatiles or impurities including any
ethanol alcohol from the previous process. The result is super-refined concentrated
omega-3 oil on a natural triglyceride form.
Fish oil supplements manufacturers could sell the products generated from above
step 6 (EPA and DHA in triglyceride form but low concentration such as 20-30%, the
natural fish oil), step 9 (EPA and DHA in ethyl ester form, high concentration such as 50
-70%, molecular distilled), and step 11 (EPA and DHA in triglyceride form, super-
refined, high concentration such as 50%).
3.1.4 Fish Oil Absorption – Bioavailability
Fish oil absorption, i.e. the bioavailability of the natural triglycerides vs. synthetic
ethyl esters is currently being debated in the medical arena. Recently, much emphasis
has been placed on fish oil quality and purity but another important factor to be
considered for fish oils is bioavailability. There were studies14-15
that have addressed this
issue and have presented evidence that fish oil in its natural triglyceride form is
substantially better absorbed than the synthetic ethyl ester form. One of the apparent

72
reasons for the poor bioavailability of the ethyl ester form is due to its greater resistance
to digestive enzymes. During the digestive process, pancreatic lipase enzymes hydrolyse
(cleave) the oils to liberate the fatty acids. This stage of digestion prepares the fatty acids
for subsequent absorption. The ethyl ester form has been demonstrated to be 10-50 times
more resistant to this enzymatic process than the natural triglyceride form. Since our
bodies can only use nutrients that get absorbed, consuming omega-3 fatty acids in their
natural triglycerides form offers substantially better absorption over the ethyl ester form.
These statements were part of a marketing campaign by NutraSea.
However, two of the studies16-17
did not find a significant difference between the
bioavailability of the triglyceride form of fish oil vs. the ethyl ester form. But no studies
have shown the ethyl ester form to be superior. Minami Nutrition’s marketing campaign
states that several scientific studies revealed that post-24 hour absorption rates are
identical and that ethyl esters may be the preferred form in the prevention of heart
failure18
. Because of the increasing controversy about absorption, it is very important
then to characterize the fish oil supplements.
3.2 Objective of Fish Oil Supplement Characterization
As more health claims appear in the scientific literature, the market of fish oil
supplements has rapidly expanded, and there are many different brands of the products
sold in the local stores and online. Most of the products on the market claim the active
ingredient EPA and DHA on the labels, but the chemical form of EPA and DHA are not
indicated. This is misleading since most of consumers who are not familiar with the
products may think that fish oil supplements contain EPA and DHA free acids.

73
Therefore, the consumer has no idea what form of DHA or EPA they are ingesting.
Figure 3-5 shows a typical label of fish oil products without indication of the chemical
form. Only a few products indicate the chemical form on the labels, for example Figure
3-6 shows a label that states the chemical form, ―containing omega-3 fatty acids (as
natural triglycerides) supplying EPA and DHA …‖.
Figure 3-5 A typical fish oil product label Figure 3-6 An example of correct label
Since bioavailability of fish oil supplements is related to the chemical form of
DHA and EPA, it is necessary to develop a quick qualitative screening method to identify
the chemical form of the active ingredients EPA and DHA in fish oil products.
Also, there are only a few fish oil manufacturers but many distributors and
hundreds of products on the market with vastly different prices. It would be interesting to
find out the fish oil supplements that possibly made by the same manufacturers with
equal quality but sold under different brands and prices.

74
With rapid increasing of the market for health foods enriched with omega-3 fatty
acids including DHA and EPA, the quality of these important nutrients in marine
products should be strictly controlled. For this purpose polyunsaturated fatty acids in fish
and fish oils are routinely analyzed by gas chromatography (GC)19-22
. However, GC
methods are time-consuming, involve considerable manipulation steps that may cause
oxidation of lipids, may give variable results depending on the columns used, and pose
difficulty in correctly identifying each fatty acid in the chromatograms23
. The GC
method does not provide any information on whether the supplements contain
triglyceride or ethyl ester forms of the essential omega-3 fatty acids.
FTIR has been widely used for the analysis of edible oils and fats24-29
, such as
analysis of free fatty acids, the content of trans-double bonds, oxidation of fatty acids,
characterization, authentication of vegetable oils, etc. There were also few studies30-31
on
the determination of polyunsaturated fatty acids in pork fat and vegetable oils using
ATR-FTIR supported by multivariate statistical methods. Raman spectroscopy has also
been used for the analysis of cis/trans-isomer ratio of oils and fats32
, the level of
conjugated fatty acids in milk fat33
, oil and fat classification34
, predictions of various
single fatty acids35
, and characterization of the degree of fatty acid unsaturation of
salmon36
. 1H nuclear magnetic resonance (
1H NMR) in the study of oils and fats has
already been reviewed37
. It has been recently shown that polyunsaturated fatty acids in
fish and fish oils could be determined 1H and
13C NMR (carbon nuclear magnetic
resonance) spectroscopy38-39
.
Even though there are many publications about the analysis of fatty acids and
esters in dietary oils and fats using various techniques as listed above, currently there

75
were no reports on the characterization of fish oil supplements using FTIR and Raman.
Therefore, the goal of this research project was to utilize ATR-FTIR and Micro-Raman,
which are non-destructive and require no sample preparation, to develop a quick
qualitative screening method to identify the chemical form of the active ingredients EPA
and DHA in fish oil products, to classify the fish oil supplements on the markets by
means of principle component analysis, to develop a method for quantitative analysis of
EPA and DHA using standard addition approach, and to study the temperature dependent
spectral properties of polyunsaturated fatty acids such as EPA esters using 2D IR
correlation analysis.
3.3 Qualitative Characterization of Fish Oil Supplements by ATR-FTIR
3.3.1 Fish Oil Samples and Reference Material
About 75 different brands of fish oil supplement samples were purchased from
local grocery and drug stores, and online. Most of the samples were in the form of
softgels with others being liquid. An example list of products together with the chemical
forms, manufacturers, distributors, and label claims, etc. are summarized in Table 3-1.
The reference standards of triglyceride of EPA and DHA, ethyl ester of EPA and
DHA, were purchased in > 99% purity from Nu-Chek Prep. Inc. (Elysian, MN).
3.6.2 ATR-FTIR Instrumentation and Spectral Acquisition
A Bruker Equinox 55 FTIR spectrometer (Bruker Optics, Billerica, MA)
fitted with a DuroScope (Smith’s Detection System, Danbury, CT) diamond ATR and
equipped with a DTGS (Deuterated Triglycine Sulfate) detector was used to measure the
IR spectra of fish oil samples. The reference standard material or fish oil supplement
liquids (~ 40 uL) were placed on the single bounced diamond ATR crystal with a micro

76
pipette. One hundred (100) co-added scans were taken and averaged and measurements
were taken at a resolution of 4 cm-1
between 4000 - 400 cm-1
. The background was
collected before every sample was measured. After each sample analysis, the diamond
ATR crystal was cleaned with acetone.
3.3.3 Software Assistance
The software BioRad’s KnowItAll version 7.0 (BioRad, Philadelphia, PA) was
used for spectra evaluation and reports. Advanced Chemical Development (ACD) Curve
Manager version 9.0 (Toronto, Ontario, Canada) was used for band assignments and
database building. Thermo Galactic’s Spectral ID software version 3.02 (Thermo-Fisher
Scientific, Waltham, MA) was used for building the IR spectra library of fish oil
supplements to determine sample similarities and/or differences. Camo Unscrambler
Version 9.7 (Edison, NJ) was used for chemometrics - principle components analysis.
3.3.4 ATR-FTIR Spectra Analysis and Discussion
Total about 50 fish oil samples were analyzed with ATR-FTIR. Figure 3-7 shows
one of the typical FTIR Spectra of fish oil supplement samples (MaxEPA Fish Oil
Concentration). The corresponding band assignments are tabulated in Table 3-2. The
assignments of the major bands referenced some of the early studies of the IR spectra of
fatty acids and esters in edible oils and fats by Guillen and Cabo40
and book Spectral
Properties of Lipids by Richard J. Hamilton (page 241-242). Although fish oil sample
spectra seem to be similar, they show differences in the intensity of their bands as well as
in the exact frequency at which the maximum absorbance is produced in each case, due to
the different nature and composition of fish oils under study.
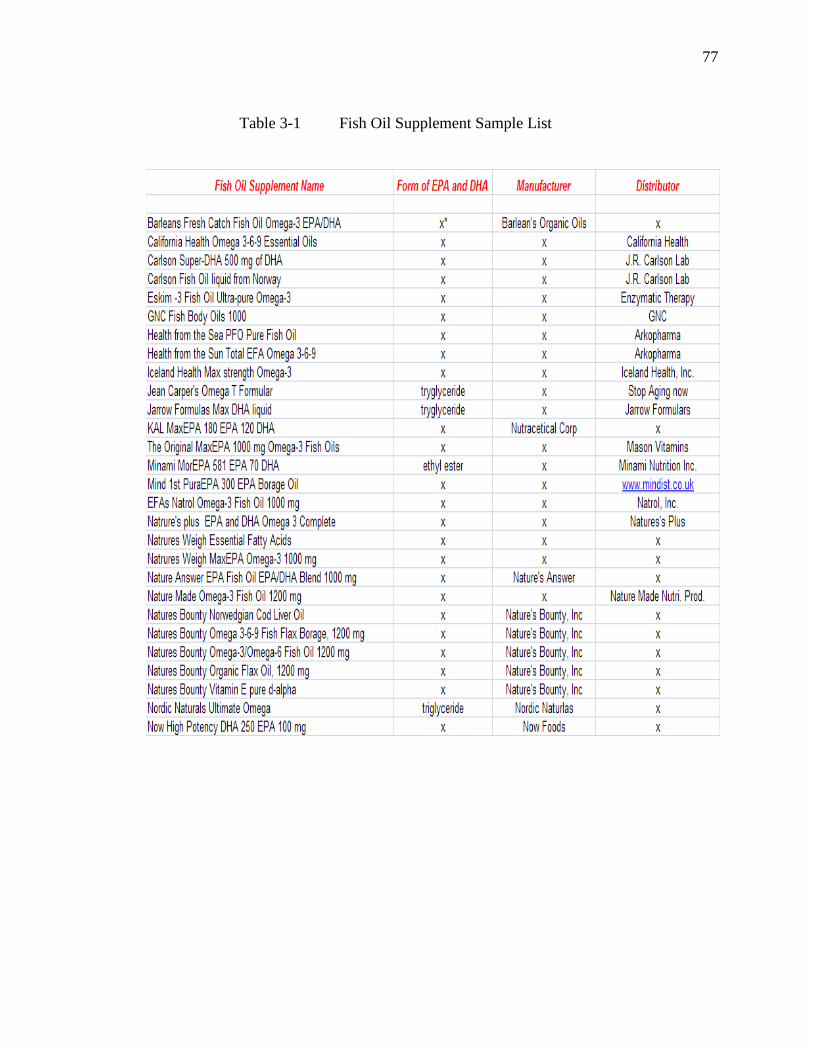
77
Table 3-1 Fish Oil Supplement Sample List
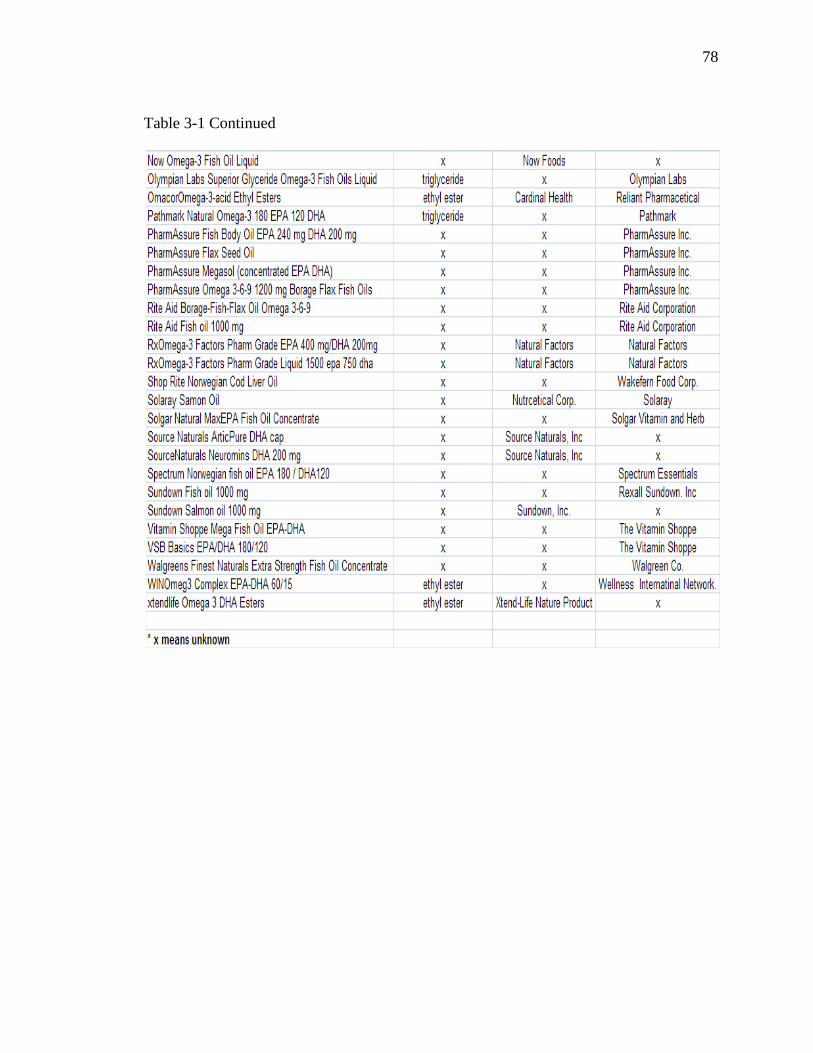
78
Table 3-1 Continued

79
Figure 3-7 A typical FTIR spectrum of fish oil supplements
Table 3-2 Major characteristic IR absorption bands of fish oils
Approx. Band Positions (cm-1) Assignments
3012 =C-H (cis, stretching)
2954 -C-H (CH3 groups, asym stretching)
2921 -C-H (CH2 groups, asym stretching)
2852 -C-H (CH2 and CH3 groups, sym stretching)
1743 -C=O (ester stretching)
1653 -C=C- (cis double bond stretching)
1457 -C-H (CH2 scissoring bending)
1376 -C-H (CH3 sym bending)
1230 -C-O, CH2 (stretching , bending)
1145 -C-O (stretching)
1097 -C-O ( stretching)
968 =C-H (trans, bending out of plane)
914 =C-H (cis, bending out of plane)
719 -(CH2)n, =C-H cis (rocking, bending out)
In general, the position of the band due to the C-H stretching vibration of cis
double bonds (=C-H) depends on the number of double bonds in the fatty acid chain,
cm-1
4000 3750 3500 3250 3000 2750 2500 2250 2000 1750 1500 1250 1000 750 500
abso
rban
ce
0
0.05
0.1
0.15
0.2
0.25
0.3
455.1
18
586.2
54
719.3
18
914.0
93
1097.3
1145.5
1
1376.9
31457.9
2
1743.3
3
2852.2
2921.6
33012.2
7
MaxEPA Fish Oil EPA 180 DHA 120
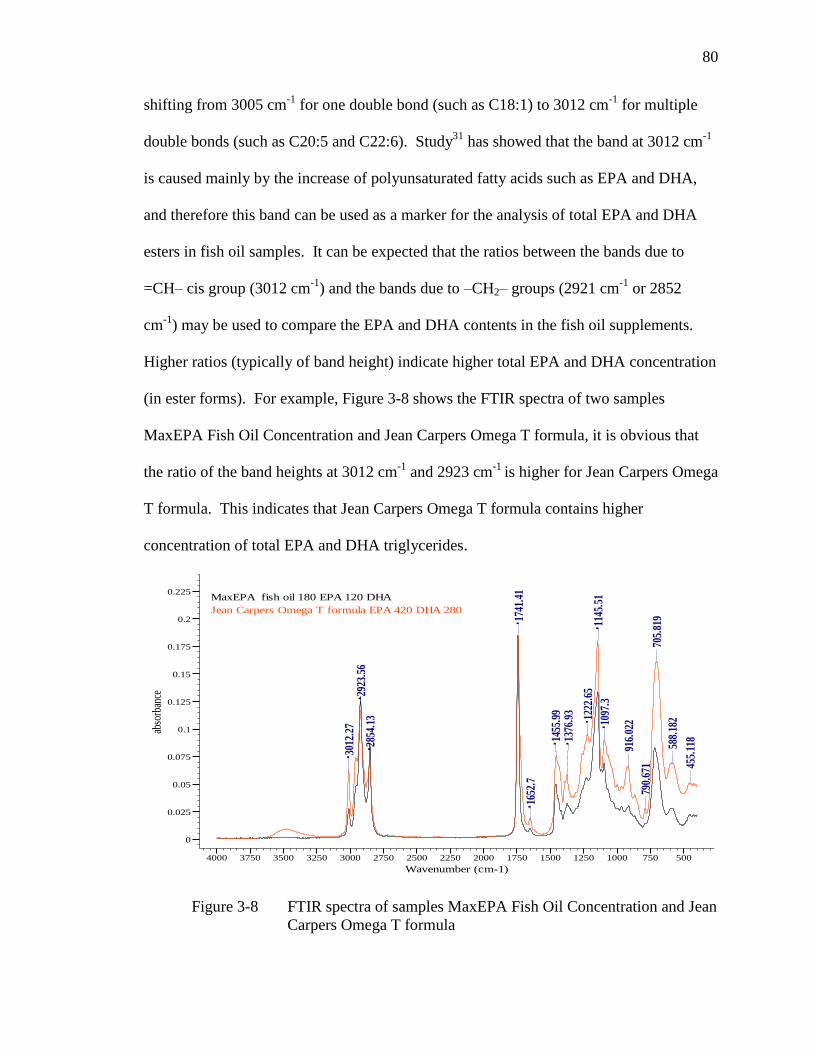
80
shifting from 3005 cm-1
for one double bond (such as C18:1) to 3012 cm-1
for multiple
double bonds (such as C20:5 and C22:6). Study31
has showed that the band at 3012 cm-1
is caused mainly by the increase of polyunsaturated fatty acids such as EPA and DHA,
and therefore this band can be used as a marker for the analysis of total EPA and DHA
esters in fish oil samples. It can be expected that the ratios between the bands due to
=CH– cis group (3012 cm-1
) and the bands due to –CH2– groups (2921 cm-1
or 2852
cm-1
) may be used to compare the EPA and DHA contents in the fish oil supplements.
Higher ratios (typically of band height) indicate higher total EPA and DHA concentration
(in ester forms). For example, Figure 3-8 shows the FTIR spectra of two samples
MaxEPA Fish Oil Concentration and Jean Carpers Omega T formula, it is obvious that
the ratio of the band heights at 3012 cm-1
and 2923 cm-1
is higher for Jean Carpers Omega
T formula. This indicates that Jean Carpers Omega T formula contains higher
concentration of total EPA and DHA triglycerides.
Figure 3-8 FTIR spectra of samples MaxEPA Fish Oil Concentration and Jean
Carpers Omega T formula
Wavenumber (cm-1)
4000 3750 3500 3250 3000 2750 2500 2250 2000 1750 1500 1250 1000 750 500
abso
rban
ce
0
0.025
0.05
0.075
0.1
0.125
0.15
0.175
0.2
0.225
455.
118
588.
182
705.
819
790.
671
916.
02210
97.3
1145
.51
1222
.65
1376
.93
1455
.99
1652
.717
41.4
1
2854
.13
2923
.56
3012
.27
MaxEPA fish oil 180 EPA 120 DHA
Jean Carpers Omega T formula EPA 420 DHA 280

81
Four reference standards, triglycerides of EPA and DHA, ethyl esters of EPA and
DHA, were analyzed with ATR-FTIR, and the spectra of the four compounds are shown
in Figures 3-9 and 3-10.
Figure 3-9 FTIR spectra of ethyl esters of EPA and DHA
Figure 3-10 FTIR spectra of triglycerides of EPA and DHA
Wavenumber (cm-1)
4000 3750 3500 3250 3000 2750 2500 2250 2000 1750 1500 1250 1000 750 500
abso
rban
ce
-0.3
-0.2
-0.1
0
0.1
0.2
0.3
0.4
457.
047
597.
825
698.
105
792.
6925.
664
1068
.37
1097
.311
43.5
812
30.3
612
63.1
513
61.5
1390
.42
1438
.64
1652
.7
1743
.33
2931
.27
2962
.13
3012
.27
EPA triglyceride Nu-Chek
DHA triglyceride Nu-Chek
Wavenumber (cm-1)
4000 3750 3500 3250 3000 2750 2500 2250 2000 1750 1500 1250 1000 750 500
abso
rban
ce
-0.3
-0.2
-0.1
0
0.1
0.2
0.3
0.4
599.
753
700.
033
790.
671
862.
025
925.
664
1037
.52
1095
.37
1155
.15
1247
.72
1348
1371
.14
1392
.35
1444
.42
1652
.717
35.6
2
2931
.27
2964
.05
3012
.27
EPA ethyl ester Nu-Chek
DHA ethyl ester Nu-Chek
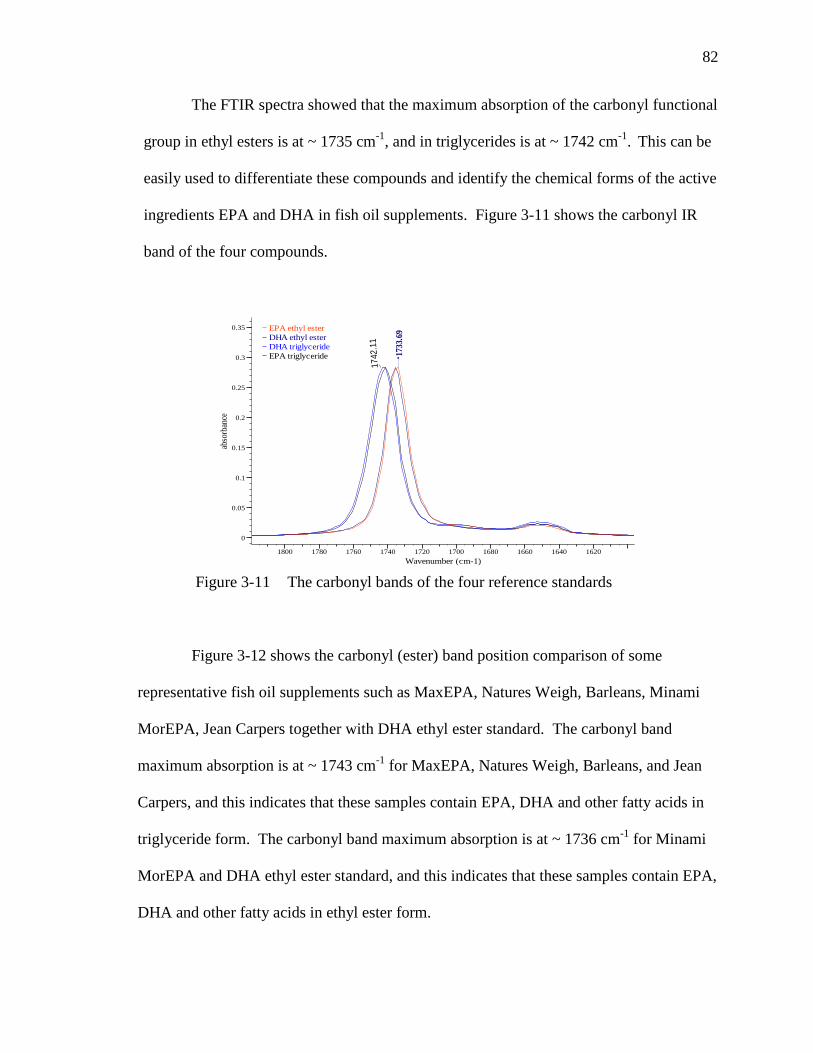
82
The FTIR spectra showed that the maximum absorption of the carbonyl functional
group in ethyl esters is at ~ 1735 cm-1
, and in triglycerides is at ~ 1742 cm-1
. This can be
easily used to differentiate these compounds and identify the chemical forms of the active
ingredients EPA and DHA in fish oil supplements. Figure 3-11 shows the carbonyl IR
band of the four compounds.
Figure 3-11 The carbonyl bands of the four reference standards
Figure 3-12 shows the carbonyl (ester) band position comparison of some
representative fish oil supplements such as MaxEPA, Natures Weigh, Barleans, Minami
MorEPA, Jean Carpers together with DHA ethyl ester standard. The carbonyl band
maximum absorption is at ~ 1743 cm-1
for MaxEPA, Natures Weigh, Barleans, and Jean
Carpers, and this indicates that these samples contain EPA, DHA and other fatty acids in
triglyceride form. The carbonyl band maximum absorption is at ~ 1736 cm-1
for Minami
MorEPA and DHA ethyl ester standard, and this indicates that these samples contain EPA,
DHA and other fatty acids in ethyl ester form.
17
42
.11
Wavenumber (cm-1)
1800 1780 1760 1740 1720 1700 1680 1660 1640 1620
abso
rban
ce
0
0.05
0.1
0.15
0.2
0.25
0.3
0.35
1733
.69EPA ethyl ester
DHA ethyl ester
DHA triglyceride
EPA triglyceride

83
Figure 3-12 Differentiate fish oil supplements with –C=O (ester) bands
In addition, the FTIR spectra showed a strong C-O stretching band at ~ 1153 cm-1
for ethyl esters of EPA and DHA, and at ~ 1143 cm-1
for triglycerides of EPA and DHA
This may also be used to differentiate the chemical forms of EPA and DHA in fish oil
supplements depending on the composition of samples.
3.3.5 Principle Components Analysis (PCA) of FTIR Spectra
PCA was applied in this study to identify the similarities and differences between
sample spectra and therefore to view the interrelationships among the commercial fish oil
supplements and to detect and interpret sample patterns and groupings (classification).
Software Camo Unscrambler, Version 9.7, was used for the PCA analysis. The
analysis parameters are as follows:

84
Sample Sets: 47; Variable Sets: 510 – 1940 cm-1
, 2700 – 3210 cm-1
Center data; Number of PCs: 6; Model Size: Full.
Since the spectra showed very good repeatability for the same sample analyzed
multiple times on the same and different days, there was no spectra pre-treatment
performed before PCA analysis. Figure 3-13 shows the overlay spectra of sample
MaxEPA Fish Oil Concentration which was analyzed at different time (on 03/19/07 and
04/14/07). The three spectra superimpose very well. In order to further demonstrate the
spectra differences of the three samples, Figure 3-14 shows the subtracted spectra of
MaxEPA fish oil r2_04-14-17 and MaxEPA fish oil_03-19-07 from the reference
spectrum of MaxEPA fish oil r1_04-14-17. The subtracted spectra appear to be virtually
straight line. This indicated that the FTIR spectra of fish oil samples collected at different
days and different runs (r1 and r2 during the same day) are very close to each other, and
therefore, no further spectrum treatments are required for PCA analysis.
Figure 3-13 Overlay spectra of the MaxEPA Fish Oil Concentrate
analyzed at different time
4000 3750 3500 3250 3000 2750 2500 2250 2000 1750 1500 1250 1000 750 500
0
0.05
0.1
0.15
0.2
0.25
MaxEPA fish oil r1_04-14-07
MaxEPA fish Oil_03-19-07
MaxEPA fish oil r2_04-14-07

85
Figure 3-14 Subtracted spectra of MaxEPA fish oil r2_04-14-17and MaxEPA fish
oil_03-19-07 against reference spectrum of MaxEPA fish oil r1_04-14-17
The most commonly used plot in PCA is the score plot for PC1 versus PC2 since
these are the two directions along which the data swarm exhibits the largest and the
second largest variances. The PCA scores plot (PC1 vs. PC2) of the FTIR spectra of 47
fish oil supplements is shown in Figure 3-15. The first two principle components (PC1
and PC2) made up 94% of the variance. The corresponding PCA loadings plot (PC1 vs.
PC2) is shown in Figure 3-16. Each number in the PCA scores plot stands for a
particular fish oil supplement sample. Four groups (I, II, III, and IV) of spectra were
clearly separated from negative to positive values of the first score PC1. The loading plot
indicated the corresponding possible variables that differentiated each group. The PC1
was mainly related to the band position of ester carbonyl group in the samples. The fish
oil supplements containing fatty acids in ethyl ester form, which showed a C=O
Wavenumber (cm-1)
4000 3750 3500 3250 3000 2750 2500 2250 2000 1750 1500 1250 1000 750 500
abso
rban
ce
0
0.1
0.2
0.3
0.4
0.5
0.6
0.7
0.8
MaxEPA fish oil r2_04-14-07 - MaxEPA fish oil r1_04-14-07 X1.00
MaxEPA fish oil_03-19-07 - MaxEPA fish oil r1_04-14-07 X1.00
MaxEPA fish oil r1_04-14-07

86
absorption band at ~ 1735 cm-1
, were clustered into group I. The fish oil supplements
containing fatty acids in triglyceride form, which showed a C=O absorption band at ~
1742 cm-1
, were clustered into group IV.
Figure 3-15 PCA scores plot (PC1 vs. PC2) of FTIR spectra of fish oil supplements
Figure 3-16 PCA loading plot (PC1 vs. PC2)
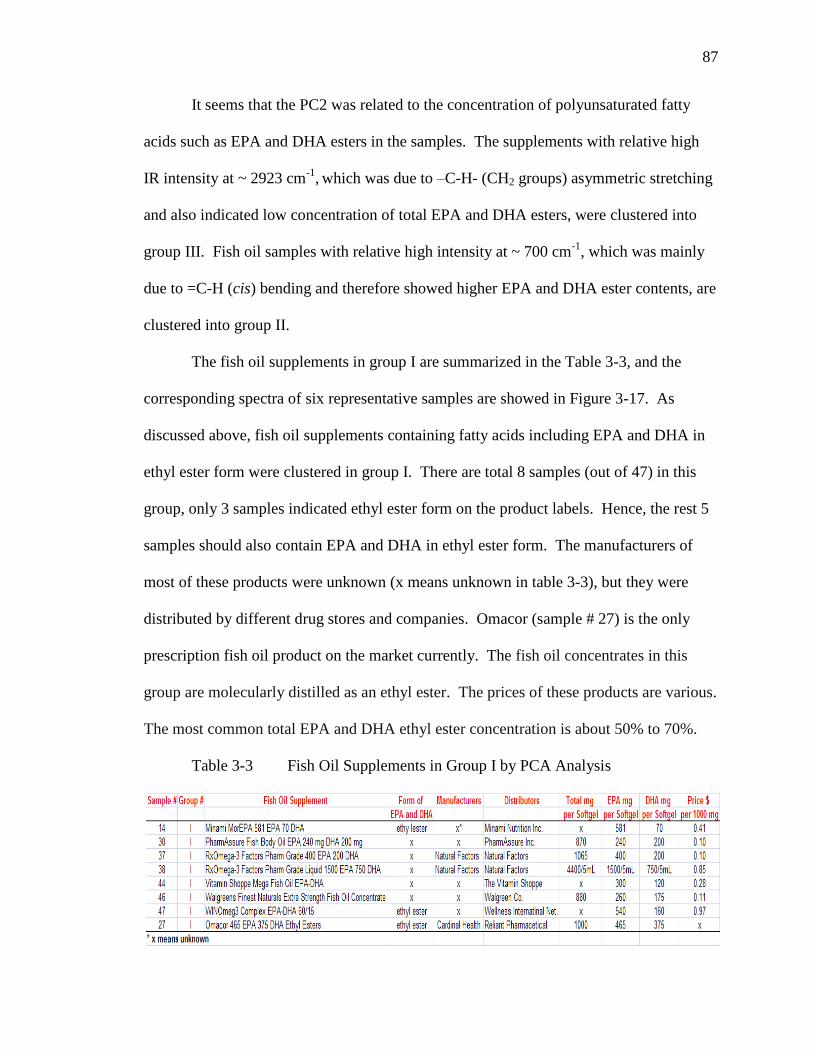
87
It seems that the PC2 was related to the concentration of polyunsaturated fatty
acids such as EPA and DHA esters in the samples. The supplements with relative high
IR intensity at ~ 2923 cm-1
, which was due to –C-H- (CH2 groups) asymmetric stretching
and also indicated low concentration of total EPA and DHA esters, were clustered into
group III. Fish oil samples with relative high intensity at ~ 700 cm-1
, which was mainly
due to =C-H (cis) bending and therefore showed higher EPA and DHA ester contents, are
clustered into group II.
The fish oil supplements in group I are summarized in the Table 3-3, and the
corresponding spectra of six representative samples are showed in Figure 3-17. As
discussed above, fish oil supplements containing fatty acids including EPA and DHA in
ethyl ester form were clustered in group I. There are total 8 samples (out of 47) in this
group, only 3 samples indicated ethyl ester form on the product labels. Hence, the rest 5
samples should also contain EPA and DHA in ethyl ester form. The manufacturers of
most of these products were unknown (x means unknown in table 3-3), but they were
distributed by different drug stores and companies. Omacor (sample # 27) is the only
prescription fish oil product on the market currently. The fish oil concentrates in this
group are molecularly distilled as an ethyl ester. The prices of these products are various.
The most common total EPA and DHA ethyl ester concentration is about 50% to 70%.
Table 3-3 Fish Oil Supplements in Group I by PCA Analysis
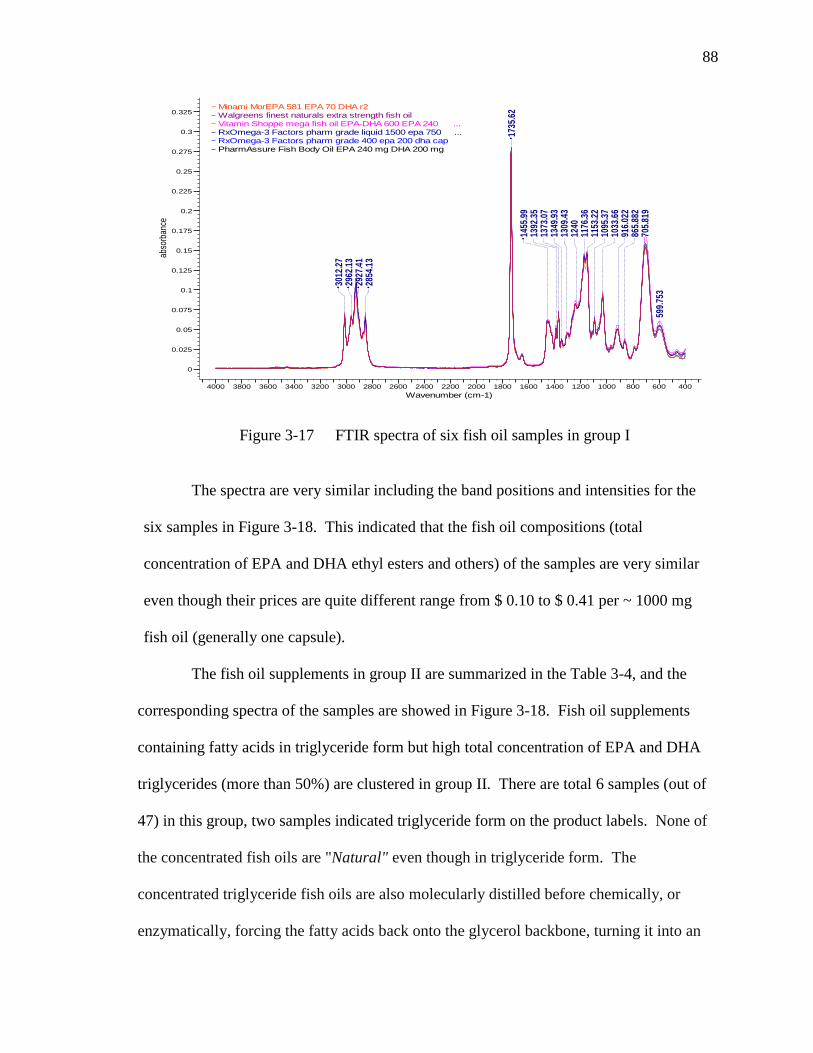
88
Figure 3-17 FTIR spectra of six fish oil samples in group I
The spectra are very similar including the band positions and intensities for the
six samples in Figure 3-18. This indicated that the fish oil compositions (total
concentration of EPA and DHA ethyl esters and others) of the samples are very similar
even though their prices are quite different range from $ 0.10 to $ 0.41 per ~ 1000 mg
fish oil (generally one capsule).
The fish oil supplements in group II are summarized in the Table 3-4, and the
corresponding spectra of the samples are showed in Figure 3-18. Fish oil supplements
containing fatty acids in triglyceride form but high total concentration of EPA and DHA
triglycerides (more than 50%) are clustered in group II. There are total 6 samples (out of
47) in this group, two samples indicated triglyceride form on the product labels. None of
the concentrated fish oils are "Natural" even though in triglyceride form. The
concentrated triglyceride fish oils are also molecularly distilled before chemically, or
enzymatically, forcing the fatty acids back onto the glycerol backbone, turning it into an
Wavenumber (cm-1)
4000 3800 3600 3400 3200 3000 2800 2600 2400 2200 2000 1800 1600 1400 1200 1000 800 600 400
abso
rban
ce
0
0.025
0.05
0.075
0.1
0.125
0.15
0.175
0.2
0.225
0.25
0.275
0.3
0.325
599.
753
705.
819
865.
882
916.
022
1033
.66
1095
.37
1153
.22
1176
.36
1240
1309
.43
1349
.93
1373
.07
1392
.35
1455
.99
1735
.62
2854
.13
2927
.41
2962
.13
3012
.27
Minami MorEPA 581 EPA 70 DHA r2Walgreens finest naturals extra strength fish oil Vitamin Shoppe mega fish oil EPA-DHA 600 EPA 240 ...RxOmega-3 Factors pharm grade liquid 1500 epa 750 ...RxOmega-3 Factors pharm grade 400 epa 200 dha capPharmAssure Fish Body Oil EPA 240 mg DHA 200 mg

89
altered triglyceride, not a "Natural" triglyceride. The enriched triglycerides may have
abnormal fatty acid distributions on the glycerol backbone, and this information is rarely
provided. Therefore no bioavailability information specifically on the altered triglyceride
is available. The concentrated triglyceride form of fish oil is selling for about the similar
prices as the ethyl ester form, and in some cases, considerably more.
Table 3-4 Fish Oil Supplements in Group II by PCA Analysis
The fish oil supplements in the group III are summarized in the Table 3.5, and the
corresponding spectra of the samples are showed in Figure 3.17. Fish oil supplements
containing omega 3, 6, and 9 fatty acids in triglyceride form were clustered in group III.
Figure 3-18 FTIR spectra of fish oil samples in group II
cm-1
4000 3800 3600 3400 3200 3000 2800 2600 2400 2200 2000 1800 1600 1400 1200 1000 800 600 400
ab
sorb
an
ce
0
0.02
0.04
0.06
0.08
0.1
0.12
0.14
0.16
0.18
0.2
0.22 source naturals ArticPure DHAPharmAssure megasol premium concentrated EPA DHANow high potency DHA 250 EPA 100 mgNordic naturals ultimate omega 325 EPA 225 EPA 640 totJean Carpers Omega T formula EPA 420 DHA 280 tryglycerid...
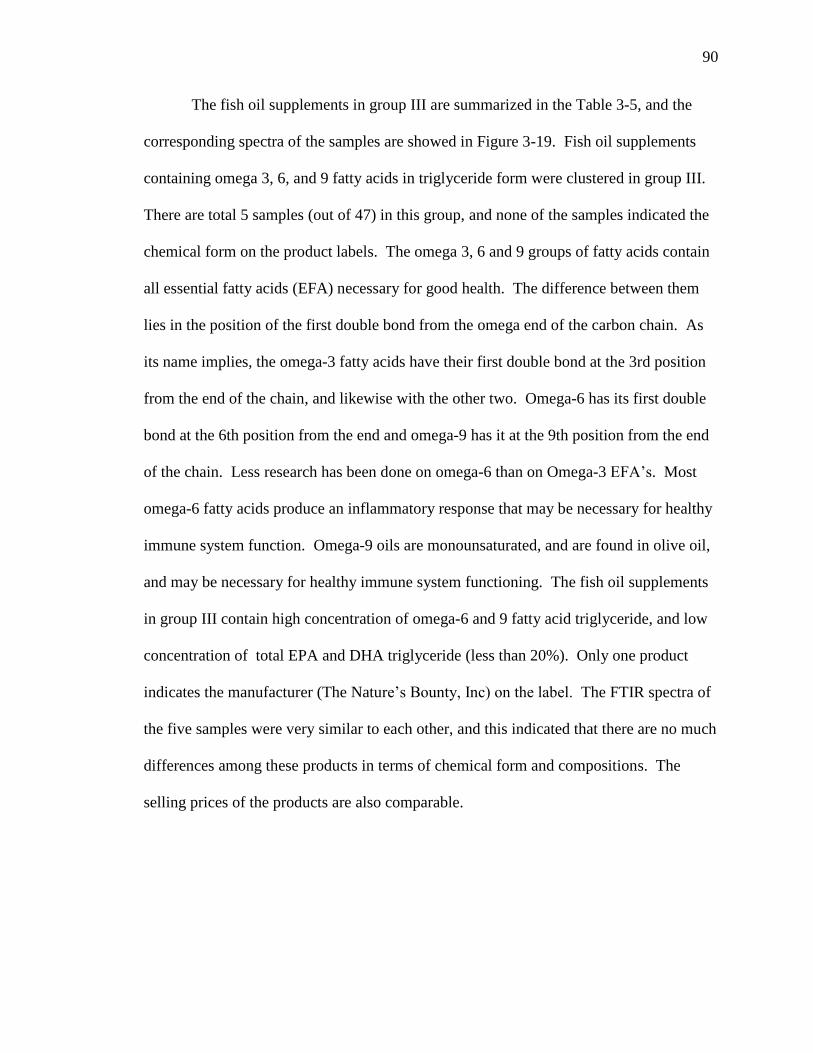
90
The fish oil supplements in group III are summarized in the Table 3-5, and the
corresponding spectra of the samples are showed in Figure 3-19. Fish oil supplements
containing omega 3, 6, and 9 fatty acids in triglyceride form were clustered in group III.
There are total 5 samples (out of 47) in this group, and none of the samples indicated the
chemical form on the product labels. The omega 3, 6 and 9 groups of fatty acids contain
all essential fatty acids (EFA) necessary for good health. The difference between them
lies in the position of the first double bond from the omega end of the carbon chain. As
its name implies, the omega-3 fatty acids have their first double bond at the 3rd position
from the end of the chain, and likewise with the other two. Omega-6 has its first double
bond at the 6th position from the end and omega-9 has it at the 9th position from the end
of the chain. Less research has been done on omega-6 than on Omega-3 EFA’s. Most
omega-6 fatty acids produce an inflammatory response that may be necessary for healthy
immune system function. Omega-9 oils are monounsaturated, and are found in olive oil,
and may be necessary for healthy immune system functioning. The fish oil supplements
in group III contain high concentration of omega-6 and 9 fatty acid triglyceride, and low
concentration of total EPA and DHA triglyceride (less than 20%). Only one product
indicates the manufacturer (The Nature’s Bounty, Inc) on the label. The FTIR spectra of
the five samples were very similar to each other, and this indicated that there are no much
differences among these products in terms of chemical form and compositions. The
selling prices of the products are also comparable.
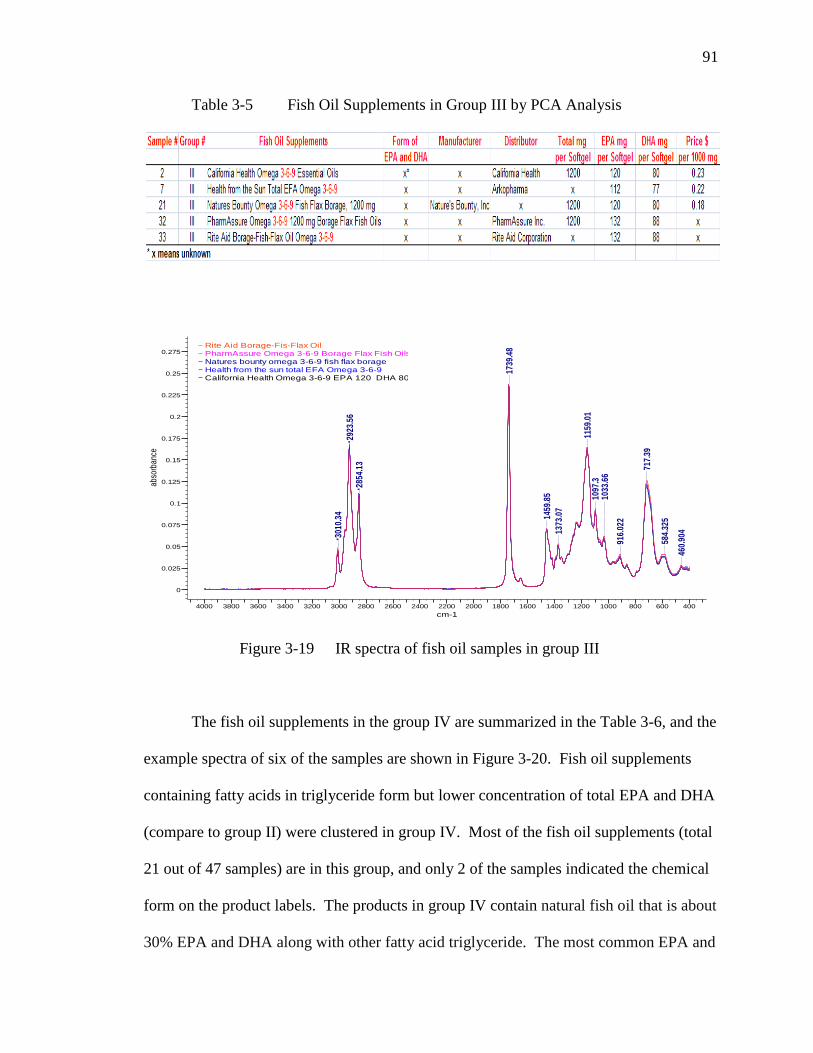
91
Table 3-5 Fish Oil Supplements in Group III by PCA Analysis
Figure 3-19 IR spectra of fish oil samples in group III
The fish oil supplements in the group IV are summarized in the Table 3-6, and the
example spectra of six of the samples are shown in Figure 3-20. Fish oil supplements
containing fatty acids in triglyceride form but lower concentration of total EPA and DHA
(compare to group II) were clustered in group IV. Most of the fish oil supplements (total
21 out of 47 samples) are in this group, and only 2 of the samples indicated the chemical
form on the product labels. The products in group IV contain natural fish oil that is about
30% EPA and DHA along with other fatty acid triglyceride. The most common EPA and
cm-1
4000 3800 3600 3400 3200 3000 2800 2600 2400 2200 2000 1800 1600 1400 1200 1000 800 600 400
abso
rban
ce
0
0.025
0.05
0.075
0.1
0.125
0.15
0.175
0.2
0.225
0.25
0.275
460.
904
584.
325
717.
39
916.
022
1033
.66
1097
.311
59.0
1
1373
.07
1459
.85
1739
.48
2854
.13
2923
.56
3010
.34
Rite Aid Borage-Fis-Flax OilPharmAssure Omega 3-6-9 Borage Flax Fish OilsNatures bounty omega 3-6-9 fish flax borageHealth from the sun total EFA Omega 3-6-9California Health Omega 3-6-9 EPA 120 DHA 80

92
DHA ratio in natural fish oil is 18:12, meaning that the average 1,000 mg fish
oil capsule contains 180 mg of EPA and 120 mg of DHA triglyceride. Although natural
fish oils offer half the EPA and DHA concentration of ethyl ester fish oil (group I), it is
generally claimed that they are 2-3 times better absorbed by the body. Considering the
higher cost of ethyl ester concentrates, it could be that natural fish oils represent a much
better value for omega-3 supplementation. The spectra of the six samples in Figure 3-20
are almost identical and this may indicate that these products were made by the same
manufactures but sold by different distributors with wide range of prices from 6 to 20
cents per capsule.
Table 3-6 Fish Oil Supplements in the Group IV by PCA Analysis
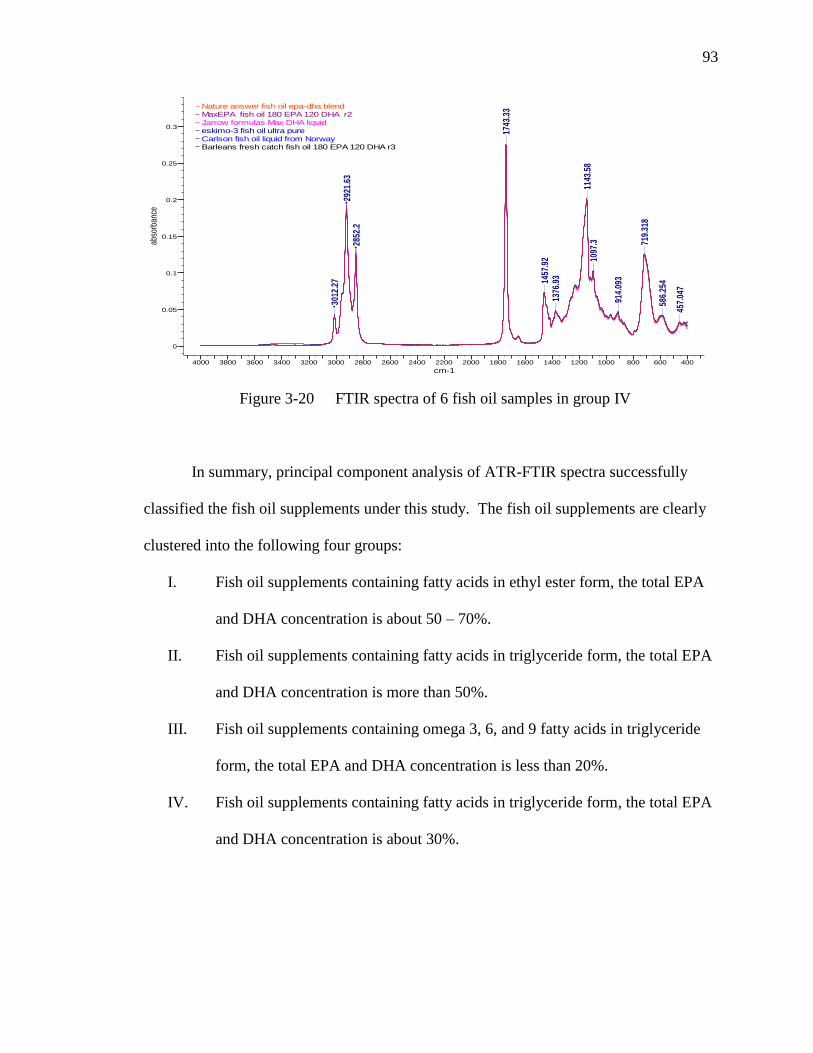
93
Figure 3-20 FTIR spectra of 6 fish oil samples in group IV
In summary, principal component analysis of ATR-FTIR spectra successfully
classified the fish oil supplements under this study. The fish oil supplements are clearly
clustered into the following four groups:
I. Fish oil supplements containing fatty acids in ethyl ester form, the total EPA
and DHA concentration is about 50 – 70%.
II. Fish oil supplements containing fatty acids in triglyceride form, the total EPA
and DHA concentration is more than 50%.
III. Fish oil supplements containing omega 3, 6, and 9 fatty acids in triglyceride
form, the total EPA and DHA concentration is less than 20%.
IV. Fish oil supplements containing fatty acids in triglyceride form, the total EPA
and DHA concentration is about 30%.
cm-1
4000 3800 3600 3400 3200 3000 2800 2600 2400 2200 2000 1800 1600 1400 1200 1000 800 600 400
abso
rban
ce
0
0.05
0.1
0.15
0.2
0.25
0.3
457.
047
586.
254
719.
318
914.
093
1097
.311
43.5
8
1376
.931457
.92
1743
.33
2852
.229
21.6
3
3012
.27
Nature answer fish oil epa-dha blendMaxEPA fish oil 180 EPA 120 DHA r2Jarrow formulas Max DHA liquideskimo-3 fish oil ultra pureCarlson fish oil liquid from NorwayBarleans fresh catch fish oil 180 EPA 120 DHA r3
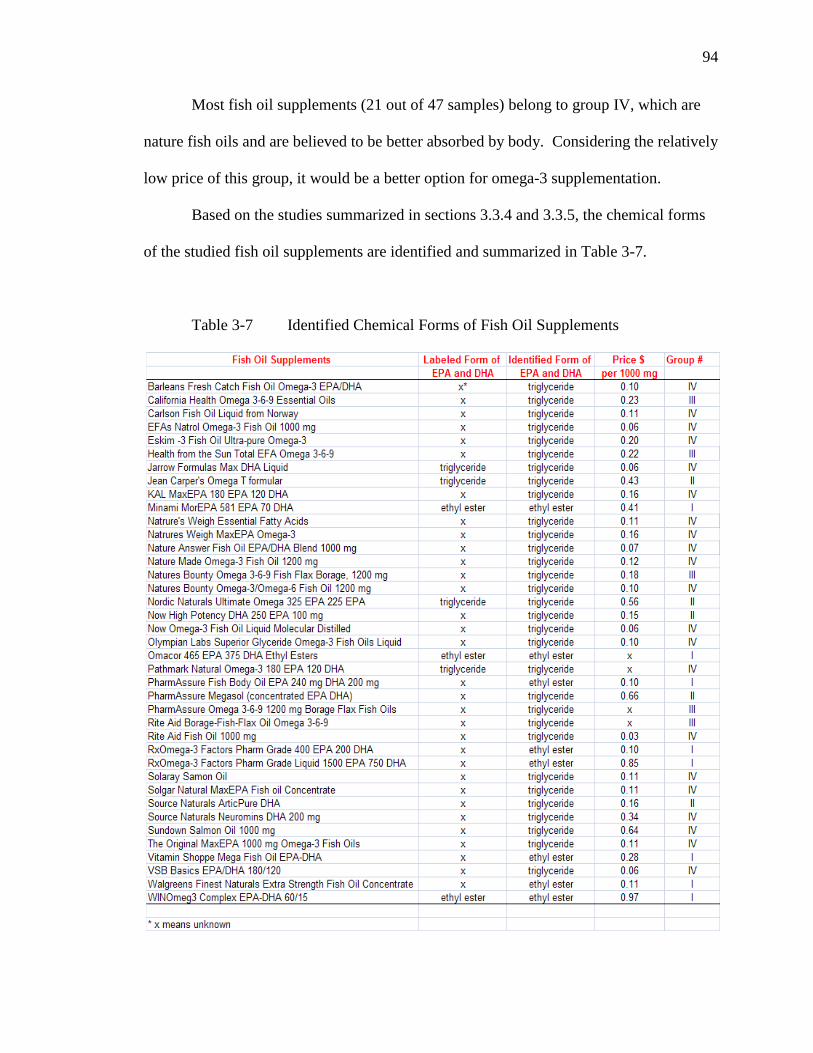
94
Most fish oil supplements (21 out of 47 samples) belong to group IV, which are
nature fish oils and are believed to be better absorbed by body. Considering the relatively
low price of this group, it would be a better option for omega-3 supplementation.
Based on the studies summarized in sections 3.3.4 and 3.3.5, the chemical forms
of the studied fish oil supplements are identified and summarized in Table 3-7.
Table 3-7 Identified Chemical Forms of Fish Oil Supplements

95
3.3.6 IR Spectra Library of Fish Oil Supplements
Thermo Galactic Spectral ID version 3.02 was used to create a FTIR spectral
library of fish oil supplements. A library file including the spectra of all the fish oil
supplements was created in Spectral ID as a database to determine similarity and/or
differences among the samples. The library can be used for rapid searching and product
comparison every time a new fish oil supplement is analyzed.
Spectral ID optical spectral data searching of an unknown versus library spectra
uses seven search algorithms. These seven algorithms were compared to determine the
best search method based on Hit Quality Index (HQI) for the spectra of fish oil
supplements. The 7 algorithms are: Euclidian Distance, Absolute Value, First
Derivative, Least Squares, First Derivative Least Squares, Correlation, and First
Derivative Correlation.
The First Derivative Correlation Algorithm method was chosen in this study.
This algorithm is the same as the correlation algorithm except that the first derivative of
both the unknown and library spectra are taken before calculating the HQI. In
Correlation Algorithm, both the unknown and the library data are centered about their
respective means before the vector dot products are calculated based on the equation 3-1:
HQI = 1 – (Libm•Unkm)2/(Libm•Libm)(Unknm•Unknm) (3-1)
where the vectors are defined as the follows:
Libm= Lib – i)/n Unknm= Unkn – i)/n
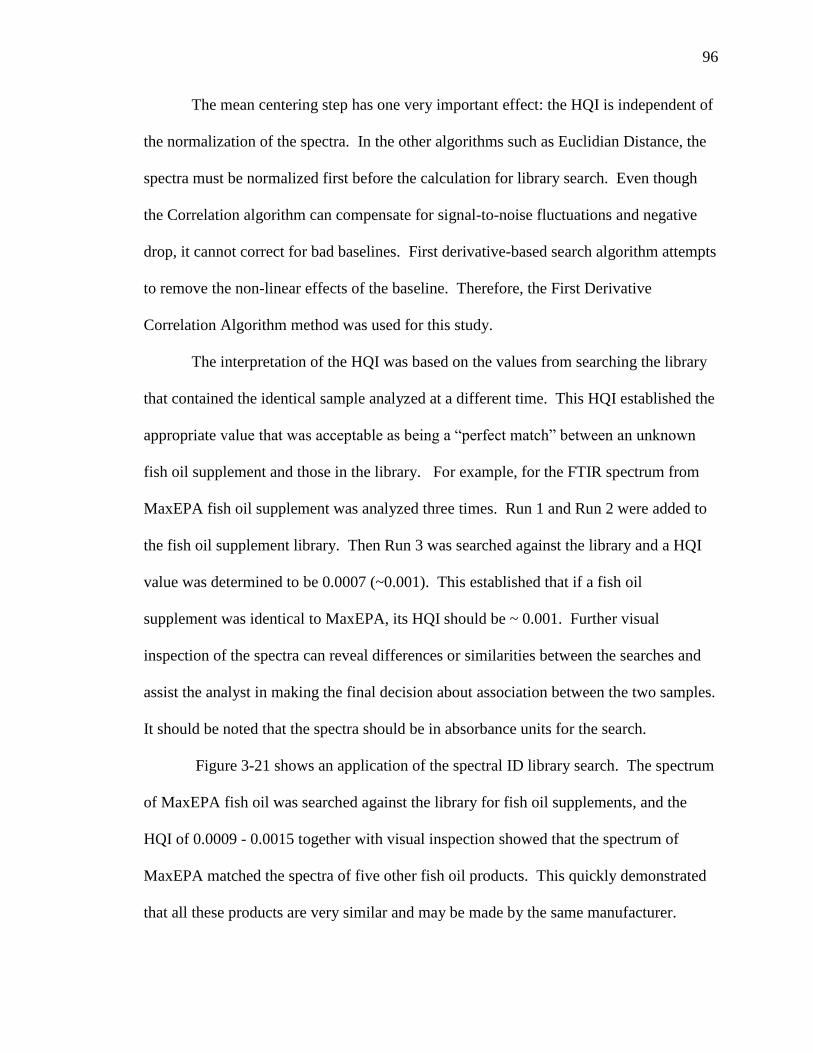
96
The mean centering step has one very important effect: the HQI is independent of
the normalization of the spectra. In the other algorithms such as Euclidian Distance, the
spectra must be normalized first before the calculation for library search. Even though
the Correlation algorithm can compensate for signal-to-noise fluctuations and negative
drop, it cannot correct for bad baselines. First derivative-based search algorithm attempts
to remove the non-linear effects of the baseline. Therefore, the First Derivative
Correlation Algorithm method was used for this study.
The interpretation of the HQI was based on the values from searching the library
that contained the identical sample analyzed at a different time. This HQI established the
appropriate value that was acceptable as being a ―perfect match‖ between an unknown
fish oil supplement and those in the library. For example, for the FTIR spectrum from
MaxEPA fish oil supplement was analyzed three times. Run 1 and Run 2 were added to
the fish oil supplement library. Then Run 3 was searched against the library and a HQI
value was determined to be 0.0007 (~0.001). This established that if a fish oil
supplement was identical to MaxEPA, its HQI should be ~ 0.001. Further visual
inspection of the spectra can reveal differences or similarities between the searches and
assist the analyst in making the final decision about association between the two samples.
It should be noted that the spectra should be in absorbance units for the search.
Figure 3-21 shows an application of the spectral ID library search. The spectrum
of MaxEPA fish oil was searched against the library for fish oil supplements, and the
HQI of 0.0009 - 0.0015 together with visual inspection showed that the spectrum of
MaxEPA matched the spectra of five other fish oil products. This quickly demonstrated
that all these products are very similar and may be made by the same manufacturer.
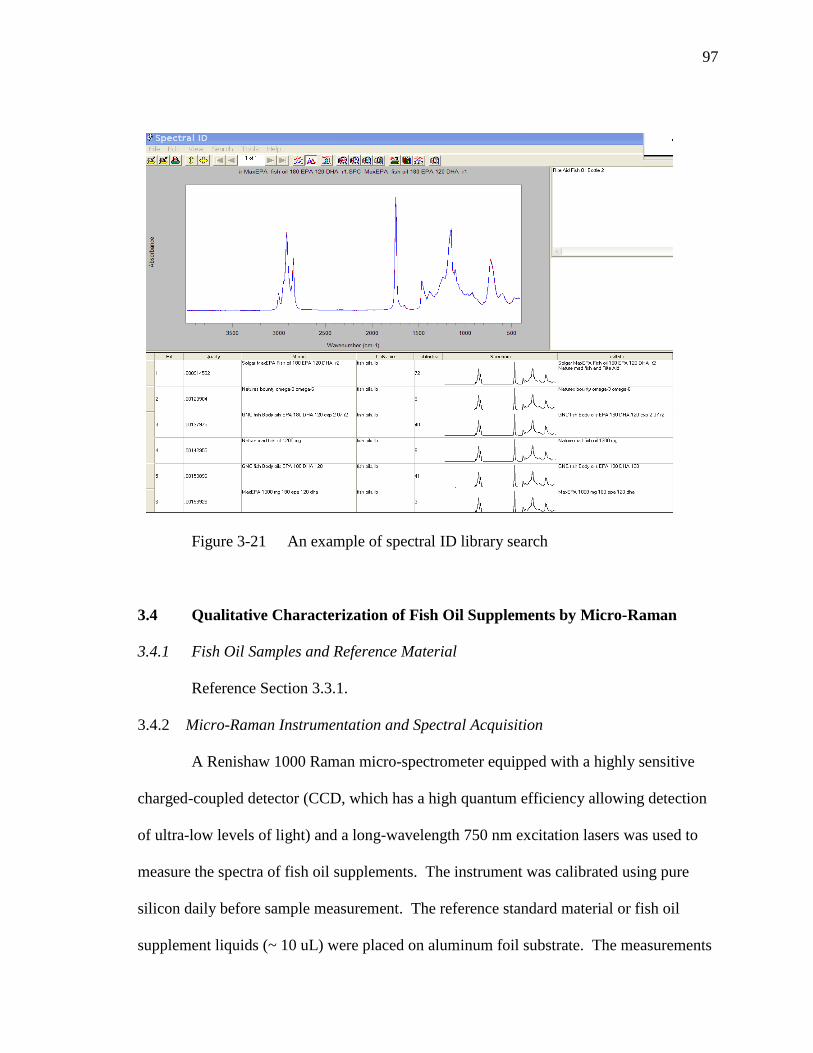
97
Figure 3-21 An example of spectral ID library search
3.4 Qualitative Characterization of Fish Oil Supplements by Micro-Raman
3.4.1 Fish Oil Samples and Reference Material
Reference Section 3.3.1.
3.4.2 Micro-Raman Instrumentation and Spectral Acquisition
A Renishaw 1000 Raman micro-spectrometer equipped with a highly sensitive
charged-coupled detector (CCD, which has a high quantum efficiency allowing detection
of ultra-low levels of light) and a long-wavelength 750 nm excitation lasers was used to
measure the spectra of fish oil supplements. The instrument was calibrated using pure
silicon daily before sample measurement. The reference standard material or fish oil
supplement liquids (~ 10 uL) were placed on aluminum foil substrate. The measurements

98
were taken in the Raman shift range of 1800 - 500 cm-1
. The background was collected
before every sample was measured. The other spectral acquisition parameters are as
follows:
- 50 mm slit width - 50x objective
- 2 mm spot size - 25 mW power
- 20s exposure time - 5 accumulations
3.4.3 Software Assistance
The software BioRad’s KnowItAll version 7.0 (BioRad, Philadelphia, PA) was
used for spectra evaluation and reports. Advanced Chemical Development (ACD) Curve
Manager version 9.0 (Toronto, Ontario, Canada) was used for band assignments and
database building. Camo Unscrambler Version 9.7 (Edison, NJ) was used for
Chemometrics - Principle Components Analysis.
3.4.4 Micro-Raman Spectra Analysis and Discussion
The reference standard ethyl ester of EPA was first applied on glass substrate for
Raman analysis and the signal was totally covered by fluorescence background. The
Raman signal was enhanced when the samples were analyzed on aluminum (Al) substrate.
This may be due to surface enhanced Raman scattering (SERS) affect. In the rest of the
studies, the samples were deposited on Al foil for spectra measurement. Figure 3-22
compares the Raman spectra of ethyl ester of EPA collected on glass and Al slides.
The Raman spectra of four reference standards, triglycerides of EPA and DHA
and ethyl esters of EPA and DHA, are shown in Figure 3-23. The major band assignments
are listed in Table 3-8 (referenced a critical evaluation of Raman spectroscopy for the

99
analysis of lipid by J. Renwick Besttie, etc. 41
). Figure 3-24 shows some example Raman
spectra of fish oil supplements.
Figure 3-22 Raman spectra of ethyl ester of EPA collected on glass and Al slides
Figure 3.22 Raman Spectra of Some Fish Oil Supplements
Figure 3-23 Raman spectra of 4 reference standards
Raman Shift (cm-1)
1900 1800 1700 1600 1500 1400 1300 1200 1100 1000 900 800 700
Ram
an In
tens
ity
-300
-250
-200
-150
-100
-50
0
50
100
150
718.
993
720.
94479
2.50
986
6.02
692
8.48
393
1.08
595
9.71
196
1.66
397
2.72
310
10.4
610
21.5
210
25.4
210
56.6
510
67.0
6
1266
.14
1287
.61
1317
.54
1443
.75
1625
.27
1659
.1
EPA ethyl ester Nu-Chek 4-12-07 on Al foil
EPA triglyceride Nu-Chek 4-12-07 on Al foil
DHA ethyl ester Nu-Chek 4-12-07 on Al foil
DHA triglyceride Nu-Chek 4-12-07 on Al foil

100
Figure 3-24 Examples of Raman spectra of fish oil supplements
Table 3-8 Major Raman Band Assignments of Fish Oils
Approx. Band Positions (cm-1) Assignments
1730 - 1750 -C=O (carbonyl stretching)
1640 - 1665 -C=C- (cis double bond stretching)
1400 - 1500 -C-H (CH2 scissoring bending)
1295 - 1305 -C-H (CH2 twisting bending)
1250 - 1280 =C-H (In-plane CH bending)
1100 - 1135 -C-C (in-phase stretching, all-trans)
1080 - 1110 -C-C (liquid: stretching in gauche)
1060 - 1065 -C-C (out-of-phase stretching, all-trans)
~ 972 =C-H out-of-plane bending
~ 931/866 -C-C/C-O (mixture of stretches)
The Raman spectra of the four reference standards are very similar as shown in
Figure 3-24. The major band positions at Raman shifts 1659 cm-1
, 1444 cm-1
, 1266 cm-1
,
972 cm-1
, 930 cm-1
, and 866 cm-1
are the same for both triglycerides of EPA and DHA
and ethyl esters of EPA and DHA. A small band at ~1110 cm-1
was observed in the
spectra of ethyl esters of EPA and DHA, but not observed in the spectra of triglycerides
Raman Shift (cm-1)
1800 1700 1600 1500 1400 1300 1200 1100 1000 900 800 700 600 500
Ram
an I
nten
sity
100
200
300
400
500
600
wonder labs marine lipid con 180 EPA 120 DHA
winOmeg3 complex ethyl esters 490 EPA 160 DHA
ra Natural Wealth 180 EPA 120 DHA
Olympian Labs superior glyceride omega-3 fish oils liquid
Barleans fresh catch fish oil 180 EPA 120 DHA
PharmAssure Fish Body Oil EPA 240 mg DHA 200 mg

101
of EPA and DHA, and hence, this band may be used as a marker to differentiate the two
chemical forms. However, this band (arrow pointed at ~ 1110 cm-1
) is almost invisible in
the spectra of fish oil samples as shown in Figure 3-24. Even though the reference
standards which are colorless and exhibit good Raman signals, all the fish oil samples
(with yellowish color) exhibit weak Raman signals due to florescence background
(yellow color usually is an indication of florescence absorption). Therefore, there is no
specific Raman band can be easily used to identify the chemical form of the fatty acids in
the fish oil supplements under this study.
Raman is a complementary technique to FTIR. For example, in Raman, the bands
(1658 cm-1
and 1266 cm-1
) related to non-polar functional group C=C are intense whereas
in the FTIR they are weak. The band at ~ 1732 cm-1
related to polar functional group
C=O is very weak in Raman but intense in FTIR. Figure 3-25 shows the comparison of
IR and Raman spectra of ethyl ester of EPA.
Figure 3-25 Comparison of IR and Raman spectra of ethyl ester of EPA
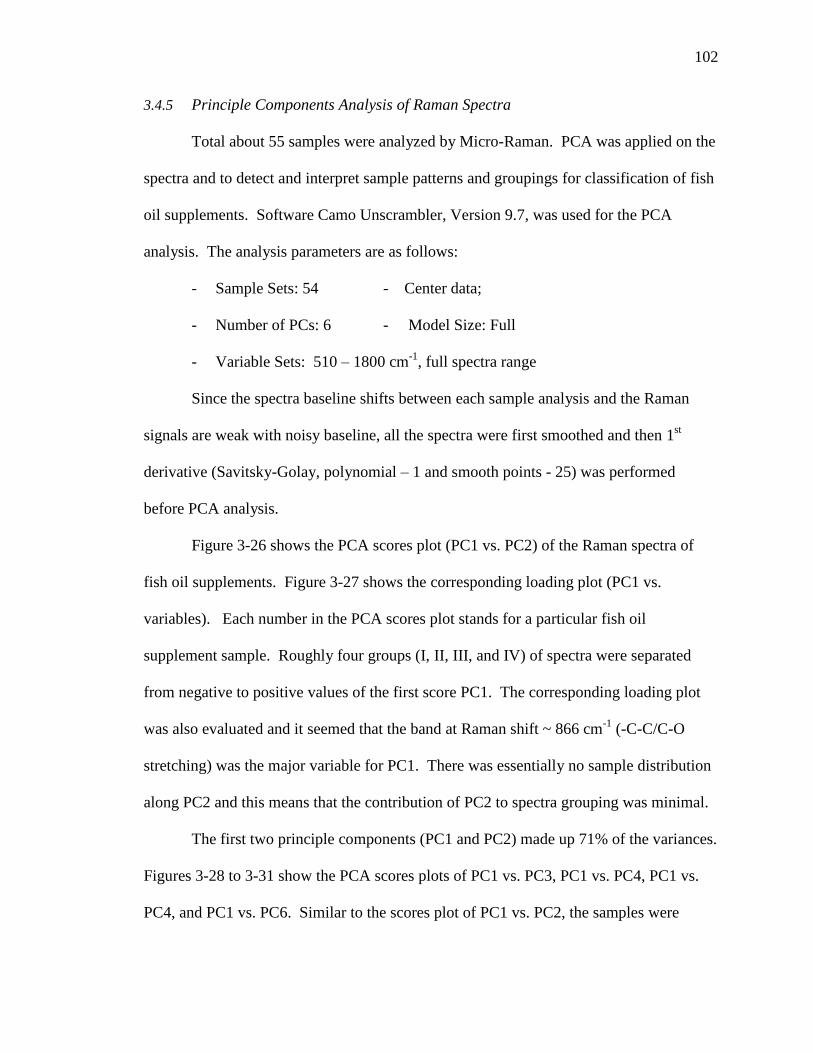
102
3.4.5 Principle Components Analysis of Raman Spectra
Total about 55 samples were analyzed by Micro-Raman. PCA was applied on the
spectra and to detect and interpret sample patterns and groupings for classification of fish
oil supplements. Software Camo Unscrambler, Version 9.7, was used for the PCA
analysis. The analysis parameters are as follows:
- Sample Sets: 54 - Center data;
- Number of PCs: 6 - Model Size: Full
- Variable Sets: 510 – 1800 cm-1
, full spectra range
Since the spectra baseline shifts between each sample analysis and the Raman
signals are weak with noisy baseline, all the spectra were first smoothed and then 1st
derivative (Savitsky-Golay, polynomial – 1 and smooth points - 25) was performed
before PCA analysis.
Figure 3-26 shows the PCA scores plot (PC1 vs. PC2) of the Raman spectra of
fish oil supplements. Figure 3-27 shows the corresponding loading plot (PC1 vs.
variables). Each number in the PCA scores plot stands for a particular fish oil
supplement sample. Roughly four groups (I, II, III, and IV) of spectra were separated
from negative to positive values of the first score PC1. The corresponding loading plot
was also evaluated and it seemed that the band at Raman shift ~ 866 cm-1
(-C-C/C-O
stretching) was the major variable for PC1. There was essentially no sample distribution
along PC2 and this means that the contribution of PC2 to spectra grouping was minimal.
The first two principle components (PC1 and PC2) made up 71% of the variances.
Figures 3-28 to 3-31 show the PCA scores plots of PC1 vs. PC3, PC1 vs. PC4, PC1 vs.
PC4, and PC1 vs. PC6. Similar to the scores plot of PC1 vs. PC2, the samples were

103
meanly grouped along PC1. The contributions from other PCs for the sample grouping
were not obvious.
Figure 3-26 PCA scores plot (PC1 vs. PC2) of Raman spectra
Figure 3-27 PCA loading plot (PC1 vs. variables)

104
Figure 3-28 PCA scores plot (PC1 vs. PC3)
Figure 3-29 PCA scores plot (PC1 vs. PC4)
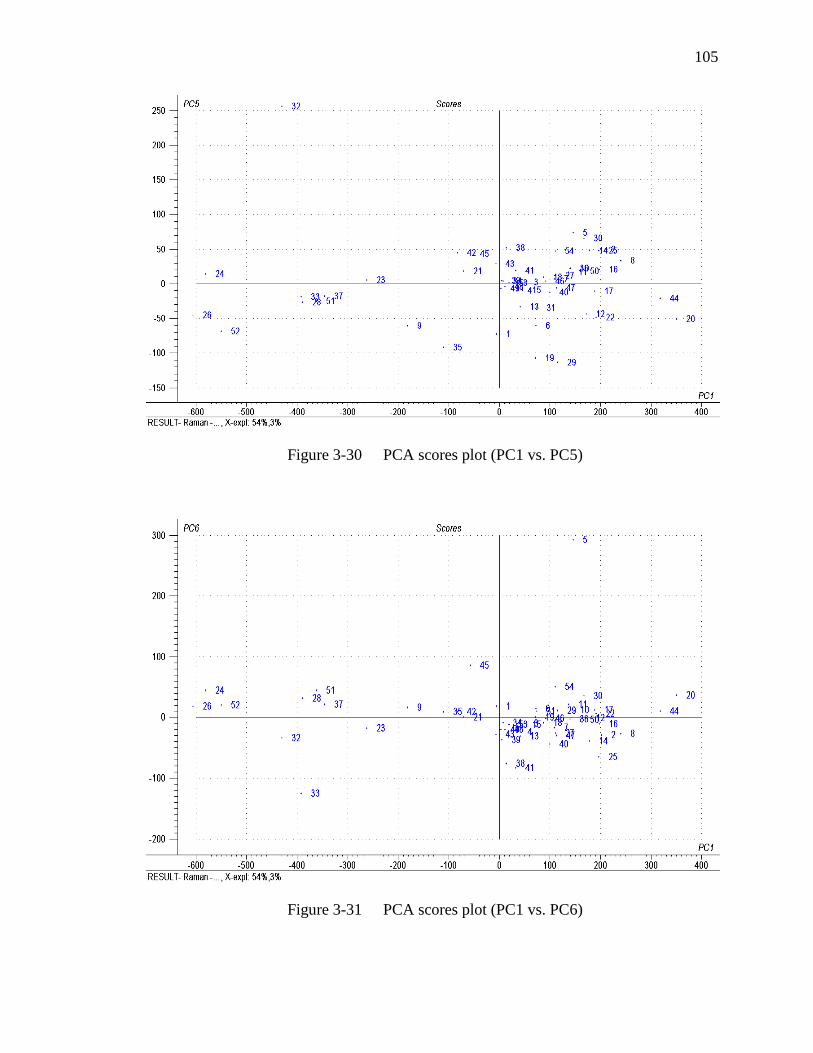
105
Figure 3-30 PCA scores plot (PC1 vs. PC5)
Figure 3-31 PCA scores plot (PC1 vs. PC6)

106
The fish oil supplements clustered in the groups I, II, and III are summarized in
Table 3-9. Basically fish oil supplements containing high concentration of EPA and
DHA in ethyl ester form were in group I, the supplements containing medium to high
concentration of EPA and DHA also in ethyl ester form were in group II, and those
containing high concentration of EPA and DHA in triglyceride form were clustered in
group III.
Majority of the samples were clustered in group IV. Ever though the samples are
quite mixed, generally the products contain natural fish oil that is about 30% of total EPA
and DHA and omega 3, 6, and 9 fatty acids in triglyceride form were clustered in this
group. Fish oil supplements in the group IV are summarized in Table 3-10.
Table 3-9 Fish Oil Supplements in the Group I, II, and III by Raman PCA
Sample # Sample Name Group
24
Nsi Nutracetical Sciences Superior DHA essencial fatty
acids from fish oil
I
ethyl esters,
high EPA and DHA
Concentration 26 Omax 562 EPA 137 DHA
52 WinOmeg3 Complex Ethyl Esters 490 EPA 160 DHA
32 PureGels Omega-3 300-200 II
ethyl esters,
medium to high EPA
and DHA
Concentration
28 PharmAssure Fish Body Oil EPA 240 mg DHA 200 mg
33 Purity Products Ultra Pure Omega-3 325 EPA 250 DHA
37 RxOmega-3 Factors Pharm Grade 400 epa 200 dha cap
51 Walgreens Finest Naturals Extra Strength Fish Oil
42 Source Naturals ArticPure DHA cap III
Tryglycerides, high
EPA and DHA
Concentration
21 Nordic Naturals Ultimate Omega 325
35 Rite Aid Borage-Fish-Flax Oil
45 Stop Aging Now Omega T Formular
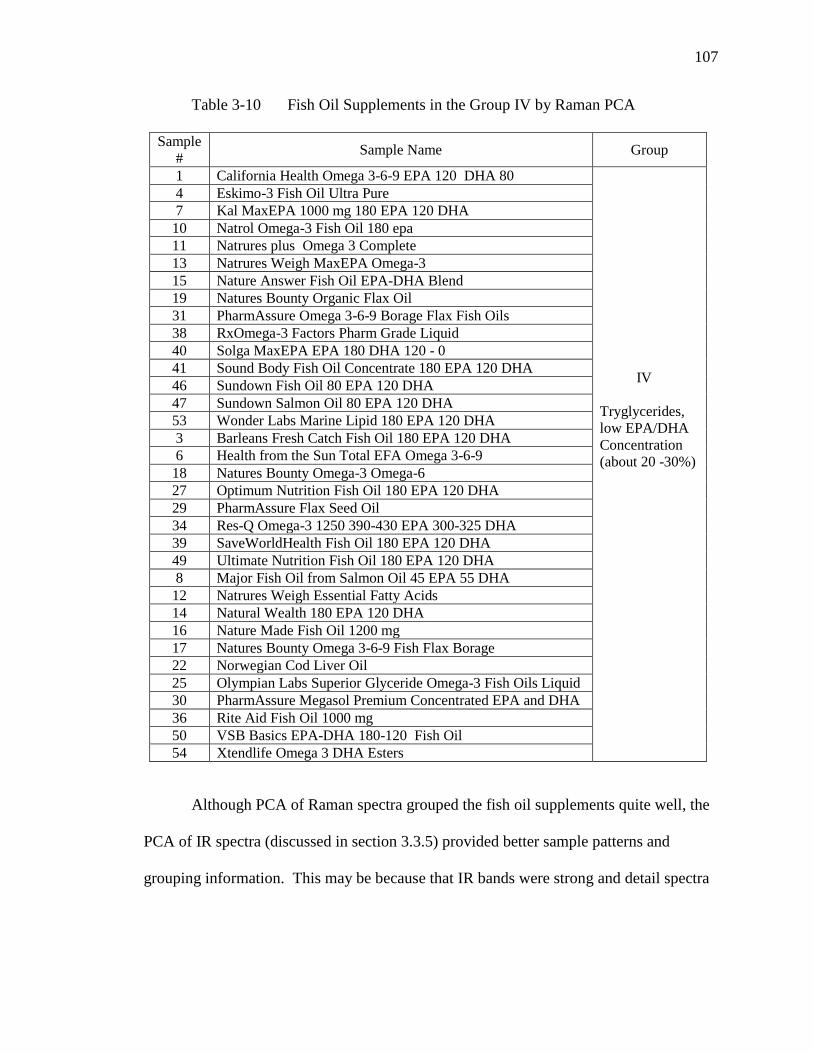
107
Table 3-10 Fish Oil Supplements in the Group IV by Raman PCA
Sample
# Sample Name Group
1 California Health Omega 3-6-9 EPA 120 DHA 80
IV
Tryglycerides,
low EPA/DHA
Concentration
(about 20 -30%)
4 Eskimo-3 Fish Oil Ultra Pure
7 Kal MaxEPA 1000 mg 180 EPA 120 DHA
10 Natrol Omega-3 Fish Oil 180 epa
11 Natrures plus Omega 3 Complete
13 Natrures Weigh MaxEPA Omega-3
15 Nature Answer Fish Oil EPA-DHA Blend
19 Natures Bounty Organic Flax Oil
31 PharmAssure Omega 3-6-9 Borage Flax Fish Oils
38 RxOmega-3 Factors Pharm Grade Liquid
40 Solga MaxEPA EPA 180 DHA 120 - 0
41 Sound Body Fish Oil Concentrate 180 EPA 120 DHA
46 Sundown Fish Oil 80 EPA 120 DHA
47 Sundown Salmon Oil 80 EPA 120 DHA
53 Wonder Labs Marine Lipid 180 EPA 120 DHA
3 Barleans Fresh Catch Fish Oil 180 EPA 120 DHA
6 Health from the Sun Total EFA Omega 3-6-9
18 Natures Bounty Omega-3 Omega-6
27 Optimum Nutrition Fish Oil 180 EPA 120 DHA
29 PharmAssure Flax Seed Oil
34 Res-Q Omega-3 1250 390-430 EPA 300-325 DHA
39 SaveWorldHealth Fish Oil 180 EPA 120 DHA
49 Ultimate Nutrition Fish Oil 180 EPA 120 DHA
8 Major Fish Oil from Salmon Oil 45 EPA 55 DHA
12 Natrures Weigh Essential Fatty Acids
14 Natural Wealth 180 EPA 120 DHA
16 Nature Made Fish Oil 1200 mg
17 Natures Bounty Omega 3-6-9 Fish Flax Borage
22 Norwegian Cod Liver Oil
25 Olympian Labs Superior Glyceride Omega-3 Fish Oils Liquid
30 PharmAssure Megasol Premium Concentrated EPA and DHA
36 Rite Aid Fish Oil 1000 mg
50 VSB Basics EPA-DHA 180-120 Fish Oil
54 Xtendlife Omega 3 DHA Esters
Although PCA of Raman spectra grouped the fish oil supplements quite well, the
PCA of IR spectra (discussed in section 3.3.5) provided better sample patterns and
grouping information. This may be because that IR bands were strong and detail spectra
108
differences were detected by means of PCA, but Raman bands were weak and spectra
differences were not significant enough to generate clearer sample patterns.
3.5 Quantitative Characterization of Fish Oil Supplements by ATR-FTIR
Standard Addition
3.5.1 Principle
Quantitative analysis with any analytical method or instrument requires
calibration to ensure the accuracy of the results. Depending on the analysis being made,
there are various calibration techniques that may be used such as external calibration,
standard addition calibration, and internal standard calibration. External calibration is
most commonly used to compare the response of the unknown to the standard calibration
curve to determine concentration. When matrix effects appear or are to be expected,
standard addition method can be the calibration method of choice. In the study of
environmental and biochemical systems and generally in ultra trace analysis, the standard
addition method is frequently used. Standard addition is performed using the same
amount of unknown make a series of solutions with increasing known amounts of added
analyte into the mixture and associating it with the response. The x-intercept in a plot of
response versus concentration of added analyte gives the concentration of unknown
analyte. To find the x-intercept in equation 3-2, set y to zero:
y = mx + b (3-2)
set y to zero 0 = mx + b, then x = -b/m
Therefore concentration of unknown can be calculated from:
(3-3)

109
One of the goals for my studies was to develop a quantitative analysis method to
determine the total contents of EPA and DHA in fish oil supplements using a rapid non-
destructive technique such as FTIR. As discussed in section 3.3.4, the IR spectra of all
different fatty acid esters found in fish oil supplements are very similar. The C-H
stretching vibrational mode of the cis-alkene H-C=C-H form shows IR absorption at
around 3010 cm-1
, and its peak position and intensity depends on the amount of double
bonds in the fatty acid esters and the position or species (n-3, n-6, or monoene). An early
study31
showed that the alkene band can shift to over 12 cm-1
(from 3000 cm-1
), which is
shifted to 3012 cm-1
. The shift is caused mainly by the concentration increase of EPA
and DHA esters. Therefore, this band can potentially be used as a marker for the
quantitative analysis of EPA and DHA ethyl esters and triglycerides. However, other
bands, for example ~ 3005 cm-1
band from one of the common fish oil components oleic
acid (C18:1), partially overlap with the 3012 cm-1
band of EPA and DHA as shown in
Figure 3-32. This means that it would not be accurate to quantitatively analyze total EPA
and DHA using 3012 cm-1
band with the external standard calibration due to band
interferences. Therefore, the standard addition method should be a superior choice to
analyze the total EPA and DHA using the characteristic IR 3012 cm-1
band.
The quantitative analysis of the fish oil supplements by standard addition was
carried out by weighing known amounts of EPA and DHA ester standards and spiking the
selected weighed samples with increasing concentration of the active ingredients. Then
the IR of the spiked fish oil sample was recorded. The IR absorbance at 3012 cm-1
was
measured manually (with baseline correction at 3040 cm-1
) using BioRad’s KnowItAll
software. After plotting the added concentration (spike) vs absorbance (standard addition

110
curve), the total concentration of EPA and DHA can be obtained where the line crosses
the x axis.
Figure 3-32 Overlay of IR Spectra of ethyl esters of EPA and oleic acid
3.5.2 ATR-FTIR Instrumentation and Spectral Acquisition
A Bruker Equinox 55 FTIR spectrometer fitted with a MIRacleTM
single
reflection horizontal ATR (Pike Technologies, Madison, WI) and equipped with a DTGS
detector was used to acquire the spectra. Twenty micro liters (20 μL) of the sample were
deposited on diamond ATR crystal. One hundred (100) co-added scans were taken at a
resolution of 4 cm-1
between 4000 - 400 cm-1
. The background was collected before
every sample was measured. After each sample analysis, the diamond ATR crystal was
cleaned with acetone. The absorbance was obtained by manually reading using
KnowItAll software.
Wavenumber (cm-1)
3200 3150 3100 3050 3000 2950 2900 2850 2800 2750 2700 2650 2600
abso
rban
ce
0
0.025
0.05
0.075
0.1
0.125
0.15
0.175
0.2
2933.7
8
2963.5
7
3011.9
7
EPA ethyl ester
Oleic acid ethyl ester

111
3.5.3 Materials
Fatty acid esters were purchased from Nu-Chek-Prep. Inc. (Elysian, MN):
Ethyl Myristate, Lot # N-14E-J10-M, Purity >99%
Ethyl Palmitate, Lot # N-16E-S17-R, Purity >99%
Ethyl Oleate, Lot # U-46E-N5-R, Purity >99%
Ethyl EPA, Lot # U-99E-A29-S, Purity >99%
Ethyl DHA, Lot # U-99E-D11-S, Purity >99%
Tri EPA, Lot # T-325-N18-P, Purity >99%
Tri DHA, Lot # T-310-M5-S, Purity >99%
Sample Diluent: Mineral Oil, Lot # PY 02611LY, Aldrich Chemical Company
3.5.4 Fish Oil Samples
Fish oils are characterized by the wide range of fatty acid esters present and
particularly by the highly unsaturated members. Any of the following saturated (C14:0
and C16:0), monoenoic (C16:1, C18:1, C20:1, and C22:1), and polyunsatuared (C20:5
and C22:6) can be major components. Fish oil compositions were studies by GC and 1H
NMR methods and were reported in literature44
. Generally, major fatty acid esters in fish
oils are the esters of myristic acid (C14:0, about 3 – 6 %), Palmitic acid (C16:0, about 15
– 20%), Palmitoleric acid (C16:1, about 5 – 8%), Stearic acid (C18:0, about 3 – 5%),
Oleic acid (C18:1, 18 – 25%), EPA (C20:5, about 5 – 9%), and DHA (C22:6, about 10 –
25%).
According to information above, a simple fish oil dietary supplement sample was
made by blending these constituents in a centrifuge tube listed in the Table 3-11, and this
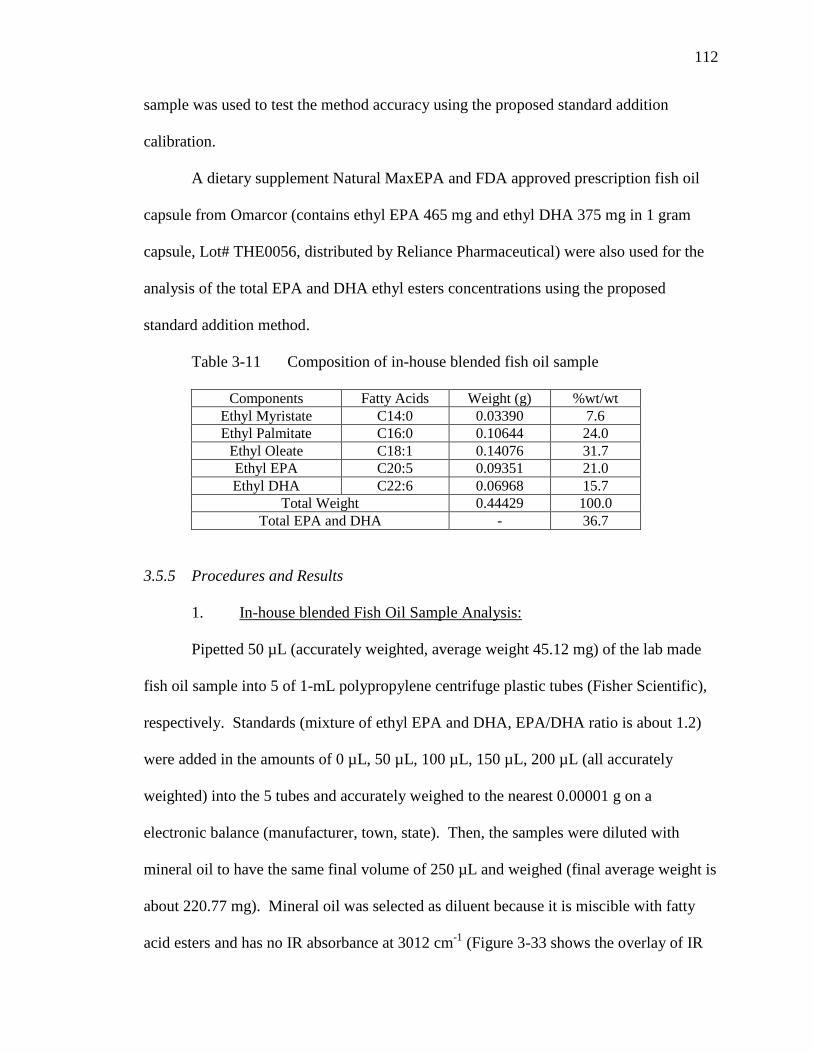
112
sample was used to test the method accuracy using the proposed standard addition
calibration.
A dietary supplement Natural MaxEPA and FDA approved prescription fish oil
capsule from Omarcor (contains ethyl EPA 465 mg and ethyl DHA 375 mg in 1 gram
capsule, Lot# THE0056, distributed by Reliance Pharmaceutical) were also used for the
analysis of the total EPA and DHA ethyl esters concentrations using the proposed
standard addition method.
Table 3-11 Composition of in-house blended fish oil sample
Components Fatty Acids Weight (g) %wt/wt
Ethyl Myristate C14:0 0.03390 7.6
Ethyl Palmitate C16:0 0.10644 24.0
Ethyl Oleate C18:1 0.14076 31.7
Ethyl EPA C20:5 0.09351 21.0
Ethyl DHA C22:6 0.06968 15.7
Total Weight 0.44429 100.0
Total EPA and DHA - 36.7
3.5.5 Procedures and Results
1. In-house blended Fish Oil Sample Analysis:
Pipetted 50 µL (accurately weighted, average weight 45.12 mg) of the lab made
fish oil sample into 5 of 1-mL polypropylene centrifuge plastic tubes (Fisher Scientific),
respectively. Standards (mixture of ethyl EPA and DHA, EPA/DHA ratio is about 1.2)
were added in the amounts of 0 µL, 50 µL, 100 µL, 150 µL, 200 µL (all accurately
weighted) into the 5 tubes and accurately weighed to the nearest 0.00001 g on a
electronic balance (manufacturer, town, state). Then, the samples were diluted with
mineral oil to have the same final volume of 250 µL and weighed (final average weight is
about 220.77 mg). Mineral oil was selected as diluent because it is miscible with fatty
acid esters and has no IR absorbance at 3012 cm-1
(Figure 3-33 shows the overlay of IR

113
spectra of ethyl EPA and mineral oil at ~ 3000 cm-1
region). The mixtures were then
vortex mixed. The detail sample preparations are listed in Table 3-12.
Table 3-12 Details of Standard Addition Sample Preparations
Sample
Preparation
#
In-house made
fish oil sample
EPA and DHA
Standard Mineral Oil Final
µL mg µL mg µL mg µL mg
A 50 45.05 0 0 200 168.15 250 213.20
B 50 44.92 50 46.50 150 126.36 250 217.78
C 50 45.11 100 90.24 100 83.00 250 218.35
D 50 45.52 150 136.59 50 42.23 250 224.34
E 50 44.99 200 185.18 0 0 250 230.17
- - Avg. 45.12 - - - - - Avg. 220.77
3100 3050 3000 2950 2900 2850 2800 2750 2700 2650 2600
0.1
0.12
0.14
0.16
0.18
0.2
2873.4
2
2931.2
72962.1
3
3010.3
4Ethyl EPA
Mineral Oil
Figure 3-33 Overlay of IR spectra of ethyl EPA and mineral oil
The ATR-FTIR spectrum of each sample preparation was obtained using the same
procedures summarized in section 3.5.2. Manually measured the IR absorbance at 3012
cm-1
and 3040 cm-1
(for baseline correction) using the KnowItAll software. The
absorbance results are summarized in Table 3-13. After plotting the added standard
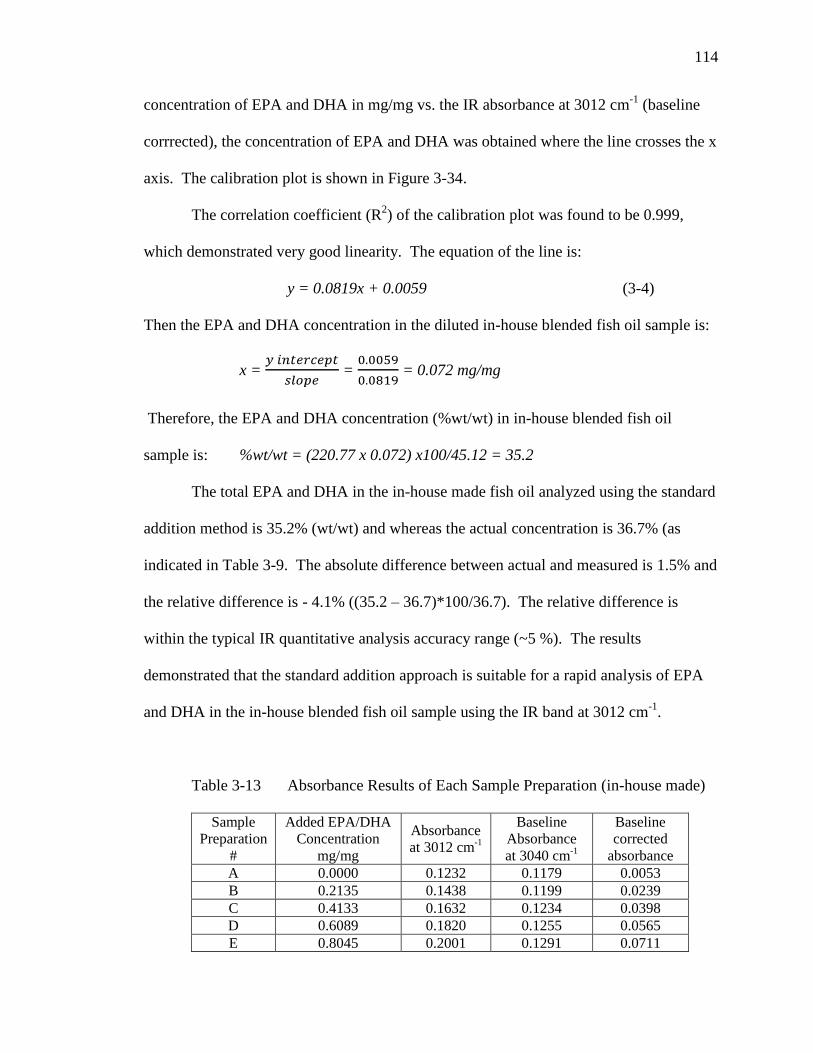
114
concentration of EPA and DHA in mg/mg vs. the IR absorbance at 3012 cm-1
(baseline
corrrected), the concentration of EPA and DHA was obtained where the line crosses the x
axis. The calibration plot is shown in Figure 3-34.
The correlation coefficient (R2) of the calibration plot was found to be 0.999,
which demonstrated very good linearity. The equation of the line is:
y = 0.0819x + 0.0059 (3-4)
Then the EPA and DHA concentration in the diluted in-house blended fish oil sample is:
x = = = 0.072 mg/mg
Therefore, the EPA and DHA concentration (%wt/wt) in in-house blended fish oil
sample is: %wt/wt = (220.77 x 0.072) x100/45.12 = 35.2
The total EPA and DHA in the in-house made fish oil analyzed using the standard
addition method is 35.2% (wt/wt) and whereas the actual concentration is 36.7% (as
indicated in Table 3-9. The absolute difference between actual and measured is 1.5% and
the relative difference is - 4.1% ((35.2 – 36.7)*100/36.7). The relative difference is
within the typical IR quantitative analysis accuracy range (~5 %). The results
demonstrated that the standard addition approach is suitable for a rapid analysis of EPA
and DHA in the in-house blended fish oil sample using the IR band at 3012 cm-1
.
Table 3-13 Absorbance Results of Each Sample Preparation (in-house made)
Sample
Preparation
#
Added EPA/DHA
Concentration
mg/mg
Absorbance
at 3012 cm-1
Baseline
Absorbance
at 3040 cm-1
Baseline
corrected
absorbance
A 0.0000 0.1232 0.1179 0.0053
B 0.2135 0.1438 0.1199 0.0239
C 0.4133 0.1632 0.1234 0.0398
D 0.6089 0.1820 0.1255 0.0565
E 0.8045 0.2001 0.1291 0.0711
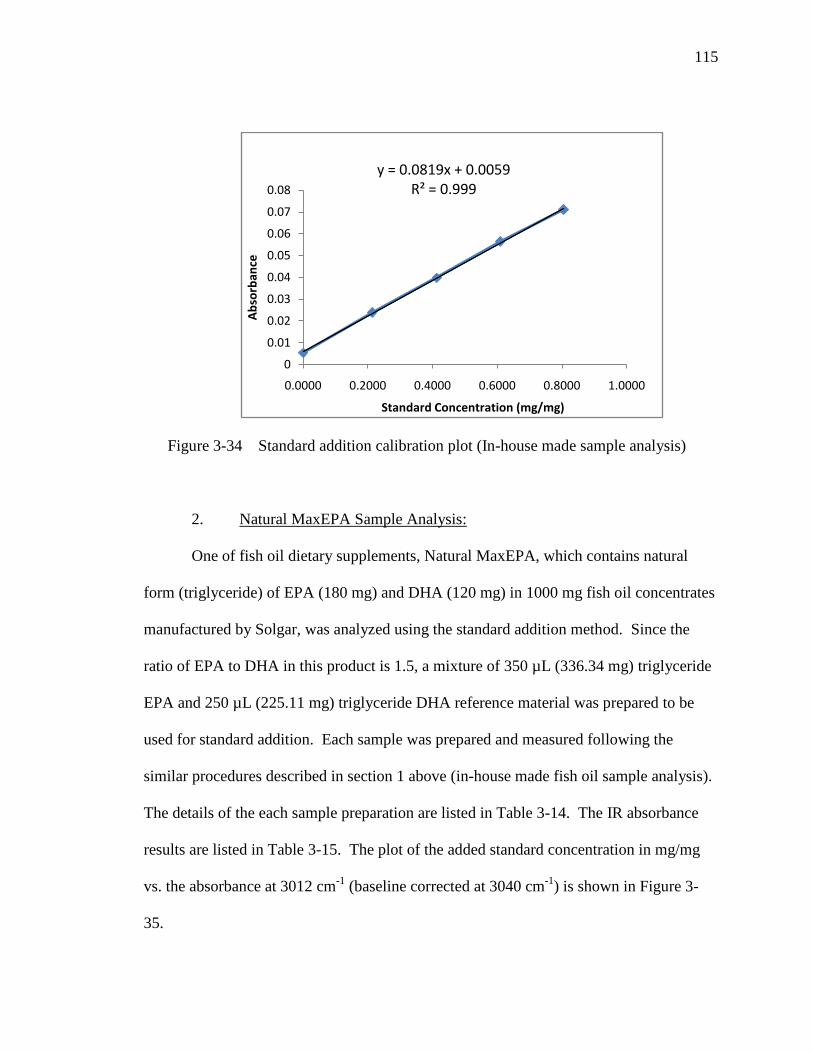
115
Figure 3-34 Standard addition calibration plot (In-house made sample analysis)
2. Natural MaxEPA Sample Analysis:
One of fish oil dietary supplements, Natural MaxEPA, which contains natural
form (triglyceride) of EPA (180 mg) and DHA (120 mg) in 1000 mg fish oil concentrates
manufactured by Solgar, was analyzed using the standard addition method. Since the
ratio of EPA to DHA in this product is 1.5, a mixture of 350 µL (336.34 mg) triglyceride
EPA and 250 µL (225.11 mg) triglyceride DHA reference material was prepared to be
used for standard addition. Each sample was prepared and measured following the
similar procedures described in section 1 above (in-house made fish oil sample analysis).
The details of the each sample preparation are listed in Table 3-14. The IR absorbance
results are listed in Table 3-15. The plot of the added standard concentration in mg/mg
vs. the absorbance at 3012 cm-1
(baseline corrected at 3040 cm-1
) is shown in Figure 3-
35.
y = 0.0819x + 0.0059R² = 0.999
0
0.01
0.02
0.03
0.04
0.05
0.06
0.07
0.08
0.0000 0.2000 0.4000 0.6000 0.8000 1.0000
Ab
sorb
ance
Standard Concentration (mg/mg)

116
The correlation coefficient (R2) of the calibration plot was found to be 0.999,
which also demonstrated very good linearity. The equation of the line is:
y = 0.0878x + 0.0074 (3-5)
Then the EPA and DHA concentration in the diluted Natural MaxEPA sample is:
x = = = 0.084 mg/mg
Therefore, the total EPA and DHA concentration (%wt/wt) in Natural MaxEPA sample
is: %wt/wt = (227.01 x 0.084) x100/45.74 = 41.7
The total EPA and DHA in Natural MaxEPA analyzed using the standard addition
method is 41.7% (wt/wt), and whereas the label claimed concentration 30%, the absolute
difference is 11.7%. The analysis result is much higher than the label claim. This may
be due to either the label claim is not accurate or the standard addition approach is not
accurate for the quantitation of total EPA and DHA in some of the commercial fish oil
supplements when the exact formulation composition is not available for a complete
evaluation of the method.
Table 3-14 Details of Standard Addition Sample Preparations (MaxEPA)
Sample
Preparation
#
Natural
MaxEPA
EPA/DHA
Standard Mineral Oil Final
µL mg µL mg µL mg µL mg
A 50 45.83 0 0 200 170.42 250 216.25
B 50 45.54 50 48.09 150 126.11 250 219.74
C 50 45.79 100 97.32 100 85.49 250 228.60
D 50 45.58 150 143.17 50 44.84 250 233.59
E 50 45.95 200 190.94 0 0 250 236.89
- - Avg. 45.74 - - - - - Avg. 227.01
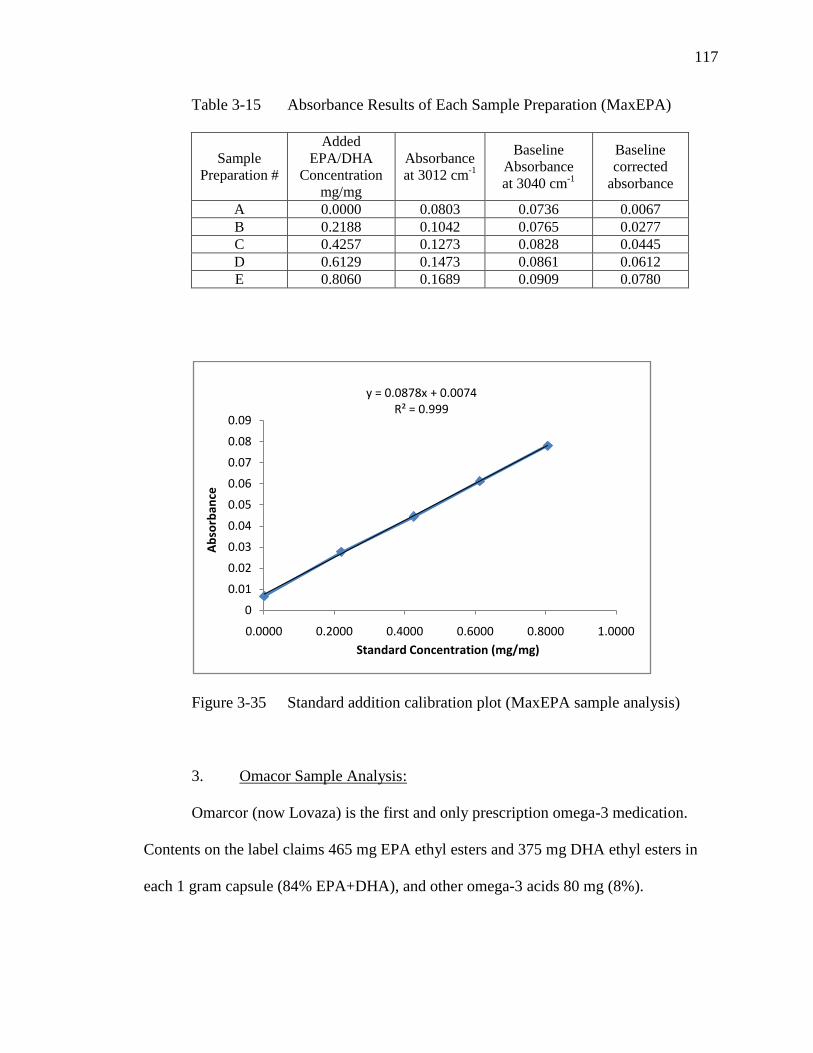
117
Table 3-15 Absorbance Results of Each Sample Preparation (MaxEPA)
Sample
Preparation #
Added
EPA/DHA
Concentration
mg/mg
Absorbance
at 3012 cm-1
Baseline
Absorbance
at 3040 cm-1
Baseline
corrected
absorbance
A 0.0000 0.0803 0.0736 0.0067 B 0.2188 0.1042 0.0765 0.0277 C 0.4257 0.1273 0.0828 0.0445 D 0.6129 0.1473 0.0861 0.0612 E 0.8060 0.1689 0.0909 0.0780
Figure 3-35 Standard addition calibration plot (MaxEPA sample analysis)
3. Omacor Sample Analysis:
Omarcor (now Lovaza) is the first and only prescription omega-3 medication.
Contents on the label claims 465 mg EPA ethyl esters and 375 mg DHA ethyl esters in
each 1 gram capsule (84% EPA+DHA), and other omega-3 acids 80 mg (8%).
y = 0.0878x + 0.0074R² = 0.999
0
0.01
0.02
0.03
0.04
0.05
0.06
0.07
0.08
0.09
0.0000 0.2000 0.4000 0.6000 0.8000 1.0000
Ab
sorb
ance
Standard Concentration (mg/mg)
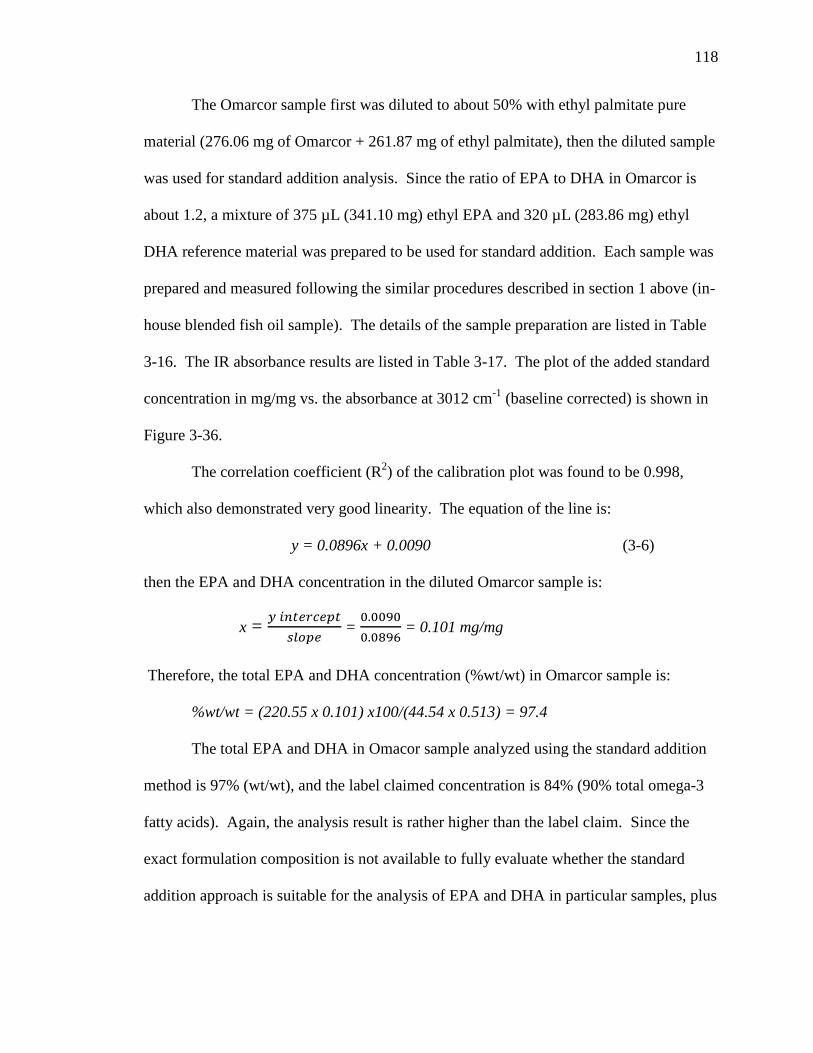
118
The Omarcor sample first was diluted to about 50% with ethyl palmitate pure
material (276.06 mg of Omarcor + 261.87 mg of ethyl palmitate), then the diluted sample
was used for standard addition analysis. Since the ratio of EPA to DHA in Omarcor is
about 1.2, a mixture of 375 µL (341.10 mg) ethyl EPA and 320 µL (283.86 mg) ethyl
DHA reference material was prepared to be used for standard addition. Each sample was
prepared and measured following the similar procedures described in section 1 above (in-
house blended fish oil sample). The details of the sample preparation are listed in Table
3-16. The IR absorbance results are listed in Table 3-17. The plot of the added standard
concentration in mg/mg vs. the absorbance at 3012 cm-1
(baseline corrected) is shown in
Figure 3-36.
The correlation coefficient (R2) of the calibration plot was found to be 0.998,
which also demonstrated very good linearity. The equation of the line is:
y = 0.0896x + 0.0090 (3-6)
then the EPA and DHA concentration in the diluted Omarcor sample is:
x = = = 0.101 mg/mg
Therefore, the total EPA and DHA concentration (%wt/wt) in Omarcor sample is:
%wt/wt = (220.55 x 0.101) x100/(44.54 x 0.513) = 97.4
The total EPA and DHA in Omacor sample analyzed using the standard addition
method is 97% (wt/wt), and the label claimed concentration is 84% (90% total omega-3
fatty acids). Again, the analysis result is rather higher than the label claim. Since the
exact formulation composition is not available to fully evaluate whether the standard
addition approach is suitable for the analysis of EPA and DHA in particular samples, plus
119
the accuracy of the label claim is unknown, it is difficult to understand why the result
calculated from standard addition method is high.
Table 3-16 Details of Standard Addition Sample Preparations (Omarcor)
Sample
Preparation
#
Diluted Omarcor EPA and DHA
Standard Mineral Oil Final
µL mg µL mg µL mg µL mg
A 50 44.33 0 0 200 169.74 250 214.07 B 50 44.33 50 48.59 150 123.04 250 215.96 C 50 45.13 100 91.69 100 83.54 250 220.36 D 50 44.44 150 140.82 50 40.01 250 225.27 E 50 44.48 200 182.60 0 0 250 227.08 - - Avg. 44.54 - - - - - Avg. 220.55
Table 3-17 Absorbance Results of Each Sample Preparation (Omarcor)
Sample
Preparation #
Added EPA
and DHA
Concentration
mg/mg
Absorbance
at 3012 cm-1
Baseline
Absorbance
at 3040 cm-1
Baseline
corrected
absorbance
A 0.0000 0.0966 0.0884 0.0082 B 0.2250 0.1216 0.0916 0.0299 C 0.4161 0.1434 0.0961 0.0472 D 0.6251 0.1650 0.0986 0.0665 E 0.8041 0.1846 0.1048 0.0798
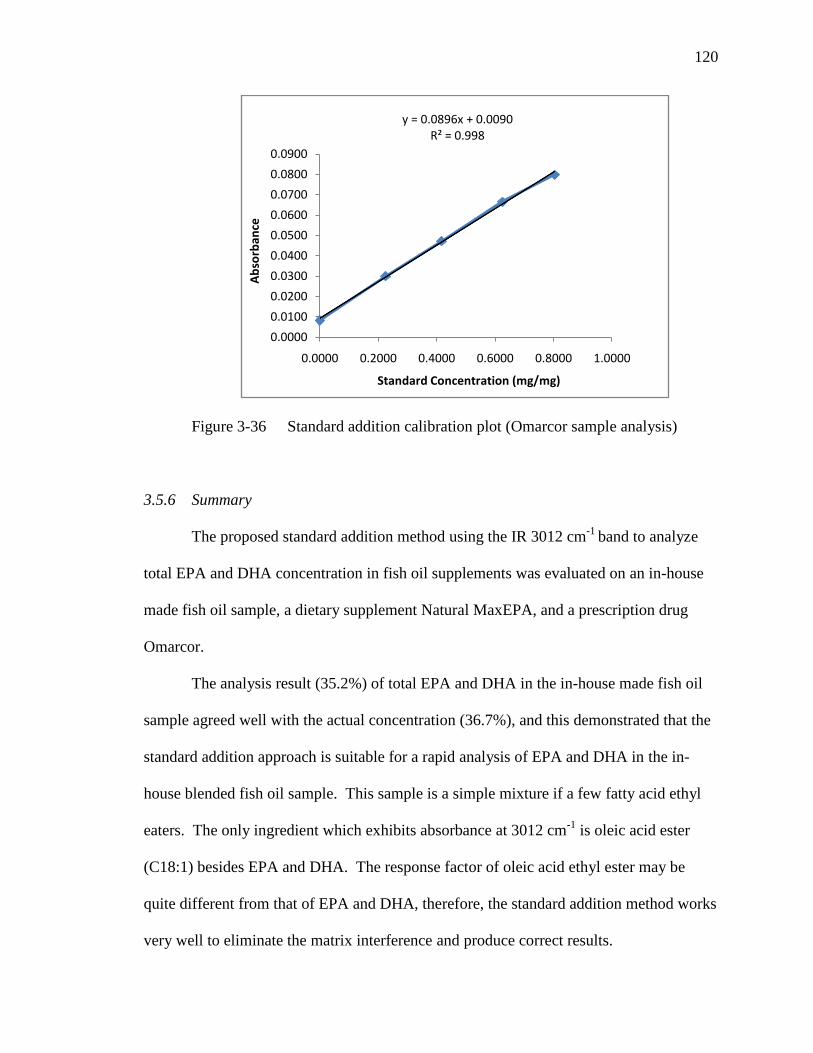
120
Figure 3-36 Standard addition calibration plot (Omarcor sample analysis)
3.5.6 Summary
The proposed standard addition method using the IR 3012 cm-1
band to analyze
total EPA and DHA concentration in fish oil supplements was evaluated on an in-house
made fish oil sample, a dietary supplement Natural MaxEPA, and a prescription drug
Omarcor.
The analysis result (35.2%) of total EPA and DHA in the in-house made fish oil
sample agreed well with the actual concentration (36.7%), and this demonstrated that the
standard addition approach is suitable for a rapid analysis of EPA and DHA in the in-
house blended fish oil sample. This sample is a simple mixture if a few fatty acid ethyl
eaters. The only ingredient which exhibits absorbance at 3012 cm-1
is oleic acid ester
(C18:1) besides EPA and DHA. The response factor of oleic acid ethyl ester may be
quite different from that of EPA and DHA, therefore, the standard addition method works
very well to eliminate the matrix interference and produce correct results.
y = 0.0896x + 0.0090R² = 0.998
0.0000
0.0100
0.0200
0.0300
0.0400
0.0500
0.0600
0.0700
0.0800
0.0900
0.0000 0.2000 0.4000 0.6000 0.8000 1.0000
Ab
sorb
ance
Standard Concentration (mg/mg)

121
However, the analysis result 41.7% of total EPA and DHA concentration in
Natural MaxEPA and 97.4% in Omarcor were much higher than the label claims 30% in
Natural MaxEPA and 84% in Omarcor. Since the exact formulation compositions of
these two products are not available to evaluate whether the standard addition approach is
proper for analyzing EPA and DHA, in addition the accuracy of the label claims is
unknown, it is not easy to fully understand why the results were high. If some of other
ingredients in the formulation have similar response factors to that of EPA and DHA,
then the standard addition method may not be able to correct the matrix effect and
generate accurate results. Typically, a product formulation list should be evaluated for a
quantitative analytical method development.
3.6 Two-Dimensional FTIR Spectral Correlation Analysis of Qmega-3 Fatty
Acids (EPA Esters)
3.6.1 Objective
This study is to evaluate for the first time the temperature-dependent FTIR
spectral characteristics of the active ingredients such as ethyl ester of EPA and
triglyceride EPA in fish oil supplements using two dimensional (2D) IR correlation
analyses.
3.6.2 Materials
Ethyl ester EPA, Lot # U-99E-A29-S, Purity >99%, and triglyceride EPA,
Lot # T-325-N18-P, Purity >99%, were both purchased from Nu-Chek-Prep, Inc.
(Elysian, MN) and used as is without any treatment.

122
3.6.3 Instrumentation and Data Acquisition
A SensIR IlluminATR micro ATR-FTIR spectrometer (Smiths Detection,
Danbury, CT) fitted with a diamond ATR and equipped with a mercury cadmium
telluride (MCT) detector was used to measure the spectra. The spectrometer is attached
to a Rensishaw System 1,000 (Renishaw Inc., Hoffman Estates, IL) micro Raman
spectrometer. Two-hundred co-added scans were taken at a resolution of 4 cm-1
between
4000 - 650 cm-1
using the 100- m slit mask. A background spectrum was collected
before each sample measurement.
An aluminum heating block that was designed and built in-house and controlled
by a digital temperature controller was used for sustaining sample temperature. A
schematic of the temperature-controlled heating stage is shown in Figure 3-31. The
sample liquid (50 uL) was placed on a small indentation in the aluminum block and then
the ATR diamond objective was lowered into the sample to acquire the spectra as shown
in Figure 3-37. The spectra of the samples were collected in the temperature range of 10
- 150⁰C (10⁰C, 20⁰C, 40⁰C, 60⁰C, 80⁰C, 100⁰C, 120⁰C, 140⁰C, 150⁰C, and return to
20⁰C). The sample was kept at the each temperature for about 10 minutes before every
measurement to allow the sample to reach a stable homogenous temperature. The
temperature stability was better than ± 0.2⁰C.

123
Figure 3-37 Spectra measurement of sample placed on the Al heating block
3.6.4 2D Correlation Analysis
As discussed in the section 1.2, generalized 2D correlation can obtain two kinds
of spectra, namely synchronous and asynchronous spectra. The peaks generated on the
diagonal line in synchronous spectra are referred to as autopeaks representing the changes
in intensities of observed spectral bands under the external perturbation. By spreading
peaks along the second dimension, the spectral resolution is enhanced, and seemingly
complicated spectra have often been simplified. The cross peaks which lie in
asynchronous spectra determine the sequential order of intensity changes of bands.
Thermal treatment has been chosen in this study as perturbation to monitor the
infrared behaviors of two essential omega-3 fatty acids EPA and DHA in ethyl ester and
triglyceride forms, and also Omarcor prescription drug product sample. Synchronous and
asynchronous correlation intensities were computed for the FTIR spectra at different
124
temperature by applying the generalized 2D correlation algorithm of Noda42
. Before 2D
calculation, each spectrum was cut off region (chose 800 – 3200 cm-1
), smoothed and
baseline corrected using ACD curve manager software. 2D-IR correlation spectra were
obtained by the treatment of the series of dynamic spectra with 2Dshige (version 1.3)
software, which was developed by Shigeaki Morita in professor Yukihiro Ozaki’s group
at Kwansei-Gakuin University.
As a result of the symmetric and antisymmetric properties of the cross correlation
peaks with respect to the diagonal line in the 2D plots, only peaks below the diagonal are
discussed. Peaks are identifies as (X , Y) cm-1
, where X and Y represent the frequencies
marked on the x- and y-axes, respectively. Throughout this study, red and blue peaks in
the 2D plots denote positive and negative correlation peaks, respectively. According to
the rules proposed by Noda43
, the positive peak in the asynchronous map indicated that
the spectral intensity change at X occurs at a lower temperature than that at Y if the
corresponding synchronous peak at (X, Y) is also positive. On the other hand, if the
synchronous peak at (X, Y) is negative, the spectral intensity change at X occurs at higher
temperature than that at Y. A negative peak in the asynchronous map is interpreted in a
similar manner; i.e., X changes at higher (lower) temperature if the synchronous (X, Y)
peak is positive (negative).
3.6.5 Results and discussion
1). 1D IR spectral analysis of Ethyl Ester and Triglyceride of EPA
Figure 3-38 shows the overlay IR spectra (smoothed and baseline corrected) of
ethyl EPA (a) and triglyceride EPA (b), which were collected at the temperatures of 10⁰
C, 20⁰C, 40⁰C, 60⁰C, 80⁰C, 100⁰C, 120⁰C, 140⁰C, 150⁰C, and return to 20⁰C. By

125
comparing the spectra with eyes, it appears that the intensities of most of bands decreases
with the increasing of temperature, and baseline also became noisier at higher
temperatures. The spectrum of the sample at returned 20⁰ C is similar to that at 150⁰C,
and this indicates that the sample chemical configuration might be altered at high
temperature such as 150⁰C.
The spectra of ethyl EPA and triglyceride EPA at different temperatures were
also analyzed with PCA, and the scores plots are shown in Figure 3-39 (a) and (b),
respectively. The PCA scores plots indicated that the sample spectra at 10⁰C, 20⁰C,
40⁰C, 60⁰C, and 80⁰C were at the similar region of PC1, but the spectra were spread
along PC1 for the samples at 100⁰C and higher temperatures. The PC1 factor of the
spectrum at returned 20⁰C was very different from that of the spectrum at initial 20⁰C,
but similar to that at 150⁰C. This further confirmed that the sample chemical
configuration may change at a higher temperature. The corresponding loading plot
indicated that the C=O band (ester) intensity was possibly the major variable that
contributed to the spectra distribution along the PC1 in PCA scores plots.

126
(a)
(b)
Figure 3-38 FTIR spectra overlay of ethyl EPA (a), and triglyceride EPA (b), at
temperatures ranging from 10⁰C to 150⁰C
cm-1
3200 3000 2800 2600 2400 2200 2000 1800 1600 1400 1200 1000
abso
rban
ce
0
0.02
0.04
0.06
0.08
0.1
0.12
0.14
0.16
0.18ethyl EPA - 140C
ethyl EPA - 120C
ethyl EPA - 100C
ethyl EPA - 80C
ethyl EPA - 60C
ethyl EPA - 40C
ethyl EPA - 20C
ethyl EPA - 20C - return
ethyl EPA - 10C
ethyl EPA - 150C
cm-1
3000 2800 2600 2400 2200 2000 1800 1600 1400 1200 1000
abso
rban
ce
0
0.02
0.04
0.06
0.08
0.1
0.12
0.14
0.16
0.18
Tri EPA - 140C
Tri EPA - 120C
Tri EPA - 100C
Tri EPA - 80C
Tri EPA - 60C
Tri EPA - 40C
Tri EPA - 20C
Tri EPA - 20C - return
Tri EPA - 10C
Tri EPA - 150C

127
(a)
(b)
Figure 3-39 PCA scores plot of ethyl EPA IR spectra (a), and PCA scores plot of
triglyceride EPA IR spectra (b), at different temperatures

128
2). 2D IR Correlation Analysis of Ethyl Ester of EPA
Usually 2D IR correlation is performed on a relatively narrow wavelength ranges
(not full spectrum range such as 4000 to 600 cm-1
) due to software calculation limitation
and 2D map complexity. In this study, 2D IR correlation was examined in the
wavenumber ranges of 3080 - 2760 cm-1
, 1830 - 1620 cm-1
, 1280 - 1135 cm-1
, and 1120 -
850 cm-1
. The 2D IR correlation was not examined in the range of 1500 - 1280 cm-1
due
to the complexity of 2D maps. The 2D spectra represent the coordinated temperature-
dependent spectral intensity variations in this region from 10⁰C to 150⁰C.
3080 - 2760 cm-1
region
Figure 3-40 shows (a) overlay 1D IR spectra of ethyl EPA from 10⁰C to 150⁰C,
(b) 2D FTIR synchronous spectrum, and (c) 2D IR asynchronous spectrum, of ethyl EPA
in the 3080 - 2760 cm-1
.
In the synchronous map (Figure 3-40 (b)), two autopeaks are observed around
3012 cm-1
(due to =C-H cis stretching) and 2965 cm-1
(due to –C-H (CH3) asym.
stretching). This indicates that the intensities of these two bands change with increasing
temperature. There are no autopeaks observed for at 2874 cm-1
(due to –C-H (CH2) sym.
stretching) and 2934 cm-1
(due to –C-H (CH2) asym. stretching), and this indicates that
intensity changes are very minor for these two bands when the temperature increases.
The major cross peak in the synchronous map is at (2965, 3012) cm-1
. The signs of the
cross peaks is positive (red color), indicating that the temperature-induced changes in the
spectral intensities are in the same direction. This result is in agreement with the
observation in Figure 3-34 (a) that the intensities of these IR bands decrease with
increasing temperature.

129
A number of cross peaks are observed in the asynchronous spectrum as shown in
Figure 3-40 (c). Since the major cross peak at (2964, 3012) cm-1
is positive in the
asynchronous map, and is also positive in the synchronous map, the band intensity
changes (decreases) at 2964 cm-1
occur faster than that at 3012 cm-1
with increasing
temperature.
(a)
(b) (c)
Figure 3-40 1D IR (a), 2D IR Synchronous (b), and 2D IR Asynchronous (c),
spectra of ethyl EPA in 3080 - 2760 cm-1
region
cm-1
3075 3050 3025 3000 2975 2950 2925 2900 2875 2850 2825 2800 2775
abso
rban
ce
0
0.01
0.02
0.03
0.04
0.05
0.06ethyl EPA - 140C
ethyl EPA - 120C
ethyl EPA - 100C
ethyl EPA - 80C
ethyl EPA - 60C
ethyl EPA - 40C
ethyl EPA - 20C
ethyl EPA - 10C
ethyl EPA - 150C

130
1830 - 1620 cm-1
region
Figure 3-41 shows (a) overlay 1D IR spectra of ethyl EPA from 10⁰C to 150⁰C,
(b) 2D FTIR synchronous spectrum, and (c) 2D IR asynchronous spectrum, of ethyl EPA
in the 1830 - 1620 cm-1
region.
In the synchronous map (Figure 3-41 (b)), two autopeaks (along the diagonal)
centered at 1735 cm-1
(due to C=O ester stretching) and 1716 cm-1
(due to C=O acid
stretching) are observed, indicating that the relative intensities of these two bands change
with increasing temperature. There was no autopeak observed at 1650 cm-1
(due C=C cis
stretching), and this indicates that the band intensity change of this band is minor when
the temperature increases. The major cross peak observed in the synchronous spectrum is
at (1716, 1735) cm-1
. The sign of the cross peak is negative (blue color), indicating that
the temperature-induced changes in the spectral intensities of the two bands are in
opposite direction. This result is in agreement with the observation in Figure 3-41 (a)
which shows that the intensity of band at 1735 cm-1
decreases and intensity of the band
around 1716 cm-1
increases with increasing temperature. In addition, one minor cross
peak is observed in the synchronous map at (1735, 1751) cm-1
, and the sign is negative,
which means the intensity of the band at 1735 cm-1
decreases while the intensity of the
band around 1751 cm-1
increases with increasing temperature.
The intensity increasing of bands at ~ 1716 cm-1
and ~ 1750 cm-1
, and decreasing
of band at 1735 cm-1
indicate that the C=O (ester stretching) band gets broaden and less
intense when the temperature increases. Unusually strong temperature broadening of the
C=O band is interpreted to be caused by thermal population of a very flexible excited
conformational configuration. The hypothesis is that at high temperature there is a wider
131
distribution of conformations that will produce a broadening of both these spectral
marker bands. As temperature decreases, the functional group relaxes to lower energy
states, and the band should narrow.
A strong cross peak observed in the asynchronous 2D correlation map (Figure 3-
41 (c)) is at (1716, 1735) cm-1
, and it is positive. Since this peak is negative in the
synchronous map, the band intensity changes (decrease) at 1735 cm-1
occur faster than
the band intensity increase at 1716 cm-1
with increasing temperature. The band around
1716 cm-1
is a typical free fatty acid (FFA) C=O band. FFA are common fatty acid ester
hydrolysis products in crude oils and are formed to some extent in refined oils as a results
of oxidation or degradation during oil refining processes mostly at high temperatures. In
this study, the increase of band intensity at 1716 cm-1
with temperature may be an
indication of a small increase in the amount of free fatty acid at high temperatures due to
oxidation. Figure 3-42 shows the overlap spectra of ethyl EPA at 20⁰C and 20⁰C - return
(return to 20⁰C after ethyl EPA was heated to 150 ⁰C). The C=O band is more broaden
and band intensity is higher around 1705 cm-1
to 1720 cm-1
at 20⁰C – return, and this
confirmed that the increase of band intensity at 1716 cm-1
with temperature is not only a
temperature effect, but also due to chemical structure change (a small increase in the
amount of free fatty acid at high temperatures due to oxidation). Owing to the overlap of
this band with the very strong ester carbonyl absorption at 1735 cm-1
, there is no
resolution between these two bands in 1D IR spectral. However, it is very clear that 2D
correlation spreads these two bands over two dimensions and thus enhances the band
resolution.

132
(a)
(b) (c)
Figure 3-41 1D IR (a), 2D IR Synchronous (b), and 2D IR Asynchronous (c),
spectra of ethyl EPA in 1830 - 1620 cm-1
region
cm-1
1820 1800 1780 1760 1740 1720 1700 1680 1660 1640 1620
abso
rban
ce
0
0.025
0.05
0.075
0.1
0.125
0.15
0.175ethyl EPA - 140C
ethyl EPA - 120C
ethyl EPA - 100C
ethyl EPA - 80C
ethyl EPA - 60C
ethyl EPA - 40C
ethyl EPA - 20C
ethyl EPA - 10C
ethyl EPA - 150C

133
Figure 3-42 Overlap spectra of ethyl EPA at 20⁰C and 20⁰C - return
1120 - 850 cm-1
region
Figure 3-43 shows (a) overlay 1D IR spectra of ethyl EPA from 10⁰C to 150⁰C,
(b) 2D FTIR synchronous spectrum, and (c) 2D IR asynchronous spectrum, of ethyl EPA
in 1120 - 850 cm-1
region.
In the synchronous map (Figure 3-43(b)), three autopeaks (along the diagonal)
centered at 1033 cm-1
(due to C-O stretching), 919 cm-1
(due to =C-H cis out of plane
bending), and 866 cm-1
are observed, indicating that the relative intensities of these three
bands change with increasing temperature. There were no autopeaks observed at ~ 975
cm-1
(due =C-H trans out of plane bending) and 1096 cm-1
(due to C-O stretching), and
this indicates that intensity changes of these bands were minor with increasing
temperature. There are three positive cross peaks observed in the synchronous spectrum
at (919, 1033) cm-1
, (866, 1033) cm-1
, and (866, 919) cm-1
, indicating that the
temperature-induced changes in the spectral intensities of the three bands at 1033 cm-1
,
cm-1
1820 1800 1780 1760 1740 1720 1700 1680 1660 1640 1620
abso
rban
ce
0
0.02
0.04
0.06
0.08
0.1
0.12
0.14
0.16
0.18ethyl EPA - 20C - return
ethyl EPA - 20C

134
919 cm-1
, and 866 cm-1
are in the same direction (decreasing). The results are in
agreement with the observation in Figure 3-43 (a) that the intensity of these bands
decreases with the increasing temperature. In addition, there is one negative cross peaks
observed at (919, 975) cm-1
, indicating the intensity of the band at 919 cm-1
decreases
while the intensity of the band at 975 cm-1
increases with increasing temperature. In fact
at high temperature, a small percentage of cis C=C bond could change to trans
configuration, so the band intensity at ~ 975 cm-1
, which is due to =C-H trans out of
plane bending, were observed increasing.
In the asynchronous map (Figure 3-43(c)), two positive cross peaks were
observed at (975, 1033) cm-1
and (866, 919) cm-1
. Since the peak (975, 1033) cm-1
is
negative and the peak (866, 919) cm-1
is positive in synchronous map, the band intensity
changes (decrease) at 1033 cm-1
occur faster than the band intensity increase at 975 cm-1
and the band intensity changes at 866 cm-1
occur faster than that at 919 cm-1
with the
increasing of temperature. There were four major negative cross peaks observed at (919,
1033) cm-1
, (919, 975) cm-1
, (866, 1033) cm-1
, and (866, 975) cm-1
, combined with the
existence of the positive or negative of the same peak at synchronous map, these results
indicate that the change at 1033 cm-1
occurs prior to that of 919 cm-1
and 866 cm
-1, the
change at 919 cm-1
occurs prior to that of 975 cm-1
, and the change at 866 cm-1
occurs
prior to that of 975 cm-1
. Therefore, the overall sequence of intensity change in
ascending order of temperature as follows: 1033 cm-1
> 866 cm-1
> 919 cm-1
> 975 cm-1
.

135
(a)
(b) (c)
Figure 3-43 1D IR (a), 2D IR Synchronous (b), and 2D IR Asynchronous (c),
spectra of ethyl EPA in 1120 - 850 cm-1
region
1280 - 1135 cm-1
region
Figure 3-44 shows (a) overlay 1D IR spectra of ethyl EPA from 10⁰C to 150⁰C,
(b) 2D FTIR synchronous spectrum, and (c) 2D IR asynchronous spectrum, of ethyl EPA
in 1280 - 1135 cm-1
region.
cm-1
1120 1100 1080 1060 1040 1020 1000 980 960 940 920 900 880 860
abso
rban
ce
0
0.01
0.02
0.03
0.04
0.05
ethyl EPA - 140C
ethyl EPA - 120C
ethyl EPA - 100C
ethyl EPA - 80C
ethyl EPA - 60C
ethyl EPA - 40C
ethyl EPA - 20C
ethyl EPA - 10C
ethyl EPA - 150C

136
In the synchronous map (Figure 3-44 (b)), four autopeaks at 1152 cm-1
(due to C-
O stretching), 1178 cm-1
(due to C-O stretching, -CH2- bending), 1240 (-CH2- bending),
and 1265 cm-1
are observed, indicating that the relative intensities of these bands change
with increasing temperature. There is one positive cross peak observed at (1152, 1178)
cm-1
, indicating that the temperature-induced changes in the spectral intensities of the
bands at 1152 cm-1
and 1178 cm-1
are in the same direction (decreasing). There are four
negative cross peaks observed at (1178, 1240) cm-1
, (1152, 1240) cm-1
, (1178, 1265) cm-
1, and (1152, 1265) cm
-1, indicating the intensity of each pair of bands change in opposite
direction with increasing temperature. The band intensity decreases at 1152 cm-1
and
1178 cm-1
while it increases at 1240 cm-1
and 1265 cm-1
. This also indicated that bands
1152 cm-1
and 1178 cm-1
may be from the same origin such as C-O stretching and 1240
cm-1
and 1265 cm-1
are from other origin such as –CH2- bending.
In the asynchronous map (Figure 3-44 (c)), two positive cross peaks were
observed at (1152, 1240) cm-1
and (1178, 1240) cm-1
. Since the peaks are negative in
synchronous map, the band changes (increase) at 1240 cm-1
occur faster than the band
intensity decrease at 1152 cm-1
and 1178 cm-1
. There is a major negative cross peaks at
(1152, 1178) cm-1
, combined with the existence of the positive peak at synchronous map,
the result indicates that the change at 1178 cm-1
occurs prior to that of 1152 cm-1
.
Therefore, the overall sequence of intensity change in ascending order of temperature is
as follows: 1240 cm-1
> 1178 cm-1
> 1152 cm-1
.
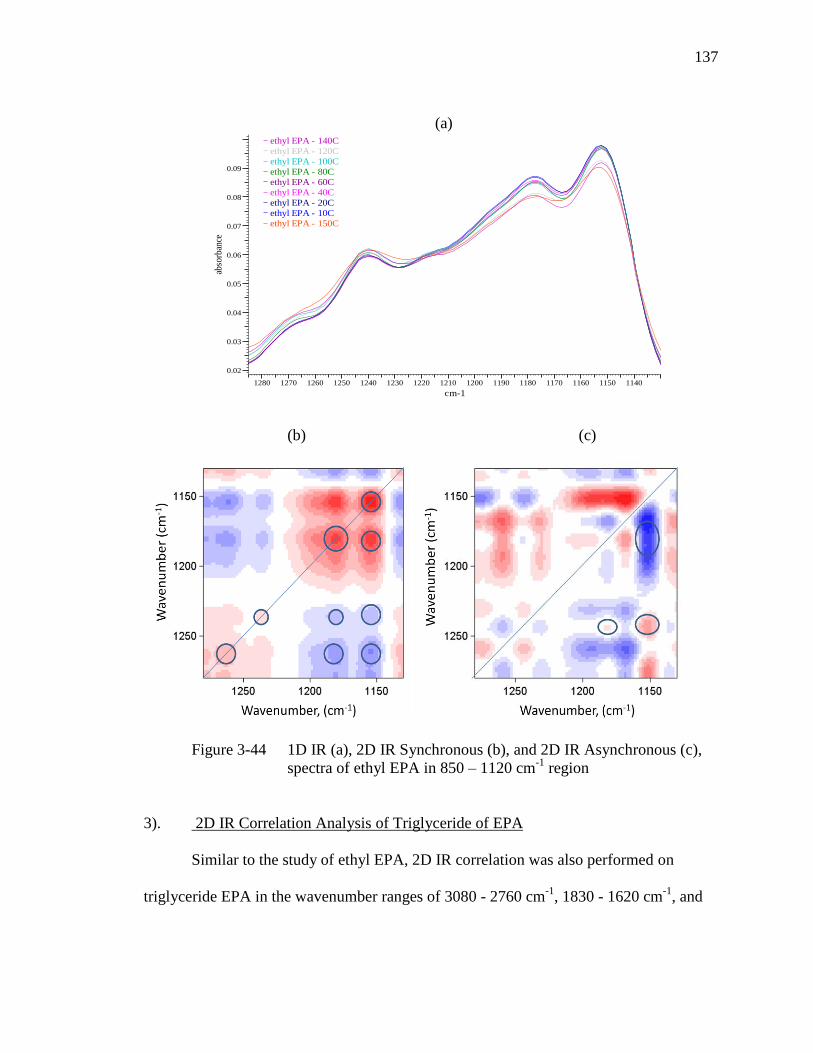
137
(a)
(b) (c)
Figure 3-44 1D IR (a), 2D IR Synchronous (b), and 2D IR Asynchronous (c),
spectra of ethyl EPA in 850 – 1120 cm-1
region
3). 2D IR Correlation Analysis of Triglyceride of EPA
Similar to the study of ethyl EPA, 2D IR correlation was also performed on
triglyceride EPA in the wavenumber ranges of 3080 - 2760 cm-1
, 1830 - 1620 cm-1
, and
cm-1
1280 1270 1260 1250 1240 1230 1220 1210 1200 1190 1180 1170 1160 1150 1140
abso
rban
ce
0.02
0.03
0.04
0.05
0.06
0.07
0.08
0.09
ethyl EPA - 140C
ethyl EPA - 120C
ethyl EPA - 100C
ethyl EPA - 80C
ethyl EPA - 60C
ethyl EPA - 40C
ethyl EPA - 20C
ethyl EPA - 10C
ethyl EPA - 150C
138
1280 – 840 cm-1
. The 2D spectra represent the coordinated temperature-dependent
spectral intensity variations in this region from 10⁰C to 150⁰C.
3080 - 2760 cm-1
region
Figure 3-45 shows (a) overlay 1D IR spectra of triglyceride EPA from 10⁰C to
150⁰C, (b) 2D FTIR synchronous spectrum, and (c) 2D IR asynchronous spectrum, of
triglyceride EPA in the 3080 - 2760 cm-1
region.
In the synchronous map (Figure 3-45 (b)), two autopeaks are observed around
3012 cm-1
(due to =C-H cis stretching) and 2964 cm-1
(due to –C-H (CH3) asym.
stretching). This indicated that the intensities of these two bands changed with ascending
temperature. There were no autopeaks observed for bands 2874 cm-1
(due to –C-H (CH2)
sym. stretching) and 2934 cm-1
(due to –C-H (CH2) asym. stretching), indicating that
there were no or very minor band intensity changes for these two bands. A major
positive cross peak is at (2964, 3012) cm-1
and minor positive one is at (2934, 3012) cm-1
,
indicating that the temperature-induced changes in the spectral intensities are all in the
same direction. The intensities of these IR bands decrease with increasing temperature.
Two positive cross peaks were observed in the asynchronous map (Figure 3-45
(c)) at (2964, 3012) cm-1
and (2934, 3012) cm-1
and since this peak is also positive in the
synchronous map, the band intensity changes (decrease) at 2964 cm-1
and 2934 cm-1
occur
faster than that at 3012 cm-1
with increasing temperature.

139
(a)
(b) (c)
Figure 3-45 1D IR (a), 2D IR Synchronous (b), and 2D IR Asynchronous (c)
spectra of triglyceride EPA in 3080 - 2760 cm-1
region
1830 - 1620 cm-1
region
Figure 3-46 shows (a) overlay 1D IR spectra of triglyceride EPA from 10⁰C to
150⁰C, (b) 2D IR synchronous spectrum, and (c) 2D IR asynchronous spectrum, of
triglyceride EPA in the 1830 - 1620 cm-1
region.
cm-1
3075 3050 3025 3000 2975 2950 2925 2900 2875 2850 2825 2800 2775
abso
rban
ce
0
0.01
0.02
0.03
0.04
0.05
0.06
Triglyceride EPA - 140C
Triglyceride EPA - 120C
Triglyceride EPA - 100C
Triglyceride EPA - 80C
Triglyceride EPA - 60C
Triglyceride EPA - 40C
Triglyceride EPA - 20C
Triglyceride EPA - 10C
Triglyceride EPA - 150C

140
In the synchronous map (Figure 3-46 (b)), two autopeaks centered at 1742 cm-1
(due to C=O ester stretching) and 1716 cm-1
(due to C=O acid stretching) are observed,
indicating that the relative intensities of these two bands change with increasing of
temperature. There was no autopeak observed at 1650 cm-1
(due C=C cis stretching), and
this indicated that band intensity change of this band was insignificant. A major negative
cross peak observed in the synchronous spectrum is at (1716, 1742) cm-1
, indicating that
the temperature-induced changes in the spectral intensities of these two bands are in
opposite direction. This result is in agreement with the observation in Figure 3-46 (a)
which shows that the intensity of the band at1742 cm-1
decreases whiles the intensity of
the band around 1716 cm-1
increases with increasing temperature. In addition, there are a
number of minor cross peaks observed in the synchronous map. Two positive peaks at
(1690, 1716) cm-1
and (1716, 1775) cm-1
, and the other one is negative at (1690, 1742)
cm-1
which shows the intensity of the band at1742 cm-1
decreases while the intensities of
the band around 1690 cm-1
, 1716 cm-1
and 1775 cm
-1 increase with the increasing of
temperature. The intensity increasing of these bands indicates that the C=O ester band
gets broaden and less intense when the temperature increases. Again, this may be due to
a wider distribution of conformations that will produce a broadening of both these
spectral marker bands at high temperature.
A strong positive cross peak observed in the asynchronous 2D correlation map
(Figure 3-46 (c)) is at (1716, 1742) cm-1
. Since this peak is negative in the synchronous
map, the band intensity decreases at 1742 cm-1
occur faster than the band intensity
increases at 1716 cm-1
with increasing temperature. As discussed in early section for
ethyl EPA, the band around 1716 cm-1
is a typical free fatty acid (FFA) C=O band. The

141
band intensity increasing at 1716 cm-1
may be an indication of a increasing of a small
amount of free fatty acid at high temperature due to oxidation. Owing to the overlap of
this band with the very strong ester carbonyl absorption at 1742 cm-1
, there is no
resolution between these two bands in 1D IR spectral. However, it is clear that 2D
correlation enhances the band resolution.
(a)
(b) (c)
Figure 3-46 1D IR (a), 2D IR Synchronous (b), and 2D IR Asynchronous (c),
spectra of triglyceride EPA in 1830 - 1620 cm-1
region
cm-1
1820 1800 1780 1760 1740 1720 1700 1680 1660 1640 1620
abso
rban
ce
0
0.02
0.04
0.06
0.08
0.1
0.12
0.14
0.16
0.18Triglyceride EPA - 140C
Triglyceride EPA - 120C
Triglyceride EPA - 100C
Triglyceride EPA - 80C
Triglyceride EPA - 60C
Triglyceride EPA - 40C
Triglyceride EPA - 20C
Triglyceride EPA - 10C
Triglyceride EPA - 150C

142
1280 - 840 cm-1
region
Figure 3-47 shows (a) overlay 1D IR spectra of triglyceride EPA from 10⁰C to
150⁰C, (b) 2D FTIR synchronous spectrum, and (c) 2D IR asynchronous spectrum, of
triglyceride EPA in the 1280 - 840 cm-1
region.
In the synchronous map (Figure 3-47 (b)), four autopeaks at 919 cm-1
(due to =C-
H cis out of plane bending), 975 cm-1
(due to =C-H trans out of plane bending),1115 cm-1
(not a band, at valley) and 1143 cm-1
(due to C-O stretching) are observed, indicating that
the relative intensity changes of these bands with increasing temperature. There is a
positive cross peaks observed in the synchronous spectrum at (919, 1143) cm-1
,
indicating that the temperature-induced changes in the spectral intensities of the bands at
1143 cm-1
and 919 cm-1
are in the same direction (decreasing). There are negative cross
peaks observed at (975, 1143) cm-1
and (919, 975) cm
-1, indicating the intensity of the
band at 975 cm-1
increases while the intensity of the band at 919 cm-1
and 1143 cm-1
increases with increasing temperature. At high temperature, a small percentage of cis
C=C bond might change to trans configuration, so the band intensity at ~ 975 cm-1
(due
to =C-H trans out of plane bending) was observed increasing.
In the asynchronous map (Figure 3-47 (c)), two major negative cross peaks were
observed at (919, 975) cm-1
and (919, 1143) cm-1
. Combined with the negative/positive
peaks in synchronous map, the band intensity decreases at 1143 cm-1
occur faster than the
band intensity decrease at 919 cm-1
, and band intensity decrease at 919 cm-1
occur faster
than the band intensity increase at 975 cm-1
. There is a positive cross peak observed at
(975, 1143) cm-1
, together with the negative peak in synchronous map, this indicates that
band intensity decreases at 1143 cm-1
occur faster than the band intensity increase at 975

143
cm-1. Therefore, the overall sequence of intensity change in ascending order of
temperature is as follows: 1143 cm-1
> 919 cm-1
> 975 cm-1
.
(a)
(b) (c)
Figure 3-47 1D IR (a), 2D IR Synchronous (b), and 2D IR Asynchronous (c)
spectra of triglyceride EPA in 1280 - 840 cm-1
region
4). Summary of 2D IR Correlation Analysis
The results of 2D correlation analysis for ethyl EPA and triglyceride EPA are
very similar. Generally, for the bands at 3012 cm-1
(=C-H cis stretching), 2964 cm-1
(–C-
H (CH3) asym. stretching), 1735 - 1742 cm-1
(C=O ester stretching), 1178 cm-1
(C-O
cm-1
1250 1200 1150 1100 1050 1000 950 900 850
abso
rban
ce
0
0.02
0.04
0.06
0.08
0.1
0.12
0.14
0.16Triglyceride EPA - 140C
Triglyceride EPA - 120C
Triglyceride EPA - 100C
Triglyceride EPA - 80C
Triglyceride EPA - 60C
Triglyceride EPA - 40C
Triglyceride EPA - 20C
Triglyceride EPA - 10C
Triglyceride EPA - 150C

144
stretching), 1152 cm-1
(C-O stretching), 1143 cm-1
(C-O stretching), and 919 cm-1
(=C-H
cis out of plane bending), the band intensities decrease with the ascending of temperature.
For the bands at ~1716 cm-1
(C=O acid stretching) and ~ 975 cm-1
(=C-H trans
stretching), the intensities increase with increasing temperature. The band intensity
increasing at 1716 cm-1
may be an indication of a increasing of small amount of free fatty
acid at high temperature due to oxidation, and band intensity increasing at 975 cm-1
may
be due to cis C=C bond convert to trans configuration at high temperature. Two
dimensional IR correlation clearly shows better resolution separating these two increasing
bands comparing to 1D IR spectra.
Within each wavenumber range, such as 3080 - 2760 cm-1
, 1830 - 1620 cm-1
,
1280 - 850 cm-1
, the sequence of major band intensity changes with increasing
temperature were suggested by analyzing asynchronous map.
For the bands from 1280 to 1500 cm-1
such as ~1310 cm-1
, ~1372 cm-1
, ~1392
cm-1
, ~1446 cm-1
, which
mostly due to –C-H- bending/scissoring, the band intensities
appear increasing slightly with increasing temperature by examining the 1D IR spectra.
Two dimentional correlation was not evaluated for this region because of the complexity
of the 2D maps.
In fact, other fatty acids such as ethyl DHA, triglyceride DHA, and Omarcor, etc.
fish oil products were also studied using temperature-dependent 2D IR correlation, and
the results are very similar to those of ethyl EPA and triglyceride EPA presented above.
Therefore, these study results are not included in this thesis.
3.7 Conclusion

145
Fish oil supplements labels are misleading and the products do not contain the
free acids EPA and DHA active ingredients.
ATR-FTIR can quickly and easily distinguish between the ethyl ester and the
triglyceride forms of fatty acids using the carbonyl band position.
Principal component analysis (PCA) grouped the FTIR and Raman spectra of fish
oil supplements successfully. The fish oil supplements are clearly clustered into
groups:
- Fish oil supplements containing fatty acids in ethyl ester form, the total EPA
and DHA concentration is about 50 – 70%.
- Fish oil supplements containing fatty acids in triglyceride form, the total EPA
and DHA concentration is more than 50%.
- Fish oil supplements containing omega 3, 6, and 9 fatty acids in triglyceride
form, the total EPA and DHA concentration is less than 20%.
- Fish oil supplements containing fatty acids in triglyceride form, the total EPA
and DHA concentration is about 30%.
PCA can be used to screen these products and to identify the products that may be
made by the same manufacturers with the same quality, but sold with different
prices.
A fish oil spectral library was created for rapid searching and product comparison.
Standard addition method using bands at 3012 cm-1 may be used for rapid
quantitative analysis of total EPA and DHA in fish oil supplements.
2D-IR correlation spectroscopy can be used to study the temperature-dependent
spectral variations of polyunsaturated omega-3 fatty acid esters.

146
Chapter 3 References
1. W.S Harris, American Journal of Clinical Nutrition (The American Society for
Nutrition), 65 (5 Supplement): 1645S–1654S (1997).
2. H.M Roche, M.J. Gibney, European Journal of Clinical Nutrition, 50 (9): 617–624
(1996).
3. T.A.B. Sanders, F.R Oakley, G.J. Miller, K.A. Mitropoulos, D Crook, and M.F. Oliver,
Arteriosclerosis, Thrombosis, and Vascular Biology, 17 (12): 3449–3460 (1997).
4. M.H. Davidson, E.A. Stein, H.E. Bays, K.C. Maki, R.T. Doyle, etl. Clinical
Therapeutic, 29 (7): 1354–1367(2007).
5. H.C. Bucher, P. Hengstler, C. Schindler, G. Meier, The American Journal of
Medicine, 112 (4): 298–304(2002).
6. M.L. Burr, P.M. Sweetham, A.M. Fehily, European Heart Journal , 15 (8): 1152–
1153 (1994).
7. W.C. Willett, M.J Stampfer, G.A.Colditz, F.E. Speizer, B.A. Rosner, C.H. Hennekens,
The Lancet , 341 (8845): 581–585 (1993).
8. N.J. Stone, Circulation (American Heart Association), 94: 2337–2340 (1996).
9. K.P. Su, S.Y. Huang, C.C. Chiub, W.W. Shenc, European Neuropsychopharmacology
13 (4): 267–271 (2003).
10. K. Naliwaiko, R.L. Araújo, R.V. da Fonseca, J.C. Castilho, R. Andreatini, etl.
Nutritional Neuroscience , 7 (2): 91–99(2004).
11. P.R. Fortin, R.A. Lew, M.H. Liang, etl. Journal of Clinical Epidemiology , 48 (11):
1379–1390 (1995).
12. J.M. Kremer, J. Bigauoette, A.V. Michalek, etl. The Lancet (Elsevier), 1 (8422):
184–187 (1985).
13. Ref. www.equazen.com.
14. L.D. Lawson, B.G. Hughes, Biochem Biophys Res Commun. 156(2), 960-3 (1988).
15. B. Beckermann, M. Beneke, I. Seitz, Arzneimittel-Forschung, 40 (6): 700–704 (1990).
16. K.E. Krokan, K.S. Bjerve, E. Mork, Biochim Biophys Acta. 1168(1), 59-67 (1993).

147
17. A. Nordoy, L. Barstad, W.E. Connor, L. Hatcher, Am J Clin Nutr. 53(5), 1185-90
(1991).
18. Van de Voort F.R., A.A. Ismail, and J. Sedman., Ibid., 72, 873-880 (1995).
19. Fatty Acid Composition by GLC: Marine Oils, in Official Methods and
Recommended Practices of the American Oil Chemists’ Society, 4th edn., AOCS Press,
1993 (reapproved 1997), Official Method Ce 16-89.
20. T. Takagi, M. Kaneniwa, and Y. Itabashi, Lipids 21:430 (1986).
21. R.G. Ackman, Fatty Acids, in Marine Biogenic Lipids, Fats and Oils (edited by R.G.
Ackman), CRC Press Inc., Boca Raton, Vol. 1, pp. 103–138 (1989).
22. T. Kajishima, S. Aoki, Y. Nishimoto, E. Hasegawa, E. Moriyoshi, and H. Nagayama,
J. Jpn. Oil. Chem. Soc.45:335 (1996).
23. I. Medina, S. Aubourg, J.M. Gallardo, and R. Perez-Martin, Int. J. Food Sci.Technol.
27:597 (1992).
24. A.A. Ismail, F.R. van de Voort, G. Emo and J. Sedman, J. Am.Oil Chem. Soc.,
70:335 (1993).
25. M.M. Mossoba, J.K.G. Kramer, J. Fritsche, M.P. Yurawecz, K.D. Eulitz, Y. Ku, and
J.I. Rader, J. Am.Oil Chem. Soc., 78:631- 634 (2001).
26. M.M. Mossoba, M..P. Yurawecz, and R.E. McDonald, J. Am. Oil Chem. Soc.,
73:1003–1009 (1996).
27. M. Safar, D. Bertrand, P. Robert, M.F Devaux and C. Genot, J. Am.Oil Chem. Soc.,
71:371-377 (1994).
28. A. Al-Alawi, F.R. van de Voort, and J. Sedman, J. Am. Oil Chem. Soc., 81:441-446
(2004).
29. Y.W. Lai, E.K. Kemsley, and R.H. Wilson, J. Agric. Food Chem. 42:1154-1159
(1994)
30. A. Flatten, E.A. Bryhni, A. Kokler, B. Egelandsdal, and T. Isakaaon, Meat Science,
69: 433-440 (2005).
31. S. Yoshida and H. Yoshida, Biopolymers (Biospectroscopy), 70: 604-613 (2003).
32. H. Sadeghi-jorabchi, R.H. Wilson, P.S. Belton, et al., Spectrochim. Acta, Part A,
47:1449 (1991).
148
33. M. Meurens, V. Baeten, S.H. Yan, E. Mignolet, and Y. Larondelle, J. Agric. Food
Chem. 53, 5831 (2005).
34. V. Baeten, P. Hourant, M.T. Morales, R.Aparicio, J. Agric. Food Chem. 46, 2638
(1998).
35. J.R. Beattie, S.E.J. Bell, C. Borgaad, A.M. Fearon, B.W. Moss, Lipid, 39, 897
(2004).
36. N.K. Afseth, J.P. Wold, and V.H. Segtnan, Analytica Chim. Acta, 572, 85-92 (2006).
37. M. D. Guillén, A. Ruiz, J. Sci. Food Agric. 83, 338-346 (2003).
38. L. Broadhurst, W.F. Schmidit, M.A. Crawford, Y. Wang, and R. Li, J. Agric. Food
Chem. 52, 4250-4255 (2004).
39. M. Aursand, I.B. Standal, and D.E. Axelson, J. Agric. Food Chem. 55, 38-47 (2007).
40. M. D. Guillén and N. Cabo, J. Agric. Food Chem. 46, 1788-1793 (1998).
41. J.R. Beattie, S.E.J. Bell, C. and B.W. Moss, Lipid, 39, 407-419 (2004).
42. I. Noda, J. Am. Chem. Soc., 111, 8116-8118 (1989).
43. I. Noda, A.E. Dowrey, C. Marcott, and G.M. Story, Applied Spectroscopy, 54, 236A-
248A (2000).
44. T. Igarashi, M. Aursand, Y. Hirata et al., J. Am. Oil Chem. Soc., 77:737-747 (2000).

149
Chapter 4: Summary
The research results outlined in the project I demonstrated that the unique IR
method developed for simultaneous quantitation of dimethicone and cyclomethicone
using two simultaneous absorbance – concentration equations at two fixed wavenumbers
of 1258.50 cm-1
and 800.00 cm-1
(with baseline correction at 1325.00 cm-1
and 950.00 cm-
1, respectively) is applicable. The method has been successfully validated for the analysis
of dimethicone and cyclomethicone in consumer products such as skin protective
ointments. The method was shown to be linear, accurate, precise, and specific.
The research results outlined in the project II indicated that a fast qualitative
ATR-FTIR method can be used to distinguish between the ethyl ester and triglyceride
forms of fatty acids using the carbonyl band position. Principal Component Analysis
(PCA) was used to classify fish oil supplements successfully by grouping the products
into four groups based on the fatty acid chemical form and EPA and DHA
concentrations. PCA was also demonstrated as a powerful tool to screen fish oil
supplements that may be made by the same manufacturers with the same quality, but sold
with different prices. A fish oil FTIR spectral library was also created for rapid searching
and product comparison. In addition, an ATR-FTIR standard addition method was
evaluated and shown to be suitable for the quantitative analysis of EPA and DHA esters
in an in-house blended fish oil sample. However, the detail formulation information
should be evaluated to determine whether this approach is applicable for other products.
The temperature dependent spectral characteristics of EPA esters were successfully
studied using two-dimensional FTIR correlation spectroscopy.

150
Curriculum Vitae
Jun Zhang
Education
1983 - 1987 Lanzhou University, Lanzhou, P.R. China
B.S. in Chemistry, July 1987
1987 - 1990 Lanzhou University, Lanzhou, P.R. China
M.S. in Polymer Chemistry, June 1990
1995 - 1997 Rutgers, The State University of New Jersey,
New Brunswick, New Jersey
M.S. in Chemistry, January 1997
2004 - 2009 Rutgers, The State University of New Jersey,
New Brunswick, New Jersey
Ph.D. in Analytical Chemistry, May 2009
Principle Occupation
1998 - Present Staff Scientist
Analytical Development, R&D Operations,
J&J Group of Consumer Companies, Skillman, New Jersey
1997 Chemist
Analytical R&D Department,
Par Pharmaceutical Inc., Spring Valley, New York
1995 - 1996 Teaching Assistant and Research Assistant
Chemistry and Psychology Department,
Rutgers University, New Brunswick, New Jersey
1990 - 1994 Associate Research Scientist
Lanzhou Chemistry Institute,
Chinese Academy of Science, Lanzhou, P.R. China
Publication
Fang Ma, Jun Zhang and Chyan E. Lau., Determination of cocaine and its metabolites in
serum microsamples by high- performance liquid chromatography and its application to
pharmacokinetics in rats., J. Chromatography B, Vol. 693, No. 2(307-312), 1997.