agronomy forms of phosphorus in soils and … wang forms of phosphorus … · as a percentage of...
TRANSCRIPT
Agronomy
FORMS OF PHOSPHORUS IN SOILS AND THEIR AVAILABILITY k 1,
TO SUGARCANE
Chwan-chau Wang, Ing-jye Fang and Lynn S. Robertson
Taiwan Sugar Research Institute, Tainan, Taiwan, Republic of China Michigan State University E. Lansing, Michigan, USA
ABSTRACT
This study was designed to evaluate the forms of P removed from soil by sugarcane; to measure the yield response of sugarcane to P fertilizer and to develop a suitable extractant for P determination on sugarcane soils.
AI-P was the form removed by one sugarcane harveqt in the lowest quantity and with the least variation irrespective of s ~ i l type. However, if the amount of AI-P removed by cropping was exoressed as a percentage of the original level it became the highest, and averaged 25.4% varying from a maximum of 37.9% in the As, soil group to a minimum of 20.0% in the AS, soil group. The sugarcane crop removed 20.4% of the Fe-P, 13.3% of the Ca-P and 13.5% of the Red-P.
Fe-P and Ca-P are the most common forms removed by sugarcane in acid soils and in calcareous soils, respectively, if the amounts of these two forms used by the crop are expressed as the percentage of total P removed.
Apparently, all four forms of P in the soil were available to su- garcane. The AI-P and Fe-P were the major sources of P utilized by sugarcane.
High correlation between soil P extracted with modified Bray's No. 1, in a l:50 soil: solution ratio, and sugarcane yields was found on pot cultures and in field experiments with a statistical significance at the 0.1% and 1% levels, respectively. Therefore it was recommend- ed that modified Bray's No. 1 extractant should be used on the soils of TSC's plantations-as a routine soil P test method.
INTRODUCTION
The chemical forms of P in the soil greatly influence the amount of P' available to plants. Therefore, it seems that a knowledge of the distribution of soil P among discrete chemical forms should be useful in diagnosing the supplying power of a soil.
The idea of fractionation of inorganic P in the soil was proposed as early as 1938 by Deanl3. Many workers435J0 investigated methods of frac- tionation of inorganic P in soils. Al-Abbas & Barber1 studied P soil tests based on the fractionation of P. They reported that the quantity of Fe-P in the soil indicated a degree of P availability to corn. By using radioisotopic
AGRONOMY
technique, Yuan et ai, Dunber & Baker, and Smith14~21~u a11 pointed out that the most active form of P in soils was A1-P, which can be extracted with NH4F. Chiang stated that, if the dominant forms of P in soil are AI-P and Fe-P, Ca-P will be taken up most rapidly by rice. When Ca-P is present in relatively large amounts there is a tendency for AI-P and Fe-P uptake to increase.
Since fluoride-extractable soil P is recognized as an important source of P for plants, a series of papers by Fife15.16,1TJ8 evaluated NH4F as a selective extractant for Al-bound soil P. Susuki et a123 also found that P removed from soil by Bray, Olsen, resin and surface P methods was prin- cipally from the Al-P fraction.
The forms of P in the soils of Taiwan were investigated by Chu & Chang, and Chang & Juo99'2. They found that apparently the Olsen and Bray's No. 1 extracting agents evaluate Al-P well but no Ca-P.
The available P in the soil is usually extracted by water, dilute acids, dilute alkali or buffered salt solutions. Comparisons of the amount of P removed from soil by various extractants have been reported in many in- vestigations3~7h11.
Soil analysis for P is considered to be especially important since this nutrient needs to be applied to the sugarcane soiI prior to planting. In trying to make the highest return per dollar ipvested in fertilizer, the study of improvement in soil testing for P should be an integral part of sugarcane research. This study is intended to investigate the distribution pattern of the forms of P in the soil; the forms of P removed from soil by sugarcane; and to develop a suitable extractant for P soil tests on sugarcane soils.
MATERIALS AND METHODS
Large (70 cm diameter x 75 cm height) cement pots containing 300 kg of soils were used in the outdoor pot test to study the distribution pattern of the forms of P in sols; the forms of P removed from soil by sugarcane; and the correlation between extractable P by various methods and sugarcane yields. Two replications of treatments were placed at random. Two F160 cuttings, 4 buds per pot, were planted in September of 1969 and harvested in December of 1970. No P was used on these soils which were treated with the equivalent of 300 kg of N and 150 kg of KzO.
The fractionation of the P in the soils was done with Chang and Jackson's method as modified by Petersen and Corey8J0 on samples collected both before planting and alter harvest. The available P levels were evaluated by Bray's No. 1 test6 at various soils to extractant ratios, Bray's No. 2 test6, Amer et a12 resin adsorption method, 0.5 M NH4F solution adjusted to pH 7.2 and 8.2, atid Olsen's methodig, respectively.
The pH determination was made in a 1 : 1 soil water mixture using a glass electrode. Organic matter determinations and mechanical analysis were made by chromic acid oxidation and hydrometer method, respectively.
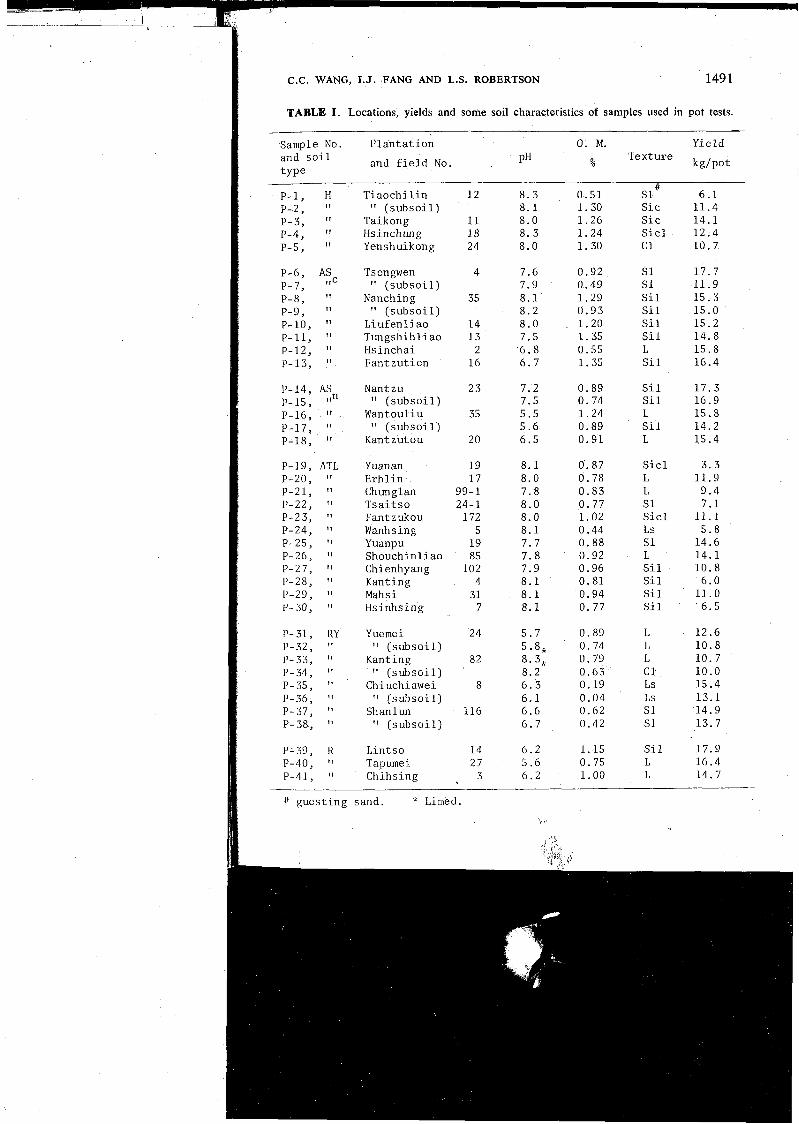
The yields, and some soil properties of samples, are shown in Table I.
C.C. WANG, I. J . FANG AND L.S. ROBERTSON 149 1
TABLE I . Locations, yields and some soil characteristics of samples used in pot tests.
Sample No. P l a n t a t i o n 0 . M. Yield and s o i l pH Texture and f i e l d No. % kg/pot t y p e
T i a o c h i l i n ( s u b s o i l )
Taikong ffsinchung Yenshuikong
slK 6 . 1 S i c 11.4 S i c 1 4 . 1 S i c l 12 .4 C 1 10 .7
Tsengwen ( s u b s o i l )
Nanching I' ( s u b s o i l )
L i u f e n l i a o Tungsh ih l iao Hs incha i F a n t z u t i e n
Nant zu ( s u b s o i l )
Wantouliu If ( s u b s o i l )
Kant zu tou
S i 1 S i 1 L S i l L
P-19, ATL P-20, "
P-21, "
P-22, "
P-23, "
P-24, "
P-25, "
P-26, " P-27, I '
P-28, P-29, " P- 30, I '
Yuanan E r h l i n Chunglan T s a i t s o Fantzukou Wanhsing Yuanpu Shouchin l iao Chienhyang Kanting Mahsi Hs inhs ing
S i c l L L S1 S i c l Ls S 1 L S i 1 S i 1 S i 1 S i 1
Yuemei ( s u b s o i l )
Kanting ( s u b s o i l )
Chiuchiawei ( s u b s o i l )
Shanlun " ( s u b s o i l )
L in t s o Tapumei Chihs ing
fl g u e s t i n g sand. * Limed.
1492 AGRONOMY
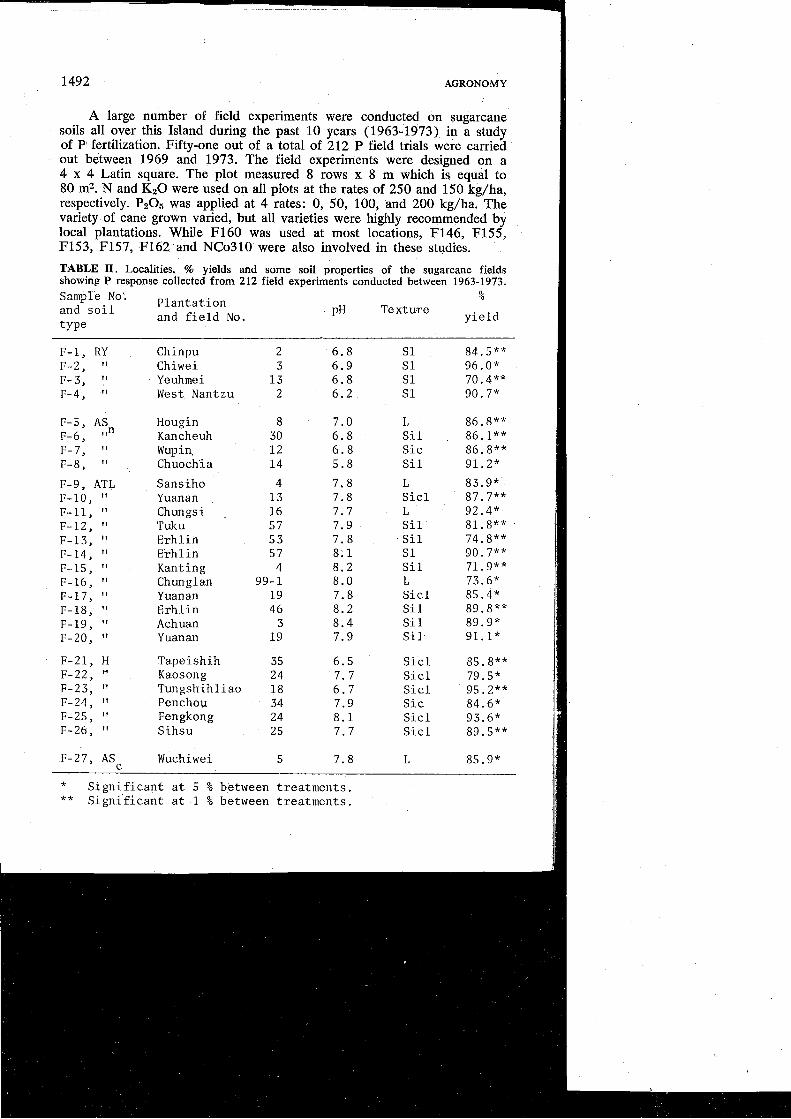
A large number of field experiments were conducted on sugarcane soils all over this Island during the past 10 years (1963-1973) in a study of Pi fertilization. Fifty-one out of a total of 212 P field trials were carried out between 1969 and 1973. The field experiments were designed on a 4 x 4 Latin square. The plot measured 8 rows x 8 m which is equal to 80 m2. N and KzO were used on all pIots at the rates of 250 and 150 kg/ha, respectively. PzOs was applied at 4 rates: 0, 50, 100, and 200 kg/ha. The variety of cane grown varied, but all varieties were highly recommended by local plantations. While F160 was used at most locations, F146, F155, F153, F157, F162 and NCo310 were also involved in these studies.
TABLE 11. Localities, % yields and some soil properties of the sugarcane fields showing P response collected from 212 field experiments conducted between 1963-1973.
p l a n t a t i o n and s o i l
and f i e l d No. type
% PH Texture y i e l d
F-1, RY Chinpu 2 6 . 8 S1 84.5** F-2, I t Chiwei 3 6 . 9 S1 96.0* F-3, " Yeuhmei 1 3 6 . 8 S1 70.4** F-4, If West Nantzu 2 6 .2 S1 90.7*
F-5, AS Hougin 8 7 .0 L 86.8** F-6, lfn Kancheuh 30 6 . 8 S i l . 86.1** F-7, I t Wupin 12 6 . 8 S i c 86.8** F-8, I ' Chuochia 14 5 . 8 S i 1 91.2*
F-9, ATL F- 10, "
F-11, "
F-12, "
F-13, " F-14, " F-15, "
F-16, I '
F-17, "
F-18, I '
F-19, I'
F-20, "
Sansiho Yuanan Chungsi Tuku E r h l i n Erh 1 i n Kanting Chunglan Y uanan E r h l i n Achuan Yuanan
L S i c l L S i 1 S i 1 S 1 S i l L S i c l S i 1 S i 1 S i l
F-21, H Tapeishih 35 6 . 5 S i c 1 85.8** F-22, " Kaosong 24 7 .7 S i c 1 79.5* F-23, I f Tungshihl iao 18 6 . 7 S i c 1 95.2** F- 24, I t Penchou 34 7.9 S i c 84.6" F-25, I ' Fengkong 2 4 8 . 1 S i c 1 93.6" F-26, I t S i h s u 2 5 7 .7 S i c 1 89.5**
F-27, ASc Wuchiwei 5 7.8 L 85.9*
* S i g n i f i c a n t a t 5 % between t r e a t m e n t s . * * S i g n i f i c a n t a t 1 % between t r e a t m e n t s .
c.C. WANG, I .J . FANG AND L.S. ROBERTSON 1493
Among these 212 P field experiments, only 27 sites had shown statistically significant yield response to P fertilizer. These were chosen for a correlation study between percentage yields of sugarcane and ex- tractable P by various methods as mentioned in correction with pot tests. Table I1 shows the locations, percentage yields and some soil properties of the sugarcane fields giving P response.
Soils included in this study have been grouped as:
(1 ) H: Low humic gley soil (Vertisols) . (2) AS,: Sandstone alluvial soil, calcareous (Inceptisols) .
(3) ASn: Sandstone alluvial soil, non-calcareous (Inceptisols) . (4) ATL: Slate alluvial soil (Inceptisols).
( 5 ) RY: Red yellow podzolic soil (Ultisols).
(6) R: Red soil (Ultisols).
RESULTS AND DISCUSSION
Forms of P in soils and their availability to sugarcane
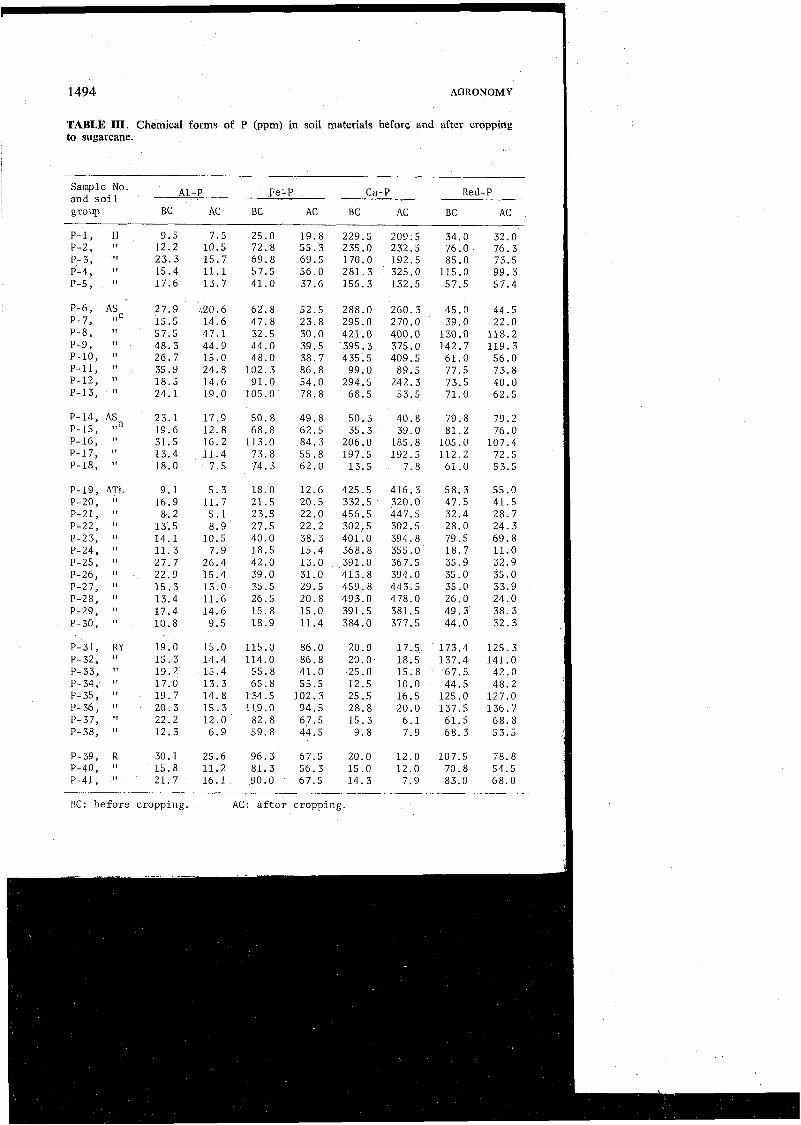
The chemical forms of P in soil materials before and after sugarcane cropping are shown in Table 111.
In the R and RY soils, Red-P and Fe-P were the most abundant. These soils were the lowest in total mineral P due to extensive leaching that had occurred in the soil formation process. The usually acid AS, soils contained much more Ca-P (100 ppm) than tlie usually acid R and RY soils (18 ppm) but far less than did the calcareous soils (300 ppm). However, the difference in amount of the other three forms of P, A1-P, Fe-P, and Red-P in these three acid soil groups was small. This indicated that the ASn soil was in an. intermediate stage of development between that of the highly weathered R and RY soils and that of the less weathered calcareous soils (AS,, ATL, and H).
The average level of A1-P was not only the lowest among all forms of P in any soil type but also showed the least variation, ranging from 15.6 ppm to 31.8 ppm. In the less weathered ATL soils, Ca-P was present at the highest level accounting for more than 80% of the total mineral P.
"i' 1
821 / :, '(', "
1494 AGRONOMY
TABLE 111. Chemical forms of P (ppm) in soil materials before and after cropping to sugarcane.
Sample No. A1-P Fe-P Ca-P Red-P and s o i l group BC AC BC AC BC AC BC AC
P-1, H 9 .5 7.5 25.0 19.8 229.5 209.5 34.0 32.0 P-2, " 12.2 10 .5 72.8 5 5 . 3 235.0 232.5 76.0 76 .3 P-3, " 2 3 . 3 1 5 . 7 69 .8 69.5 170.0 192.5 85.0 73.5 P-4, " 15.4 11 .1 57 .5 56 .0 281.3 325.0 115.0 9 9 . 3 P-5, I! 17 .6 1 3 . 7 41.0 37.6 156 .3 132.5 57 .5 57.4
P-19, ATL P-20, "
P-21, "
P-22, I '
P-23, "
P-24, "
P-25, "
P-26, "
P-27, I'
P-28, " P-29, ' I
P- 30, I'
BC: b e f o r e cropping. AC: a f t e r c ropping.
C.C. WANG, I.J. FANG AND L.S. ROBERTSON 1495
The quantity of each form of P removed by cropping with sugarcane varied with the soil groups. As indicated in Table IV, the average quantity of Al-P removed by sugarcane was always less than the amounts of Fe-P, Ca-P, or Red-P. Furthermore, there was less variation in the amount of A1-P removed than in the amount of any other phosphate. The average amount of A1-P that was removed by one sugarcane crop ranged between 3.4 pprn in the ATL soils and 8.0 pprn in the AS, soils. If the amount of A1-P removed from the soil is expressed as a percentage of the amount present, a different interpretation is possible. With this interpretation A1-P becomes a major source of the P utilized by sugarcane.
It is interesting that, on a percentage basis, there was not much dif- ference among the six soil groups. The percentage of AI-P removed from all soils by cropping averaged 25.4% and varied from a maximum of 37.9% for the AS, soil to a minimum of 20.0% for the ASc soil. A possible explanation of this situation is that A1-P is the most active form of P in the soil, zind its solubility increases with an increase in pH. Above pH 7.0, the concentration ol A1-P is likely to be higher than that of Ca-P. In 27 out of 41 pot tests, the soils had pH levels greater than 7.0. Thus the availability of Al-P would be higher than that of any of the other forms of P in the soils considered, giving a better chance of utilization by sugar- cane.
A relatively high percentage removal of Fe-P was also found in the R soil (28.5% ). The H soil had the lowest percentage removal values for Fe-P (1 1.8% ). The calcareous ATL soil had the lowest average Fe-P test but it also had a relatively high percentage removal value (23.2% ). For all of the soils, the average percentage removal of Fe-P was equal to 20.4%. This value is less than that for Al-P. It is likely that A1-P was more soluble in these soils than was the Fe-P.
The test values for Ca-P varied between 16.4 pprn for the R soils and 401.6 pprn for the ATL soils. The R and RY soils averaged 16.4 pprn and 19.6 pprn of Ca-P, respectively, which were the lowest values found. It is of interest that much of this Ca-P was utilized by the sugarcane crop and the percentage removal values were the highest, 35.4 and 28.6% respectively.
The pH values of R and RY soil groups, in this study, ranged from 5.6 to 6.7. The concentration of Ca-P in solution in soils within this pH range would be higher than in those soils with a more alkaline reaction. Thus the Ca-P was more readily available to sugarcane in the R and RY soil groups than in the less weathered AS,, ASc, ATL and H soils.
Higher average amounts, of Ca-P in the soil do not necessarily imply a higher percentage removal .cf Ca-P by sugarcane. The less weathered, high Ca-P containing soils (ATL, AS,, AS, and H) were able to supply larger amounts of Ca-P than the more weathered R and RY soils. The opposite
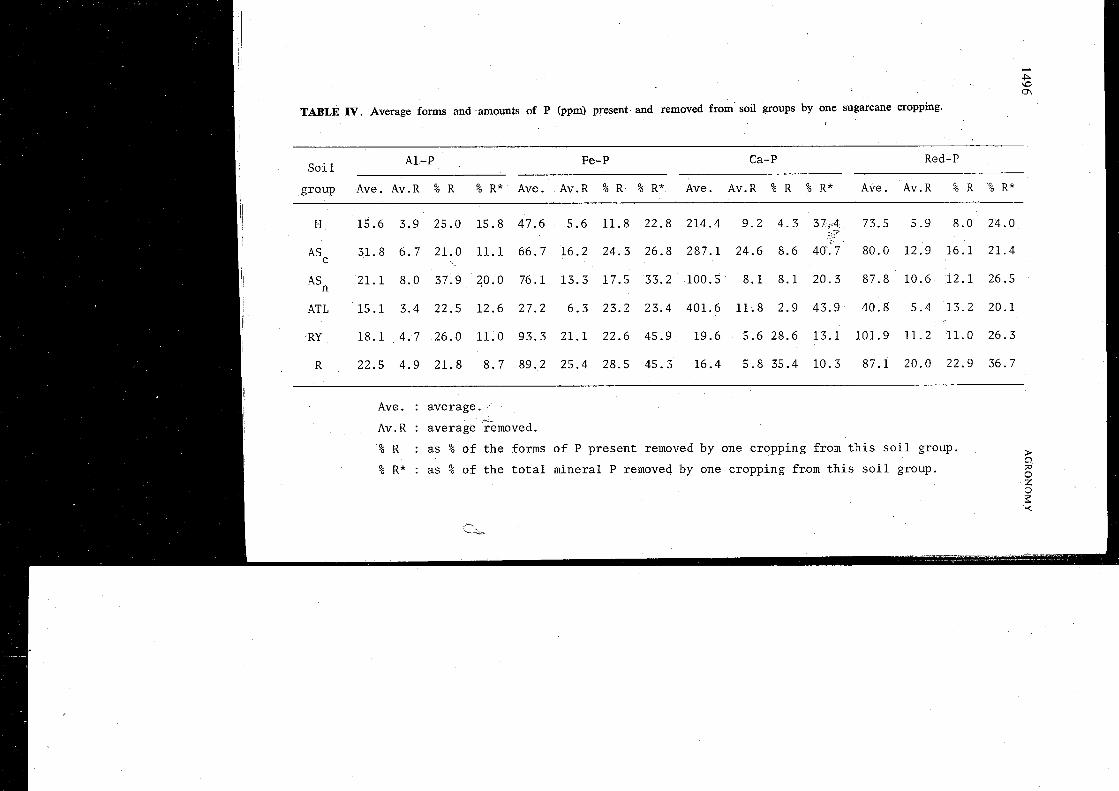
TABLE IV. Average forms and amounts of P (ppm) present and removed from soil groups by one sugarcane cropping.
A1-P Fe- P Ca-P Red-P Soi 1
group Ave. Av.R % R % R* Ave. Av.R % R % R* Ave. Av.R % R % R* Ave. Av.R % R % R*
H 15.6 3.9 25.0 15.8 47.6 5.6 11.8 22.8 214.4 9.2 4 . 3 37;A4 73.5 5.9 8.0 24.0
ASc 31.8 6 . 7 21.0 11.1 66.7 16.2 24.3 26.8 287.1 24.6 8.6 4 ~ : 7 80.0 12.9 16.1 21.4
ASn 21.1 8.0 37.9 20.0 76.1 13 .3 17.5 33.2 100.5 8 .1 8 .1 20.3 87.8 10.6 12.1 26.5
ATL 15.1 3.4 22.5 12.6 27.2 6 .3 23.2 23.4 401.6 11.8 2.9 43.9 40.8 5.4 13.2 20.1
RY 18.1 4.7 26.0 11.0 93.3 21.1 22.6 45.9 19.6 5 .6 28.6 13.1 101.9 11.2 11.0 26.3
R 22.5 4.9 21.8 8 .7 89.2 25.4 28.5 45.3 16.4 5 . 8 3 5 . 4 10.3 87.1 20.0 22.9 36.7
Ave. : average. -
Av. R : average ;emoved.
% R : a s % of t h e forms of P presen t removed by one cropping from t h i s s o i l group.
% R* : a s % of t h e t o t a l mineral P removed by one cropping from t h i s s o i l group.
?:-
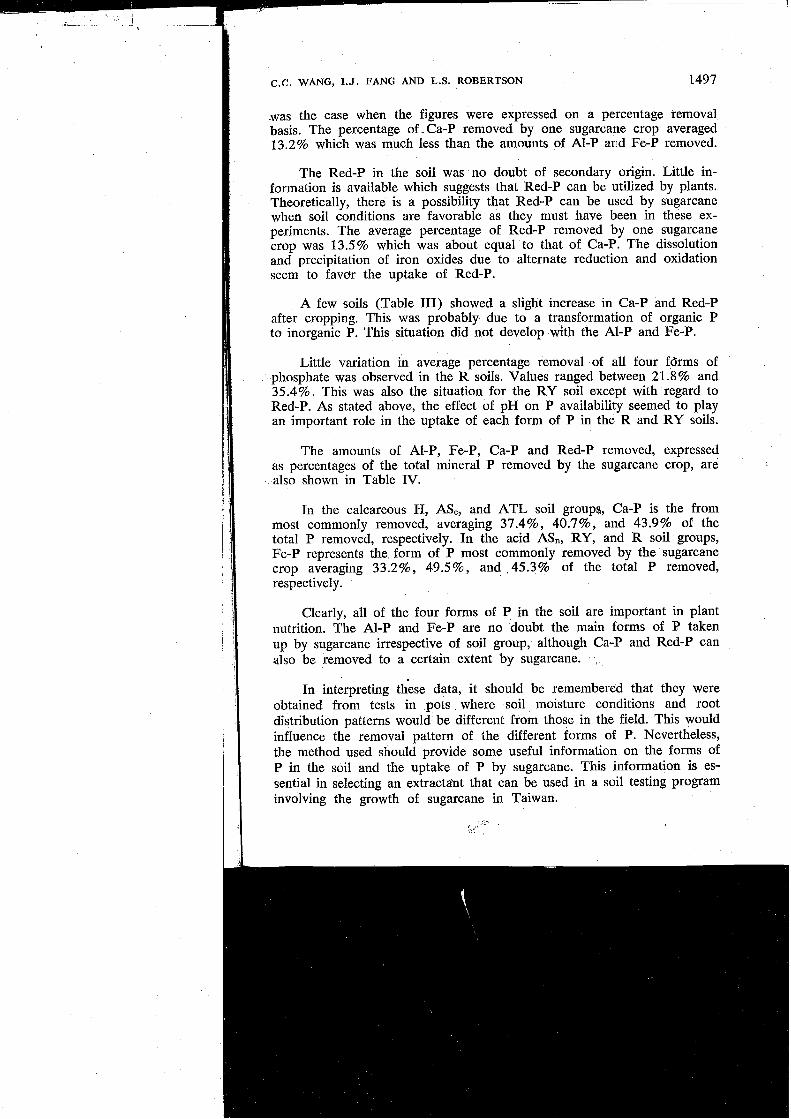
.was the case when the figures were expressed on a percentage removal basis. The percentage of-Ca-P removed by one sugarcane crop averaged 13.2% which was much less than the amounts of AI-P and Fe-P removed.
The Red-P in the soil was no doubt of secondary origin. Little in- formation is available which suggests that Red-P can be utilized by plants. Theoretically, there is a possibility that Red-P can be used by sugarcane when soil conditions are favorable as they must have been in these ex- periments. The average percentage of Red-P removed by one sugarcane crop was 13.5% which was about equal to that of Ca-P. The dissolution and precipitation of iron oxides due to alternate reduction and oxidation seem to favcrr the uptake of Red-P.
A few soils (Table 111) showed a slight increase in Ca-P and Red-P after cropping. This was probably due to a transformation of organic P to inorganic P. This situation did not develop with the A1-P and Fe-P.
Little variation in average percentage removal of all four fdrms of phosphate was observed in the R soils. Values ranged between 21.8% and 35.4%. This was also the situation for the RY soil except with regard to Red-P. As stated above, the effect of pH on P availability seemed to play an important role in the uptake of each form of P in the R and RY soils.
I The amounts of Al-P, Fe-P, Ca-P and Red-P removed, expressed as percentages of the total mineral P removed by the sugarcane crop, are also shown in Table IV.
In the calcareous H, AS,, and ATL soil groups, Ca-P is the from most commonly removed, averaging 37.4%, 40.7%, and 43.9% of the total P removed, respectively. In the acid AS,, RY, and R soil groups, Fe-P represents the form of P most con~n~only removed by the sugarcane crop averaging 33.2%, 49.5%, and ,45.3% of the total P removed, respectively.
In interpreting these data, it should be remembered that they were obtained from tests in pots where soil moisture conditions and root distribution patterns would be different from those in the field. This would influence the removal pattern of the different forms of P. Nevertheless, the method used should provide some useful information on the forms of P in the soil and the uptake of P by sugarcane. This information is es- sential in selecting an extractant that can be used in a soil testing program involving the growth of sugarcane in Taiwan.
1 Clearly, all of the four forms of P in the soil are important in plant nutrition. The A1-P and Fe-P are no doubt the main forms of P taken up by sugarcane irrespective of soil group, although Ca-P and Red-P can also be removed to a certain extent by sugarcane.
1498 AGRONOMY
Correlations between extractable P and sugarcane yield
Now that information on the levels of P available in the soils of Taiwan and on the forms of P utilized by sugarcane are available, it should theoretically be possible to formulate a suitable extractant for P. Most certainly, the extractant should remove considerable A1-P and Fe-P and a limited quantity of both Ca-P and Red-P.
The ions commonly used to extract these forms of P will be H+, OH-., F-, HC03-, acetate, and SO4=. Hydrogen ion greatly increases the solubility of 'all Ca-P including basic Ca-P such as hydroxyapatite. It also attacks Al-P and Fe-P. In a soil containing Ca-P, A1-P and Fe-P, H ions would be expected to remove them in the order Ca>Al>Fe.
Hydroxide ions have been found by Dean13 to dissolve Fe-P and A1-P in this order but have little effect on basic Ca-P.
Fluoride ions specifically precipitate soluble Ca a$ the ~, and thus will extract the more soluble Ca-P such as CaHP04 from the soil. Fluoride also complexes A1 strongly and frees phosphate formerly bonded to Al.
Bicarbonate ions do not attack basic Ca-P nor do they attack to any extent A1-P or Fe-P that are covered with oxide coatings.
By evaluating the specific chemical behavior of the ions to be used for extracting larger amounts of Al-P and Fe-P and relatively smaller quantities of Ca-P and Red-P, it was possible by use of an extracting solution consisting of 0.025N HCl and 0.03N NH4F to provide a relatively high proportion of solution volume instead of a low ratio of soil: solution volume. b $ .
i'i
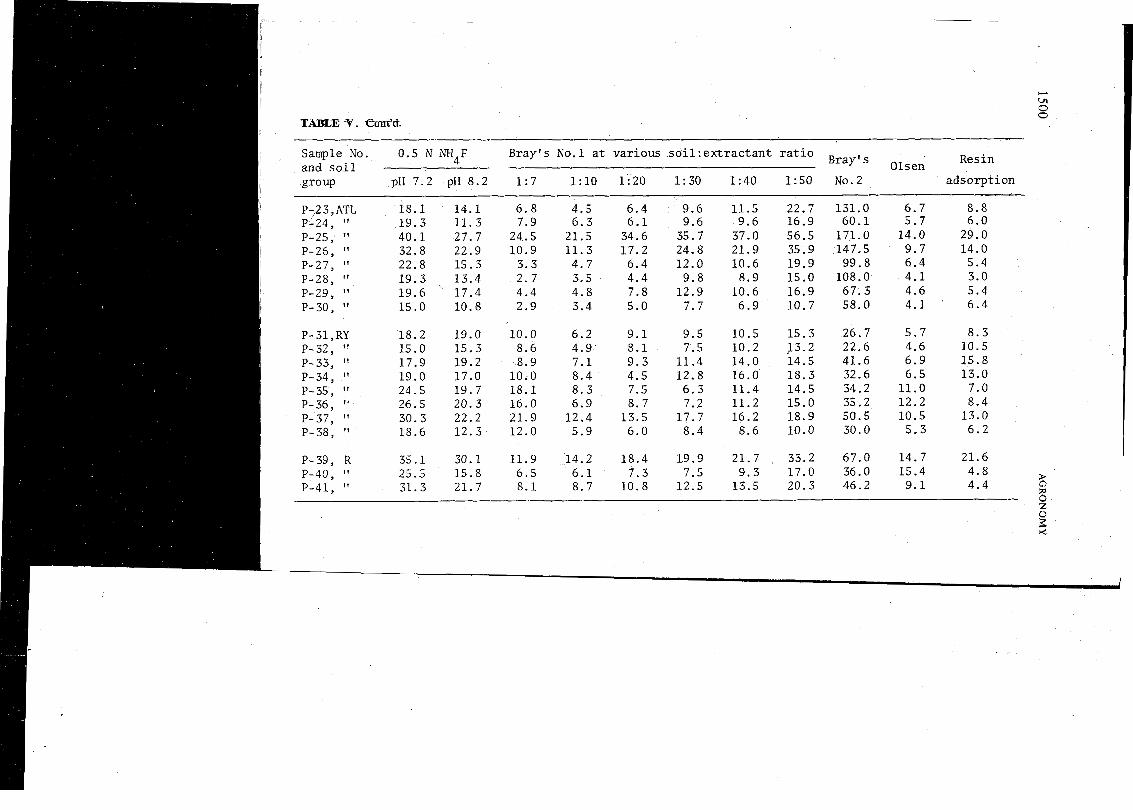
Tables V and VI show the P extracted by various methods fro& the 41 pot tests and 27 field experiments givii1g.P responses. r ,
As shown in Table V, the NH4F-P extracted at pH 7.2 was always higher than that extracted at pH 8.2. The explanation for this is related to the form of P soluble at different pH levels. An appreciable amount of Fe-P was extracted at pH 7.2, while at pH 8.2, most of the extractable P was A1-P16J7J8. The values of extractable P by Bray's No. 1 method were usually increased with an increase in soil: solution ratio. Bray's No. 2 solution is a strong acid-fluoride extractant which extracted much more P from the soils than did the other extractants. A few analytical errors, how- ever, may be found in Tables V and VI.
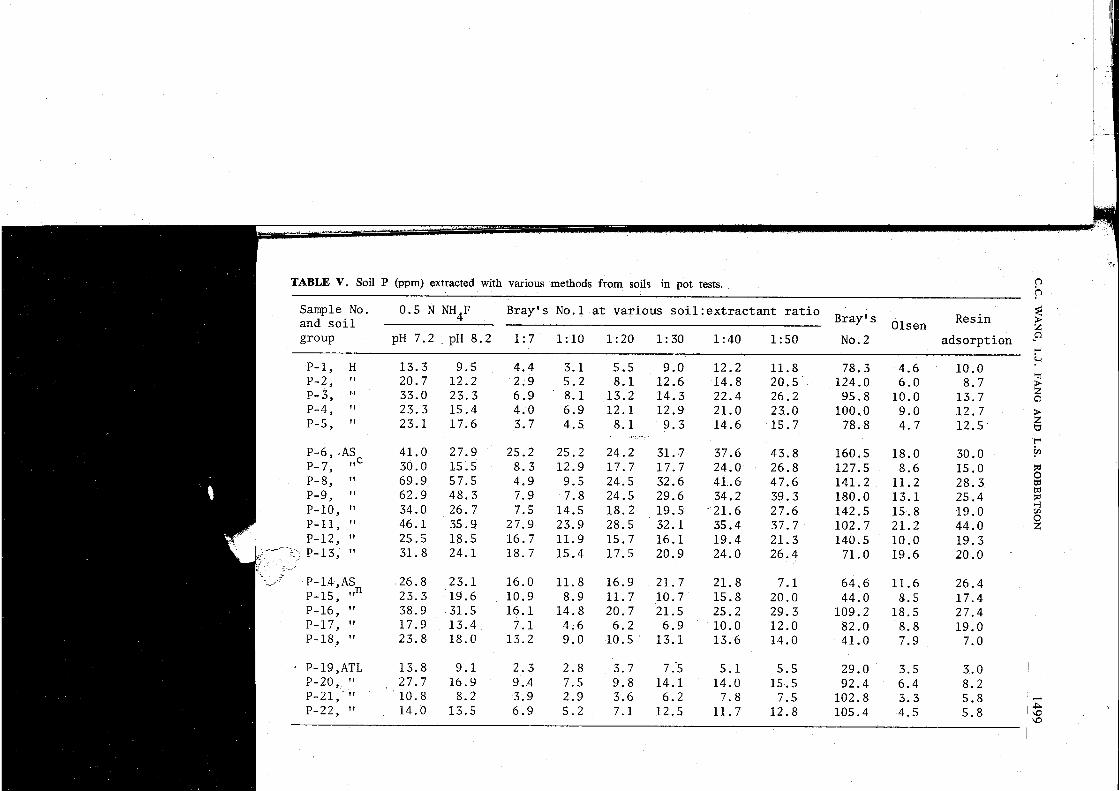
TABLE V. Soil P (ppm) extracted with various methods from soils in pot tests. ----
SampleNo. 0.5NNH4F Bray's N O . ~ a t var ious s o i 1 : e x t r a c t a n t r a t i o and s o i l Bray s
Olsen Resin
group p H 7 . 2 p H 8 . 2 1 :7 1:10 1:20 1:30 1:40 1:50 No. 2 adsorp t ion
P-1, H 13 .3 9 .5 4.4 3.1 5.5 9.0 12.2 11.8 78.3 4.6 10.0 P-2, " 20.7 12.2 2.9 5 .2 8 .1 12.6 14 .8 20.5 124.0 6.0 8 .7 P-3, " 33.0 23.3 6.9 8.1 13.2 14 .3 22.4 26.2 95.8 10.0 13.7 P-4, " 23.3 15.4 4.0 6.9 12 .1 12.9 21.0 23.0 100.0 9.0 12 .7 P-5, " 23.1 17.6 3.7 4 .5 8 . 1 9 .3 14.6 15.7 78.8 4.7 12 .51
..- P-6, ,AS 41.0 27.9 25.2 25.2 24.2 31.7 37.6 43.8 160.5 18.0 30.0 P- 7, !lC 30.0 15.5 8.3 12.9 17 .7 17.7 24.0 26.8 127.5 8.6 15.0 P-8, " 69.9 57.5 4.9 9.5 24.5 32.6 41.6 47.6 141.2 11.2 28.3 P-9, " 62.9 48.3 7.9 7.8 24.5 29.6 34.2 39.3 180.0 13 .1 25.4 P-10, " 34.0 26.7 7.5 14.5 18.2 19.5 -21 .6 27.6 142.5 15.8 19.0 P-11, " 46.1 35.9 27.9 23.9 28.5 32.1 35.4 37.7 102.7 21.2 44.0
. P-12, " 25.5 18.5 16 .7 11.9 15.7 16.1 19.4 21.3 140.5 10.0 19 .3 - - P-13, " 31.8 24.1 18.7 15.4 17.5 20.9 24.0 26.4 71.0 19.6 20.0 .-
P-14,AS 26.8 23.1 16.0 11.8 16.9 21.7 21.8 7.1 64.6 11.6 26.4 P-15, !ln 23.3 19.6 10.9 8.9 11.7 10 .7 15.8 20.0 44.0 8 .5 17.4 P-16, " 38.9 31.5 16 .1 14 .8 20.7 21.5 25.2 29.3 109.2 18.5 27.4 P-17, " 17.9 13.4 7.1 4.6 6.2 6 .9 10.0 12.0 82.0 8.8 19.0 P-18, " 23.8 18.0 13.2 9 .0 10.5 13.1 13.6 14.0 41.0 7.9 7.0
P- 19, ATL 13.8 9 . 1 2 . 3 2.8 3.7 7.5 5 .1 5.5 29.0 3.5 3.0 I P-20, " 27.7 16.9 I 9.4 7.5 9.8 14 .1 14.0 15.5 92.4 6 .4 8.2 P-21, " 10.8 8.2 3.9 2.9 3.6 6.2 7 .8 7.5 102.8 3 .3 5.8 r
P-22, !I 14.0 13.5 6 .9 5.2 7.1 12.5 11.7 12.8 105.4 4.5 5 . 8 1 $ I
SampleNo. 0 .5NNH4F and s o i l group pH 7.2 pH 8.2
Bray's No. 1 a t va r ious s o i l : e x t r a c t a n t r a t i o Bray
1 : 7 1:10 1:20 1:30 1:40 1:50 No.2
6 . 8 4 .5 6 .4 9.6 11.5 22.7 131.0 7.9 6 . 3 6 .1 9 .6 9 .6 16.9 60.1
24.5 21.5 34.6 35.7 37.0 56.5 171.0 10.9 11.3 17.2 24.8 21.9 35.9 147.5
3 .3 4 .7 6.4 12.0 10.6 19.9 99.8 2 . 7 3.5 4 .4 9 . 8 8 .9 15.0 108.0 4.4 4.8 7.8 12.9 10.6 16.9 67 .3 2.9 3.4 5.0 7 .7 6 . 9 10.7 58.0
Resin Olsen
adsorp t ion
C.C. WANG, I. J . FANG AND L.S. ROBERTSON
TABLE VI. Soil P (ppm) extracted with various methods from soils at sites showing p response of field experiments.
pH 7.2 pH 8.2
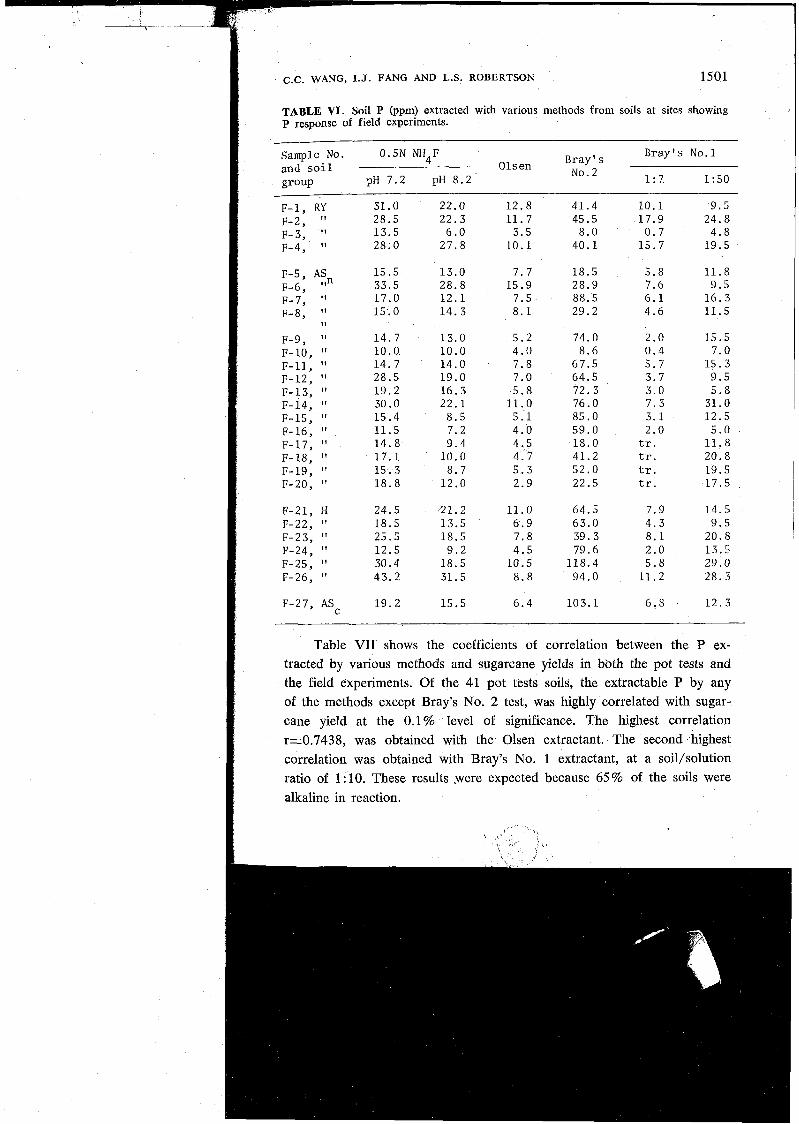
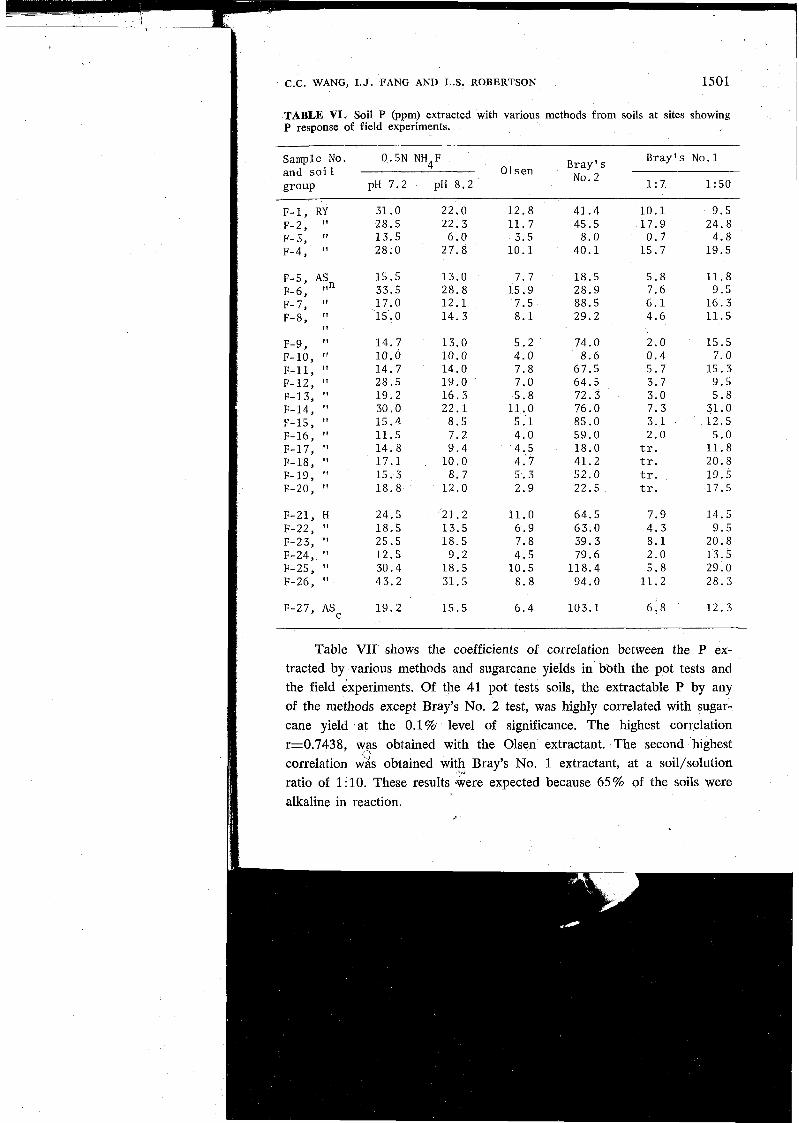
Table VII shows the coefficients of correlation between the P ex- tracted by various methods and sugarcane yields in bbth the pot tests and the field experiments. Of the 41 pot tests soils, the extractable P by any of the methods except Bray's No. 2 test, was highly correlated with sugar- cane yield at the 0.1% level of significance. The highest correlation r=0.7438, was obtained with the Olsen extractant. The second highest correlation was obtained with Bray's No. 1 extractant, at a soil/solution ratio of 1 : 10. These results *were expected because 65 % of the soils were alkaline in reaction.
C.C. WANG, I.J. FANG AND L.S. ROBERTSON 1501
TABLE VI. Soil P (ppm) extracted with various methods from soils at sites showing p response of field experiments.
Sample No. 0.5N NH4F Bray s Bray's No.1 and s o i l Olsen
pH 7.2 pH 8 . 2 No. 2
group 1 : 7 1:50
F-1, RY 31.0 22.0 1 2 . 8 41.4 1 0 . 1 9 . 5 F-2, ' I 28.5 2 2 . 3 1 1 . 7 45.5 17 .9 24 .8 F-3, I 1 13 .5 6 . 0 3.5 8 . 0 0 . 7 4.8 F-4, I 1 28.0 27 .8 10 .1 4 0 . 1 1 5 . 7 19 .5
F-5, AS 15 .5 13 .0 7 . 7 1 8 . 5 5 . 8 1 1 . 8 F-6, ' ln 33.5 2 8 . 8 1 5 . 9 28 .9 7.6 9 . 5 F-7, I 1 17 .0 1 2 . 1 7.5 88.5 6 . 1 1 6 . 3 F-8, l 1 15 .0 1 4 . 3 8 . 1 29.2 4 . 6 11.5
I I
F-9, I ' 1 4 . 7 1 3 . 0 5 . 2 74.0 2.0 15 .5 F-10, I' 1 0 . 0 1 0 . 0 4 . 0 8.6 0 . 4 7.0 F-11, ' I 1 4 . 7 14 .0 7 . 8 6 7 . 5 5 . 7 1 5 . 3 F-12, I' 2 8 . 5 19 .0 7.0 6 4 . 5 3 .7 9 . 5 F-13, l 1 1 9 . 2 1 6 . 3 5 . 8 72 .3 3.0 5 . 8 F-14, I ' 30.0 2 2 . 1 1 1 . 0 76.0 7 . 3 31.0 F-15, l 1 1 5 . 4 8 . 5 5 . 1 85 .0 3 . 1 1 2 . 5 F-16, " 11 .5 7.2 4 .0 59 .0 2 . 0 5 . 0 F-17, l 1 1 4 . 8 9 . 4 4 . 5 1 8 . 0 t r . 1 1 . 8 F-18, ' I 1 7 . 1 1 0 . 0 4 . 7 41.2 tr . 20.8 F-19, " 1 5 . 3 8 . 7 5 . 3 5 2 . 0 t r . 19 .5 F-20, I ' 1 8 . 8 1 2 . 0 2 . 9 22.5 t r . 17 .5
F-21, H 24.5 '21.2 11 .0 64 .5 7.9 14 .5 F-22, l 1 18 .5 1 3 . 5 6 . 9 6 3 . 0 4 . 3 9 . 5 F-23, I' 25.5 1 8 . 5 7 .8 3 9 . 3 8 . 1 20.8 F-24, ' I 12 .5 9 .2 4 . 5 79.6 2.0 13 .5 F-25, l 1 30.4 18.5 1 0 . 5 118 .4 5 . 8 29.0 F-26, l 1 4 3 . 2 31.5 8 . 8 94 .0 1 1 . 2 2 8 . 3
F-27, ASc 1 9 . 2 1 5 . 5 6 . 4 103 .1 6 :8 1 2 . 3
Table VII shows the coefficients of correlation between the P ex- tracted by various methods and sugarcane yields in bbth the pot tests and the field experiments. Of the 41 pot tests soils, the extractable P by any of the methods except Bray's No. 2 test, was highly correlated with sugar- cane yield at the 0.1% level of significance. The highest correlation r=0.7438, was obtained with the Olsen extractant. The second highest correlation wds obtained with Bray's No. 1 extractant, at a soil/solution ratio of 1: 10. These results ;\;rere expected because 65% of the soils were alkaline in reaction.
J
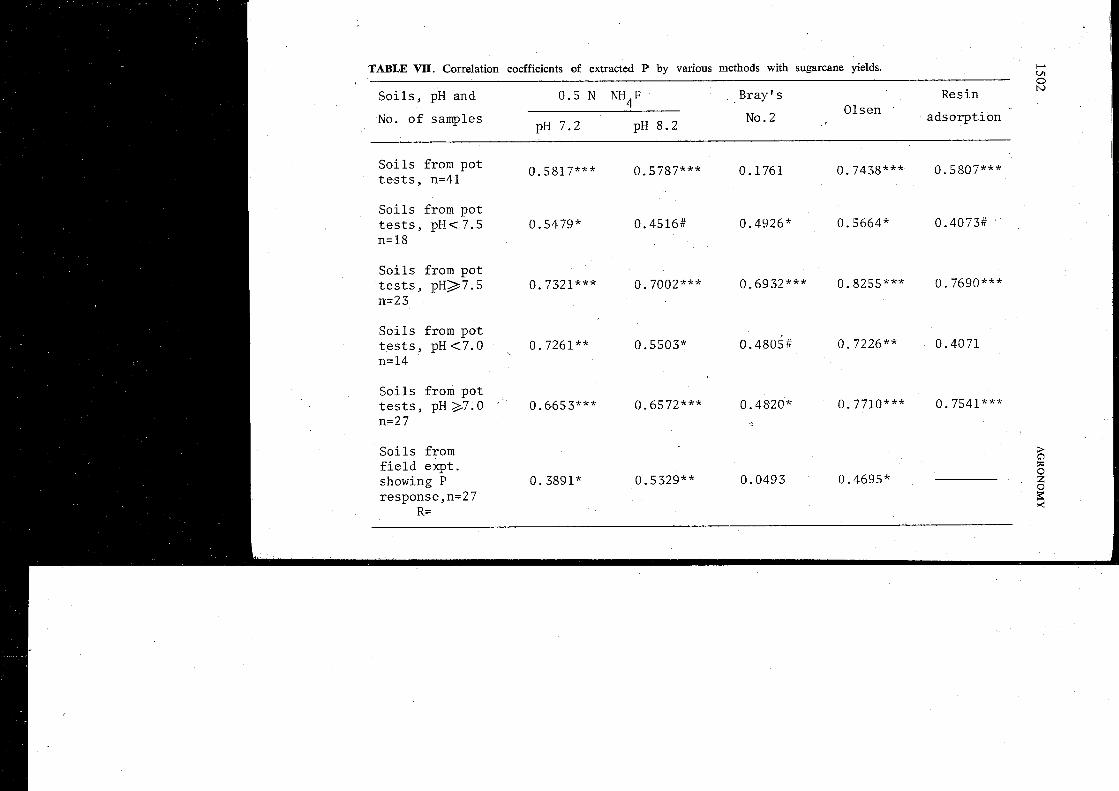
TABLE W. Correlation coefficients of extracted P by various methods with sugarcane yields.
S o i l s , pH and 0 .5 N NH,F Bray' s Resin - A 4 Olsen No. o f samples No. 2 a d s o r p t i o n pH 7.2 pH 8 .2
S o i l s from p o t 0.5817*** 0.5787*** 0.1761 t e s t s , n=41
S o i l s from p o t t e s t s , pH< 7 .5 0.5479* 0.4516# 0.4926* 0.5664* 0.4073# n=18
S o i l s from p o t t e s t s , p H 2 7 . 5 0.7321*** 0.7002*** 0.6932*** 0.8255*** 0.7690*** n=23
S o i l s from p o t t e s t s , pH (7.0 0.7261 ** 0.5503* 0.4805# 0.7226** 0.4071 n=14
S o i l s from p o t t e s t s , pH 2 7 . 0 0.6653*** 0.6572*** 0. 4820* 0.7710*** 0. 7541X** n=2 7
S o i l s from f i e l d exp t . showing P 0.3891* 0.5329** 0.0493 0.4695* response,n=27
R=
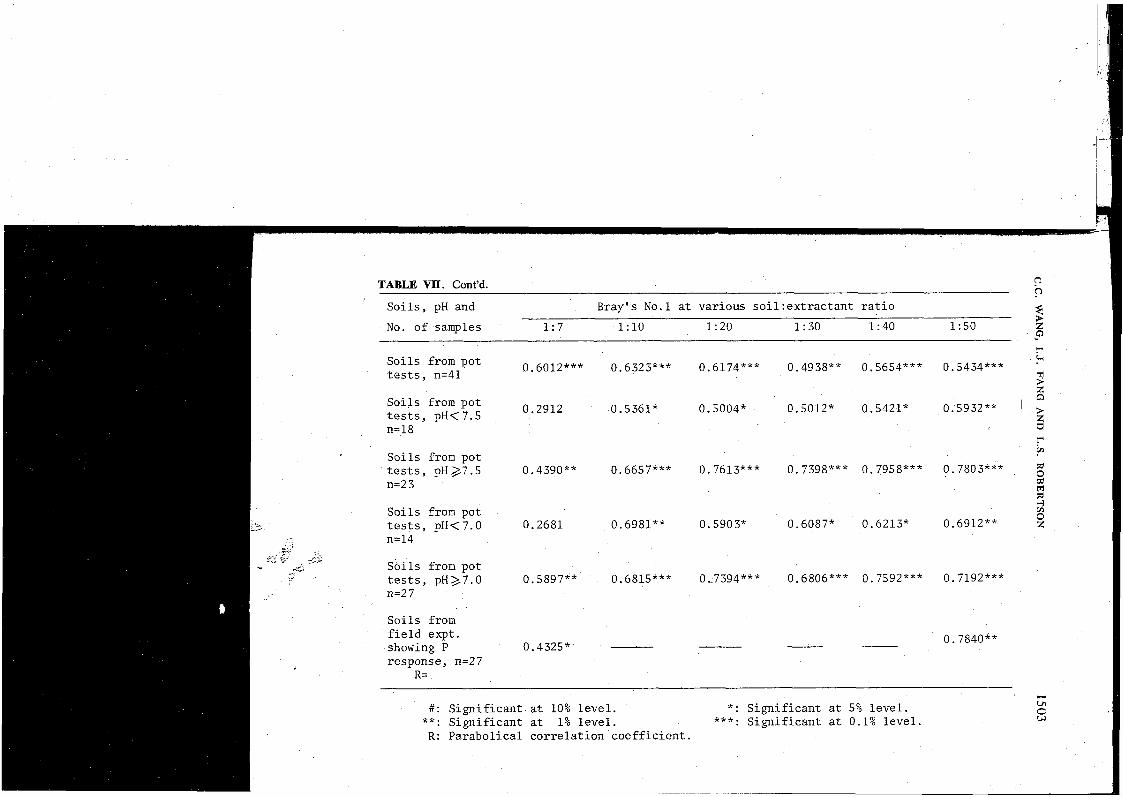
TABLE VII. Cont'd. I
S o i l s , pH and Bray's No.1 a t va r ious s o i 1 : e x t r a c t a n t r a t i o
No. o f samples 1 : 7 1 : l O 1:20 1:30 1:40 1 : 50 3 2
S o i l s from po t 0.6012*** 0.6323*** 0.6174*** 0.4938** 0.5654*** 0.5434*** 9
t e s t s , n=41 +- w
S o i l s from po t t e s t s , pHC7.5 0.2912
S o i l s from f i e l d expt . 0. 7840X* showing P 0.4325* response, n=27
R=
C
#: S i g n i f i c a n t a t 10% l e v e l . *: S i g n i f i c a n t at 5% l e v e l . ul 0
**: S i g n i f i c a n t a t 1% l e v e l . ***: S i g n i f i c a n t a t 0.1% l e v e l . W
R: Pa rabo l i ca l c o r r e l a t i o n c o e f f i c i e n t .
1504 AGRONOMY
When the soils in the 41 pot tests were grouped into four pH classes ( < 7.0, > 7.0, < 7.5, > 7.5) different coefficients were obtained. The results can be summarized as follows:
1 . The highest correlation between soil extractants and yield was obtained with the Olsen method irrespective of pH level.
2 . With the Bray's No. 1 test, the correlation coeificients were somewhat increased when the soil to solution ratios were increased, especially for those soils with a pH greater than 7.5. This agrees with the work of Smith et UP. The coefficients, however, were not as high as those involving the Olsen %extract. For soils with a pH of less than 7.0, the highest cor- relation coefficient was obtained at a 1 : 10 soil: solution ratio with Bray's No. 1 extract.
3 . Bray's P2 extractant was significantly correlated with sugarcane yields in the pot tests, but the coefficients were lower than some of those obtained Mtith the PI extract and lower than all of those obtained with the Olsen extract.
4 . The resin adsorption-P was correlated best with yield response on soils with a pH level in excess of 7.0.
5 . Reasonably high, and statistically significant, correlation coef- ficients were obtained with the NH4F solutions. Regardless of soil pH, the highest correlation coefficients were obtained with the NH4F adjusted to pH 4.2. This is probably due to the fact that an alkaline fluoride solution extracts more Al-P and Fe-P at pH 7.2 than' at 8.2.
The analysis of the 41 pot tests suggests that Olsen's test and Bray's No. 1 test with a soil: solution ratio of 1: 10 were in general reasonably correlated with the available P levels in the soils of TSC's plantations.
When correlations were made beheen the extractable P from field soil and the percentage yield of sugarcane on 27 sites showing P responses, the following results were obtained:
1 . As the pH values of the 27 sites showing *P responses did not all indicate alkaline reactions, the Olsen extraction waslnot highly correlated with percentage yield as was the case in pot tests.
2 . With the NH4F extraction, the coefficients from field tests were decreased by comparison with those of pot tests.
3 . Bray's No. 2 P extractant showed an extremely low correlation coefficient of Rz0.0493.
4 . Bray's No. 1 extractable P was determined only at soil to solution ratios of 1 :7 and 1 :50. Bray's PI extractant at 1 :50 soil to solution ratio
C.C. WANG, I.J. FANG AND L.S. ROBERTSON
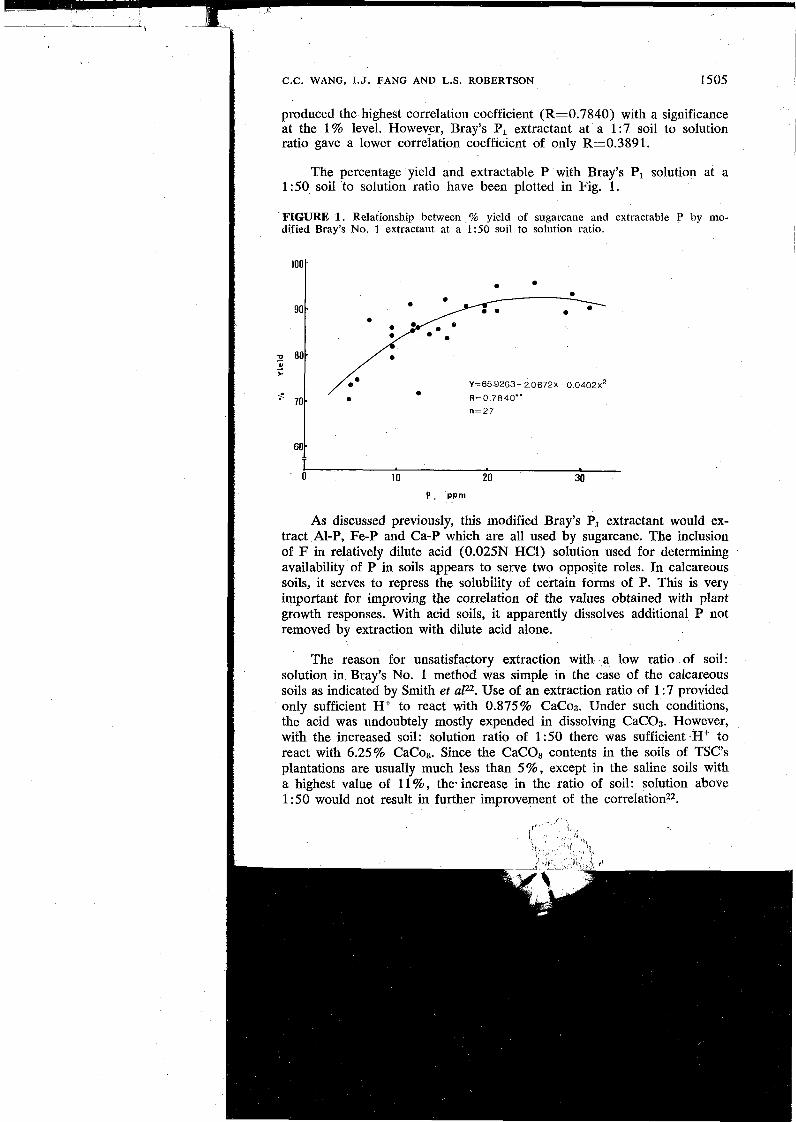
I produced the highest correlation coefficient (R=0.7840) with a significance at the 1% level. However, Bray's P1 extractant at a 1:7 soil to solution ratio gave a lower correlation coefficient of only Rr0.3891.
I The percentage yield and extractable Y with Bray's PI solution at a 1 :50 soil to solution ratio have been plotted in Fig. 1.
I FIGURE 1. Relationship between % yield of sugarcane and extractable P by mo- dified Bray's No. 1 extraclant at a 1:50 soil to solution ratio.
As discussed previously, this modified Bray's P, extractant would ex- tract A1-P, Fe-P and Ca-P which are all used by sugarcane. The inclusion of F in relatively dilute acid (0.025N HCI) solution used for determining availability of P in soils appears to serve two opposite roles. In calcareous soils, it serves to repress the solubility of certain forms of P. This is very important for improving the correlation of the values obtained with plant growth responses. With acid soils, it apparently dissolves additional P not removed by extraction with dilute acid alone.
The reason for unsatisfactory extraction with a low ratio of soil: solution in Bray's No. 1 method was simple in the case of the calcareous soils as indicated by Smith et ~ 1 2 ~ . Use of an extraction ratio of 1 :7 provided only sufficient Hf to react with 0.875% CaCoa. Under such conditions, the acid was undoubtely mostly expended in dissolving CaC03. However, wiih the increased soil: solution ratio of 1 :50 there was sufficient H+ to react with 6.25% CaCoa. Since the CaC03 contents in the soils of TSC7s plantations are usually much less than 5%, except in the saline soils with a highest value of 11 %, the. increase in the ratio of soil: solution above 1 : 50 would not result in further improvement of the c~rre la t ion~~.
1506 AGRONOMY
It seems logical to conclude that modified Bray's PI extractant at a soil to solution ratio of 1 :50 would be the best choice for evaluating soil P that is available to sugarcane.
The quantity of each form of P removed from the soil by sugarcane varied with the soil group. A1-P was the form removed in the smallest amount ranging from 3.4 ppm to 8.0 ppm. However, if the amount of A1-P removed is expressed as a percentage of the original A1-P content, Al-P becomes the form removed in the greatest amount by cropping with sugar- cane. The. average value for'. the six soil groups was 25.4% .
I , ? .i A second important source of P taken up by sugarcane was Fe-P
which averaged 20.4% for the six soil groups. The Fe-P was most abundant in the RY soil, the highest removable percentage occurred in R soils.
Ca-P was also removed by cropping and averaged 13.2%. Although the average levels of Ca-P in R and RY soil groups were lower than in the other soil groups, the percentage of Ca-P removed by cropping was highest in the two strongly weathered soil groups.
In the RY soils, the Red-P was most abundant. The highest percentage of Red-P removed by sugarcane occurred in the R soil group. On the average, 13.5 % of the Red-P was removed by one cropping.
If the amounts of Ca-P and Fe-P are expressed as a percentage of total P removed, the Ca-P was removed in largest amounts from the calc- areous soils and the Fe-P from the acid soil.
Clearly, all of the four forms of P are important in sugarcane pro- duction, but the Al-P and Fe-P are, no doubt, the most important sources of P utilized by sugarcane.
Of the 212 field P experiments conducted by this Institute in the past 10 years, only 27 sites. showed a statistically significant yield response to P fertilization. Correlation analysis demonstrated that the modified Bray's No. 1 extractant at a soil: solution ratio of 1 :50 was highly correlated with sugarcane yield or percentage yield at the 0.1% and 1% levels of signif- icance, in pot tests and field experiments, respectively. The results of these investigations are in agreement with previous work which suggested that, when a dilute acid-fluoride solution is used at a high extraction volume ratio, it extract% Al-P, Fe-P and Ca-P. This inlproves the correlation between extractable P and yield responses. Therefore, the Bray's No. 1 extractant at a soil/solution ratio of 1:50 is proposed as the best testing method for evaluating the P status in the soil of Taiwan's sugarcane fields.
I C.C. WANG, I.J. FANG AND L.S. ROBERTSON
REFERENCES
1 . Al-Abbas, A.H. and S.A. Barber. (1964). A soil test for phosphorus based upon fractionation of soil phosphorus: I. correlation of soil phosphorus fraction with plant-available phosphorus. SSSAP 28 : 21 8-221.
2 . Amer, F., D.R. Bouldin, C.A. Black and F.R. Duke. (1955). Characterization of soil phosphorus by anion exchange resin adsorption and psz-equilibration. Plant and Soil VI, 4:391-408.
3 . Anderson, M.S. and W.M. Noble. (1937). Comparison of various chemical quick tests on different soils. U.S.D.A. Misc. Pub. 259.
4 . Bhangoo, M.S. and F.W. Smith. (1957). Fractionation of phosphorus in Kansas soils and its significance in response of wheat to phosphate fertilizers. Agron. J. 49:354-358.
5 . Bray, R.H. and S.R. Dickman. (1941). Adsorbed phosphates in soils and their relation to crop responses. SSSAP 6:3 12-320.
6 . Bray, R.H. and L.T. Kurtz. (1945). Determination of total, organic and available forms of phosphorus in soils. Soil Sci. 59:39-45.
7 . Breland, H.L. and F.A. Sierra. (1962). A comparison of the amounts of phos- phorus removed from different soils by various extractants. SSSAP 26:348-350.
8 . Chang, S.C. and M.L. Jackson. (1957). Fractionation of soil phosphorus. Soil Sci. 84: 133-144.
9. Chang, S.C. and S.R. Juo. (1963). Available phosphorus in relation to forms of phosphate in soils. Soil Sci. 95:91-96.
10. Chirikov, F.V. and V.V. Volkova. (1945). The availability to plants of different forms of soil phosphate. (Abstract) Soils and Fertilizers 8:78-79.
11. Cho, C.M. and A.C. Caldwell. (1959). Forms of phosphorus and fixation in soils. SSSAP 23 :458-460.
12. Chu, W.K. and S.C. Chang. (1960). Forms of phosphorus in the soils of Taiwan. J. of the Society of Chinese Agron. Vol. 30:l-12.
13. Dean, L.A. (1938). An attempted fractionation of the soil phosphorus. J. Agr. Sci. 28 :234-246.
14. Dunbar, A.D. and D.E. Bake. (1965). Use of isotopic dilution in study of inorganic phosphorus fractions &om different soils. SSSAP 29:259-262.
15. Fife, C.V. (1959). An evaluation of ammonium fluoride as a selective extractant for Al-bound soil phosphate. I. Preliminary studies on non-soil system. Soil Sci. 87~13-21.
16. Fife, C.V. (1959). An evaluation of ammonium fluoride as a selective extractant for Al-bound soil phosphate. 11. Preliminary studies on soils. Soil Sci. 87:83-88.
17. Fife, C.V. (1962). An evaluation of ammonium fluoride as a selective extractant for Al-bound soil phosphate. 111. Detailed studies on selected soils. Soil Sci. 93:113-123.
18. Fife, C.V. (1963). An evaluation of ammonium fluoride as a selective extractant for Al-bound soil phosphate. IV. Detailed studies on soils. Soil Sci. 96: 112-120.
19. Olsen, S.R., C.V. Cole, F.S. Watanabe and L.A. Dean. (1954). Estimation of available phosphorus in soil by extraction with sodium biocarbonate. U.S.D.A. Circ. 939.
20. Petersen, G.W. and R.B. Corey. (1966). A modified Chang and Jackson procedure for routine fractionation inorgknic phosphates. SSSAP 30:563-565.
21. Smith, A.N. (1965). The supply of soluble phosphorus to wheat plant from inorganic soil phosphorus. Plant and Soil 22: 3 14-3 16.
22. Smith, F.W., B.G. Ellis and J. Grava. (1957). Use of acid fluoride solutions for the extraction of available phosphorus in calcareous soils and in soils to which rock phosphate has been added. SSSAP 21:400-404.
23. Susuki, A,, K. Lawton and E.C. Doll. (1963). Phosphorus uptake and soil tests as related to forms of phosphorus in some Mich. soil. SSSAP 27:401-403.
24. Yuan, T.L., W.K. Robertsoti, and J.R. Neller. (1960). Form of newly fixed phosphorus in three acid sandy soils. SSSAP 24:447-450.
AGRONOMY
COMPUESTOS DE FOSFORO EN LOS SUELOS Y SU DISPONIBILIDAD PARA LA CARA DE AZUCAR
C.C. Wang, I.J. Fang y L. S. Robertson
RESUMEN
El estudio que se informa se diseiio para evaluar 10s compuestos de P que remueve la caiia del suelo, medir 10s rendimientos de caiia en respuesta a aplicaciones de P y desarrollar un metodo de ex- tracci6n para determinar el P en 10s suelos que se utilizan para la production de caiia.
Se encontro que una cosecha de caiia remueve AI-P en menores cantidades que otros compuestos de P en el suelo y con la menor variacibn, irrespectiva del tip0 de suelo. Sin embargo, cuando la cantidad de AI-P removidos se explica en terminos de porciento del nivel original se convierten en la mayor con un promedio de 25.4 porciento fluctuando desde 37.9 porciento en el grado de suelos AS, hasta 20.0 porciento en el grupo AS, la cosecha de caiia removio 20.4 porciento de Fe-P, 13.3 porciento de Ca-P y 13.5 porciento de Red-P.
El Fe-P y el Ca-P con 10s compuestos que mas comunmente remueve la caiia en suelos acidos y calcareos, respectivamente, cuando la magnitud de la remoci6n se expresa en terminos de por- ciento de P total removido.
Aparentemente, todos 10s cuatro compuestos de P en el suelo estan disponibles en la caiia. El At-P y el Fe-P fueron las fuentes mayores de P utilizadas psr la caiia.
Se encontr6 una correlaci6n alta entre el P del suelo extraido por el metodo modificado de Bray NLim. 1 en una soluci6n de 1:50 y Ios rendimientos de caiia en tiestos y bajo condiciones de campo eon niveles de confiabilidad estadistica de 0.1 y 1 %, respectivamente. Por lo tanto, se recomend6 el uso del metodo modificado (Bray Nljm. 1) en los de plantaciones de TSC como prActicas rutinarias.