stability of phosphorus forms in dairy-impacted soils under
TRANSCRIPT

ELSEVIER Ecological Engineering 5 (1995) 209-227
ECOLOGICAL ENGINEERING
Stability of phosphorus forms in dairy-impacted soils under simulated leaching
H.D. Wang a, W.G. Harris b.., K.R. Reddy b, E.G. Flaig c
a Lan Associates, Inc., 17 Cordoca Street, St. Augustine, FL 32084, USA b Soil and Water Science Department, 2169 McCarty Hall, Unicersity o f Florida, Gainesuille, FL 32611,
USA c South Florida Water Management District, P.O. Box 24680, 3301 Gun Club Road, West Palm Beach,
FL, USA
Abstract
Dairy manure has been linked to elevated phosphorus (P) levels in surface waters of Lake Okeechobee basin. Prevalent soils of the basin (Aquods) retain little P in sandy, quartz-dominated upper horizons, and lateral P transport is favored by high water tables. The stability of manure-derived P forms is thus an important factor in the Okeechobee basin and other regions where soil and hydrologic factors are unfavorable for P retention. The objectives of this study were to determine (1) the forms of P in four dairy impacted soils and one associated stream sediment, (2) the forms lost most readily following disturbance and simulated leaching, and (3) the effect of residence time prior to a leaching event on the relative amount of P released. Samples included four Ap horizons from holding areas and a stream sediment from one of the dairy sites. All samples (500 g) were packed in columns and leached with synthetic rainwater at 0.4 ml /min for 6 h weekly. Concentrations of P, Ca, Mg, AI, and Fe in the leachate, along with pH and electrical conductivity (EC) were determined. The form of solution P for selected leachates was also evaluated using 3tp NMR spectroscopy. Samples before and after leaching were subjected to P fractionation. Results of P-fractionation, solution speciation, and 3tp NMR indicated that P lost from surface horizons during leaching was dominantly in inorganic forms associated with Ca and Mg. Leachates of soil horizons contained much higher levels of P than did those of the sediment, despite comparable total-P levels. Recalcitrance of the sediment P probably relates to its dominant form, determined in a related study to be a poorly-crystalline apatite-like mineral; soil horizons contained no detectable crystalline P. However, specia-
Paper presented at the workshop on Phosphorus Behavior in the Okeechobee Basin, sponsored by the south Florida Water Management District and the University of Florida, Institute of Food and Agricultural Sciences.
" Corresponding author.
0925-8574/95/$09.50 © 1995 Elsevier Science B.V. All rights reserved SSDI 0925-8574(95)00047-X

210 H.D. Wang et al . / Ecological Engineering 5 ~1995) 209-227
tion modelling indicated that leachates were supersaturated with respect to hydroxyapatite, and in most cases to metastable Ca-P forms. Lack of crystalline Ca-P could be related to kinetics, or to a poisoning effect of components such as Mg, Si and organic acids in the dairy soil system. Elimination of the "barrier" to Ca-P crystallization could reduce the leaching of P from dairy systems.
Keywords: Soil contamination; Phosphorus fractionation
1. Introduction
Dairy farming and beef cattle ranching in the Lake Okeechobee watershed have been identified as the major contributors of P to Lake Okeechobee (Joyner, 1971; Allen et al., 1976; Fonyo and Flaig, 1995). Federico et al. (1981) estimated that about 28% of the total P input to Lake Okeechobee was attributed to the Taylor Creek-Nubbin Slough (TCNS) watershed, although this watershed covers only about 4% of the surface area of the Lake Okeechobee Basin and supplies only about 5% of the total water input. The high P concentration and load of TCNS watershed are associated with dairy farming along Otter Creek, Nubbin Slough, and Mosquito Creek tributaries (Allen et al., 1976; Federico, 1977; Stewart et al., 1978). Ritter and Alien (1982) showed that stream-flow P concentration decreased immediately when a nearby-upstream dairy farm near Otter Creek closed opera- tions, which indicated that the dairy was a major P contributor. Total P content of dairy-affected soils can range up to several g kg-I for holding areas of dairies in Okeechobee Basin (Nair and Graetz, 1991).
Transport of P from dairy to receiving waters in the basin is exacerbated by unfavorable soil and hydrologic conditions (Allen, 1988). The local climate favors intensive leaching; the basin receives about 125 cm of rainfall per year (Macvicar, 1981). Retention of P by soils is dependent on properties such as texture, clay mineral species, soil pH and other properties. Most dairies in Okeechobee County are located on soils classified as Aquods (suborder of Spodosols, Soil Survey Staff, 1975). These soils are characterized by sandy textures, shallow fluctuating water table which seasonally approaches the soil surface, and the presence of an E-Bh horizon sequence below the surface (Ap) horizon. The E horizon, dominantly uncoated quartz sand, has minimal affinity for P. Thus, high water tables increase the potential for P transport to surface water to the extent that lateral flow to streams and canals occurs through the E horizon (Allen, 1988).
Prediction of long term P retention in dairy-affected surface horizons of Aquods requires knowledge of the nature and stability of phases with which P is associated. This study assessed the stability of P forms from leached surface soil horizons which have been intensively loaded with cow manure from long-term dairy opera- tions. It simulates a "worst-case" scenario in which the material has been dis- turbed, as by land-spreading or spoil deposition. Specific objectives were to determine (1) the forms of P in four dairy impacted soils and one associated stream sediment, (2) the forms lost most readily following disturbance and leaching

H.D. Wang et al. /Ecological Engineering 5 ¢ 1995) 209-22 7 211
with simulated rain, and (3) the effect of incubation time prior to a leaching event on the relative amount of P released.
2. Materials and methods
2.1. Weekly cyclic incubation and leaching
Soils and sampling Surface-soil samples (Ap-horizons) from four high-intensive dairy holding areas
(Sites 1 through 4) in Okeechobee Basin, along with a stream sediment sample from Site 2 were used in the study (Fig. 1). The sites were judged to be representative for the area based on soils and dairy management practices. The dominant soils for all sites are Aquods; the P forms by horizon were characterized for Sites 1, 2 and 4 (see Graetz and Nair, 1995). Samples have relatively high organic C (45 to 72 g kg -~) contents (Reddy et al., 1993). Ap-horizons have high pH (8.0 and above), reflecting the influence of manure on the originally-acidic native soils at Sites 3 and 4; Sites 1 and 2 had also received CaCO3-rich fill material. Three 25 cm bucket-auger samples of Ap-horizon material within a radius of approximately 50 cm were collected from two locations within each high-intensity area. Samples within the 50-cm radius were combined, such that there were two samples from each holding area. Two undisturbed cores (0 to 20 cm) were also taken within each 50-cm radius for bulk density and moisture content determination. The stream sediment was sampled at depth increments of approximately 0-20 and 20-40 cm at the same location for which high total P was measured in a previous study (Scinto and Reddy, 1990). Soil samples were stored in plastic bags and brought back to the laboratory. Sub-samples were air-dried,
,,
Fig. 1. Location of the study area and sites.

212 H.D. Wang et al. / Ecological Engineering 5 (1995) 209-227
crushed, and sieved (2 mm). All samples within each high-intensity area were combined by thorough mixing, as were the stream sediment samples. The < 2 mm fraction was used for column leaching study. A portion of the Site 2 surface soil sample was spiked with 5 mg P /g soil in apatite form ( < 0.1 mm) and included in the study.
Soil column packing and leaching Nalgene columns (internal area = 58 cm 2 and length = 10 cm) were sealed at
the bottom with fritted glass discs (4 to 5/~m pore size). The discs were pre-soaked in 1 M HCI and 1 M NaOH in a sequence for 3 cycles to remove P or other active ions. A small volume above the discs was filled with acid-washed sand (50 g). A cup (6 cm in diameter) with perforations was placed over the column to promote an even application of simulated rainwater (see composition below). Flow rate into the column from a reservoir was controlled via flexible tubing and clamps. The assembled column apparatus was initially tested, and found to retain negligible P.
A 500-g portion of each soil sample ( < 2 mm) in duplicate was moistened to the mean original field water content (28.5% by weight), and packed in a column to a density of about 1.3 g cm -3 (a mean value for the in situ densities). A P t redox electrode (5 cm in length) was inserted through the side wall into the middle of the soil column. Flow rate of synthetic rain through each column was controlled at about 0.4 ml/min during the leaching, which occurred once a week for 6 h. Each weekly leachate volume was approximately equivalent to 0.8 fractional pore vol- ume. A suction ( - 600 cm water) was introduced at the bottom of each soil column to promote leaching. A total amount of water equivalent to 1/3 of average annual precipitation (42.3 cm or 2.4 L) (Macvicar, 1981) was leached through each soil column in a 17-week period (real time simulation).
Chemical analyses Sample Eh values in soil columns were measured before each leaching cycle.
Leachates were analyzed for P, AI, Fe, Mg, Ca, pH, and electrical conductivity (EC). Leachate P was determined before (Pi) and after (Pt) organic matter digestion, the difference (Pt-Pi) being taken as organic Po. The organic digestion was accomplished using a modified ignition method (Olsen and Sommers, 1982). Leachate samples (10 ml) were oven-dried, then ashed at 550°C for 1 h. Each sample was moistened with drops of 6-M HNO 3, dried on a hotplate, heated at 500°C for 15 min, and dissolved in 0.1 M HCI solution for analysis. Phosphorus was determined using an ascorbic acid colorimetric method (John, 1970) and AI, Fe, Mg, and Ca were determined by atomic absorption spectrophotometry.
Ion activity products calculation The P, AI, Fe, Mg, Ca, pH, and EC values of selected (1st, 6th, 12th, and 17th
week) leachates were used to model speciation via the MINTEQA2 program under an open system (Allison et al., 1991). Activity of H4SiO 4 was assumed to be controlled by amorphous silica (log K °= -2.74). Ion activity coefficients were

H.D. Wang et al. /Ecological Engineering 5 (1995) 209-227 213
calculated according to Davies equation, using ionic strengths of leachates calcu- lated from EC based on the following conversion (Griffin and Jurinak, 1973):
I -- 0.0127 EC
where, I = ion strength (mol/l). Activity products of HPO42- with Ca ~÷ or Mg 2÷ were calculated for selected
leachates, plotted as a function of pH, and related to solubility lines for Ca- and Mg-phosphate minerals (Lindsay, 1979).
Selected leachates from Site 3 were concentrated in a vacuum rotatory vaporiza- tor at 35°C and examined for P form using 31 P-nuclear magnetic resonance (NMR) spectroscopy.
2.2. Eualuation of residence time effect
The above experiment provided one incubation interval (solution residence time between leaching events). In the field residence times can vary widely, according to frequency and duration of rainfall events. The longer the residence time, the closer the soil solution would approach equilibrium. The importance of residence time as a factor depends on dissolution kinetics. Since the latter may be slow for P-minerals, we evaluated the relative effect of residence time. A simple batch experiment was conducted "parallel" to the column incubations to provide for finer increments of residence time and for comparison with the column approach. A 200-g portion of the dairy soils and stream sediment was incubated in capped plastic bottles at 28.5% moisture content and 25°C with simulated rainwater. After 1, 2, 4, 8, and 16 weeks of incubation, duplicate 12.85-g portions (equivalent to 10 g oven-dried weight) were placed in a centrifuge tube and 17.15 ml of synthetic rain water (pH 5.0) was added. The mixtures were shaken on a rotary shaker for 1 h. The solution was collected following centrifugation and analyzed for P. After an 8-month incubation, samples from Site 2 and 4 were centrifuged to collect interstitial solutions. Samples were placed in smaller centrifuge tubes which had small holes and glass wool in the bottom. The small tubes were placed inside larger tubes which were centrifuged. Solutions were analyzed for P, Ca, Mg, pH, and EC. Results were used to calculate activities of P species.
2.3. Soil chemical analyses
Chemical fractionation of soil P was conducted before and after leaching treatments by a modification of the method of Hieltjes and Lijklema (1980). This method distinguishes between loosely-bound P (1.0 M NH4Cl-extractable), Fe- and Al-associated P (0.1 M NaOH-extractable) and Ca- and Mg-associated P (0.5 M HCI- extractable). The present study substituted KCI for NH4CI and used sample- to-solution ratio of 1:30. The pre- and post-treatment status of the samples with respect to forms and abundance of P were compared. The proportions of Ca-, Al-, and Fe-P lost from the column were compared and related to the stability of discrete P phases (detected or prospective) under conditions as monitored in the

214 H.D. Wang et aL /Ecological Engineering 5 (I995) 209-227
effluent. Total P was determined for the clay fractions, as separated by centrifuga- tion, as well as for the whole soil (< 2 mm) using sodium hypobromite digestion (Dick and Tabatabai, 1977).
2.4. Composition of simulated rainwater
Simulated rainwater was prepared to simulate the chemical composition of rain typical of the region of study (U.S.G.S. Water-Resources Investigations, 1980). The composition was as follows (mg 1-1): MgC1 z, 1.1; CaCI 2, 2.9; KCI, 0.9; NaHCO 3, 2.09; NH4NO 3, 4.3. Phosphorus, Fe, and A1 were not included. The pH was adjusted to approximate that of rainwater falling close to the study sites, which averages approximately 5.0 according to a pH map based on measurements from May 4, 1978 to April, 1979 (Brezonik et al., 1983). Dilute HzSO 4 was used to adjust the solution pH, since this acid accounts for major acidity in rainfall over Florida (Brezonik et al., 1983). NaCI was used to maintain the specific conduc- tance at 0.03 dSm-t.
3. Results and discussion
3.1. Leachate pH, EC, and Eh
About 2.4 1 (equivalent to 43.3 cm precipitation and approximately 13 pore volumes) were leached through each 500 g soil column (solution:soil ratio of 4.8) over the 17-week leaching period. The pH values of the column leachates were all above 7.0, and remained much higher than the pH of simulated rainwater (5.0) throughout the leaching treatments (Table 1). The high pH is attributable to dairy, manure (Graetz and Nair, 1995), which contains alkaline components (e.g., Ca, Mg, Na, etc.).
The EC values dropped rapidly with cumulative leaching and reached more stable values after the first 10 cm (Fig. 2). The EC of leachate is a function of ionic strength, which can affect the activities of solution P and other ion species through the activity coefficient. High EC values of the initial leachates were due to initially-high concentrations of soluble Na ~ ÷ and K ~ ÷ salts associated with manure (Table 1). A rapid depletion of these salts by leaching would account for the precipitous EC drop.
The soil column redox potential (Eh) values varied over time and among soils, but were consistently positive beyond the first week. Redox data showed no relationship with leachate P concentrations.
3.2. Leachate phosphorus
Phosphorus concentration change ot;er cumulati~,e leachate Leachate P was dominantly inorganic in the four dairy soils (Fig. 3a-d). The 31p
NMR spectra for the second week leachate of the Site 3 soil showed that leachate

H.D. Wang et aL / Ecological Engineering 5 (1995) 209-227
Table 1
Elemental concentrations (rag/l) and pH for column leachates for week 1, 6, 12, and 17
215
Week Ca Mg Fe AI Pi Po K Na pH
mg/ l '
Site 1 1 213 325 5,6 2.0 46,5 18.0 5750 2335 9.0
6 26 43 0.4 0.1 40.6 1.0 - - 9.2
12 28 58 0 0.1 34.1 0 - - 8.6
17 23 61 0 0 28.5 2.3 137 33 8.9
Site 2 1 206 206 3.0 0.7 45.1 7.0 3950 1725 8.4
2 31 30 0.6 0.1 84.9 0 - - 8.1 12 38 58 0 0 46.4 0 - - 8.0
17 46 64 0 0 40.5 2.4 50 8 8.5
Site 3 1 206 197 1.3 1.6 75.5 5.3 2360 671 8.1
6 36 52 0.4 0.l 91.6 0 - - 7.7
12 37 59 0 0 54.1 3.0 - - 7.8
17 44 65 0 0 45.5 3.0 38 9 7.5
Site 4 1 191 168 0.4 0.2 78.6 5.2 1395 404 7.6 6 34 44 0.4 0 79.2 0 - - 7.9
12 69 77 0 0 58,8 1.2 - - 7.3
17 70 69 0 0 44.9 2,6 14 7 7.6
Stream I 920 188 0.2 0.2 1.4 4.8 347 307 7.4
6 36 9 0.4 0.1 3.5 0.4 - - 8.1
12 34 10 0 0 4.2 0.2 - - 7.5
17 44 11 0 0 4.6 0.1 30 2 8.2
P was mainly 0rthophosphate (not shown), corroborating the fractionation results with respect to dominance of inorganic forms. The stream sediment leachate, with low total leachate P concentration, had more organic- than inorganic P in the initial few leaching cycles (Fig. 3e). The leachate inorganic P concentrations increased from the first week to the second week in Site 3 and Site 4 soils and to the third week in Site 1 and Site 2 soils. After the second or third week, both inorganic P and organic P concentrations decreased gradually with cumulative leachate for all dairy soils (Fig. 3a-d). However, inorganic P leached from the stream sample increased with successive leaching events (Fig. 3e).
Possibly, the initial increase in leachate P concentration is related to the thickness of the electric double-layer as affected by ionic strength. Surface adsorp- tion of P at the beginning of the study may have been fostered by double-layer compression at high ionic strength, permitting closer approach of anionic or-

216 H.D, Wang et al. /Ecological Engineering 5 (1995) 209-227
25
t Sit== 1
/
| Sit == 2 ÷lDatlt==
~ Stream
~ 1 5 - I ~ : ÷
~ Sit== 4
I .
0 10 20 30 40 50 Cumulative leachate (crn)
Fig. 2, Leachate electric conductivity (EC) and cumulative leachate relationship.
thophosphate to surfaces. An initial upward trend in leachate P concentration could then be explained by double-layer expansion related to decreasing ionic strength with leaching of salts, which would decrease surface access for P and increase its mobility. Subsequent decreases in ieachate P concentration would result from depletion of the most soluble forms of P.
The leachate organic P (Po) decreased gradually from the first or second week of leaching to an undetectable limit within a few weeks. Higher organic P in the first few weekly leachates may be due to high humic acid content indicated by darker brown color. With time, the color became clearer.
Leachate P leL, els and soil P phase relation The P concentrations in leachates of dairy soils ranged from 20 to 150 mg 1-:
over the 17-week period, but those of the stream sediment ranged only from 1 to 7 mg l - t (Fig. 3). Leachate P concentrations of the stream sediment were signifi- cantly lower (p < 0.0001) than any of the dairy soils although the total P content of the stream sediment was comparable to that of the Site 3 and Site 4 soils (Table 2). Lower leachate P in the stream sediment reflects the dominance of a less soluble P phase. A sand-sized, apatite-like mineral was previously detected in the stream sediment (Harris et al., 1994), and probably constitutes the recalcitrant source of P in this sample. However, no P minerals were detected in the dairy soils even though total P levels were high (> 1% in the Site 1 clay). The P in the dairy soils is dominantly in more soluble noncrystalline forms, or forms too fine or poorly crystalline for detection by x-ray diffraction. A large proportion of soil P was

ll.D. Wang et al. / Ecological Engineering 5 (1995) 209-227 217
a, Site 1. b. Site 2,
1 a 73
• n '
,= .81.. i t ~" ~ "° **
0 10 m M q ~ | 10 I I i n 40 W
Cumulative le~tchate (cm) Cumulate I ~ d ~ (~)
c, Site 3. . . d, Site 4.
i i o ~" 0
= 0.02 " 0.87 a B
a o ° ° a nan" aa o D ~ . ~ . . , a ~
a
8 " 8 ° (3 . = ~ . =
Ib =t'~'= I'D" =*="='==~"=' o o. .~; " - , " " _ _ _ _ ~ . ~ t,~, = ~.
Cumulative lea~ate (era) Cumuldve l ~ m (era)
i I-
4 $ 8_' 8 '
13. =
e. Stream. i
i e=o.=, o,~_.::=~. t p =, a o o , = , o ~ ° ° o - o
I U Ill 40 m CumulalNe luehate (era)
Inorganic a
Organic
Fig. 3. Leachate organic- and inorganic P change with cumulative lechate for soils and stream sediment.
present in the clay of the dairy soils; in contrast, total P in the clay of the stream sediment was only a small fraction of the soil P (Table 2). The higher specific ,surface (smaller particle size) of P-bearing components in holding-area soils is

218 H.D. Wang et al. /Ecological Eng,neering 5 (1995) 209-227
Table 2 Phosphorus data for soils and stream sediment used for column study
Soil Soil Clay Clay Soil P partition. %
P (p.g/g) P (p.g/g) content. % Clay Other
Site 1 3144 13234 10.7 45.1 54.9 Site 2 2119 6658 13.9 45.5 54.5 Site 3 1595 7018 8.1 35.5 64.5 Site 4 1579 6325 9.3 37.1 62.9 Stream 1707 3807 12.3 27.6 72.4
consistent with the greater reactivity of these soils. The P concentrations of leachate from the apatite-spiked sample were no greater than those of the non-spiked samples throughout the 17-week leaching (Table 1), reflecting the stability of apatite in these dairy soil systems as long as alkaline conditions prevail.
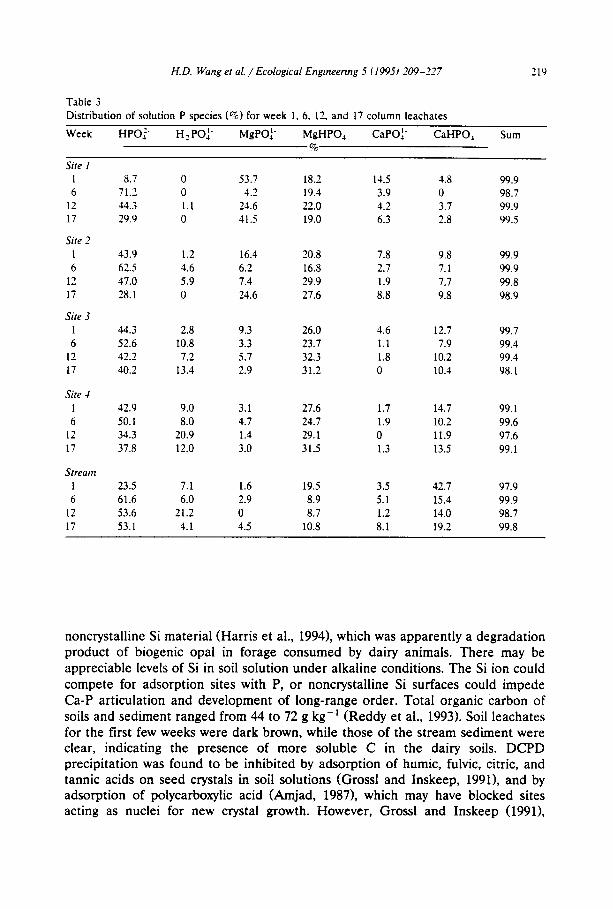
Leachate phosphorus speciation and acticity products The major solution species in leachates, as indicated by solution speciation
modelling, were UVO4-, MgPO °, CaHPO °, and H2PO ] - (Table 3). Relative abundance of species was related to pH. Species of Al- and Fe-P were not found because of the high solution pH and very low Al and Fe concentrations in the leachates (Table 1). Results show that Al- and Fe-P were not significant leachate P sources, and suggest that Ca- and Mg-P were the main P sources released during the 17-week leaching.
Leachate P activities were compared with solubility data for selected Ca- and Mg-P minerals. Most leachate samples were undersaturated for dicalcium phos- phate dihydrate (DCPD). Leachates were supersaturated with respect to /3-tri- calcium phosphate (TCP), and many with respect to octacalcium phosphate (OCP) (Fig. 4). The stream-sample leachates were slightly undersaturated for octacalcium phosphate. Many leachates were undersaturated with respect to some Mg-P minerals (Fig. 5).
The absence of Ca-P minerals could be due to the presence of significant levels of solution Mg, which can effectively inhibit the crystallization of Ca-P (Ferguson et al., 1973; Zoltek, 1974; Brown, 1981; Yadav et al., 1984). Levels of Mg in the leachate were comparable to those of Ca (Table 1), yet extractable Mg levels were orders of magnitude lower (Reddy et al., 1993). The MgZ+-inhibition effect has been ascribed to (1) masking the adsorption sites on calcite; (2) disrupting the nucleation and crystallization of P precipitates; and (3) increasing the solubility of CaCO 3 (Yadav et al., 1984). In the stream sediment, with lower pH (6.9), much more Ca was released than Mg (Table 1). Possibly Mg was not as stable as Ca at in situ pH and had previously been relatively depleted in the stream sediment, permitting apatite formation.
Other possible inhibitors of Ca-P crystallization include Si and dissolved organic carbon. Clay fractions of all soils were dominated by a manure-derived hydrated
H.D. Wang et aL / Ecological Engineering 5 (1995) 209-227 219
Table 3 Distribution of solution P species (%) for week 1, 6, 12, and 17 column leachates
Week H P O j H 2 p o t MgPO4 t MgHPO~ CaPOn CaHPO~ %
Sum
Site l | 8.7 0 53.7 18.2 14.5 4.8 99.9 6 71.2 0 4.2 19.4 3.9 0 98.7
12 44.3 1.1 24.6 22.0 4.2 3.7 99.9 17 29.9 0 41.5 19.0 6.3 2.8 99.5
Site 2 1 43.9 1.2 16.4 20.8 7.8 9.8 99.9 6 62.5 4.6 6.2 16.8 2.7 7.1 99.9
12 47.0 5.9 7.4 29.9 1.9 7.7 99.8 17 28. l 0 24.6 27.6 8.8 9.8 98.9
Site 3 1 44.3 2.8 9.3 26.0 4.6 12.7 99.7 6 52.6 10.8 3.3 23.7 1.1 7.9 99.4
12 42.2 7.2 5.7 32.3 1.8 10.2 99.4 17 40.2 13.4 2.9 31.2 0 10.4 98.1
Site 4 1 42.9 9.0 3.1 27.6 1.7 14.7 99.1 6 50.1 8.0 4.7 24.7 1.9 10.2 99.6
12 34.3 20.9 1.4 29.1 0 11.9 97.6 17 37.8 12.0 3.0 31.5 1.3 13.5 99.1
Stream 1 23.5 7.1 1.6 19.5 3.5 42.7 97.9 6 61.6 6.0 2.9 8.9 5.1 15.4 99.9
12 53.6 21.2 0 8.7 1.2 14.0 98.7 17 53.1 4.1 4.5 10.8 8.1 19.2 99.8
noncrystalline Si material (Harris et al., 1994), which was apparently a degradation product of biogenic opal in forage consumed by dairy animals. There may be appreciable levels of Si in soil solution under alkaline conditions. The Si ion could compete for adsorption sites with P, or noncrystalline Si surfaces could impede Ca-P articulation and development of long-range order. Total organic Carbon of soils and sediment ranged from 44 to 72 g kg-t (Reddy et al., 1993). Soil leachates for the first few weeks were dark brown, while those of the stream sediment were clear, indicating the presence of more soluble C in the dairy soils. DCPD precipitation was found to be inhibited by adsorption of humic, fulvic, citric, and tannic acids on seed crystals in soil solutions (Grossl and Inskeep, 1991), and by adsorption of polycarboxylic acid (Amjad, 1987), which may have blocked sites acting as nuclei for new crystal growth. However, Grossl and Inskeep (1991),

220 ll.D. Wang et al. / Ecological Engineering 5 (1995) 209-227
-13
-14
-15
- 1 0 ~ . _ .~ a, OCP i, So,ileUm -11 ~ ~ • • tp Sodlment Iome, had:o
-12 ~ w~ • • • w- m"
-7
I i I n I M I a I i I ,
-7,5
2:
~d ~5
-10
-1 &5
-55
b, TCP o • Sdl luchate
8 I~ Sediment l e e c h ~
• ~ a - o Sail eolullan
• ,I' " I I • m w = = = = I~ I I •
- - ~ • in i q ~ "
, I , , l , A ,
-6
.,e
~. -r ++
-7.5
c, Hydroxyapatite o 8 I I iiii ii I I I I I
• !! • III ai R If ' '¢ , , ,
• I i i
%" • ;,q' •
) ' • •
7
• Sall lee¢hm
I~ Sediment leachebl
o Sail ecdu~an
I i I a I i I a I i
6.5 7,5 8 8,5 9 9,5 10 pH
Fig. 4. Comparison of Ca 2÷ and HPO~- activity products of leachates to solubility lines for selected Ca-P minerals. Soil solution refers to solutions after 8 months incubation.
r e p o r t e d tha t p r ec ip i t a t i on ra tes o f O C P and H A P were even more s t rongly inh ib i t ed by so lub le ca rbon , exp la in ing the k ine t ica l ly favored fo rma t ion of D C P D vs. m o r e t h e r m o d y n a m i c a l l y s table O C P and H A P .

H.D. Wang et aL /Ecological Engineering 5 (1995) 209-227 221
,e
" r
4~
"~.5
a. Mg/P = I. Mgwmo4.~ao (n~=.~,m)
I o l i ~Nmomsm lemomme
o
o o
<~ ~ ~ ~ O
r i J I J
o
rls 8 81s ; gls ,0 pH
Fig. 5. Comparison of Mg 2+ and HPO4 z - activity products of leachates to solubility lines for selected Mg-P minerals.
Phosphorus release in a 17-week leaching The mass of P released from Site 3 and Site 4 soils were higher than amounts
released from Site 1 and Site 2 soils. Total P ranged from 1500 to over 3000 mg kg-t (Table 2), but only a portion of soil P was removed by the 17-week leaching. Much less P was released from the stream sediment than from the dairy soil samples (Fig. 6). The total mass of P released during the 17-week leaching period ranged from 200 to 400 mg P kg- ~ of total P for the dairy soils, but was only about 30 mg P kg-t for the stream sediment. Apatite-spiked sample released no more P than the non-spiked sample for the Site 2 soil during the 17-week period (Fig. 6). Little apatite-P was soluble at leachate pH > 7. Predicted P loss for one year (127 cm of leachate), obtained by extrapolating the linear portion of the curve for cumulative P in the leachate (Table 4), ranged from 66 to 969 mg kg-i . These predictions presume no further decrease in the rate of P loss from 17 weeks to 1 year. Furthermore, the released P and cumulative leachate relation was based on weekly leaching in a soil column with initial soil thickness of 6.7 crn, with fixed residence time, and following major disturbance (disruption of fabric, drying, etc.). Phosphorus release may be affected by soil depth and rate and frequency of leaching which may be different for the in situ soil conditions. Thus the total P loss

222 H.D. Wang et al. / Ecological Engineering 5 (1995) 209-227
A
r ,
| E (.)
4OO
30O
2 0 0
100
Site 1 : i~1~11 I
S I t e 2 + A ! • I~ ~.~> ; " 0 > >
Stream • • > ~ " i . ? * > >>>~ ~-
s~3 "=r > > ~ =-c
I ~ . ~ . . ~ ':A
10 20 30 40 Cumulative leaehmte (crn)
Fig. 6. Relation between cumulative P and cumulative leashate in a 17-week leaching. A = apatite.
and one year projections apply only to experimental conditions, and essentially approximate a "worst case scenario" limit.
3.3. Soil incubation time effect on phosphorus
Phosphorus in leachate of soils and stream sediment in simulated rainwater (soil:water ratio = 1:2) increased with incubation time from 1 to 16 weeks (Fig. 7). The P concentration in stream sediment was much lower than those of the four dairy soils in all incubation periods, probably because of the presence of crys- talline- rather than noncrystalline-P minerals. Soluble P increased linearly with time of incubation in all soils except for the Site 4 soil, which increased with time
Table 4 Relation between cumulative P (P) released from soil column and cumulative leachate (L) (cm), the predicted P (Pry) released after one year of leaching (127 cm) obtained from extrapolation of the linear portion of curves in Fig. 8, and the fraction of the initial P lost from the column (Pc) based on the one year prediction
Soil Relation Weeks of r 2 Ply Pf data used (rag k g - t ) (g g - t )
Site 1 P = 69.2+3.93 L 6-17 0.99 568 0.18 Site 2 P = 57.6 + 5.94 L 6-17 0.95 811 0.38 Site 2 + A p a t i t e P = 60.4+4.80 L 7-17 0.99 670 0.09 Stream P = 1.1+0.512 L 1-17 0.99 66 0.04 Site 3 P = 97.0 + 6.87 L 5-17 0.97 969 0.68 Site 4 P = 97.1 +6.61 L 6-17 0.99 937 0.59

H.D. Wang et al. / Ecological Engineering 5 (1995) ~0#- ~ 7 --3
200
150
~. 1oo
f f l
50
0 0
r = O.gl',' ~ ~m" ~
r ~ 0 . ~
r = O.gl7
" ° ° ' ° ' " ~ ° . - ° ' ' "
i r : 0.87
• P , . A © . . . . . . . . . . . . . . . . . . . . . O 5 10 15
Incubation (w~
Slte l _S~2 $1te3 81re4 St m [ ] - - , - -m- . . . . ~ .
Fig. 7. Relation between water woluble P and time of incubation in 28.5% synthetic rain water.
as a logarithmic function. The increase in soluble P with time of incubation showed that solution P levels were approaching equilibrium with the soil P phase as incubation time increased. At the 16th week incubation period, soluble P de- creased as pH increased in the four dairy soils (pH 8.0, 8.5, 9.2, and 9.5 for Site 4 to Site 1, respectively), reflecting greater P solubility at lower soil pH. The activity products of HPO 2- and Ca 2÷ for the incubated soil solutions of Site 2 and 4 all indicated supersaturation with respect to OCP and were higher than those of soil leachates. The activity products of HPO 2- and Mg 2+ were also higher than those of soil leachates when the Mg/P ratio was 3/2; but were not so when Mg/P ratio was 1 (Fig. 5). Higher phosphate activity products were probably due to lower water/soil ratio (28 g kg -t moisture content) in the mixture from which soil solution was obtained and longer time of incubation (8 months) relative to those of soil leachates.
3.4. Soil phosphorus phase change by leaching
Column leaching over 17 weeks reduced soil pH from 9.5 to 7.8, 9.3 to 7.5, 8.5 to 7.1, 8.0 to 7.0, and 6.9 to 6.6, respectively, for the Site 1 to 4 soils and the Site 2 stream sediment. The relative stability of P forms under leaching conditions should be reflected in a decrease in P fractions after leaching. The proportion of KCI-P was decreased after leaching in the soils of Sites 3 and 4, and the stream sediment sample (Fig. 8c-e). However, KCI-P was greater after leaching for the soils of Sites 1 and 2 (Fig. 8a,b). This increase, along with pH reduction, suggests that KCI-P is pH dependent for these soils. Increases in KCI-P resulted i n a reduction in subsequent HC1-P extraction.
The NaOH-P i, reported to represent AI- and FeoP (Hieltjes and Lijklema, 1980), was significantly reduced in soils of Sites 1, 3, and 4 soils, but the relative

3~ __4
NsC(H-P i
NaOH-P o
HCI-P
Reel,'t ,=l-P
H.D. Wang et al. /Ecological Engineering 5 (1995) 209-227
a. Site 1. b. Site 2.
~CI-P
NIOH-P ~
NsOH-P,
HCI,.,P
RIIIICI.III-P
E x ' o ' ~ l e P (mg/kg) ExPectable P (mglkg) 8 ~
c. Site 3, d. Slte 4.
~CI-P
NsOM-P I
NeOH-P o
HCI-P
RelOj=l-p
J
J
' i , ~ , t , i ' ,~ ,
0 I(0 200 3(0 4(0 O(0 ~¢lreu:tebie P (mg/kg)
K~I-P
NaOH-P i
NeOn-P.
HCI-P
RaOj=i.P
I(0 L=O0 300 4(0 5C~ Extre~lablo P (mg/kg)
KCI-P
NSOd-P I
N.O~,%
HCI,.P
R~duW-P
e, Stream,
J
I Before leed~lng
[ ] After leed~ing
[ ] + Ape'dte + alter Ilechlng
0 200 400 (100 800 10013 r:x'~e=teble P (r'~/kQ)
Fig. 8. The change in P levels of different fractions in soils and sediment after a 17-week leaching.
decreases were not as great as for HCI-P. Relatively high levels of NaOH-P i, particularly for the Site 3 soil, are perplexing given the very low levels of Fe and AI in the leachate. Apparently, NaOH is extracting something in addition to Fe- and AI-P from these samples, contrary to traditional fractionation interpretations.
Extractable P in the Site 2 dairy soil, after spiking with apatite and leaching for 17 weeks, was mostly recovered in HCI-P form. However, some apatite-P was lost during extraction with KCI and NaOH solutions (Fig. 8b). The KCI-P and NaOH-P i

H.D. Wang et al. /Ecological Engmeering 5 (1995) 209-227 225
for the spiked sample were all higher than those of the non-spiked sample before leaching.
HCl-extractable P was the dominant form in 3 of the 4 intensive-area samples, and the form most reduced by leaching in all samples (Fig. 8). Graetz and Nair (1995) also found a dominance of the HCI-P fraction for similar intensive-area surface horizons from the Lake Okeechobee Basin. The prevalence of Ca and Mg solution species in the leachates (reported above) is consistent with both the high initial HCl-extractable P values and the relatively-large depletion of this fraction by leaching. However, much of the HCI-P pool was still present after the 17-week leaching. This substantial residue, in conjunction with declining P levels in succes- sive leachates, indicates that there are more recalcitrant forms of P which are either present or forming. Chemical fractionation of similar samples from aban- doned dairies (Nair and Graetz, 1991) verified that high P levels can persist for years.
4. Conclusions
Leachate from disturbed Ap horizons of four dairy holding areas showed declining levels of pH, EC, and P with successive leaching. The stream sediment sample released much less P than the holding areas, despite comparable initial P contents. However, the sediment showed increasing levels of P with cumulative leachate. These holding areas vs. sediment differences are attributable to form rather than abundance of P. The P is retained in noncrystalline form in holding-area soils, but mainly in the form of a poorly-crystalline apatite-like mineral in the sediment.
The P leached from all samples was dominantly inorganic, despite relatively high organic C contents. Solution speciation and P fractionation of samples before and after leaching generally showed that P is mainly in Ca and Mg forms. The greater stability of these forms, relative to A1- and Fe-P forms, is favored by the alkaline soil conditions. However, leachate levels of P, Ca, and Mg greatly exceeded values predicted from apatite solubility, and no crystalline form of Ca-P was detected by x-ray diffraction (Reddy et al., 1993). Thus, factors which inhibit the crystallization of Ca-P are relevant concerns in attempting to control P leaching from soils highly loaded with dairy wastes. The lack of crystalline Ca-P could be related to kinetics, or to a poisoning effect of other components in the soils such as Mg, Si and soluble organic carbon.
Incubation for varying durations showed that solution concentrations signifi- cantly increased with residence time. Thus, rainfall distribution would affect the efficiency of in situ leaching. The present study probably depicts a "worst-case" condition, because (1) soil fabrics were disrupted by disturbance and (2) column lengths (6.7 cm) were less than the common thickness of Ap horizons. Nonetheless, appreciable P remained after 17 weeks of leaching. The residues, in conjunction with declining P levels in successive leachates, show that more recalcitrant forms of P are present. The rate and extent of formation for the latter are important

226 H.D Wang et al. /Ecological Engineering 5 (1995) 209-227
e nv i ronmen ta l cons ide ra t ions in O k e e c h o b e e Basin. If more stable phases could be
" e n c o u r a g e d " or " a l l o w e d " to form, leaching of P should be greatly reduced.
Acknowledgements
Fund ing for this research was provided by the South Flor ida W a t e r Manage-
m e n t District . We thank Dr. Cliff Johns ton for help in obta in ing 3Zp N M R data
and Mr. J a r e d Brown for pe r fo rming some of the chemica l analyses.
References
Allen, L.H. Jr., 1988. Dairy-siting criteria and other options for wastewater management on high water-table soils. Soil Crop Sci. Soc. Fla. Proc., 47: 108-127.
Allen, L.H., Jr., E.H. Stewart, W.G. Knisel, Jr. and R.A. Slack, 1976. Seasonal variation in runoff and water quality from the Taylor Creek watershed, Okeechobee County. Florida. Soil Crop Sci. Soc. Fla. Proc., 35: 126-138.
Allison, J.D., D.S. Brown and K.J. Novo-Gradac, 1991. MINTEQA2/PRODEFA2, a geochemical assessment model for environmental systems. Environmental Research Laboratory, Office of Re- search and Development. U.S.E.P.A., Athens, GA.
Amjad, Z., 1987. The inhibition of dicalcium phosphate dihydrate crystal growth by polycarboxylic acids. J. Colloid Interface Sci., 117: 98-103.
Brezonik, P.L., C.D. Hendry, Jr., E.S. Edgerton, R.L. Schulze and T.L. Crisman, 1983. Acidity, nutrients, and minerals in atmospheric precipitation over Florida: deposition patterns, mechanisms and ecological effects, 1983 documents (Microfiche).
Brown, J.L., 1981. Calcium phosphate precipitation: effects of common and foreign ions on hydroxyap- atite crystal growth. Soil Sci. Soc. Am. J., 45: 482-487.
Dick, W.A. and M.A. Tabatabai, 1977. An alkaline oxidation method for determination of total phosphorus in soils. Soil Sci. Soc. Am. J., 41: 511-514.
Federico, A.C., 1977. Investigations of the relationship between land use, rainfall, and runoff quality in the Taylor Creek watershed. Tech. Pub. 77-3. South Florida Water Management District, West Palm Beach, Florida.
Federico, A.C., F.E. Davis, K.G. Dickson and C.R. Kratzer, 1981. Lake Okeechobee water quality studies and eutrophication assessment. South Florida Water Manage. Distric Tech. Publ. 81-82. West Palm Beach, Florida.
Ferguson, J.F., D. Jenkins and J. Eastman, 1973. Calcium phosphate precipitation at slightly alkaline pH values. J. Water Pollut. Control Fed., 45: 620-631.
Fonyo, C. and E. Flaig, 1995. Phosphorus budgets for Lake Okeechobee Tributary Basins. Ecol. Eng. (this issue).
Graetz, D,A. and V.D. Nair, 1995. Fate of phosphorus in Florida Spodosols contaminated with cattle manure. Ecol. Eng. (this issue).
Griffin, R.A. and J.J. Jurinak, 1973. Estimation of activity coefficients from the electrical conductivity of natural aquatic systems and soil extracts. Soil Sci., 116: 26-30.
Grossl, P.R. and W.P. Inskeep, 1991. Precipitation of dicalcium phosphate dihydrate in the presence of organic acids. Soil Sci. Soc. Am. J., 55: 670-675.
Harris, W.G., H.D. Wang and K.R. Reddy, 1994. Dairy manure influence on soil and sediment composition: implications for P retention. J. Environ. Qual., 23: 1071-1081.
Hieltjes, H.M. and L. Lijklema, 1980. Fractionation of inorganic phosphates in calcareous sediments. J. Environ. Qual., 9: 405-407.

H.D. Wang et aL / Ecological Engineering 5 (1995~ 209-227 227
John. M.K., 1970. Colorimetric determination of phosphorus in soil and plant materials with ascorbic acid. Soil Sci., 109: 214-220.
Joyner, B.F., 1971. Appraisal of chemical and biological conditions of Lake Okeechobee, Florida, 1969-1970. Open File Report 71006. U.S. Dept. of Interior, Geological Survey, Water Resources Divn., Tallahassee, Florida.
Lindsay, W.L., 1979. Chemical Equilibria in Soils. John Wiley and Sons. New York. Macvicar, T.K., 1981. Frequency analysis of rainfall maximums for central and south Florida. Technical
publication #81-3, May, 1981. Resource Planning Department, South Florida Water Management District, West Palm Beach, Florida.
Nair, V.D. and D.A. Graetz, 1991. Phosphorus fractionation in soils from selected South Florida dairies. Agron. Abst. 1992 Annual Meeting. ASA, CSSA, SSSA. Madison, Wisconsin, p.47.
Olsen, S.R. and L.E. Sommers, 1982. Phosphorus. In: A.L. Page, R.H. Miller and D.R. Keeney (Eds.), Methods of Soil Analysis, Part 2: Soil Sci. Sic. Am., Madison, Wisconsin.
Reddy, K.R., W.G. Harris, O. Diaz and H.D. Wang, 1993. Phosphorus retention in Okeechobee Basin. Final report submitted to the South Florida Water Management District, West Palm Beach, Florida.
Ritter, G.J. and L.H. Allen, Jr., 1982. Taylor Creek headwaters project phase I report; Water quality. Tech. Pub. 82-8. South Florida Water Management District, West Palm Beach, Florida.
Scinto, L.J. and K.R. Reddy, 1990. Phosphorus dynamics in wetlands and stream sediments. Task 2.3.6. Seasonal variation in soil phosphorus distribution in two wetlands of South Florida. Final report submitted to the South Florida Water Management District, West Palm Beach, Florida.
Soil Survey Staff, 1975. Soil taxonomy: a basic system of soil classification for making and interpreting soil surveys. USDA-SCS Agric. Handbook 436. U,S. Government Printing Office, Washington, D.C.
Stewart, E.H., L.H. Allen, Jr. and D.V. Calvert, 1978. Water quality of streams on the upper Taylor Creek watershed, Okeechobee County, Fla. Soil Crop Sci. Fla. Proc., 31: 117-120.
U.S.G.S. Water-Resources Investigations, 1980. Chemical and physical characteristics of precipitation at selected sites in Florida. Prepared in cooperation with the Florida Department of Environmental Regulations.
Yadav, B.R., K.V. Paliwal and N.M. Nimgade, 1984. Effect of magnesium-rich waters on phosphate adsorption by calcite. Soil Sci., 138: 153-157.
Zoltek, J., Jr., 1974. Phosphorus removal by orthophosphate nucleation. J. Water Pollut. Control. Fed., 46: 2498-2520.