various forms of phosphorus in sediments of the eastern
TRANSCRIPT
INTRODUCTION
Phosphorus (P) is an essential element for all lifeforms1 and is considered to be one of the major nutrientswhich, when present in large concentrations, couldcause eutrophication2, as well as the key nutrient foundto be a limiting factor in natural waters3. Phosphorusis found in both inorganic and organic forms insediments where they serve as sinks and sources of P.It enters the rivers and sea in different chemical formsfrom various sources, including point sources and non-point sources. It is eventually incorporated into bottomsediments. Dissolved inorganic P is consideredbioavailable, whereas organic and particulate P formsgenerally must undergo a transformation into inorganicforms before being considered bioavailable3.Phosphorus adsorbed onto sediments can be releasedinto the overlying water depending on the chemicalforms in the sediments4,5 and the environmentalconditions5,6, such as pH, redox potential, microbes,bioturbation etc. The released P may become availableto algae and stimulate blooms of phytoplankton, andexcess can lead to eutrophication of the water body.
Knowledge of chemical speciation of sediment-bound P, is necessary to evaluate the bioavailable P
which is the amount of P that is biologically usable,because each chemical form has its own ability of releasefrom the sediments4. Sediment fractionation helps inidentifying the chemical forms of P and can highlightthe pathways it takes into the coastal waters7.Phosphorus fractionation is commonly achieved bysequential extractions, by which P is supposed to beselectively removed from different forms of attachmentin the sediments8 with a specific reagent preferentiallyextracting a specific form7. The weakly-bound Premoved by the first one or two extracting solutions ina sequential extraction method is usually consideredbioavailable3.
The Eastern Coast of Thailand comprises an area of5 Provinces; Chachoengsao, Chon Buri, Rayong,Chanthaburi and Trat. This area contains variousactivities including agriculture, fisheries, tourism,industry and urban communities. It is still in adevelopment stage with a high expansion rate ofindustrialization and urbanization, which willsubstantially increase the amount of wastewaterdischarging into the coastal area. In addition, red tideoutbreaks occasionally occur in this area, especially inChon Buri9.
The present study was undertaken to 1) investigate
ScienceAsia 30 (2004): 211-222
Various Forms of Phosphorus in Sediments ofthe Eastern Coast of Thailand
Waewtaa Thongra-ar,* Chaluay Musika, Phaithoon Mokkongpai, Wanchai Wongsudawan andArvut Munhapol
Institute of Marine Science, Burapha University, Bangsaen, Chon Buri 20131 Thailand.
* Corresponding author, E-mail: [email protected]
Received 1 Dec 2003 Accepted 23 Jun 2004
ABSTRACT: The amount of total phosphorus (P) and its chemical forms were investigated in sediments of theEastern Coast of Thailand in the dry (April 2001) and wet (July 2001) seasons. The amounts of total P rangedfrom 55.83 to 2,575.83 and from 30.0 to 2,672.50 µg g-1 dry weight for the dry and wet seasons, respectively.The P in sediments was mainly in an inorganic rather than organic form. Sediment inorganic P fractions weredetermined by a sequential extraction technique. In the estuarine sediments, the major form of P was Fe, Al-bound P and the second most abundant form was organic P, whereas the other sediments showed differentrelative dominant P forms depending on the sediment characteristics of each location. The seasonal changehad an influence on the chemical form of P available. In the dry season the available fractions were derivedfrom organic P, those in the wet season were derived largely from Fe, Al-bound P. The available concentrationsfound for both seasons were very similar in terms of the percentage of total P. It was also found that in mostsamples, the available forms were very low, comprising less than 10 % of total P.
In this study Fe oxides were found to be the major P sorbent of the sediments, followed by clay contents,while organic matter and CaCO
3 were less effective in sorbing P. In addition, the sediment P concentrations
decreased with increasing sediment pH and salinity of the overlying water.
KEYWORDS: phosphorus, sediment, fractionation, bioavailability, Eastern Coast of Thailand.
212 ScienceAsia ScienceAsia ScienceAsia ScienceAsia ScienceAsia 30 (2004)30 (2004)30 (2004)30 (2004)30 (2004)
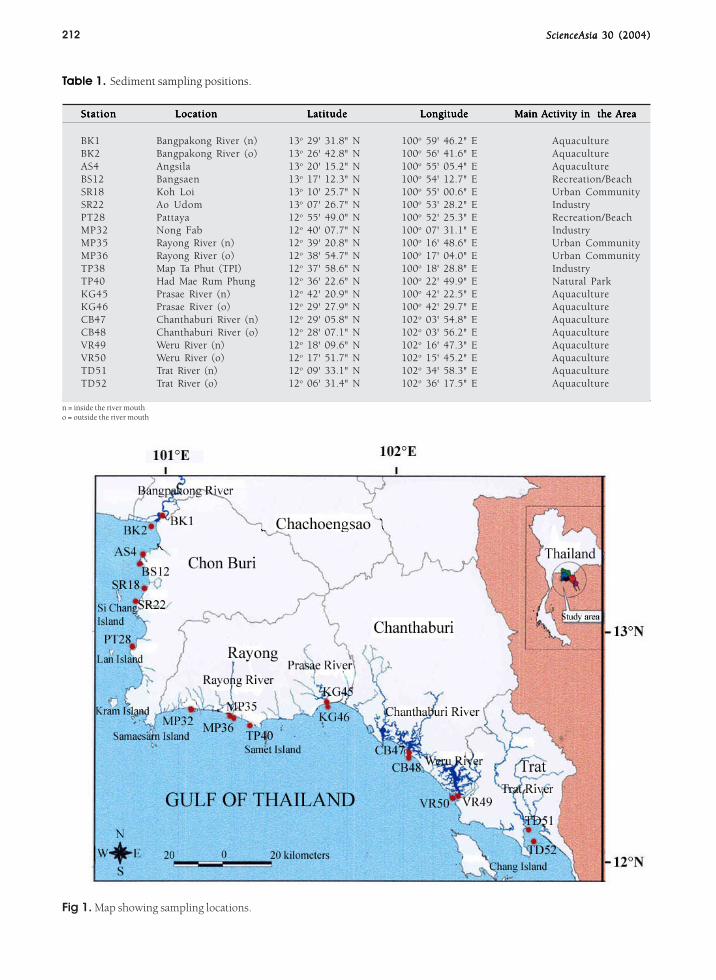
Table 1. Sediment sampling positions.
StationStationStationStationStation LocationLocationLocationLocationLocation LatitudeLatitudeLatitudeLatitudeLatitude LongitudeLongitudeLongitudeLongitudeLongitude Main Activity in the AreaMain Activity in the AreaMain Activity in the AreaMain Activity in the AreaMain Activity in the Area
BK1 Bangpakong River (n) 13o 29' 31.8" N 100o 59' 46.2" E AquacultureBK2 Bangpakong River (o) 13o 26' 42.8" N 100o 56' 41.6" E AquacultureAS4 Angsila 13o 20' 15.2" N 100o 55' 05.4" E AquacultureBS12 Bangsaen 13o 17' 12.3" N 100o 54' 12.7" E Recreation/BeachSR18 Koh Loi 13o 10' 25.7" N 100o 55' 00.6" E Urban CommunitySR22 Ao Udom 13o 07' 26.7" N 100o 53' 28.2" E IndustryPT28 Pattaya 12o 55' 49.0" N 100o 52' 25.3" E Recreation/BeachMP32 Nong Fab 12o 40' 07.7" N 100o 07' 31.1" E IndustryMP35 Rayong River (n) 12o 39' 20.8" N 100o 16' 48.6" E Urban CommunityMP36 Rayong River (o) 12o 38' 54.7" N 100o 17' 04.0" E Urban CommunityTP38 Map Ta Phut (TPI) 12o 37' 58.6" N 100o 18' 28.8" E IndustryTP40 Had Mae Rum Phung 12o 36' 22.6" N 100o 22' 49.9" E Natural ParkKG45 Prasae River (n) 12o 42' 20.9" N 100o 42' 22.5" E AquacultureKG46 Prasae River (o) 12o 29' 27.9" N 100o 42' 29.7" E AquacultureCB47 Chanthaburi River (n) 12o 29' 05.8" N 102o 03' 54.8" E AquacultureCB48 Chanthaburi River (o) 12o 28' 07.1" N 102o 03' 56.2" E AquacultureVR49 Weru River (n) 12o 18' 09.6" N 102o 16' 47.3" E AquacultureVR50 Weru River (o) 12o 17' 51.7" N 102o 15' 45.2" E AquacultureTD51 Trat River (n) 12o 09' 33.1" N 102o 34' 58.3" E AquacultureTD52 Trat River (o) 12o 06' 31.4" N 102o 36' 17.5" E Aquaculture
n = inside the river moutho = outside the river mouth
Fig 1. Map showing sampling locations.
ScienceAsia ScienceAsia ScienceAsia ScienceAsia ScienceAsia 30 (2004)30 (2004)30 (2004)30 (2004)30 (2004) 213
Fractionation of PhosphorusFractionation of PhosphorusFractionation of PhosphorusFractionation of PhosphorusFractionation of PhosphorusA sequential chemical extraction method described
by De Lange5 (which is similar to the method of Hieltjiesand Lijklema10) was used to fractionate the inorganicforms of P in the sediments (Table 2). The differencebetween total P and the sum of the extracted inorganicP, referred to as residual P, was assumed to be organicallybound10.
Each sediment sample was also analyzed for totalP by the ignition method at 550 ºC followed by extractionfor 16 h with 1 N HCl, whereas un-ignited samples wereprepared for total inorganic P11. The total inorganic Pwas also compared to the sum of the sequentiallyextracted inorganic P. The organic P was indirectly
obtained by the difference between the total P andinorganic P.
The available P was also extracted from thesediments by direct chemical leaching with a diluteacid-fluoride solution, a combination of HCl and NH
4F,
according to the method of Olsen and Sommers12.Phosphorus in all extracts was analyzed by the ascorbicacid method of Strickland and Parsons13 and theconcentrations were measured with a UV-VisSpectrophotometer Model UV 300 Unicam.
Sediment CharacterizationSediment CharacterizationSediment CharacterizationSediment CharacterizationSediment CharacterizationSelected sediment characteristics were determined
as follows: pH in water at a sediment to solution ratioof 1:2.5, calcium carbonate by the approximategravimetric method for loss of carbon dioxide14, organicmatter by the acid-dichromate oxidation method15,particle size distribution by the hydrometer method16
and sediment texture was classified according to theU.S. Agriculture texture triangle17. Extractable iron (Fe)and manganese (Mn) oxides were also examined in thesediments. The total (free) and amorphous oxides wereextracted by a dithionite-citrate solution and an acidammonium oxalate solution respectively, according tothe method of Ross and Wang18. Total oxides wererefered to as “cystralline and amorphous oxides”. Theconcentrations of these Fe and Mn oxides in the extractswere measured with a flame atomic absorptionspectrophotometer Model AAnalyst 100 (Perkin Elmer,Connecticut, USA).
RESULTS AND DISCUSSION
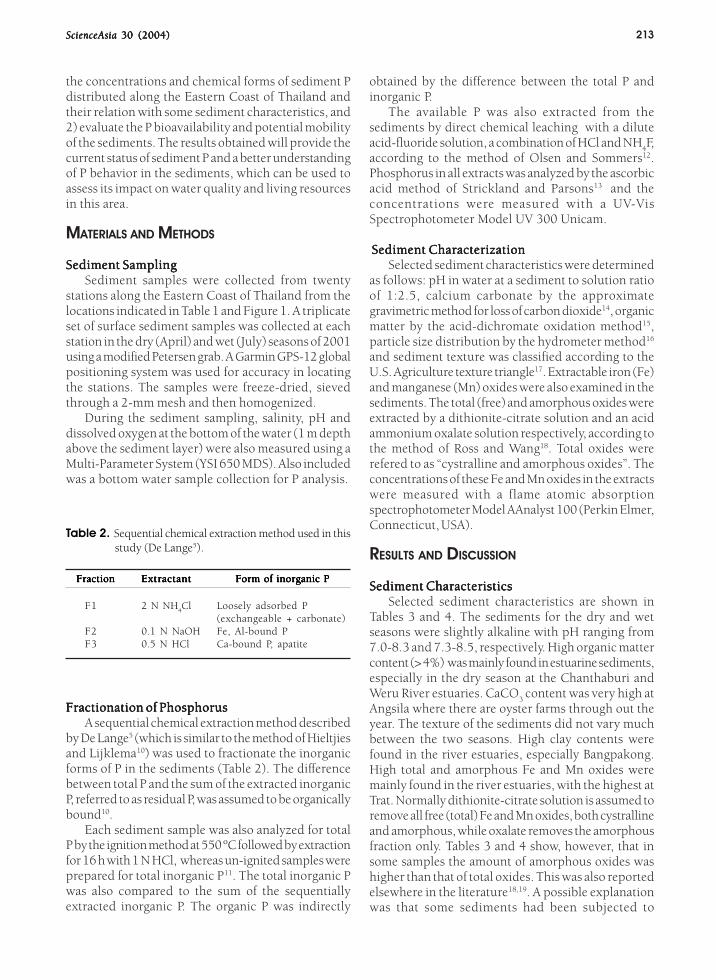
Sediment CharacteristicsSediment CharacteristicsSediment CharacteristicsSediment CharacteristicsSediment CharacteristicsSelected sediment characteristics are shown in
Tables 3 and 4. The sediments for the dry and wetseasons were slightly alkaline with pH ranging from7.0-8.3 and 7.3-8.5, respectively. High organic mattercontent (> 4%) was mainly found in estuarine sediments,especially in the dry season at the Chanthaburi andWeru River estuaries. CaCO
3 content was very high at
Angsila where there are oyster farms through out theyear. The texture of the sediments did not vary muchbetween the two seasons. High clay contents werefound in the river estuaries, especially Bangpakong.High total and amorphous Fe and Mn oxides weremainly found in the river estuaries, with the highest atTrat. Normally dithionite-citrate solution is assumed toremove all free (total) Fe and Mn oxides, both cystrallineand amorphous, while oxalate removes the amorphousfraction only. Tables 3 and 4 show, however, that insome samples the amount of amorphous oxides washigher than that of total oxides. This was also reportedelsewhere in the literature18,19. A possible explanationwas that some sediments had been subjected to
the concentrations and chemical forms of sediment Pdistributed along the Eastern Coast of Thailand andtheir relation with some sediment characteristics, and2) evaluate the P bioavailability and potential mobilityof the sediments. The results obtained will provide thecurrent status of sediment P and a better understandingof P behavior in the sediments, which can be used toassess its impact on water quality and living resourcesin this area.
MATERIALS AND METHODS
Sediment SamplingSediment SamplingSediment SamplingSediment SamplingSediment SamplingSediment samples were collected from twenty
stations along the Eastern Coast of Thailand from thelocations indicated in Table 1 and Figure 1. A triplicateset of surface sediment samples was collected at eachstation in the dry (April) and wet (July) seasons of 2001using a modified Petersen grab. A Garmin GPS-12 globalpositioning system was used for accuracy in locatingthe stations. The samples were freeze-dried, sievedthrough a 2-mm mesh and then homogenized.
During the sediment sampling, salinity, pH anddissolved oxygen at the bottom of the water (1 m depthabove the sediment layer) were also measured using aMulti-Parameter System (YSI 650 MDS). Also includedwas a bottom water sample collection for P analysis.
Table 2. Sequential chemical extraction method used in thisstudy (De Lange5).
Fraction Fraction Fraction Fraction Fraction ExtractantExtractantExtractantExtractantExtractant Form of inorganic PForm of inorganic PForm of inorganic PForm of inorganic PForm of inorganic P
F1 2 N NH4Cl Loosely adsorbed P
(exchangeable + carbonate)F2 0.1 N NaOH Fe, Al-bound PF3 0.5 N HCl Ca-bound P, apatite
214 ScienceAsia ScienceAsia ScienceAsia ScienceAsia ScienceAsia 30 (2004)30 (2004)30 (2004)30 (2004)30 (2004)
Table 3. East Coast sediment characteristics in the dry season (April 2001). Results reported are the mean of three replicas.
StationStationStationStationStation LocationLocationLocationLocationLocation pHpHpHpHpH CaCOCaCOCaCOCaCOCaCO33333
Organic Organic Organic Organic Organic Fe (mg gFe (mg gFe (mg gFe (mg gFe (mg g-1-1-1-1-1))))) Mn (mg g Mn (mg g Mn (mg g Mn (mg g Mn (mg g-1-1-1-1-1))))) Par Par Par Par Particle Size Tticle Size Tticle Size Tticle Size Tticle Size Texturexturexturexturextureeeee No. No. No. No. No. equivalent matter equivalent matter equivalent matter equivalent matter equivalent matter T T T T Totalotalotalotalotal Amorp. Amorp. Amorp. Amorp. Amorp. TTTTTotalotalotalotalotal Amorp.Amorp.Amorp.Amorp.Amorp. Distribution (%)Distribution (%)Distribution (%)Distribution (%)Distribution (%) Class Class Class Class Class
(%) (%) (%) (%) (%) (%) (%) (%) (%) (%) Oxides OxidesOxides OxidesOxides OxidesOxides OxidesOxides Oxides OxidesOxidesOxidesOxidesOxides OxidesOxidesOxidesOxidesOxides SandSandSandSandSand SiltSiltSiltSiltSilt ClayClayClayClayClay
BK1 Bangpakong 7.6 0.70 2.22 11.86 10.92 1.84 1.92 30.9 49 19.8 LoamRiver (n)
BK2 Bangpakong 7.8 1.35 2.31 14.30 12.16 1.64 1.61 42.2 32.1 25.8 ClayRiver (o) loam
AS4 Angsila 8.2 41.85 1.76 2.28 2.47 0.44 0.30 73.5 16.7 9.8 Sandyloam
BS12 Bangsaen 8.0 5.62 0.24 0.64 2.04 0.04 0.04 92.9 2.1 5.1 SandSR18 Koh Loi 8.1 12.97 0.85 1.59 2.25 0.15 0.14 58.9 33.7 7.4 Sandy
loamSR22 Ao Udom 8.1 11.79 1.31 1.00 1.50 0.15 0.12 54.9 36.7 8.4 Sandy
loamPT28 Pattaya 8.3 8.89 0.40 0.88 0.89 0.06 0.06 73.8 18.7 7.5 Sandy
loamMP32 Nong Fab 8.3 2.06 0.27 2.99 0.49 0.03 0.03 91.8 4.4 3.9 SandMP35 Rayong 8.1 2.28 0.44 1.59 1.33 0.07 0.01 89.6 3.5 6.8 Sand
River (n)MP36 Rayong 7.9 4.29 2.52 8.06 6.39 0.20 0.16 44.2 43.4 12.4 Loam
River (o)TP38 Map Ta 7.7 1.94 0.42 1.60 1.11 0.03 0.04 57.5 21.1 21.4 Sandy
Phut (TPI) clay loamTP40 Had Mae 7.9 3.43 0.10 1.31 1.97 0.01 0.02 92.9 1.3 5.8 Sand
Rum PhungKG45 Prasae 7.9 3.08 3.09 13.63 12.55 0.15 0.18 60.6 23.3 16.1 Sandy
River (n) loamKG46 Prasae 8.0 8.96 3.52 9.42 11.39 0.32 0.38 74.6 16.0 9.4 Sandy
River (o) loamCB47 Chanthaburi 8.0 3.66 4.59 8.60 10.46 0.14 0.20 61.9 25.1 13.0 Sandy
River (n) loamCB48 Chanthaburi 8.0 3.99 5.94 14.28 16.05 0.44 0.50 41.2 46.0 12.8 Loam
River (o)VR49 Weru River (n) 7.9 3.10 5.03 13.91 16.77 0.50 0.50 33.9 55.6 10.5 Silt loamVR50 Weru River (o) 7.9 7.61 6.55 19.92 22.59 0.74 0.50 36.9 50.7 12.4 Silt loamTD51 Trat River (n) 7.0 2.22 1.12 72.19 38.77 0.41 0.37 44.9 35.4 19.8 LoamTD52 Trat River (o) 7.0 2.64 2.61 49.63 28.81 0.30 0.31 41.5 44.7 13.8 Loam
processes causing changes in their structure especiallyan alteration between aerobic and anaerobicconditions. Upon reoxidation, Fe will precipitate andmay form an amorphous, highly hydrated solid phasewith the structural Si and Al. Thus, most of Fe extractedby dithionite-citrate in those sediments was also oxalate-extractable19. In addition, oxalate itself can extractpoorly crystalline oxides as well18.
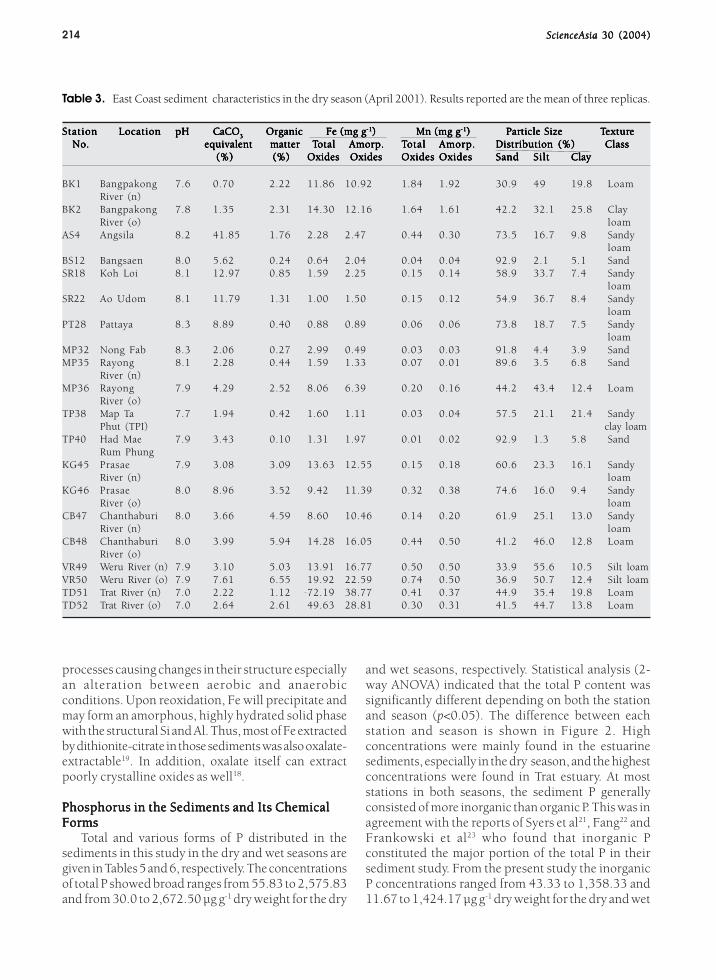
Phosphorus in the Sediments and Its ChemicalPhosphorus in the Sediments and Its ChemicalPhosphorus in the Sediments and Its ChemicalPhosphorus in the Sediments and Its ChemicalPhosphorus in the Sediments and Its ChemicalFormsFormsFormsFormsForms
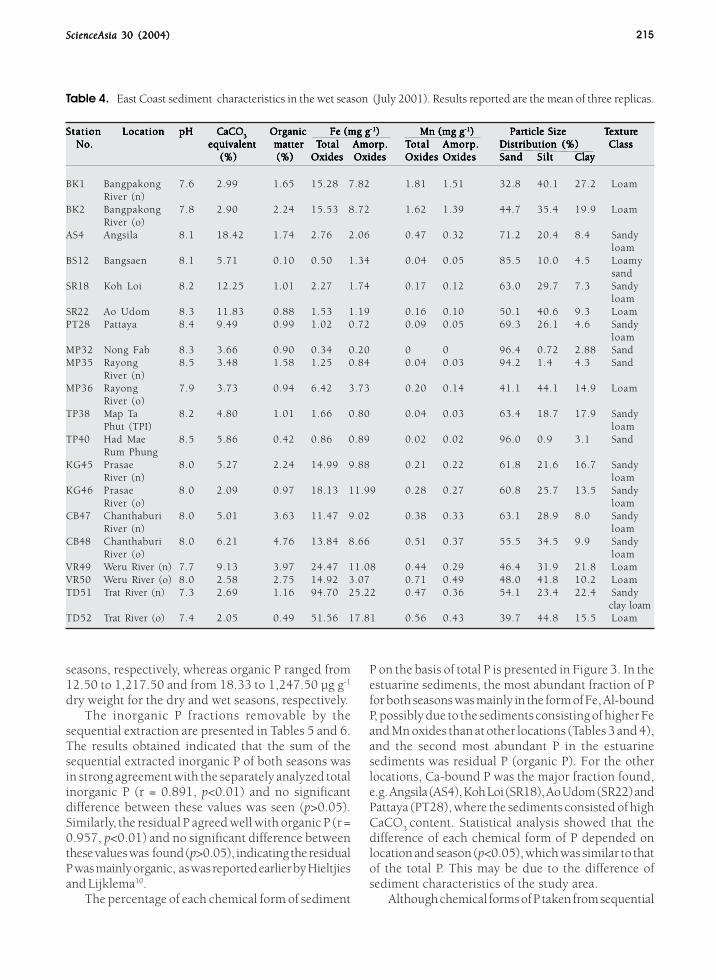
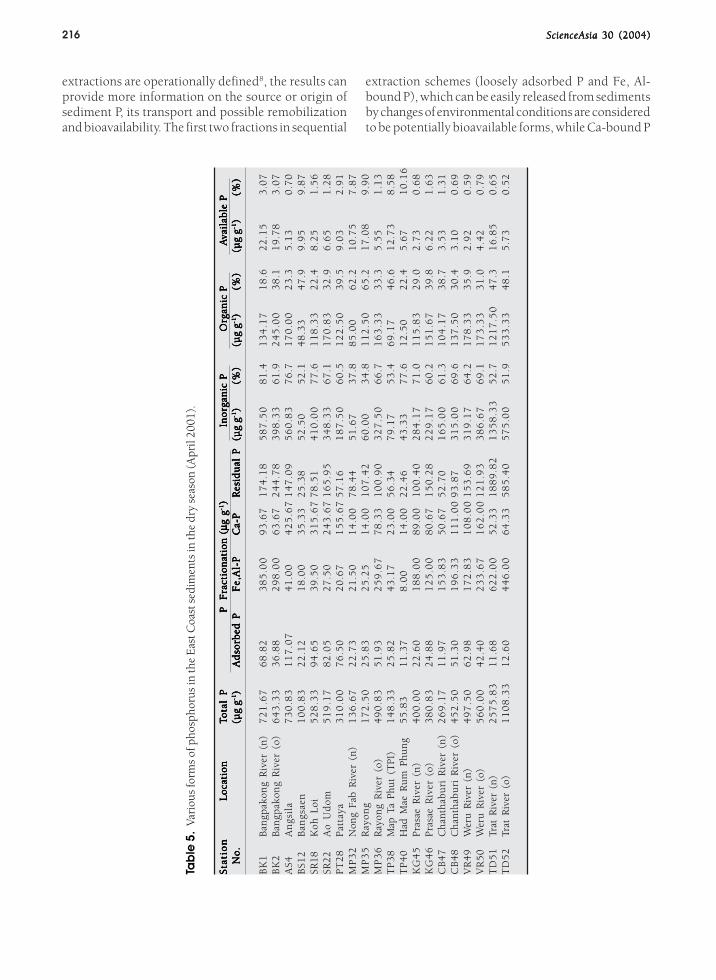
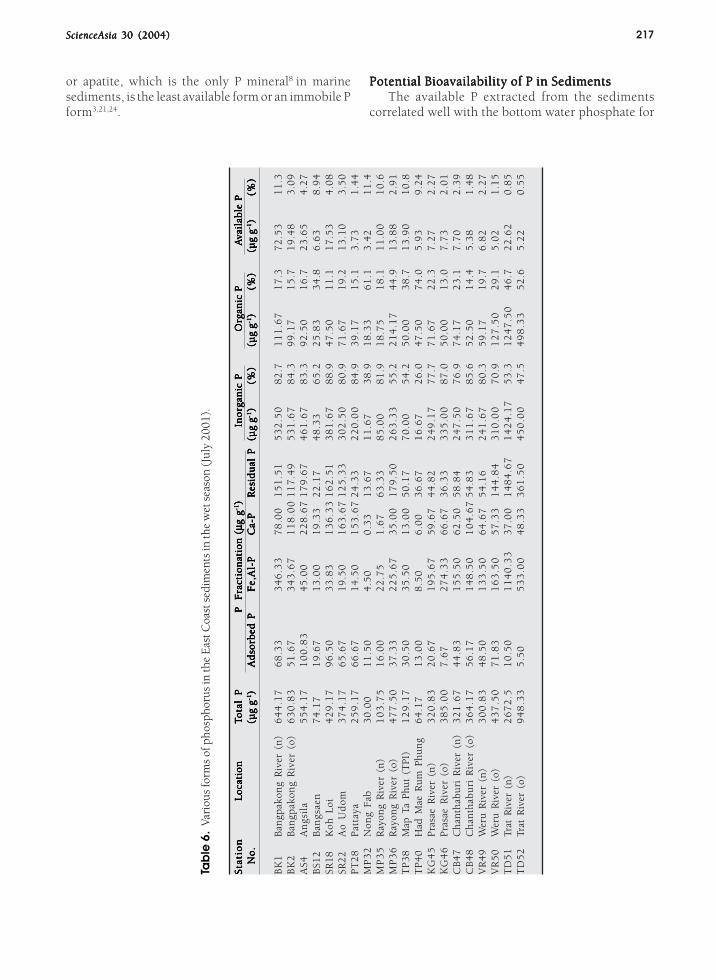
Total and various forms of P distributed in thesediments in this study in the dry and wet seasons aregiven in Tables 5 and 6, respectively. The concentrationsof total P showed broad ranges from 55.83 to 2,575.83and from 30.0 to 2,672.50 µg g-1 dry weight for the dry
and wet seasons, respectively. Statistical analysis (2-way ANOVA) indicated that the total P content wassignificantly different depending on both the stationand season (p<0.05). The difference between eachstation and season is shown in Figure 2. Highconcentrations were mainly found in the estuarinesediments, especially in the dry season, and the highestconcentrations were found in Trat estuary. At moststations in both seasons, the sediment P generallyconsisted of more inorganic than organic P. This was inagreement with the reports of Syers et al21, Fang22 andFrankowski et al23 who found that inorganic Pconstituted the major portion of the total P in theirsediment study. From the present study the inorganicP concentrations ranged from 43.33 to 1,358.33 and11.67 to 1,424.17 µg g-1 dry weight for the dry and wet
ScienceAsia ScienceAsia ScienceAsia ScienceAsia ScienceAsia 30 (2004)30 (2004)30 (2004)30 (2004)30 (2004) 215
Table 4. East Coast sediment characteristics in the wet season (July 2001). Results reported are the mean of three replicas.
StationStationStationStationStation LocationLocationLocationLocationLocation pHpHpHpHpH CaCOCaCOCaCOCaCOCaCO33333
Organic Organic Organic Organic Organic Fe (mg gFe (mg gFe (mg gFe (mg gFe (mg g-1-1-1-1-1))))) Mn (mg g Mn (mg g Mn (mg g Mn (mg g Mn (mg g-1-1-1-1-1))))) Par Par Par Par Particle Size Tticle Size Tticle Size Tticle Size Tticle Size Texturexturexturexturextureeeee No. No. No. No. No. equivalent matter equivalent matter equivalent matter equivalent matter equivalent matter T T T T Totalotalotalotalotal Amorp. Amorp. Amorp. Amorp. Amorp. TTTTTotalotalotalotalotal Amorp.Amorp.Amorp.Amorp.Amorp. Distribution (%)Distribution (%)Distribution (%)Distribution (%)Distribution (%) Class Class Class Class Class
(%) (%) (%) (%) (%) (%) (%) (%) (%) (%) Oxides OxidesOxides OxidesOxides OxidesOxides OxidesOxides Oxides OxidesOxidesOxidesOxidesOxides OxidesOxidesOxidesOxidesOxides SandSandSandSandSand SiltSiltSiltSiltSilt ClayClayClayClayClay
BK1 Bangpakong 7.6 2.99 1.65 15.28 7.82 1.81 1.51 32.8 40.1 27.2 LoamRiver (n)
BK2 Bangpakong 7.8 2.90 2.24 15.53 8.72 1.62 1.39 44.7 35.4 19.9 LoamRiver (o)
AS4 Angsila 8.1 18.42 1.74 2.76 2.06 0.47 0.32 71.2 20.4 8.4 Sandyloam
BS12 Bangsaen 8.1 5.71 0.10 0.50 1.34 0.04 0.05 85.5 10.0 4.5 Loamysand
SR18 Koh Loi 8.2 12.25 1.01 2.27 1.74 0.17 0.12 63.0 29.7 7.3 Sandyloam
SR22 Ao Udom 8.3 11.83 0.88 1.53 1.19 0.16 0.10 50.1 40.6 9.3 LoamPT28 Pattaya 8.4 9.49 0.99 1.02 0.72 0.09 0.05 69.3 26.1 4.6 Sandy
loamMP32 Nong Fab 8.3 3.66 0.90 0.34 0.20 0 0 96.4 0.72 2.88 SandMP35 Rayong 8.5 3.48 1.58 1.25 0.84 0.04 0.03 94.2 1.4 4.3 Sand
River (n)MP36 Rayong 7.9 3.73 0.94 6.42 3.73 0.20 0.14 41.1 44.1 14.9 Loam
River (o)TP38 Map Ta 8.2 4.80 1.01 1.66 0.80 0.04 0.03 63.4 18.7 17.9 Sandy
Phut (TPI) loamTP40 Had Mae 8.5 5.86 0.42 0.86 0.89 0.02 0.02 96.0 0.9 3.1 Sand
Rum PhungKG45 Prasae 8.0 5.27 2.24 14.99 9.88 0.21 0.22 61.8 21.6 16.7 Sandy
River (n) loamKG46 Prasae 8.0 2.09 0.97 18.13 11.99 0.28 0.27 60.8 25.7 13.5 Sandy
River (o) loamCB47 Chanthaburi 8.0 5.01 3.63 11.47 9.02 0.38 0.33 63.1 28.9 8.0 Sandy
River (n) loamCB48 Chanthaburi 8.0 6.21 4.76 13.84 8.66 0.51 0.37 55.5 34.5 9.9 Sandy
River (o) loamVR49 Weru River (n) 7.7 9.13 3.97 24.47 11.08 0.44 0.29 46.4 31.9 21.8 LoamVR50 Weru River (o) 8.0 2.58 2.75 14.92 3.07 0.71 0.49 48.0 41.8 10.2 LoamTD51 Trat River (n) 7.3 2.69 1.16 94.70 25.22 0.47 0.36 54.1 23.4 22.4 Sandy
clay loamTD52 Trat River (o) 7.4 2.05 0.49 51.56 17.81 0.56 0.43 39.7 44.8 15.5 Loam
seasons, respectively, whereas organic P ranged from12.50 to 1,217.50 and from 18.33 to 1,247.50 µg g-1
dry weight for the dry and wet seasons, respectively.The inorganic P fractions removable by the
sequential extraction are presented in Tables 5 and 6.The results obtained indicated that the sum of thesequential extracted inorganic P of both seasons wasin strong agreement with the separately analyzed totalinorganic P (r = 0.891, p<0.01) and no significantdifference between these values was seen (p>0.05).Similarly, the residual P agreed well with organic P (r =0.957, p<0.01) and no significant difference betweenthese values was found (p>0.05), indicating the residualP was mainly organic, as was reported earlier by Hieltjiesand Lijklema10.
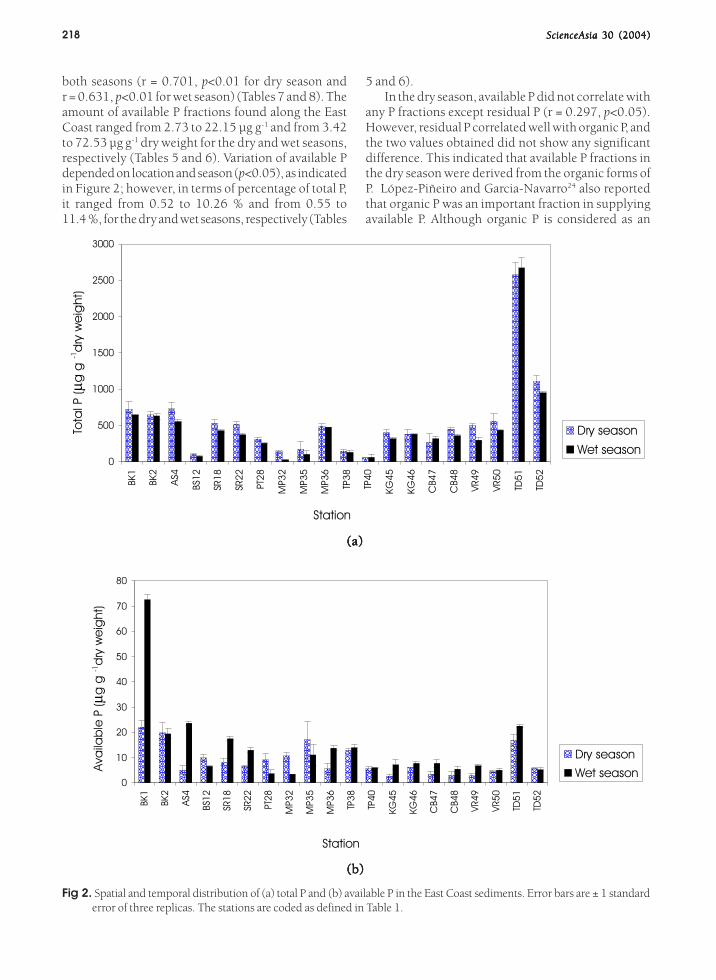
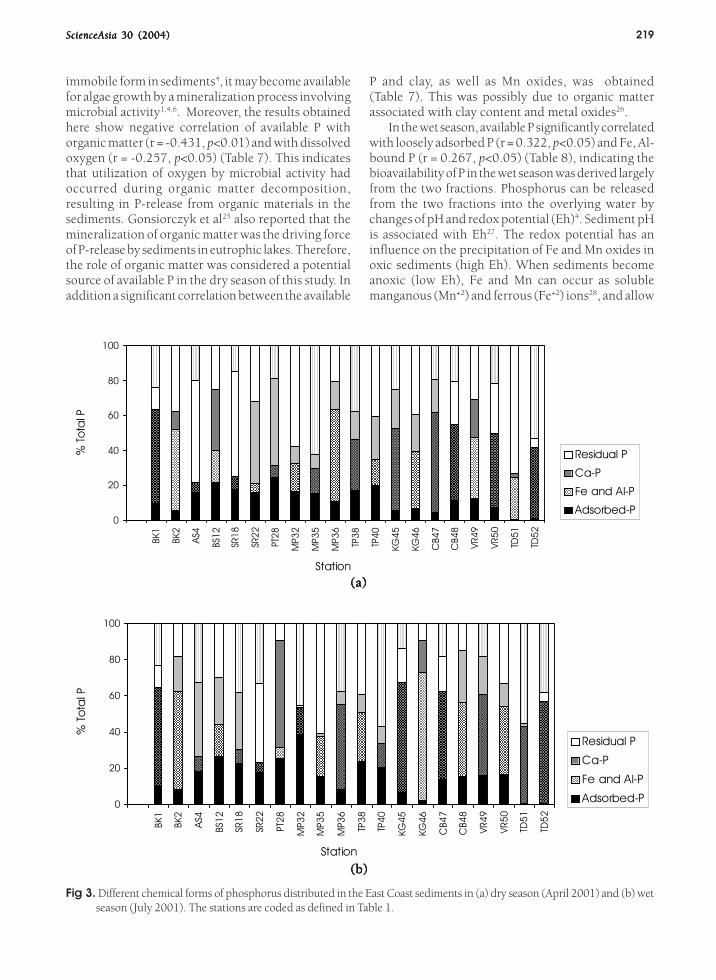
The percentage of each chemical form of sediment
P on the basis of total P is presented in Figure 3. In theestuarine sediments, the most abundant fraction of Pfor both seasons was mainly in the form of Fe, Al-boundP, possibly due to the sediments consisting of higher Feand Mn oxides than at other locations (Tables 3 and 4),and the second most abundant P in the estuarinesediments was residual P (organic P). For the otherlocations, Ca-bound P was the major fraction found,e.g. Angsila (AS4), Koh Loi (SR18), Ao Udom (SR22) andPattaya (PT28), where the sediments consisted of highCaCO
3 content. Statistical analysis showed that the
difference of each chemical form of P depended onlocation and season (p<0.05), which was similar to thatof the total P. This may be due to the difference ofsediment characteristics of the study area.
Although chemical forms of P taken from sequential
216 ScienceAsia ScienceAsia ScienceAsia ScienceAsia ScienceAsia 30 (2004)30 (2004)30 (2004)30 (2004)30 (2004)
Tab
le 5
. Va
riou
s fo
rms
of p
hosp
horu
s in
the
Eas
t Coa
st s
edim
ents
in th
e dr
y se
ason
(Apr
il 20
01).
Sta
tio
nS
tati
on
Sta
tio
nS
tati
on
Sta
tio
n
L
ocat
ion
Loc
atio
n
L
ocat
ion
Loc
atio
n
L
ocat
ion
TTTT To
tal
Po
tal
Po
tal
Po
tal
Po
tal
P
P
F
ract
ion
atio
n (
P
Fra
ctio
nat
ion
(
P
F
ract
ion
atio
n (
P
Fra
ctio
nat
ion
(
P
F
ract
ion
atio
n (
µµµµ µ g gg g
g g
g g
g g-1-1-1-1 -1
)))) )
In
orga
nic
P
In
orga
nic
P
In
orga
nic
P
In
orga
nic
P
In
orga
nic
P
O
rgan
ic P
Org
anic
P
O
rgan
ic P
Org
anic
P
O
rgan
ic P
A
A
A
A
A
vail
able
Pva
ilab
le P
vail
able
Pva
ilab
le P
vail
able
P
No.
N
o.
No.
N
o.
No.
(µg
g(µ
g g
(µg
g(µ
g g
(µg
g-1-1-1-1 -1)))) )
Ad
sorb
ed P
Ad
sorb
ed P
Ad
sorb
ed P
Ad
sorb
ed P
Ad
sorb
ed P
Fe,
Al-
PF
e,A
l-P
Fe,
Al-
PF
e,A
l-P
Fe,
Al-
PC
a-P
Ca-
PC
a-P
Ca-
PC
a-P
Res
idu
al P
Res
idu
al P
Res
idu
al P
Res
idu
al P
Res
idu
al P
(µg
g(µ
g g
(µg
g(µ
g g
(µg
g-1-1-1-1 -1)))) )
(%)
(%)
(%)
(%)
(%)
(µg
g(µ
g g
(µg
g(µ
g g
(µg
g-1-1-1-1 -1)))) )
(%)
(%)
(%)
(%)
(%)
(µg
g(µ
g g
(µg
g(µ
g g
(µg
g-1-1-1-1 -1)))) )
(%)
(%)
(%)
(%)
(%)
BK
1B
angp
akon
g R
iver
(n
)7
21
.67
68
.82
38
5.0
09
3.6
71
74
.18
58
7.5
08
1.4
13
4.1
71
8.6
22
.15
3.0
7B
K2
Ban
gpak
ong
Riv
er (
o)6
43
.33
36
.88
29
8.0
06
3.6
72
44
.78
39
8.3
36
1.9
24
5.0
03
8.1
19
.78
3.0
7A
S4A
ngs
ila
73
0.8
31
17
.07
41
.00
42
5.6
71
47
.09
56
0.8
37
6.7
17
0.0
02
3.3
5.1
30
.70
BS1
2B
angs
aen
10
0.8
32
2.1
21
8.0
03
5.3
32
5.3
85
2.5
05
2.1
48
.33
47
.99
.95
9.8
7SR
18K
oh L
oi5
28
.33
94
.65
39
.50
31
5.6
77
8.5
14
10
.00
77
.61
18
.33
22
.48
.25
1.5
6SR
22A
o U
dom
51
9.1
78
2.0
52
7.5
02
43
.67
16
5.9
53
48
.33
67
.11
70
.83
32
.96
.65
1.2
8P
T2
8P
atta
ya3
10
.00
76
.50
20
.67
15
5.6
75
7.1
61
87
.50
60
.51
22
.50
39
.59
.03
2.9
1M
P3
2N
ong
Fab
Riv
er (
n)
13
6.6
72
2.7
32
1.5
01
4.0
07
8.4
45
1.6
73
7.8
85
.00
62
.21
0.7
57
.87
MP
35
Ray
ong
17
2.5
02
5.8
32
5.2
51
4.0
01
07
.42
60
.00
34
.81
12
.50
65
.21
7.0
89
.90
MP
36
Ray
ong
Riv
er (
o)4
90
.83
51
.93
25
9.6
77
8.3
31
00
.90
32
7.5
06
6.7
16
3.3
33
3.3
5.5
51
.13
TP
38
Map
Ta
Phut
(T
PI)
14
8.3
32
5.8
24
3.1
72
3.0
05
6.3
47
9.1
75
3.4
69
.17
46
.61
2.7
38
.58
TP
40
Had
Mae
Ru
m P
hu
ng
55
.83
11
.37
8.0
01
4.0
02
2.4
64
3.3
37
7.6
12
.50
22
.45
.67
10
.16
KG
45
Pras
ae R
iver
(n
)4
00
.00
22
.60
18
8.0
08
9.0
01
00
.40
28
4.1
77
1.0
11
5.8
32
9.0
2.7
30
.68
KG
46
Pras
ae R
iver
(o)
38
0.8
32
4.8
81
25
.00
80
.67
15
0.2
82
29
.17
60
.21
51
.67
39
.86
.22
1.6
3C
B4
7C
han
thab
uri
Riv
er (
n)
26
9.1
71
1.9
71
53
.83
50
.67
52
.70
16
5.0
06
1.3
10
4.1
73
8.7
3.5
31
.31
CB
48
Ch
anth
abu
ri R
iver
(o)
45
2.5
05
1.3
01
96
.33
11
1.0
09
3.8
73
15
.00
69
.61
37
.50
30
.43
.10
0.6
9V
R4
9W
eru
Riv
er (
n)
49
7.5
06
2.9
81
72
.83
10
8.0
01
53
.69
31
9.1
76
4.2
17
8.3
33
5.9
2.9
20
.59
VR
50
Wer
u R
iver
(o)
56
0.0
04
2.4
02
33
.67
16
2.0
01
21
.93
38
6.6
76
9.1
17
3.3
33
1.0
4.4
20
.79
TD
51
Trat
Riv
er (
n)2
57
5.8
31
1.6
86
22
.00
52
.33
18
89
.82
13
58
.33
52
.71
21
7.5
04
7.3
16
.85
0.6
5T
D5
2Tr
at R
iver
(o)
11
08
.33
12
.60
44
6.0
06
4.3
35
85
.40
57
5.0
05
1.9
53
3.3
34
8.1
5.7
30
.52
extractions are operationally defined8, the results canprovide more information on the source or origin ofsediment P, its transport and possible remobilizationand bioavailability. The first two fractions in sequential
extraction schemes (loosely adsorbed P and Fe, Al-bound P), which can be easily released from sedimentsby changes of environmental conditions are consideredto be potentially bioavailable forms, while Ca-bound P
ScienceAsia ScienceAsia ScienceAsia ScienceAsia ScienceAsia 30 (2004)30 (2004)30 (2004)30 (2004)30 (2004) 217
or apatite, which is the only P mineral8 in marinesediments, is the least available form or an immobile Pform3,21,24.
Potential Bioavailability of P in SedimentsPotential Bioavailability of P in SedimentsPotential Bioavailability of P in SedimentsPotential Bioavailability of P in SedimentsPotential Bioavailability of P in SedimentsThe available P extracted from the sediments
correlated well with the bottom water phosphate for
Tab
le 6
. Va
riou
s fo
rms
of p
hosp
horu
s in
the
Eas
t Coa
st s
edim
ents
in th
e w
et s
easo
n (J
uly
2001
).
Sta
tio
nS
tati
on
Sta
tio
nS
tati
on
Sta
tio
n
L
ocat
ion
Loc
atio
n
L
ocat
ion
Loc
atio
n
L
ocat
ion
TTTT To
tal
Po
tal
Po
tal
Po
tal
Po
tal
P
P
F
ract
ion
atio
n (
P
Fra
ctio
nat
ion
(
P
F
ract
ion
atio
n (
P
Fra
ctio
nat
ion
(
P
F
ract
ion
atio
n (
µµµµ µ g gg g
g g
g g
g g-1-1-1-1 -1
)))) )
In
orga
nic
P
In
orga
nic
P
In
orga
nic
P
In
orga
nic
P
In
orga
nic
P
O
rgan
ic P
Org
anic
P
O
rgan
ic P
Org
anic
P
O
rgan
ic P
A
A
A
A
A
vail
able
Pva
ilab
le P
vail
able
Pva
ilab
le P
vail
able
P
No.
N
o.
No.
N
o.
No.
(µg
g(µ
g g
(µg
g(µ
g g
(µg
g-1-1-1-1 -1)))) )
Ad
sorb
ed P
Ad
sorb
ed P
Ad
sorb
ed P
Ad
sorb
ed P
Ad
sorb
ed P
Fe,
Al-
PF
e,A
l-P
Fe,
Al-
PF
e,A
l-P
Fe,
Al-
PC
a-P
Ca-
PC
a-P
Ca-
PC
a-P
Res
idu
al P
Res
idu
al P
Res
idu
al P
Res
idu
al P
Res
idu
al P
(µg
g(µ
g g
(µg
g(µ
g g
(µg
g-1-1-1-1 -1)))) )
(%)
(%)
(%)
(%)
(%)
(µg
g(µ
g g
(µg
g(µ
g g
(µg
g-1-1-1-1 -1)))) )
(%)
(%)
(%)
(%)
(%)
(µg
g(µ
g g
(µg
g(µ
g g
(µg
g-1-1-1-1 -1)))) )
(%)
(%)
(%)
(%)
(%)
BK
1B
angp
akon
g R
iver
(n
)6
44
.17
68
.33
34
6.3
37
8.0
01
51
.51
53
2.5
08
2.7
11
1.6
71
7.3
72
.53
11
.3B
K2
Ban
gpak
ong
Riv
er (
o)6
30
.83
51
.67
34
3.6
71
18
.00
11
7.4
95
31
.67
84
.39
9.1
71
5.7
19
.48
3.0
9A
S4A
ngs
ila
55
4.1
71
00
.83
45
.00
22
8.6
71
79
.67
46
1.6
78
3.3
92
.50
16
.72
3.6
54
.27
BS1
2B
angs
aen
74
.17
19
.67
13
.00
19
.33
22
.17
48
.33
65
.22
5.8
33
4.8
6.6
38
.94
SR18
Koh
Loi
42
9.1
79
6.5
03
3.8
31
36
.33
16
2.5
13
81
.67
88
.94
7.5
01
1.1
17
.53
4.0
8SR
22A
o U
dom
37
4.1
76
5.6
71
9.5
01
63
.67
12
5.3
33
02
.50
80
.97
1.6
71
9.2
13
.10
3.5
0P
T2
8P
atta
ya2
59
.17
66
.67
14
.50
15
3.6
72
4.3
32
20
.00
84
.93
9.1
71
5.1
3.7
31
.44
MP
32
Non
g F
ab3
0.0
01
1.5
04
.50
0.3
31
3.6
71
1.6
73
8.9
18
.33
61
.13
.42
11
.4M
P3
5R
ayon
g R
iver
(n
)1
03
.75
16
.00
22
.75
1.6
76
3.3
38
5.0
08
1.9
18
.75
18
.11
1.0
01
0.6
MP
36
Ray
ong
Riv
er (
o)4
77
.50
37
.33
22
5.6
73
5.0
01
79
.50
26
3.3
35
5.2
21
4.1
74
4.9
13
.88
2.9
1T
P3
8M
ap T
a Ph
ut (
TPI
)1
29
.17
30
.50
35
.50
13
.00
50
.17
70
.00
54
.25
0.0
03
8.7
13
.90
10
.8T
P4
0H
ad M
ae R
um
Ph
un
g6
4.1
71
3.0
08
.50
6.0
03
6.6
71
6.6
72
6.0
47
.50
74
.05
.93
9.2
4K
G4
5Pr
asae
Riv
er (
n)
32
0.8
32
0.6
71
95
.67
59
.67
44
.82
24
9.1
77
7.7
71
.67
22
.37
.27
2.2
7K
G4
6Pr
asae
Riv
er (
o)3
85
.00
7.6
72
74
.33
66
.67
36
.33
33
5.0
08
7.0
50
.00
13
.07
.73
2.0
1C
B4
7C
han
thab
uri
Riv
er (
n)
32
1.6
74
4.8
31
55
.50
62
.50
58
.84
24
7.5
07
6.9
74
.17
23
.17
.70
2.3
9C
B4
8C
han
thab
uri
Riv
er (
o)3
64
.17
56
.17
14
8.5
01
04
.67
54
.83
31
1.6
78
5.6
52
.50
14
.45
.38
1.4
8V
R4
9W
eru
Riv
er (
n)
30
0.8
34
8.5
01
33
.50
64
.67
54
.16
24
1.6
78
0.3
59
.17
19
.76
.82
2.2
7V
R5
0W
eru
Riv
er (
o)4
37
.50
71
.83
16
3.5
05
7.3
31
44
.84
31
0.0
07
0.9
12
7.5
02
9.1
5.0
21
.15
TD
51
Trat
Riv
er (
n)2
67
2.5
10
.50
11
40
.33
37
.00
14
84
.67
14
24
.17
53
.31
24
7.5
04
6.7
22
.62
0.8
5T
D5
2Tr
at R
iver
(o)
94
8.3
35
.50
53
3.0
04
8.3
33
61
.50
45
0.0
04
7.5
49
8.3
35
2.6
5.2
20
.55
218 ScienceAsia ScienceAsia ScienceAsia ScienceAsia ScienceAsia 30 (2004)30 (2004)30 (2004)30 (2004)30 (2004)
both seasons (r = 0.701, p<0.01 for dry season andr = 0.631, p<0.01 for wet season) (Tables 7 and 8). Theamount of available P fractions found along the EastCoast ranged from 2.73 to 22.15 µg g-1 and from 3.42to 72.53 µg g-1 dry weight for the dry and wet seasons,respectively (Tables 5 and 6). Variation of available Pdepended on location and season (p<0.05), as indicatedin Figure 2; however, in terms of percentage of total P,it ranged from 0.52 to 10.26 % and from 0.55 to11.4 %, for the dry and wet seasons, respectively (Tables
5 and 6).In the dry season, available P did not correlate with
any P fractions except residual P (r = 0.297, p<0.05).However, residual P correlated well with organic P, andthe two values obtained did not show any significantdifference. This indicated that available P fractions inthe dry season were derived from the organic forms ofP. López-Piñeiro and Garcia-Navarro24 also reportedthat organic P was an important fraction in supplyingavailable P. Although organic P is considered as an
Fig 2. Spatial and temporal distribution of (a) total P and (b) available P in the East Coast sediments. Error bars are ± 1 standarderror of three replicas. The stations are coded as defined in Table 1.
(b)(b)(b)(b)(b)
0
500
1000
1500
2000
2500
3000
BK1
BK2
AS4
BS1
2
SR18
SR22
PT2
8
MP32
MP35
MP36
TP38
TP40
KG
45
KG
46
CB47
CB48
VR49
VR50
TD51
TD52
Station
Tota
l P (µg
g d
ry w
eig
ht)
Dry season
Wet season
-1
0
10
20
30
40
50
60
70
80
BK1
BK2
AS4
BS12
SR18
SR22
PT28
MP3
2
MP3
5
MP3
6
TP38
TP40
KG
45
KG
46
CB4
7
CB4
8
VR49
VR50
TD51
TD52
Station
Ava
ilab
le P
(µg
g d
ry w
eig
ht)
Dry season
Wet season
-1
(a)(a)(a)(a)(a)
ScienceAsia ScienceAsia ScienceAsia ScienceAsia ScienceAsia 30 (2004)30 (2004)30 (2004)30 (2004)30 (2004) 219
0
20
40
60
80
100
BK1
BK2
AS4
BS12
SR18
SR22
PT28
MP3
2
MP3
5
MP3
6
TP38
TP40
KG45
KG46
CB4
7
CB4
8
VR49
VR50
TD51
TD52
Station
% T
ota
l P
Residual P
Ca-P
Fe and Al-P
Adsorbed-P
0
20
40
60
80
100
BK1
BK2
AS4
BS12
SR18
SR22
PT28
MP3
2
MP3
5
MP3
6
TP38
TP40
KG45
KG46
CB4
7
CB4
8
VR49
VR50
TD51
TD52
Station
% T
ota
l P
Residual P
Ca-P
Fe and Al-P
Adsorbed-P
immobile form in sediments4, it may become availablefor algae growth by a mineralization process involvingmicrobial activity1,4,6. Moreover, the results obtainedhere show negative correlation of available P withorganic matter (r = -0.431, p<0.01) and with dissolvedoxygen (r = -0.257, p<0.05) (Table 7). This indicatesthat utilization of oxygen by microbial activity hadoccurred during organic matter decomposition,resulting in P-release from organic materials in thesediments. Gonsiorczyk et al25 also reported that themineralization of organic matter was the driving forceof P-release by sediments in eutrophic lakes. Therefore,the role of organic matter was considered a potentialsource of available P in the dry season of this study. Inaddition a significant correlation between the available
P and clay, as well as Mn oxides, was obtained(Table 7). This was possibly due to organic matterassociated with clay content and metal oxides26.
In the wet season, available P significantly correlatedwith loosely adsorbed P (r = 0.322, p<0.05) and Fe, Al-bound P (r = 0.267, p<0.05) (Table 8), indicating thebioavailability of P in the wet season was derived largelyfrom the two fractions. Phosphorus can be releasedfrom the two fractions into the overlying water bychanges of pH and redox potential (Eh)4. Sediment pHis associated with Eh27. The redox potential has aninfluence on the precipitation of Fe and Mn oxides inoxic sediments (high Eh). When sediments becomeanoxic (low Eh), Fe and Mn can occur as solublemanganous (Mn+2) and ferrous (Fe+2) ions28, and allow
Fig 3. Different chemical forms of phosphorus distributed in the East Coast sediments in (a) dry season (April 2001) and (b) wetseason (July 2001). The stations are coded as defined in Table 1.
(b)(b)(b)(b)(b)
(a)(a)(a)(a)(a)
220 ScienceAsia ScienceAsia ScienceAsia ScienceAsia ScienceAsia 30 (2004)30 (2004)30 (2004)30 (2004)30 (2004)
phosphate to diffuse more freely into the overlyingwater. Possibly, the release of P in the river estuarieswas largely from Fe, Al-bound P, rather than fromloosely adsorbed P, because there was a larger portionof the former fraction, which agrees with the reportsof Upchurch et al29 and Gonsiorczyk et al25. The availableP in the wet season also established a significant andhigh correlation with total and amorphous Mn oxides(r = 0.620 and r = 0.702, respectively) (Table 8). Sucha correlation could not be obtained with any Fe oxides,since Fe oxides are more difficult to reduce than Mnoxides26 resulting in P being strongly held with Fe ratherthan with Mn. This being the case, the release of P fromFe, Al-inorganic complexes in the wet season was mainlyfrom Mn oxides, especially the amorphous form, ratherthan from Fe oxides.
Relationship between Sediment P and SelectedRelationship between Sediment P and SelectedRelationship between Sediment P and SelectedRelationship between Sediment P and SelectedRelationship between Sediment P and SelectedSediment CharacteristicsSediment CharacteristicsSediment CharacteristicsSediment CharacteristicsSediment Characteristics
For both seasons, sediment P (both inorganic andorganic forms) was most strongly correlated with totaland amorphous Fe oxides, followed by clay content(Tables 7 and 8). No significant correlation betweentotal P and organic matter or CaCO
3 could be obtained.
This correlation indicated that both cystralline andamorphous Fe oxides were the major P sorbent of thesediments, followed by clay, respectively, while organicmatter and CaCO
3 were less effective or may not be
responsible for P sorbed in the study area. Fe oxides arequite common in sediments as suspended particles andas coatings on clay mineral surfaces and humicsubstances in organic matter26. They have high specificsurface areas and great reactivity26, making them a
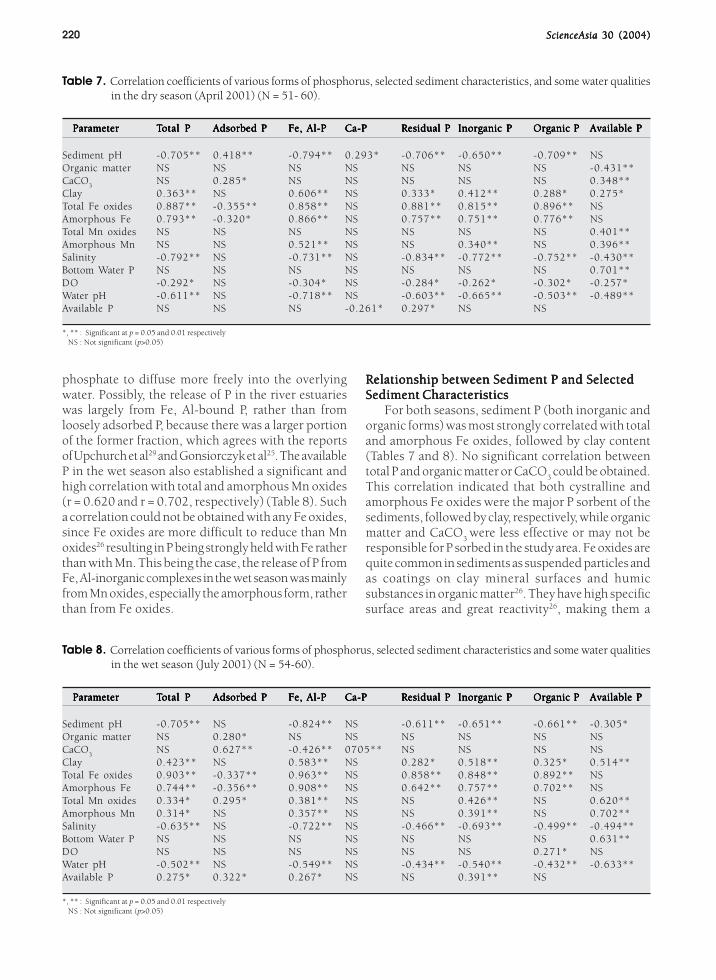
Table 7. Correlation coefficients of various forms of phosphorus, selected sediment characteristics, and some water qualitiesin the dry season (April 2001) (N = 51- 60).
Parameter Parameter Parameter Parameter Parameter TTTTTotal Potal Potal Potal Potal P Adsorbed PAdsorbed PAdsorbed PAdsorbed PAdsorbed P Fe, Al-PFe, Al-PFe, Al-PFe, Al-PFe, Al-P Ca-PCa-PCa-PCa-PCa-P Residual PResidual PResidual PResidual PResidual P Inorganic PInorganic PInorganic PInorganic PInorganic P Organic POrganic POrganic POrganic POrganic P Available PAvailable PAvailable PAvailable PAvailable P
Sediment pH -0.705** 0.418** -0.794** 0.293* -0.706** -0.650** -0.709** NSOrganic matter NS NS NS NS NS NS NS -0.431**CaCO
3NS 0.285* NS NS NS NS NS 0.348**
Clay 0.363** NS 0.606** NS 0.333* 0.412** 0.288* 0.275*Total Fe oxides 0.887** -0.355** 0.858** NS 0.881** 0.815** 0.896** NSAmorphous Fe 0.793** -0.320* 0.866** NS 0.757** 0.751** 0.776** NSTotal Mn oxides NS NS NS NS NS NS NS 0.401**Amorphous Mn NS NS 0.521** NS NS 0.340** NS 0.396**Salinity -0.792** NS -0.731** NS -0.834** -0.772** -0.752** -0.430**Bottom Water P NS NS NS NS NS NS NS 0.701**DO -0.292* NS -0.304* NS -0.284* -0.262* -0.302* -0.257*Water pH -0.611** NS -0.718** NS -0.603** -0.665** -0.503** -0.489**Available P NS NS NS -0.261* 0.297* NS NS
*, ** : Significant at p = 0.05 and 0.01 respectively NS : Not significant (p>0.05)
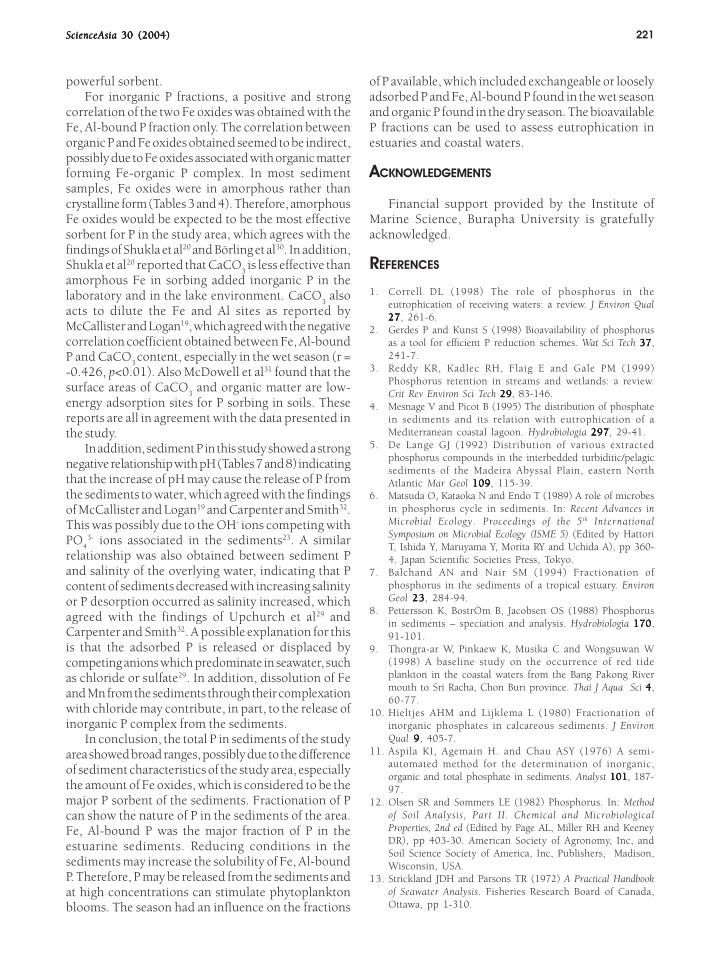
Table 8. Correlation coefficients of various forms of phosphorus, selected sediment characteristics and some water qualitiesin the wet season (July 2001) (N = 54-60).
Parameter Parameter Parameter Parameter Parameter TTTTTotal Potal Potal Potal Potal P Adsorbed PAdsorbed PAdsorbed PAdsorbed PAdsorbed P Fe, Al-PFe, Al-PFe, Al-PFe, Al-PFe, Al-P Ca-PCa-PCa-PCa-PCa-P Residual PResidual PResidual PResidual PResidual P Inorganic PInorganic PInorganic PInorganic PInorganic P Organic POrganic POrganic POrganic POrganic P Available PAvailable PAvailable PAvailable PAvailable P
Sediment pH -0.705** NS -0.824** NS -0.611** -0.651** -0.661** -0.305*Organic matter NS 0.280* NS NS NS NS NS NSCaCO
3NS 0.627** -0.426** 0705** NS NS NS NS
Clay 0.423** NS 0.583** NS 0.282* 0.518** 0.325* 0.514**Total Fe oxides 0.903** -0.337** 0.963** NS 0.858** 0.848** 0.892** NSAmorphous Fe 0.744** -0.356** 0.908** NS 0.642** 0.757** 0.702** NSTotal Mn oxides 0.334* 0.295* 0.381** NS NS 0.426** NS 0.620**Amorphous Mn 0.314* NS 0.357** NS NS 0.391** NS 0.702**Salinity -0.635** NS -0.722** NS -0.466** -0.693** -0.499** -0.494**Bottom Water P NS NS NS NS NS NS NS 0.631**DO NS NS NS NS NS NS 0.271* NSWater pH -0.502** NS -0.549** NS -0.434** -0.540** -0.432** -0.633**Available P 0.275* 0.322* 0.267* NS NS 0.391** NS
*, ** : Significant at p = 0.05 and 0.01 respectively NS : Not significant (p>0.05)
ScienceAsia ScienceAsia ScienceAsia ScienceAsia ScienceAsia 30 (2004)30 (2004)30 (2004)30 (2004)30 (2004) 221
powerful sorbent.For inorganic P fractions, a positive and strong
correlation of the two Fe oxides was obtained with theFe, Al-bound P fraction only. The correlation betweenorganic P and Fe oxides obtained seemed to be indirect,possibly due to Fe oxides associated with organic matterforming Fe-organic P complex. In most sedimentsamples, Fe oxides were in amorphous rather thancrystalline form (Tables 3 and 4). Therefore, amorphousFe oxides would be expected to be the most effectivesorbent for P in the study area, which agrees with thefindings of Shukla et al20 and Börling et al30. In addition,Shukla et al20 reported that CaCO
3 is less effective than
amorphous Fe in sorbing added inorganic P in thelaboratory and in the lake environment. CaCO
3 also
acts to dilute the Fe and Al sites as reported byMcCallister and Logan19, which agreed with the negativecorrelation coefficient obtained between Fe, Al-boundP and CaCO
3 content, especially in the wet season (r =
-0.426, p<0.01). Also McDowell et al31 found that thesurface areas of CaCO
3 and organic matter are low-
energy adsorption sites for P sorbing in soils. Thesereports are all in agreement with the data presented inthe study.
In addition, sediment P in this study showed a strongnegative relationship with pH (Tables 7 and 8) indicatingthat the increase of pH may cause the release of P fromthe sediments to water, which agreed with the findingsof McCallister and Logan19 and Carpenter and Smith32.This was possibly due to the OH- ions competing withPO
43- ions associated in the sediments23. A similar
relationship was also obtained between sediment Pand salinity of the overlying water, indicating that Pcontent of sediments decreased with increasing salinityor P desorption occurred as salinity increased, whichagreed with the findings of Upchurch et al29 andCarpenter and Smith32. A possible explanation for thisis that the adsorbed P is released or displaced bycompeting anions which predominate in seawater, suchas chloride or sulfate29. In addition, dissolution of Feand Mn from the sediments through their complexationwith chloride may contribute, in part, to the release ofinorganic P complex from the sediments.
In conclusion, the total P in sediments of the studyarea showed broad ranges, possibly due to the differenceof sediment characteristics of the study area, especiallythe amount of Fe oxides, which is considered to be themajor P sorbent of the sediments. Fractionation of Pcan show the nature of P in the sediments of the area.Fe, Al-bound P was the major fraction of P in theestuarine sediments. Reducing conditions in thesediments may increase the solubility of Fe, Al-boundP. Therefore, P may be released from the sediments andat high concentrations can stimulate phytoplanktonblooms. The season had an influence on the fractions
of P available, which included exchangeable or looselyadsorbed P and Fe, Al-bound P found in the wet seasonand organic P found in the dry season. The bioavailableP fractions can be used to assess eutrophication inestuaries and coastal waters.
ACKNOWLEDGEMENTS
Financial support provided by the Institute ofMarine Science, Burapha University is gratefullyacknowledged.
REFERENCES
1. Correll DL (1998) The role of phosphorus in theeutrophication of receiving waters: a review. J Environ Qual2727272727, 261-6.
2. Gerdes P and Kunst S (1998) Bioavailability of phosphorusas a tool for efficient P reduction schemes. Wat Sci Tech 3737373737,241-7.
3. Reddy KR, Kadlec RH, Flaig E and Gale PM (1999)Phosphorus retention in streams and wetlands: a review.Crit Rev Environ Sci Tech 2929292929, 83-146.
4. Mesnage V and Picot B (1995) The distribution of phosphatein sediments and its relation with eutrophication of aMediterranean coastal lagoon. Hydrobiologia 297297297297297, 29-41.
5. De Lange GJ (1992) Distribution of various extractedphosphorus compounds in the interbedded turbiditic/pelagicsediments of the Madeira Abyssal Plain, eastern NorthAtlantic Mar Geol 109109109109109, 115-39.
6. Matsuda O, Kataoka N and Endo T (1989) A role of microbesin phosphorus cycle in sediments. In: Recent Advances inMicrobial Ecology. Proceedings of the 5th InternationalSymposium on Microbial Ecology (ISME 5) (Edited by HattoriT, Ishida Y, Maruyama Y, Morita RY and Uchida A), pp 360-4. Japan Scientific Societies Press, Tokyo.
7. Balchand AN and Nair SM (1994) Fractionation ofphosphorus in the sediments of a tropical estuary. EnvironGeol 2323232323, 284-94.
8. Pettersson K, BostrÖm B, Jacobsen OS (1988) Phosphorusin sediments – speciation and analysis. Hydrobiologia 170170170170170,91-101.
9. Thongra-ar W, Pinkaew K, Musika C and Wongsuwan W(1998) A baseline study on the occurrence of red tideplankton in the coastal waters from the Bang Pakong Rivermouth to Sri Racha, Chon Buri province. Thai J Aqua Sci 44444,60-77.
10. Hieltjes AHM and Lijklema L (1980) Fractionation ofinorganic phosphates in calcareous sediments. J EnvironQual 9 9 9 9 9, 405-7.
11. Aspila KI, Agemain H. and Chau ASY (1976) A semi-automated method for the determination of inorganic,organic and total phosphate in sediments. Analyst 101101101101101, 187-97.
12. Olsen SR and Sommers LE (1982) Phosphorus. In: Methodof Soil Analysis, Part II. Chemical and MicrobiologicalProperties, 2nd ed (Edited by Page AL, Miller RH and KeeneyDR), pp 403-30. American Society of Agronomy, Inc, andSoil Science Society of America, Inc, Publishers, Madison,Wisconsin, USA.
13. Strickland JDH and Parsons TR (1972) A Practical Handbookof Seawater Analysis. Fisheries Research Board of Canada,Ottawa, pp 1-310.
222 ScienceAsia ScienceAsia ScienceAsia ScienceAsia ScienceAsia 30 (2004)30 (2004)30 (2004)30 (2004)30 (2004)
14. Goh TB, Arnaud RJSt and Mermut AR (1993) Carbonates.In: Soil Sampling and Methods of Analysis (Edited by CarterMR), pp 177-85. Canadian Society of Soil Science. LewisPublishers, Boca Raton.
15. Nelson DW and Sommers LE (1982) Total carbon, organiccarbon and organic matter. In: Method of Soil Analysis, PartII. Chemical and Microbiological Properties, 2nd ed (Edited byPage AL, Miller RH and Keeney DR) pp 539-79. AmericanSociety of Agronomy, Inc, and Soil Science Society of America,Inc, Publishers, Madison, Wisconsin, USA.
16. English S, Wilkinson C and Baker V (1994) Survey Manualfor Tropical Marine Resources. ASEAN-Australia MarineScience Project, Living Coastal Resources, Australia Instituteof Marine Science, Townsville, pp 1-368.
17. Hillel D (1998) Environmental Soil Physics Academic Press,San Diego.
18. Ross GJ and Wang C (1993) Extractable Al, Fe, Mn, and Si.In: Soil Sampling and Methods of Analysis. (Edited by CarterMR), pp 239-41. Canadian Society of Soil Science. LewisPublishers, Boca Raton.
19. McCallister DL and Logan TJ (1978) Phosphate adsorption-desorption characteristics of soils and bottom sediments inthe Maumee River basin of Ohio. J Environ Qual 77777, 87-92.
20. Shukla SS, Syers JK, Williams JDH, Armstrong DE and HarrisRF (1971) Sorption of inorganic phosphate by lakesediments. Soil Sci Soc Amer Proc 3535353535, 244-9.
21. Syers JK, Harris RF and Armstrong DE (1973) Phosphatechemistry in lake sediments. J Environ Qual 22222, 1-14.
22. Fang TH (2000) Partitioning and behaviour of different formsof phosphorus in the Tanshui estuary and one of its tributaries,Northern Taiwan. Estua Coast Shelf Sci 5050505050, 689-701.
23. Frankowski L, Bolalek J and Szostek A (2002) Phosphorusin bottom sediments of Pomeranian Bay (Southern Baltic-Poland). Estua Coast Shelf Sci 5454545454, 1027-38.
24. López-Piñeiro A and Garcia-Navarro A (2001) Phosphatefractions and availability in vertisols of south-western Spain.Soil Sci 166166166166166, 548-56.
25. Gonsiorczyk T, Casper P and Koschel R (1998) Phosphorus-binding forms in the sediment of an oligotrophic and aneutrophic hardwater lake of the Baltic lake district(Germany). Wat Sci Tech 3737373737, 51-8.
26. Sparks DL (1995) Environmental Soil Chemistry. AcademicPress, San Diego.
27. Tan KM (1982) Principles of Soil Chemistry. Marcel Dekker,Inc, New York.
28. Olsen CR, Cutshall NH and Larsen IL (1982) Pollutant-particle associations and dynamics in coastal marineenvironments: a review. Mar Chem 1111111111, 501-33.
29. Upchurch JB, Edzwald JK and O’Melia CR (1974) Phosphatesin sediments of Pamlico Estuary. Environ Sci Tech 88888, 56-8.
30. Börling K, Otabbong E and Barberis E (2001) Phosphorussorption in relation to soil properties in some cultivatedSwedish soils. Nutrient Cycling in Agroecosystems 5959595959, 39-46.
31. McDowell R, Sharpley A, Brookes P and Poulton P (2001)Relationship between soil test phosphorus and phosphorusrelease to solution. Soil Sci 166166166166166, 137-49.
32. Carpenter PD and Smith JD (1984) Effect of pH, iron andhumic acid on the estuarine behaviour of phosphate. EnvironTech 66666, 65-72.