aerodynamic study of an ahmed body with the help of cfd
TRANSCRIPT
Aerodynamic Study of an Ahmed Body with the help of CFD Simulation
Indrashis Saha1a, Tathagatha Mukherjee2b, Ankit Saha3c, Richa Pandey4d
a) [email protected], b) [email protected], c) [email protected], d) [email protected]
1,3. Department of Chemical Engineering, University of Calcutta, India
2.Department of Mechanical Engineering, Birla Institute of Technology, Mesra, India
4Assistant Professor, Department of Mechanical Engineering, Birla Institute of Technology, Mesra, India
Abstract
Automotive aerodynamics comprises of the study of aerodynamics of road vehicles. Its main goals are reducing drag,
minimizing noise emission, improving fuel economy, preventing undesired lift forces and minimizing other causes of
aerodynamic instability at high speeds. The Ahmed body has the form of a highly simplified car, consisting of a blunt
nose with rounded edges fixed onto a box-like middle section and a rear end that has an upper slanted surface, the
angle of which can be varied. It retains vital features of real vehicles in order to study the flow fields around it and the
related turbulence models which characterizes the actual flow at elevated Reynolds number. In the present study, the
aerodynamic behavior of this body is investigated numerically by the aid of commercial CFD tool: Ansys Fluent. The
results of the simulation are validated with available experimental data and results of the simulations from other
literatures. The numerical data were obtained for a fixed free stream velocity of 25 m/s at the inlet. The simulations
were performed at a fixed slant angle of 25 degree and zero yaw angle. The present study focuses on how local
refinement of mesh inside the concerned body and the outside, helps affect the results and for which grid dependency
test is the primary objective of this paper. The present study also helps demonstrate how the drag of the body behaves,
which is mainly the effect of pressure drag force generated at the rear portion of the body. The study also focuses on
important properties like the velocity magnitude at different locations for different meshing cases, and to capture the
flow pattern in the front or near the wake region. The study can be further helpful to future researchers in determining
resistance, fuel efficiency etc. helping designers to optimize in specialized areas for better efficiency.
Keywords: Ahmed Body, vehicle aerodynamics, drag force measurement, Simulation/Numerical investigation
1. Introduction
The Ahmed body was at first put forward by Ahmed et al. (1984). is a general car model which is used by the
automotive industries (Morel (1978), Good and Garry (2004), Guilmineau and Chometon (2009), Heft et al. (2012)
and Huminic and Huminic (2012)), to examine the wake forces and dynamics which is experienced in a verity of
configurations. The Ahmed body is designed to have a smooth-edged front end with a flat roof and a flat bottom
section and an angled back slant which basically acts as the rear window of a car and ending with a vertical base. The
back-slant angle which is commonly designated as ϕ is very critical to the flow patterns which are fashioned at the
near wake region and subsequently has an impact on the aerodynamic forces which act on the body. Car companies
makes numerous attempts to develop modified designs to effectively reduce the aerodynamic drag force which occurs
at the rear end without putting any constraints in the stability, comfort and safety of the passengers. The aerodynamic
drag of road automobiles is firmly connected to the vehicle’s wake downstream flow. The separation zone size and
the drag force FD directly rest mainly on the position of flow separation over the Ahmed body. Subsequently,
comprehensive facts regarding the wake flow characteristics and its connection with the geometry of body is essential
for a successful design of upcoming future cars. The application of Computational Fluid Dynamics (CFD) in
determining fluid flow pattern has been observed to be very common among researchers in the present days. CFD
modeling in determining flow line of fluid around the Ahmed body has been utilized since the early 21st century. In
many open literatures, the CFD application in determining air flow pattern and the changes in flow motion with
altering geometry of the Ahmed body have been found. Certain modifications in the Ahmed body aids researches and
designers to determine the effect of modification on the resultant drag and lift force which can be calculated using
Preprints (www.preprints.org) | NOT PEER-REVIEWED | Posted: 12 June 2020 doi:10.20944/preprints202006.0149.v1
© 2020 by the author(s). Distributed under a Creative Commons CC BY license.
CFD modeling. The chief purpose of automotive aerodynamics is the reduction of drag, lessening noise emission,
increasing fuel economy and eliminating unnecessary lift forces and other origins of aerodynamic unsteadiness which
arises at high speeds. The conventional Ahmed reference model has been considered as the standard model in this
research work for carrying out numerical simulations for researching on the aerodynamic parameters. The Ahmed
body has alike featured like a general car and is broadly utilized for authentication of new codes in the automobile
industry. This simple geometric model has a length of 1.044-meter, height of 0.288 meter and a width of 0.389 meter.
It consists of cylindrical legs of 0.5-meter radius attached to the bottommost part of the body. The rearmost surface
has an inclination of 25 degrees. Ahmed body characterizes the simplified geometry of a ground vehicle as a bluff
body type. Its geometry is adequate enough for precise flow simulation and retains few vital practical features relevant
to cars. This model aids engineers and designers to generate turbulent flow field surrounding the simple car model by
the use of k-epsilon model. In spite of neglecting quite a few numbers of features of a real car like rough underside,
rotating wheels, surface projections etc. The Ahmed body generates the crucial features of flow pattern around a car
for instance flow impinge-mentation and the displacement around the nose, relative uniform flow of air around the
middle portion and flow separation along with the wake generation at the rear. Since the Ahmed body is easy to model,
it can be effortlessly utilized for researching various properties like turbulence, drag coefficient, wake region, lift
forces, velocity magnitude at various regions of the car, magnitude of pressure around the car which helps in
determining what will be resistance, fuel efficiency etc. of the car thereby providing designers a clear idea on which
region needs to be optimized for better effectiveness. The main objective of this study being stimulation of turbulent
flow within the wind tunnel and around the Ahmed body to capture the flow pattern at the rear and wake region. A
local refinement of mesh inside the concerned body is done with necessary body and face sizing’s of the parts of the
Ahmed body to generate well defined plots for pressure and velocity contours and its grid dependency test is the
primary focus of this paper.
2. Methodology
CFD modeling involves a series of steps for numerically solving the fluid flow movement. The steps involved are
creation of geometry, meshing and numerical setting based on which the fluid trajectory will be determined. Each of
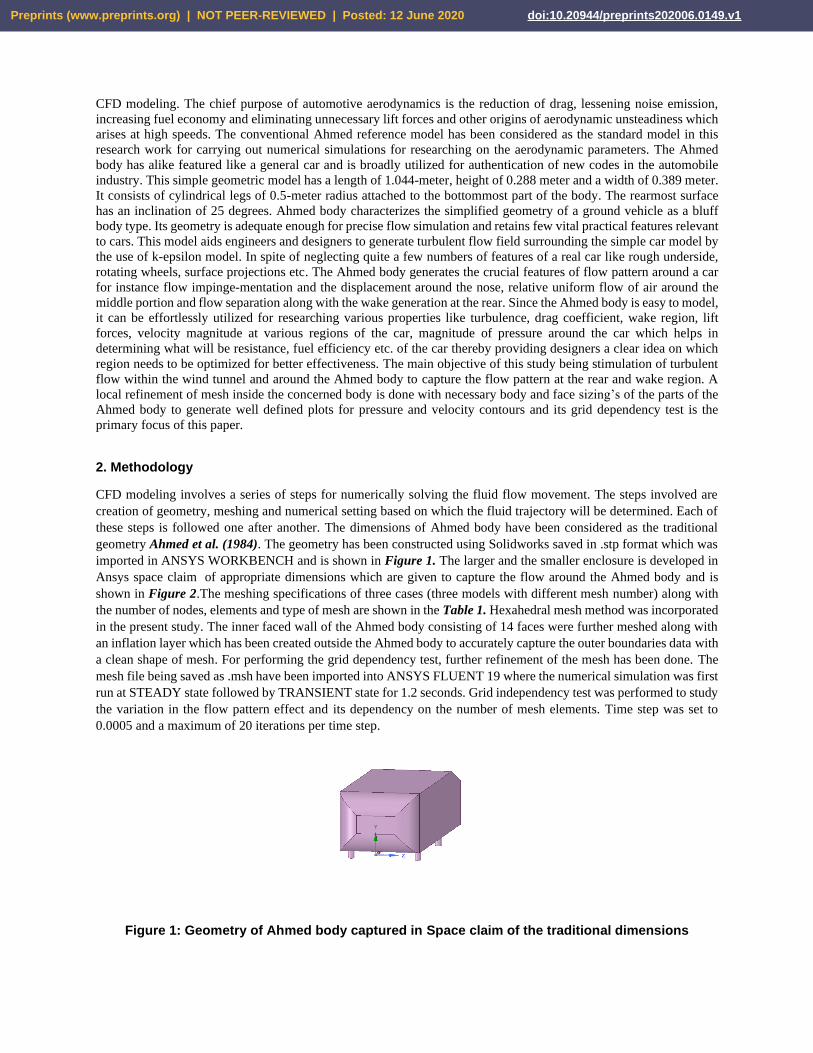
these steps is followed one after another. The dimensions of Ahmed body have been considered as the traditional
geometry Ahmed et al. (1984). The geometry has been constructed using Solidworks saved in .stp format which was
imported in ANSYS WORKBENCH and is shown in Figure 1. The larger and the smaller enclosure is developed in
Ansys space claim of appropriate dimensions which are given to capture the flow around the Ahmed body and is
shown in Figure 2.The meshing specifications of three cases (three models with different mesh number) along with
the number of nodes, elements and type of mesh are shown in the Table 1. Hexahedral mesh method was incorporated
in the present study. The inner faced wall of the Ahmed body consisting of 14 faces were further meshed along with
an inflation layer which has been created outside the Ahmed body to accurately capture the outer boundaries data with
a clean shape of mesh. For performing the grid dependency test, further refinement of the mesh has been done. The
mesh file being saved as .msh have been imported into ANSYS FLUENT 19 where the numerical simulation was first
run at STEADY state followed by TRANSIENT state for 1.2 seconds. Grid independency test was performed to study
the variation in the flow pattern effect and its dependency on the number of mesh elements. Time step was set to
0.0005 and a maximum of 20 iterations per time step.
Figure 1: Geometry of Ahmed body captured in Space claim of the traditional dimensions
Preprints (www.preprints.org) | NOT PEER-REVIEWED | Posted: 12 June 2020 doi:10.20944/preprints202006.0149.v1

Figure 2: Geometry of Inner and Outer enclosure of appropriate dimensions.
Table 1: Mesh Details
Mesh Details CASE 1 CASE 2 CASE 3
Main enclosure 200 mm 100 mm 90 mm
Small enclosure 70 mm 70 mm 50 mm
Body sizing of the Ahmed
body
20 mm 20 mm 10 mm
Face sizing of the legs of
Ahmed Body
5 mm 5 mm 5 mm
Inflation: (5 layers) First Layer thickness
height-0.57 mm
(5 layers) Total
thickness-12.4 mm
(8 layers) Total
thickness-35 mm
Elements 119379 143713 206443
Nodes 34053 70118 71772
Figure 3: Cut section view of the local refinement of the mesh.
Figure 4: Cut section view of the inflation layers applied on the Ahmed body
Preprints (www.preprints.org) | NOT PEER-REVIEWED | Posted: 12 June 2020 doi:10.20944/preprints202006.0149.v1

Figure 5: Close proximity applied around the legs of the Ahmed body
Figure 6: Bottom view of the legs refined with face sizing
Table 2: Numerical Settings or Case Setup in Fluent
Type Density Based
Velocity Formulation
Type of solver
Absolute
Density based
Flow Method STEADY for 2000 iterations and TRANSIENT for 1.2 seconds
Viscous/Turbulence Model used k-epsilon model
Inlet velocity 25 m/sec
Outlet pressure 1 atm
Initialization Hybrid
Material Fluid air
Density of air 1.225 kg/m3
Viscosity 1.7894e-5 Kg/m-sec
Lower wall Stationary wall
Side wall Symmetry condition
Table 2 shows the numerical settings which were applied in Fluent 19 to simulate the air flow movement around the
Ahmed Body. Several planes were created to successfully capture the velocity contour and animations have been
recorded to visualize the air flow around the body. Exactly same numerical setting has been used in all three cases for
grid independent test to avoid discrepancy.
3. Post Processing Results and Discussion
A cut plane (XY Plane) is created in the center of wind tunnel as well as 5 planes are created in the YZ direction at
different locations in the Post Processing over the Ahmed body. This gives the velocity of air along different geometry
sections of the Ahmed body. The results and the plots are explained in the following subsection.
3.1 Velocity vector plot for the transverse plane (XY plane)
The Figures 3 is a good overview of the velocity distributions with vector plots around the Ahmed body. The plots in
the X-Y plane are for three different local refinements for the required grid independency test. The mean velocity
vectors along the first edge of the slant indicates no separation of flow. The boundary layer separation starts at the rear
Preprints (www.preprints.org) | NOT PEER-REVIEWED | Posted: 12 June 2020 doi:10.20944/preprints202006.0149.v1

wake region due to high negative pressure gradients. In Case1,the yellow to orange region is the display of the
velocities within 22.5 to 30 m/s while the lower wall captures the boundary layer starting from nearly negligible
velocity to increasing velocities as it enters the second enclosure and is furthur refined. We can also observe the wake
region to be sharper as ths slant angle is 25 deg. In the experimental results a little wider wake region has been observed
in previous published literatures with lesser angles such as 12.5 deg. The wake region indicates very low velocity
region which is the reason for appearance of small vector fields in the wake region. Comparing Figure 7(a) with
Figure 7(b) we can see that the maximum velocity for Case 2 is higher than Case 1.The blue region show low velocity
and a high pressure region and the red region around the turns or corners of the Ahmed body highlights the region of
low pressure and highest velocity. We can also see the counter rotating trailing vortex on the velocity contour.The
main motive behind Figure 3 is to see how the vector lines in the wake region behaves. It can be seen from the vector
plot that there are lots of detachments/attachments and recirculation zones at the trailing end of the Ahmed body for
the refined setup compared to the base setup. These vortices are responsible for maintaining attached flow at the slant.
The plots further reveals a magnified and a clear wake region in the two refined setups compared to the base setup.
7(a): CASE1(Base Setup) 7(b):CASE2(1st Refined Setup )
7(c): CASE3(2nd Refined Setup)
Figure 7: Velocity vector plots captured for 7(a)CASE1,7(b)CASE2,7(c)CASE3
3.2 Velocity streamline plot for the transverse plane (XY plane)
The Figure 8 shows the known time-averaged streamlines and streamwise velocity component contours in the
symmetric plane created in the middle of the enclosure in XY direction, predicted by the CFD software. The boundary
layer separation occurs on the rear slant with increase in lift due to larger pressure gradient generated in the slant. The
sudden vacuums zone created on the wake region generate eddies. The spatial positions and dimensions of the upper
Preprints (www.preprints.org) | NOT PEER-REVIEWED | Posted: 12 June 2020 doi:10.20944/preprints202006.0149.v1

and lower vortices in the rear wake region of the body given by the coarse and fine Refined Setup which is in close
agreement with the Base Setup.
8(a): CASE1(Base Setup) 8(b):CASE2(1st Refined Setup)
8(c): CASE3(2nd Refined Setup)
Figure 8: Velocity streamline plots captured for 8(a)CASE1,8(b)CASE2,8(c)CASE3
3.3 Velocity vector plots for 5 different transverse planes created at different positions (YZ plane)
Figure 9,10 and 11 for the 3 different cases of meshing shows the downstream development of the counter rotating
trailing vortex at a specific slant angle of 25 deg. The contours represent regions of constant magnitude downstream
velocity. At a distance of 1.11m downstream at the trailing edge of the Ahmed body, there is a large and strong region
of recirculation back towards the Ahmed surface. Although the recirculation has somewhat disappeared by x =1.22m,
there is still a large streamwise velocity deficit. At x=1.38 m and greater the location of the cores of the trailing vortices
can still be differentiated by deficits in streamwise velocity. In the upper part of the slanted surface there is small
recirculation zones and exceeding this region the vector line behavior suggests that the flow reattaches itself leading
to the development of circulation region in the lower most part of the rear end.
Preprints (www.preprints.org) | NOT PEER-REVIEWED | Posted: 12 June 2020 doi:10.20944/preprints202006.0149.v1

3.3.1 CASE 1
9(a) 9(b)
9(c) 9(d)
Figure 9: Velocity vector plots at planes created at distance of (a)x=0.7m, (b)x=1.11m, (c)x=1.22m,
(d)x=1.38m
3.3.2 CASE 2
10(a) 10(b)
Preprints (www.preprints.org) | NOT PEER-REVIEWED | Posted: 12 June 2020 doi:10.20944/preprints202006.0149.v1

10(c) 10(d)
Figure 10: Velocity vector plots at planes created at distance of
(a)x=0.7m,(b)x=1.11m,(c)x=1.22m,(d)x=1.38m
3.3.3 CASE 3
11(a) 11(b)
11(c) 11(d)
Figure 11: Velocity vector plots at planes created at distance of
(a)x=0.7m,(b)x=1.11m,(c)x=1.22m,(d)x=1.38m
3.4 Velocity distribution plot for 4 different probes located at the front and rear end.
For all the cases, probes are created at fixed locations in the wake region and near ahmed body & velocity across Y
distance is plotted. This observation and study gives data of how the velocity behaves in a graphical manner between
Preprints (www.preprints.org) | NOT PEER-REVIEWED | Posted: 12 June 2020 doi:10.20944/preprints202006.0149.v1

two distant probes, their values and can be compared across different Cases. It allows for flexibility to export the data
and use it for further calculations as well.
In Case1, we can see the velocity at the front of the Ahmed body increases from 0 to 18m/s and then again decreases
near the stagnation zone to a velocity of 8m/s and then increasing again. Similar patterns are observed with the other
3 in the wake region, but depending on the probe location, the closer the probe to the center of the wake region(:1.11m)
the lower the velocity has dropped and at later probe locations the velocity drop decreases, such that the probe on
1.22m and 1.38m the velocity is not negative. The velocity did not drop at the probe location of 1.38 m in the wake
region suggesting that no reverse vortices are formed.
In Case 2, similar velocity profiles can be observed at a finer mesh and this time the velocity at the probe location of
1.22m slightly drops to negative velocity and the velocity drop is very little in this case for the probe location of 1.38m
in the wake region. In Case 3, it is observed that the wake region expanded a little with the velocity drop at the first
two probe locations(1.11m and 1.22m) as we can observe the middle and last probe shows nearly same results in this
case which wasn’t with the above two. Here in this case the velocity drop was quite to a larger extent than the previous
two case for the probe location at 1.38m.
(a)CASE1(Base Setup) (b)CASE2(1st Refined Setup)
(c)CASE3(2nd Refined Setup)
Figure 12: Comparison of the velocity distribution with respect to height for 12(a)CASE1,
12(b)CASE2, 12(c)CASE3
3.5 Comparison of drift coefficient with other literatures
It can be seen from the table 3 that the results for the value of drift coefficient is more or less near to those found in
other literatures. In the current study for the case 3 the value of the drift coefficient closely matches with the findings
of Meile et al. (2011), Meile et al. (2016). Recent numerical simulations by Guilmineau et al. (2017) for the 25 deg
Preprints (www.preprints.org) | NOT PEER-REVIEWED | Posted: 12 June 2020 doi:10.20944/preprints202006.0149.v1

back slant Ahmed body at inlet velocity of 40 m/s using the EARSM (Explicit Algebraic Reynolds Stress Model)
based on the k -ω turbulence model while their hybrid models -DDES (Delayed Detached Eddy Simulation) and
IDDES (Improved Delayed Detached Eddy Simulation) gives favourable outcome compared with the experimental
results. The data found by Bayraktar et al. (2001) at Reynolds numbers,Re= 4.29·106 are quite similar to those of
Ahmed et al. (1984) at the corresponding Reynolds number. Bayraktar et al. (2001) carried out various measurements
for free stream velocity ranging from 10 m/s to 40 m/s while the present study was simulated with inlet free stream
velocity at 25m/s and at Reynolds Number, Re =2.78·106. Figure 9 shows the comparison of the values of CD for the
present simulation with the experimental datas of Bayraktar et al. (2001). It can be seen from the Figure 8 that Case
3 has generated the most similar value with the experimental data of drift coefficient which suggests with proper
refinement and increased mesh count, it gives accurate results. A wide range of values for the drag coefficients has
been reported in previous published literature, and the variation in the experimental values can be related to the type
of wind tunnel (open or closed), turbulence intensity, inlet velocity, surface roughness etc. In the numerical CFD
simulations, this variation can be attributed to the spatial resolution, numerical formulation or the Case setup, and
turbulence model used.
Figure 13: Comparison between the data’s of CD (drift coefficient) for the present simulations with
the experimental data’s at Reynold’s Number, Re=2.78·106 and slant angle ϕ = 25°
Table 3: Comparison of the time-averaged force coefficients with previous studies for the 25° back slant Ahmed
body at zero yaw angle at specified inlet velocities
Literature Review Drift Coefficient, Cd
Meile et al. (2011), Inlet velocity =40m/s 0.299
Meile et al. (2016), Inlet velocity =40m/s 0.2964
Thacker et al. (2012), Inlet velocity =40m/s 0.3840
Rossitto et al. (2016b), Inlet velocity =40m/s 0.356
Guilmineau et al. (2017)-IDDES, Inlet velocity =40m/s 0.3802
Guilmineau et al. (2017)-DDES, Inlet velocity =40m/s 0.4371
Current study Case 1(Base Setup), Inlet velocity =25m/s 0.49
Current study Case 2(1st Refined setup), Inlet velocity =25m/s 0.42
Current study Case 3(2nd refined setup), Inlet velocity =25m/s 0.28
4. Conclusions
The grid dependency test allows us to see smoother velocity profile. As we make the mesh finer i.e. when we increase
the cell counts (closer to the limit), we can see from the vector plots from all the 3 cases, of the velocity that it becomes
more and more smoother. One thing is observable that making the mesh finer lets us see the wake region more
prominent. From the 3 cases, we can conclude that the flow is more defined at lower element size i.e. at case 3. The
finer the mesh gets, the easier it gets in visualizing the contours. Mesh refinement increases the closeness of the
0
0.1
0.2
0.3
0.4
0.5
Case1 Case2 Case3
Present Simulation 0.49 0.42 0.28
Experimental Datas 0.299 0.299 0.299
0.490.42
0.280.299 0.299 0.299
Dri
ft C
oef
fici
ent
Preprints (www.preprints.org) | NOT PEER-REVIEWED | Posted: 12 June 2020 doi:10.20944/preprints202006.0149.v1

resulting values to the true values. From above observations, we conclude that Grid is independent but there is some
margin of error which can be caused by a number of other simulation parameters, for example, the turbulence model
chosen for this simulation is not the best one for it. Local refinement of the enclosure is a great tool for performing
analysis and it improved the results without which wouldn’t have been so accurate and cleared grid dependency in
fluent. This study for all practical purposes gives a great real-world scenario of aerodynamic impact on a car body,
which when improved can help overcome many challenges faced by automobile.
Acknowledgement
Mechanical Engineering faculty members of BIT Mesra had greatly motivated and supported our research team in
pursuing this study. The simulation had been carried on in high-end computers provided by the college.
References
Ahmed, S.R., Ramm, G., Faltin, G., 1984. Some salient features of the time-averaged ground vehicle wake. In: SAE
Technical Paper, 840300. SAE International.
Bayraktar, I., Landman, D., Baysal, O., 2001. Experimental and computational investigation of Ahmed body for
ground vehicle aerodynamics. In: SAE Technical paper. SAE International.
Good, G.M.L., Garry, K.P., 2004. On the use of reference models in automotive aerodynamics. In: SAE Technical
Paper - 2004-01-1308. SAE International.
Guilmineau, E., Chometon, F., 2009. Experimental and numerical study of unsteady wakes behind an oscillating car
model. In: IUTAM Symposium on Unsteady Separated Flows and Their Control: Proceedings of the IUTAM
Symposium - Unsteady Separated Flows and Their Control, Corfu, Greece, 18–22 June 2007. Springer Netherlands,
pp. 367–379.
Guilmineau, E., Deng, G.B., Leroyer, A., Queutey, P., Visonneau, M., Wackers, J., 2017.Assessment of hybrid
RANS-LES formulations for flow simulation around the Ahmed body. Comput. Fluids.
https://doi.org/10.1016/j.compfluid.2017.01.0053 available online, issn: 0045-
7930.https://www.sciencedirect.com/science/article/abs/pii/S0045793017300051
Heft, A.I., Indinger, T., Adams, N.A., 2012. Introduction of a new realistic generic car model for aerodynamic
investigations. In: SAE Technical Paper - 2012-01-0168. SAE International.
Huminic, A., Huminic, G., 2012. Numerical flow simulation for a generic vehicle body on wheels with variable
underbody diffuser. In: SAE Technical Paper. SAE International-2012-01-0172.
Morel, T., 1978. Aerodynamic drag of bluff body shapes characteristic of hatch-back cars. In: SAE Technical Paper.
SAE International.
Meile, W., Brenn, G., Reppenhagen, A., Fuchs, A., 2011. Experiments and numerical simulations on the
aerodynamics of the Ahmed body. CFD Lett. 3, 3239.
Meile, W., Ladinek, T., Brenn, G., Reppenhagen, A., Fuchs, A., 2016. Non-symmetric bistable flow around the
Ahmed body. Int. J. Heat Fluid Flow 57, 34–47.
Rossitto, G., Sicot, C., Ferrand, V., Bor_ee, J., Harambat, F., 2016b. Influence of afterbody rounding on the pressure
distribution over a fastback vehicle. Exp. Fluids 57, 43.
Thacker, A., Aubrun, S., Leroy, A., Devinant, P., 2012. Effects of suppressing the 3D separation on the rear slant on
the flow structures around an Ahmed body. J. Wind Eng. Ind. Aerodynamics 107, 237–243.
Preprints (www.preprints.org) | NOT PEER-REVIEWED | Posted: 12 June 2020 doi:10.20944/preprints202006.0149.v1