cfd investigation on the aerodynamic interferences … · · 2016-08-22... especially for urban...
TRANSCRIPT
1876-6102 © 2015 The Authors. Published by Elsevier Ltd. This is an open access article under the CC BY-NC-ND license (http://creativecommons.org/licenses/by-nc-nd/4.0/).Peer-review under responsibility of the Scientific Committee of ATI 2014doi: 10.1016/j.egypro.2015.12.089
Energy Procedia 81 ( 2015 ) 227 – 239
ScienceDirect
69th Conference of the Italian Thermal Machines Engineering Association, ATI 2014
CFD investigation on the aerodynamic interferences between medium-solidity Darrieus Vertical Axis Wind Turbines
Simone Giorgettia, Giulio Pellegrinia, Stefania Zanforlinb,* aMSc student, University of Pisa, l.go Lucio Lazzarino, 56122 Pisa, Italy
b Assistant Professor, Department of Energy, Systems, Territory and Constructions Engineering, University of Pisa, l.go Lucio Lazzarino, 56122 Pisa, Italy
Abstract
The present study contributes to understand physical mechanisms involved in an achievable power enhancement by setting vertical axis wind turbines in close proximity. The turbines are straight-bladed Darrieus micro-turbines characterized by medium-high solidity and therefore low tip-speed ratio. Preliminary CFD simulations of the isolated turbine explain the reasons why it has a low power output, namely which are laminar flow and laminar separation bubbles on the blades. This fact is expected also considering the low Reynolds number. Subsequently a campaign of CFD simulations has been performed to analyse the aerodynamic interferences in two-rotor configurations. The behaviour of counter-rotating and co-rotating arrangements is analysed at different distances between rotor axes. The simulations show an increasing of power production of about 10% compared to results for the isolated turbine, independently of the sense of rotation. In order to verify wheter vortex shedding suppression might be the cause of the enhanced performance interactions has been simulated between two closely spaced Magnus spinning cylinders with the same tip-speed ratio of the turbines. These last results don’t show reasonable analogies with VAWT wake structures and interactions. Our main conclusion is that accelerated free-stream flow between the turbines is the principle cause of the power extraction enhancement by means of contraction and re-energisation of the turbine wakes. CFD predictions of a four-rotor configuration confirm our hypothesis, nevertheless the wind direction strongly affects the overall efficacy. © 2015 The Authors. Published by Elsevier Ltd. Peer-review under responsibility of the Scientific Committee of ATI 2014.
Keywords: Darrieus wind turbine; high solidity; laminar flow separation; aerodynamic interference; wake energisation
Biographical
Simone Giorgetti and Giulio Pellegrini are MSc students in Energy Engineering at the University of Pisa.
Stefania Zanforlin is Assistant Professor in Fluid Machinery at the University of Pisa. She has a degree in Chemical Engineering and a PhD in Energetics. She has now 18 years of experience in CFD tools applied to internal reactant flows and external flows. Recently her research activity has been focused on wind turbine aerodynamics: assessment of the micro-generation potential in urban environments, performance prediction of offshore turbines on floating platforms, investigation of the aerodynamic interactions between vertical axis turbines.
1 Introduction
* Corresponding author. Tel.: +39-050-2217145; fax: +39-050-2217150.
E-mail addresses: [email protected] (S. Giorgetti), [email protected] (G. Pellegrini), [email protected] (S. Zanforlin)
Available online at www.sciencedirect.com
© 2015 The Authors. Published by Elsevier Ltd. This is an open access article under the CC BY-NC-ND license (http://creativecommons.org/licenses/by-nc-nd/4.0/).Peer-review under responsibility of the Scientific Committee of ATI 2014
228 Simone Giorgetti et al. / Energy Procedia 81 ( 2015 ) 227 – 239
Nowadays vertical-axis wind turbines (VAWTs) are generally considered a promising alternative to horizontal axis wind turbines (HAWTs) especially for small-scale electric power in urban areas. The main advantages of VAWTs are: ability to capture wind from any direction, lack of expensive yaw control mechanisms, low noise levels, compact design; the gearbox and drive train components are located on the ground and this allows easier access, installation, maintenance and repair. On the other hand, VAWTs are penalized by a relatively low efficiency compared to HAWTs and by self-starting issues. Moreover vibrations are an important structural limit due to highly variable blade loadings, especially for urban applications. One technique to reduce vibrations is the decrease of the turbine rotational speed by increasing the solidity [1]. Higher solidities lead to complex aerodynamic mechanisms as vortex shedding and interactions between vortices and turbine blades, therefore power efficiency is usually worse than low solidity rotors. VAWTs could also be used in medium scale wind farms to overcome their typical issues as moderate efficiency and land occupation. Power density should be increased by adopting high aspect ratios (ratio between blade length and diameter) and low turbine spacing, compatibly with the negative effects of wake aerodynamic interactions. Concerning wake interactions, VAWT and HAWT exhibit completely different behaviour. Due to aerodynamic interference between adjacent turbines, in modern wind farms the HAWTs are typically spaced 3÷5 rotor diameters along the cross-wind direction and 6÷10 diameters along the streamwise direction to achieve about 90% of the power output of an isolated HAWT [1]. By contrast, aerodynamic interferences could be effectively exploited to increase the power output of a VAWT farm, as demonstrated by an experimental campaign carried out by Dabiri [3-5] in recent years. Some numerical studies about physical processes of aerodynamic interference can be found in literature [6-9], all of them are based on simplified models, as vortex method or momentum source, and empirical approximations. Despite a large number of 2D CFD investigations of single VAWT, there are still few URANS CFD analyses on wake interferences in two or more VAWTs configurations. The aim of the present study is to give a contribution in this direction.
Nomenclature
R [m] Rotor radius D [m] Rotor diameter N Number of rotors B Number of blades c [m] Chord U∞ [m/s] Far upstream wind velocity φ [°] Wind direction α [°] Blade angle of attack Ω [rad/s] Angular velocity ρ [kg/m3] Air density μ [Pa s] Air viscosity P [W] Power k [m2/s2] Turbulent kinetic energy Re Reynolds Number (Re= ρΩRc/μ ) σ Rotor solidity (σ =Bc/2πR) λ Tip Speed Ratio (λ = ΩR / U∞) Cp Power Coefficient Cp
norm Normalized Power Coefficient
Simone Giorgetti et al. / Energy Procedia 81 ( 2015 ) 227 – 239 229
2 Methodological approach
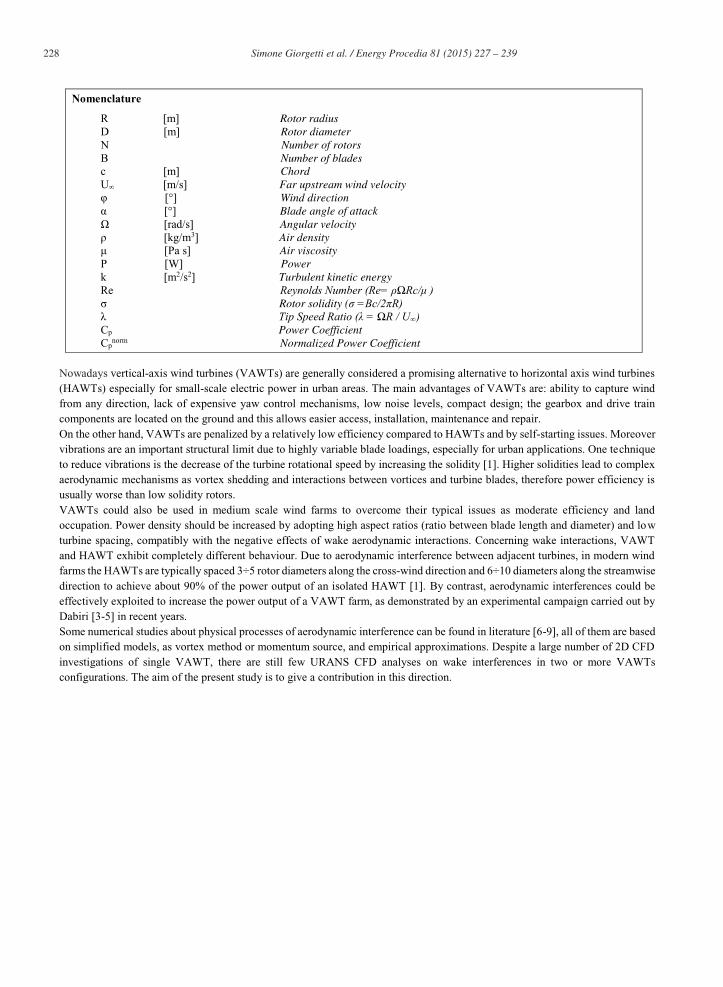
To draw the geometry and create the computational meshes for the turbines and the external domain we adopted the software ANSYS ICEM CFD 14.0. All the grids are unstructured with only quadrilateral elements. The domain has been divided in three parts: the external domain, the ring containing three airfoils and the internal circle. We have drawn a 120° sector mesh with only one airfoil and after that we have used the cylindrical symmetry to copy it and form an entire ring (Figure 2.1). The same figure shows the closed trimming curve around the airfoil used to increase the number of cells around it by setting a large number of nodes along this curve. Only the ring is set as a rotating mesh to simulate the motion of the turbine.
Figure 2.1: 120° sector (on the left) and the entire ring (on the right)
The mesh size is not uniform: we created the smallest elements in proximity of the airfoil surface due to the presence of the boundary layer. The Figure 2.2 shows the prism layer drawn on the airfoil surface.
Figure 2.2: Detail of the prism layer around the airfoil
The method of trimming curves is also applied in the region of external domain, for instance near the turbines, where cells need to be very small. The Figure 2.3 shows an example for the grid of two rotors.
Figure 2.3: Trimming curves on the external domain used to refine the mesh with small elements
230 Simone Giorgetti et al. / Energy Procedia 81 ( 2015 ) 227 – 239
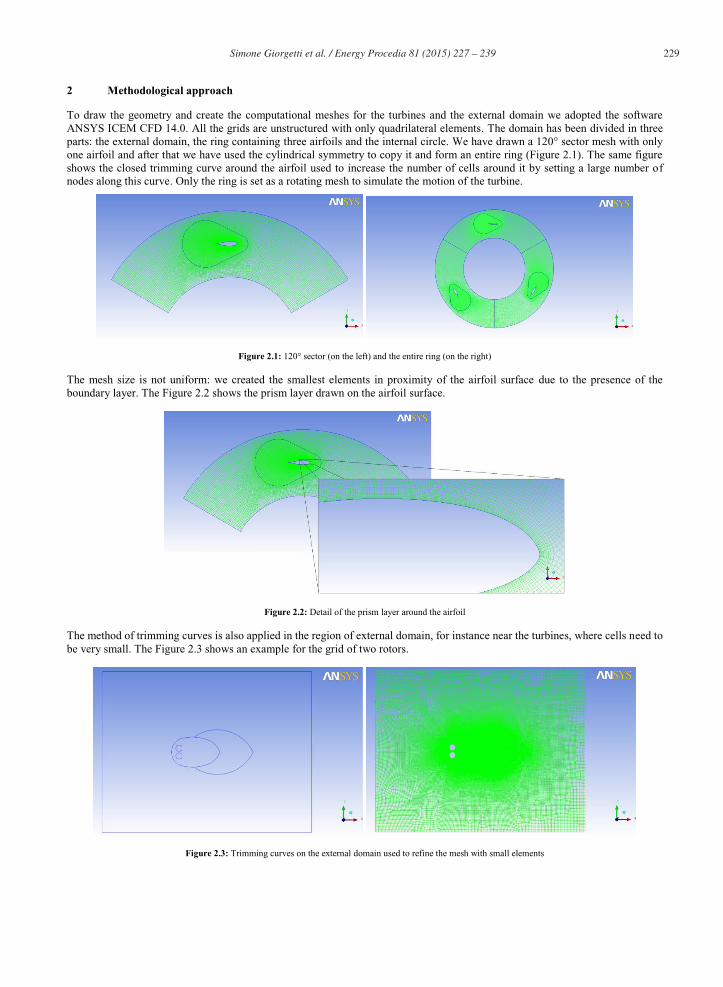
The four-rotor arrangement was studied with different wind directions: in this respect we have created an internal grid for all the cases and an external grid with different inclinations for every wind direction (Figure 2.4).
Figure 2.4: Internal grid with the locations for 4 rotors (on the left) and the total domain (on the right) to study different wind directions (inclined 30° respect to the x-axis)
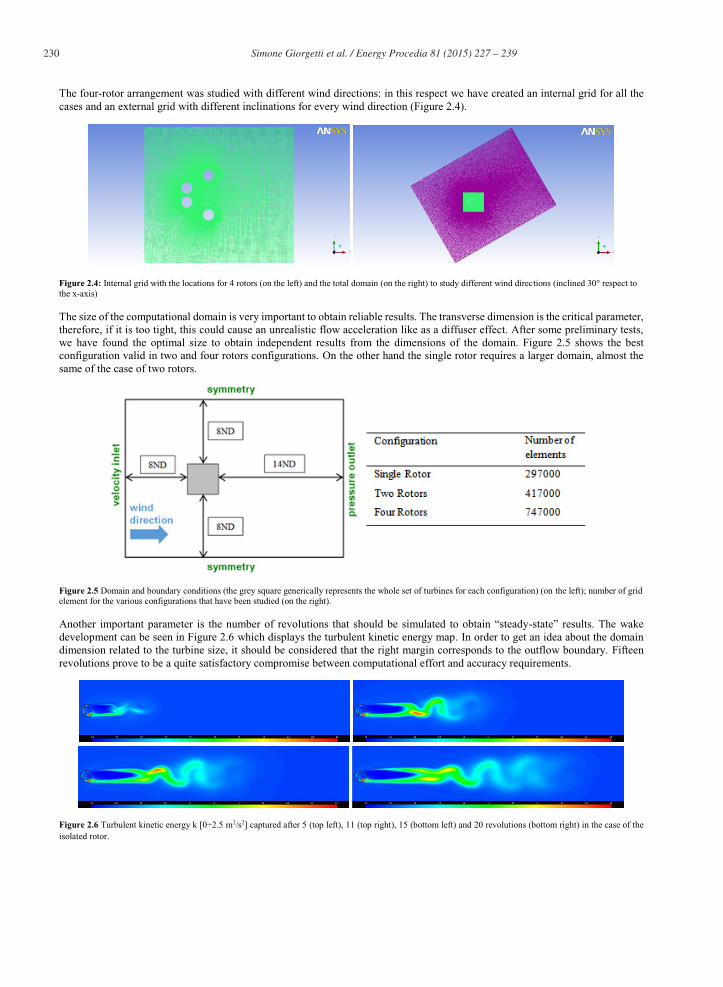
The size of the computational domain is very important to obtain reliable results. The transverse dimension is the critical parameter, therefore, if it is too tight, this could cause an unrealistic flow acceleration like as a diffuser effect. After some preliminary tests, we have found the optimal size to obtain independent results from the dimensions of the domain. Figure 2.5 shows the best configuration valid in two and four rotors configurations. On the other hand the single rotor requires a larger domain, almost the same of the case of two rotors.
Figure 2.5 Domain and boundary conditions (the grey square generically represents the whole set of turbines for each configuration) (on the left); number of grid element for the various configurations that have been studied (on the right).
Another important parameter is the number of revolutions that should be simulated to obtain “steady-state” results. The wake development can be seen in Figure 2.6 which displays the turbulent kinetic energy map. In order to get an idea about the domain dimension related to the turbine size, it should be considered that the right margin corresponds to the outflow boundary. Fifteen revolutions prove to be a quite satisfactory compromise between computational effort and accuracy requirements.
Figure 2.6 Turbulent kinetic energy k [0÷2.5 m2/s2] captured after 5 (top left), 11 (top right), 15 (bottom left) and 20 revolutions (bottom right) in the case of the isolated rotor.
Simone Giorgetti et al. / Energy Procedia 81 ( 2015 ) 227 – 239 231
Table 2.2 ANSYS-Fluent parameters
Space 2D Space - Planar Time-step 1° for the first 6 revolutions; 0.5° for the following 9 revolutions
Viscous Model k-ω SST with Low-Re corrections Pressure-Velocity Coupling PISO
Pressure PRESTO!
Momentum First Order Upwind (first rotation) Second Order Upwind (following 14 rotations)
Turbulent Kinetic Energy First Order Upwind Specific Dissipation Rate First Order Upwind
Residuals of each physical variable 1.0∙10-4
3 Numerical models validation
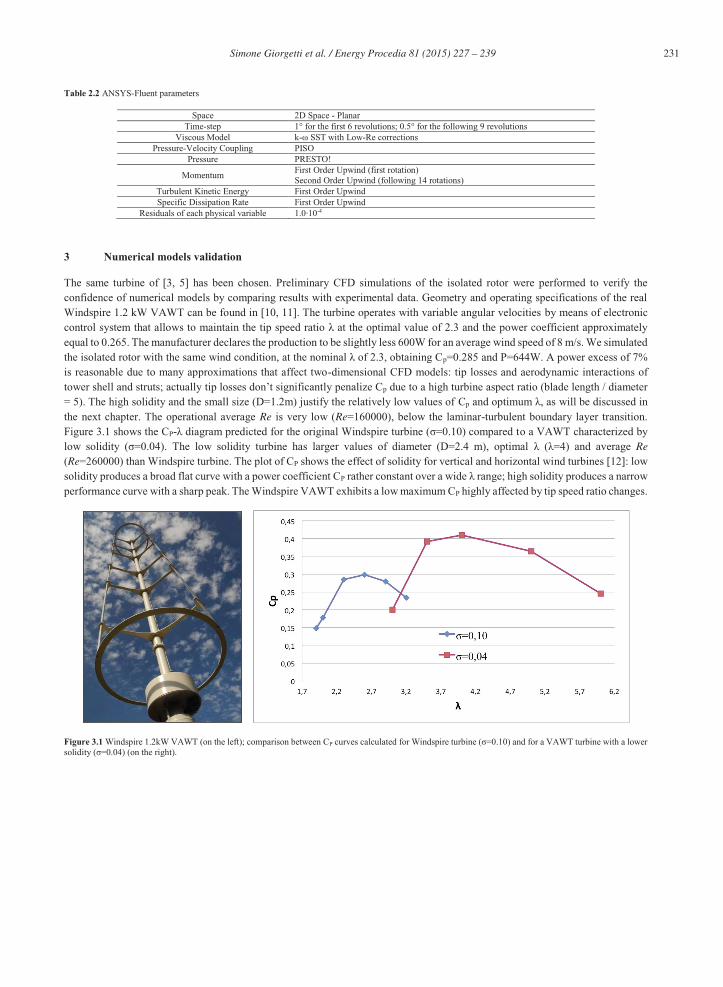
The same turbine of [3, 5] has been chosen. Preliminary CFD simulations of the isolated rotor were performed to verify the confidence of numerical models by comparing results with experimental data. Geometry and operating specifications of the real Windspire 1.2 kW VAWT can be found in [10, 11]. The turbine operates with variable angular velocities by means of electronic control system that allows to maintain the tip speed ratio λ at the optimal value of 2.3 and the power coefficient approximately equal to 0.265. The manufacturer declares the production to be slightly less 600W for an average wind speed of 8 m/s. We simulated the isolated rotor with the same wind condition, at the nominal λ of 2.3, obtaining Cp=0.285 and P=644W. A power excess of 7% is reasonable due to many approximations that affect two-dimensional CFD models: tip losses and aerodynamic interactions of tower shell and struts; actually tip losses don’t significantly penalize Cp due to a high turbine aspect ratio (blade length / diameter = 5). The high solidity and the small size (D=1.2m) justify the relatively low values of Cp and optimum λ, as will be discussed in the next chapter. The operational average Re is very low (Re=160000), below the laminar-turbulent boundary layer transition. Figure 3.1 shows the CP-λ diagram predicted for the original Windspire turbine (σ=0.10) compared to a VAWT characterized by low solidity (σ=0.04). The low solidity turbine has larger values of diameter (D=2.4 m), optimal λ (λ=4) and average Re (Re=260000) than Windspire turbine. The plot of CP shows the effect of solidity for vertical and horizontal wind turbines [12]: low solidity produces a broad flat curve with a power coefficient CP rather constant over a wide λ range; high solidity produces a narrow performance curve with a sharp peak. The Windspire VAWT exhibits a low maximum CP highly affected by tip speed ratio changes.
Figure 3.1 Windspire 1.2kW VAWT (on the left); comparison between CP curves calculated for Windspire turbine (σ=0.10) and for a VAWT turbine with a lower solidity (σ=0.04) (on the right).
232 Simone Giorgetti et al. / Energy Procedia 81 ( 2015 ) 227 – 239
4 The behaviour of isolated rotor
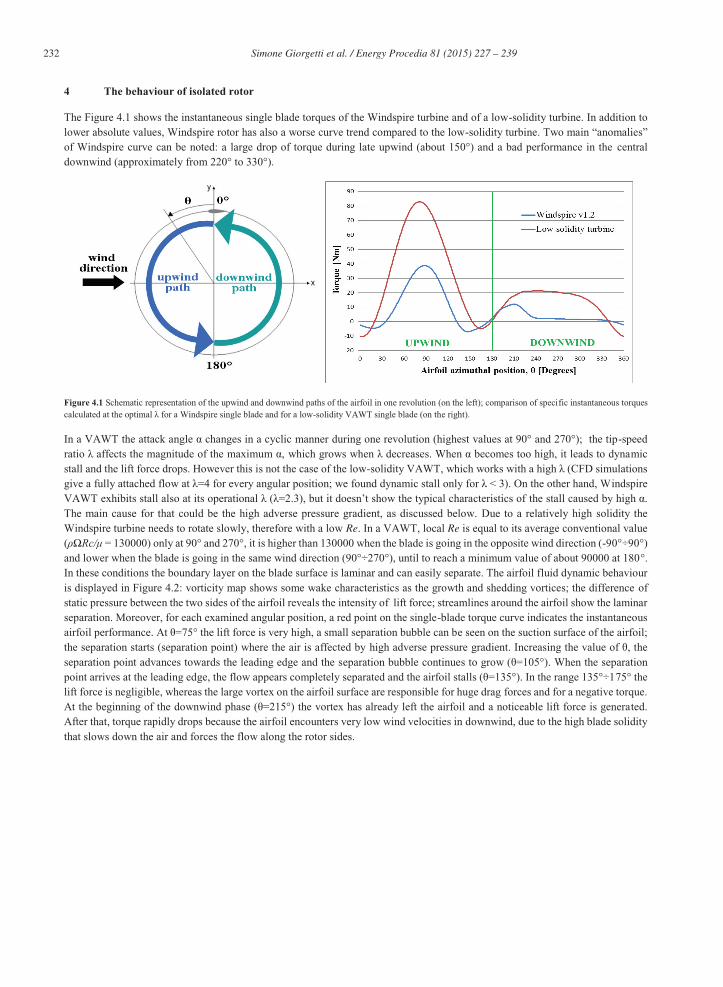
The Figure 4.1 shows the instantaneous single blade torques of the Windspire turbine and of a low-solidity turbine. In addition to lower absolute values, Windspire rotor has also a worse curve trend compared to the low-solidity turbine. Two main “anomalies” of Windspire curve can be noted: a large drop of torque during late upwind (about 150°) and a bad performance in the central downwind (approximately from 220° to 330°).
Figure 4.1 Schematic representation of the upwind and downwind paths of the airfoil in one revolution (on the left); comparison of specific instantaneous torques calculated at the optimal λ for a Windspire single blade and for a low-solidity VAWT single blade (on the right).
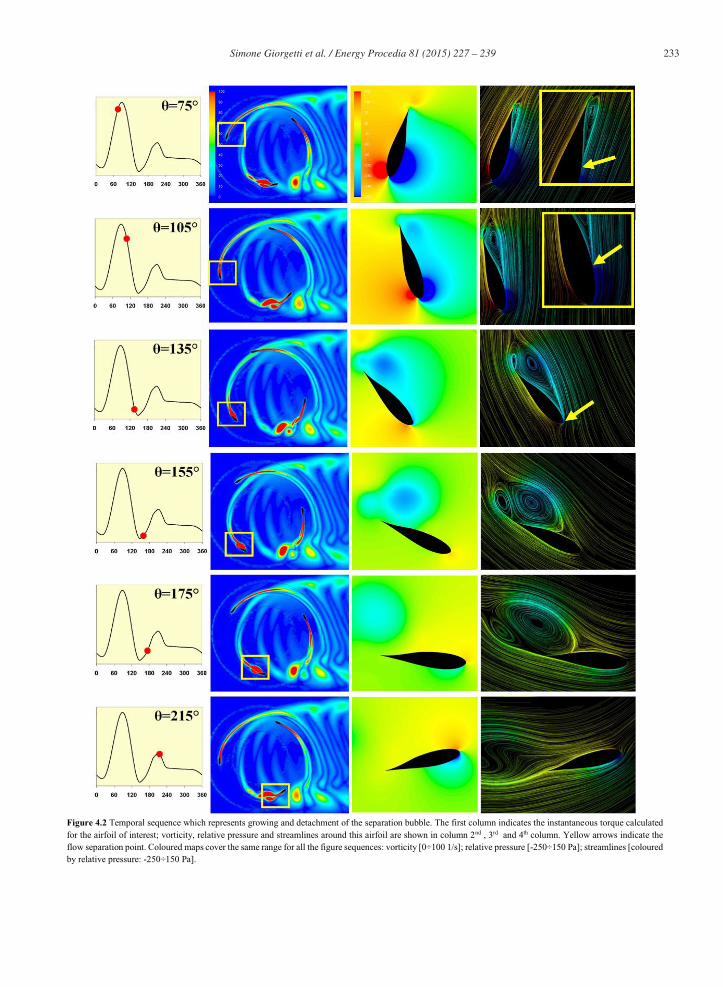
In a VAWT the attack angle α changes in a cyclic manner during one revolution (highest values at 90° and 270°); the tip-speed ratio λ affects the magnitude of the maximum α, which grows when λ decreases. When α becomes too high, it leads to dynamic stall and the lift force drops. However this is not the case of the low-solidity VAWT, which works with a high λ (CFD simulations give a fully attached flow at λ=4 for every angular position; we found dynamic stall only for λ < 3). On the other hand, Windspire VAWT exhibits stall also at its operational λ (λ=2.3), but it doesn’t show the typical characteristics of the stall caused by high α. The main cause for that could be the high adverse pressure gradient, as discussed below. Due to a relatively high solidity the Windspire turbine needs to rotate slowly, therefore with a low Re. In a VAWT, local Re is equal to its average conventional value (ρΩRc/μ = 130000) only at 90° and 270°, it is higher than 130000 when the blade is going in the opposite wind direction (-90°÷90°) and lower when the blade is going in the same wind direction (90°÷270°), until to reach a minimum value of about 90000 at 180°. In these conditions the boundary layer on the blade surface is laminar and can easily separate. The airfoil fluid dynamic behaviour is displayed in Figure 4.2: vorticity map shows some wake characteristics as the growth and shedding vortices; the difference of static pressure between the two sides of the airfoil reveals the intensity of lift force; streamlines around the airfoil show the laminar separation. Moreover, for each examined angular position, a red point on the single-blade torque curve indicates the instantaneous airfoil performance. At θ=75° the lift force is very high, a small separation bubble can be seen on the suction surface of the airfoil; the separation starts (separation point) where the air is affected by high adverse pressure gradient. Increasing the value of θ, the separation point advances towards the leading edge and the separation bubble continues to grow (θ=105°). When the separation point arrives at the leading edge, the flow appears completely separated and the airfoil stalls (θ=135°). In the range 135°÷175° the lift force is negligible, whereas the large vortex on the airfoil surface are responsible for huge drag forces and for a negative torque. At the beginning of the downwind phase (θ=215°) the vortex has already left the airfoil and a noticeable lift force is generated. After that, torque rapidly drops because the airfoil encounters very low wind velocities in downwind, due to the high blade solidity that slows down the air and forces the flow along the rotor sides.
Simone Giorgetti et al. / Energy Procedia 81 ( 2015 ) 227 – 239 233
Figure 4.2 Temporal sequence which represents growing and detachment of the separation bubble. The first column indicates the instantaneous torque calculated for the airfoil of interest; vorticity, relative pressure and streamlines around this airfoil are shown in column 2nd , 3rd and 4th column. Yellow arrows indicate the flow separation point. Coloured maps cover the same range for all the figure sequences: vorticity [0÷100 1/s]; relative pressure [-250÷150 Pa]; streamlines [coloured by relative pressure: -250÷150 Pa].
234 Simone Giorgetti et al. / Energy Procedia 81 ( 2015 ) 227 – 239
5 The behaviour of coupled rotors
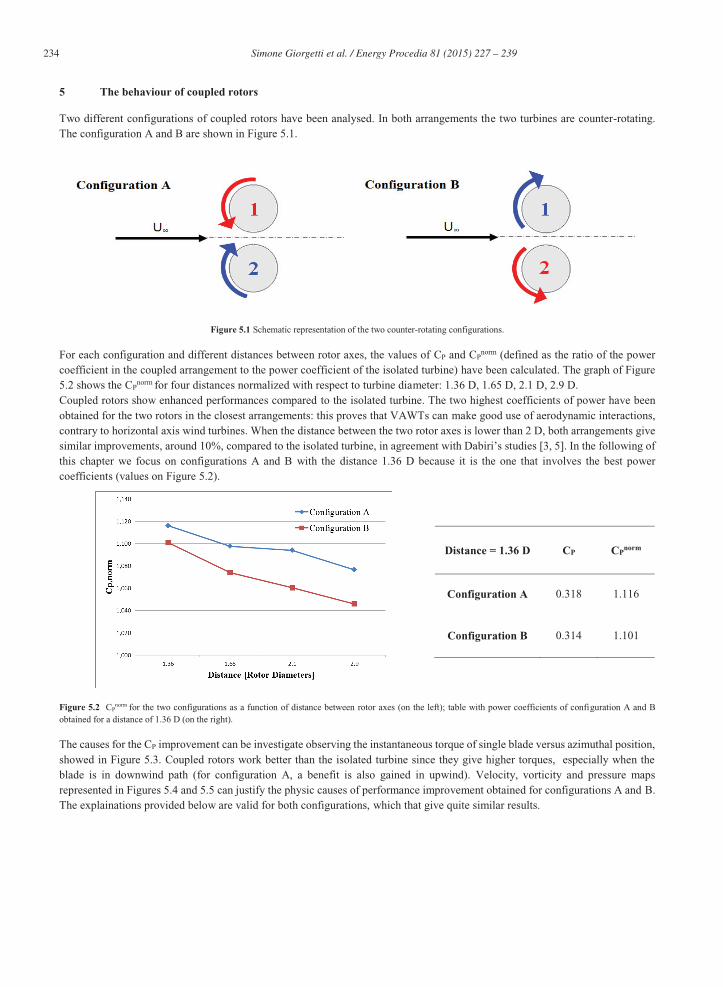
Two different configurations of coupled rotors have been analysed. In both arrangements the two turbines are counter-rotating. The configuration A and B are shown in Figure 5.1.
Figure 5.1 Schematic representation of the two counter-rotating configurations.
For each configuration and different distances between rotor axes, the values of CP and CPnorm (defined as the ratio of the power
coefficient in the coupled arrangement to the power coefficient of the isolated turbine) have been calculated. The graph of Figure 5.2 shows the CP
norm for four distances normalized with respect to turbine diameter: 1.36 D, 1.65 D, 2.1 D, 2.9 D. Coupled rotors show enhanced performances compared to the isolated turbine. The two highest coefficients of power have been obtained for the two rotors in the closest arrangements: this proves that VAWTs can make good use of aerodynamic interactions, contrary to horizontal axis wind turbines. When the distance between the two rotor axes is lower than 2 D, both arrangements give similar improvements, around 10%, compared to the isolated turbine, in agreement with Dabiri’s studies [3, 5]. In the following of this chapter we focus on configurations A and B with the distance 1.36 D because it is the one that involves the best power coefficients (values on Figure 5.2).
Figure 5.2 CPnorm for the two configurations as a function of distance between rotor axes (on the left); table with power coefficients of configuration A and B
obtained for a distance of 1.36 D (on the right).
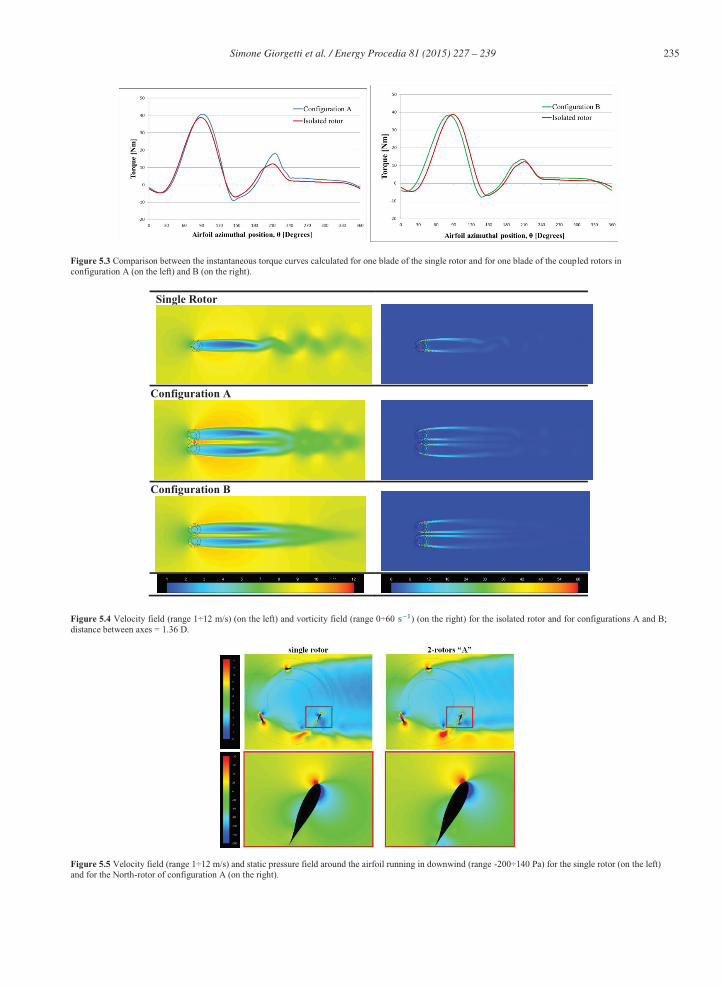
The causes for the CP improvement can be investigate observing the instantaneous torque of single blade versus azimuthal position, showed in Figure 5.3. Coupled rotors work better than the isolated turbine since they give higher torques, especially when the blade is in downwind path (for configuration A, a benefit is also gained in upwind). Velocity, vorticity and pressure maps represented in Figures 5.4 and 5.5 can justify the physic causes of performance improvement obtained for configurations A and B. The explainations provided below are valid for both configurations, which that give quite similar results.
Distance = 1.36 D CP CPnorm
Configuration A 0.318 1.116
Configuration B 0.314 1.101
Simone Giorgetti et al. / Energy Procedia 81 ( 2015 ) 227 – 239 235
Figure 5.3 Comparison between the instantaneous torque curves calculated for one blade of the single rotor and for one blade of the coupled rotors in configuration A (on the left) and B (on the right).
Single Rotor
Configuration A
Configuration B
Figure 5.4 Velocity field (range 1÷12 m/s) (on the left) and vorticity field (range 0÷60 ) (on the right) for the isolated rotor and for configurations A and B; distance between axes = 1.36 D.
Figure 5.5 Velocity field (range 1÷12 m/s) and static pressure field around the airfoil running in downwind (range -200÷140 Pa) for the single rotor (on the left) and for the North-rotor of configuration A (on the right).
236 Simone Giorgetti et al. / Energy Procedia 81 ( 2015 ) 227 – 239
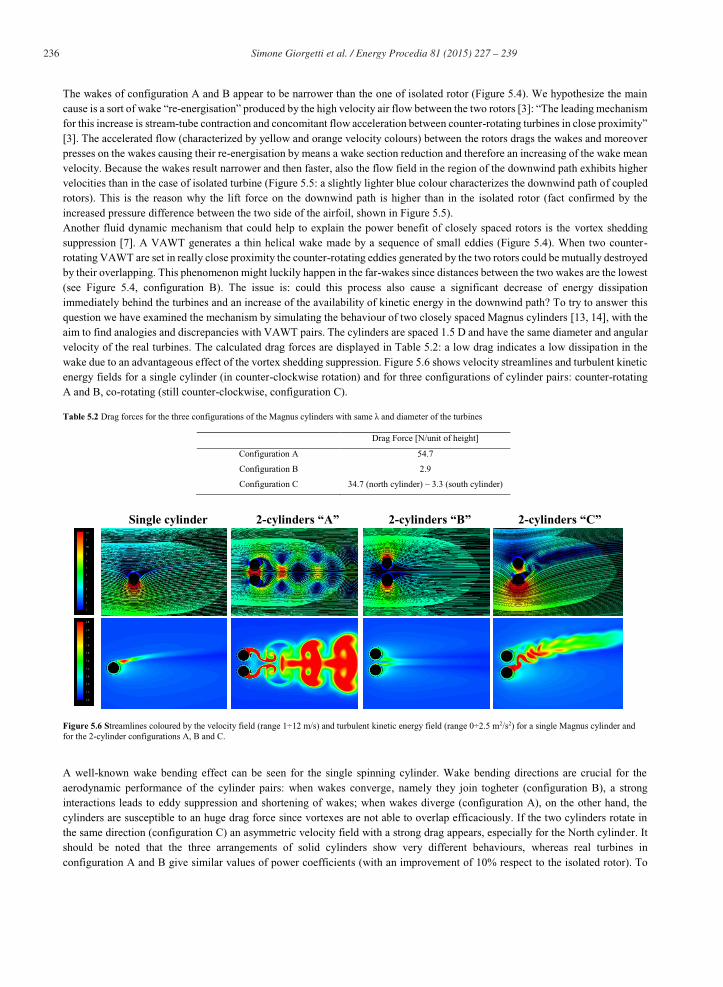
The wakes of configuration A and B appear to be narrower than the one of isolated rotor (Figure 5.4). We hypothesize the main cause is a sort of wake “re-energisation” produced by the high velocity air flow between the two rotors [3]: “The leading mechanism for this increase is stream-tube contraction and concomitant flow acceleration between counter-rotating turbines in close proximity” [3]. The accelerated flow (characterized by yellow and orange velocity colours) between the rotors drags the wakes and moreover presses on the wakes causing their re-energisation by means a wake section reduction and therefore an increasing of the wake mean velocity. Because the wakes result narrower and then faster, also the flow field in the region of the downwind path exhibits higher velocities than in the case of isolated turbine (Figure 5.5: a slightly lighter blue colour characterizes the downwind path of coupled rotors). This is the reason why the lift force on the downwind path is higher than in the isolated rotor (fact confirmed by the increased pressure difference between the two side of the airfoil, shown in Figure 5.5). Another fluid dynamic mechanism that could help to explain the power benefit of closely spaced rotors is the vortex shedding suppression [7]. A VAWT generates a thin helical wake made by a sequence of small eddies (Figure 5.4). When two counter-rotating VAWT are set in really close proximity the counter-rotating eddies generated by the two rotors could be mutually destroyed by their overlapping. This phenomenon might luckily happen in the far-wakes since distances between the two wakes are the lowest (see Figure 5.4, configuration B). The issue is: could this process also cause a significant decrease of energy dissipation immediately behind the turbines and an increase of the availability of kinetic energy in the downwind path? To try to answer this question we have examined the mechanism by simulating the behaviour of two closely spaced Magnus cylinders [13, 14], with the aim to find analogies and discrepancies with VAWT pairs. The cylinders are spaced 1.5 D and have the same diameter and angular velocity of the real turbines. The calculated drag forces are displayed in Table 5.2: a low drag indicates a low dissipation in the wake due to an advantageous effect of the vortex shedding suppression. Figure 5.6 shows velocity streamlines and turbulent kinetic energy fields for a single cylinder (in counter-clockwise rotation) and for three configurations of cylinder pairs: counter-rotating A and B, co-rotating (still counter-clockwise, configuration C).
Table 5.2 Drag forces for the three configurations of the Magnus cylinders with same λ and diameter of the turbines
Drag Force [N/unit of height]
Configuration A 54.7
Configuration B 2.9
Configuration C 34.7 (north cylinder) – 3.3 (south cylinder)
Single cylinder 2-cylinders “A” 2-cylinders “B” 2-cylinders “C”
Figure 5.6 Streamlines coloured by the velocity field (range 1÷12 m/s) and turbulent kinetic energy field (range 0÷2.5 m2/s2) for a single Magnus cylinder and for the 2-cylinder configurations A, B and C.
A well-known wake bending effect can be seen for the single spinning cylinder. Wake bending directions are crucial for the aerodynamic performance of the cylinder pairs: when wakes converge, namely they join togheter (configuration B), a strong interactions leads to eddy suppression and shortening of wakes; when wakes diverge (configuration A), on the other hand, the cylinders are susceptible to an huge drag force since vortexes are not able to overlap efficaciously. If the two cylinders rotate in the same direction (configuration C) an asymmetric velocity field with a strong drag appears, especially for the North cylinder. It should be noted that the three arrangements of solid cylinders show very different behaviours, whereas real turbines in configuration A and B give similar values of power coefficients (with an improvement of 10% respect to the isolated rotor). To
Simone Giorgetti et al. / Energy Procedia 81 ( 2015 ) 227 – 239 237
complete the analysis, the simulation of two co-rotating turbines (distance between axes equal to 1.65D) has been carried out, obtaining a CP
norm=1.08. Therefore we have realized that schematising a permeable real turbine with a Magnus cylinder is not realistic, since some basic fluid dynamic aspects appear to be in disagreement. Firstly two bluff bodies in close proximity represent an obstacle for the wind, which is induced to flow on the outer sides, whereas permeable turbines allow the flow to pass between two rotors with a high velocity and this causes the wake “re-energisation”. Secondly, a spinning cylinder shows a massive wake bending that is responsible for strong vortex interaction in close pair configurations, while a VAWT experiences a negligible wake bending. Moreover, as it can be seen in Figure 5.2, the CP enhancement obtained for coupled VAWTs remains good enough for quite long distances between rotors (CP
norm=1.05 with 2.9 D between rotor axes), when wakes are really too far to overlap in a some way. Finally, we hypothesize that the little improvement of two turbines in configuration A in comparison of the other configurations is caused by an enhanced acceleration of the free-stream flow between rotors, therefore an enhanced wake energisation, which occurs when blades are moving in the same wind direction. The wake energisation seems to compensate and even improve performances despite a worse vortex shedding supression.
6 The four-rotor configuration
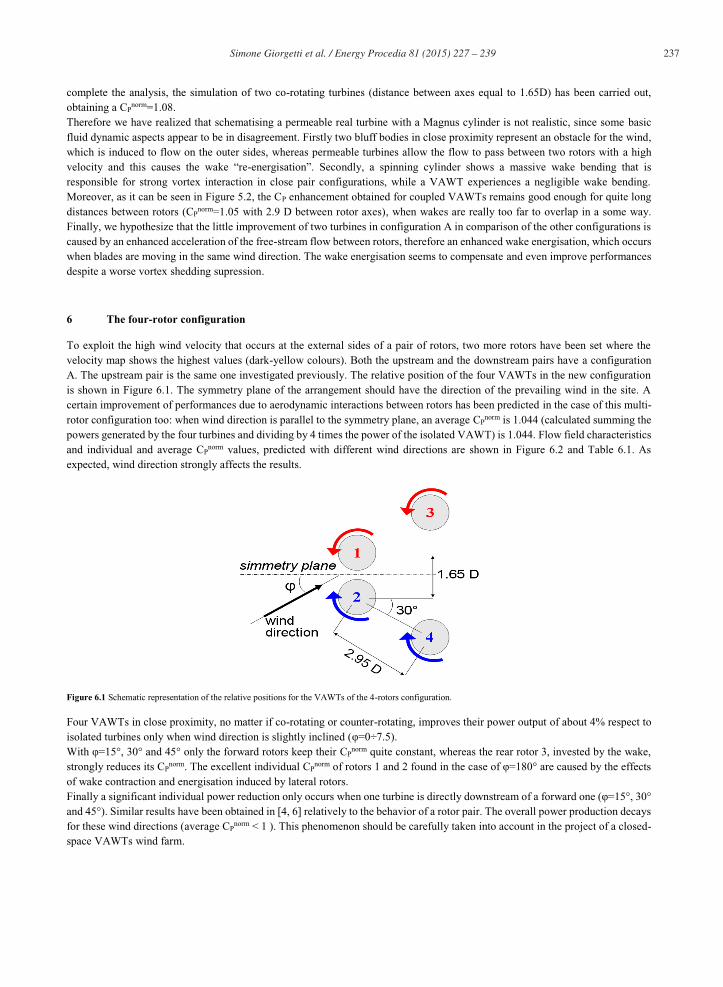
To exploit the high wind velocity that occurs at the external sides of a pair of rotors, two more rotors have been set where the velocity map shows the highest values (dark-yellow colours). Both the upstream and the downstream pairs have a configuration A. The upstream pair is the same one investigated previously. The relative position of the four VAWTs in the new configuration is shown in Figure 6.1. The symmetry plane of the arrangement should have the direction of the prevailing wind in the site. A certain improvement of performances due to aerodynamic interactions between rotors has been predicted in the case of this multi-rotor configuration too: when wind direction is parallel to the symmetry plane, an average CP
norm is 1.044 (calculated summing the powers generated by the four turbines and dividing by 4 times the power of the isolated VAWT) is 1.044. Flow field characteristics and individual and average CP
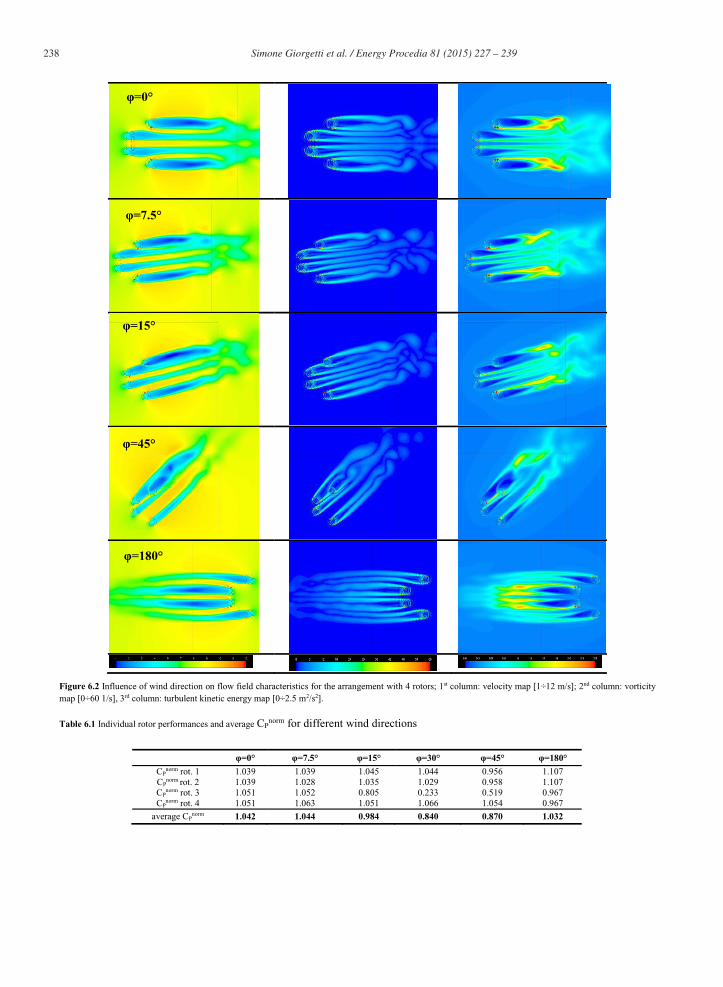
norm values, predicted with different wind directions are shown in Figure 6.2 and Table 6.1. As expected, wind direction strongly affects the results.
Figure 6.1 Schematic representation of the relative positions for the VAWTs of the 4-rotors configuration.
Four VAWTs in close proximity, no matter if co-rotating or counter-rotating, improves their power output of about 4% respect to isolated turbines only when wind direction is slightly inclined (φ=0÷7.5). With φ=15°, 30° and 45° only the forward rotors keep their CP
norm quite constant, whereas the rear rotor 3, invested by the wake, strongly reduces its CP
norm. The excellent individual CPnorm of rotors 1 and 2 found in the case of φ=180° are caused by the effects
of wake contraction and energisation induced by lateral rotors. Finally a significant individual power reduction only occurs when one turbine is directly downstream of a forward one (φ=15°, 30° and 45°). Similar results have been obtained in [4, 6] relatively to the behavior of a rotor pair. The overall power production decays for these wind directions (average CP
norm < 1 ). This phenomenon should be carefully taken into account in the project of a closed-space VAWTs wind farm.
238 Simone Giorgetti et al. / Energy Procedia 81 ( 2015 ) 227 – 239
Figure 6.2 Influence of wind direction on flow field characteristics for the arrangement with 4 rotors; 1st column: velocity map [1÷12 m/s]; 2nd column: vorticity map [0÷60 1/s], 3rd column: turbulent kinetic energy map [0÷2.5 m2/s2].
Table 6.1 Individual rotor performances and average CPnorm for different wind directions
φ=0° φ=7.5° φ=15° φ=30° φ=45° φ=180°
CPnorm rot. 1 1.039 1.039 1.045 1.044 0.956 1.107
CPnorm rot. 2 1.039 1.028 1.035 1.029 0.958 1.107
CPnorm rot. 3 1.051 1.052 0.805 0.233 0.519 0.967
CPnorm rot. 4 1.051 1.063 1.051 1.066 1.054 0.967
average CPnorm 1.042 1.044 0.984 0.840 0.870 1.032
φ=180°
φ=45°
φ=15°
φ=7.5°
φ=0°
Simone Giorgetti et al. / Energy Procedia 81 ( 2015 ) 227 – 239 239
7 Conclusions
The aim of the present work has been to analyse numerically the aerodynamic interactions between medium-solidity Darrieus VAWTs when positioned in close proximity. The small size of these turbines and the relatively low tip-speed ratio are responsible for very low Reynolds numbers. These trigger mechanisms of vortex rolling-up and shedding, leading to huge shape-drag losses and low power coefficients. Medium-high solidities contribute to low power performance of isolated turbines, primary because the wind blockage, operated by the blades running upwind, penalises the availability of kinetic energy in downwind path. However, when two rotors are in close proximity, the wind blockage supports the acceleration of the free-stream flow between the rotors. Therefore this is able to shrink and re-energise the rotor wake and increase the available kinetic energy in downwind path. The wake re-energisation process can justify the enhanced power coefficients we have obtained for coupled rotors in different configurations (counter-rotating and co-rotating). On the other hand, a shedding vortex suppression mechanism could not correctly explain the performance improvement of rotor pairs, as shown by the behaviour of coupled spinning cylinders. Finally, the results of a sensitivity analysis to wind direction suggest that closely-spaced multi-rotor arrangements should be only used in sites with strong prevailing wind directions.
References
[1] Tullis, S. et al., 2008, "Medium-Solidity Vertical Axis Wind Turbines for Use in Urban Environments", 7th World Wind Energy Conference, St. Lawrence College, Kingston, Ontario [2] Sørensen B., “Renewable Energy: Its Physics, Engineering, Use, Environmental Impacts, Economy, and Planning Aspects”, Elsevier, London, 2004 [3] Whittlesey R. W., Liska S. and Dabiri J. O., “Fish schooling as a basis for vertical axis wind turbine farm design” , Bioinspiration & biomimetics, 2010, vol.5 [4] Dabiri J. O., “Potential order-of-magnitude enhancement of wind farm power density via counter-rotating vertical-axis wind turbine arrays”, Journal of renewable and sustainable energy, 2011, vol. 3 [5] Kinzel M., Mulligan Q. and Dabiri J. O., “Energy exchange in an array of vertical-axis wind turbines”, Journal of Turbulence, 2012, vol. 13, No. 38, pp. 1–13 [6] Feng G. et al. “Optimizing the Land Use for Wind Farms Using Vertical Axis Wind Turbines”, PO.ID 192, Europe's premier wind energy conference and exhibition, European Wind Energy Association (EWEA), 2014, Barcelona, Spain [7] Li Y., Calisal S. M., “Modeling of twin-turbines ystems with vertical axis tidal current turbines: Part I - Power output”, Ocean Engineering, 2010, vol. 37, pp. 627–637 [8] Schatzle P.R., Klimas P.C., and Spahr H.R. "Aerodynamic Interference Between Two Darrieus Wind Turbines", Journal of Energy, 1981, vol. 5, No. 2, pp 84-88 [9] Rajagopalan R. G., Klimas P. C. and Rickerl T. L. “Aerodynamic interference of vertical axis wind turbines”, Journal of Propulsion and Power, 1990, vol. 6, pp. 645–653 [10] Windspire Energy inc. Windspire specification standard unit 1.2 kW [11] Bazilevs Y. et al. “FSI Modeling of Vertical-Axis Wind Turbines”, Journal of Applied Mechanics, 2014, vol. 81. [12] Burton T. et al., “Wind energy handbook”, second edition, Wiley, 2011 [13] Chan A. S. et al. “Vortex suppression and drag reduction in the wake of counter-rotating cylinders” J. Fluid Mech., 2011, vol. 679, pp. 343–382 [14] Mittal S. and Kumar B., “Flow past a rotating cylinder” J. Fluid Mech., 2003, vol. 476, pp. 303-334