a qualitative decision support for environmental impact
TRANSCRIPT
93
Journal of Environmental
Informatics
ISEIS
Journal of Environmental Informatics 13(2) 93-103 (2009)
www.iseis.org/jei
A Qualitative Decision Support for Environmental Impact Assessment Using Fuzzy Logic
K. F. R. Liu1,*, H. H. Liang2, K. Yeh3, and C. W. Chen4
1Department of Safety, Health and Environmental Engineering, Ming Chi University of Technology, Taipei, Taiwan 24301, R.O.C.
2Department of Architecture, National United University, Miaoli, Taiwan 36003, R.O.C. 3Department of Construction Engineering, De Lin Institute of Technology, Taipei, Taiwan 23654, R.O.C.
4Department of Logistics Management, Shu-Te University, Kaohsiung, Taiwan 82445, R.O.C.
Received 22 May 2008; revised 9 Feburary 2009; accepted 19 Feburary 2009; published online 10 June 2009
ABSTRACT. In environmental impact assessment (EIA), experts produce conclusions not only according to scientific data but also political factors and social values. Subjective judgment plays a significant role in EIA. Traditional multi-criteria decision-making methods cannot provide best decision support because they are incapable of modeling qualitative human thinking process. On the other hand, fuzzy logic is widely recognized as a tool with the ability to compute using words to model qualitative human thinking processes in the analysis of complex systems and decisions. This study attempts to utilize fuzzy logic as a decision-support approach for EIA. The evaluation knowledge represented by “if-then” fuzzy rules is employed to measure the significance of environmental impacts. In this paper, 10 indicators and 28 subindicators are considered in the assessment framework using the Taiwan High-Speed Rail System as the case study. Keywords: fuzzy logic, environmental impact assessment, significance
1. Introduction
Environmental impact assessment (EIA) can be defined as the systematic identification and evaluation of the potential im- pacts (effects) of proposed projects, plans, programs, or legis- lative actions relative to the physical-chemical, biological, cul- tural, and socioeconomic components of the total environment (Canter, 1996). The EIA process essentially involves scoping, studying baseline conditions, identifying potential impacts, pre- dicting significant impacts, and evaluating them (Shepard, 2005). Scoping determines which components are to be inclu- ded in the EIA and alternatives to be considered. A baseline condition, namely the existing environment, is recognized as a benchmark by which the future conditions of project alterna- tives are compared. Historically, several methodologies have been developed for the identification of impacts on the base- line condition, including the ad hoc, overlay, checklist, matrix, and networks methods. The purpose of impact prediction is to forecast the effects of an identified impact through methods such as subjective judgment, case studies, quantitative mathe- matical models, statistical models, pilot models and experi- ments. Once an impact has been forecasted, it is necessary to
* Corresponding author. Tel.: +886 2 2908 9899 ext. 4697; fax: +886 2
2904 1914. E-mail address: [email protected] (K.F.R. Liu). ISSN: 1726-2135 print/1684-8799 online © 2009 ISEIS All rights reserved. doi:10.3808/jei.200900144
evaluate its significance on environmental effects. Eventually, decision makers (EIA review committee) have to decide whe- ther to accept the proposal or not.
When assessing environmental impacts, the concept of “significance” is adopted from previous literature (Duinker and Beanlands, 1986; Canter and Canty, 1993; Dzidzornu, 2001; Cloquell-Ballester et al., 2007). Significance is a com- plex concept that is related not only to the magnitude of im- pact but also to other considerations such as societal values and political aspects. Thus, determining the significance of environmental impacts may be viewed as highly subjective ju- dgment because it has to ruminate over the scientific facts (en- vironmental, ecological and socioeconomic impacts) and sub- jective values (judgment, preference, value and concern). Sig- nificance of environmental impacts is mainly appraised by ex- perts since manipulation of perceptions is a remarkable hu- man capability even under fuzzy surroundings. In artificial in- telligence (AI), fuzzy logic (Zadeh, 1973) is such a mecha- nism with the ability of computing with words to mimic the manipulation of human perceptions. Therefore, this paper in- tends to utilize fuzzy logic as a decision-support approach to bridging the gap between scientific facts and subjective values in EIA. The evaluation knowledge represented by “if-then” fu- zzy rules is employed to measure the significance of environ- mental impacts.
The organization of this paper is presented as follows. Ba- ckground literature is introduced in the next section. The asse- ssment framework and decision-support methodology, namely

K.F.R. Liu et al. / Journal of Environmental Informatics 13(2) 93-103 (2009)
94
fuzzy logic, are discussed in Section 3. Finally, the proposed approach is applied to the EIAs of construction projects, ex- emplified in a case study of the Taiwan High-Speed Rail pro- ject.
2. Background Literature
The decision-making on approval of EIA reports is an in- trinsically complex multi-dimensional process because it not only considers the scientific facts (environmental, ecological and socioeconomic impacts) but also reflects subjective values (judgment, preference, value and concern). Figure 1 delineates a flowchart of the EIA process; wherein the use of decision- support methods to balance facts and values can benefit deci- sion-makers.
Several decision-support methods have been proposed in the literature. Among them, two categories are noteworthy. The utilization of the analytic hierarchy process (AHP) (Saaty, 1990) and its variants has become the first remarkable category due to their capability in facilitating multi-criteria decision-making. For example, Tsamboulas and Mikroudis (2000) devoted them- selves to the combination of the AHP with cost-benefit analy-
sis methods to develop an overall assessment of the impacts of transport initiatives over different geographical regions and time periods. Ong et al. (2001) used the AHP method to assess the environmental impact of materials process techniques by deriving a single environmental score according to process emissions for each of the products or alternatives evaluated. In order to compare three large industrial development alter- natives in an orderly manner, Solnes (2003) utilized the AHP to calculate the environmental quality index of each. Readers can refer to Ramanathan’s (2001) discussion on the advanta- ges and shortcomings of using the AHP for EIA. Tesfamariam and Sadiq (2006) employed fuzzy AHP to deal with the selec- tion of drilling fluid/mud for offshore oil and gas operations, which incorporated decision-maker’s risk attitude and associ- ated confidence on the estimates of pairwise comparisons. Liu (2007) outlines a new integration of fuzzy logic and fuzzy AHP to perform the evaluation of environmental sustainability in 146 countries. The analytic network process (ANP) (Saaty, 2001) relieves the independence limitation inherent in the AHP so that several researchers have been able to manipulate the dependence property of environmental factors. For exam- ple, according to data on the land cover, population, roads, streams, air pollution and topography of the Mid-Atlantic Re-
Figure 1. A decision-making process for environmental impact assessment.

K.F.R. Liu et al. / Journal of Environmental Informatics 13(2) 93-103 (2009)
95
gion of the United States, Tran et al. (2004) conducted an inte- grated environmental assessment by combining principal com- ponent analysis and the ANP. Chen et al. (2005) introduced the use of the ANP to develop a decision model for evaluating potentially adverse environmental impacts of alternative cons- truction plans. Traditional multi-criteria decision-making me- thods can not provide best decision-support because they are incapable of modeling qualitative human thinking process.
The second category exploits the fuzzy logic method to infer the environmental impacts or significances. For instance, Borri et al. (1998) introduced a fuzzy rule-based methodology for environmental evaluation which provided a robust tool to directly cope with linguistic models of human interpretation of environmental systems. Van der Werf and Zimmer (1998), as well as Roussel et al. (2000), endeavored to use fuzzy expert systems to calculate an indicator “Ipest”, which reflects an ex- pert perception of the potential environmental impact of the application of a pesticide in a crop field. Marusich et al. (2001) conducted two EIA cases with fuzzy logic and concluded that fuzzy logic analysis can make valuable contribution to the en- vironmental assessment of complex projects but it offers no significant benefits in the case of simple projects. Gonzalez et al. (2002) utilized fuzzy logic to avoid the need for in-depth environmental knowledge and extremely accurate data to im- plement the assessment, thus making life-cycle assessment more applicable to small and medium-sized enterprises. Boc- lin et al. (2006) used a fuzzy logic computational approach to operating fuzzy and crisp variables and make inferences from resultant values of the systemic indicator as well as environ-
mental, cultural, social and economic thematic indicators.
3. Decision-Support Methodologies
3.1. Assessment Framework
A decision-support framework for EIA of public infras- tructure projects during construction is depicted in Figure 2. This framework considers the overall significance of a propo- sal determined by three major clusters: environmental pollu- tion, ecological alteration and socioeconomic disturbance. The environmental pollution contains five indicators: air (I1), wa- ter (I2), soil (I3), noise (I4) and solid waste (I5); the ecological alteration contains two indicators: terrestrial (I6) and aquatic (I7); the socioeconomic disturbance includes three indicators: economics (I8), society (I9) and culture (I10). The determina- tion of impacts related to these indicators is based on their res- pective subindicators (SI). Air pollution evaluation refers to the appraisal of emission of carbon monoxide (SI1), sulfur dio- xide (SI2), nitrogen dioxide (SI3) and total suspended particu- lates (SI4); water pollution evaluation involves the conditions of dissolved oxygen (SI5), biochemical oxygen demand (SI6), suspended solids (SI7) and ammonia nitrogen (SI8) in surface and ground water; soil pollution evaluation denotes liquid (SI9) and gaseous chemical residues (SI10) in soil; noise pollution evaluation indicates noise (SI11) and vibration (SI12) induced by construction equipment; solid waste evaluation implies rub- bish (SI13) and construction waste (SI14). The evaluation of th- reats to terrestrial species considers the threatened percentages of terrestrial animals (SI15), plants (SI16) and endangered spe-
Figure 2. A fuzzy logic-based decision-support framework for EIAs of construction projects.

K.F.R. Liu et al. / Journal of Environmental Informatics 13(2) 93-103 (2009)
96
cies (SI17); moreover, a similar evaluation focusing on aquatic species examines the threatened percentages of aquatic animals (SI18), plants (SI19) and endangered species (SI20). Economic evaluation encompasses disturbances in land-use and develop- ment (SI21), life quality (SI22) and economic activities (SI23). Societal evaluation considers inaccessibility in public facilities (SI24) and transportation (SI25), and disconnection in commu- nities (SI26). Cultural evaluation encompasses destroyed cultu- ral heritage (SI27) and landscapes (SI28).
When assessing these indicators and subindicators, the concept of “significance” of an environmental impact is adop- ted (Duinker and Beanlands, 1986; Canter and Canty, 1993; Dzidzornu, 2001; Cloquell-Ballester et al., 2007). Determin- ing the significance of environmental impacts may be viewed as highly subjective judgment because it has to consider both science facts and societal values. As shown in Figure 2, the fu- zzy logic is employed to infer the significances because it can imitate human thinking process. The level of significance is re- presented as a score ranging from 0 (i.e., insignificant) to 100 (i.e., completely significant). The use of fuzzy logic to estimate the significances of the indicators and subindicators is outlined as follows.
3.2. Fuzzy Logic
Fuzzy logic (Zadeh, 1996) can be treated as a tool having the ability to compute with words for modeling qualitative hu- man thought processes in the analysis of complex systems and decisions. In fuzzy logic, qualitative perception-based reason- ing is represented by “IF-THEN” fuzzy rules. An example of fuzzy logic, in which a new fuzzy value is derived on the ba- sis of a fuzzy rule (i.e., the ith rule in a fuzzy-rule base) with three antecedents and three fuzzy facts, is represented as foll- ows:
IF X1 is Fi1 AND X2 is Fi2 AND X3 is Fi3 THEN Y is Gi
X1 is F1' AND X2 is F2' AND X3 is F3' (1)
Y is Gi'
where Xj and Y are linguistic variables; Fij and Fj' are fuzzy sets of Uj; Gij and Gj' are fuzzy sets of V. In the framework of the compositional rule of inference (Zadeh, 1975), Gi' is com- puted by
1 2 3 1 2 3' ( ' ' ' ) (( ) )i i i i iG F F F F F F G (2)
where denotes a t-norm operator, is a composition ope- rator and indicates an implication operator.
Selection of operators is an important issue for calculat- ing G'. If ‘sup-min’ is chosen as the composition operator ‘sup- min’ (Zadeh, 1975), the membership function of G' is computed by:
1 2 3 1 2 31 2 3
' ' ' ' 1 2 3 1 2 3, ,
( ) max min[ ( , , ), ( , , , )]i i i iG F F F F F F G
u u uv u u u u u u v
(3)
Furthermore, if ‘min’ is treated as the t-norm operator [i.e., min( , )a b a b ] and Mamdani’s implication operator [i.e., min( , )a b a b ], Equation (3) becomes the well-known “Mamdani's fuzzy reasoning” , which can be expressed as
1 2 3 1 2 31 2 3
' ' 1 ' 2 ' 3 1 2 3, ,
( ) max min[ ( ), ( ), ( ), ( ), ( ), ( ), ( )]i i i iG F F F F F F G
u u uv u u u u u u v
(4)
Equation (4) can be further depicted in another form:
1 1 2 2 3 31 2 3
' ' 1 ' 2 ' 3( ) min[max ( ),max ( ),max ( ), ( )]i i i iG F F F F F F G
u u uv u u u v
(5) where ' j ijF F denotes the intersection of fuzzy sets ' jF and ijF ; 'max ( )
j ijj
F F ju
u is the highest degree of membership of the intersection and can be interpreted as the compati- bility Cij between ' jF and ijF ;
1 11 2
' 1m in [ m a x ( ) , m a xiF F
u uu
3 33
2 ' 3( ),max ( )]iF F
uu u can be viewed as the overall compatibility Ci
between the facts and the rule; and Ci is used to truncate Gi to obtain Gi'. Moreover, if Fj' is a precise value (i.e., say ūj), Equation (5) becomes:
1 2 3' 1 2 3( ) min[ ( ), ( ), ( ), ( )]i i i iG F F F Gv u u u v (6)
where
1 2 31 2 3min[ ( ), ( ), ( )]i i iF F Fu u u can be viewed as the over-
all compatibility Ci between the facts and the rule; Ci is used to truncate Gi to obtain Gi'.
3.3. Graphical Representation of Fuzzy Logic
The rule set concerning the significance of air pollution can be exemplified as:
Rule 1: IF CO concentration is high AND SO2 concentra- tion is high AND NO2 concentration is high AND TSP con- centration is high THEN impact of air pollution is very signi- ficant.
Rule 2: IF CO concentration is high AND SO2 concentra- tion is high AND NO2 concentration is high AND TSP con- centration is medium THEN impact of air pollution is signifi- cant.
……
Rule 80: IF CO concentration is low AND SO2 concen- tration is low AND NO2 concentration is low AND TSP con- centration is medium THEN impact of air pollution is insigni- ficant.
Rule 81: IF CO concentration is low AND SO2 concen- tration is low AND NO2 concentration is low AND TSP con- centration is low THEN impact of air pollution is very insig- nificant.
where “CO concentration”, “SO2 concentration”, “NO2 con- centration”, “TSP concentration” and “impact of air pollution” are linguistic variables; “high”, “medium”, “low”, “very signi- ficant”, “significant”, “insignificant” and “very insignificant” are their possible fuzzy values, as defined in Figure 3.

K.F.R. Liu et al. / Journal of Environmental Informatics 13(2) 93-103 (2009)
97
Figure 3. Membership functions of fuzzy values for linguistic variables (a) CO concentration, (b) SO2 concentration, (c) NO2 concentration, (d) TSP concentration and (e) significance of air pollution.
When that four factual statements (i.e., Fact 1: CO con-
centration is 5.6 ppm; Fact 2: SO2 concentration is 9.1 ppb; Fact 3: NO2 concentration is 31.8 ppb; Fact 4: TSP concen- tration is 199.3 g/m3) are fed into this inference mechanism, Mamdani’s fuzzy reasoning proceeds.
The theory of Mamdani’s fuzzy reasoning can be easily explained by a graphical representation as shown in Figure 4. As seen in this figure, there are four major steps in reaching a conclusion using fuzzy logic, which are described as follows:
Step 1: Computing compatibilities.
Compatibility designates the similarity between an ante- cedent and a fact. For rule 80, the compatibilities between Facts 1, 2, 3 and 4 with the first, second, third and fourth ante- cedents are 0.880, 0.975, 0.912 and 0.664, respectively. The overall compatibility of Rule 80 with the four facts is then computed by min[0.880, 0.975, 0.912, 0.664], that is 0.664. Similarly, the overall compatibility of Rule 81 with the same facts is 0.446. The compatibilities of other rules are also cal- culated in the same way.
Step 2: Truncating conclusions.
Once the compatibility for each rule has been calculated, the degree to which the antecedents have been satisfied for each rule is known. As shown in Figure 4, a trapezoid con- clusion is then inferred by truncating the triangular conclusion of each rule with its corresponding compatibility. The use of implication operator “min” results in the truncations of each conclusion; whereas a conclusion will be scaled if the impli- cation operator “product” is selected.
Step 3: Aggregating truncated conclusions.
Several inferred conclusions having the same linguistic variable should be aggregated. Aggregation is the process by which the fuzzy sets representing the truncated conclusions of triggered rules are combined into a single fuzzy set. In Figure 4, the final conclusion is aggregated by using the union of all truncated conclusions. In this paper, the union indicates t-con- orm operator “max”.
Step 4: Defuzzifying overall conclusion.
In many cases, the final output of an inference system should be a single number. Defuzzification is a method to jus- tifiably convert a fuzzy set into a precise value. This study uti- lized the center-of-gravity method, which takes the center of the area under the curve of the membership function of a fu- zzy set as the answer. Figure 4 indicates that the score of sig- nificance for air pollution is 18.0.
To evaluate the overall significances of a construction pro- posal, 14 rule bases containing 558 fuzzy rules were produced: 81 rules for air (I1); for water (I2), 27; soil (I3), 9; noise (I4), 9; solid waste (I5), 9; terrestrial (I6), 27; aquatic (I8), 27; econo- mics (I8), 27; society (I9), 27; culture (I10), 9; environment, 243; ecology, 9; socioeconomy, 27; and overall significance, 27. These 14 rule bases and their corresponding membership functions are constructed based on expertise, and these fuzzy inference systems are implemented with MATLAB Fuzzy Lo- gic Toolbox.

K.F.R. Liu et al. / Journal of Environmental Informatics 13(2) 93-103 (2009)
98
Figure 4. Graphical representation of fuzzy logic.
K.F.R. Liu et al. / Journal of Environmental Informatics 13(2) 93-103 (2009)
99
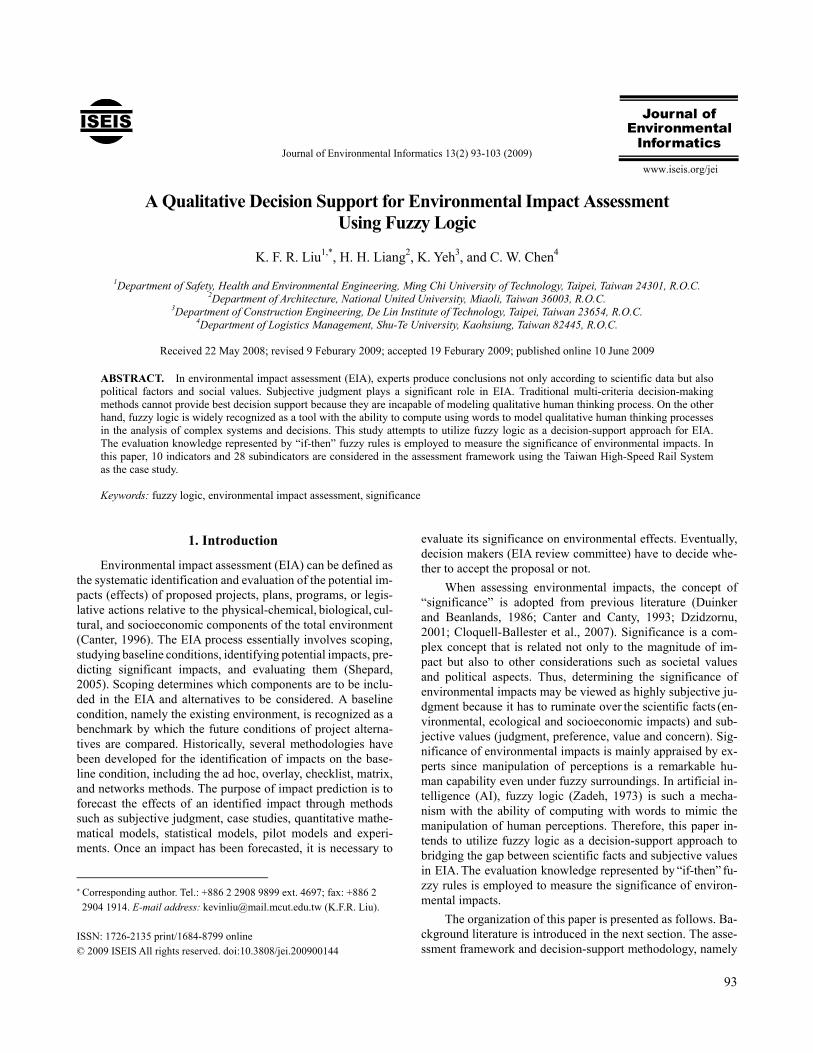
3.4. Transformation of Outputs of Fuzzy Logic
Although the scale of outputs of fuzzy logic is from 0.0 to 100.0, the range of real outputs is within this scale. All out- puts will be transformed so that their lower bounds are design- ated to correspond to 0.0; on the contrary, their upper bounds correspond to 100.0; most of all, the outputs of standards main- tain the significance score, 60. To investigate their real range, the term ‘deterioration-gradient’ of the inputs of subindicators is defined as one-percentage change (i.e., increase or decrease) of scales for all subindicators with the same goal of deteriora- ting the output. In other words, ‘deterioration-gradient’ of the inputs means 1% decrease in scale for inputs in which high va- lues correspond to high levels of output, and 1% increase in sc- ale for other inputs in which low values correspond to high le- vels of output. For example, the real outputs of overall signifi- cance by FL range from 38.5 to 80.1, as shown in the dotted line of Figure 5a, thereby they can be transformed into the sc- ale from 0.0 to 100.0, as shown in the solid line of Figure 5a.
Figure 5. Sensitivity analysis of the decision-support framework: (a) change in overall significance due to deterioration-gradient of subindicators; and (b) increase in overall significance of a subindicator with half-scale deterioration.
3.5. Sensitivity Analysis
In this paper, sensitivity analysis for the decision-support
framework aims to examine the variation of in output (i.e., the score of significance) by gradually increasing (or decreasing) its inputs (i.e., the values of the 28 subindicators). As shown in Figure 5a, the change in output of the decision-support fra- mework of EIA with respect to the ‘deterioration-gradient’ of subindicators is a winding curve, which reflects the non-line- arity characteristic of the human thinking process.
To scrutinize the contribution of a specific subindicator to the overall significance, Figure 5b illustrates a comparison of the increase in overall significance due to a 50% deterioration in a subindicator while the other 27 subindicators are main- tained at 0.0 (except DO, 20.0). As seen in Figure 5b, subindi- cator SI14 (construction waste) contributed the most to the in- crease in overall significance; followed by the group compris- ing subindicators SI1, SI2, SI3, SI4, SI5, SI6, SI7, SI8, SI17, SI20, SI23, SI26, SI27 and SI28. SI11, SI12, SI21, SI22, SI24 and SI25 form- ed the group that ranked in their contribution, followed by the group comprising SI9, SI10, SI15, SI16, SI18 and SI19. Finally, subindicator SI13 (rubbish) made the lowest contribution.
4. Application to Taiwan High-Speed Rail project
4.1. Case Description
Taiwan, located 160 km southeast of Mainland China, is a subtropical island with beautiful and splendid natural scene- ry. Its total area is 35,961 km2, more than 70% of which is moun- tainous terrain, with over half having an altitude above 1000 meters. The population is 23.0 million, 95% of which inhabits the Western Corridor. The major metropolises are Taipei in the north, with a population of 6.15 million, and Kaoshiung in the south, with a population of 2.71 million. Other cities along the Western Corridor are Taoyuan, Hsinchu, Taichung and Tainan. In 1987, in view of the deteriorating quality and saturation of transportation in the Western Corridor, the Taiwan Transporta- tion Bureau was appointed by the Executive Yuan to under- take a “Feasibility Study for a High-Speed Rail System in the Western Corridor”. The aim of this study was to improve the transportation service in this area and coordinate with the me- tropolitan rapid transport system plan for constructing a com- plete transportation network.
After almost 13 years of preparation and planning, the construction work on the Taiwan High-Speed Rail (THSR) system began on March 27, 2000. The THSR project, the rou- te of which is mapped in Figure 6, is not only one of the most challenging infrastructure projects in the world to date but al- so the largest private-sector-invested public construction pro- ject concurrently. The total construction investment needed is approximately USD 15 billion. The planned system is 344.68 km in length, including 252 km of overpasses and 48 km of tunnels, for which revenue service is projected to commence by the end of 2006. The THSR line runs from Taipei to Kaoh- siung, passing 14 major cities and counties and 77 townships and regions. In the earliest phase, eight stations located in Tai- pei, Banciao, Taoyuan, Hsinchu, Taichung, Chiayi, Tainan and Zuoying, will be operational. Five additional stations (Nan- gang, Miaoli, Changhua, Yunlin Stations and Kaohsiung) will be built in a later phase.

K.F.R. Liu et al. / Journal of Environmental Informatics 13(2) 93-103 (2009)
100
TaipeiNangangTaoyuan
Banciao
Hsinchu
Miaoli
Taichung
Changhua
Yunlin
Chiayi
Tainan
Zuoying
Kaogsiung
Operational
Planned for 2012
Northern section (90 kms)
Central section(130 kms)
Southern section(125 kms)
Figure 6. Route of Taiwan High-speed Rail Project.
To prevent a lateral impact on the adjacent environment along the THSR line within the construction and operation sta- ges, the Taiwan Transportation Bureau conducted an EIA re- port concerning the natural, biological, social and economic impacts, including 20 subjects within the years from 1990 to 1994. The Environmental Protection Administration of the Exe- cutive Yuan approved this EIA report on September 12, 1994. According to the information provided in this EIA report, the decision-support framework using fuzzy logic demonstrates its use.
4.2. Assessment Result
In this study, the THSR line was divided into three sec- tions: northern, from Taipei to Hsinchu, about 90 km; central, from Hsinchu to Yunlin, about 130 km; and southern, from Yunlin to Kaohsiung, about 125 km. For each THSR section, three conditions are discussed: the baseline condition (BC) be- fore the construction of the THSR, prediction of the impact wi- thout mitigation measures (PIWOM) and prediction of the im- pact with mitigation measures (PIWM).
Fuzzy logic for the significance of air pollution is illus- trated. The 81 fuzzy rules for evaluating air impact produced in Section 2 are triggered by measured and predicted concen- trations of air pollutants in the EIA report, the results of which
Table 1. Fuzzy Inference of Significance of Air Pollution
CO (ppm)
SO2 (ppb)
NO2 (ppb)
TSP (ppb)
Significance (0-100)
ST 35.0 250.0 250.0 250.0 60.0
Northern section BC 5.6 9.1 199.3 31.8 24.2 PIWOM 5.6 9.1 277.7 31.8 25.5 PIWM 5.6 9.1 230.7 31.8 24.9
Central section BC 5.0 14.0 174.5 35.4 24.2 PIWOM 5.0 14.0 257.1 35.4 25.7 PIWM 5.0 14.0 207.6 35.4 24.9
Southern section BC 5.75 7.0 271.4 38.8 25.0 PIWOM 5.75 7.0 340.2 38.8 30.5 PIWM 5.75 7.0 298.9 38.8 25.4
* ST: standard; BC: baseline condition; PIWOM: prediction of impact without mitigation measures; PIWM: prediction of impact with mitigation measures.
Table 2. Fuzzy Inference of Significance of Water Pollution
DO (mg/l)
BOD5 (mg/l)
SS (mg/l)
NH3-N (mg/l)
Significance (0-100)
ST 6.5 3.0 20.0 0.5 60.0
Northern section BC 5.3 13.9 33.2 4.4 80.8 PIWOM 5.3 13.9 39.3 4.4 82.6 PIWM 5.3 13.9 35.6 4.4 81.4
Central section BC 6.6 31.1 76.5 1.2 81.4 PIWOM 6.6 31.1 105.8 1.2 85.9 PIWM 6.6 31.1 88.2 1.2 85.0
Southern section BC 3.0 14.4 37.7 5.3 84.0 PIWOM 3.0 14.4 42.8 5.3 86.2 PIWM 3.0 14.4 39.8 5.3 84.9
*ST: standard; BC: baseline condition; PIWOM: prediction of impact without mitigation measures; PIWM: prediction of impact with mitigation measures.
are presented in Table 1. The concentrations listed in the four middle columns in Table 1 represent the average values of all measurement points within the respective sections. The signi- ficance of the air-quality standard is 41.6. For the baseline con- dition, with the exception of total suspended particulates (TSP), the other air pollutants (CO, SO2 and NO2) were far below the air-quality standard, thereby inducing the significances of 19.9, 19.9 and 20.4 in the northern, central and southern sections, respectively. The concentrations of CO, SO2 and NO2 were predicted not to cause increase in the construction phase of the THSR; however, a large amount of dust could be genera- ted due to ground excavations, handling materials, truck hau- lage on unpaved site roads, as well as construction of stations, bridges, and tunnels. The exceedances of TSP for a 24-hour average were predicted at 100 air-sensitive receivers, thereby
K.F.R. Liu et al. / Journal of Environmental Informatics 13(2) 93-103 (2009)
101
causing an increase in significances, i.e., 20.7, 20.8 and 23.7 in the northern, central and southern sections, respectively. The number of air-sensitive receivers could be reduced to 54 and the increments in TSP concentrations were eliminated by 60% through certain mitigation measures, such as spraying water to keep the hauling roads in a wet condition, reducing vehicle speeds and limiting vehicular movements in unpaved areas, providing wheel- and body-washing facilities at exits from the site, cleaning public roads wherever necessary, and covering all dusty vehicle loads with tarpaulins for transportation to, from and between site locations. With these mitigation mea- sures, the significances improved to 20.3, 20.3 and 20.6 in the northern, central and southern sections, respectively. Contrast to air pollution, water pollution obtains much higher signifi- cances in all conditions mainly because this pollution was se- vere at the time of testing (see Table 2), i.e., 40% of the rivers that the THSR would cross were severely polluted; 32%, mo- derately polluted; 16%, slightly polluted; whereas only 12% were acceptable.
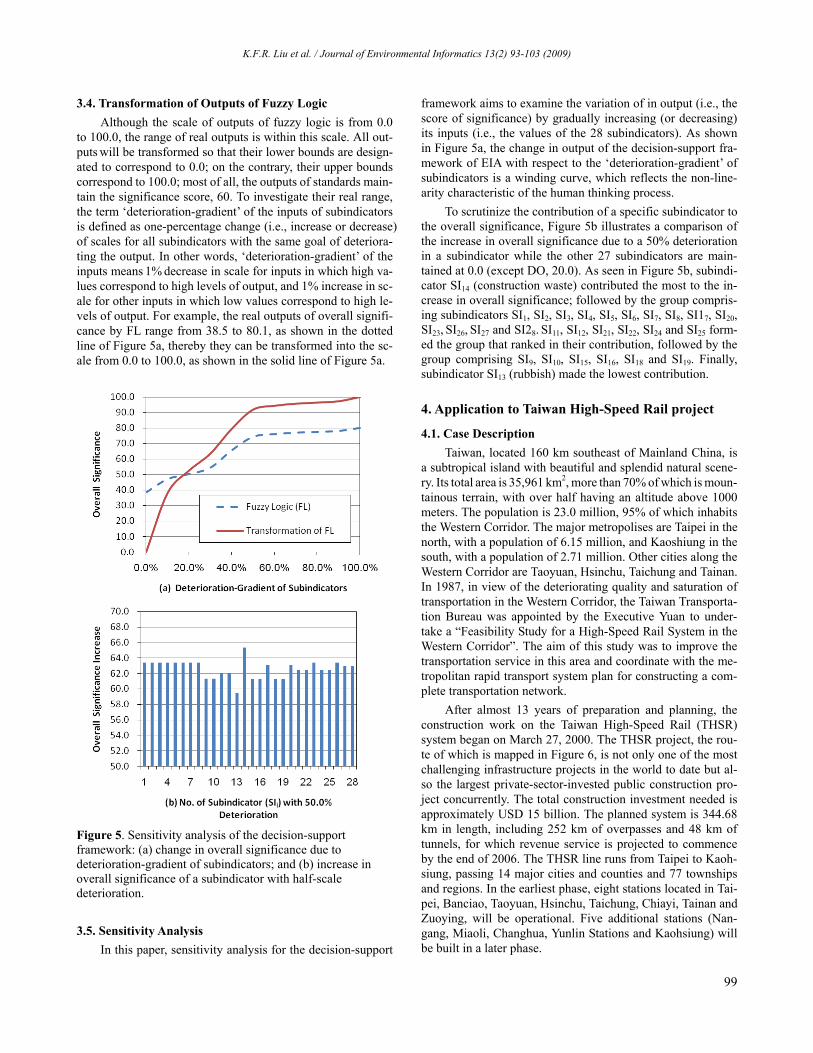
The significances for the other eight indicators are also inferred through respective sets of fuzzy rules. Table 3 shows the outcomes of fuzzy logic; however, the implication of a sig- nificance value is indecipherable when not compared with the standard.
4.3. Cluster Analysis
Cluster analysis identifies and classifies objects or varia- bles on the basis of the similarity of their characteristics. Mo- reover, this analysis seeks to minimize within-cluster variance and maximize between-cluster variance. The results of cluster analysis constitute a number of heterogeneous clusters with homogeneous contents. Substantial differences exist between these clusters, but the objects within a single cluster are simi- lar. Thus, if the classification is successful, the objects within clusters will be proximate when plotted geometrically; whe- reas those of different clusters will be peripheral.
In this study, the increase in the significance of the PIWM when compared with the BC, that is PIWM/BC, was of parti- cular concern because this increase reveals the level of envi- ronmental impact due to the construction work. To interpret the impact, a nonhierarchical clustering technique, similar to importance-performance analysis (Martilla and James, 1977), was implemented on the basis of the influences of indicators and the decline in levels of PIWM significance relative to the BC. The influences of indicators from I1 to I10 are 0.077, 0.109, 0.107, 0.107, 0.275, 0.029, 0.025, 0.086, 0.108 and 0.077, res- pectively, being the results of with dependences and influen- ces among indicators well considered (Liu and Lai, 2009). So- lid waste (I5), referring to construction waste in particular, ob- tains the highest influence (0.275) because the production of construction waste implies more TSP, SS, noise, soil pollution, and more destruction of terrestrial and aquatic habitats. How- ever, aquatic I7 has the lowest global weight (0.025) due to low influence.
Clustering began with the manual selection of a seed point (i.e., a cross in Figure 7) for each potential cluster, usually located at the centroid of all objects within the cluster. Each object must belong exclusively to a cluster whose seed point is nearest to this object. Figure 7 illustrates geometrica- lly the three clusters in a coordinate graph where the x-axis represents the influence of the indicator and the y-axis indicates the decline in acceptability due to the THSR project. Cluster A indicates the indicator with less influence but severe increase in significance. Terrestrial species, with low influen- ces on other indicators, will receive a greater impact owing to destruction of their habitats. Moreover, culture will also be subjected to a higher impact. The THSR project should devise a superior plan to preserve the terrestrial species, cultural heritage and landscape. The rest of indicators converge into cluster B, representing low increase in significance and low influence. Even some indicators such as air, water, soil, aquatic and society will have a slight increase in significance. Cluster C denotes the indicator with low increase in signifi-
Table 3. Evaluation Results of Significances
Northern section Central section Southern section
ST BC PIWOM PIWM BC PIWOM PIWM BC PIWOM PIWM
Air 60.0 24.2 25.5 24.9 24.2 25.7 24.9 25.0 30.5 25.4 Water 60.0 80.8 82.6 81.4 81.4 85.9 85.0 84.0 86.2 84.9 Soil 60.0 15.5 18.2 16.7 15.5 18.2 16.7 15.5 18.2 16.7 Noise 60.0 50.3 58.5 55.3 49.8 56.5 53.6 50.2 60.9 53.8 Solid waste 60.0 42.6 83.9 54.0 41.5 86.4 50.1 40.3 64.3 48.3 Terrestrial 60.0 27.6 64.6 57.5 27.6 63.8 55.9 27.6 64.1 54.8 Aquatic 60.0 41.2 48.5 46.3 41.4 57.9 45.0 41.7 49.4 46.9 Economy 60.0 38.7 54.1 52.4 44.1 51.7 50.7 44.1 50.9 49.5 Society 60.0 39.6 43.8 42.8 45.5 48.7 47.5 48.5 51.4 50.7 Culture 60.0 33.2 55.1 52.6 31.7 57.0 54.6 30.5 57.5 54.8 Environment 60.0 66.9 83.6 68.4 66.8 84.1 68.3 67.1 73.3 67.7 Ecology 60.0 34.9 55.7 51.8 34.9 57.1 51.3 34.9 55.2 51.3 Socioeconomy 60.0 45.1 53.2 51.6 46.8 53.9 52.6 47.2 54.6 53.2 Overall impact 60.0 63.1 75.1 66.3 63.4 75.4 66.4 63.6 70.3 66.1
*ST: standard; BC: baseline condition; PIWOM: prediction of impact without mitigation measures; PIWM: prediction of impact with mitigation measures.

K.F.R. Liu et al. / Journal of Environmental Informatics 13(2) 93-103 (2009)
102
A
A
A
B
B
B C
C
C
Figure 7. Cluster analyses of PIWM/BC for (a) northern, (b) central and (c) southern sections.
cance and high influence. Despite this lower increase, cons- truction waste influences heavily other indicators, thereby rendering it noteworthy.
5. Conclusions
A decision-support framework considering air, water, soil, noise, solid waste, terrestrial, aquatic, economics, society and
culture has been developed to evaluate significance of envi- ronmental impacts of construction projects. The framework utilizes fuzzy logic as a decision-support approach to captur- ing evaluation knowledge because fuzzy logic has the ability of computing with words to mimic the manipulation of human perceptions. Although the case study of the Taiwan High- Speed Rail project has demonstrated the use of the proposed approach, further investigation is needed in the future, such as a refinement of evaluation sections (more than three sections) to reflect realistic situations.
Acknowledgments. The authors would like to thank the National Science Council of the Republic of China (Taiwan) for financially supporting this research under Contract NSC 95-2211-E-212-024.
References
Borri, D., Concilio, G., and Conte, E. (1998). A fuzzy approach for modeling knowledge in environmental systems evaluation, Com- put., Environ. Urban Syst., 22(3), 299-313, doi:10.1016 /S0198-97 15(98)00045-3.
Canter, L. (1996). Environmental Impact Assessment, McGraw-Hill, Singapore.
Canter, L.W., and Canty, G.A. (1993). Impact significance determina- tion basic considerations and a sequenced approach, Environ. Im- pact Assess. Rev., 13, 275-97.
Chen, Q., and Mynett, A.E. (2003). Integration of data mining techni- niques and heuristic knowledge in fuzzy logic modelling of eutro- phication in Taihu Lake, Ecol. Model., 162, 55-67.
Cloquell-Ballester, V.A., Monterde-Diaz, R., Cloquell-Ballester, V.A., and Santamarina-Siurana, M.C. (2007). Systematic comparative and sensitivity analyses of additive and outranking techniques for supporting impact significance assessments, Environ. Impact Assess. Rev., 27, 62-83, doi:10.1016/j.eiar.2006.08.005.
Duinker, P.N., and Beanlands, G.E. (1986). The significance of envi- ronmental impacts: an exploration of the concept, Environ. Ma- nage., 10(1), 1-11, doi:10.1007/BF01866412.
Dzidzornu, D.M. (2001). Environmental impact assessment proce- dure through the conventions, Eur. Environ.Law Rev., 10(1), 15- 27.
Gonzalez, B., Adenso-Diaz, B., and Gonzalez-Torre, P.L. (2002). A fuzzy logic approach for the impact assessment in LCA, Resour. Conserv.Recycling, 37, 61-79.
Liu, K.F.R. (2007). Evaluating environmental sustainability: An integration of multiple-criteria decision-making and fuzzy logic, Environ. Manage., 39, 721-736, doi:10.1007/s00267-005-0395-8.
Liu, K.F.R., and Lai, J.H., (2009). Decision-support for environmen- tal impact assessment: A hybrid approach using fuzzy logic and fuzzy analytic network process, Expert Systems with Applications, 36, 5119-5136, doi: 10.1016/j.eswa.2008.06.045.
Martilla, J.A., and James, J.C. (1977). Importance-performance ana- lysis, J. Mark., 41(1), 77-79.
Marusich, L.J., and Wilkinson, P.F. (2001). The application of fuzzy logic analysis to assessing the significance of environmental im- pacts: case studies from Mexico and Canada, Report for the Cana- dian Environmental Assessment Agency, http://www.ceaa-acee.g c.ca /015/001/012/index_e.htm.
Ong, S.K., Koh, T.H., and Nee, A.Y.C. (2001). Assessing the en- vironmental impact of material processing techniques using an analytical hierarchy process method, Journal of Materials Pro- cessing Technology, 113, 424-431, doi:10.1016/S0924-0136(01)00 618-5.

K.F.R. Liu et al. / Journal of Environmental Informatics 13(2) 93-103 (2009)
103
Ramanathan, R. (2001). A note on the use of the analytic hierarchy process for environmental impact assessment, J. Environ. Manage., 63, 27-35.
Roussel, O., Cavelier, A., and van der Werf, H.M.G. (2000). Adapta- tion and use of a fuzzy expert system to assess the environmental effect of pesticides applied to field crops, Agricul ture, Ecosystems and Environment, 80, 143-158, doi:10.1016/S0167-8809(00)00142 -0.
Saaty, T.L. (1990). The Analytic Hierarchy Process, Pergamon Press, New York.
Saaty, T.L. (2001). Decision Making with Dependence and Feedback: The Analytic Network Process, PA:RWS, Pittsburgh.
Shepard, R.B. (2005). Quantifying Environmental Impact Assess- ments Using Fuzzy Logic, Springer, New York.
Siqueira Campos Boclin, A., and Mello, R. (2006). A decision-sup- port method for environmental impact assessment using a fuzzy logic approach, Ecol. Econ., 58, 170-181.
Solnes, J. (2003). Environmental quality indexing of large industrial development alternatives using AHP, Environ.Impact Assess. Rev., 23, 283-303, doi:10.1016/S0195-9255(03)00004-0.
Tesfamariam, S., and Sadiq, A.R. (2006). Risk-based environmental
decision-making using fuzzy analytic hierarchy process (F-AHP), Stochastic Environ. Res. Risk Assess., 21, 35-50, doi:10.1007/s004 77-006-0042-9.
Tran, L.T., Gregory, K.C., O’Neill, R.V., and Smith, E.R. (2004). Integrated environmental assessment of the mid-Atlantic region with analytical network process, Environ. Monit. Assess., 94, 263- 277.
Tsamboulas, D., and Mikroudis, G. (2000). EFECT: evaluation fra- mework of environmental impacts and costs of transport initi- atives, Trans. Res. Part D: Transport and Environment, 5, 283-303, doi:10.1016/S1361-9209(99)00038-3.
Van der Werf, H.M.G., and Zimmer, C. (1998). An indicator of pes- ticide environmental impact based on a fuzzy expert system, Che- mosphere, 36(10), 2225-2249, doi:10.1016/S0045-6535(97) 10194 -1.
Zadeh, L.A. (1975). The Concept of a Linguistic Variable and its Ap- plication to Approximate Reasoning, Information Sciences, 8(3), 199-249.
Zadeh, L.A. (1996). Fuzzy logic = computing with words, IEEE Transactions on Fuzzy Systems, 4(2), 103-111, doi:10.1109/91.493 904.