evaluating environmental decision support tools · bnl-74699-2005-ir evaluating environmental...
TRANSCRIPT

BNL-74699-2005-IR
Evaluating Environmental Decision Support Tools
Terry Sullivan
October 2002
Environmental Sciences Department Environmental Research & Technology Division
Brookhaven National Laboratory
P.O. Box 5000 Upton, NY 11973-5000
www.bnl.gov
Managed by Brookhaven Science Associates, LLC
for the United States Department of Energy under Contract No. DE-AC02-98CH10886

DISCLAIMER
This report was prepared as an account of work sponsored by an agency of the United States Government. Neither the United States Government nor any agency thereof, nor any of their employees, nor any of their contractors, subcontractors, or their employees, makes any warranty, express or implied, or assumes any legal liability or responsibility for the accuracy, completeness, or any third party’s use or the results of such use of any information, apparatus, product, or process disclosed, or represents that its use would not infringe privately owned rights. Reference herein to any specific commercial product, process, or service by trade name, trademark, manufacturer, or otherwise, does not necessarily constitute or imply its endorsement, recommendation, or favoring by the United States Government or any agency thereof or its contractors or subcontractors. The views and opinions of authors expressed herein do not necessarily state or reflect those of the United States Government or any agency thereof.
Evaluation of Environmental Decision Support Tools
Terry Sullivan
October, 2002
Environmental & Waste Technology Division Brookhaven National Laboratory
Upton, NY 11973

1
Table of Contents 1) Introduction............................................................................................................................. 2
1.1 Objective ......................................................................................................................... 1 2) Taxonomy/Framework............................................................................................................ 3
2.1) What is a Decision Support Tool?....................................................................................... 3 2.2 Advantages of Using a DST ........................................................................................... 4 2.3 Differences between a Computer Model and a DST ...................................................... 4 2.4 Suggested Taxonomy...................................................................................................... 4 2.5 Application of Decision Support Tools in Other Areas.................................................. 7
3) The Decision Support Process ................................................................................................ 9 4) Software Overview ............................................................................................................... 13
4.1 ArcView........................................................................................................................ 14 4.2 API-DSS ....................................................................................................................... 15 4.3 BIOPLUME III ............................................................................................................. 17 4.4 BIOSCREEN ................................................................................................................ 17 4.5 DEFT............................................................................................................................. 18 4.6 DQO-PRO..................................................................................................................... 20 4.7 ELIPGRID-PC .............................................................................................................. 21 4.8 EVS-PRO...................................................................................................................... 21 4.9 FIELDS......................................................................................................................... 23 4.10 GMS – Groundwater Modeling System ....................................................................... 24 4.11 MNAtoolbox................................................................................................................. 25 4.12 MYGRT – Migration of Organic and Inorganic Chemicals in Groundwater............... 26 4.13 RAAS - Remedial Action Assessment System............................................................. 27 4.14 RIP ................................................................................................................................ 28 4.15 ROAM – Remedial Options Assessment Model .......................................................... 29 4.16 SADA – Spatial Analysis and Decision Assistance ..................................................... 29 4.17 VSP- Visual Sample Plan ............................................................................................. 31
5) Review of Selected Software ................................................................................................ 33 6) Issues in the use of Decision Support Tools ......................................................................... 39
6.1 DST Applications.......................................................................................................... 39 6.2 Defining the Role of Modeling ..................................................................................... 40 6.4 Training and Technical Support.................................................................................... 40 6.5 Data Portability ............................................................................................................. 40 6.6 Selection of Appropriate DST ...................................................................................... 41 6.7 Current Directions in DST Development ..................................................................... 41 6.8 Gaps in DST.................................................................................................................. 42
7) References............................................................................................................................. 43 Appendix A: DSS Glossary ......................................................................................................... 45 Appendix B: Suggested Environmental Decision Support Taxonomy........................................ 53

2
Evaluation of Environmental Decision Support Tools 1) Introduction Effective contaminated land management requires a number of decisions addressing a suite of technical, economic, and social concerns. These concerns include human health risks, ecological risks, economic costs, technical feasibility of proposed remedial actions, and the value society places on clean-up and re-use of formerly contaminated lands. Decision making, in the face of uncertainty and multiple and often conflicting objectives, is a vital and challenging role in environmental management that affects a significant economic activity. Although each environmental remediation problem is unique and requires a site-specific analysis, many of the key decisions are similar in structure. This has led many to attempt to develop standard approaches. As part of the standardization process, attempts have been made to codify specialist expertise into decision support tools. This activity is intended to facilitate reproducible and transparent decision making. The process of codifying procedures has also been found to be a useful activity for establishing and rationalizing management processes. The uses envisaged or desired for decision support include: • Identifying realistic management choices; • Integrating information into a coherent framework for analysis and decision making,
discerning key information that impacts decision making from more basic information; • Providing a framework for transparency (i.e. all parameters, assumption, and data used to
reach the decision should be clearly documented) and ensuring that the decision making process itself is documented.
Decision making for environmental contamination problems involves integration of knowledge from many disciplines. There is also a range of contexts in which decisions have to be made, for example defining the extent of contamination, compliance with a regulatory need, enabling redevelopment, registering and mapping sites, and/or prioritizing use of resources. Each has their own suite of decisions. For example, consider the suite of decisions that have to be made when considering remediation as part of a redevelopment process for a particular site. • The first step in the process is to collect information about the site such as location of spills
or disposal areas, the type of contamination that can be expected and the amount of contamination (area, volume, or concentrations). Based on this information, decisions pertaining to collection of site-specific data on the nature and extent of contamination must be made. These types of decisions include the number, frequency, and location of samples balanced against the cost of collecting and analyzing the samples and the value of additional data in arriving at a more robust decision.
• Based on the initial site characterization data, interpolation, extrapolation, and other modeling techniques are often used to estimate the contamination levels between measured data locations. This information is often used in human health risk assessments to guide decisions on the need for remedial action (including monitored natural attenuation). If

1
remedial action is required, decisions pertaining to what regions to treat and what level of remediation is technically and financially achievable must be addressed.
• Projections of contamination levels often have a high degree of uncertainty (i.e., only a few data points are available for estimating contamination over large regions). This uncertainty requires a decision on whether more data is needed to better define the region requiring remediation or to improve the remedy selection or remedy design.
• After remedial actions are complete, monitoring is often required to demonstrate the effectiveness of the remediation. This requires further decisions on what and where to monitor, and the duration of monitoring.
A similar list of questions could be generated for other management processes or functions, such as prioritizing development of several contaminated sites or assessing financial risks for sustainable development. It is unlikely that any single person will have the knowledge to perform all of the analyses required in supporting all of the decisions pertaining to the management of land contamination. Typically, a number of people with different areas of expertise are involved in interpreting basic information and providing it in a form useful for others with less expertise in a given area. It is also apparent that there are many specialist underpinning decisions (e.g., what risk levels are acceptable, what to sample, when to sample, what technologies should be used, etc) that need to be made before general decisions on the reuse of contaminated land can be made. The range of decisions and their inter-relationships lead to a great variety of decision support approaches. It has found that these address different management problems, different segments of each problem, and that they operate on a variety of scales and complexities, using a variety of analysis and techniques. The broad range of decision support tools available in the USA has been reviewed by Sullivan et al (1997, 1999-2000), and new methods are regularly announced on the US Environmental Protection Agency's (US EPA) "TechDirect" service1. The language used to describe decision support methods has not been found to be consistent by these studies. In fact, the use of the term decision support software is waning. However, the need for these types of tools continues as evidenced by four sessions at the upcoming Waste Management 2003 conference that focus on various aspects of decision making and decision support for environmental contamination problems. A common taxonomy (as far as such a thing is possible), and a general conceptual framework for describing decision support methods, would greatly assist comparisons of methods and their applications. The use of the terminology ‘decision support’ to cover such a wide spectrum of topics has led to confusion over what is meant by decision support and confusion as to the capabilities of the different DST. 1.1 Objective This study will have two primary objectives. The first is to develop taxonomy for Decision Support Tools (DST) to provide a framework for understanding the different tools and what they are designed to address in the context of environmental remediation problems. The taxonomy will have a series of subject areas for the DST. From these subjects, a few key areas will be selected for further study and software in these areas will be identified. The second objective,
1 Information on TechDirect is available at www.clu-in.org

2
will be to review the existing DST in the selected areas and develop a screening matrix for each software product.

3
2) Taxonomy/Framework 2.1) What is a Decision Support Tool? In the broadest sense, a DST is any guidance, procedure, or analysis tool that can be used to help support a decision. Bardos, 2001 provides a literal definition of Decision Support as: “the assistance for, substantiation and corroboration of, an act or result of deciding; typically this deciding will be a determination of an optimal or best approach.” Although obvious, it is important to point out that decision support is NOT the same as making a decision. Another important point pertaining to decision support is that it can come in the form of written guidance or in the form of software. Written guidance is frequently provided by regulatory agencies as a means of obtaining a standardized, reproducible approach to reaching a decision. Most regulatory agencies view written guidance as an essential part of the approach to contaminated land management. Examples of guidance documents from the EPA cover the technical approach to evaluating human and ecological risk assessments (EPA, 1989, 1996a, 1996b, 1997, 1998). In many cases, this guidance is translated into computer software to assist in the calculations (e.g., risk assessment). Guidance documents can be categorized as document-driven DST (Powers, 2001). Software tools are also developed to assist in the decision process for computationally intensive analysis, (e.g., flow and transport, geostatistical modeling, and multi-criteria analysis) and for mapping the spatial relationship between contamination data and site landmarks (buildings, roads, etc.). Software tools are categorized as data-driven or model-driven DST depending on the output of the tools (Powers, 2001). An early description of Decision Support Systems states that a software DST has six characteristics (Geoffrion, 1983): 1) explicit design to solve ill-structured problems; 2) easy-to-use and powerful user interface; 3) ability to combine analytical models with data; 4) ability to explore the solution space by building alternatives; 5) capability of supporting a variety of decision-making styles; and 6) allowing interactive and recursive problem-solving. These characteristics lend themselves naturally to contamination problems in environmental systems in which decisions are often made with uncertainty surrounding the data and models used to interpret the data. The uncertainty is often resolved through exploring the effects of alternative conceptual models and parameter choices on the decision. In environmental problems, frequently the analysis requires examination of the problem in a spatial context (e.g., where does contamination exist above specified threshold levels). Spatial decision support tools need to 1) provide mechanisms for the input of spatial data; 2) allow representation of the spatial relations and structures; 3) include the analytical techniques of spatial and geographical analysis, and 4) provide output in a variety of spatial forms, including maps (Geoffrion, 1983). The preceding definitions of decision support are extremely general in nature and permit many things to be identified as decision support tools. This report focuses on defining the taxonomy for software DST for environmental contamination problems. These tools are computer-based systems that facilitate the use of data, models, and structured decision processes in decision making. The optimal DST should attempt to integrate, analyze, and present environmental information to remediation project managers to select cost-effective cleanup strategies. DST output is typically in terms of decision variables (e.g. cost or risk), or provides a direct comparison between alternative remedial strategies.

4
2.2 Advantages of Using a DST The major advantages of using a computerized decision support tool is that it provides improved transparency of the decision process and permits the effects of uncertainty on the decision to be quantitatively addressed. A DST provides a structured process in which all assumptions, model parameters, and predicted outcomes can be reviewed and documented. Therefore, the steps in the decision process can be made transparent to those not directly involved in the process. Uncertainties can be addressed through multiple use of the DST to examine the impact of model parameters and different scenarios on the decision variable. Uncertainties are also addressed through statistical analysis of the data. Incorporating uncertainties in the decision process can lead to better decision making. 2.3 Differences between a Computer Model and a DST There is confusion over the difference between a DST and a model. The key difference is that a DST provides the information in terms of a decision variable. For example, if the decision was how much soil needs to be remediated, a DST would estimate the volume of soil in excess of a risk-based concentration limit. Computer models that produce output in terms of technical variables, e.g., flow rate, are not DST. For example, if the goal is to define an optimum sampling strategy, knowledge of the flow rate is insufficient to address this decision. However, computer models that produce output of technical variables may be incorporated into a DST. In the preceding example, the flow code could be coupled with knowledge about the source term, contaminant transport and geostatistical analysis to form a DST that calculated optimum sampling locations. 2.4 Suggested Taxonomy Several papers have proposed categories to define decision support software tools (Powers, 2001, Pollard, 1999, Sullivan, 1997) . The suggested categorizations all have substantial overlap and their differences are primarily related to the degree of generality. Some define the taxonomy based on the solution technique (multi-attribute analysis, uncertainty analysis, etc.). While others define the taxonomy based on the application (sustainable land development, site characterization, etc.). One of the first classification schemes proposed for Decision Support Software (DST) for environmental contamination problems was based on the different aspects of the remediation process (Sullivan, 1997). The following categories were identified:
a) Site characterization. This includes defining data quality objectives and sampling requirements.
b) Contaminant characterization. Defining the nature and extent of contamination. c) Data Worth Analysis. Optimizing sample collection and defining the added benefit of
collecting more data in terms of improving the decisions that will be made. d) Remedy Selection. Based on characterization data, identification of the optimal remedial
alternative. e) Remedial Design Optimization f) Human-health and Ecological Risk Assessment
5
g) Cost/Benefit Analysis. Defining the costs associated with different remedial alternatives or different remediation goals.
The taxonomy suggested by Sullivan (1997) is the most focused on the actual steps in defining and remediating an environmental contamination problem and is retained as the starting point for defining the taxonomy for this review. Since the 1997 review, the use of the term decision support has declined, a number of software programs have either stopped development or are no longer supported, and the market appears to be stabilizing around a few products. In addition, database management and visualization of spatial data have become recognized as integral parts of any environmental contamination problem. For this reason, a streamlined version of the 1997 taxonomy of Sullivan is suggested. Decision support tools can be categorized into four major categories that cover different aspects of the process.
a) Defining the nature and extent of contamination. b) Remedy selection and optimization. c) Human and ecological risk assessment. d) Benefits Analysis including cost estimation or other benefits such as risk reduction that
result of remedial activities. Defining the nature and extent of contamination includes all work related to site and contaminant characterization and optimization of the process. These tools support decisions on the approach and implementation of: • setting data quality objectives and sampling requirements to define the level and location of
contamination, • data collection to define contaminant flow paths and exposure pathways, and • optimization of sample collection to provide the maximum amount of information for a fixed
number of samples or cost. Site characterization DST’s are often combined with human and ecological risk assessment tools. When this occurs cleanup guidelines can be defined for prescribed risk levels. In some cases, site characterization tools are also connected with simple cost-benefit tools that permit the computation of remediation costs as a function of the volume of soil or water that needs to be treated. Remedy selection and optimization includes all work to support decisions related to selecting the most appropriate technology based on key decision variables (e.g., cost, financial and human health risk reduction, schedule, meeting regulatory requirements, etc.). Remedy selection may involve a comparison between different remedies, or demonstration that a selected remedy meets all of the requirements. Optimization of a remedy is typically performed to lower costs while meeting all other requirements. Optimization can be performed prior to implementation of a system. For example, the location and flow rates of extraction wells in a pump-and-treat system are typically selected through an optimization process. Optimization can also be performed after installation of a remedial system to improve performance based on data collected through

6
operating the system. For example, after operation of a system for an extended time-period, analysis of the value of information supplied from the monitoring system can be evaluated to determine if different information is required, or if some of the current information being collected is redundant (correlated with other data) or unnecessary (i.e. always clean). Use of DST for optimization of a remedial technique tends to require software specifically developed for the remedial process and involves highly technical decisions (e.g. determine the optimum flow rate for a soil vapor extraction system). For this reason, remedy optimization DSTs generally do not contain tools for addressing other aspects of the remediation problem. In contrast, remedy selection DSTs often rely on extensive data bases and compare different options. Therefore, they are often connected to tools that evaluate costs. Human and ecological risks are commonly used to support decisions on the impacts of the contamination to health and the environment. Risk is often used as an endpoint in deciding remediation goals and therefore, this class of tools contains the greatest number of software products. A typical application of a risk assessment would be to calculate the risk from soil contamination due to heavy metals based on characterization data and compare the results to a specified risk level. Benefits analysis is typically used to support decisions on whether additional remediation is warranted based on the benefits that will occur. Benefits analysis involves quantitative estimation of benefits, which are typically costs or reduction in risks. Other benefits could include improved confidence that the remedy will successfully meet cleanup goals. Improved confidence can be obtained through increased characterization, improved understanding of contaminant movement, or remediation of a larger area/volume than estimated. Each of these will impact cost and schedule, therefore a cost benefit analysis can be performed to evaluate the benefit of increasing the chance for successfully meeting cleanup goals. Each of these categories can have unique decision support tools. However, as discussed in the above examples, it is possible for a single software system to address more than one category. For example, a contaminant characterization tool may define the extent of contamination and calculate remediation volumes to prepare a cost-benefit analysis based on different risk levels Two important components of many decision support software tools that are not explicitly listed are data management and visualization. Many environmental contamination problems have large amounts of data affiliated with them (characterization data, human and ecological risk data, technology performance data, cost data, etc.) Maintaining this information is important for understanding changes over time, and quality control. Effective depiction of the spatial relationship exhibited by data is often critical for effective communication between stakeholders. Data management and visualization needs occur throughout the analysis and most tools either incorporate them directly (e.g., supply the database on technology performance) or have the capability to read database files generated by other software. Similarly, most environmental DST provides some visualization capabilities or exports their data files to software that can visually represent the data. The above taxonomy does not specify the analysis technique (e.g. multi-criteria analysis, life-cycle, etc.) as suggested by other approaches. The importance of selecting a technique is related

7
to the intended purpose of the analysis, and the expectation of interested parties on what constitutes a demonstration of the acceptability of an approach. 2.5 Application of Decision Support Tools in Other Areas The intent of a Decision Support Tool is to provide information in a form that readily supports the decision. Often there is a wide range of disparate data available to the decision-maker. For example, in environmental problems, it may include meteorological data (e.g., temperature, pressure, wind speed, precipitation, etc.), geologic data (soil structure, physical and chemical properties of the soil, etc.), hydrologic data (depth to the water table, groundwater elevation, groundwater flow rate and direction, hydraulic properties of the soil, etc), contamination data (source, distribution in the soil and groundwater over time, physical and chemical form of the contamination, etc.) and exposure pathway data (location of receptors, contamination uptake factors in plants, resuspension factors, etc.). It is essential for a decision support system to take the appropriate data from all of the available data and synthesize this information to provide knowledge useful to the decision process (e.g. define likelihood of exceeding a risk threshold, identify uncertainties in the analysis and model parameters that could impact decisions). The use of DST to assist in environmental contamination problems constitutes a small fraction of the amount of work being performed on developing computer based decision support tools. Decision Support Tool is a general term that has been used in a variety of fields including agriculture, business, and medicine. As such, there is a wide range of DSS tailored to support specific decisions. Applications include: • Optimization of pesticide and irrigation applications to maximize crop yield. (Agriculture) • Optimization of maintenance and routing schedules for the airline industry. (Business) • Minimization of financial risks for large construction projects. (Business) • Minimization of financial risks for remediation of contaminated sites (Business) • Minimization of administrative and medical benefits costs. (Business) • Optimization of the use of groundwater resources. (Groundwater management) • Optimization of medical diagnosis (Medicine). • Optimization of land usage for urban planning. (Business) • Minimization of temporal exceedences of air quality standards resulting from vehicular
emission sources. (Regulatory) The theoretical basis for decision support tools and their applications are taught at many Universities, generally in management information sciences departments. These courses focus on decision making in the face of uncertainty and typically cover topics such as probability and Bayesian statistics as well as artificial intelligence concepts, case-based reasoning, expert systems, rule based systems, machine learning methods, data mining, and neural networks. Courses in decision support systems to improve medical diagnostics in the face of incomplete or ambiguous information are offered at some medical schools. In addition, several journals address both the theory and applications of decision support tools. These include Decision Support Systems, Decision Sciences, Journal of Data Intensive Decision Support, Journal of Decision Support, as well as journals that feature other topics but often have decision support articles (e.g., Journal of Management Information Systems).

9
3) The Decision Support Process Decision support methods codify expert knowledge and expertise into a "stored" method or process. The decision support methods use specific information for a particular problem; with the aim of providing a concise representation of the essential decision making issues for that particular problem. Hence, decision support integrates information to produce usable knowledge, as illustrated in Figure 1. For example, consider the decision to select between two different remedial alternatives. The analyst would start with knowledge about the nature and extent of contamination. This information would be used to estimate the volume requiring treatment based on the "stored" knowledge (e.g., best practice, regulatory limits, cost data, data management and analysis techniques including interpolation, etc.). This information could then be used as the basis for the selection and/or design of the remedial options. For example, "stored" information on typical remediation costs could be used to estimate likely project costs. Other knowledge such as the degree of uncertainty in the volume requiring remediation and the reliability of the different remedial options could also be evaluated. The decision maker would then be presented with information on costs, probability of success, and what is being treated for the money spent to support the decision on a course of action. problem stored general decision specific expertise knowledge information Figure 1 –Illustration of Decision Support Decision support methods help to make the decision making process transparent, documented, reproducible, robust, and provide a coherent framework to explore the options available. Figure 2 illustrates the stages used to arrive at decision support knowledge for a typical site. The stages of the decision support process are confined within the dotted lines of Figure 2. Taking the decision is illustrated as being supported by the process. The first stage in the decision support process is to use experience and site-specific information (for example relating to the source terms, pathways and receptors) and site-specific data (for example, soil properties and hydrology). The second stage uses this information to develop simple conceptual models of the site behavior. The conceptual model is the basis for the analysis (third stage in the process) which combines information on the technology being proposed (if any) and the information used to form the conceptual model. Often all of this information is processed in computer software. There are several reasons for the use of software. First, the sheer amount of data in many problems favors electronic storage and manipulation. Second, the complexity of the analysis (e.g., geostatistics, groundwater flow and transport, human health risk assessment) requires many calculations, which can easily be done on a computer. Third, the use of computers permits rapid evaluation of the effects of changing parameters or scenarios. This may permit uncertainties to be addressed.

10
For example to determine the effectiveness of different remedial options, estimates of contaminant concentrations before and after remediation may be determined through a combination of data, geostatistical interpolation and flow and transport models. Usually this information has to be interpreted and analyzed in terms of the decision variable (fourth stage in the process). In this example, the contaminant concentrations can be compared to regulatory thresholds and the region that exceeds the threshold can be defined for each remedial option. The interpretation and analysis may be facilitated by the computer software, but it is the responsibility of the analyst to insure that the analysis is accurate and the output is in a form useful for decision making. The knowledge supplied to the decision makers (fifth stage) should be transparent and readily understandable by different stakeholders, not just specialists. Indeed, even specialists might struggle with the sheer volume of detail that arises from many sites, and so require some form of rational abstraction of information into a more manageable volume and level of detail. These five stages form the basis for decision support, which uses information abstracted from other (and often more detailed) analyses.

11
Figure 2: Flow chart containing the essential steps in the decision support process. Decision knowledge is supplied to the decision makers, who then evaluate whether all stakeholders agree that the information provided is sufficient to support a decision. All environmental decisions are made with some degree of uncertainty. Complete knowledge is never available or attainable. If the stakeholders conclude that a decision can not be made, they may request additional data, improved conceptual models, consideration of different technologies or refined analysis. The process of providing decision support is repeated with the
Experience and Problem Specific Knowledge
Site Data
Develop Conceptual Model
Data Analysis
Technology Data
Integrate and Interpret Analysis
Provide Decision Support Knowledge
Available knowledge sufficient to all interested stake holders to make a decision?
Make Decision
Collect More Information
Yes
No
Decision Support Process
Decision Making

12
new information until a decision can be reached. In some cases, it may not be possible to get all stakeholders to agree to an approach. When this occurs, the process may be vulnerable to litigation. Figure 2 also includes the idea that using models is not the same as decision support. Rather using models, and modeling techniques and software, is a step in information collection that precedes decision making. It is the integration of model results and their interpretation in terms of the decision variable that supplies decision support. This is an important distinction and is made on the basis that decision support implies making usable information available to a variety of stakeholders. A variety of stakeholders may play a role in contaminated land decision making, for example: land owners/problem holders; regulators and planners; site users; those with a financial connection to a site; the neighbors to a site including the local community; the consultants, contractors, researchers and vendors involved in designing and implementing the remediation. In some cases, campaigning organizations and pressure groups may also seek involvement. Clearly, it would be an unlucky site manager who had to defend his decision making against all of these stakeholders simultaneously, but any decision made should be clear to them. In particular the site owner and a busy regulator, dealing with a variety of issues, not just contaminated land, will want reliable information that can be easily and quickly understood. Decision support exists within three broad sets of boundaries: the range of technical possibilities; the level of detail that is appropriate and the legislation and regulations pertinent to the decision. An effective decision support tool needs to offer options that are both technically and economically feasible and permitted by regulators, the public and other stakeholders. In a practical sense, it is equally important that the level of detail is appropriate. The level of detail provided to the decision-makers must be sufficiently explanatory, but it must also be readily understood (as pointed out above). The implications of excess detail are not only reducing the helpfulness of the decision support, but also increasing the cost of the decision support knowledge.

13
4) Software Overview The sheer amount of data collected to define the nature and extent of environmental contamination problems makes software tools essential to effectively manage and analyze the data and scenarios involved with remediation of contaminated sites. The scope of this review is focused on software that aid in defining the nature and extent of contamination. Site characterization often relies on DST because large quantities of data can be analyzed and evaluated quickly. DST can permit access to and visualization of the data, generate reports, and define zones above prescribed cleanup goals. Having a data management system as part of the DST can accelerate data processing and reduce the time needed to analyze the data. Software that covers other aspects of environmental remediation is included in this overview in a limited extent to provide an indication of the types of tools that exist. To identify software with these characteristics, a literature search was conducted including the Internet as well as traditional publications. Software developed outside of the United States was not considered in this review. However, there is a substantial interest in environmental Decision Support tools in Europe and the former Soviet Union. NICOLE (the Network for Industrial Contaminated Land in Europe) has had two workshops in the past year that addressed the role of decision support tools for site characterization. Their reports are available at www.nicole.org. Several countries in the former Soviet Union are planning or have begun to develop decision support systems to deal with land contamination originating from the Chernobyl accident. Table 2 contains a list of Decision Support Tools that were developed for or have had substantial applications in addressing environmental problems. Following the table, a brief overview is presented for each software tool covering the:
• Objectives of the software – class of problems addressed • Advantages – main technical strengths, • Applications – types of problems and number of users, and • Limitations – main restrictions in the model or usefulness of the software tool.
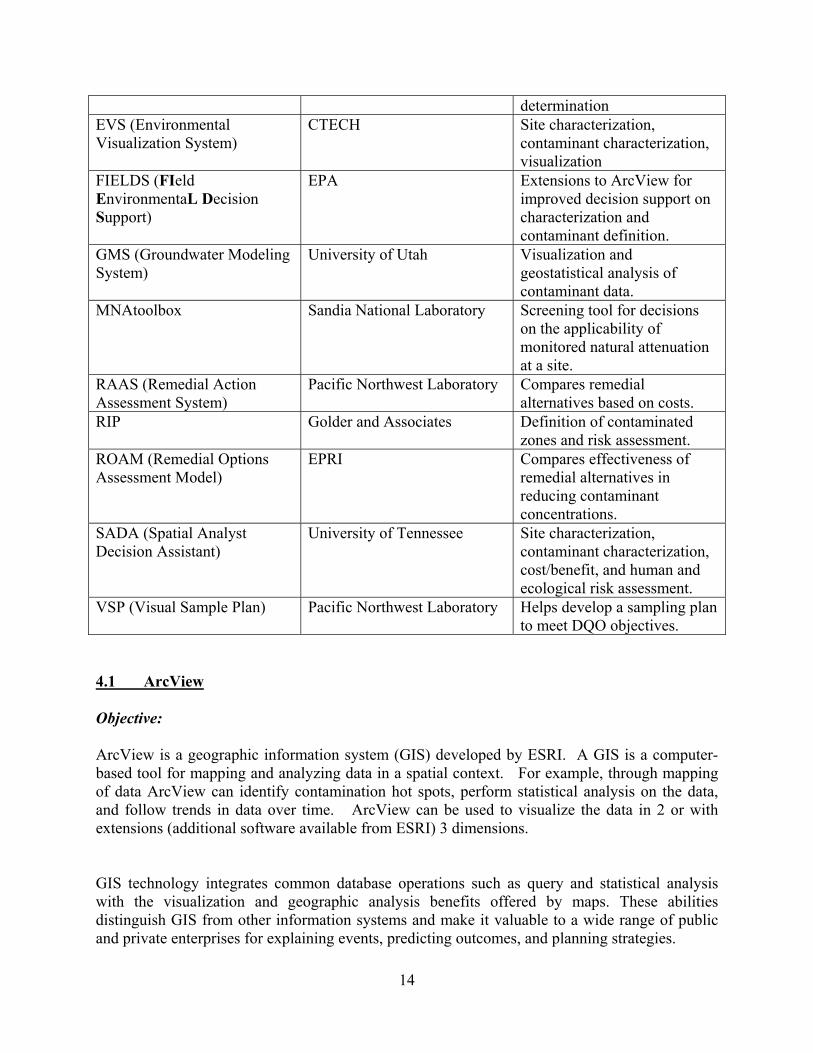
Table 2. Decision Support Tools Software Decision Support Tool
Developer Description/Comment
ArcView Environmental Systems Research Institute (ESRI)
Most widely used GIS system. Visualization and data interpretation. Data management.
API-DSS American Petroleum Institute Fate and transport and risk assessment
BIOPLUME III Rice University Decision Support for MNA BIOSCREEN Air Force Screening tool for decision
support on MNA DQO-PRO Pacific Northwest Laboratory Site characterization and data
collection ELIPGRID-PC Pacific Northwest Laboratory Site characterization, hot spot
14
determination EVS (Environmental Visualization System)
CTECH Site characterization, contaminant characterization, visualization
FIELDS (FIeld EnvironmentaL Decision Support)
EPA Extensions to ArcView for improved decision support on characterization and contaminant definition.
GMS (Groundwater Modeling System)
University of Utah Visualization and geostatistical analysis of contaminant data.
MNAtoolbox Sandia National Laboratory Screening tool for decisions on the applicability of monitored natural attenuation at a site.
RAAS (Remedial Action Assessment System)
Pacific Northwest Laboratory Compares remedial alternatives based on costs.
RIP Golder and Associates Definition of contaminated zones and risk assessment.
ROAM (Remedial Options Assessment Model)
EPRI Compares effectiveness of remedial alternatives in reducing contaminant concentrations.
SADA (Spatial Analyst Decision Assistant)
University of Tennessee Site characterization, contaminant characterization, cost/benefit, and human and ecological risk assessment.
VSP (Visual Sample Plan) Pacific Northwest Laboratory Helps develop a sampling plan to meet DQO objectives.
4.1 ArcView Objective: ArcView is a geographic information system (GIS) developed by ESRI. A GIS is a computer-based tool for mapping and analyzing data in a spatial context. For example, through mapping of data ArcView can identify contamination hot spots, perform statistical analysis on the data, and follow trends in data over time. ArcView can be used to visualize the data in 2 or with extensions (additional software available from ESRI) 3 dimensions. GIS technology integrates common database operations such as query and statistical analysis with the visualization and geographic analysis benefits offered by maps. These abilities distinguish GIS from other information systems and make it valuable to a wide range of public and private enterprises for explaining events, predicting outcomes, and planning strategies.

15
Advantages ArcView is one of the most widely used GIS systems in the United States and is the most widely used for environmental contamination problems. ArcView and its extensions, Spatial Analyst and 3DAnalyst, have been extensively applied to environmental contamination problems as a tool for assessing site and contaminant characterization. ArcView has also been used to support risk assessment and remedial action work. ArcView and its extensions include the ability to integrate data from a series of databases, provide geographic display and mapping capability, and they have a script language that permits model interfaces to be developed. Although a number of GIS systems could be used for environmental decision support, ArcView is the most widely used and therefore, it’s capabilities are discussed in this report. ArcView is an integral component of EPA’s FIELDS (Fully Integrated Environmental Decision Support) program. Many of the comments pertaining to ArcView also pertain to other GIS systems. Limitations ArcView is a general software tool that by itself is not focused solely on decision support for environmental contamination problems. The generality of the software requires that it support a wide range of functions to address different situations. Although ArcView is relatively easy to use, efficient and proper use requires some training and continual usage. A number of GIS systems exist and are commonly used for mapping a wide range of data (for example, population, infrastructure such as rail lines, power lines, roads, waterbodies, and ecological systems). For those types of decision where the standard features of a GIS provide the information essential to the decision maker, a GIS may be a DST. For example, standard GIS can map areas contamination above a remediation threshold. However, for the full range of problem areas where GIS techniques can provide decision support, specific problem related models are needed. For this wide range of second order uses of spatial data, additional processing or integration with non-spatial models is required to fully support the decision maker (Keenan, 1997). ArcView has had a number of groups develop extensions to aid in decision support for environmental problems and for this reason, it has been selected for inclusion in this report as representative of the capabilities of GIS systems. In cases where models that work with ArcView have been developed, they are addressed separately in this report. Two important extensions to ArcView, Spatial Analyst and 3D Analyst, are sold separately. These extensions permit the user to perform more sophisticated statistical analysis of the data and to visualize the data in 3 dimensions. 4.2 API-DSS Objective The American Petroleum Institute Decision Support System (API-DSS) software can be used to estimate site-specific risks, identify a need for site remediation, develop and support negotiations

16
for site-specific cleanup levels with regulatory agencies, and efficiently and effectively evaluate the effect of uncertainty in input parameters on estimated risk. The AI-DSS is used to estimate human exposure, carcinogenic risk, and non-carcinogenic effects. API's Risk and Exposure Assessment Decision Support System (API-DSS), Version 2.0, calculates carcinogenic risks to, and non-carcinogenic effects on, human receptors from underground and above ground releases of petroleum products. The following six exposure pathways are analyzed: • ingestion of water, • dermal absorption while bathing, • inhalation while showering, • inhalation of soil emissions, • dermal contact with soil, and • soil ingestion Risk assessments can be conducted for numerous petroleum hydrocarbons, petroleum product additives, chlorinated hydrocarbons, and metals. Advantages Version 2.0 of the API-DSS incorporates a number of fate and transport models for easy calculation of receptor point concentrations. Exposure, carcinogenic risk, and non-carcinogenic effects (hazard indices) are calculated using procedures consistent with those described in EPA guidance. The API-DSS is designed to be user friendly and automates a number of processes involved in the analysis. API-DSS input data is via KnowledgePro for Windows, with output files from the DSS in EXCEL. Built-in EXCEL macros permit easy viewing and printing of risk assessment results in a number of convenient and illustrative formats. The database in Version 2.0 provides physical/chemical and toxicological property data for 86 petroleum hydrocarbons, petroleum product additives, chlorinated hydrocarbons, and metals. It can also be modified by the user . The API-DSS estimates site-specific risks at sites contaminated by petroleum hydrocarbons and other contaminants, thereby:
1. identifying the need for site remediation, 2. developing site-specific cleanup levels, and
assessing the effect of various remedial alternatives on the level of long-term human health risk at the site. Limitations

17
The models incorporated into API-DSS are generally analytical and can not accurately simulate complicated subsurface flows. The models are most useful for determining general trends and performing screening level calculations. The exposure data base used with the code must be updated manually to obtain the latest risk factors. The materials database is limited to petroleum hydrocarbons and therefore not appropriate for other contaminants. 4.3 BIOPLUME III Objective: Bioplume III can be used to support decisions on the effectiveness of bioremediation as a means of natural attenuation. Bioplume III is a two-dimensional, finite difference model for simulating the biodegradation of hydrocarbons in groundwater. The model simulates both aerobic and anaerobic biodegradation processes in addition to advection, dispersion, sorption and ion exchange. Bioplume III simulates the biodegradation of organic contaminants using a number of aerobic and anaerobic electron acceptors: oxygen, nitrate, iron (III), sulfate, and carbon dioxide. Advantages: To help the environmental professional with the data management, visualization, and decision-making tasks involved, Bioplume III adopted the EIS Graphical User Interface Platform. EIS (Environmental Information System) is an integrated software platform under Windows 95 in which to register, sort, and evaluate the site-specific data of the physical processes influencing the groundwater migration of organic contaminants. The EIS platform permits integration and quantification of the simulation and data processing error to the risk of health hazard. BIOPLUME III is available for free from the EPA Center for Subsurface Modeling support web site - http://www.epa.gov/ada/csmos/models.html. Limitations Bioremediation studies are data intensive and require detailed site characterization of the key parameters for biodegradation. In addition, in many cases, particularly when nutrients or microbial populations are introduced into the subsurface, it is required to know how these evolve in space and time. BIOPLUMEIII has not been updated since 1997. BIIOPLUMEIII is a two-dimensional model and can not simulate problems in three-dimensions. 4.4 BIOSCREEN

18
Objective: BIOSCREEN is a screening model that can be used to provide decision support on the potential success of biodegradation as a natural method of remediation. BIOSCREEN simulates remediation through natural attenuation of dissolved hydrocarbons at petroleum fuel release sites. The software, programmed in the Microsoft Excel spreadsheet environment and based on the Domenico analytical solute transport model, has the ability to simulate advection, dispersion, adsorption, and aerobic decay as well as anaerobic reactions that have been shown to be the dominant biodegradation processes at many petroleum release sites. BIOSCREEN includes three different model types: (1) solute transport without decay, (2) solute transport with biodegradation modeled as a first-order decay process (simple, lumped-parameter approach), and (3) solute transport with biodegradation modeled as an instantaneous biodegradation reaction with multiple soluble electron acceptors including dissolved oxygen, nitrate, and sulfate. The model is designed to simulate biodegradation by both aerobic and anaerobic reactions. Advantages The use of analytical models permits rapid analysis of the potential for naturally occurring biological processes to remediate dissolved hydrocarbons. The system is easy to use and requires little training other than an understanding of biodegradation and transport processes. Limitations BIOSCREEN is not intended to be used as a remedial design tool as such, its models are fairly simple and can not handle complicated flows or distributions of contaminants and/or microbes.. 4.5 DEFT The Decision Error Feasibility Trials (DEFT) software was developed to assist in determining the feasibility of data quality objectives (DQOs) developed using the Data Quality Objectives Process. DEFT allows decision makers and members of a planning team to quickly generate cost information about several simple sampling designs based on the DQOs. If necessary, the planning team can change the DQOs and evaluate the effect of these changes. It is designed to supplement the EPA Guidance on the Data Quality Objectives Process (QA/G-4) (EPA, 2000b) which describes the DQO Process in detail. DEFT generates cost information about several simple sampling designs based on the outputs from the first six steps of the DQO Process. The planning team can use this information to evaluate whether the DQOs generate cost-feasible sample sizes before the sampling and analysis design team begins developing a final sampling design in the last step of the DQO process. DEFT is designed to address the following types of questions.
• Is the population mean greater/less than a fixed standard? For example, does the mean concentration of hazardous waste in a drum exceed the regulatory threshold?

19
• Is the population proportion/percentile greater/less than a fixed standard? For example, from a series of soil characterization data, does the number of samples containing hazardous constituents above a regulatory threshold exceed 25%?
• Is the difference between two population means significant? For example, does the mean concentration of radioactive soil contaminants at the former fuel processing facility exceed the mean concentration of radioactive soil contaminants in the downtown city park ( background)?
• Is the difference between two population proportions/percentiles significant? For example, does the 98th percentile of daily PM10 particulate concentration measurements taken during 1998 in St. Louis differ significantly from the same measurements taken during 1999?
Advantages DEFT is an easy to use software package designed to address specific statistical questions pertaining to a data set. It can handle single population statistics as well as comparison between two different populations. The application of DEFT for calculating a number of samples is straightforward for random sampling across space when the population remains relatively static over time. For example, DEFT is particularly applicable for calculating sample sizes when investigating slow-moving contaminants in surface soil because the samples can be collected randomly across space, and the concentrations do not change much over time. Limitations DEFT is not an expert system that considers the appropriateness of the DQOs or ensures an optimal (or even feasible) sampling design. Therefore, the software should not be used to validate the DQOs or to select a final sample size. DEFT should be used only to evaluate the feasibility of the DQOs generated (i.e., is it financially practical to collect enough data to have statistical confidence in the result). In the final stage of the DQO process, more sophisticated tools may be used to aid in design optimization, which may yield a lower-cost design. DEFT is not designed to handle problems that involve streams of data over time, which require careful consideration of how correlations affect the analysis. For example, when investigating contaminants in ground water, sampling locations may need to be restricted to locations where wells currently exist, and the concentrations at any given location may vary greatly over relatively short periods of time, making the problem much more dynamic.. Volatile contaminants may present complex challenges because they may move quickly through an environmental medium, thereby creating a dynamic sampling problem in the field, while also posing difficulties in implementing analytical methods, thereby creating measurement problems in both the field and the laboratory. DEFT does not address these types of problems involving dynamic fate and transport for processes such as volatilization, retardation, or decay. DEFT has capabilities that can be misused as well. A composite sampling design is applicable for testing hypotheses concerning the mean; however, it is not applicable for testing hypotheses
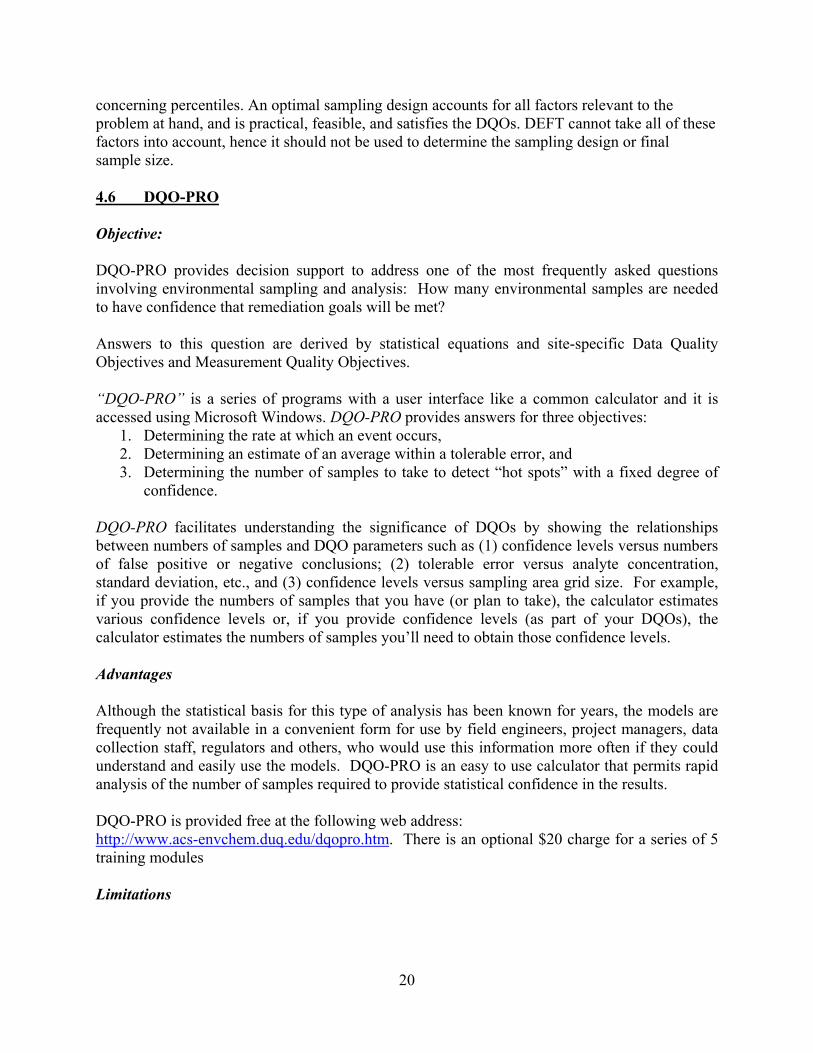
20
concerning percentiles. An optimal sampling design accounts for all factors relevant to the problem at hand, and is practical, feasible, and satisfies the DQOs. DEFT cannot take all of these factors into account, hence it should not be used to determine the sampling design or final sample size. 4.6 DQO-PRO Objective: DQO-PRO provides decision support to address one of the most frequently asked questions involving environmental sampling and analysis: How many environmental samples are needed to have confidence that remediation goals will be met? Answers to this question are derived by statistical equations and site-specific Data Quality Objectives and Measurement Quality Objectives. “DQO-PRO” is a series of programs with a user interface like a common calculator and it is accessed using Microsoft Windows. DQO-PRO provides answers for three objectives:
1. Determining the rate at which an event occurs, 2. Determining an estimate of an average within a tolerable error, and 3. Determining the number of samples to take to detect “hot spots” with a fixed degree of
confidence. DQO-PRO facilitates understanding the significance of DQOs by showing the relationships between numbers of samples and DQO parameters such as (1) confidence levels versus numbers of false positive or negative conclusions; (2) tolerable error versus analyte concentration, standard deviation, etc., and (3) confidence levels versus sampling area grid size. For example, if you provide the numbers of samples that you have (or plan to take), the calculator estimates various confidence levels or, if you provide confidence levels (as part of your DQOs), the calculator estimates the numbers of samples you’ll need to obtain those confidence levels. Advantages Although the statistical basis for this type of analysis has been known for years, the models are frequently not available in a convenient form for use by field engineers, project managers, data collection staff, regulators and others, who would use this information more often if they could understand and easily use the models. DQO-PRO is an easy to use calculator that permits rapid analysis of the number of samples required to provide statistical confidence in the results. DQO-PRO is provided free at the following web address: http://www.acs-envchem.duq.edu/dqopro.htm. There is an optional $20 charge for a series of 5 training modules Limitations

21
DQO-PRO is based entirely on statistics and the assumption of a random distribution of contamination. It does not adjust for spatial correlation in the data (e.g. non-random distribution) that may arise due to source deposition or subsequent transport. 4.7 ELIPGRID-PC Objectives ELIPGRID-PC is a program for the design and analysis of sampling grids for locating contamination "hot spots" . It computes the probability of success in locating "hot spots" based on the assumed size, shape, and orientation of the "hot spots", and on the specified grid spacing. It can also be used to compute a grid spacing from a specified success probability, compute cost information associated with specified sampling grids, determine the size of the smallest hot spot detected given a particular grid, and create graphs of the results. The algorithms in ELIPGRID are contained in the program VSP and they form a subset of the options found in VSP. ELIPGRID has been superseded by VSP, however, it is still being used. Advantages ELIPGRID is easy to use. It can be obtained for free at the following web site: (http://dqo.pnl.gov/software/elipgrid.htm). Limitations ELIPGRID is limited in scope as it is designed to answer a single issue. ELIPGRID is based entirely on statistics and the assumption of a random distribution of contamination. It does not adjust for spatial correlation in the data (e.g. non-random distribution) that may arise due to source deposition or subsequent transport. 4.8 EVS-PRO Objective C Tech's Environmental Visualization System (EVS) unites state-of-the art analysis and visualization tools into a software system developed to meet the needs of environmental professionals that interpret data. EVS focuses on obtaining high quality 3-dimensional visualization (stills and animations) of environmental data. EVS was developed to meet the needs of the geologist, environmental engineer, and environmental program manager as they relate to: • Site assessment: determination of the optimal locations for collecting data in order to best
determine the spatial extent of contamination at the lowest possible cost.

22
• Site evaluation: determination of the spatial extent of contamination. EVS’s “Min-Max Plume” technology quantifies the statistical variation in the volume and mass estimates resulting from the current level of characterization.
• Geology: creation of a three-dimensional model of the site geology and determination of the relationship between the geology and the contaminant plumes. This understanding allows for better-targeted remediation plans, which consider the effect of geology on the migration and capture of contamination. Additionally EVS can compute plume volumes and masses on a (geologic) layer basis.
• Communication: visual presentation of the site geology and contamination is critical for effective communication. EVS provides the ability to integrate geologic information, environmental contamination data, site buildings, roads, aerial photographs, etc., into a single visualization. EVS provides high quality still and animated 3D visualization.
Advantages EVS permits the user to customize the analysis to the problem. EVS is a modular software program that uses a graphical user interface that has object oriented programming that permits the user to drag and drop modules into the analysis. For example, to visualize a subsurface contamination plume, the user could select the following modules:
• read a geology data base file that provides soil stratigraphy data, • interpolate the stratigraphy data in 3-D • read a separate data base file with contamination data, • interpolate the contamination data in 3-D, • read a separate file with a site map including outlines of buildings and roads, • visualize the data in 3-D showing the site map, soil stratigraphy (e.g. ground surface and
confining bedrock layer), contamination levels at all sampling points, and the contour of the volume that has contamination above a pre-defined cleanup threshold,
• generate an animation that rotates around the contaminated zone to increase understanding about the extent of contamination.
EVS’s modularity and architecture provide the ability to customize applications for the most demanding application while preserving an ease of use that provides immediate productivity. EVS can be used to analyze all types of analytes and geophysical data in any environment (e.g. soil, groundwater, surface water, air, etc.). One of EVS’s strengths is the geostatistics modules that provide quantitative assessment of the quality of a site assessment and identification of locations in a site which require additional investigation. These modules can be used to select additional sampling locations that minimize uncertainty in the predicted region of contamination for a fixed number of samples. A major strength of EVS is the sate-of-the-art 3D graphics capability. The visualizations generated by EVS make powerful, clear presentations of the data that can be used to improve communication of the problem between various stakeholders. There are several versions of EVS that can be purchased based on the desired functionality. The versions, in order of sophistication include EVS-Standard, EVS for ArcView, EVS-PRO, and

23
EVS-MVS. EVS-PRO will be reviewed in this report as it includes all of the options in EVS-Standard and EVS for Arc-View and contains all of the tools necessary for environmental remediation problems. Options included in the PRO version are the ability to read ArcView shape files and databases, animation creation and advanced features such as a module to determine the geostatistical importance of a well in defining the nature and extent of contamination. Limitations EVS is a powerful and flexible software product. This flexibility requires that there are a substantial number of modules incorporated into the software. While it is easy to learn the use of the basic modules in EVS, training and continual use are needed to take advantage of all of the options. For example developing scripts to perform repeated tasks. 4.9 FIELDS Objective The FIELDS (FIeld EnvironmentaL Decision Support) Team is a collaboration of Region 5 employees and Research Associates centered in the USEPA Region 5 Superfund Division formed to provide the Environmental Protection Agency with the internal capability for rapid and effective contaminated site characterization. The mission of the FIELDS Team is to combine field expertise with technical innovation to provide rapid, cost-effective, and high-quality decision support to contaminated site characterization and remediation. The FIELDS Team has developed a set of tools that integrate the power of geographic information systems (GIS), imaging software, global positioning system (GPS), and in-field sampling and analysis technology. The FIELDS tools are a collection of ArcView extensions that utilize published methodology for each step in the characterization process. The FIELDS software forms the foundation for a system that provides data analysis and interpretation for environmental decision-making. The results allow project managers to evaluate the extent of contamination and hot spot sizes, estimate health risks, prioritize site goals, and weigh potential actions. Advantages The FIELDS Tools provide a range of data analysis options. These options are broadly defined as sample design, database query, and data and decision analysis.
• Sample Design Sample design capabilities include the creation of statistically-based sample designs (random, stratified random, systematic grid, and unaligned grid) and the ability to upload these designs to a GPS unit in order to navigate to sample locations. The parameters used to create the sample design (e.g., number of sample locations, sample area, false negative values) are exported as a table that can be included in a report.
• Database Query The FIELDS query tool can be used to query all results; the maximum result in 3-

24
dimensions, the maximum result in 2-dimensions, and results by interval (e.g., 0-6 inches, 6-12 inches) either using a depth-weighted average algorithm or the maximum results per interval. The input data can be from a FIELDS-defined data table or imported from databases such as STORET, EQuIS, or NOAA’s Query Manager database. If the input data has field names or types that do not match the FIELDS-defined data table format, an interactive GUI allows users to match their field names with the FIELDS-required names.
• Data and Decision Analysis The resulting queried data values can be used in the Human Health Risk or Ecological Risk Assessment modules. Each module meets U.S. EPA guidelines for risk assessment. In addition, the queried data can be contoured (interpolated) to create estimates at unsampled locations using Dr. Dave Watson’s Natural Neighbor algorithm or ArcView’s Inverse Distance Weighting (IDW) algorithm. The FIELDS Tools also includes a cross validation routine that generates root mean square errors (RMSE) of estimation for permutations of IDW parameters, number of neighbors and exponent.
The contoured values can be used to estimate the mass of contaminant (e.g., pounds of PCB) and the volume of contaminated material (e.g., sediment > 10 ppm) using the Mass/Volume module. Finally, the FIELDS Tools includes a Remediation module that allows users to determine areas to remediate in order to meet a clean-up goal by remediation unit (called block-based remediation) or for the entire site (i.e., to meet an average concentration value for an entire area). A major advantage of FIELDS is that it has taken procedures that are routinely performed in environmental analysis and created software modules that work directly with ArcView. This increases productivity and reproducibility while reducing the chance for error in performing an analysis. FIELDS provides a stand-alone 3D viewer that can interpolate and contour data. Limitations Although the FIELDS software is free, use of FIELDS requires ArcView and, its supporting software program, Spatial Analyst. However, many companies have purchased licenses to these products and this will not be a problem. FIELDS provides powerful tools for data analyses, , efficient use requires experience with and regular use of the software. For data interpolation, kriging techniques are generally superior to Inverse Distance Weighting Techniques found in ArcView. Extensions to ArcView such as Spatial Analyst contain kriging algorithms. 4.10 GMS – Groundwater Modeling System Objective The Groundwater Modeling System is a comprehensive package that provides tools for every phase of a groundwater simulation including site characterization, model development, postprocessing, calibration, and visualization.

25
Advantages GMS is an extremely sophisticated interface for developing groundwater flow and contaminant transport models and analyzing the results of the models. GMS provides a graphical user interface to enhance creation of input files (e.g. pre-processing) and output files (post-processing) from a number of popular fate and transport simulation programs. GMS supports modeling of triangular irregular networks (TINs), solid surfaces, borehole data, geostatistical analysis in 2 or 3 dimensions, and creates input files for both finite element and finite difference models in 2 or 3 dimensions. Currently supported models include MODFLOW, MODPATH, MT3D, RT3D, FEMWATER, SEEP2D, SEAM3D, PEST, UCODE and UTCHEM. The integration of input preparation, software simulation, and visualization and data analysis into a single platform makes GMS a powerful tool for subsurface fate and transport analysis. Limitations GMS is a sophisticated piece of software that requires training and regular use to operate efficiently. GMS is often not considered as a decision support tool as it does not emphasize decision processes. However, it has the complete functionality to address sample design, optimization of data collection, definition of plume volume and location, and other decision support functions. Use of GMS as a decision tool requires the analyst to select the proper models and evaluation techniques to support the decision. 4.11 MNAtoolbox Objective MNAtoolbox is a screening tool to be used to evaluate sites for the potential implementation of monitored natural attenuation (MNA). MNAtoolbox was designed to be used with the US Department of Energy's guidelines for implementing monitored natural attenuation. Specific questions that must be answered for successful reliance on MNA at sites include:
1. Is natural attenuation occurring? 2. If so, are reductions in potential contaminant impacts decreasing rapidly enough to
achieve regulatory compliance in an acceptable time frame? 3. Is natural attenuation sufficiently widespread and reliable to assure remedial goals are
achieved? 4. How much long-term monitoring is required? 5. What is the cost of MNA in comparison to other remediation techniques?
Advantages

26
MNAtoolbox identifies primary attenuation pathways, and points out processes that might mitigate against MNA for particular contaminants. Development of site-specific conceptual models describing contaminant transport in the subsurface permits an evaluation tailored to the site. For each contaminant, MNAtoolbox generates a scorecard that uses site-specific input parameters to gauge the probable effectiveness of natural attenuation. Documentation provided with MNAtoolbox outlines a screening procedure for assessing the importance of natural attenuation at a site and provides technical guidance for relying on natural attenuation in contaminated soils and groundwaters. The object of the documentation is to provide site managers, the target audience, the general technical background needed to consider remediation by natural attenuation. The MNAtoolbox is available at www.sandia.gov/eesector/gs/gc/na/mnahome.html. Limitations MNAtoolbox is a screening tool that can rapidly assess the potential use of monitored natural attenuation as a remedy for soil and groundwater contamination problems. It is not designed to develop monitoring networks. 4.12 MYGRT – Migration of Organic and Inorganic Chemicals in Groundwater Objective MYGRT 3.0 can support remedial option decisions resulting from the migration of both inorganic and organic solutes in the unsaturated and saturated zones down gradient of sources (i.e., waste disposal sites or spills). Advantages MYGRT 3.0, developed in 1998, is an interactive, menu-driven code that can simulate problems in one, two, or three dimensions using either horizontal or vertical views. Visualization tools include plots that can be generated including concentration vs. time, concentration vs. distance, areal or cross-sectional contour plots, and concentration vs. depth profiles. Data used to generate each plot is stored as a tabular listing of the predicted concentrations. The results can be displayed on a color monitor, sent to a printer or saved in a project file for later retrieval. Limitations Although, MYGRT is described as decision support software, output is not in terms of decision variables and the analyst must perform another step to interpret the data.

27
The models implemented in MYGRT 3.0 are adequate for general calculations but can not handle more complex situations with heterogeneous subsurface properties. Visualization tools are limited to two dimensions. 4.13 RAAS - Remedial Action Assessment System Objective RAAS™ can be used to support decisions on which remedial technologies can be used, alone or combined, to clean up your site. RAAS can simulate various alternative remedial actions to predict and compare their effectiveness. Advantages With RAAS you can create a list of alternative remedies, then evaluate the effectiveness of each alternative in terms of concentration, risk reduction, and effect on media properties. In addition, the methodology allows the user to then assess and compare those potential remedial response alternatives across the following criteria
• Compliance with Objectives -- Extent to which objectives are met to support statutory finding of protectiveness of public health and safety and ARAR compliance.
• Short-Term Effectiveness -- Time to complete remedial action and physical hazards. • Long-Term Effectiveness -- Degree and permanence of risk reduction. • Extent of Treatment -- Degree of permanent reduction of toxicity, mobility, and volume
through irreversible treatment. • Implementability -- Difficulty of implementing technologies in the alternative. • Cost -- Estimated cost of implementing alternatives.
RAAS is a rules-based, object-oriented software system that runs on a stand-alone personal computer and includes
• ReOpt™ Software, an electronic encyclopedia that provides in-depth information about contaminants, mediums, and environmental remediation technologies
• MEPAS, a physics-based computational model for risk assessment • a site description module that helps quantify site data and define a cleanup strategy,
constraints, and assumptions • a report writing feature that documents assumptions, decisions, and results • an extensive database that includes engineering judgment data to assist new users • simulations of over 100 technologies, including disposal; barriers/removal;
biodegradation/accumulation; immobilization; institutional control; physical/chemical treatment; and thermal technologies
• information on hundreds of contaminants, including referenced physical parameter data • a point-and-click user interface for IBM-compatible computers running the Windows™
operating system.

28
Limitations RAAS has an extensive data base on remedial technologies. The user must verify that the data base is current and relevant to the site-specific situation at hand. The data base must be continually updated to keep current with changes in technology and costs. 4.14 RIP Objective RIP can support decisions on effectiveness of radioactive waste disposal facilities using probabilistic simulations of the release, transport, and fate of contaminants within engineered and/or natural environmental systems. Advantages The evaluation of all transport pathways (e.g., groundwater, surface water, air, soil) in a single simulation provides the capability to conduct an integrated risk assessment. Although originally developed to evaluate the long-term performance of radioactive waste disposal facilities, the software can be readily applied to more commonly encountered environmental problems, such as contaminant release from landfills and/or hazardous waste sites, and contaminant fate and transport in wetlands, lakes and other complex ecosystems. The software can also be used to simulate complex fate and transport processes within biological systems (e.g., physiologically-based pharmacokinetic modeling). The transport pathways used in the model can consist of multiple transport and storage media (e.g., groundwater, surface water, air, soil), and both advective and diffusive transport mechanisms can be directly simulated. Transport processes incorporate solubility constraints and partitioning of contaminants between the media present in the system, and can include the effects of complex chemical reactions and decay processes. It can also model biological transport of contaminants, and like physical transport pathways, is can include any number of transport and storage media (e.g., blood, tissue) which can be linked by a variety of transport mechanisms. The output produced by RIP consists of predicted contaminant release rates from defined sources and transport pathways, and predicted concentrations within environmental media throughout the system (e.g., groundwater, soil, air, blood). Limitations RIP is not designed as a decision support system. Obtaining output in terms of decision variables requires the user to provide appropriate conversion factors to translate environmental concentrations into dose and/or health risk. Output files must be imported into other software for visualization.

29
Issues An important requirement for using the RIP is that the user has a clear understanding of the features, processes, and events controlling the behavior of the system to be modeled. The modeler must have a good understanding of the fundamentals of contaminant transport modeling. This understanding is more difficult to obtain than when using other software systems because it includes surface water The RIP model can be run in a deterministic manner, or can represent uncertainty through the use of probability distributions. However the user must have at least a basic understanding of the representation and propagation of uncertainty as a probability distribution. 4.15 ROAM – Remedial Options Assessment Model Objective ROAM is interactive software that simulates the implications of remedial measures on contaminant plumes in the subsurface. ROAM can provide the basis for choosing a remedial action at a site, provide an assessment for acceptance or rejection of a remedial action, and help define preliminary design goals for a particular remedial action. Advantages ROAM simulates soil-based chemical concentrations, including coal, tars or fuels, and other chemical spills. ROAM includes a single solute analytical transport model, a multi-component numerical vadose zone transport model, and 2-D numerical ground water flow and transport model. ROAM can simulate unsaturated zone remediation measures such as capping, excavation, tank removal, and in-situ bioremediation; and saturated zone remediation measures such as extraction/injection systems, hydraulic barriers, drains, bioremediation and excavation. ROAM is a PC Windows-based modeling package that integrates the GIS-site representation, including chemical distribution, vadose zone and ground water description; the transport and flow models; linkage to chemical databases; and a plotting package for viewing concentrations in the vadose zone and ground water via contour plots, time or distance line plots, and data tables. Limitations ROAM can not address problems that require 3-dimensional analysis. ROAM calculates chemical concentrations but does not emphasize decision variables. As such, the decision process is left to comparison between model runs (e.g. concentrations downstream of a disposal site with and without a landfill cover). 4.16 SADA – Spatial Analysis and Decision Assistance

30
Objective Ultimately, the objective for Spatial Analysis and Decision Assistance (SADA) is to be a unified user-friendly software package that links practical environmental characterization tools to decision-making capabilities. SADA has the capability to integrate models for visualization, geospatial analysis, statistical analysis, human health risk assessment, ecological risk assessment, cost/benefit analysis, sampling design, and decision analysis. Advantages SADA processes and produces information in a clear, transparent manner, directly supporting decision processes, and can serve as a communication tool between technical and non-technical audiences. SADA has a strong emphasis on the spatial distribution of contaminant data and is therefore best suited for anyone who needs to look at data within a spatial context, such as:
• Statisticians • Risk Assessors • GIS Users • Project Managers • Stakeholders
SADA is free software that incorporates tools from environmental assessment fields into an effective problem solving environment. The capabilities of SADA can be used independently or collectively to address site specific concerns when characterizing a contaminated site, assessing risk, determining the location of future samples, and when designing remedial action. A few examples of the types of problem SADA can address include:
• Calculate the volume or area of contamination above a clean-up threshold and present a site map with a map of contamination above a clean-up threshold on top of the site map.
• Calculate the area or volume requiring clean-up as a function of clean-up level and generate costs for remediation to the different clean-up levels.
• Select optimal sampling locations and place them on a site map. The integration of the human health risk capabilities of SADA with modules for ecological risk assessment can help accomplish EPA's mission as outlined in the Ecological Research Strategy to: "develop and demonstrate a multiple pathway, multiple chemical model that integrates human health and ecological cumulative exposure and risk assessments." In addition, using the same problem solving environment for human health and ecological risk assessment assures consistency between the two assessment efforts in terms of the data that is used and the decision rules that are addressed. In this review, only the visualization, sampling design, and cost/benefit attributes of the code will be evaluated. A fully functional freeware version is available on the download page of this web site. SADA is developed in the Institute for Environmental Modeling at the University of Tennessee. http://www.tiem.utk.edu/~sada/ A number of the capabilities present in SADA are also present in the FIELDS (Fully Integrated Environmental Location Decision Support) system.

31
Limitations SADA integrates models from geostatistics with human and ecological risk assessments. Background knowledge in these fields is essential to operating SADA properly when these models are used. Visualization in 3 – dimensions is not as advanced as in other products. Some training covering the assumptions used in SADA and the databases supplied with the code are needed to optimally use the code. SADA does not perform transient analysis to evaluate contaminant transport effects. 4.17 VSP- Visual Sample Plan Objective The purpose of Visual Sample Plan (VSP) is to provide simple, defensible tools for defining an optimal, technically defensible sampling scheme for characterization. Advantages VSP is applicable for any two-dimensional sampling plan including surface soil, building surfaces, water body sediments or other similar applications. VSP provides statistical solutions to sampling design using state-of-the-art mathematical and statistical algorithms, and a user-friendly visual interface. VSP is designed to answer two important questions in sample planning.
• How many samples are needed? The algorithms involved in determining the number of samples needed can be quite involved and intimidating to the non-expert. VSP can quickly calculate the number of samples needed for various scenarios and estimate sampling costs.
• Where should the samples be taken?
Sample placement based on personal judgment is prone to bias. VSP instantly provides random or gridded sampling locations overlaid on the site map.
Important features of VSP are that it:
• Interacts with the user through familiar visual interfaces such as site maps and building plans.
• Provides immediate feedback of the projected results of selected statistical sampling plans by overlaying random sampling locations or grids directly onto the site map or building plan.
• Provides projected number of samples, total sampling costs, and sampling locations in appropriate coordinates.
• Provides graphic decision tools such as graphs of probability of hot spot detection vs. total sampling costs.
• Allows nonparametric and parametric sampling designs.

32
• Generates MARSSIM supported sampling designs for soils and building surfaces. • Incorporates SampTOOL, a tool to guide the user to the appropriate type of sampling
design. VSP is freeware that can be obtained at http://dqo.pnl.gov/VSP/Index.htm. Limitations The analyst should be familiar with statistical concepts to effectively use VSP. VSP does not perform calculations of transport in the optimization of sample design. Therefore, it is best for contaminants that are immobile, or moving slowly with respect to the time between sampling and remediation.

33
5) Review of Selected Software The above list contains DST that cover the entire range of tools needed in addressing environmental contamination problems. For the purpose of this review, a screening matrix was developed for the programs that involve definition of the nature and extent of contamination. Tools that examine remedy selection and optimization, and benefits analysis will be reviewed later. There are a substantial number of tools that primarily address health and ecological risk assessment. The large number of these tools makes them beyond the scope of this project. The review identified the following programs for development of the screening matrix.
ArcView and its extensions Spatial Analyst and 3DAnalyst. DQO-PRO ELIPGRID EVS FIELDS GMS SADA VSP.
Each of these products is reviewed against the following criteria: • DST Function (soil or groundwater contamination characterization) • Contaminant Characteristics (type of contaminants addressed and phase) • Site Characteristics (vadose zone, saturated zone, extreme conditions) • Data Management (interface with other codes, sort and query) • Data Analysis tools (define zones of contamination, calculate volume of contaminant, etc.) • Data Visualization tools ( surface structures, hydrologic structure, and subsurface structures,
contaminant) • Other criteria (ease of use, usage, state of development, cost, independent testing and general
comments). Each software package was rated for the above criteria. The detailed criteria used to rate each of the above areas is provided in the Glossary in Appendix A. In general, software that could handle a wide range of problems was rated higher than those that could not. The information provided was obtained from vendor supplied literature, review of related web sites and, in some cases, telephone interviews with code developers. Telephone interviews were found to provide both the most and the best information about the different packages. Vendor literature was often not detailed enough to make a clear evaluation of all aspects found in the table. . The following symbols are used for all ratings:
Highest level of model robustness Intermediate level of model robustness Lowest-level of model robustness
I Insufficient information to make an evaluation. N/A The software is not applicable to that field.
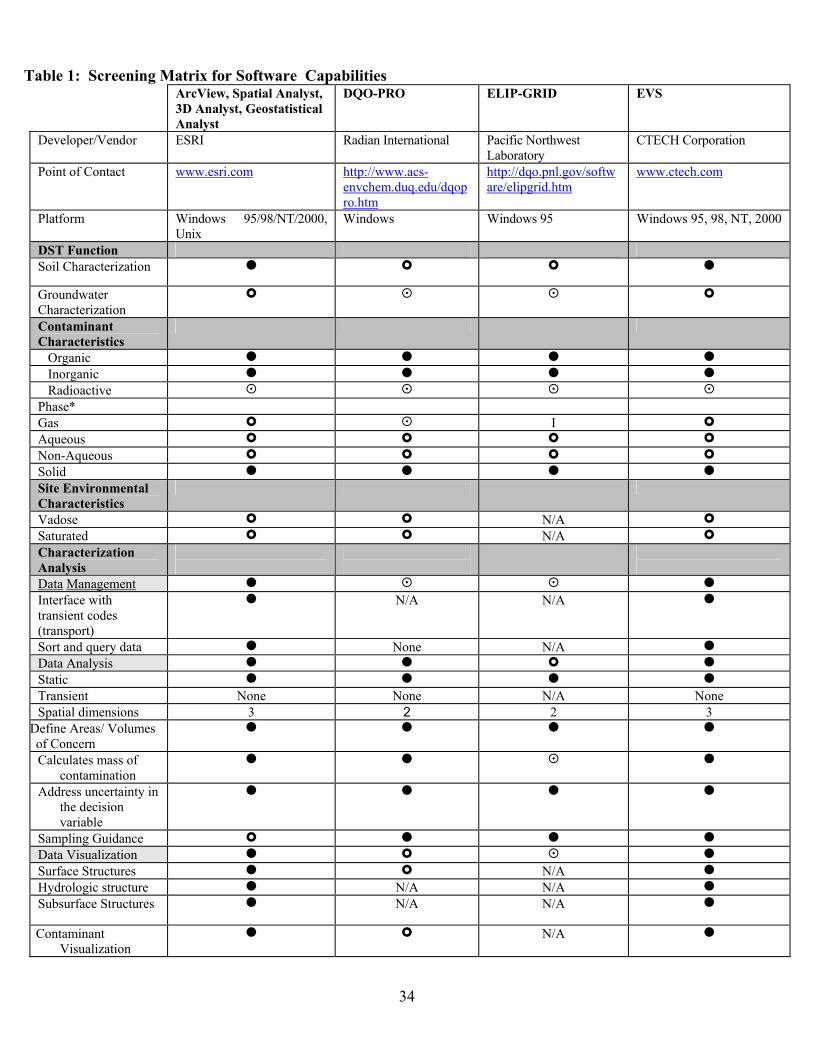
34
Table 1: Screening Matrix for Software Capabilities
ArcView, Spatial Analyst, 3D Analyst, Geostatistical Analyst
DQO-PRO ELIP-GRID EVS
Developer/Vendor ESRI Radian International Pacific Northwest Laboratory
CTECH Corporation
Point of Contact
www.esri.com http://www.acs-envchem.duq.edu/dqopro.htm
http://dqo.pnl.gov/software/elipgrid.htm
www.ctech.com
Platform Windows 95/98/NT/2000, Unix
Windows Windows 95 Windows 95, 98, NT, 2000
DST Function Soil Characterization
Groundwater Characterization
Contaminant Characteristics
Organic Inorganic Radioactive Phase* Gas I Aqueous Non-Aqueous Solid Site Environmental Characteristics
Vadose N/A Saturated N/A Characterization Analysis
Data Management Interface with transient codes (transport)
N/A N/A
Sort and query data None N/A Data Analysis Static Transient None None N/A None Spatial dimensions 3 2 2 3
Define Areas/ Volumes of Concern
Calculates mass of contamination
Address uncertainty in the decision variable
Sampling Guidance Data Visualization Surface Structures N/A Hydrologic structure N/A N/A Subsurface Structures N/A N/A
Contaminant Visualization
N/A

35
ArcView, Spatial Analyst, 3D Analyst, Geostatistical Analyst
DQO-PRO
ELIP-GRID
EVS
Other Criteria Ease of Use ArcView is the most widely used
GIS system in the U.S. It has extensive data base management and visualization tools. Simple tasks can be mastered within a few days. More advanced tasks require substantial training and regular use of the software. Training is available.
Training documentation available on the web. Relatively simple program to use based on ELIPG. Use improved if analyst has a background in statistics.
The program is easy to use provided the user is familiar with the statistical concepts used in the code.
EVS has extreme flexibility in providing visualization of environmental data. Simple tasks can be mastered within a few days. More advanced tasks require substantial training and regular use of the software.
Usage Widely used to display environmental data in complex settings.
Used at several DOE sites Limited usage Widely used to display environmental data in complex settings.
Stage of Development
Mature product that has been on the market for several years. Continually being updated and improved. Enhanced versions released periodically.
Development completed in the mid 1990’s.
Fully developed. Development stopped in the mid 1990’s.
Mature product that has been on the market for several years. Continually being updated and improved. Enhanced versions released periodically.
Cost ArcView $1500 Spatial Analyst, 3D Analyst, Geostatistical Analyst, $2500 each for a single user.
Software is free. Free Several versions of the software are available. The version with the smallest functionality costs $3,000, the best version costs $25,000.
Independent Testing
EPA ETV (ArcView, Spatial Analyst, and 3D Analyst)
EPA ETV
Comments Provides a framework for making consistent, technically-defensible and traceable decisions on location and extent of contamination. Excellent visualization and data management capabilities.
Provides a framework for implementing the DQO process in designing sample grids.
Provides a framework for making consistent, technically-defensible and traceable decisions for sampling to define hot spots. Limited visualization and data management capabilities.
State-of-the-art visualization capabilities. Compatible with a wide range of files and good data management tools. Geostatistical modules permit analysis of the extent of contamination as a function of the degree of confidence in the predicted results. Can be used to guide sampling to reduce uncertainty.

36
FIELDS GMS SADA VSP
Developer/Vendor EPA – Region 5 University of Utah/DOD University of Tennessee
Pacific Northwest Laboratory
Point of Contact
http://www.epa.gov/region5fields/
Marketed through several software vendors. For example, Boss International and Scientific Software Group
http://www.tiem.utk.edu/~sada/
http://dqo.pnl.gov/VSP/Index.htm
Platform Windows/ Requires ArcView
Windows and/or Unix Windows 95/98/NT/2000
Windows 95/98/NT/2000
DSS Function Soil Characterization N/A
Groundwater Characterization
Contaminant Characteristics
Organic Inorganic Radioactive Phase* Gas I N/A I N/A Aqueous Non-Aqueous Solid N/A Site Environmental Characteristics
Vadose N/A Saturated N/A Data Management Interface with transient codes (transport)
N/A N/A
Sort and query data I N/A Data Analysis Static Transient None None N/A Spatial dimensions 3 3 3 2 Define
Areas/Volumes of Concern
Calculates mass of contamination
N/A
Address uncertainty in the decision variable
Sampling Guidance Data Visualization Surface Structures Hydrologic structure None Subsurface Structures None Contaminant
Visualization None

37
FIELDS GMS SADA VSP Other Criteria: Ease of Use FIELDS has a number of tools to
address sample design questions. FIELDS software is an add-on to ArcView. Therefore, visualization of environmental data is dependent on ArcView and its extensions (3D Analyst and Spatial Analyst). Sort and query operations work with many database structures. Simple tasks can be mastered within a few days. More advanced tasks require substantial training and regular use of the software.
Full 3-dimensional pre-and post processing for several water flow and contaminant transport codes. Requires user experienced in water flow, contaminant transport and geostatistics. Personalized training is available.
SADA has an intuitive graphical interface that allows the analyst to use all of its features. More advanced tasks require training
VSP is a Windows based progwith pull-down menus that peeasy access to all features. Thtool is easy to use after minimtraining.
Usage Over 50 applications to contamination problems.
Widely used for groundwater contamination problems.
Several examples of its use are provided on its web page.
Several examples of its use atDOE facilities are provided oweb page
Stage of Development
Mature product that has been on the market for several years. Continually being updated and improved. Enhanced versions released periodically.
Mature product that has been on the market for several years. Continually being updated and improved. Enhanced versions released periodically.
Mature product that has been available for several years. Continually being updated and improved. Enhanced versions released periodically.
Mature product.
Cost Free $1200 for the basic package. Up to several thousand depending on which package is needed.
Free Free
Independent Testing
EPA ETV

38
Comments Designed to address sample design, data exploration, mapping, risk assessment, and mapping. Can support analysis of volume contaminated above cleanup goal.
Excellent package for groundwater modeling. Ability to handle site and contaminant characterization but has seen limited use in this regard.
Provides a framework for making consistent, technically-defensible and traceable decisions. Several alternatives are provided for selecting sample location. SADA is a multi-purpose code that assists in sample design, cost/benefit analysis, human and ecological risk analysis, geospatial analysis, data exploration and visualization.
Provides visual framework fodefining sample plans. Focusaddressing where and what tosample. Includes approaches follow the MARSSIM sampliprotocols for soils and surface

39
6) Issues in the use of Decision Support Tools As part of the review, a number of issues pertaining the use of decision support tools were noted. This chapter discusses these issues. 6.1 DST Applications In the early to mid 1990’s as the power of computers increased and personal computers (PC) became widely used, and the need to address environmental contamination problems became more urgent, there was a flurry of activity to develop environmental decision support software tools for the PC. Since that time, the number of tools being supported and developed has substantially declined. However, the remaining tools are being actively used on a large number of projects. The exact usage is difficult to determine because of several factors including the need for privacy, lack of tracking usage once the software is transferred to the user, and the repeated application of a tool by a single user or company. The software reviewed in Chapter 5 are for the most part widely distributed and used. For example, ArcView is the most widely used GIS system in the world. It has been used to visualize and map contamination data for thousands of applications. While use of ArcView for decision support (determining contaminated volumes, sample guidance, etc) is less, it has and is being widely used in the field. C-Tech has sold over 400 copies of there EVS system. Purchasing EVS costs several thousand dollars, and therefore, companies have given thought to its purchase and it tends to be repeatedly used for environmental problems by these companies. One user has claimed over 100 applications of EVS. EVS has been successfully used in two court cases. In City of Newburgh, New York v. Central Hudson Gas & Electric Corporation, 95 Civ. 3863, geostatistical modeling with corresponding 3-D graphical animations was used to support the expert testimony for the plaintiff (the City of Newburgh, New York, the client) in a case arising from manufactured gas waste contamination. The software developed by C-Tech Development Corp. was used to visualize the site surface and subsurface conditions at a former manufactured gas plant (MGP) site in Newburgh, New York, adjacent to the Hudson River. In the second case, Kanavos, et al., Trustees v. Bayer Corp., et al., Middlesex (MA) Superior Court, No. 96-7232D, EVS was used to support expert testimony on site characterization. Freeware, such as SADA and VSP, are widely distributed over the internet as both have received over 1000 downloads. However, actual usage is far less than the number of downloads. Nevertheless, surveys from those that downloaded VSP, and training courses offered by SADA indicate that each has several hundred users. VSP is used to provide sample guidance prior to and during characterization (iterative sampling). SADA is used to provide sample guidance and perform human and ecological risk assessment. The FIELDS program is also freeware that runs in conjunction with ArcView. FIELDS has a substantial user group and they regularly conduct conferences to discuss applications of the technology and to provide training. These conferences also include presentations and training on the use of SADA

40
6.2 Defining the Role of Modeling There is often a misperception of what a model can and can not do. It is critical to get all stakeholders to understand and agree upon the objectives of using the model. A model can not make a decision. It can only provide information to support a decision. Many believe that if the predictions arise from a sophisticated computer code which incorporates all of the fundamental physics as it is currently understood, the answer must be correct. In fact, at best, the model output is a scientifically defensible, although not necessarily accurate, prediction of the system behavior. This belief in modeling leads to the development and use of more sophisticated models that advance the state-of-the-science, but do not necessarily provide more defensible decisions. 6.3 Proper training and use of the models. Models are frequently misapplied which leads to poor decisions. A model’s predictions are only as good as the analyst and the data used by the model. Stated in the negative, this is known as garbage in/garbage out syndrome. Many of the models reviewed in this document use sophisticated statistical techniques to analyze the data. Analysts need to be aware of the assumptions and limitations in the models to effectively use the models. There is a trend to simplify the implementation of decision support tools models through development of pre and post-processors that facilitate data input and analyses and incorporation of data bases with default input parameters. While this leads to higher efficiency, it can lead to misuse and does not remove the need to understand the physical processes and model assumptions that effect the distribution of contaminants. 6.4 Training and Technical Support Training and technical support are often needed to effectively use decision support tools. All of the software products reviewed in this report provide some type of training. For the less sophisticated products, training can be as limited as providing user’s manuals and case studies. For the more involved products, such as EVS and ArcView, training courses that last several days are available for a fee. Training for FIELDS and SADA are provided in conjunction with a users conference. Commercial products often provide technical support to users that purchase an annual maintenance fee. This entitles the user to software upgrades and technical support for any problems that arise. FIELDS, which is operated through EPA Region 5, offers technical support on an ad hoc basis. Other freeware products, SADA and VSP, offer technical support through e-mail. Commercial companies will, for a fee, act as a consultant to facilitate the use of their products. Developers of freeware may also become involved in the application of their software as consultants. 6.5 Data Portability

41
Decision support tools often use large amounts of data as part of the analysis. Obtaining the data in the proper format can be an important problem. Often the software requires that specific fields are used for data (e.g., the first three fields are often Easting, Northing, and Elevation). For the most part, decision support tools work with databases or spreadsheets and can manipulate the data. However, often there is substantial data management (reformatting the data into appropriate columns, removing extraneous information, combining data from different spreadsheets, etc.) that is required prior to using a specific piece of software. Data portability issues need to be explored prior to selecting a software tool as it can be time consuming. Data portability is also an issue for incorporation of 2 and 3-dimensional images (site maps, surface structures, etc.) into visualizations that present the data. Moving images between software is typically more difficult than moving tables of data. 6.6 Selection of Appropriate DST In general, decision support tools are developed as modular platforms that integrate a wide variety of software applications into a single program. In principle, it would be possible to incorporate any model into the framework Increasing the functionality of the software program often required a larger knowledge base for the user and makes the program more difficult to use For site characterization problems, the user may select from several different decision support tools to analyze the problem. There exists a trade-off between the use of simple models that are easy to use and more complex models which can more accurately reflect field conditions. Conceptually, the use of more accurate models (which generally involves more detailed and complex models) can lead to a better resolution of the contamination problem with less uncertainty than the simple model. This can lead to lower remediation costs. On the other hand, simpler models are easier to use, defend, and gain acceptance from the regulators and stakeholders. The appropriate selection of a model is site and problem specific. 6.7 Current Directions in DST Development The breadth of capabilities found in existing site characterization decision support tools is generally adequate to handle most situations that occur. However, there is no one software tool that is superior in all instances. Each product tends to have a niche where it excels as compared to other models. The amount of software tools claiming to provide decision support has decreased markedly since the late 1990’s and the best tools seem to have emerged. The market for applying DST falls into the domain of consulting firms and there are a substantial number of these firms that use DST software. Future development of DST appears to be in adding enhancements to existing programs that are currently widely used. The cost of development of new DST is prohibitive as compared to the potential for out competing existing products. The types of enhancements that are being developed depend on the software and its state of development and range from improving existing capabilities (increasing the ease in using the tool, adding a better interpolation routine or visualization routine) to adding additional capability (e.g. tools for geostatistical analysis of the coverage provided by monitoring systems).

42
6.8 Gaps in DST Current decision support tools can address the technical issues associated with site characterization. However, often decisions are made based on having an adequate (but not necessarily optimal) technical solution with the key drivers of the decision process being other factors such as public acceptability, meeting programmatic objectives such as regulatory agreements, and minimizing costs. For this reason, decision support tools tend to focus on technical decisions and are limited in their influence of the overarching decisions that are made. Attempts to incorporate subjective goals, such as meeting programmatic goals, into decision support tools have been performed using multi-attribute analysis. Multi-attribute analysis has been used in a number of areas including business and financial management. In multi-attribute analysis, the attributes are decision parameters such as cost, protection of public health, meeting schedule, gaining public acceptability, etc. are given a quantitative value (for example, 0 being no chance of meeting the goal and 100 being certain that the goal will be met). The attributes are then weighted depending on the importance to the decision process with a large weight for things that are important and a small weight for attributes that are not as important. The resulting score can then be compared to the score for other assumptions, or scenarios. Proponents of incorporating the multi-attribute approach cite that it results in a clear well-documented decision process in which all of the decision parameters are treated simultaneously. Opponents of the approach state that it is difficult if not impossible to accurately and reliably quantify subjective processes such as the value of stakeholder acceptability.

43
7) References Densham, P.J., 1991. “Spatial Decision Support Systems.” In: Maguire, D.J., M.F. Goodchild, and D.W. Rhind, eds. Geographical Information Systems: Principles and Applications, vol.1, London: Langman, 403-412. Geoffrion, A.M., 1983. :”Can OR/MS Evolve Fast Enough?”, Interfaces 13: 10-25. Goodchild, M.F. and P.J. Densham (1990). Research Initiative Six. Spatial Decision Support Systems: Scientific Report for the Specialist Meeting. Technical Report 90-5. National Center for Geographic Information and Analysis. Keenan, P., 1997. “Using GIS as a DSS Generator,” Department of Management Information Systems, University College, Dublin, Ireland. Pollard. S., Brookes A., Twigger-Ross C., and Irwin J.,1999. “Fragmentation. Convergence and Harmonisation: Where Are We Going with Integrated Decision-Making?“ In: facing the New Millennium, proceedings 9th Annual SRA-Europe Conference, Rotterdam, October 10-13, 1999, SRA-Europe. Powers, D.J. 2001. “Supporting Decision Makers, An Expanded Framework,” Informing Science, June 2001. Sullivan, T.M., M. Gitten, and P.D. Moskowitz, 1997. “Evaluation of Selected Environmental Decision Support Software, “ BNL-64613, Brookhaven National Laboratory, 1997. USEPA, 1989. U.S. Environmental Protection Agency, 1989. “Risk Assessment Guidance for Superfund Volume I Human Health Evaluation Manual (Part A) Interim Final,” Office of Emergency and Remedial Response, Washington, D.C. EPA/540/1-89/002. USEPA, 1995. United States Environmental Protection Agency, 1995. “Guidance for Community Advisory Groups at Superfund Sites,” EPA-540-K-96-001, USEPA, 1996a. United States Environmental Protection Agency, 1996. Soil Screening Guidance: Technical Background Document. Office of Emergency and Remedial Response, Washington, D.C., EPA/540/R-95/128. (www.epa.gov/superfund/pubs.htm#h) USEPA, 1996 b. United States Environmental Protection Agency, 1996. Soil Screening User’s Guide. Office of Emergency and Remedial Response, Washington D.C., EPA/540/R-96/018. Second Edition. (www.epa.gov/superfund/pubs.htm#h) USEPA, 1997. United States Environmental Protection Agency, 1997. Ecological Risk Assessment Guidance for Superfund: Process for Designing and Conducting Ecological Risk Assessments. Interim Final. EPA 540-R97-006, OSWER 92857-25, PB 963211. (www.epa.gov/oerrpage/superfund/programs/risk/ecorisk/ecorisk.htm)

44
USEPA, 1998a. United States Environmental Protection Agency. (1998). NATO Committee on Challenges to Modern Society: NATO/CCMS Pilot Study Evaluation of Demonstrated and Emerging Technologies for the Treatment and Clean Up of Contaminated Land and Groundwater. Phase III 1998 Special Session Treatment Walls and Reactive Barriers. No 229. EPA Report: 542-R-98-003 USEPA, 1998b. United States Environmental Protection Agency, (1998). “Superfund Community Involvement,” EPA-540-R-98-027, OSWER 9205.5-12A, PB98-963235. (www.epa.gov/superfund/pubs.htm#h) USEPA, 1999. United States Environmental Protection Agency, (1999). NATO Committee on Challenges to Modern Society: NATO/CCMS Pilot Study Evaluation of Demonstrated and Emerging Technologies for the Treatment and Clean Up of Contaminated Land and Groundwater. Phase III 1999 Special Session Monitored Natural Attenuation. No 236. EPA Report: 542-R-99/008. USEPA, 2000. U.S. Environmental Protection Agency, “Ecological Soil Screening Level Guidance DRAFT, “ Office of Emergency and Remedial Response , Washington, DC July 10, 2000, www.epa.gov/superfund/programs/risk/ecorisk/ecossl.htm U.S. Environmental Protection Agency, 2000b. “Guidance for the Data Quality Objectives Process (QA/G-4)”, EPA/600/R-96/055, Office of Research and Development. USEPA, 2001, U.S. Environmental Protection Agency, “Data Quality Objectives Decision Error Feasibility Trials (DEFT) Software – USERS GUIDE,” EPA 240/B-01/007, http://www.epa.gov/quality/qs-docs/g4d-final.pdf.

45
Appendix A: DSS Glossary Major Sections Software Information Contacts for collecting more information Decision Support Software Function Soil Contamination Groundwater Contamination There are two major approaches to examining environmental data, static or transient. Static calculations analyze the data independent of time and provide a ‘snapshot’ of site conditions. For the most part, static calculations are not dependent on the contaminant or its properties. For example, a static model would use the measured values and spatially interpolate the data to define zones of contamination. Transient calculations take the data and try to predict future conditions (e.g. the contaminant will migrate to the nearest well in 5 years). For predictive models a number of special cases occur that require different mathematical models. The processes include: single phase water flow; two phase flow (DNAPL or LNAPL), gas phase flow (volatile organics), radioactive decay, biodegradation, and multiple species (in which radioactive and biodegradation decay products are simulated). These differences necessitate the distinction between soil and groundwater contamination. Contaminants List of major categories of contaminants.
Organic: VOC, semi-volatiles, PAH, etc. Inorganic: Non-radioactive metals. Radioactive: All Types of radioactive waste.
Contaminant phase Aqueous Non-Aqueous (Dense Non-Aqueous Phase Liquids, Light Non-Aqueous Phase
Liquids) Gas Solid
Site Environmental Characteristics Vadose Zone Saturated Zone Addressing the vadose zone requires substantially different models and data than required for the saturated zone. Characterization Analysis Data Management

46
The ability to query the database and extract only the appropriate information enhances the software’s utility. Environmental data sets are often extremely large and contain data that are not relevant to the analysis being performed. For example, a single sample may be analyzed for over 50 different contaminants. .
For static analysis codes, the ability to import data directly from groundwater flow and transport simulations permits analysis to examine changes over time.
. Data Analysis Data analysis for site characterization involves the determination of the nature and extent of
contamination. Important considerations in the analysis include: • The type of analysis - static (snapshot) or transient (predictive) • The spatial dimensions in the analysis (1,2, or 3) • The ability to define areas/volumes where contamination exists above a pre-
defined cleanup threshold. • The ability to define the mass/volume of contaminant within contamination zones • The ability to define uncertainties in the decision variable. For example, if the
decision variable is the volume of contaminated soil above a threshold. Software with geostatistical simulation capabilities can estimate the volume of soil exceeding the threshold with 50, 75, and 95% confidence that the site will be clean if the soil is removed. As one goes to higher confidence, more soil needs to be removed.
• The ability to assist in sample optimization. Software often contains algorithms to select sample locations that optimize a constraint. For example sample optimization can be based on minimizing the largest distance between two sample points, defining the boundaries of a contaminated zone, or reducing overall uncertainty in prediction of contamination zones. This type of software can also address data worth questions such as will collection of additional data reduce uncertainty in the decision.
Data Visualization The ability to visualize the data in a spatial frame of reference is often crucial to understanding
and being able to communicate the extent of contamination. Important visualization capabilities include:
• The ability to include surface structures such as roads, buildings, well locations, and water bodies as part of the visualization
• The ability to define hydrologic structures including aquifers and confining layers.
• The ability to represent subsurface structures such as buildings or piping that may be relevant to contaminant location (e.g. leaking pipes).
• The ability to post, map, and contour the data to define the extent of contamination.
These three steps form the framework of any decision support software. While many software programs will not have data management functionality, all will have analysis and visualization functions.

47
Other Criteria This category includes additional information that may be useful to the reader in deciding the technical skill required to operate the software and strengths and weaknesses of the software. The categories include: Ease of Use – Experience and training required to competently use the software Usage - Applications to environmental problems. State of Development - Under development, new product, continued development Independent testing/Peer Review - Cost - Comments – General description of the software’s capabilities and any special strengths or weaknesses not covered in other parts of the table. Evaluation metrics. DSS Function Site Characterization: Assess ability for DSS to assist with characterizing the nature and extent of contamination, hydrogeological properties, and distribution of waste. Characterization can be made by incorporating a wide range of parameters. These include contaminant analytical data, hydrogeological properties, land use, and waste disposal data.
M DSS incorporates a wide range of data from a large number of the parameters listed above and aids in developing a full characterization of a site.
DSS incorporates a limited combination of data from a reduced number of the parameters listed above and aids in developing a full characterization of the site as it relates to these limited parameters.
DSS incorporates information relating to only one of the parameter groups listed above (for example, soil borings to develop a geological profile).
Groundwater Characterization: Assess ability for DSS to model flow and transport associated with ground water contamination plume.
M DSS can model a number of the contaminant fate and transport properties under a variety of user defined conditions. DSS can account for processes that will vary chemical concentrations such as adsorption, hydrolysis, metabolic transformations, and reduction. DSS can simulate contaminant behavior under user varied conditions. DSS may use advanced geostatistical simulations to define the zone of contamination.
Same as above, with a limited ability to account for processes that will vary chemical concentrations and to simulate plume behavior under user varied conditions. DSS uses spatial extrapolation to define the contamination and does not account
for the physical and chemical processes that can lead to variations in chemical concentrations in soil or ground water.

48
Contaminant Characteristics: Assess the ability for software to provide decision support for each of the listed classification of contaminants. The contaminant categories are: Organic: VOC, semi-volatiles, PAH, etc. Inorganic: Non-radioactive metals. Radioactive: All Types of radioactive waste excluding tritium. If a DSS can address tritium, it
is noted in the comments section of the table. Regulations require the management of mixtures of hazardous and radioactive wastes separately from radioactive or hazardous. However, this does not impact on the capability of the software to address these wastes and therefore, mixed waste is not considered separately here. Other types of contaminants are generally subcategories, for example, transuranics wastes are a subset of radioactive wastes. Special wastes such as explosives are beyond the scope of this review. The evaluation criteria are:
M DSS specifically designed to address this classification of contaminants and can handle a wide range of contaminant types within this class. For example, specific volatile and semi-volatile compounds within the organic classification.
DSS specifically designed to address this classification of contaminants and can handle only a portion of the range of contaminants within this classification. For example, radioactive decay is not explicitly treated.
DSS can handle this classification of contaminants but does not take into consideration how various sub-classifications within this group may behave differently.
Phase: Ability for the software to address each phase that a contaminant may exhibit. The phase will impact the contaminant=s transport through media; therefore, a DSS must be selected that can model the appropriate transport mechanism. The phases considered are: Gas: Contaminant exists as vapor and/or gas that can move through the media. Liquid: Contaminant is present in an aqueous phase (dissolved in water). Non-Aqueous Phase: The separate phase portion of a contaminant that exists after its dissolved concentration in water reaches the saturation limit for that contaminant, commonly referred to as a non-aqueous phase liquid (NAPL). Often, NAPLs are grouped based on specific gravity. NAPLs with a specific gravity greater than water are known as Dense NAPLs (DNAPL). Those with a specific gravity less than water are known as Light NAPLs (LNAPL). DSS that can address all types of NAPLs are rated the highest. Solid: Contaminant exists on the solid phase that is immobile. The evaluation criteria are:
M DSS designed to model this phase and utilize site and chemical specific parameters to tailor the analysis to site conditions. The model can address a variety of contaminant stages within one phase (e.g. - DNAPL and LNAPL). The model can address the transfer of the contaminant from one phase to another.

49
DSS designed to model this phase and utilize site and chemical specific parameters to tailor the analysis to site conditions. The model does not address transfer between phases.
DSS designed to model this phase based on generalized site and chemical parameters.
Site Environmental Characteristics: Ability of DSS to address a variety of unique site characteristics. Vadose Zone: The zone above the water table where the pore space is filled with a mixture of
gas and liquid. M DSS can simulate vadose zone properties relevant to flow and transport, and may
use site and chemical specific parameters to tailor the analysis to site conditions. DSS can address transfer of contaminant from the vadose zone to the saturated zone.
DSS uses site-specific data to determine zones of contamination but does not address contaminant transport. .
DSS can address vadose zone using generalized parameters. Saturated: The zone beneath the water table where all available pore space is filled with liquid.
M DSS can simulate saturated zone properties relevant to flow and transport, and may use site and chemical specific parameters to tailor the analysis to site conditions.
DSS uses site-specific data to determine zones of contamination but does not address contaminant transport.
DSS can addresses vadose zone using generalized parameters. Interface With Flow Codes: Assess the ease associated with importing predicted concentrations, hydraulic head and other data from flow and transport codes.
M Software can directly import data without processing. Software can import data with minimal processing. Software can import data with substantial processing.
Data Visualization: Assess the overall presentation, flexibility, and options associated with the DSS data visualization.
M Data are presented in three dimensions and full color with labeling and numerous options for viewing. This includes viewing from a variety of perspectives and ability to readily select data sets shown.
Data are presented in three dimensions with limited color and labeling or two dimensions with full color. The ability to view from different perspectives and the number of viewing options is more limited than the above category.

50
Data are presented in two dimensions with limited color and labeling. Limited options for viewing.
Sort and Query Data: Ability of the software to access data files and select a subset of the data (e.g. specific contaminant, or data from the year 2001, etc.).
M Software can access the entire database and select and analyze the subset of selected data.
Software can access limited sections of the database Software can not access database to select data for analysis.
Data Analysis: Static: Software performs static analysis on the data. (Yes/No) Transient: Software performs transient analysis of the data. (Yes/No) Spatial Dimensions: 1, 2, or 3 dimensional analysis. Define Areas/Volumes of Concern: Ability of the software to calculate and visualize regions having contamination above a specified threshold.
M DSS can define area/volume of concern DSS provides a statistical assessment of the confidence in the estimate.
DSS can define area/volume of concern but does not provide a statistical assessment of the confidence in the estimate.
DSS can not define area/volume of concern. Define mass of contaminant: Ability of the software to calculate the mass of contaminant above specified threshold levels.
M DSS can calculate the mass of contaminant. DSS provides a statistical assessment of the confidence in the estimate.
DSS can calculate the mass of contaminant but does not provide a statistical assessment of the confidence in the estimate.
DSS can not calculate the mass of the contaminant.
Address uncertainty in the decision variable: Ability of the software to calculate the statistical confidence in the estimate of the decision variable.
M DSS provides a statistical assessment of the confidence in the estimate. DSS can not provide a statistical assessment of the confidence in the estimate.
Sampling Guidance: Ability of the DSS to assist in the selection of field sampling locations and parameters.

51
M DSS can generate sampling locations and suggest sampling parameters. DSS provides a statistical assessment of the anticipated results from this location. The DSS suggests where to sample, which chemicals to sample for, and predicts what will be found at this location.
DSS can generate sampling locations or suggest sampling parameters. DSS provides a limited assessment of the anticipated results from this
location. For example, spatial extrapolation may be used to estimate sampling locations.
Data Visualization Data visualization consists of four categories, surface structures, hydrologic structures, subsurface structures, and contaminant visualization. Surface Structures: Assess ability of the DSS to incorporate surface structures into the model and show the structure accurately on the screen or hard copy print out.
M DSS takes into consideration surface structures (caps, buildings, etc.). DSS
shows structures on visual displays accurately and clearly and is capable of providing a hard copy print out.
DSS takes into consideration surface structures in a limited manner. DSS shows structures on visual displays accurately and clearly and is capable of providing a hard copy print out.
DSS can show structures and has more limited viewing or output. For example, the DSS can not produce hard copy output.
Hydrologic Structure: Same as Surface Structures, except as it relates to variations in hydrologic features. Subsurface Structures: Same as Surface Structures, except as it relates to the presence of buried objects and subsurface geologic features. Contaminant Visualization: Assess the overall presentation, flexibility, and options associated with the plume visualization of the DSS.
M The contamination is presented in three dimensions and full color with labeling and numerous options for viewing. This includes viewing from a variety of perspectives and ability to select different output format and contents readily (e.g. switch from hydraulic head data to contamination data).
The contamination is presented in three dimensions with limited color and labeling or two dimensions with full color. Viewing data from different perspectives is cumbersome or not possible. The contamination is presented in two dimensions with limited color and labeling.
There are limited options for viewing.

53
Appendix B: Suggested Environmental Decision Support Taxonomy In addition to the taxonomy selected, several other approaches have been suggested in the literature. Pollard et al (Pollard, 1999) defined decision support tools by their analysis technique and identified the following commonly used approaches. • Life cycle analysis (LCA); • Environmental risk assessment (ERA); • Environmental impact assessment (EIA); • Cost benefit analyses (CBA); • Multi-criteria analysis (MCA) and multi-attribute analysis (MAT) • Environmental audit; and • “Sustainability appraisal”. In contrast to the approach developed by Sullivan, this approach focuses on the technique used and not the steps in a remediation process. As such, it is more general and not as focused on environmental problems. A 1999 workshop on the use of Artificial Intelligence in Environmental Decision Making listed the following categories for decision support software tools: • Design and modeling • Hazard identification • Impact assessment • Intervention and decision making • Risk evaluation • Prediction
It can be seen that this categorization is also more general than the one proposed in (Sullivan, 1997), and the categories are not necessarily aligned with a particular remediation decision process. However there is substantial overlap between the two. The following table makes the linkage explicit. Table 1: Linkage between the Taxonomy of the Artificial Intelligence Workshop and Sullivan, 1997. Artificial Intelligence Workshop Category
Matching Category from Sullivan, 1997
Design and Modeling Remedy Selection and Design Optimization
Hazard Identification Site and Contaminant Characterization
Impact Assessment Human Health and Ecological Risk Evaluation
Intervention and Decision Making
Remedy Selection, Cost/Benefit Analysis, Risk Assessment
Risk Evaluation Human Health and Ecological Risk Evaluation

54
Prediction Risk Assessment CLARINET, the Contaminated Land Rehabilitation Network for Environmental Technologies is a European group designed to address issues in contaminated land management. Within CLARINET work is organized across a series of Working Groups, one of which focused on decision support issues. The CLARINET Working Group has conducted an extensive survey of CLARINET countries to review both key factors for decision support and risk management, and to identify decision support approaches, which it is cataloguing in a Microsoft Access database.. They use the following four categories to describe Decision Support Tools (Bardos, 2001): • Their application in contaminated Land Management (remedial action, sustainable
development, comparison, risk management, prioritization, etc.) • Their use in decision making (Comparison between alternatives, remedy selection, strategy
development); • The techniques they employ; (Life Cycle Analysis, Multi-Criteria Analysis, Cost-Benefit
Analysis, Risk Assessment, etc) and • The nature of the product. (Software, Written Guidance, Flow Chart Procedure, etc).