exploiting qualitative information for decision support...
TRANSCRIPT

Exploiting qualitative information for decision support in scenario analysis Danilo Gambelli* - Daniela Vairo* - Raffaele Zanoli*
D.I.I.G.A. - Polytechnic University of Marche - Via Brecce Bianche, 60131 Ancona, Italy; Corresponding author: D. Gambelli, [email protected]
ABSTRACT. The development of scenario analysis (SA) to assist decision makers and stakeholders has been growing
over the last few years through mainly exploiting qualitative information provided by experts. In this study, we present
SA based on the use of qualitative data for strategy planning. We discuss the potential of SA as a decision-support tool,
and provide a structured approach for the interpretation of SA data, and an empirical validation of expert evaluations
that can help to measure the consistency of the analysis. An application to a specific case study is provided, with
reference to the European organic farming business.
KEYWORDS: Scenario analysis, qualitative data, cognitive evaluation, expert assessment
RESUME: Resume ici…
MOTS-CLES: DSS, etc...
1. Introduction
Over the last couple of decades, scenario analysis (SA) has become a broadly used tool to provide support and advice to policy makers (Meyer, 2007). In decision-making processes, scenarios can help the decision makers to anticipate possible or potential strategies according to different plausible scenarios. This is of particular relevance in fields where no structured data are readily available or where it is difficult to adapt the data to the aims of the stakeholder analysis.
Here, we present results and discuss the implications of a SA used to investigate the possible pathways of scenario evolution of the organic food market in Europe, to 2015. The aim of this study is to use SA to provide a range of possible policy options that can be used as decisional support to policy makers and stakeholders who are dealing with the uncertainty of the organic food business. This study was conducted within the Quality Low Input Food (QLIF) project1. We used a qualitative approach to SA that relies on subjective assessments and judgments of a selected group of experts. Qualitative information was used basically for two reasons: first, for the use of qualitative data as a substitute for a lack of adequate or feasible statistics concerning the issues to be analysed; and secondly, for the use of methodological approaches that require qualitative data that exploit relational, intuitive and subjective information.
Qualitative research and methods have now become an established way to approach complex systems (see Mason, 2002; Denzin and Lincoln, 2006; among others), particularly in the social and economic fields. These approaches are mainly based on the elicitation of information from a set of people, or a panel of experts or stakeholders, and they are therefore characterised by a high level of subjectivity. This represents the primary limitation of such qualitative approaches, particularly regarding the possibility of validation of the results, and the ability to provide structured results from the analysis. Here, we are not going to discuss the primacy of quantitative data, rather we will analyse whether and how a bridge can be built between qualitative and quantitative approaches, particularly regarding analysis and research in the field of decision systems. In this study, we propose a way to summarise the results from the SA in a coded and mathematically structured approach, and to test how confident we can be about the consistency and ‘reliability’ of expert assessments used for SA. Indeed, the ‘quality’ and performance of SA as a basis for decision support become critically dependent on the quality and performance of the assessments expressed throughout the entire scenario-building process. The structure of our study is as follows. The next section, section 2, provides a short introduction of scenario modelling and the approaches that focus on SA as a tool for
1 This study was carried out with financial support from the Commission of the European Community under the Sixth Framework Programme for the project FP6-FOOD-CT-506358: “Quality Low Input Food (QLIF)”. The views expressed do not necessarily reflect the views of the European Commission and do not in any way anticipate future policy of the Commission in this area.

supporting decision making; section 3 describes in detail the methodology followed in this study; section 4 presents and discusses the results of the scenario through a description of the main findings of each scenario, while analysing the relevance and the role of the different variables within each scenario and validating the consistency of the qualitative assessment used for the SA; finally, our conclusions summarise the main issues arising from this study.
2. Scenario analysis as tool for strategic planning
2.1. Scenario analysis: a brief introduction
A scenario describes (textually or graphically) a set of hypothetical sequences of events that might reasonably take place (Kahn and Wiener 1968). Scenarios can be considered as hypothetical images of the future that describe the functioning of a system under different conditions with a certain degree of uncertainty (for review, see Bunn and Salo, 1993). In this sense, SA can be seen as complementary to traditional forecasting and simulation techniques, so as to provide a composite picture of future developments for use as a background for policy making and/or strategic planning. Scenarios are not forecasts or predictions; they provide a dynamic view of the future by exploring various trajectories of change that lead to a broadening range of plausible alternative futures (IPCC, 2008; Mahmoud et al., 2009).
SA was originally developed for military strategy purposes (Kahn and Wiener, 1968). Starting from the early 1970s, SA has been variously used as a forecasting tool by some multinational companies, mainly for investment strategies and long-term planning. Schnaars (1987) argued that most of the scenario techniques available at the time of his publication were still based on those developed by the Rand Corporation during the 1950s. At that time, Herman Kahn and Olaf Helmer were employed by the Rand Corporation as analysts for the development of military defence projects. Kahn’s approach was mainly qualitative, as it emphasised the subjective aspects in particular, while Helmer’s approach was a more methodological characterisation.
In 1971, Chambers et al. referred to scenarios as “visionary forecasts”. The scenario approach was considered quite inexpensive but also unsatisfactory. More than a decade later, Georgoff and Murdick (1986) showed an appreciation of SA particularly for its little time-series data requirement, and low mathematical formalisation, among other reasons.
Millett (1988) applied SA to company strategy planning, basically so as to forecast the economic environment within which a company would need to operate. This was thus designed to establish the long-term goals of a company, and to evaluate the

different strategic options. Scenarios can be considered as benchmarks for alternative strategies.
Following the Bunn and Salo argument (1993), it is possible to summarise the aims of scenarios in three basic categories that reflect the different approaches to SA: forecasting and decision making; benchmarking; and institutional. In this sense, Van der Heijden (1996) argued that while forecasts are decision-making tools, scenarios aim to develop strategies and policies.
There is not a single, well-defined methodological approach to SA; instead, there is a spectrum of techniques that differ according to the type of information and data used, the methods used to develop the scenarios, and the ways of providing the results (for review, see, among others, Bunn and Salo, 1993; Alcamo, 2001; Börjeson at al., 2006; Mahmoud et al., 2009; for a general description of SA for business purposes, see Schwartz, 1992). Van Notten et al. (2003) in particular provided an extensive scenario classification, and discussed how in many cases the categorisation of scenarios was not always either exhaustive or consistent among authors. Therefore, here we provide a simple scenario classification based mainly on aim, type of data, and methods.
A first subdivision of scenarios can be made between explorative or forecasting scenarios, and anticipatory or back-casting scenarios (i.e., given causes, what are the effects, vs. given effects, what are the causes). Explorative scenarios consider alternative developments into the future, starting from the current situation (the majority of recent scenario studies fall into this category), while anticipatory scenarios start from a desired future situation and explore different strategies to reach this situation.
Secondly, scenario methods can be classified according to the nature of the source of information used for the analysis. We can distinguish between participatory/ expert-based scenarios, and desk-analysis scenarios. Participatory scenarios refer to approaches where experts and stakeholders (e.g., scientists, decision makers, business executives) have active roles in the scenario generation system (e.g., data elicitation, narrative development). In this specific case, the participant selection assumes a crucial role, with different approaches to this selection for multi-stakeholder workshops discussed in the literature (LilJa and Ashby, 1999; Reed, 2008). Desk analysis scenarios exploit information based on the existing literature and/or statistical data, which is then elaborated into the scenario form without a collaborative process.
Finally, SA can be developed according to different methodological approaches, from less formalised approaches, to more structured methods (for a review, see Zanoli et al., 2000). Table 1 summarises these main approaches and their respective characteristics.

Table 1: Methodological approaches for SA Methodological approach
Strength Weakness
Intuitive logic • Flexibility • Simplicity • Intuitive and creative
perspective • Integrate traditional
forecasting techniques
• High subjectivity • Low methodological
formalisation
Trend impact analysis
• Combination of traditional and qualitative forecasting techniques
• Focus on exogenous shocks/ impact factors
• Low formalisation of exogenous shocks/ impacts identification
• Requires time-series data for trend extrapolation
• Does not take into consideration events interactions
Complex interaction systems
• List of relevant variables
• Variable interactions • Measurement of links
between variables
• Complex • Time consuming • Theoretical and practical
problems for managing expert assessments in a formalised way
Building a plausible scenario is a complex task that requires at least three steps, each of which represents a basic element of the scenario: analysis of the present situation; definition of the images of the future; and definition of the ‘path’ that links the present and future situations. These crucial steps represent a logical approach to scenario construction, and they should be preceded by a preliminary stage, where the general framework for the analysis is defined, and a final stage, relating to a narrative description of the scenarios and an evaluation of their plausibility (Zanoli et al., 2000).
As a general rule, scenarios cannot be evaluated on the basis of their predictive accuracy, as the probability of a single scenario happening completely is close to zero (Van der Heijden, 1996). As a general criterion, credibility/ plausibility can be used to evaluate scenarios, which can be considered to have four major determinants that are strictly interlinked (Helmer, 1981; Bunn and Salo, 1993): comprehensiveness (the model should be able to take into account all of the relevant variables and trends); clarity (the scenario should be clearly described); coherence (the scenario should be developed coherently according to the scenario approach used); and consistency (the scenario should be consistent in the judgments and expertise provided).
The more structured approaches to SA usually provide a basis for formalisation and validation of the SA results. For example, in their pioneer study on cross-impact scenarios, De Kluyveer and Moskowitz (1984) proposed an algorithm to assure that
the expert-assessed probabilities satisfied the probability theory axioms. Zanoli et al. (2000) use a fuzzy-logic approach, converting linguistically defined variables into numerical values to build up a rule-based system SA.
2.2. Scenario analysis as a tool for supporting decision making
Decision support systems (DSS) are a specific class of computerised information system that supports organisational decision-making activities. A properly designed DSS is an interactive software-based system that is intended to help decision makers compile useful information from raw data, documents, personal knowledge, and/or other models, and to identify and solve problems and make decisions (Power, 2007). A lot of the research in decision making has been focused on the difficulty of defining a rational and structured model for an ever-changing process (for a literature review and debate on decision-making models, see, among others, Carton and Adam, 2005).
The basic structure and behaviour of SA is analogous to DSS models, as they can be defined as complex combinations of data, models and solvers (Ahmed and Sundaram, 2008). Nevertheless, to date, the traditional DSS literature has underestimated the importance of scenario support. Schwartz (1992) emphasised that a central outcome of scenario planning is the improvement of the stakeholder understanding and abilities in the decision-making process. If decision making is improved in the scenario-planning system, then scenarios can be used to stimulate learning, and to make managers aware of environmental uncertainties, and mental models can be transformed and decisions can be moved forwards several hypothetical situations (Chermack, 2005). SA is not specifically aimed at obtaining forecasts, but rather promotes the creation of alternative images/ perspectives of the future development of the World. As a consequence, SA highlights crucial uncertainties that have an impact on the strategic decisions managers have to make (Postma and Liebl, 2005).
SA differs from other forecasting approaches in two important ways. First, it usually provides a more qualitative and contextual description of how the present will evolve into the future, through using qualitative models, rather than being an approach that seeks numerical precision. Secondly, SA is usually designed to identify a set of possible futures, where the occurrence of each is plausible, although not assured and not necessarily probable (Schnaars, 1987). In this way, SA can be seen as a process of understanding, analysing and describing the behaviour of complex systems consistently and, as far as possible, completely.
In this context, scenarios are tools for strategic analysis, and they summarise different sources of information concerning the future, with special attention to the actors, aims, mechanisms, and causes and effects of any change.
The literature generally still lacks a correct approach for planning, developing, organising and evaluating scenarios using DSS models. In addition, current scenario planning and SA systems do not support the modelling and evaluating of multiple scenarios simultaneously. The scenarios are still used for strategic decisions, rather than for supporting tactical-level decision making.
However, some significant contributions in this direction can be considered. To face these problems, Ahmed and Sundaram (2008) introduced life-cycle-approach-based scenario management guidelines describing the whole process, starting from the idea generation to the final use for decision support. Their studies included “scenario as a decision-support component of the DSS and defines scenario-driven DSS as an interactive computer-based system, which integrates diverse data, models and solvers to explore decision scenarios for supporting the decision makers in solving problems” (Ahmed and Sundaram, 2008; page 46). Pallottino et al. (2005) presented a scenario-modelling framework to solve water-system optimisation problems, as an alternative to the traditional stochastic approach. Based on SA approaches for water resources proposed in these former studies, the water resource SA tool was proposed to evolve into a DSS that allows the achieving of a ‘robust’ decision policy that should minimise the risk of incorrect decisions: “in the proposed decision support system, the availability of an efficient computer graphical interface helps end-users to evaluate with ease the best choice and to reach a robust solution” (Pallottino et al., 2005, page 1032). In the Global Environmental Change and Food Systems (GECAFS) project, one of the research objectives is the development of DSS to assist decision makers in the science-policy-practice dialogue. In constructing DSS methodologies and tools, aspects of SA and DSS modelling have been combined. Finally, Cinar and Kayakutlu (2010) provided an overview of creating scenarios for energy policies using Bayesian network (BN) models. BN models are a useful tool for the analysis of the complex structures that allow observation of the current structure and basic consequences of any strategic change. Creating scenarios using BN models provides a decision model that can support researchers in their forecasting (Cinar and Kayakutlu, 2010).
3. Validating results of a qualitative scenario: an application to the organic food business
The aim of the SA we developed was to support stakeholders of the organic farming business in their planning of strategies to anticipate the potential evolution of the organic sector. This SA was developed within the EU QLIF ‘Quality Low Input Food’ funded project. The aim was to involve business people, researchers and policy makers in the evaluation of specific strategies for the organic business.
This SA was performed using a deductive–qualitative method (Van der Heijden, 1996) that was based on experts and a participatory approach. Twelve experts from the organic business and the academic sector were selected as part of the scenario team that formed the ‘knowledge-generation engine’ of the entire process, which

took place over two full days of a workshop in mid-2008, both in plenary and parallel sessions. The focus of the SA was the potential development of the organic food sector in EU 25, by the year 2015. Experts were asked to provide a list of their relevant variables: 129 variables were originally defined as relevant for the organic food sector. These variables were then clustered according to the themes involved, and the clusters were then classified in terms of their relevance/ uncertainty.
The two most uncertain and relevant variable clusters formed the basis for the development of four contrasting scenarios through exploiting the evaluation and intuitions of the experts relating to the plausible potential development of the organic food market. To avoid bias due to the type of inferential approach used, we followed the suggestions of Jungermann (1985): we used a forward-looking approach to generate the four scenarios, and then a backward-inference approach to build the causal representation of the alternative futures. The experts were encouraged to develop scenarios in terms of complex systems, with high interactions among the variables. Four scenarios where defined. The outcome of each scenario is represented graphically in the form of a directed graph, with the connecting of the variables with ‘arrows’ which are directed according to the causal interconnections of the variables (as an example, see Figure 1). Four directed graphs were created, one corresponding to each scenario, with from 14 to 25 variables. Linguistic storylines were developed around the directed graphs to describe the scenario representation also in a narrative format.
Figure 1. The structure of a simple directed graph
At this stage we introduced an innovative approach to classify the results in a systemic and structured way, and to check for the consistency of the qualitative assessment of the experts used for the SA.
V3V3
V2V2
V5V5
V7V7V6V6
V1V1
V4V4V3V3
V2V2
V5V5
V7V7V6V6
V1V1
V4V4

For the first aspect, adjacency matrices that measured the interactions among the driving forces were derived for each scenario, which allowed network-analysis tools to be used to analyse the relevance and roles of the different variables within each scenario. For reasons of synthesis, we will only discuss here how to implement basic degree centrality measures, although other centrality measures can be used to enrich the interpretation of the variable importance for each scenario. For details concerning network-centrality measures, see Wassermann and Faust (1994). More specifically, normalised Freeman IN and OUT Degree Centrality (IDC and ODC, respectively) was used to measure the role of each variable in terms of its relevance for ‘information’ propagation within each scenario, according to the information originating from (OUT) and received by (IN) for each variable. Normalisation of degree-centrality scores allowed for a comparison among the different scenarios. The higher the ODC, the higher the active role of the variable within the scenario; the higher the IDC, the higher the characterisation of the scenario due to the variable.
Regarding the second aspect, as indicated by Bunn and Salo (1993), scenario consistency refers mainly to the validity cause–effect relationships among the variables, and becomes crucial in the process of narratives creation, when the role of expert knowledge and intuition is particularly exploited. To assess the scenario consistency according to Epstein et al. (1996), we used a Rational-Experiential Inventory (REI) scale to provide independent measures of the analytical rational and intuitive–experiential thinking styles. The scale was divided into two subscales: (i) the 5-item Need for Cognition (NFC) scale, which measures the degree of engagement in and enjoyment of cognitive activities, and hence was aimed at measuring the rational approach of the experts to the scenario process; and (ii) the 5-item Faith in Intuition (FI) scale, which measures the confidence in the opinions and initial impressions as a basis for decisions and actions, and hence this was aimed at assessing the reliance of the experts on an experiential/ emotional thinking approach during the workshop. Once the scenario process had been completed, the scenario team filled in a questionnaire concerning the 10-item REI scale, scored as 5-point Likert scales (1, completely false; 5, completely true). Since heuristic responses have been shown to correlate with a high score on the NFC scale and a low score on the FI scale, we wanted to indirectly test for the consistency or coherence of the scenarios, on the assumption that rational and less experienced experts will produce better quality (i.e. more logical) inferences.
4. Results and discussion: scenario description and their cognitive evaluation of the scenario process
The result of the scenario development process was the definition of four contrasting scenarios, referred to as follows: 1) ‘stable expansion’; 2) ‘policy-driven growth’; 3) ‘agricultural industrialisation’; and 4) ‘techno sustainability’. The stable expansion scenario basically yielded a positive framework for organic farming, and a lasting
stable (although small) positive trend in terms of the economic situation, despite signs of the upcoming global crisis at that time. The policy-driven growth scenario depicted the reaction of the organic sector under a general global economic crisis and a worsening of the socio-economic situation. Even under this gloomy scenario, the organic food market appeared to have a chance for development. The agricultural industrialisation scenario involved a general worsening in the global socio-economic conditions, combined with a reduction in the competitiveness of organic farming with respect to conventional farming. Organic products would end up being produced and processed in exclusive and secluded organic districts. The techno-sustainability scenario involved a general improvement in the global socio-economic conditions, combined with a reduction in the relative competitiveness of organic farming. Despite the positive economic environment, organic farming loses competitiveness in favour of new, ‘high-tech’ farming systems.
The main findings of our study for the future of the organic market show that the general economic conditions and policies (i.e. subsidies) are not the only factors that drive organic market growth. Disposable income, consumer attitudes towards environmentally friendly products and organic ‘low-input’ substitutes, policy targets, and technological aspects all emerged as the main factors, where their combinations and interactions would mostly affect the future shape of the organic system in Europe. Although an active policy reaction has been shown to have a crucial role in the case of worsening global economic conditions, it might not be an adequate tool when other key factors are in place. Consumer attitudes were found to have crucial roles due to changes in the consumer approaches to food, which have shifted towards natural and healthy aspect of food consumption. Technology shifts in particular appear to have potentially critical effects on the organic-sector performance across all of the four scenarios developed.
These four scenarios are characterised by different variables that assume different relevance. The network of the variable interactions was analysed using network-analysis tools, to obtain a more precise and measurable interpretation of the different roles of the variables within each scenario. Table 2 summarises the results of the normalised OUT and IN Freeman degree centrality, for the top five ranking variables. The use of normalised centrality measures allows for a comparison of the results among the four scenarios. First, it is possible to determine which variable has the highest score, and if some variables score higher under different scenarios: the ‘decrease in organic farming relative profitability’ variable assumed the highest scores within all four of the scenarios, and it was top ranked in both SC3 and SC4, which are those scenarios that presented the least favourable situations for organic farming.
Secondly, we can determine for each scenario what variables score high both in IDC and ODC, and hence which were shown to have particularly active roles, as for instance, ‘organic farming policy response’ in SC2, and ‘increasing food prices’ in SC3.

Finally, the variable ranking according to IDC and ODC allows an understanding of how different variable combinations might yield completely different scenarios. A high degree centrality scoring is not sufficient to predict the overall scenario outcome. For instance, the variables ‘organic farming policy response’, ‘increasing food prices’, and ‘high oil prices’ were scored high in both SC2 and SC3, which were however scenarios that depicted completely different evolution of the organic business.
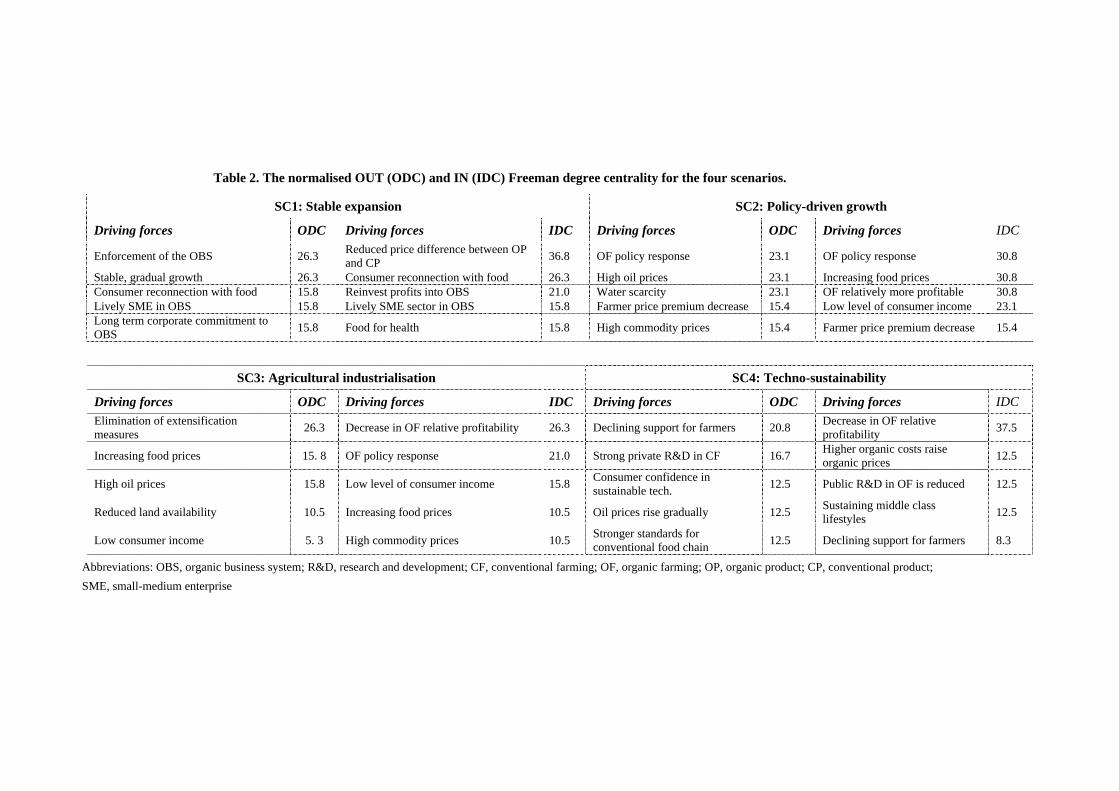
Table 2. The normalised OUT (ODC) and IN (IDC) Freeman degree centrality for the four scenarios.
SC3: Agricultural industrialisation SC4: Techno-sustainability
Driving forces ODC Driving forces IDC Driving forces ODC Driving forces IDC Elimination of extensification measures 26.3 Decrease in OF relative profitability 26.3 Declining support for farmers 20.8 Decrease in OF relative
profitability 37.5
Increasing food prices 15. 8 OF policy response 21.0 Strong private R&D in CF 16.7 Higher organic costs raise organic prices 12.5
High oil prices 15.8 Low level of consumer income 15.8 Consumer confidence in sustainable tech. 12.5 Public R&D in OF is reduced 12.5
Reduced land availability 10.5 Increasing food prices 10.5 Oil prices rise gradually 12.5 Sustaining middle class lifestyles 12.5
Low consumer income 5. 3 High commodity prices 10.5 Stronger standards for conventional food chain 12.5 Declining support for farmers 8.3
Abbreviations: OBS, organic business system; R&D, research and development; CF, conventional farming; OF, organic farming; OP, organic product; CP, conventional product; SME, small-medium enterprise
SC1: Stable expansion SC2: Policy-driven growth
Driving forces ODC Driving forces IDC Driving forces ODC Driving forces IDC
Enforcement of the OBS 26.3 Reduced price difference between OP and CP 36.8 OF policy response 23.1 OF policy response 30.8
Stable, gradual growth 26.3 Consumer reconnection with food 26.3 High oil prices 23.1 Increasing food prices 30.8 Consumer reconnection with food 15.8 Reinvest profits into OBS 21.0 Water scarcity 23.1 OF relatively more profitable 30.8 Lively SME in OBS 15.8 Lively SME sector in OBS 15.8 Farmer price premium decrease 15.4 Low level of consumer income 23.1 Long term corporate commitment to OBS 15.8 Food for health 15.8 High commodity prices 15.4 Farmer price premium decrease 15.4

Following the pioneering work of Wack (1985), the four scenarios can be used as a ‘wind tunnel’ for the evaluation and testing of the effectiveness of the individual ideas and the overall performance of different policy options or strategies. At the same time, they provide starting points for the design and development of new strategies and/or policies in different future situations. Therefore, we provide here a simulation of the potential strategy implementation of the organic food sector. According to previous findings of Gambelli and Zanoli (2004) and Zanoli et al. (2000), and considering the intensive group discussions of the experts that occurred during the scenario-generation process, we have summarised the different potential strategy options in Table 3.
Table 3. The business strategies under the different scenarios
SCENARIOS
BUSINESS STRATEGIES
SC1: Stable expansion
SC2: Policy-driven growth
SC3: Agricultural industrialisation
SC4: Techno-sustainability
Product innovation ✓ ✓ Processing/ distribution integration ✓ Enlarge product range/ availability ✓
Quality development ✓ ✓ ✓ Branding, going into niche product ✓ ✓ Specialised shop distribution ✓ ✓
Enhance ethical aspects of organic products ✓ ✓
Quality enhancement can be considered a key option in three of the scenarios, even if it reflects different general conditions for the organic food sector. Strategies for taking advantage of the positive options under SC1 considered a general development of integration in the organic business, and emphasis on research and development. Under the less favourable scenarios, the option of a niche market distribution for organic products was often integrated with specific branding strategies for product differentiation. Ethical issues are the only chance to assure organic product survival in SC4, where new technologies will solve the environmental drawbacks of conventional farming.
The scenario outcomes were obtained by applying backward inference and causal reasoning, in the form of graphical influence diagrams. The analysis of the ‘thinking

styles’ of the experts can be considered to provide predictors of heuristic responses and framing effects, and therefore of the coherence and consistency of the actual scenario-development process. Even in this limited sample, the REI scales were seen to be reliable enough (NFC: α, 0.69; FI: α, 0.87, well above the original findings in 0) and independent enough (r = 0.11; not significant). The NFC scale had a mean (±S.D.) of 21.75 (2.70): this shows a high degree of rational thinking style among the experts. As a high NFC and a low FI correlate with reduced risk of heuristic bias, we can conclude that there is an acceptable degree of consistency and coherence for the scenarios generated.
5. Conclusions
The traditional distinction between quantitative and qualitative data, which is mainly based on the simple idea that the former deals with numbers while the latter deals with judgements or assessments, is becoming less sharp. Bryman (2008) showed how data and information that are usually collected using participatory approaches, interviews, discourse and text analysis, can be used in a more formalised approach. Among the contributions that deal with planning and complex territorial systems, Roberts and Stimson (1998) provided a practical tool for the use of qualitative information in a structured way, for defining regional economic strategies by exploiting multi-sectoral interactions among economic sectors and competences. Bedford et al. (2006) considered the use of expert assessments in statistical analyses, and considered the issues of statistical reliability evaluation in engineering design processes. Wisse et al. (2006) proposed a solution for the reduction in the large amounts of information when compiling conditional probability tables in BN models based on probability elicitation from experts. Brown (1993) implemented the Q-methodology approach as a tool for providing a basis for the systematic study of subjectivity.
Differences between qualitative and quantitative research are narrowing also with respect to the issue of the generalisation and validation of results. Mason (2002) argued that if a correct approach to qualitative research is followed, then results and findings can be considered as relevant even if the source of the qualitative information used is unique and cannot be replicated. Saaty (1980) used the well-known analytic hierarchy process approach to propose an effective and elegant way to check and solve consistency issues in preference statements of interviewees, using linear algebra computation. Gummerson (2005) argued that although a quantitative approach might improve the scientific soundness of marketing research, it cannot be sufficient for an understanding of the deeply complex interactive systems, and proposed an approach to exploit the intuitive information in a systematic and rigorous way.
SA can supplement information derived from more conventional modelling sources, and it is designed to supplement, rather than to replace, traditional decision-making techniques. Of course, the results of qualitative SA will ultimately depend on the

nature of the SA process and on the way the qualitative information is raised and used. However, a rational approach to decision making would combine the flexibility of qualitative information with a rigorous treatment of the decision system and data. In this study, we have shown how the structured processing of information can greatly facilitate the understanding of the scenario structure and of the roles of the variables considered in the SA, and can allow for a consistent comparison among the resulting decision options. As final comment, the subjectivity of the aspects involved in SA can be taken into account by measuring their rational responses, hence assessing the overall consistency of the SA-generation process.
6. References
Ahmed M.D., Sundaram D., “A Framework for a Scenario Driven Decision Support Systems Generator”, International Journal of Information Technology and Web Engineering, vol. 3, no.2, 2008, p. 45-62.
Alcamo J., Scenarios as tools for international environmental assessments, European Environment Agency, Copenhagen, Denmark, 2001.
Bedford T., Quigley J., Walls L., “Expert Elicitation for Reliable System Design”, Statistical Science, vol. 21, n. 4, 2006, p. 428-450.
Börjeson L. Höjer M., Dreborg K.H., Ekvall T., Finnveden G., “Scenario types and techniques: Towards a user’s guide”, Futures, vol. 38, 2006, p. 723-739.
Brown S.R., “A primer on Q methodology”, Operant Subjectivity, vol. 16, n. 3/4, 1993, p. 91-138.
Bryman A., Social Research Methods, Oxford University Press, Oxford, 2008.
Bunn D.W., Salo A.A., “Forecasting with scenarios”, European Journal of Operational Research, vol. 68 no. 3, 1993, p. 291-303.
Carton F., Adam F., “Understanding the Impact of Enterprises Systems on Management Decision Making: An Agenda for Future Research”, Electronic Journal of Information Systems Evaluation, Vol. 8, n. 2, 2005, p. 99-106.
Chambers J.D., Satindev K.M., Donald D.S., “How to choose the right forecasting technique”, Harvard Business Review, July-August 1971, p. 45-74.
Chermack T.J., “Studying scenario planning: Theory, research suggestions, and hypothesis”, Technological Forecasting & Social Change, vol. 72, 2005. p. 59-73.
Cinar D., Kayakutlu G., “Scenario analysis using Bayesian networks: A case study in energy sector”, Knowledge-Based Systems, vol. 23, 2010, p. 267-276.
De Kluyver C.A., Moskowitz H., “Assessing scenario probabilities via interactive goal programming”, Management Science, vol. 30. n. 3, 1984, p. 273-278.
Denzin N.K. and Lincoln Y.S. (Eds.), The Sage Handbook of Qualitative Research (3rd ed.), Thousand Oaks, CA: Sage, 2005.

Epstein S., R. Pacini, Denes-Raj V., Heiher H., “Individual differences in intuitive and analytical information processing”, Journal of Personality and Social Psychology, vol. 71, 1996, p. 390-405.
Gambelli D., Zanoli R., Future environment for organic marketing initiatives, Organic Marketing Initiatives and Rural Development, Volume 7, School of Management and Business, Aberysthwyth, UK, 2004.
GECAFS, http://www.gecafs.org/.
Georgoff D.M., Murdick R.G., “Manager’s guide to forecasting”, Harvard Business Review, Jan.-Feb. 1986, p. 110-120.
Gummerson E., “Qualitative research in marketing. Roadmap for a wilderness of complexity and unpredictability”, European Journal of Marketing, vol. 39, n. 3-4, 2005, p. 309-327.
Helmer O., “Reassessment of cross-impact analysis”, Futures, vol. 13 no.5, 1981, p. 389-400.
IPCC, Intergovernmental Panel on Climate Change, 2008, http://www.ipcc-data.org/ ddc_definitions.html.
Jungermann H., “Inferential processes in the construction of scenarios”, Journal of Forecasting, vol. 4, 1985, p. 321-327.
Kahn H., Wiener A.J., The year 2000: a framework for speculation on the next thirty-three years, Macmillan, New York, 1968.
Lilja, N., Ashby, J.A., ‘Types of participatory research based on the locus of decision-making”. PRGA Working Paper 6, 1999, Cali, Colombia.
Mahmoud M., Liu Y., Hartmann H., Stewart S., Wagener T., Semmens D., Stewart R., Gupta H., Dominguez D., Dominguez F., Hulse D., Letcher R., Rashleigh B., Smith C., Street R., Ticehurst J., Twery M., van Delden H., Waldick R., White D., Winter L., “A formal framework for scenario development in support of environmental decision-making”, Environmental Modelling & Software, vol. 24, 2009, p. 798-808.
Mason J., Qualitative Researching, Second Ed. London: Sage, 2002.
Meyer R., “Comparison of scenarios on futures of European food chains”, Trends in Food Science & Technology, vol. 18, 2007, p. 540-545.
Millet S. M., “How scenarios trigger strategic thinking”, Long Range Planning, vol. 21 no. 5 , 1988, p. 61-68.
Pallottino S., Sechi G.M., Zuddas P., “A DSS for water re sources management under uncertainty by scenario analysis”, Environmental Modelling & Software, vol. 20, 2005, p. 1031-1042.
Postma T.J.B.M., Liebl F., “How to improve scenario analysis as a strategic management tool?”, Technological Forecasting & Social Change, vol. 72, 2005, p. 161-173.
Power D.J., A Brief History of Decision Support Systems, DSSResources.COM, World Wide Web, http://DSSResources.COM/history/dsshistory.html, version 4.0, March 10, 2007.
Reed M.S., “Stakeholder participation for environmental management: a literature review”, Biological Conservation, vol. 141, 2008, p. 2417-2431.

Roberts, B., Stimson R. J., “Multi-sectoral qualitative analysis: A tool for assessing the competitiveness of regions and formulating strategies for economic development”, Annals of Regional Science, vol. 32, 1998, p. 469-494.
Saaty T.L., The Analytic Hierarchy Process: Planning, Priority Setting, Resource Allocation, McGraw-Hill, New York, 1980.
Schnaars S.P, “How to develop and use scenarios”, Long Range Planning, vol. 20 no. 1, 1987, p. 105-114.
Schwartz P., The art of the long view: scenario planning – protecting your company against an uncertain future, Century Business, London, 1992.
Van der Heijden A. M. J., Scenarios: The art of strategic conversation , John Wiley, Chichester, UK, 1996.
Van Notten P.W.F., Rotmans J., Van Asselt M.B.A., Rothman D.S., “An updated scenario typology”, Futures, vol. 35, 2003, p. 423-443.
Wack P., “Scenarios: shooting the rapids”, Harvard Bus. Ref., Nov-Dec. 1985, p. 139-150.
Wassermann S. and Faust K., Social Network Analysis: Methods and Applications, Cambridge, Cambridge University Press, 1994.
Wisse B.W., van Gosliga S.P., van Elst N.P., Barros A.I., "Relieving the elicitation burden of Bayesian Belief Networks", 6th Bayesian Modelling Applications Workshop on UAI, Helsinki, Finland, July 2008.
Zanoli, R., Gambelli D. and Vairo D., Organic farming in the EU by 2010: A scenario analysis, Organic farming in Europe: Economics and Policy, Volume 8, 2000, University of Hohenheim.