a climate change scenario for carbon dioxide and dissolved organic carbon fluxes from a temperate...
TRANSCRIPT

DIVISION S-7—FOREST & RANGE SOILS
A Climate Change Scenario for Carbon Dioxide and Dissolved Organic Carbon Fluxesfrom a Temperate Forest Soil: Drought and Rewetting Effects
W. Borken,* Y.-J. Xu, R. Brumme, and N. Lamersdorf
ABSTRACTOur objective was to assess the effect of changes in rainfall amount
and distribution on CO2 emissions and dissolved organic C (DOC)leaching. We manipulated soil moisture, using a roof constructedbelow the canopy of a 65-yr-oId Norway spruce plantation [Piceaabies (L.) Karst.] at Soiling, Germany. We simulated two scenarios:a prolonged summer drought of 172 d followed by a rewetting periodof 19 d and a shorter summer drought of 108 d followed by a rewettingperiod of 33 d. Soil CO, emission, DOC, soil matric potential, andsoil temperature were monitored in situ for 2 yr. On an annual basisno significant influence of the droughts on DOC leaching rates belowthe rhizosphere was observed. Although not significantly, the droughtstended to reduce soil respiration. Rewetting increased CO, emissionsin the first 30 d by 48% (P < 0.08) in 1993 and 144% (P < 0.01)in 1994. The CO2 flush during rewetting was highest at high soiltemperatures and strongly affected the annual soil respiration rate.The annual emission rate from the drought plot was not affected bythe drought and rewetting treatments in 1993 (2981 kg C ha"1 yr"1),but increased by 51% (P < 0.05) to 4813 kg C ha J yr"1 in 1994.Our results suggest that reduction of rainfall or changes in rainfalldistribution due to climate change will affect soil CO, emissions andpossibly C storage in temperate forest ecosystems.
/~~^ ENERAL CIRCULATION MODELS have projected a hu-VJ man-induced global warming varying from 0.9 to3.5°C by 2100 (Intergovernmental Panel on ClimateChange, 1996). Changes in the global water cycle areexpected as a result of this temperature increase, butthe direction of change is unclear. On a global scale,Rind et al. (1990) pointed out that the likelihood ofdrought conditions will increase dramatically with in-creasing temperature. A study of Eurasian hydrologyduring the past 2500 to 3000 yr showed that the correla-tion of precipitation with temperature is negative in aridregions and positive in most other areas (Selivanov,1994). MacCracken et al. (1991) predicted increases ofsummertime evaporation, which may cause a decreasein soil moisture, and of precipitation in winter andspring, which may cause an increase of soil moisture inspring, for the middle latitudes. On the other hand,elevated atmospheric CO2 increases the water use effi-ciency of vegetation because of decreasing transpirationrates (Bazzaz et al., 1990), which may compensate re-duced water availability during droughts.
W. Borken, R. Brumme, and N. Lamersdorf, Inst. of Soil Science andForest Nutrition, Univ. of Goettingen, Buesgenweg 2, 37077 Goet-tingen, Germany; and Y.-J. Xu, Dep. of Forestry, Virginia PolytechnicInst. and State Univ., Blacksburg, VA 24061. Received 29 July 1998.•"Corresponding author ([email protected]).
Published in Soil Sci. Soc. Am. J. 63:1848-1855 (1999).
The amount of C stored in the soils of temperateforest ecosystems is estimated between 104 and 155 Pg(Houghton, 1995; Post et al., 1982; Taylor and Lloyd,1992), with a mean residence time between 23 yr (Taylorand Lloyd, 1992) and 29 yr (Raich and Schlesinger,1992). Soil respiration is very sensitive to changes intemperature and moisture. In their review of soil respi-ration rates from terrestrial ecosystems, Raich andSchlesinger (1992) showed that temperature was thesingle best predictor of annual soil respiration rates andthat an inclusion of precipitation as an additional param-eter considerably increased the model prediction. Labo-ratory studies of the effect of moisture on respirationrates of litter and soil organic matter generally show awide moisture range with little effect on decomposition(Ino and Monsi, 1969; Linn and Doran, 1984; Skopp etal., 1990). Soil moisture conditions below and above thisoptimum range led to a reduction in soil respirationthrough water or O2 stress. Laboratory investigationssimulating soil droughts resulted in decreased CO2 emis-sion rates, while subsequent rewetting generally causeda CO2 flush (Birch, 1959; Seneviratne and Wild, 1985;Moore, 1986; Cabrera, 1993; Degens and Sparling,1995).
Leaching of DOC represents another sensitive releaseof C from forest soils. Although the amount of C leach-ing as DOC is generally very small compared with thatreleased by soil respiration, DOC production and trans-port may affect many biological and chemical processesin soils, such as activity of soil microorganisms and nutri-ent availability (Quails and Haines, 1992). Concentra-tions of DOC in soil solutions may increase with increas-ing temperature because of promotion of microbialactivity in the forest floor (Liechty et al., 1995).
Little is known about the effect of soil drought andrewetting on CO2 emission and DOC leaching underfield conditions in temperate forest soils. The goal ofour study was to investigate the effects of extendedsummer droughts and subsequent rewettings on soil CO2emissions and DOC leaching. The study was conductedin situ in a mature Norway spruce plantation. At thissite a roof below the canopy has been constructed toallow for manipulations of the amount of throughfallreaching the soil surface.
MATERIALS AND METHODSSite
The study was conducted in a 65-yr-old Norway spruceplantation in the German Soiling research area (51°31'N,
Abbreviations: DOC, dissolved organic carbon.
1848

BORKEN ET AL.: CLIMATE CHANGE SCENARIO FOR CARBON FLUXES FROM A TEMPERATE FOREST SOIL 1849
9°34'E, 510-m elevation). The area has an annual mean airtemperature of 6.4°C, varying between —2 and 16°C monthlyduring a year, and an annual precipitation of=1090 mm, evenlydistributed throughout the year. Compared with the long-termaverage, the experimental years had slightly higher precipita-tion and air temperatures (1241 mm and 6.5°C in 1993, 1291mm and 7.6°C in 1994). Meteorological data were collectedat a height of 33 m (2-3 m above the canopy) from a towerconstructed within a neighboring 118-yr-old Norway spruceplantation. In 1991 the forest in the study site was 20 m tall,with a density of 900 trees ha"1 and a basal area of =50 m2
ha"1 (Dohrenbusch et al., 1993).The soil is developed in 60- to 80-cm-thick solifluction de-
posits overlying weathered Triassic sandstone. The soil is clas-sified as a Typic Dystrochrept according to U.S. soil taxonomy(Soil Survey Staff, 1994), with a pH (0.01 M CaCl2) gradientfrom 3.2 (0-10 cm) to 4.2 (20-40 cm) and a base saturationof <7% down to the 100-cm depth. Carbon storage at the siteis estimated to be =46 Mg ha"1 in the 6- to 9-cm-thick Ohorizon and 79 Mg ha"1 in the mineral soil down to 80 cm.The O horizon has a maximum water-holding capacity of 473 %(g H2O g"1 dry matter), which may yield a maximum waterstorage of 48 L m~2.
Drought and Rewetting Experimentunder Field Conditions
In the summer of 1991, two 300-m2 roofs made of transpar-ent polycarbonate were constructed below the forest canopy,=3.5 m above the forest floor. The roofs were part of theEuropean EXMAN project conducted in several Europeancountries (Bredemeier et al., 1998). One roof was used forthe drought and rewetting experiment (drought plot), whilethe other roof served as an untreated control plot. During thedrought experiments, only the soil was dried out but the can-opy received precipitation. An ambient plot without a roofwas selected in an adjacent spruce stand of the same age andon similar soil to quantify possible roof effects. A 1-m-widetrench was dug and sheathed with plastic foil to separate thesoil of the roofed areas from the neighboring soil. A zoneof 2 m within the plastic foil was demarcated in which nomeasurements were established. The high cost for the roofconstruction precluded replication of the roof treatment andtherefore pseudoreplications were used to evaluate experi-mental treatments.
Below the drought roof, dry periods were simulated be-tween 1 April and 19 Sept. 1993 and between 1 April and 17July 1994 (Table 1). Throughfall intercepted by the roofs waspiped into several water tanks and stored for 172 d in 1993and for 108 d in 1994. The soil was rewetted with the collectedthroughfall, using a sprinkler system installed underneath theroof. Water was applied with an intensity of 1 to 2 mm h"1
for 19 d in September 1993 and 33 d in 1994. The total waterinput on the drought plot was reduced by 475 mm in 1993and 152 mm in 1994 compared with the throughfall in theambient plot. After the rewetting periods, both control andtreated plots received the same amount of throughfall. Littercollected by the roofs was redistributed onto the forest floor.The amounts of litter in the ambient plot were 1.89 Mg Cha"1 in 1993 and 1.92 Mg C ha"1 in 1994 and were not differentfrom those in the drought and control roof plot.
Carbon dioxide emissions were measured on the drought(n = 4) and the ambient plots (n = 3) from September toNovember 1993 and from April to November 1994 by anautomated chamber system (Brumme and Beese, 1995). Forother periods between 1993 and 1994, manual gas sampleswere taken weekly and analyzed in the laboratory (Loftfield
Table 1. Throughfall water for different time periods at the ambi-ent, control roof, and drought roof plot in a temperate Norwayspruce plantation at Soiling, Germany.
Throughfall water
Time period Ambient plot Control plot Drought plot
Drought period 1993(1 Apr.-19 Sept.)
Rewetting period 1993(20 Sept.-8 Oct.)1993 (total)
Drought period 1994(1 Apr.-17 July)
Rewetting period 1994(18 July-19 Aug.)1994 (total)
483
701058
250
261117
Lm"z
467
53911
245
221057
193583
184965
et al., 1997). In the control plot (n = 4), soil respiration wasmeasured only weekly during 1993. All chambers covered anarea of 0.25 m2 and were inserted into the O horizon downto the 5-cm depth.
The automated chambers were closed four to five timesper day, and gas samples were taken at 0, 30, and 60 min afterclosure. Carbon dioxide was analyzed on a gas chromatograph(GC 6000, Vegas Series 2, Carlo Erba Instruments, Milan,Italy) equipped with an electron capture detector. The systemwas interfaced to a personal computer with the software BO-NANOX (Messwert GmbH, Goettingen, Germany), whichcontrolled the sampling and analysis of gases, monitored thegas chromatograph detector signal, air pressure (temperaturecompensated silicon piezo-resistive sensor 142-SC-15A, Sen-sym, Rugby, UK) and air temperature (PTC, Siemens, Mu-nich, Germany) within the chambers. Air temperature and airpressure were measured at 10-min intervals and recorded ashourly averages. Four certified CO2 standards (350,750,1200,and 1800 u.L L"1 CO2 in N2; Messer Griesheim, Krefeld, Ger-many) were used for calibration every 2 h. Repeated measur-ing of certified CO2 standards resulted in an accuracy of 0.5%for our system.
Manual gas sampling was done with evacuated glass bottles(0.1 L) and a sampling device that checks the vacuum in theglass bottles and takes the gas sample. Before sampling, thehose connecting the chamber with the glass bottle was flushedwith gas sample from the chamber. Gas samples were analyzedin the laboratory using an automated gas chromatograph sys-tem similar to the automated field system (Loftfield et al.,1997).
Soil temperature (n = 3) at the 0-cm mineral soil depthand soil matric potential at the 10-cm soil depth (n = 3) wereautomatically (IMKO GmbH, Munich, Germany) recordedevery 15 min at both the drought and ambient plots throughoutthe experiment. Soil temperature was measured using stan-dard PtlOO sensors (Siemens). Soil matric potential was mea-sured with tensiometers consisting of ceramic cups (5-cmlength) and a temperature-compensated silicon piezo-resistivepressure transducer (Schmidt, 1993). During drought periods,soil matric potential exceeded the measurable range of themonitoring system. The missing values were substituted withthe potentials estimated using a soil water balance model(SOW; Xu et al., 1998), which is a deterministic model thatcalculates actual evapotranspiration and soil water fluxes usingPenman-Montheith and Richards' equation with an empiricalreduction function for root water uptake. The validity of themodel was tested by comparing predicted matric potentialvalues with measured values at varied soil depths. Soil solutionwas sampled using suction lysimeters (ceramic P-80 cups) in-

1850 SOIL SCI. SOC. AM. J., VOL. 63, NOVEMBER-DECEMBER 1999
stalled with five replicates in the mineral soil at the 10- and100-cm depths. Samples were collected monthly but morefrequently (daily to weekly) during the rewetting events. Dis-solved organic carbon was determined using a total organicC analyzer (Shimadzu-5050, Shimadzu Scientific, Columbia,MD). Annual DOC fluxes were calculated by multiplying sea-sonal concentrations with corresponding water fluxes.
Model DevelopmentPrevious investigations have shown that temperature and
water potential interact in a nonlinear way with soil respirationrate (Moore, 1986). In temperate forest soils, the osmoticpotential is negligible compared with the matric potential. Wetherefore used soil matric potential as an indicator for wateravailability to microorganisms and roots. The temperaturedependence of soil respiration has been described using anArrhenius equation (e.g., Lloyd and Taylor, 1994). The magni-tude of the influence of temperature and matric potential onCO2 emission depends on which is the limiting factor. Wemodified the Arrhenius equation as follows:
CO2 emission = Aexp(-E/RT)(l + [1]where A is an Arrhenius constant, E is the apparent activationenergy, R is the universal gas constant, and Tis the soil temper-ature (K). The a is an empirical fitting parameter that describesthe influence of soil matric potential (kPa) on CO2 emission,and \\i is the soil matric potential (kPa). The term (1 + avjj)may be described as a moisture regulator and is only validfor soils under unsaturated conditions, in which soil respirationis not limited by O2 stress. The parameters A, E, and a werecalculated using daily averages of CO2 emission, soil tempera-ture, and soil matric potential. Qw values were determinedusing the calculated apparent activation energy E:
[2]RTStatistics
Data were analyzed using SAS software (SAS Institute,1996). Nonlinear regression analyses were performed to fitmean daily CO2 emission rates of the ambient and the droughtplots to daily averages of soil temperature and soil matricpotential. The effects of drought and rewetting on CO2 emis-sion rates and DOC concentrations at the 10- and 100-cm soildepths were analyzed by performing t tests using means ofpseudoreplications from the ambient and the drought plots.The roof effect on CO2 emission was analyzed by comparingemission rates of the control and drought plots with the samestatistical procedure. Standard deviations are given for spatialvariation in CO2 emission rates and DOC concentrations.
RESULTSCarbon Dioxide Emissions in Ambient
and Control PlotsCarbon dioxide emission (weekly average) (Fig. la)
showed a clear seasonal pattern: it increased at the be-ginning of spring and decreased in fall, following thepattern in soil temperature (Fig. Ib). In 1993, the highestemissions (1.55 ± 0.23 g C m~2 d"1) occurred fromAugust to early October. During this year no severedrought occurred except for a short dry period in Julywith the lowest matric potential of -61 kPa (Fig. Ic).This natural drought was accompanied by a slight drop
of 16% in CO2 emission rates compared with June, al-though soil temperature increased by 1.0°C. In 1994,the highest emissions were observed from July to earlySeptember (1.53 ± 0.22 g C m~2 d"1). Low throughfalloccurred from July to August 1994 (Fig. Id), resultingin a soil drought for several weeks with low matricpotential below -120 kPa (Fig. Ic). Concurrently, CO2emissions (1.35 ± 0.21 g C rrT2 d^1) decreased from theend of July to August when soil temperature reachedits maximum of 15.7°C. More than 75% of the annualtotal emission occurred during April to October.
Cumulative CO2 emission from the ambient plot was3015 kg C ha'1 in 1993 and 3192 kg C ha'1 in 1994 (Table2). This difference may be explained by the difference inmean soil temperatures of 6.0°C in 1993 and 6.8°C in1994. Cumulative CO2 emission from the control plot(3205 kg C ha"1) was not significantly different fromthe ambient plot in 1993. Although throughfall was re-duced by 14% in 1993 in the control plot (Table 1), weobserved no roof effect on soil respiration.
Drought Effects on Carbon Dioxide EmissionCompared with the annual amount of throughfall at
the ambient plot, the amount of throughfall at thedrought plot was reduced by 45% in 1993 and 14% in1994 (Table 1). After the drought experiment started
Jan Apr Jul1994
Oct Jan
Fig. 1. Seasonal changes of (a) measured and modeled CO2 emission,(b) soil temperature at 0-cm depth, (c) soil matric potential at 10-cm depth, and (d) throughfall at the ambient plot.

BORKEN ET AL.: CLIMATE CHANGE SCENARIO FOR CARBON FLUXES FROM A TEMPERATE FOREST SOIL 1851
in April 1993, the soil matric potential at the 10-cmdepth sharply decreased from -5 to -126 kPa and main-tained at this level throughout the 172-d drought period(Fig. 2c). Compared with the treatment period in 1993,the drought in 1994 was less prolonged and matric po-tential remained at a level below -100 kPa for only4 wk. The summer drought experiments only slightlyaffected soil CO2 emissions. Emission rates slowly de-creased when the droughts started (Fig. 2a and 2c).During the 172-d drought period in 1993, the soil emit-ted 1639 kg C ha'1 (Table 2). This rate was 23.3% (P <0.05) lower than that of the control plot and 12.4%lower (P > 0.09) than that of the ambient plot. Duringthe less intense 108-d drought period in 1994, the emis-sion rate was not reduced (—1.2%). The stronger reduc-tion in 1993 was due to the long and severe droughtinduced at the drought plot compared with the ambientplot, which received a throughfall input of 483 L m~2
(Table 1).
Rewetting Effects on Carbon Dioxide EmissionRewetting resulted in an immediate increase of soil
emission in both treatment years. The emission ratescontinued to increase for 3 wk and reached their maxi-mum in October 1993 (2.24 g C m~2 d"1) and August1994 (4.94 g C mT2 d~'). During rewetting, mean soiltemperature was 9.2°C in 1993 and 13.8°C in 1994. Thedrop in CO2 emission after the peak flush was accompa-nied by a decrease in soil temperature.
Rewetting lasted for a shorter time in 1993 than in1994, but the intensity of rewetting was higher in 1993(193 L irr2 within 19 d) than in 1994 (184 L m'2 within33 d, Table 1). During the first 30 d after the start ofrewetting, CO2 emission was 504 kg C ha"1 in 1993 and1088 kg C ha"1 in 1994 (Table 2). This correspondedwith about one-sixth of the annual C release in 1993and one-fifth in 1994. Compared with the C release atthe ambient plot during these 30 d, emission rates atthe drought plot were 48% (P < 0.08) higher in 1993and 144% (P < 0.01) higher in 1994.
Both duration of the summer drought and soil tern-
Table 2. Carbon dioxide fluxes for different time intervals at theambient, control, and drought plots.f_______________
CO2 fluxes
Time period
Drought period 1993
Rewetting period 1993
1993 (total)
Drought period 1994
Rewetting period 1994
1994 (total)
Ambient plot
1872ab|(273)341a(90)
3015a(366)1152a(119)445a(22)
3129a(155)
Control plot
— kg C ha'1 —2136a(227)414a(28)
3205a(233)
-
-
Drought plot
1639b(259)504a(91)
2981a(416)1138a(229)10881)(149)4813b(756)
t Mean with standard deviation in parentheses.t Significant variations (P = 0.05) in CO, fluxes during the same period
are indicated by different letters.
perature during the rewetting had an effect on the an-nual CO2 release. The drought period and subsequentrewetting led to an insignificantly lower annual rate in1993. By contrast, the drought period and rewettingevent in 1994 increased the annual CO2 emission ratesignificantly (P < 0.05) by 51% compared with the ambi-ent plot.
Quantitative Analyses of Effects of SoilTemperature and Matric Potential
on Carbon Dioxide EmissionCarbon dioxide emission rates increased exponen-
tially with increasing temperature from -1 to =16°Cduring the untreated and rewetting periods (Fig. 3). Itis apparent that soil temperature was the dominant fac-tor for soil CO2 emissions when matric potential washigher than -20 kPa (mostly during the untreated andrewetting period, Fig. 2c). During the drought periods,CO2 emission rates were below 50 mg C m~2 h~'. Appar-ently a moisture-dependent threshold value existed forsoil respiration below which temperature effects be-come virtually zero.
The calculated CO2 emission rates using Eq. [1] and[2] strongly correlated with those measured at both theambient (r2 = 0.85) and drought plots (r2 = 0.95) (Fig.la and 2a). The parameters in Eq. [1] were fitted asfollows: E = 85.0 kJ mol"1, A = 2.57 X 10¹⁷, and a =
Eo
4 -
2 -
1 -
measured- modeled
12 -
4 -
= 0 -
m -50-
-100 -
-150
•g 80 -
= 60 -Ig> 40
K 20
M^^J~^f^
droughtperiod
droughtperiod
Oct JanJan Apr Jul Oct Jan Apr Jul1993 1994
Fig. 2. Seasonal changes of (a) measured and modeled CO2 emission,(b) soil temperature at 0-cm depth, (c) soil matric potential at 10-cm depth, and (d) throughfall at the drought plot.

1852 SOIL SCI. SOC. AM. J., VOL. 63, NOVEMBER-DECEMBER 1999
O0>
200 -,
150 -|
100 -O
'</><n
<*> 50 -OO
0
» Untreated period• Rewetting period* Drought period
-2 180 2 4 6 8 10 12 14 16Soil temperature (SC)
Fig. 3. Relationship between soil temperature at 0-cm depth and CO2 emission (n = 964) for one representative chamber at the drought plotfrom 1993 to 1994.
0.0029 for the control plot; and E = 109 kJ mol"1, A =1.02 X 10²², and a = 0.0049 for the drought plot. Calcu-lated <2io values were 3.9 for the ambient plot and 5.7for the drought plot. The high values for E and a indicatea much stronger influence of soil temperature and ma-tric potential on soil respiration at the drought plot.Disregarding soil matric potential resulted in lower cor-relations at the ambient (r2 = 0.77) and drought plots(r2 = 0.63). The parameters were fitted as follows: E =65.8 kJ mol"1 and A = 6.83 X 10¹³ for the ambient plot,and E = 102 kJ mol"1 and A = 4.05 X 10²⁰ for thedrought plot. The calculated Qw values of 2.87 for theambient plot and of 5.11 for the drought plot suggesteda smaller temperature effect than when matric potentialwas included.
Dissolved Organic Carbon FluxesDuring the growing season, mean DOC concentra-
tions in the 10- and 100-cm soil depths were higher thanin winter at the ambient and drought plots (Fig. 4). TheDOC concentrations in the top soil of the ambient plot(21.5 ± 5.2 mg L"1) and the drought plot (18.5 ± 4.1mg L"1) were significantly higher (P < 0.05) than below.the rhizosphere (6.3 ± 4.1 mg L"1 at ambient plot and
5.9 ± 3.3 mg L l at drought plot). In both years andat both depths, DOC concentrations peaked followingrewetting both at the drought and ambient plots. TheDOC concentrations in the drought plot were not signif-icantly different from the ambient plot.
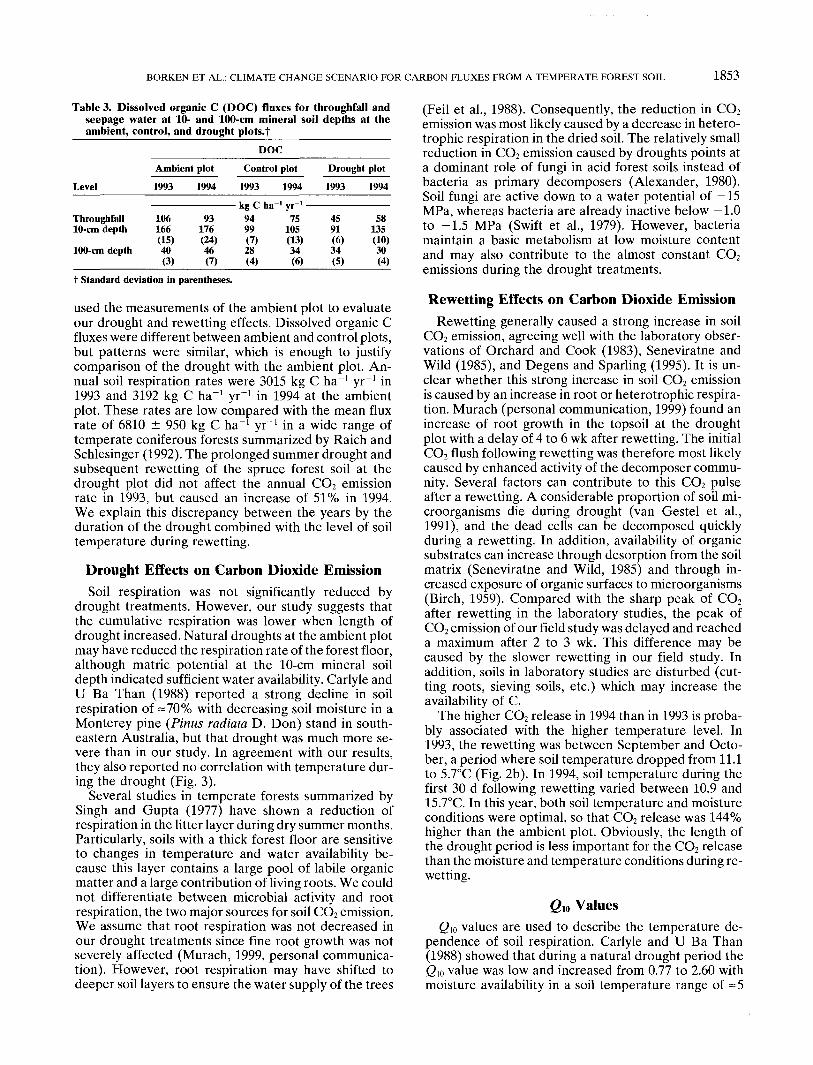
The annual rates of DOC input by throughfall at theambient plot were 106 kg ha"1 in 1993 and 93 kg ha"1
in 1994, while the drought and control plots had consid-erably lower input rates (Table 3). The large differencein DOC input to the soil was mainly caused by the lowerwater input at the drought and control plots. Usingthe water flow results modeled by Xu et al. (1998), wecalculated DOC fluxes between 91 and 176 kg ha"1 atthe 10-cm depth (Table 3). This higher DOC flux at 10cm compared with the input indicated a mobilizationof DOC in the upper soil at all plots. The differencebetween DOC input and output soil flux at 10 cm was
, highest at the ambient plot and lowest at the controlplot. Much lower rates of DOC leaching at the 100-cmsoil depth were calculated for all plots (28-46 kg ha"1).
DISCUSSIONWe found no significant differences in CO2 emission
between the ambient and control plots and therefore
OD)
8O
50 -,
40 -
30 -
20 -
10 -
o ambient plot 10cm• ambient plot 100cmv drought roof 10cm* drought roof 100cm
0 oM ° °8 v 0
° X 9 S °o T v v o o o Q
• T•
" • I . * * » I j . T , .
0 - , .-,-, . , . , , , . , , , , ,Jan Apr Jul Oct Jan Apr
0 °
V
g °T (
• . .* , , •Jul Oct Jan
1993 1994Fig. 4. Dissolved organic C (DOC) concentrations at 10- and 100-cm soil depths (n = 5) at the ambient and the drought plots from 1993 to 1994.
BORKEN ET AL.: CLIMATE CHANGE SCENARIO FOR CARBON FLUXES FROM A TEMPERATE FOREST SOIL 1853
Table 3. Dissolved organic C (DOC) fluxes for throughfall andseepage water at 10- and 100-cm mineral soil depths at theambient, control, and drought plols.t ___________
DOC
Ambient plot Control plot Drought plotLevel 1993 1994 1993 1994 1993 1994
Throughfall10-cm depth
100-cm depth
106166(15)40(3)
t Standard deviation in
93176(24)46(7)
parentheses.
kgCh i9499(7)28(4)
i ' yr ' —75
105(13)34(6)
4591(6)34(5)
58135(10)30(4)
used the measurements of the ambient plot to evaluateour drought and rewetting effects. Dissolved organic Cfluxes were different between ambient and control plots,but patterns were similar, which is enough to justifycomparison of the drought with the ambient plot. An-nual soil respiration rates were 3015 kg C ha"1 yr"1 in1993 and 3192 kg C ha"1 yr~' in 1994 at the ambientplot. These rates are low compared with the mean fluxrate of 6810 ± 950 kg C ha"1 yr"1 in a wide range oftemperate coniferous forests summarized by Raich andSchlesinger (1992). The prolonged summer drought andsubsequent rewetting of the spruce forest soil at thedrought plot did not affect the annual CO2 emissionrate in 1993, but caused an increase of 51% in 1994.We explain this discrepancy between the years by theduration of the drought combined with the level of soiltemperature during rewetting.
Drought Effects on Carbon Dioxide EmissionSoil respiration was not significantly reduced by
drought treatments. However, our study suggests thatthe cumulative respiration was lower when length ofdrought increased. Natural droughts at the ambient plotmay have reduced the respiration rate of the forest floor,although matric potential at the 10-cm mineral soildepth indicated sufficient water availability. Carlyle andU Ba Than (1988) reported a strong decline in soilrespiration of =70% with decreasing soil moisture in aMonterey pine (Pinus radiata D. Don) stand in south-eastern Australia, but that drought was much more se-vere than in our study. In agreement with our results,they also reported no correlation with temperature dur-ing the drought (Fig. 3).
Several studies in temperate forests summarized bySingh and Gupta (1977) have shown a reduction ofrespiration in the litter layer during dry summer months.Particularly, soils with a thick forest floor are sensitiveto changes in temperature and water availability be-cause this layer contains a large pool of labile organicmatter and a large contribution of living roots. We couldnot differentiate between microbial activity and rootrespiration, the two major sources for soil CO2 emission.We assume that root respiration was not decreased inour drought treatments since fine root growth was notseverely affected (Murach, 1999, personal communica-tion). However, root respiration may have shifted todeeper soil layers to ensure the water supply of the trees
(Feil et al., 1988). Consequently, the reduction in CO2emission was most likely caused by a decrease in hetero-trophic respiration in the dried soil. The relatively smallreduction in CO2 emission caused by droughts points ata dominant role of fungi in acid forest soils instead ofbacteria as primary decomposers (Alexander, 1980).Soil fungi are active down to a water potential of -15MPa, whereas bacteria are already inactive below -1.0to -1.5 MPa (Swift et al., 1979). However, bacteriamaintain a basic metabolism at low moisture contentand may also contribute to the almost constant CO2emissions during the drought treatments.
Rewetting Effects on Carbon Dioxide EmissionRewetting generally caused a strong increase in soil
CO2 emission, agreeing well with the laboratory obser-vations of Orchard and Cook (1983), Seneviratne andWild (1985), and Degens and Sparling (1995). It is un-clear whether this strong increase in soil CO2 emissionis caused by an increase in root or heterotrophic respira-tion. Murach (personal communication, 1999) found anincrease of root growth in the topsoil at the droughtplot with a delay of 4 to 6 wk after rewetting. The initialCO2 flush following rewetting was therefore most likelycaused by enhanced activity of the decomposer commu-nity. Several factors can contribute to this CO2 pulseafter a rewetting. A considerable proportion of soil mi-croorganisms die during drought (van Gestel et al.,1991), and the dead cells can be decomposed quicklyduring a rewetting. In addition, availability of organicsubstrates can increase through desorption from the soilmatrix (Seneviratne and Wild, 1985) and through in-creased exposure of organic surfaces to microorganisms(Birch, 1959). Compared with the sharp peak of CO2after rewetting in the laboratory studies, the peak ofCO2 emission of our field study was delayed and reacheda maximum after 2 to 3 wk. This difference may becaused by the slower rewetting in our field study. Inaddition, soils in laboratory studies are disturbed (cut-ting roots, sieving soils, etc.) which may increase theavailability of C.
The higher CO2 release in 1994 than in 1993 is proba-bly associated with the higher temperature level. In1993, the rewetting was between September and Octo-ber, a period where soil temperature dropped from 11.1to 5.7°C (Fig. 2b). In 1994, soil temperature during thefirst 30 d following rewetting varied between 10.9 and15.7°C. In this year, both soil temperature and moistureconditions were optimal, so that CO2 release was 144%higher than the ambient plot. Obviously, the length ofthe drought period is less important for the CO2 releasethan the moisture and temperature conditions during re-wetting.
Qw Valuesgio values are used to describe the temperature de-
pendence of soil respiration. Carlyle and U Ba Than(1988) showed that during a natural drought period theQw value was low and increased from 0.77 to 2.60 withmoisture availability in a soil temperature range of =5

1854 SOIL SCI. SOC. AM. J., VOL. 63, NOVEMBER-DECEMBER 1999
to 20°C. An inclusion of a moisture-dependent Qw termin their model, FRESP, resulted in a strong agreementbetween measured and fitted values (r2 = 0.85). Weobtained higher Qw values of 3.9 for the ambient plotand 5.7 for the drought plot using the modified Arrhen-ius equation including the water term. These <2io valuesmay represent temperature dependence of soil respira-tion under optimum moisture condition. Our Qw valuesare considerably higher than the median Qw value of2.4 found by Raich and Schlesinger (1992) from seasonalchanges in soil temperature and soil respiration ratesfor various soils under field condition. The Qw valuesin their literature review may include possible moisturelimitations and therefore do not only represent a tem-perature but also a moisture dependency. In addition,(2io values from the literature may be underestimatedbecause Kicklighter et al. (1994) obtained lower Q10values with air temperature (1.99) than with soil temper-ature (3.08). Generally, Qw values appear to be higherin cold regimes and lower under warm regimes. Kirsch-baum (1995) found a temperature dependence for Q10values obtained from CO2 emissions of soil and litterof various climate regions. In this study, the fitted Qwvalues decreased nonlinear from 8 at 0°C to =4.5 at 10°Cand 2.5 at 20°C. In cold regions, microorganisms showa stronger temperature reaction compared with temper-ate or tropical regions because of a high substrate avail-ability during the few summer months when the soilsare thawed. For instance, tundra microorganisms areadapted to low temperatures, but respond to tempera-ture increases like microorganisms elsewhere (Flanaganand Veum, 1974). The results of Kirschbaum (1995) arealso in agreement with our model results because underfield conditions water availability at low temperaturesis normally higher than at high temperatures.
The high Qw values of 5.7 and 5.1 calculated for thedrought plot a direct temperature dependence of soilrespiration but might also be the result of increased Cavailability during rewetting. As a considerable part ofthe CO2 emission is produced in the forest floor, ex-tended summer droughts and rewetting events at hightemperatures may increase soil CO2 emission rates fromforest soils, especially those with a thick O horizon.
Dissolved Organic Carbon FluxesThe DOC input by throughfall and DOC fluxes at
the 10- and 100-cm soil depth were reduced mainly bylower water input at the drought plot (Tables 1 and3). Our drought and rewetting treatment only slightlyreduced the mobilization and degradation of DOC inthe upper soil as indicated by the mobilization rate cal-culated from the difference of DOC input by throughfalland DOC fluxes at the 10-cm soil depth. Natural droughtand rewetting events at the ambient plot led to a similarpattern in DOC concentration at the 10-cm soil depth(Fig. 3). Although the DOC flux at the 10-cm soil depthat the ambient plot was higher than at the drought plot,the annual DOC outputs at 100 cm were similar. Dis-solved organic C leaching from the 10- to 100-cm soildepth increased at the drought plot because of water
flux in macropores during rewetting (Lamersdorf et al.,1998). However, the much lower rates of DOC outputbelow the rhizosphere at both plots suggest that soil hasthe potential to accumulate C in its sublayers. There issome evidence that DOC is absorbed by sesquioxidesin the B horizons and that DOC may play a significantrole for carbon storage in the mineral soil of spruceforests (Zech et al., 1994). This is in agreement with theresults of Quails and Haines (1992) that showed thatthe capacity of microorganisms to degrade DOC is lim-ited and temperature increase does not affect microbialdegradation of DOC. Our results suggest that droughtsand rewettings under changing climate will have only alimited impact on DOC concentrations in groundwater.
Potential Impacts on Carbon StorageAn inventory of tree and root growth at the site
showed no clear difference in litterfall, fine root bio-mass, and tree diameter growth between the ambientplot and the drought plot for both treatment years(Bredemeier et al., 1998). However, a reduced heightgrowth rate of trees was measured during the droughtperiod in 1993 and 1994 (Dohrenbusch et al., 1999).Although litterfall was not reduced, a decrease of lit-terfall may be expected in the following years becauseof the long life span of Norway spruce needles. In thelong run, a decrease of litter production and an increaseof the decomposition rate may reduce the C storageof this forest ecosystem. On the other hand, elevatedatmospheric CO2 concentrations have direct fertiliza-tion effects on tree and root growth (Bazzaz et al., 1990;Johnson et al., 1996; Norby et al., 1992). All of theseprocesses will influence the soil C balance, which mayhave a direct feedback to the atmospheric CO2 concen-tration.
Presently, northern hemisphere temperate forests areconsidered to be a substantial sink of C (Kauppi et al.,1992; Sedjo, 1992; Birdsey et al., 1993; Nakane and Lee,1995). Taylor and Lloyd (1992) estimated a net sinkeffect of 0.33 Pg C yr"1, based on an inventory of temper-ate forests in 1985. In the long run, prolonged summerdroughts may reduce the C storage in temperate, conif-erous forest soils as a result of lower net primary produc-tion and a larger CO2 release during subsequent re-wetting.
ACKNOWLEDGMENTSWe would like to thank Professor E. Veldkamp for invalu-
able discussions and helpful comments. We also thank theInstitute of Bioclimatology of the University of Goettingenfor meterological data we used for hydrological modeling ofwater fluxes. The study was a part of the Environmental Pro-gram Project CT91-0052 financially supported by the Commis-sion of European Communities.

BORKEN ET AL.: CLIMATE CHANGE SCENARIO FOR CARBON FLUXES FROM A TEMPERATE FOREST SOIL 1855