chapter 6. baseline carbon storage and carbon fluxes in ... · chapter 6. baseline carbon storage...
TRANSCRIPT

6.1. Highlights• Carbon storage and fluxes were examined for terrestrial
ecosystems on the seven main Hawaiian Islands: Hawaiʻi, Maui, Molokaʻi, Lānaʻi, Kahoʻolawe, Oʻahu, and Kauaʻi. Total carbon stored in terrestrial ecosystems across these islands was estimated to be 258 TgC, of which 71 percent was soil organic carbon to 1 m depth, 24 percent was live biomass (above and below ground), and 5 percent was dead biomass (a combination of litter and downed woody debris).
• Hawaiʻi Island, the largest island in the Hawaiian archipelago, stored 136 TgC, which accounted for 58 percent of the total carbon storage in the State of Hawaiʻi. The island of Kauaʻi had the highest carbon density (carbon storage per unit area), estimated as 23.5 kgC/m2, followed by Oʻahu (20.5 kgC/m2), Maui (17.1 kgC/m2), Molokaʻi (16.1 kgC/m2), and Hawaiʻi Island (14.0 kgC/m2).
• Live-biomass carbon storage in native forests was estimated as 32 TgC, which was 51 percent of all carbon stored as live biomass (63 TgC), followed by invaded forests (21 TgC) and alien tree plantations (6 TgC).
• Between 2003 and 2014, gross primary production (GPP) across the seven islands averaged 20.2 TgC/yr, with Hawaiʻi Island accounting for 55 percent of this flux (11.2 TgC/yr). As was the case with carbon storage, the island of Kauaʻi had the highest mean annual GPP carbon flux density (GPP per unit land area), estimated
at 1.85 kgC/m2, followed by Molokaʻi (1.68 kgC/m2), Oʻahu (1.47 kgC/m2), Maui (1.34 kgC/m2), and Hawaiʻi Island (1.07 kgC/m2).
• Between 2003 and 2014, the estimates of annual net ecosystem production (NEP) in terrestrial ecosystems across the seven islands averaged 2.38 TgC/yr (a positive value denotes a carbon sink). Among ecosystem types, native forests represented the largest single terrestrial carbon sink with NEP of 1.26 TgC/yr, which accounted for 53 percent of total annual carbon sequestration. Alien grasslands were estimated to be a net carbon source to the atmosphere with NEP estimated at -0.56 TgC/yr, because ecosystem respiration exceeded GPP in large areas of alien dry grasslands.
6.2. IntroductionTerrestrial ecosystems in the tropics have the potential to
be major carbon sinks, yet intensive land use and development can reduce that potential or even convert these ecosystems to net carbon sources to the atmosphere. Because of its steep environmental gradients and geological history, Hawaiʻi has been home to several plot- and stand-level studies examining the physical and biological controls over tropical ecosystem carbon storage and flux, with a focus on soils, live biomass, and plant productivity (Townsend and others, 1995; Torn and others, 1997; Aplet and others, 1998; Herbert and Fownes, 1999; Schuur and others, 2001; Schuur and Matson, 2001; Giardina and others, 2003; Litton and others, 2006; Selmants and others, 2014; Giardina and others, 2014). More recently several landscape-level studies on the Island of Hawaiʻi have examined biotic and environmental controls on aboveground carbon density (ACD) (Asner, Hughes, and others, 2009, Asner and others, 2010, Hughes and others, 2014), including the first whole-island estimate of aboveground carbon stocks for one of the main Hawaiian Islands (Asner and others, 2011). These landscape-scale studies integrated much of the previous research conducted at the plot scale but focused on a limited set of carbon pools or fluxes.
Chapter 6. Baseline Carbon Storage and Carbon Fluxes in Terrestrial Ecosystems of Hawai‘i
By Paul C. Selmants,1 Christian P. Giardina,2 Sinan Sousan,3 David E. Knapp,3 Heather L. Kimball,4 Todd J. Hawbaker,1 Alvaro Moreno,5 Jami Seirer,5 Steve W. Running,5 Tomoaki Miura,6 Rafael Bergstrom,6 R. Flint Hughes,2 Creighton M. Litton,6 and Gregory P. Asner3
1U.S. Geological Survey.2U.S. Department of Agriculture Forest Service.3Carnegie Institution for Science.4University of Hawaiʻi at Hilo.5University of Montana.6University of Hawaiʽi.
Baseline and Projected Future Carbon Storage and Carbon Fluxes in Ecosystems of Hawai‘iEditors: Paul C. Selmants, Christian P. Giardina, James D. Jacobi, and Zhiliang ZhuU.S. Geological Survey Professional Paper 1834, 2017

76 Baseline and Projected Future Carbon Storage and Carbon Fluxes in Ecosystems of Hawai‘i
This chapter represents the first comprehensive assessment of terrestrial-ecosystem carbon stocks and fluxes across the main Hawaiian Islands in an effort to better understand how carbon stocks and fluxes vary by ecosystem component across islands and among ecosystem types. The goal of this chapter is to provide robust baseline estimates of carbon storage and fluxes across the Hawaiian Islands based on the best available data. This baseline data will then be used as input to predict how terrestrial carbon cycling may respond to projected future changes in land use, land cover, disturbance, and climate (see Sleeter and others, this volume, chap. 8).
Conventional carbon cycle terminology (Chapin and others, 2006) was used in this chapter and throughout this report, as noted in Giardina and others (this volume, chap. 1). Of particular relevance here is the concept of net ecosystem production (NEP), which is defined as the imbalance between gross primary production (GPP) and ecosystem respiration (Re). For this report, NEP was estimated by subtracting Re from GPP, therefore, a positive value indicates carbon accumulation or sequestration within an ecosystem (a net carbon sink), and a negative value indicates a loss of carbon from the ecosystem to the atmosphere (a net carbon source). This definition is consistent with that suggested by Chapin and others (2006).
6.3. Input Data and Methods
6.3.1. Carbon StorageInput data, along with the data sources, used to estimate
carbon storage in terrestrial ecosystems of Hawaiʻi are listed in table 6.1. Each input dataset was converted to a standard projection and data format. For this report, estimated carbon stocks include aboveground live-biomass carbon,
live-root-biomass carbon, dead-biomass carbon (the sum of surface litter and downed woody debris carbon), and soil organic carbon (SOC). Live- and dead-biomass carbon stocks were estimated only for forests (including alien tree plantations), grasslands, shrublands, and barren-to-sparsely vegetated areas as delineated by the land-cover map from Jacobi and others (this volume, chap. 2). Collectively, these four land-cover types constitute about 88 percent of the total land area of the main Hawaiian Islands. Developed areas (6 percent of total land area), agriculture (5 percent of total land area), and wetlands (1 percent of total land) made up the remaining 12 percent of land area for which there was insufficient Hawaiʻi-specific data to estimate carbon storage in live and dead biomass. SOC data covers 100 percent of the land area on the seven main Hawaiian Islands, so we included SOC data from developed areas, agriculture, and wetlands in islandwide and statewide estimates of ecosystem carbon storage. Land-cover classes from Jacobi and others (this volume, chap. 2) were aggregated into broader categories for ease of analysis and interpretation. Specifically, all grasslands were combined into a single grassland category, all shrublands were combined into a single shrubland category, alien and mixed forest types were combined into an “invaded forest” category, and mesic and wet forests were combined into a “mesic and wet forest” category.
Aboveground biomass carbon of forest ecosystems for each island and forest cover type was estimated using a new map of forest ACD across the seven main Hawaiian Islands (Asner and others, 2016). The forest ACD map was constructed using a combination of airborne light detection and ranging (lidar) data from Hawaiʻi Island, freely available satellite data covering all the major islands, and the land-cover map described in Jacobi and others (this volume, chap. 2). Lidar estimates of forest top-of-canopy height (TCH) covering 3,793 km2 over all major forest types on Hawaiʻi Island (Asner and others, 2011) was used to train a geospatial model that incorporated forest canopy fractional cover and other structural metrics derived from Landsat data as well as several environmental factors (Asner, Knapp, and others,
Table 6.1. Input data used to estimate carbon storage in terrestrial ecosystems of Hawai‘i.
[LULC, land use and land cover]
Data category Data type Data sourceLULC LULC classes Jacobi and others (this volume, chap.2)Soils Soil organic carbon gSSURGO (Soil Survey Staff, 2015)Forests, tree plantations Aboveground biomass carbon Asner and others (2016)
Litter carbon Hawbaker and others (this volume, chap. 5)Downed woody debris carbon Hawbaker and others (this volume, chap. 5)
Shrublands, grasslands Aboveground biomass carbon Hawbaker and others (this volume, chap. 5)Litter carbon Hawbaker and others (this volume, chap. 5)Downed woody debris carbon Hawbaker and others (this volume, chap. 5)

6.3. Input Data and Methods 77
2009). This model was then applied to all the islands using the same set of canopy structural and environmental metrics to yield a multi-island map of forest TCH at 30-m spatial resolution. A landscape-level equation relating TCH to ACD was applied, resulting in a forest ACD map at 30-m resolution for the seven main Hawaiian Islands. This statewide ACD map was validated using ground-level estimates of ACD derived from Forest Inventory and Analysis plots maintained by the U.S. Department of Agriculture Forest Service that were located on Hawaiʻi Island, Maui, Molokaʻi, Oʻahu, and Kauaʻi. See Asner and others (2016) for a more detailed description of the Hawaiʻi forest ACD map.
Aboveground biomass carbon in shrublands and grasslands was estimated by multiplying median values for each biome type (from the biomass database in Hawbaker and others, this volume, chap. 5) by the land area of that biome type as delineated by the land-use and land-cover (LULC) map from Jacobi and others (this volume, chap. 2). Litter and downed-woody-debris carbon were estimated for forests, shrublands, and grasslands by taking the median values for each biome type in the biomass database from Hawbaker and others (this volume, chap. 5) and multiplying by the land area covered by that biome type.
Live-root biomass for forests and tree plantations was estimated using the power law equation listed in table 6.2 (Mokany and others, 2006). Root-to-shoot ratios of tropical grasslands are typically much lower than those of temperate grasslands (Mokany and others, 2006), and the root-to-shoot ratios of the African grass species that dominate Hawaiian grasslands are lower still because of their high biomass allocation to leaves (Williams and Black, 1994; Williams and Baruch, 2000; Neto and others, 2012). Live-root-biomass carbon of grasslands in Hawaiʻi was estimated by averaging the global median root-to-shoot ratio for tropical and subtropical grasslands (Mokany and others, 2006) with published root-to-shoot ratios of native and alien African grasses in Hawaiʻi (Williams and Black, 1994; Neto and others, 2012) and then multiplying this derived root-to-shoot ratio by the estimate of aboveground live-biomass carbon for Hawaiian grasslands (table 6.2). A similar approach was used to estimate live-biomass carbon of shrublands. The global median root-to-shoot values for shrubland and tropical arid shrubland/desert were averaged and then multiplied by the estimate of aboveground live-biomass carbon for Hawaiian shrublands (table 6.2).
Estimates of SOC to a depth of 1 m at 10-m spatial resolution were derived from the USDA Natural Resources Conservation Service (NRCS) gridded Soil Survey Geographic (gSSURGO) Database (Soil Survey Staff, 2015) for the State of Hawaiʻi. The spatial resolution of the gSSURGO dataset was resampled to 30-m raster cell size in Esri ArcGIS ver. 10.1 to align with the spatial resolution of the LULC map from Jacobi and others (this volume, chap. 2). Unlike other datasets used to estimate carbon stocks, the gSSURGO dataset covers the entire land area of the seven islands included in this report, including developed areas, agriculture areas, and wetlands. Soil organic carbon data for all land-cover types was included in islandwide and statewide estimates of SOC and total ecosystem carbon storage.
6.3.2. Carbon FluxesGPP on the seven islands included in this report was
estimated using data and algorithms from the Moderate Resolution Imaging Spectroradiometer (MODIS) project (Running and others, 2004; Zhao and others, 2005). MODIS-derived estimates of GPP (MOD17) use time series of the fraction of absorbed photosynthetically active radiation (fAPAR) and regional coarse-resolution meteorological data as inputs and then use biome-specific radiation-use efficiency (ε) coefficients to translate absorbed photosynthetically active radiation (APAR) in energy units to GPP, the total mass of carbon fixed by photosynthesis per unit area per unit time. For this report, the global MOD17 algorithm was adapted by incorporating the Hawaiʻi-specific land-cover map from Jacobi and others (this volume, chap. 2), locally derived 250-m-resolution meteorological data, and 500-m-resolution MODIS ver. 6 fAPAR data processed with a specifically adapted filtering and gap-filling technique to deal with the high prevalence of clouds in some areas.
The MOD17 algorithm relies heavily on accurate representations of land-cover type to apply biome-specific values of ε. Globally, the MODIS land-cover product (MOD12Q1) is accurate to within 65–80 percent, with higher accuracies in pixels that are largely homogeneous. However, Hawaiʻi is a discontinuous landmass with very heterogeneous land cover. To maximize the accuracy of land-cover-type assignment, a Hawaiʻi-specific biome map was developed by re-sampling the carbon assessment for Hawaiʻi (CAH) land-cover map (Jacobi and others, this volume, chap. 2) to 500-meter pixel resolution using the majority method in ArcGIS ver. 10.2.2 and then assigning each HIGAP vegetation type to 1 of the 16 land-cover classes in MOD12Q1. This Hawaiʻi-specific biome map represented a substantial improvement in land-cover classification compared to the MOD12Q1 product; there was only about a 50 percent agreement between the two overall, with about 86 percent agreement for broadleaf evergreen forest, 27 percent agreement for grasslands, and 25 percent agreement for shrublands (table 6.1).
The MOD17 algorithm uses air temperature (Tair) and vapor pressure deficit (VPD) data to calculate attenuating scalars to produce a biome-specific radiation-use efficiency coefficient, ε. The biome-specific values for ε are combined
Ecosystem Equation or Ratio Source
Forests, tree plantations
y = 0.489x0.89 Mokany and others (2006)
Shrublands 1.45 Mokany and others (2006) Grasslands 0.73 Williams and Black (1994),
Mokany and others (2006), Neto and others (2012)
Table 6.2. Equation or ratio used to estimate live-root biomass from aboveground live biomass by ecosystem type.
[y = root live biomass; x = aboveground live biomass]
78 Baseline and Projected Future Carbon Storage and Carbon Fluxes in Ecosystems of Hawai‘i
with estimates of APAR to calculate GPP, where APAR is calculated as
APAR = incident PAR × fAPAR
where incident PAR is estimated by multiplying incident short-wave radiation by 0.45, and fAPAR is the fraction of absorbed photosynthetically active radiation.
Normally, coarse-resolution Tair, VPD, and incident shortwave radiation data from the NASA GMAO dataset are used for these calculations. For this report, mean monthly Tair, VPD, and incident shortwave radiation at 250-m pixel resolution from the Climate Atlas of Hawaiʻi (Giambelluca and others, 2014) were degraded to 500-m pixel resolution and used to calculate APAR and attenuating scalars for ε. Finally, the fAPAR time series was processed with an iteratively reweighted local regression filter (LOESS) to reduce noise and fill gaps caused by persistent cloud cover in some areas of the seven main Hawaiian Islands (Moreno and others, 2014). The resulting estimate of mean annual GPP represents a 10-year period from 2004 to 2013.
Estimates of Re and NEP were calculated by modeling the relationship between GPP and Re from literature values and applying these relationships to the MODIS-derived estimate of mean annual GPP for the seven main Hawaiian Islands. A grid of points at 500-m distance centered on each MODIS pixel was intersected with the MODIS GPP data layer, and GPP values were extracted to these points using ArcGIS ver. 10.1. Regression equations of the relationship between GPP and Re were derived based on published values from broad-leaved evergreen forests, grasslands, and other ecosystems (table 6.3). These regression
equations were applied to the GPP point values across the seven islands included in this report to estimate Re, and NEP for each point was estimated by subtracting Re from GPP. The grid of points with Re and NEP values assigned was then rasterized at 500-m resolution using ArcGIS ver. 10.1.
6.4. Results and Discussion
6.4.1. Baseline Carbon StocksStatewide, the total carbon storage in terrestrial ecosystems
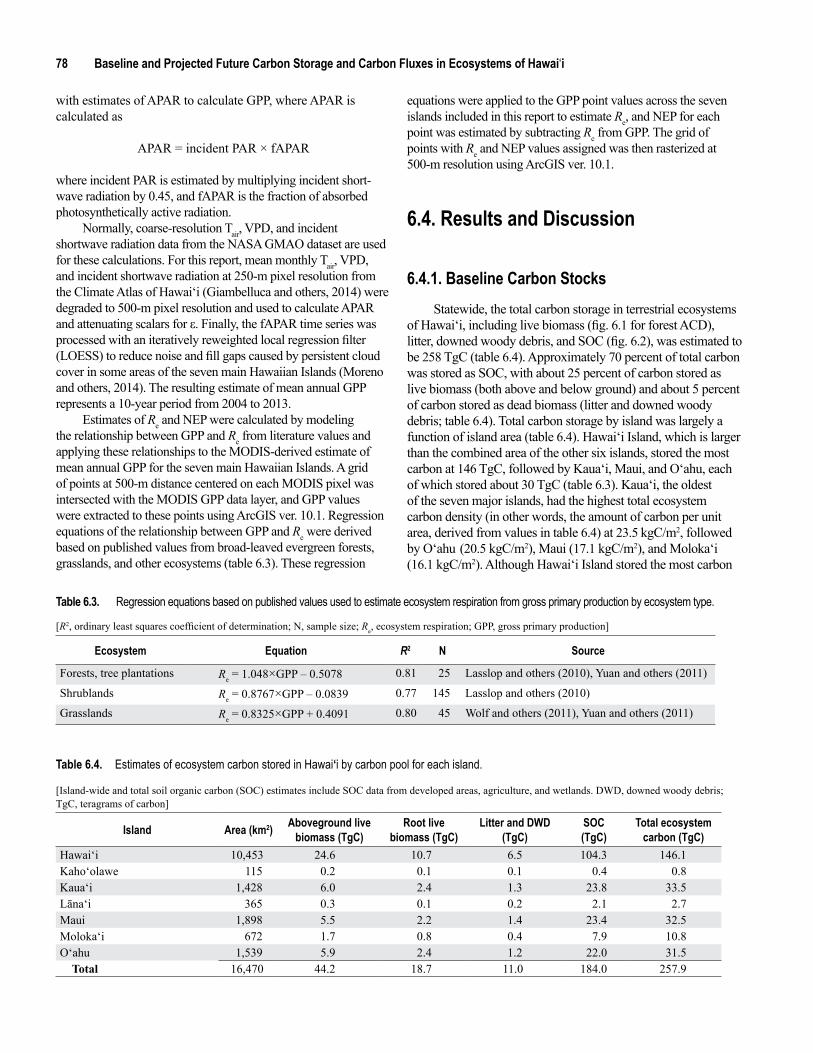
of Hawaiʻi, including live biomass (fig. 6.1 for forest ACD), litter, downed woody debris, and SOC (fig. 6.2), was estimated to be 258 TgC (table 6.4). Approximately 70 percent of total carbon was stored as SOC, with about 25 percent of carbon stored as live biomass (both above and below ground) and about 5 percent of carbon stored as dead biomass (litter and downed woody debris; table 6.4). Total carbon storage by island was largely a function of island area (table 6.4). Hawaiʻi Island, which is larger than the combined area of the other six islands, stored the most carbon at 146 TgC, followed by Kauaʻi, Maui, and Oʻahu, each of which stored about 30 TgC (table 6.3). Kauaʻi, the oldest of the seven major islands, had the highest total ecosystem carbon density (in other words, the amount of carbon per unit area, derived from values in table 6.4) at 23.5 kgC/m2, followed by Oʻahu (20.5 kgC/m2), Maui (17.1 kgC/m2), and Molokaʻi (16.1 kgC/m2). Although Hawaiʻi Island stored the most carbon
Ecosystem Equation R2 N Source
Forests, tree plantations Re = 1.048×GPP – 0.5078 0.81 25 Lasslop and others (2010), Yuan and others (2011)
Shrublands Re = 0.8767×GPP – 0.0839 0.77 145 Lasslop and others (2010)
Grasslands Re = 0.8325×GPP + 0.4091 0.80 45 Wolf and others (2011), Yuan and others (2011)
[R2, ordinary least squares coefficient of determination; N, sample size; Re, ecosystem respiration; GPP, gross primary production]
Table 6.3. Regression equations based on published values used to estimate ecosystem respiration from gross primary production by ecosystem type.
Island Area (km2) Aboveground live biomass (TgC)
Root live biomass (TgC)
Litter and DWD(TgC)
SOC(TgC)
Total ecosystem carbon (TgC)
Hawaiʻi 10,453 24.6 10.7 6.5 104.3 146.1Kahoʻolawe 115 0.2 0.1 0.1 0.4 0.8Kauaʻi 1,428 6.0 2.4 1.3 23.8 33.5Lānaʻi 365 0.3 0.1 0.2 2.1 2.7Maui 1,898 5.5 2.2 1.4 23.4 32.5Molokaʻi 672 1.7 0.8 0.4 7.9 10.8Oʻahu 1,539 5.9 2.4 1.2 22.0 31.5 Total 16,470 44.2 18.7 11.0 184.0 257.9
Table 6.4. Estimates of ecosystem carbon stored in Hawai‘i by carbon pool for each island.
[Island-wide and total soil organic carbon (SOC) estimates include SOC data from developed areas, agriculture, and wetlands. DWD, downed woody debris; TgC, teragrams of carbon]
6.4. Results and Discussion 79
Selm
ants
_fig
1_ch
ap6
EXPL
ANAT
ION
Fore
st ab
oveg
roun
dca
rbon
den
sity,
in kg
C/m
2
>20
10 <1
010
2030
MILE
S
010
2030
4050
KILO
METE
RS
N
155°
00'
155°
20'
155°
40'
155°
40'
156°
00'
20°0
0'20
°00'
19°4
0'
19°2
0'
19°0
0'
156°
10'
156°
20'
156°
30'
156°
30'
156°
40'
156°
40'
156°
50'
156°
50'
157°
00'
157°
10'
21°1
0'
21°0
0'
20°5
0'20
°50'
20°4
0'
20°3
0'
157°
40'
157°
50'
158°
00'
158°
00'
158°
10'21
°40'
21°3
0'
21°2
0'
159°
20'
159°
30'
159°
40'
22°1
0'
22°0
0'22
°00'
22°1
0'Ha
wai‘i
Molo
ka‘i Lāna‘i
O‘ah
u
Maui
Kaho
‘olaw
e
Kaua
‘i
STAT
E OF
HAW
AI‘I
Hawa
i‘i
O‘ah
uMa
ui
Kaua
‘i
Shad
ed-re
lief b
ase m
odifie
d fro
m U.
S. G
eolog
ical S
urve
y Nati
onal
Elev
ation
Data
set, 2
015.
Figu
re 6.
1. Ma
ps sh
owing
forest aboveground c
arbon d
ensity for the S
tate o
f Haw
ai‘i (d
ata from
Asner an
d othe
rs, 20
16). kgC/m2 ,
kilograms
of ca
rbon pe
r square m
eter.

80 Baseline and Projected Future Carbon Storage and Carbon Fluxes in Ecosystems of Hawai‘i
Selm
ants
_fig
2_ch
ap6
EXPL
ANAT
ION
Soil o
rgan
ic ca
rbon
in kg
C/m
2
65 45 22.5
0
010
2030
MILE
S
010
2030
4050
KILO
METE
RS
N
155°
00'
155°
20'
155°
40'
155°
40'
156°
00'
20°0
0'20
°00'
19°4
0'
19°2
0'
19°0
0'
156°
10'
156°
20'
156°
30'
156°
30'
156°
40'
156°
40'
156°
50'
156°
50'
157°
00'
157°
10'
21°1
0'
21°0
0'
20°5
0'20
°50'
20°4
0'
20°3
0'
157°
40'
157°
50'
158°
00'
158°
00'
158°
10'21
°40'
21°3
0'
21°2
0'
159°
20'
159°
30'
159°
40'
22°1
0'
22°0
0'22
°00'
22°1
0'Ha
wai‘i
Molo
ka‘i Lāna‘i
O‘ah
u
Maui
Kaho
‘olaw
e
Kaua
‘i
STAT
E OF
HAW
AI‘I
Hawa
i‘i
O‘ah
uMa
ui
Kaua
‘i
Shad
ed-re
lief b
ase m
odifie
d fro
m U.
S. G
eolog
ical S
urve
y Nati
onal
Elev
ation
Data
set, 2
015.
Figu
re 6.
2. Ma
ps sh
owing
soil o
rganic carbon to 10
0-cm
depth
for the State o
f Haw
ai‘i; the da
ta we
re de
rived from
the g
ridded S
oil Survey G
eographic
(gSS
URGO
) Data
base (S
oil Survey
Staff, 2015). kgC
/m2 , kilograms
of ca
rbon pe
r square m
eter.

6.4. Results and Discussion 81
overall, its estimated carbon density of 14 kgC/m2 was low compared to other islands because approximately 27 percent of its total land area (~2,800 km2) is classified as “bare ground” consisting of alpine tundra and relatively recent lava flows with sparse vegetation and little to no soil development (see Jacobi and others, this volume, chap. 2). Only Kahoʻolawe and Lānaʻi (~7 kgC/m2 each), both relatively arid islands with long histories of land-cover conversion, had carbon densities lower than Hawaiʻi Island.
Native mesic and wet forests stored the highest amount of total carbon among ecosystem types, estimated as 96.3 TgC. Approximately 61 percent of the total carbon in native mesic and wet forests was in soil, 33 percent in live biomass, and 6 percent in dead biomass (table 6.5). In contrast, grasslands, shrublands, and bare ground, which together cover nearly three times the total area of native mesic and wet forests, combined to store a total of only 67.9 TgC, about 30 percent less than in native mesic and wet forests (table 6.5). Total carbon of invaded mesic and wet forests was about half the total carbon stored in native mesic and wet forests (49.6 TgC), primarily because invaded mesic and wet forests covered about half the total land area of native mesic and wet forests. Of total carbon in invaded mesic and wet forests, approximately 56 percent was in soil, 39 percent was in
live biomass, and 5 percent was in dead biomass—a distribution similar to that of native mesic and wet forests. Invaded mesic and wet forests had a similar overall carbon density as native mesic and wet forests (31 and 32 kgC/m2, respectively). Native and invaded dry forests also had similar total carbon densities, estimated as 7.6 and 8.3 kgC/m2, respectively, but invaded dry forests had a higher proportion of total carbon in live biomass (24 percent) compared to native dry forests (13 percent). Alien tree plantations had the highest total carbon density of any ecosystem type, estimated as 45.7 kgC/m2, but constituted a relatively small land area (243 km2) (table 6.5). In contrast, bare ground covered the largest land area of the ecosystem types listed in table 6.5, but had the lowest estimated total carbon density at 1.9 kgC/m2.
6.4.2. Baseline Carbon FluxesMean annual GPP of terrestrial ecosystems in the
State of Hawaiʻi was estimated as 20.2 TgC/yr for the years 2003–2014 (fig. 6.3; table 6.6). Approximately 88 percent of the carbon fixed annually by GPP was respired back to the atmosphere (17.8 TgC/yr) as the combination of autotrophic and heterotrophic respiration. Terrestrial ecosystems of Hawaiʻi
Ecosystem Area (km2) Aboveground live biomass (TgC)
Root live biomass (TgC)
Litter and DWD (TgC)
SOC (TgC)
Total ecosystem carbon (TgC)
Native dry forest 302 0.2 0.1 0.2 1.8 2.3Invaded dry forest 635 1.0 0.5 0.5 3.6 5.6Native mesic–wet forest 3,148 22.8 9.0 5.6 58.9 96.3Invaded mesic–wet forest 1,529 13.9 5.3 2.7 27.6 49.5Alien tree plantations 243 4.4 1.6 0.3 5.1 11.4Shrublands 2,719 1.2 1.7 1.0 20.6 24.5Grasslands 2,783 0.7 0.5 0.6 35.6 37.4Bare (sparse vegetation) 3,111 < 0.1 < 0.1 0.1 5.7 5.9 Total 14,470 44.2 18.7 11.0 158.9 232.9
Table 6.5. Estimates of ecosystem carbon stored in Hawai‘i by carbon pool for each ecosystem type.
Table 6.6. Estimates of gross primary production, ecosystem respiration, and net ecosystem production by island.
[DWD, downed woody debris; SOC, soil organic carbon; TgC, teragrams of carbon]
[Data are mean annual fluxes for the years 2004–2013. GPP, gross primary production; Re, ecosystem respiration; NEP, net ecosystem production; TgC/yr, teragrams of carbon per year]
Island Area (km2) GPP (TgC/yr) Re (TgC/yr) NEP (TgC/yr)Hawaiʻi 10,453 11.19 10.02 1.17Kahoʻolawe 115 0.06 0.05 0.01Kauaʻi 1,429 2.64 2.29 0.35Lānaʻi 365 0.37 0.32 0.05Maui 1,898 2.54 2.25 0.29Molokaʻi 672 1.13 0.93 0.20Oʻahu 1,539 2.26 1.94 0.32 Total 16,470 20.19 17.81 2.38

82 Baseline and Projected Future Carbon Storage and Carbon Fluxes in Ecosystems of Hawai‘i
Selm
ants
_fig
3_ch
ap6
010
2030
MILE
S
010
2030
4050
KILO
METE
RS
N
155°
00'
155°
20'
155°
40'
155°
40'
156°
00'
20°0
0'20
°00'
19°4
0'
19°2
0'
19°0
0'
156°
10'
156°
20'
156°
30'
156°
30'
156°
40'
156°
40'
156°
50'
156°
50'
157°
00'
157°
10'
21°1
0'
21°0
0'
20°5
0'20
°50'
20°4
0'
20°3
0'
157°
40'
157°
50'
158°
00'
158°
00'
158°
10'21
°40'
21°3
0'
21°2
0'
159°
20'
159°
30'
159°
40'
22°1
0'
22°0
0'22
°00'
22°1
0'Ha
wai‘i
Molo
ka‘i Lā
na‘i
O‘ah
u
Maui
Kaho
‘olaw
e
Kaua
‘i
STAT
E OF
HAW
AI‘I
Hawa
i‘i
O‘ah
uMa
ui
Kaua
‘i
EXPL
ANAT
ION
Gros
s prim
ary
prod
uctio
n, in
kgC/
m2 /yr
3.88
2.63
1.38
0.13
Shad
ed-re
lief b
ase m
odifie
d fro
m U.
S. G
eolog
ical S
urve
y Nati
onal
Elev
ation
Data
set, 2
015.
Figu
re 6.
3. Ma
ps sh
owing
annual gross p
rimary p
roduction for the ye
ars 2
004–2013 in the S
tate o
f Haw
ai‘i; the da
ta we
re de
rived from
the M
oderate
Resolu
tion Ima
ging S
pectroradiom
eter
(MOD
IS) w
ith modifie
d land c
over ba
sed o
n the map from
Jacobi and o
thers (this volum
e, chap. 2) and local m
eteorolo
gical estim
ates from Giam
belluca an
d othe
rs (2014). kgC
/m2 /yr, k
ilogram
s of
carbon pe
r square m
eter per ye
ar.

6.4. Results and Discussion 83
were estimated to sequester an average of 2.38 TgC/yr for the years 2003–2014. Similar to trends for carbon storage, total annual carbon fluxes by island were largely a function of island area. Hawaiʻi Island, the largest of the seven islands considered in this report (~64 percent of the total land area), was estimated to have the highest mean annual GPP (11.2 TgC/yr) and Re (10 TgC/yr) for the period 2003–2014. Hawaiʻi Island was also the largest carbon sink with an estimated mean annual NEP of 1.17 TgC/yr, which represented approximately 50 percent of the total annual terrestrial-ecosystem carbon sink of the seven main Hawaiian Islands. Maui, Oʻahu, and Kauaʻi each represented approximately 8–12 percent of the total land area of the seven islands considered in this report, and each contributed approximately 10–14 percent of the estimated total carbon sink. Collectively, the islands of Maui, Oʻahu, and Kauaʻi accounted for about 37 percent of both GPP and NEP. Kauaʻi had the highest GPP carbon flux density (carbon flux per unit area), estimated at 1.85 kgC/m2/yr. Although Hawaiʻi Island exhibited the highest total GPP, its estimated GPP carbon flux density was
only 1.1 kgC/m2/yr, approximately 40 percent lower than that of Kauaʻi. Only Lānaʻi (1.0 kgC/m2/yr) and Kahoʻolawe (0.5 kgC/m2/yr) had lower GPP carbon flux densities than Hawaiʻi Island. Carbon-sink strength per unit area (NEP carbon flux density) followed a similar pattern; Kauaʻi was estimated to have the highest carbon-sink strength per unit area (NEP carbon flux density = 0.25 kgC/m2/yr), and Kahoʻolawe had the lowest carbon-sink strength per unit area (NEP carbon flux density = 0.09 kgC/m2/yr).
Native mesic and wet forests accounted for approxi-mately 35 percent of total terrestrial GPP, and invaded mesic and wet forests and grasslands each accounted for 16–18 percent of total GPP (table 6.7). Native mesic and wet forests represented the largest carbon sink of any ecosystem type, accounting for approximately 50 percent of estimated mean annual NEP for the years 2003–2014 (table 6.7). In contrast, grasslands were estimated to be a net carbon source to the atmosphere for the years 2003–2014 because Re exceeded GPP in dry grasslands (fig. 6.4).
Table 6.7. Estimates of gross primary production, ecosystem respiration, and net ecosystem production by ecosystem type.
[Data are mean annual fluxes for the years 2004–2013. GPP, gross primary production; Re, ecosystem respiration; NEP, net ecosystem production; TgC/yr, teragrams of carbon per year]
Ecosystem Area (km2) GPP (TgC/yr)
Re (TgC/yr)
NEP (TgC/yr)
Native dry forest 302 0.34 0.25 0.09Invaded dry forest 635 0.70 0.60 0.11Native mesic–wet forest 3,148 7.05 5.89 1.17Invaded mesic–wet forest 1,529 3.63 3.13 0.50Alien tree plantations 243 0.65 0.54 0.11Shrublands 2,719 4.65 3.69 0.96Grasslands 2,783 3.17 3.72 -0.56Bare (sparse vegetation) 3,111 0 0 0 Total 14,470 20.19 17.81 2.38

84 Baseline and Projected Future Carbon Storage and Carbon Fluxes in Ecosystems of Hawai‘i
Selm
ants
_fig
4_ch
ap6
Hawa
i‘i
Molo
ka‘i Lā
na‘i
O‘ah
uKa
ua‘i
Maui
Kaho
‘olaw
e
EXPL
ANAT
ION
Net e
cosy
stem
prod
uctio
n, in
kgC/
m2 /yr
0.56
0.25
-0.07
-0.38
010
2030
MILE
S
010
2030
4050
KILO
METE
RS
155°
00'
155°
20'
155°
40'
155°
40'
156°
00'
20°0
0'20
°00'
19°4
0'
19°2
0'
19°0
0'
156°
10'
156°
20'
156°
30'
156°
30'
156°
40'
156°
40'
156°
50'
156°
50'
157°
00'
157°
10'
21°1
0'
21°0
0'
20°5
0'20
°50'
20°4
0'
20°3
0'
157°
40'
157°
50'
158°
00'
158°
00'
158°
10'21
°40'
21°3
0'
21°2
0'0"N
159°
20'
159°
30'
159°
40'
22°1
0'
22°0
'22
°00'
N
STAT
E OF
HAW
AI‘I
Hawa
i‘i
O‘ah
uMa
ui
Kaua
‘i
Shad
ed-re
lief b
ase m
odifie
d fro
m U.
S. G
eolog
ical S
urve
y Nati
onal
Elev
ation
Data
set, 2
015.
Figu
re 6.
4. Ma
ps sh
owing
mean a
nnual net ecosystem
production for the y
ears 2003–2014 in the State o
f Haw
ai‘i; the da
ta we
re es
timate
d by s
ubtracting regressio
n-derived es
timate
s of
ecosystem
respiration from estim
ates o
f gross primary p
roduction de
rived from
the M
ODIS sa
tellite
(see fig
. 6.3). kgC
/m2 /yr, k
ilogram
s of carbon p
er sq
uare mete
r per ye
ar.

6.5. Summary, Limitations, and Uncertainty 85
6.5. Summary, Limitations, and Uncertainty
Aside from the recently published statewide forest ACD map (Asner and others, 2016), previous efforts quantifying carbon stocks and fluxes in terrestrial ecosystems in Hawaiʻi have been confined to the plot level (Herbert and Fownes, 1999; Schuur and others, 2001; Schuur and Matson, 2001; Giardina and others, 2003; Litton and others, 2006; Selmants and others, 2014; Giardina and others, 2014), the landscape level (Asner, Hughes, and others, 2009; Asner and others, 2010; Hughes and others, 2014), or, at most, the island level (Asner and others, 2011). This report represents the first comprehensive effort to quantify carbon stocks and carbon fluxes in terrestrial ecosystems across the seven main Hawaiian Islands.
Overall estimates of carbon storage are relatively well constrained, particularly data related to forest aboveground biomass carbon and SOC, but knowledge gaps exist. Estimates of forest aboveground biomass carbon were validated with statewide plot-level estimates (Asner and others, 2016). The current estimate of aboveground live-biomass carbon for Hawaiʻi Island in this report (22.8 TgC) is about 20 percent lower than a previous estimate of 28.3 TgC made by Asner and others (2011). The SOC data product, which is a statewide interpolation of soil survey data points over several decades, represents the most detailed soil geographic data available for the State of Hawaiʻi. In contrast, published studies that provided plot-level estimates of shrubland and grassland aboveground live-biomass carbon and dead-biomass carbon (downed woody debris and litter) were not evenly distributed across islands or climatic zones, and so the islandwide and statewide estimates of these carbon stocks should be used with caution. Shrublands in particular are poorly represented in the dataset of published values (Hawbaker and others, this volume, chap. 5) relative to their land area. However, shrubland and grassland ecosystems typically have relatively low biomass carbon densities compared to forest ecosystems, and SOC makes up the majority of ecosystem carbon in shrublands and grasslands, so uncertainty related to biomass carbon storage in shrubland and grassland vegetation types is unlikely to exert substantial influence on islandwide or statewide estimates of total ecosystem carbon storage. Estimates of live-root biomass are derived from global root-to-shoot relationships for particular ecosystem types, and so any errors in estimates of aboveground biomass carbon are propagated to estimates of belowground live biomass. In addition, although there is no evidence that native and nonnative plant species in Hawaiʻi differ in their root-to-shoot ratios from plant species found elsewhere, the global root-to-shoot relationships used to estimate live-root biomass may not accurately represent those of plants growing in the Hawaiian Islands. Finally, islandwide and statewide estimates of total ecosystem carbon storage do not include estimates of live biomass, litter, and downed-woody-debris carbon in agriculture, developed areas, and wetlands, which make up about 12 percent of land area statewide. Litter and downed-woody-debris carbon are likely minimal in agriculture and developed areas, and live-biomass carbon is transitory in agricultural areas and of low density in developed areas. Soil organic carbon likely makes up most ecosystem carbon in agriculture areas, developed areas, and
wetlands, but the lack of data on live biomass and detritus carbon in these areas may have resulted in an underestimate of islandwide and statewide ecosystem carbon storage and overly high estimates of the proportion of ecosystem carbon stored as SOC.
There are currently no published islandwide or statewide estimates of carbon fluxes (for example, GPP, Re, NEP) for the State of Hawaiʻi, and so it was not possible to compare current estimates to previous efforts at similar scales. However, at the plot level, Giardina and others (2003) estimated whole-ecosystem carbon budgets for Eucalyptus (Eucalyptus saligna) plantations in multiple 900 m2 plots for several years on the windward side of the Island of Hawaiʻi. They estimated a mean annual GPP carbon flux density of 2.95 kgC/m2/yr (Giardina and others, 2003), which is 10 percent higher than statewide MODIS-derived estimates of GPP carbon flux density for alien tree plantations (2.68 kgC/m2/yr), 25 percent higher than estimates for invaded mesic-to-wet forests (2.37 kgC/m2/yr), and about 30 percent higher than native mesic-to-wet forests (2.24 kgC/m2/yr).
Estimates of Re in this report are from regression equations based on the relationship between GPP and Re derived from eddy flux towers, none of which were located in Hawaiʻi (Lasslop and others, 2010; Wolf and others, 2011; Yuan and others, 2011). Therefore, statewide values of Re and NEP may be the least well constrained of all carbon stock and flux estimates in this chapter. Plot-level estimates of Re carbon flux density in Eucalyptus plantations from Giardina and others (2003) were higher (2.27 kgC/m2/yr) than statewide estimates of Re carbon flux density in both alien tree plantations (2.22 kgC/m2/yr) and invaded mesic-to-wet forests (2.05 kgC/m2/yr). However, plot-level estimates of Re in young Eucalyptus plantations accounted for about 77 percent of GPP, whereas statewide estimates of carbon flux density for Re in alien tree plantations and alien mesic-to-wet forests accounted for about 83–85 percent of GPP. The estimated statewide Re carbon flux density in native mesic-to-wet forests was 1.87 kgC/m2/yr, about 20 percent lower than the plot-level Eucalyptus estimates, but Re made up a greater proportion of GPP in native mesic-to-wet forests (approximately 84 percent) than in the young Eucalyptus plantations (Giardina and others, 2003). Taken together, the comparative relationship of Re and NEP among these forest types yields reasonable results. Older, more established forest stands should lose a greater proportion of GPP as respiration, given their higher proportion of structural tissues relative to leaf area and less efficient foliage caused by hydraulic limitation of water transport in taller trees. However, the eddy covariance technique generally underestimates Re lost to the atmosphere on an annual basis, which may result in overestimates of NEP and annual carbon sequestration. This represents an important caveat to the estimates of Re in this chapter, in addition to the fact that relationships between GPP and Re are derived from eddy flux towers in ecosystems outside of Hawaiʻi.
The data on ecosystem carbon stocks and fluxes presented in this chapter should prove useful to the scientific community, land managers, and policy stakeholders in a variety of applications. However, caution should be exercised when using data and conclusions in this chapter by considering the constraints and uncertainties noted above.

86 Baseline and Projected Future Carbon Storage and Carbon Fluxes in Ecosystems of Hawai‘i
6.6. References CitedAplet, G.H, Hughes, R.F., and Vitousek, P.M., 1998, Ecosystem
development on Hawaiian lava flows—biomass and species composition: Journal of Vegetation Science, v. 9, no. 1, p. 17–26, available at http://dx.doi.org/10.2307/3237219.
Asner, G.P., Hughes, R.F., Mascaro, J., Uowolo, A.L., Knapp, D.E., Jacobson, James, Kennedy-Bowdoin, T., and Clark, J.K., 2011, High-resolution carbon mapping on the million-hectare Island of Hawaii: Frontiers in Ecology and the Environment, v. 9, no. 8, p. 434–439, available at http://dx.doi.org/10.1890/100179.
Asner, G.P., Hughes, R.F., Varga, T.A., Knapp, D.E., and Kennedy-Bowdoin, T., 2009, Environmental and biotic controls over aboveground biomass throughout a tropical rain forest: Ecosystems, v. 12, no. 2, p. 261–278, available at http://dx.doi.org/10.1007/s10021-008-9221-5.
Asner, G.P., Knapp, D.E., Balaji, A., Paez-Acosta, G., 2009, Automated mapping of tropical deforestation and forest degradation—CLASlite: Journal of Applied Remote Sensing, v. 3, no. 1, p. 033543, available at http://dx.doi.org/10.1117/1.3223675.
Asner, G.P., Martin, R.E., Knapp, D.E., and Kennedy-Bowdoin, T., 2010, Effects of Morella faya tree invasion on aboveground carbon storage in Hawaii: Biological Invasions, v. 12, no. 3, p. 477–494, available at http://dx.doi.org/10.1007/s10530-009-9452-1.
Asner, G.P., Sousan, S., Knapp, D.E., Selmants, P.C., Martin, R.E., Hughes, R.F., and Giardina, C.P., 2016, Rapid forest carbon assessments of oceanic islands—a case study of the Hawaiian archipelago: Carbon Balance and Management, v. 11, no. 1, 13 p., available at http://dx.doi.org/10.1186/s13021-015-0043-4.
Chapin, F.S., III, Woodwell, G.M., Randerson, J.T., Rastetter, E.B., Lovett, G.M., Baldocchi, D.D., Clark, D.A., Harmon, M.E., Schimel, D.S., Valentini, R., Wirth, C., Aber, J.D., Cole, J.J., Goulden, M.L., Harden, J.W., Heimann, M., Howarth, R.W., Matson, P.A., McGuire, A.D., Melillo, J.M., Mooney, H.A., Neff, J.C., Houghton, R.A., Pace, M.L., Ryan, M.G., Running, S.W., Sala, O.E., Schlesinger, W.H., and Schulze, E.D., 2006, Reconciling carbon-cycle concepts, terminology, and methods: Ecosystems, v. 9, no. 7, p. 1041–1050.
Giambelluca, T.W., Shuai, X., Barnes, M.L., Alliss, R.J., Longman, R.J., Miura, T., Chen, Q., Frazier, A.G., Mudd, R.G., Cuo, L., and Businger, A.D., 2014, Evapotranspiration of Hawaiʻi: final report to the U.S. Army Corps of Engineers—Honolulu District and the Commission on Water Resource Management, State of Hawaiʻi, 178 p., available at http://evapotranspiration.geography.hawaii.edu.
Giardina, C.P., Litton, C.M., Crow, S.E., and Asner, G.P., 2014, Warming-related increases in soil CO2 efflux are explained by increased below-ground carbon flux: Nature—Climate Change, v. 4, no. 9, p. 822–827, available at http://dx.doi.org/10.1038/nclimate2322.
Giardina, C.P., Ryan, M.G., Binkley, D., and Fownes, J.H., 2003, Primary production and carbon allocation in relation to nutrient supply in a tropical experimental forest: Global Change Biology, v. 9, no. 10, p. 1438–1450.
Herbert, D.A., and Fownes, J.H., 1999, Forest productivity and efficiency of resource use across a chronosequence of tropical montane soils: Ecosystems, v. 2, no. 3, p. 242–254.
Hughes, R.F., Asner, G.P., Mascaro, J., Uowolo, A., and Baldwin, J., 2014, Carbon storage landscapes of lowland Hawaii—the role of native and invasive species through space and time: Ecological Applications, v. 24, no. 4, p. 716–731, available at http://dx.doi.org/10.1890/12-2253.1.
Lasslop, G., Reichstein, M., Papale, D., Richardson, A.D., Arneth, A., Barr, A., Stoy, P., and Wohlfahrt, G., 2010, Separation of net ecosystem exchange into assimilation and respiration using a light response curve approach—critical issues and global evaluation: Global Change Biology, v. 16, p. 187–208, available at http://dx.doi.org/10.1111/j.1365-2486.2009.02041.x.
Litton, C.M., Sandquist, D.R., and Cordell, S., 2006, Effects of non-native grass invasion on aboveground carbon pools and tree population structure in a tropical dry forest of Hawaii: Forest Ecology and Management, v. 231, no. 1–3, p. 105–113, available at http://dx.doi.org/10.1016/j.foreco.2006.05.008.
Mokany, Karel, Raison, R.J., and Prokushkin, A.S., 2006, Critical analysis of root : shoot ratios in terrestrial biomes: Global Change Biology, v. 12, no. 1, p. 84–96.
Moreno, Á., García-Haro, F.J., Martínez, B., and Gilabert, M.A., 2014, Noise reduction and gap filling of fAPAR time series using an adapted local regression filter: Remote Sensing, v. 6, no. 9, p. 8238–8260, available at http://dx.doi.org/10.3390/rs6098238.
Neto, A.G., K.F. Gobbi, and, J. Silva, 2012, Tillering and biomass partitioning of Mombasa grass under nitrogen fertilization during regrowth: Revista Brasileira de Zootecnia, v. 41, no. 8, 1824–1831, available at http://dx.doi.org/10.1590/S1516-35982012000800004.
Running, S.W., Nemani, R.R., Heinsch, F.A., Zhao, M., Reeves, M., and Hashimoto, H., 2004, A continuous satellite-derived measure of global terrestrial primary production: BioScience, v. 54, no. 6, p. 547–560.
Schuur, E.A.G., Chadwick, O.A., and Matson, P.A., 2001, Carbon cycling and soil carbon storage in mesic to wet Hawaiian montane forests: Ecology, v. 82, no. 11, p. 3182–3196.

6.6. References Cited 87
Schuur, E.A.G., and Matson, P.A., 2001, Net primary productivity and nutrient cycling across a mesic to wet precipitation gradient in Hawaiian montane forest: Oecologia, v. 128, no. 3, p. 431–442, available at http://dx.doi.org/10.1007/s004420100671.
Selmants, P.C., Litton, C.M., Giardina, C.P., and Asner, G.P., 2014, Ecosystem carbon storage does not vary with mean annual temperature in Hawaiian tropical montane wet forests: Global Change Biology, v. 20, no. 9, p. 2927–2937, available at http://dx.doi.org/10.1111/gcb.12636.
Soil Survey Staff, 2015, Gridded Soil Survey Geographic (gSSURGO) Database for Hawaii: United States Department of Agriculture, Natural Resources Conservation Service, accessed August 21, 2015 at https://gdg.sc.egov.usda.gov/ (FY2016 official release).
Torn, M.S., Trumbore, S.E., Chadwick, O.A., Vitousek, P.M., and Hendricks, D.M., 1997, Mineral control of soil organic carbon storage and turnover: Nature, v. 389, p. 170–173.
Townsend, A.R., Vitousek, P.M., and Trumbore, S.E., 1995, Soil organic matter dynamics along gradients in temperature and land use on the Island of Hawaii: Ecology, v. 76, no. 3, p. 721–733.
Williams, D.G., and Baruch, Z., 2000, African grass invasion in the Americas—ecosystem consequences and the role of ecophysiology: Biological Invasions, v. 2, no. 2, p. 123–140.
Williams, D.G., and Black, R.A., 1994, Drought response of a native and introduced Hawaiian grass. Oecologia, v. 97, no. 4, p. 512–519.
Wolf, S., Eugster, W., Potvin, C., Turner, B.L., and Buchmann, N., 2011, Carbon sequestration potential of tropical pasture compared with afforestation in Panama: Global Change Biology, v. 17, no. 9, p. 2763–2780, available at http://dx.doi.org/10.1111/j.1365-2486.2011.02460.x.
Yuan, W., Luo, Y., Li, X., Liu, S., Yu, G., Zhou, T., Bahn, M., Black, A., Desai, A.R., Cescatti, A., Marcolla, B., Jacobs, C., Chen, J., Aurela, M., Bernhofer, C., Gielen, B., Bohrer, G., Cook, D.R., Dragoni, D., Dunn, A.L., Gianelle, D., Grünwald, T., Ibrom, A., Leclerc, M.Y., Lindroth, A., Liu, H., Marchesini, L.B., Montagnani, L., Pita, G., Rodeghiero, M., Rodrigues, A., Starr, G., Stoy, P.C., 2011, Redefinition and global estimation of basal ecosystem respiration rate: Global Biogeochemical Cycles, v. 25, no. 4, 14 p., available at http://dx.doi.org/10.1029/2011GB004150.
Zhao, M., Heinsch, F.A., Nemani, R.R., and Running, S.W., 2005, Improvements of the MODIS terrestrial gross and net primary production global data set. Remote Sensing of Environment, v. 95, p. 164–176.