african tropical rainforest net carbon dioxide fluxes in the twentieth
TRANSCRIPT

, 20120376, published 22 July 2013368 2013 Phil. Trans. R. Soc. B E. Levy, Christian Frankenberg, Sassan Saatchi and Yadvinder MalhiJung-Eun Lee, Chris Huntingford, Nicolas Viovy, Ning Zeng, Anders Ahlström, Mark R. Lomas, Peter Joshua B. Fisher, Munish Sikka, Stephen Sitch, Philippe Ciais, Benjamin Poulter, David Galbraith, twentieth centuryAfrican tropical rainforest net carbon dioxide fluxes in the
Supplementary data
ml http://rstb.royalsocietypublishing.org/content/suppl/2013/07/23/rstb.2012.0376.DC2.ht
"French Abstracts"ml http://rstb.royalsocietypublishing.org/content/suppl/2013/07/18/rstb.2012.0376.DC1.ht
"Data Supplement"
Referenceshttp://rstb.royalsocietypublishing.org/content/368/1625/20120376.full.html#ref-list-1
This article cites 73 articles, 10 of which can be accessed free
This article is free to access
Subject collections (478 articles)ecology �
Articles on similar topics can be found in the following collections
Email alerting service hereright-hand corner of the article or click Receive free email alerts when new articles cite this article - sign up in the box at the top
http://rstb.royalsocietypublishing.org/subscriptions go to: Phil. Trans. R. Soc. BTo subscribe to
on August 12, 2013rstb.royalsocietypublishing.orgDownloaded from
on August 12, 2013rstb.royalsocietypublishing.orgDownloaded from
rstb.royalsocietypublishing.org
ResearchCite this article: Fisher JB, Sikka M, Sitch S,
Ciais P, Poulter B, Galbraith D, Lee J-E,
Huntingford C, Viovy N, Zeng N, Ahlstrom A,
Lomas MR, Levy PE, Frankenberg C, Saatchi S,
Malhi Y. 2013 African tropical rainforest net
carbon dioxide fluxes in the twentieth century.
Phil Trans R Soc B 368: 20120376.
http://dx.doi.org/10.1098/rstb.2012.0376
One contribution of 18 to a Theme Issue
‘Change in African rainforests: past, present
and future’.
Subject Areas:ecology
Keywords:Africa, carbon, Congo, rainforest, tropic,
uncertainty
Author for correspondence:Joshua B. Fisher
e-mail: [email protected]
& 2013 The Authors. Published by the Royal Society under the terms of the Creative Commons AttributionLicense http://creativecommons.org/licenses/by/3.0/, which permits unrestricted use, provided the originalauthor and source are credited.
Electronic supplementary material is available
at http://dx.doi.org/10.1098/rstb.2012.0376 or
via http://rstb.royalsocietypublishing.org.
African tropical rainforest net carbondioxide fluxes in the twentieth century
Joshua B. Fisher1, Munish Sikka1, Stephen Sitch2, Philippe Ciais3,Benjamin Poulter3, David Galbraith4, Jung-Eun Lee1, Chris Huntingford5,Nicolas Viovy3, Ning Zeng6, Anders Ahlstrom7, Mark R. Lomas8, Peter E. Levy9,Christian Frankenberg1, Sassan Saatchi1 and Yadvinder Malhi10
1Jet Propulsion Laboratory, California Institute of Technology, 4800 Oak Grove Drive, Pasadena, CA 91109, USA2Department of Geography, College of Life and Environmental Sciences, University of Exeter, Armory Building,Rennes Drive, Exeter EX4 4RJ, UK3Laboratoire des Sciences du Climat et l’Environnement, Orme des Merisiers, bat. 701-Point courier 129, 91191Gif Sur Yvette, France4School of Geography, University of Leeds, Leeds LS2 9JT, UK5Centre for Ecology and Hydrology, Benson Lane, Wallingford OX10 8BB, UK6Department of Atmospheric and Oceanic Science, University of Maryland, 2417 Computer and Space SciencesBuilding, College Park, MD 20742-2425, USA7Department of Physical Geography and Ecosystem Science, Lund University, Solvegatan 12, 223 62 Lund, Sweden8Centre for Terrestrial Carbon Dynamics, Department of Animal and Plant Sciences, University of Sheffield,Western Bank, Sheffield S10 2TN, UK9Centre for Ecology and Hydrology, Midlothian, Penicuik EH26 0QB, UK10Environmental Change Institute, School of Geography and the Environment, University of Oxford, South ParksRoad, Oxford OX1 3QY, UK
The African humid tropical biome constitutes the second largest rainforest
region, significantly impacts global carbon cycling and climate, and has under-
gone major changes in functioning owing to climate and land-use change over
the past century. We assess changes and trends in CO2 fluxes from 1901 to
2010 using nine land surface models forced with common driving data, and
depict the inter-model variability as the uncertainty in fluxes. The biome is esti-
mated to be a natural (no disturbance) net carbon sink (20.02 kg C m22 yr21 or
20.04 Pg C yr21, p , 0.05) with increasing strength fourfold in the second half of
the century. The models were in close agreement on net CO2 flux at the beginning
of the century (s1901 ¼ 0.02 kg C m22 yr21), but diverged exponentially
throughout the century (s2010¼ 0.03 kg C m22 yr21). The increasing uncer-
tainty is due to differences in sensitivity to increasing atmospheric CO2, but
not increasing water stress, despite a decrease in precipitation and increase in
air temperature. However, the largest uncertainties were associated with the
most extreme drought events of the century. These results highlight the need
to constrain modelled CO2 fluxes with increasing atmospheric CO2 concen-
trations and extreme climatic events, as the uncertainties will only amplify in
the next century.
1. IntroductionCovering an area of 2.3 million km2 (as defined by Zelazowski et al. [1]), the African
humid tropical biome comprises 15% of global forests [2–5], yet dominates global
inter-annual variability in terrestrial carbon cycling—about 50% of that from the
global land mass, which is the most out of the pan-tropics, more than the entire
Northern Hemisphere, and approximately as much as all of the oceans over the
twentieth century [6–8]. African tropical rainforests strongly modulate regional cli-
mate, especially precipitation patterns, dominating global tropical rainfall during
the transition seasons, and are tightly connected to global climate [9–13].
Despite its global and regional importance, this region has among the
least environmental observations worldwide [6,13–17]. We have very few
0 500 1000 1500 2000km
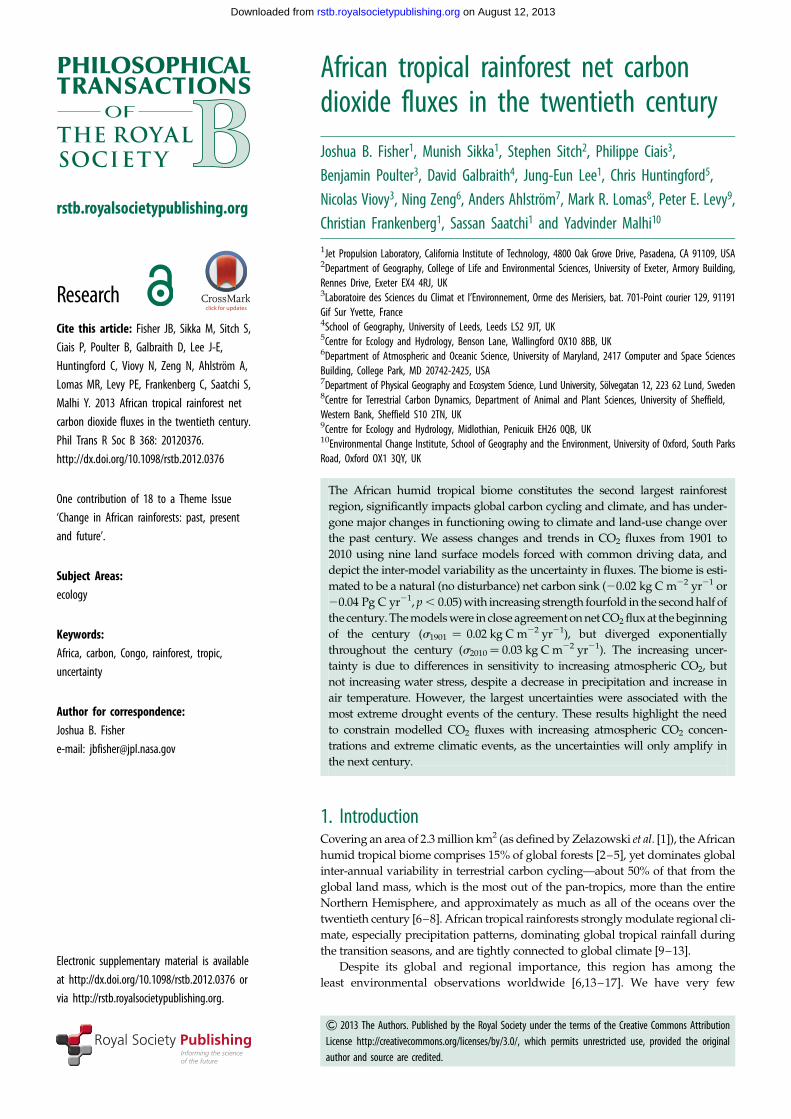
Figure 1. Map of African humid tropical forest delineation and stationlocations (n ¼ 47) within mask used for climate forcing.
rstb.royalsocietypublishing.orgPhilTransR
SocB368:20120376
2
on August 12, 2013rstb.royalsocietypublishing.orgDownloaded from
measurements on African humid tropical carbon stocks and
fluxes [18,19], we do not know whether the biome is a net
sink or source of atmospheric CO2, and we have little cer-
tainty as to the climate change response for the region
[6,14]. Atmospheric CO2 flux inversions are subsequently
among the most poorly constrained for this region [20,21].
The region is undergoing major change from land use
and climate. Deforestation in Central Africa is accelerating,
similar to deforestation patterns in the rest of the tropics
[22,23]. The climate response, however, may be disproportio-
nately extreme. The ‘great drought’ that began in the 1960s in
the Sahel lasted well into the 1980s, with 20–40% less preci-
pitation in the 30 years following 1960 relative to before
[24–26]. The drought reached the northern Congo Basin,
which appears to have continued to decline strongly in preci-
pitation (at least in the short term), unlike the rest of the
humid pan-tropics (which have showed little consistent trend
apart from episodic droughts) [9,27–29]. Vegetation and soil
carbon stocks and productivity have been shown to be
highly correlated with annual rainfall in Africa [6]. Compound-
ing this decrease in precipitation, there has been an overall
warming trend in Africa at large [28,30,31]. Given less water
and hotter temperatures, we may expect increasing water
stress to decrease CO2 uptake, and move the biome towards
a net source of CO2 to the atmosphere [27].
Paradoxically, models and measurements have shown
an increase in vegetation productivity and biomass of 0.3–
0.4 Pg C yr21 in the African humid tropics since the 1960s
[6,7,14,18,19,32–34] (compare with deforestation fluxes of
0.1–0.3 Pg yr21 and fossil fuel emissions of 0.04 Pg yr21)
[35,36]. From these studies, water appears not to be the stron-
gest limiting control on plant productivity in the African
humid tropics; rather, plant productivity may be limited by
radiation [32,37,38] or there may be no climatic constraints
to productivity in this biome [39]. The recent increase in
plant productivity has been attributed to the CO2 fertilization
effect [7,14,18,19,28,40–45]. Still, free air CO2 enrichment
(FACE) studies have shown that the CO2 enrichment effect
can be curtailed by nutrient limitation [46–49]—a physical
mechanism not included in most of these modelling stu-
dies [50]. The latest developments of nutrient limitation in
global models have shown a major decrease in the ability of
the terrestrial biosphere to sequester increasing atmospheric
CO2 [51–58].
Given changes in atmospheric CO2 concentration, temp-
erature and water throughout the twentieth century, we ask
how have African humid tropical rainforests responded to
these different climate forcings? Because of the sparseness
of observation networks in the region for this period (apart
from some plots from the AfriTRON network) [18], we rely
on models. However, instead of relying on any one model,
which may or may not represent an outlier to the community
of models that encompass global uncertainty in climate
change [42,59], we take advantage of the development of a
new ‘network of models’, that is, a recent land surface
model intercomparison project (MIP) called TRENDY
(http://dgvm.ceh.ac.uk/node/21), which has united nine
global land surface models through common forcing data
over the period of 1901–2010 [60]. This extends a previous
CarboAfrica Model InterComparison (CAMIC) project [37]
that used four of these models over Africa for 1982–2006
(see also [61]). We are therefore able to add sophistication
to our driving question, and ask how the net CO2 flux
uncertainty—as defined by the model–model convergence/
divergence—varies over this space and time domain.
2. MethodsThe nine global land surface models from the TRENDY MIP
include: CLM4-CN [55], HYLAND [62], LPJwsl [63], LPJ-
GUESS [64], OCN [56], ORCHIDEE [65], SDGVM [66], TRIFFID
[67] and VEGAS [68]. Model output for TRENDY was down-
loaded from: http://www-lscedods.cea.fr/invsat/RECCAP/.
Output from multiple versions of the same model was some-
times available; in these cases, we used output only from the
most recent version. We primarily used the version S2 runs,
which correspond to simultaneously meteorological forcings
and atmospheric CO2 concentration variation following twenti-
eth century increases, with disturbance turned off and a
constant land-use mask; this version represents the ‘natural’
state and change of the system. We also used version S1, which
varies only CO2, to evaluate sensitivities to CO2 and climate.
The TRENDY models were driven primarily with CRUþNCEP climate forcing data for 1901–2010 [60], downloaded
at http://dods.extra.cea.fr/data/p529viov/cruncep/ through
http://dgvm.ceh.ac.uk/node/9 [69–72]. The CRUþNCEP data
are a combination of two existing datasets: (i) Climate Research
Unit (CRU) TS.3.1 0.58� 0.58 monthly climatology covering the
period 1901–2009; and (ii) US National Oceanic and Atmosphe-
ric Administration (NOAA) National Centers for Environmental
Prediction (NCEP) and National Center for Atmospheric
Research (NCAR) reanalysis 2.58� 2.58 6-hourly climatology
covering the period 1948–near real time.
CRU TS.3.1 data were based on observed monthly mean temp-
eratures and precipitation (among other variables) interpolated
from more than 4000 weather stations distributed around the
world. Station abundance in our study region was n ¼ 47, though
most were located closer to the coast rather than more inland into
the Congo basin (figure 1). NCEP/NCAR reanalysis I data were
created by assimilation into a climate model of meteorological
observations from ships, satellites, ground stations, radar and
the Rawinsonde observation programme. Input variables for the
TRENDY models included: incoming longwave radiation, incom-
ing shortwave radiation, total precipitation, air temperature,
pressure, air-specific humidity, zonal wind (u) component and
meridional wind (v) component. Incoming solar radiation was cal-
culated from CRU-provided cloudiness, date and latitude; likewise,
relative humidity was converted to specific humidity as a function
of temperature and surface pressure (http://dods.extra.cea.fr/
data/p529viov/readme.htm). For the CRUþNCEP merged

0.20HYLANDOCNTRIFFID
LPJ-GUESSORCHIDEEVEGAS
CLM4-CNLPJwslSDGVM
0.10
0.05
–0.05ne
t CO
2 fl
ux (
kg C
m–2
yr–1
)–0.10
–0.15
–0.201900 1910 1920 1930 1940 1950 1960
year1970 1980 1990 2000 2010
0
0.15
Figure 2. Mean annual African humid tropical net CO2 flux (negative is carbon sink) from nine dynamic global vegetation models in the TRENDY model inter-comparison project.
rstb.royalsocietypublishing.orgPhilTransR
SocB368:20120376
3
on August 12, 2013rstb.royalsocietypublishing.orgDownloaded from
dataset, climate data between 1948 and 2009 were based on CRU
climatology, with NCEP used to generate the diurnal and daily
variability. NCEP data were bi-linearly interpolated to the 0.58 �0.58 CRU resolution for all fields except precipitation. Data for
before 1948 and after 2009 were extrapolated from the CRU–
NCEP statistical relationships for during 1948–2009. Atmospheric
CO2 data were sourced from ice core þ NOAA annual resolution
for 1860–2010.
Model output variables assessed included: net biome pro-
duction (NBP), gross primary production (GPP), heterotrophic
respiration (Rh), autotrophic respiration (Ra), ecosystem respir-
ation (Re) and net primary production (NPP). The models
provided inconsistent and different combinations of variables,
but enough variables so that those missing could be calculated.
We calculated NPP for LPJ-GUESS from the available GPP
minus Ra. We calculated Ra for HYLAND, ORCHIDEE and
VEGAS from the available GPP minus NPP. We calculated Re
from available Ra plus Rh (CLM4-CN, LPJ-GUESS, LPJ, OCN,
SDGVM, TRIFFID) or NBP minus GPP (HYLAND, ORCHIDEE,
VEGAS). HYLAND reported net ecosystem production (NEP),
which we assume equal to NBP, though we note that technically
NBP should include an additional flux from fire and other dis-
turbance as well as lateral carbon transport that NEP would
not include. HYLAND was reported in opposite sign for NEP
so we reversed the sign. The models reported different time
units (VEGAS in per years, LPJwsl in per months, all others in
per seconds), so we converted all model results to per year.
We created a half-degree mask of the African humid tropics
(figure 1; area ¼ 2 312 749 km2) used to clip from the global
model output, following Zelazowski et al. [1] for consistency
with the previous analyses. We transformed the mask to match
the relative varying native spatial resolutions of the models.
We produced annual means for each of the variables by aver-
aging the available 6-hourly model output and preserving the
native spatial resolution for each model. For climate attribution,
we selected the dominant driving variables that have undergone
relatively large twentieth century shifts, i.e. precipitation and air
temperature. We calculated trend correlations—that is, we did
not remove trends to assess de-trended variability, as is often
done—as we were more interested in what drives trends rather
than inter-annual variability, though we additionally include a
complementary analysis of inter-annual variability. We defined
‘uncertainty’ as inter-model standard deviation. We compared
two time periods for pre- and post-1968, as defined as the start
of the ‘great drought’ in the Sahel, which we test for extension
into the humid tropics.
To assess the model sensitivity of the terrestrial carbon cycle,
we follow the ‘feedback analysis’ approach of Friedlingstein
et al. [42] for their uncoupled simulations. That is, the change
in land carbon storage sensitivity to change in atmospheric
CO2 concentration may be formulated as:
DCuL ¼ bLDCu
A; ð2:1Þ
where DCuL is the change in land carbon storage in the uncoupled
simulation arising from an increase in atmospheric CO2 con-
centration of DCuA, and bL is the land carbon sensitivity to
atmospheric CO2. Friedlingstein et al. use equation (2.1) to show
the cumulative absolute change in land carbon storage from each
of the uncoupled C4 MIP runs against atmospheric CO2 concen-
tration for uncoupled simulations, which we also follow. To
isolate the impact from ‘climate change’, Friedlingstein et al. give
the following equation, which we adapt from their coupled runs:
DCuL ¼ bLDCu
A þ gLDTc; ð2:2Þ
where gL is the land carbon sensitivity to climate change with
temperature increase of DTc. Subtracting equation (2.1) from
equation (2.2):
gL ¼DCclim
L
DTc; ð2:3Þ
which can isolate the ‘climate alone’ impact on land carbon uptake.
The resultant analysis shows the cumulative net CO2 flux over the
twentieth century as the standard deviation between the models
(e.g. uncertainty) forced with CO2 alone (e.g. TRENDY version
S1), forced with varying CO2 þ climate (e.g. TRENDY version
S2), and the difference between the two, which is the impact of cli-
mate alone.
3. ResultsThe African humid tropics are estimated to be an overall
significant natural (i.e. no disturbance) net carbon sink from
1901 to 2010, with a multi-model (nine) mean net CO2 flux
of 20.018+0.009 kg C m22 yr21 or 20.04+0.02 Pg C yr21
( p , 0.05; figure 2). The individual model largest carbon
sinks came from ORCHIDEE, OCN and HYLAND
(20.03 kg C m22 yr21; table 1). LPJwsl was a non-significant
overall carbon source (0.003 kg C m22 yr21). The multi-
model sink strength increased by 4.3� post-1968 (pre-1968:
20.008 kg C m22 yr21; post-1968: 20.035 kg C m22 yr21).
Apart from the edges, there was little spatial variability in
the multi-model net CO2 flux for the biome (figure 3a–c).
The component fluxes (GPP, NPP, Ra, Rh and Re) tended
to display distinct stratification with little to no overlap
among models (see the electronic supplementary material,
figure S1). Overall, GPP was largest, followed by Re, then
Ra, NPP and Rh.
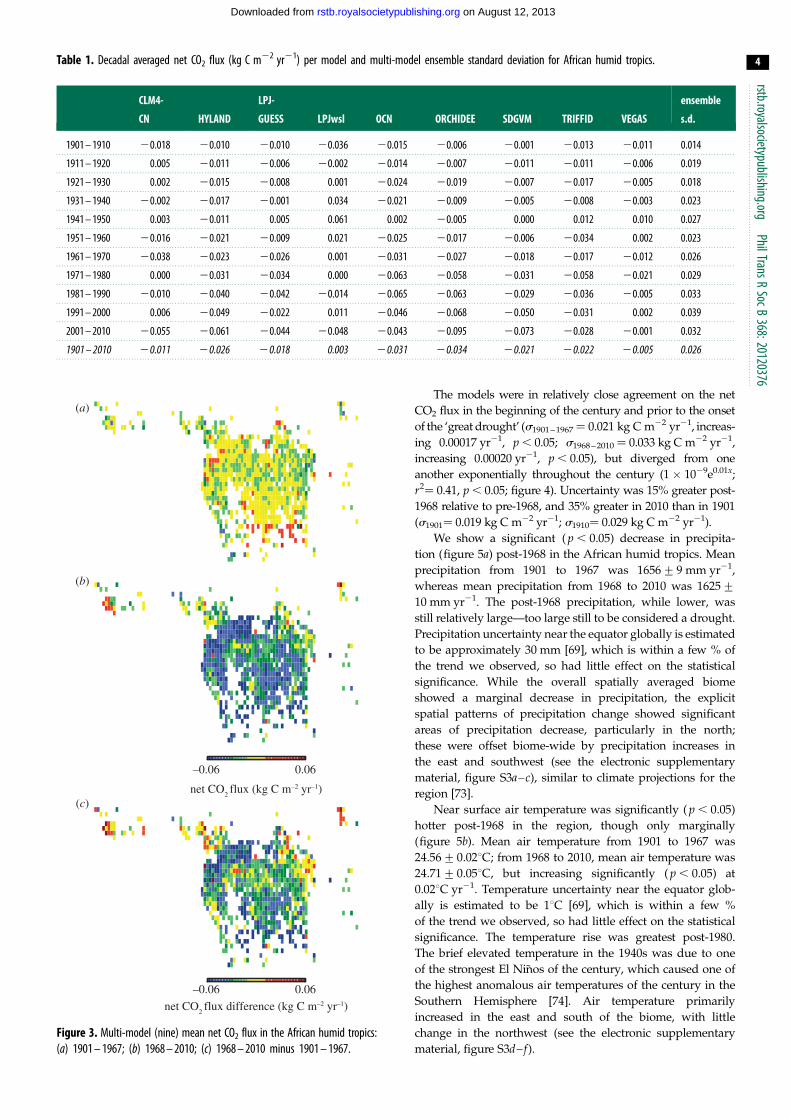
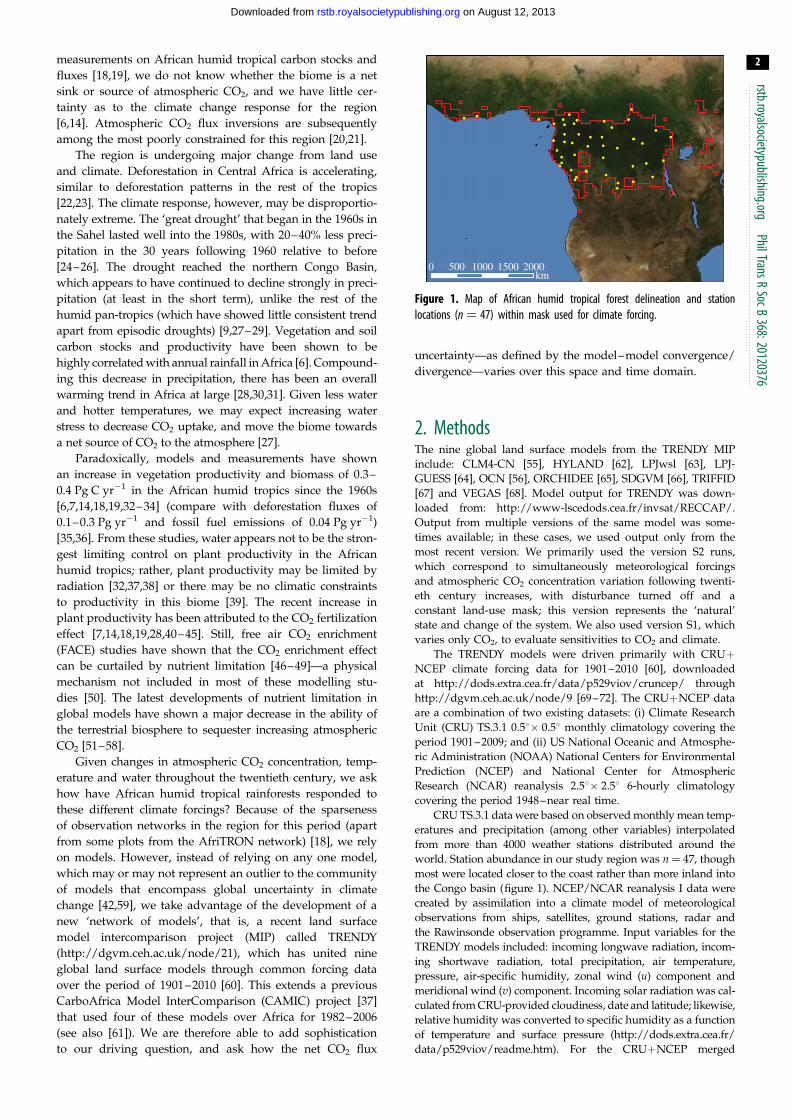
Table 1. Decadal averaged net CO2 flux (kg C m22 yr21) per model and multi-model ensemble standard deviation for African humid tropics.
CLM4-
CN HYLAND
LPJ-
GUESS LPJwsl OCN ORCHIDEE SDGVM TRIFFID VEGAS
ensemble
s.d.
1901 – 1910 20.018 20.010 20.010 20.036 20.015 20.006 20.001 20.013 20.011 0.014
1911 – 1920 0.005 20.011 20.006 20.002 20.014 20.007 20.011 20.011 20.006 0.019
1921 – 1930 0.002 20.015 20.008 0.001 20.024 20.019 20.007 20.017 20.005 0.018
1931 – 1940 20.002 20.017 20.001 0.034 20.021 20.009 20.005 20.008 20.003 0.023
1941 – 1950 0.003 20.011 0.005 0.061 0.002 20.005 0.000 0.012 0.010 0.027
1951 – 1960 20.016 20.021 20.009 0.021 20.025 20.017 20.006 20.034 0.002 0.023
1961 – 1970 20.038 20.023 20.026 0.001 20.031 20.027 20.018 20.017 20.012 0.026
1971 – 1980 0.000 20.031 20.034 0.000 20.063 20.058 20.031 20.058 20.021 0.029
1981 – 1990 20.010 20.040 20.042 20.014 20.065 20.063 20.029 20.036 20.005 0.033
1991 – 2000 0.006 20.049 20.022 0.011 20.046 20.068 20.050 20.031 0.002 0.039
2001 – 2010 20.055 20.061 20.044 20.048 20.043 20.095 20.073 20.028 20.001 0.032
1901 – 2010 20.011 20.026 20.018 0.003 20.031 20.034 20.021 20.022 20.005 0.026
–0.06
(a)
(b)
(c)
0.06
–0.06 0.06
net CO2 flux (kg C m–2 yr–1)
net CO2 flux difference (kg C m–2 yr–1)
Figure 3. Multi-model (nine) mean net CO2 flux in the African humid tropics:(a) 1901 – 1967; (b) 1968 – 2010; (c) 1968 – 2010 minus 1901 – 1967.
rstb.royalsocietypublishing.orgPhilTransR
SocB368:20120376
4
on August 12, 2013rstb.royalsocietypublishing.orgDownloaded from
The models were in relatively close agreement on the net
CO2 flux in the beginning of the century and prior to the onset
of the ‘great drought’ (s1901–1967¼ 0.021 kg C m22 yr21, increas-
ing 0.00017 yr21, p , 0.05; s1968–2010 ¼ 0.033 kg C m22 yr21,
increasing 0.00020 yr21, p , 0.05), but diverged from one
another exponentially throughout the century (1 � 1029e0.01x;
r2¼ 0.41, p , 0.05; figure 4). Uncertainty was 15% greater post-
1968 relative to pre-1968, and 35% greater in 2010 than in 1901
(s1901¼ 0.019 kg C m22 yr21; s1910¼ 0.029 kg C m22 yr21).
We show a significant ( p , 0.05) decrease in precipita-
tion (figure 5a) post-1968 in the African humid tropics. Mean
precipitation from 1901 to 1967 was 1656+9 mm yr21,
whereas mean precipitation from 1968 to 2010 was 1625+10 mm yr21. The post-1968 precipitation, while lower, was
still relatively large—too large still to be considered a drought.
Precipitation uncertainty near the equator globally is estimated
to be approximately 30 mm [69], which is within a few % of
the trend we observed, so had little effect on the statistical
significance. While the overall spatially averaged biome
showed a marginal decrease in precipitation, the explicit
spatial patterns of precipitation change showed significant
areas of precipitation decrease, particularly in the north;
these were offset biome-wide by precipitation increases in
the east and southwest (see the electronic supplementary
material, figure S3a–c), similar to climate projections for the
region [73].
Near surface air temperature was significantly ( p , 0.05)
hotter post-1968 in the region, though only marginally
(figure 5b). Mean air temperature from 1901 to 1967 was
24.56+0.028C; from 1968 to 2010, mean air temperature was
24.71+0.058C, but increasing significantly ( p , 0.05) at
0.028C yr21. Temperature uncertainty near the equator glob-
ally is estimated to be 18C [69], which is within a few %
of the trend we observed, so had little effect on the statistical
significance. The temperature rise was greatest post-1980.
The brief elevated temperature in the 1940s was due to one
of the strongest El Ninos of the century, which caused one of
the highest anomalous air temperatures of the century in the
Southern Hemisphere [74]. Air temperature primarily
increased in the east and south of the biome, with little
change in the northwest (see the electronic supplementary
material, figure S3d–f).

0.07
net C
O2
flux
(s.
d.)
(kg
C m
–2 y
r–1)
0.06
0.05
0.04
0.03
0.02
0.01
01900 1910 1920 1930 1940 1950 1960
year1970 1980 1990 2000
y=1×10⁻⁹ e0.01x
R2=0.41
2010
Figure 4. Multi-model (nine) annual standard deviation for African humid tropical net CO2 flux (red). An exponential curve (black) is fit through all years (equationin bottom-right).
1850(a)
(b)
18001750170016501600
prec
ipita
tion
(mm
yr–1
)ai
r te
mpe
ratu
re (
°C)
155015001450
onset of'great drought'
1400
25.825.625.425.225.024.824.624.424.224.0
1900 1910 1920 1930 1940 1950 1960
year
1970 1980 1990 2000 2010
Figure 5. Mean annual climatological forcing for African humid tropics: (a) precipitation; (b) air temperature. Blue represents pre-1968, red represents post-1968.Dashed lines are the mean values through the 1901 – 1967 and 1968 – 2010 periods, respectively.
rstb.royalsocietypublishing.orgPhilTransR
SocB368:20120376
5
on August 12, 2013rstb.royalsocietypublishing.orgDownloaded from
We assessed which climatic and environmental factors
influenced the model uncertainty. The differences between
models are due to differences in sensitivities to climate forcings,
rather than, for example, treatment of disturbance and land
use, which were turned off in this analysis so as to focus on
the natural ecosystem change to climate. The factor most cor-
related with the trend in net CO2 flux uncertainty was the
trend in increasing atmospheric CO2 concentration (r2¼ 0.31,
p , 0.05). OCN, ORCHIDEE and HYLAND were the most
sensitive to CO2, whereas VEGAS, CLM4-CN and LPJwsl
were the least sensitive.
Second to CO2 was the trend in air temperature, which was
weakly correlated with the trend in net CO2 flux uncertainty
(r2¼ 0.10, p , 0.05). This is primarily because the air tempera-
ture variation was relatively small; hence, the models were
insensitive to air temperature in the region following the
feed-back analysis (data not shown). The elevated temperature
in the 1940s, for example, did not greatly impact the net CO2
flux uncertainty.
The trend in precipitation was not correlated with the
trend in net CO2 flux uncertainty, though the two largest
precipitation minima of the century (in 1913 and 1997), and to
a lesser extent the minimum in 1983, corresponded with the lar-
gest increases in net CO2 flux uncertainty. This result cannot be
understated given an expected increase in the number of
extreme climate events in the twenty-first century [59].
The change in climate alone moved the African humid
tropical biome towards an increasing net carbon source, as
temperatures increased and precipitation decreased, though
also with increasing uncertainty (figure 6). However, the
change in CO2 alone was a stronger driver of the biome
towards an increasing net carbon sink, with moderately
increasing uncertainty relative to that from climate. The
uncertainty from climate alone at the beginning of the
twenty-first century was 32% greater than that from CO2
alone. The strength of CO2 fertilization outweighed that
from changing climate, so that the combined effect led to a
net overall carbon sink.
The inter-annual variability of air temperature, precipi-
tation and net CO2 flux uncertainty illustrates the temporal
influences of the magnitude changes of the climatic variables
on the magnitude change of the net CO2 flux uncertainty

1901 1920 1940 1960 1980 2000
–4.5
0
4.5
year
cum
ulat
ive
net
CO
2 fl
ux (
kg C
m–2
yr–1
)
Figure 6. Sensitivity of land carbon storage to atmospheric CO2 (blue, sink),climate (red, source) and the combined effect of CO2 and climate (orange,sink) for African humid tropics over the twentieth century for TRENDY landsurface models.
rstb.royalsocietypublishing.orgPhilTransR
SocB368:20120376
6
on August 12, 2013rstb.royalsocietypublishing.orgDownloaded from
(figure 7). It appears from figure 7 that there may be synergis-
tic interactions between precipitation and air temperature,
and their combined effect on net CO2 flux uncertainty, and
a multiple regression integrating the two climatic variables
yields a somewhat improved r2 of 0.17 (from 0.10 for air
temperature alone). Including atmospheric CO2 concentration
in the multiple regression increases the r2 to 0.35 (from 0.31
for atmospheric CO2 concentration alone). Integration of
these drivers into an artificial neural network resulted in an
equivalent r2 of 0.34, so no further structural explanation
was found through these statistical approaches for the net
CO2 flux uncertainty.
4. DiscussionOur analysis highlights three key results for the African
humid tropics over the twentieth century in response to chan-
ging climate from nine land surface models: (i) the biome has
been a natural net carbon sink, the strength of which
increased over the century; (ii) uncertainty in the strength
of the net carbon sink grew increasingly large throughout
the century; and (iii) the trend in that uncertainty was largely
related to increasing atmospheric CO2, not increasing water
stress, though maxima were observed with the largest
drought events.
As noted also in other modelling studies [7,14,17,37], as
well as in an extensive ground survey by Lewis et al. [18], the
influence of CO2 fertilization drove the biome towards an
increasing net carbon sink. Lewis et al. measured an increase
in aboveground carbon storage of 0.063 kg C m22 yr21 from
1968 to 2007, which is remarkably in the same order of magni-
tude as the multi-model carbon sink of 0.047 kg C m22 yr21 for
the same period in this study, especially given entirely different
estimation approaches, inexact spatial overlap and simplifica-
tion of a very complex biome by the models. The models
vary in how CO2 is allocated to wood, which has a long resi-
dence time and would show a greater biomass increase
for the same unit increase in GPP relative to models that allo-
cate NPP more towards pools with fast turnover times such
as fine roots and leaves. Moreover, the uptake estimate of
Lewis et al. is nearly identical to that from SDGVM
(0.064 kg C m22 yr21). The multi-model mean C uptake is
reduced primarily owing to the contribution from VEGAS,
which estimated a net C loss, rather than gain, during that
time period; removal of VEGAS from the multi-model mean
changes the C uptake to 0.054 kg C m22 yr21.
Still, in general, the models estimated less C uptake than
did Lewis et al., though with assumptions and biases in both
the measurement and modelling approaches it is difficult to
pinpoint the reasons behind the difference. Lewis et al. offer
a number of hypotheses to explain their large C uptake, lean-
ing towards changing resource availability and possibly
species-specific advantages, though with nothing as of yet
conclusive. It is possible that the models should be even
more sensitive to CO2 fertilization than they already are, at
least in this region, responding to the notion that in relatively
species-rich areas some species may find CO2 fertilization
particularly advantageous, and drive the whole biome
towards a stronger carbon sink. Supporting this concept is
observational evidence from Fauset et al. [29], who showed
that biomass increased in Ghana from a shift in species com-
position, though the shift was related to the ‘great drought’
rather than CO2 fertilization.
Unlike exponentially rising atmospheric CO2, the CO2 fer-
tilization effect on vegetation may not increase exponentially,
instead decelerating with nutrient limitation [46,48,49,51–58].
In our study, most of the models do not have nutrient limit-
ation mechanisms implemented; however, three do—
SDGVM, CLM4-CN and OCN, the latter of which may be
directly comparable with ORCHIDEE from which OCN is
derived. Throughout the century, OCN generally tracked
ORCHIDEE, which estimated the overall largest net carbon
sink, but OCN departed significantly from ORCHIDEE in the
past decade (sOCN-ORCHIDEE,1901– 2000¼ 0.011 kg C m22 yr21;
sOCN-ORCHIDEE,2001–2010¼ 0.039 kg C m22 yr21), aligning more
similarly to CLM4-CN (sOCN-CLM4-CN,2001–2010¼
0.017 kg C m22 yr21).
These patterns suggest that the CO2 fertilization effect
may or has already begun to decrease in strength, though
this would emerge more apparently as models start to inte-
grate nutrient cycles. African rainforests may be moderately
nutrient limited [47]. The difference in treatment of the CO2
fertilization effect is the primary reason for the increasing
uncertainty in net CO2 flux throughout the twentieth century.
Acclimation to high CO2 is not incorporated in most models,
nor are there any in situ CO2 enrichment experiments in tro-
pical forests with which to compare with models [75]. The
tropical forest carbon sink has the largest uncertainty of all
forests worldwide [34]. To help reduce the uncertainty,
models need to integrate nutrient cycling, which would
limit sensitivity to the CO2 fertilization effect particularly
moving forward into the twenty-first century. Further assess-
ment of in situ observations of C uptake is needed to
constrain the magnitude and drivers of C uptake. Moreover,
experimental data are needed to assess CO2 acclimation in the
humid tropics, e.g. a tropical FACE experiment, as well as
warming to confront models. Finally, the climatic forcing
data for the region need to have better quantification of
uncertainties, though presumably the climatic forcing data
have increased in robustness through time, thereby tighten-
ing our confidence on the increasing model divergence.
Despite the strong decrease in precipitation post-1968
related to the ‘great drought’ in the Sahel, we found only a
marginal decrease in precipitation overall for the African
100
–100
75
–75
50
–50
25
–25
0an
omal
y fr
om m
ean
(% o
f m
axim
um)
1900 1910 1920 1930 1940 1950 1960
year
1970 1980 1990 2000 2010
Figure 7. Inter-annual variability as defined as the annual anomaly from the long-term (1901 – 2010) mean, normalized to a percentage of the maximum value for:(i) the multi-model ensemble net CO2 flux standard deviation (black, red outline); (ii) precipitation ( purple, blue outline); and, (iii) air temperature (orange, greyoutline).
rstb.royalsocietypublishing.orgPhilTransR
SocB368:20120376
7
on August 12, 2013rstb.royalsocietypublishing.orgDownloaded from
humid tropics (particularly for the northern part of the
biome) [9] and little impact of water stress for our study. Cer-
tainly, parts of the biome were more impacted than others
(see the electronic supplementary material, figure S3a–f ), so
averaging over a heterogeneously impacted area reduces
the drought signal. Still, the reduction in precipitation and
increase in temperature were sufficiently small enough not
to produce a strong signal. Water stress would have mani-
fested itself in GPP, because CO2 uptake should be
controlled by stomatal conductance/resistance, which is
controlled by water stress [76]. However, we found no
relationship between GPP uncertainty and net CO2 flux
uncertainty. In a recent study on ORCHIDEE in Africa,
Traore et al. [17] found that GPP increased over the past 30
years even though soil moisture decreased, and that there
was no relationship between precipitation and GPP variabil-
ity in Central Africa (see also [16]), which supports our
conclusions. Moreover, even with decreased precipitation,
the African humid tropical region has persistent cloud
cover and lower rates of evapotranspiration relative to, for
example, Amazonia, so soil moisture remains at non-stress
levels [77]. Further, if similar to Amazonia, then African
humid tropical forests may also be deep rooted and able to
withstand droughts [78].
Although there was a lack of response to the overall small
drying trend in the humid African tropics, the greatest uncer-
tainties resulted from direct response to the largest drought
events throughout the twentieth century. The model diver-
gence is linked to differences in soil moisture response
thresholds across models. The potential decreasing CO2 ferti-
lization strength may soon be outpaced by an increasing
climate response (figure 6). With extreme climatic events
expected to increase in the next century [59], it will be critical
that improvement to land surface models focuses on repre-
senting the land response to these extremes accurately.
Acknowledgements. The research described in this paper was performedby the Jet Propulsion Laboratory, California Institute of Technology,under a contract with the National Aeronautics and Space Adminis-tration. We thank S. Levis and S. Zaehle, who contributed modeloutput for CLM4-CN and OCN, respectively, and J.-H. Lee for GISinput. Copyright 2013 California Institute of Technology. Govern-ment sponsorship acknowledged. J.B.F. and S.S. formulated idea;J.B.F. designed research; M.S. and J.B.F. performed research; allauthors contributed to the writing of the paper. The authors declareno conflict of interest.
References
1. Zelazowski P, Malhi Y, Huntingford C, Sitch S, FisherJB. 2011 Changes in the potential distribution ofhumid tropical forests on a warmer planet. Phil.Trans. Soc. A 369, 137 – 160. (doi:10.1098/rsta.2010.0238)
2. Mayaux P, Holmgren P, Achard F, Eva H, Stibig H-J,Branthomme A. 2005 Tropical forest cover change inthe 1990s and options for future monitoring. Phil.Trans. R. Soc. B 360, 373 – 384. (doi:10.1098/rstb.2004.1590)
3. Mayaux P, Bartholome E, Fritz S, Belward A. 2004 Anew land-cover map of Africa for the year 2000.J. Biogeogr. 31, 861 – 877. (doi:10.1111/j.1365-2699.2004.01073.x)
4. Bartholome E, Belward AS. 2005 GLC2000: anew approach to global land cover mappingfrom Earth observation data. Int. J. RemoteSens. 26, 1959 – 1977. (doi:10.1080/01431160412331291297)
5. FAO. 2010 Global forest resources assessment 2010.Rome, Italy: Food and Agriculture Organization ofthe United Nations.
6. Williams C, Hanan N, Neff J, Scholes R, Berry J,Denning AS, Baker DF. 2007 Africa and the globalcarbon cycle. Carbon Balance Manag. 2, 3. (doi:10.1186/1750-0680-2-3)
7. Cao M, Zhang Q, Shugart HH. 2001 Dynamicresponses of African ecosystem carbon cycling toclimate change. Clim. Res. 17, 183 – 193. (doi:10.3354/cr017183)
8. McGuire AD et al. 2001 Carbon balance of theterrestrial biosphere in the twentieth century:analyses of CO2, climate and land use effects withfour process-based ecosystem models. Glob.Biogeochem. Cycles 15, 183 – 206. (doi:10.1029/2000GB001298)
9. Malhi Y, Wright J. 2004 Spatial patterns and recenttrends in the climate of tropical rainforest regions.
Phil. Trans. R. Soc. Lond. B 359, 311 – 329. (doi:10.1098/rstb.2003.1433)
10. Tierney JE, Russell JM, Huang Y, Damste JSS,Hopmans EC, Cohen AS. 2008 Northern hemispherecontrols on tropical southeast African climate duringthe past 60,000 years. Science 322, 252 – 255.(doi:10.1126/science.1160485)
11. Polcher J, Laval K. 1994 The impact of African andAmazonian deforestation on tropical climate.J. Hydrol. 155, 389 – 405. (doi:10.1016/0022-1694(94)90179-1)
12. Pollard D, Thompson SL. 1995 Use of a land-surface-transfer scheme (LSX) in a global climatemodel: the response to doubling stomatalresistance. Glob. Planet. Change 10, 129 – 161.(doi:10.1016/0921-8181(94)00023-7)
13. Washington R, James R, Pearce H, Pokam W,Moufouma-Okia W. 2013 Congo Basin rainfallclimatology: a comparison of data products. Phil.

rstb.royalsocietypublishing.orgPhilTransR
SocB368:20120376
8
on August 12, 2013rstb.royalsocietypublishing.orgDownloaded from
Trans. R. Soc. B 368, 20120296. (doi:10.1098/rstb.2012.0296)
14. Ciais P, Piao SL, Cadule P, Friedlingstein P, Chedin A.2009 Variability and recent trends in the Africanterrestrial carbon balance. Biogeosciences 6,1935 – 1948. (doi:10.5194/bg-6-1935-2009)
15. Hiernaux P, Mougin E, Diarra L, Soumaguel N,Lavenu F, Tracol Y, Diawara M. 2009 Sahelianrangeland response to changes in rainfall over twodecades in the Gourma region, Mali. J. Hydrol. 375,114 – 127. (doi:10.1016/j.jhydrol.2008.11.005)
16. Ciais P, Bombelli A, Williams M, Piao SL, Chave J,Ryan CM, Henry M, Brender P, Valentini R. 2011 Thecarbon balance of Africa: synthesis of recentresearch studies. Phil. Trans. R. Soc. A 369,2038 – 2057. (doi:10.1098/rsta.2010.0328)
17. Traore AK et al. Submitted. Impacts of recentclimate variability, CO2 concentrations and croplandcover change on African terrestrial productivity andwater cycle.
18. Lewis SL et al. 2009 Increasing carbon storagein intact African tropical forests. Nature 457,1003 – 1006. (doi:10.1038/nature07771)
19. Malhi Y. 2010 The carbon balance of tropical forestregions, 1990 – 2005. Curr. Opin. Environ.Sustainability 2, 237 – 244. (doi:10.1016/j.cosust.2010.08.002)
20. Gurney KR et al. 2002 Towards robust regionalestimates of CO2 sources and sinks usingatmospheric transport models. Nature 415,626 – 630. (doi:10.1038/415626a)
21. Bousquet P, Ciais P, Peylin P, Ramonet M, MonfrayP. 1999 Inverse modeling of annual atmosphericCO2 sources and sinks 1. Method and controlinversion. J. Geophys. Res. 104, 26 161 – 26 178.(doi:10.1029/1999JD900342)
22. Houghton RA. 2003 Revised estimates of the annualnet flux of carbon to the atmosphere from changesin land use and land management 1850 – 2000.Tellus B 55, 378 – 390. (doi:10.1034/j.1600-0889.2003.01450.x)
23. Laporte NT, Stabach JA, Grosch R, Lin TS, Goetz SJ. 2007Expansion of industrial logging in Central Africa. Science316, 1451. (doi:10.1126/science.1141057)
24. Hulme M. 1992 Rainfall changes in Africa: 1931 –1960 to 1961 – 1990. Int. J. Climatol. 12, 685 – 699.(doi:10.1002/joc.3370120703)
25. Giannini A, Biasutti M, Verstraete MM. 2008 Aclimate model-based review of drought in theSahel: desertification, the re-greening and climatechange. Glob. Planet. Change 64, 119 – 128. (doi:10.1016/j.gloplacha.2008.05.004)
26. Olsson L, Eklundh L, Ardo J. 2005 A recent greeningof the Sahel: trends, patterns and potential causes.J. Arid Environ. 63, 556 – 566. (doi:10.1016/j.jaridenv.2005.03.008)
27. Phillips OL et al. 2009 Drought sensitivity of theAmazon rainforest. Science 323, 1344 – 1347.(doi:10.1126/science.1164033)
28. Lewis SL, Malhi Y, Phillips OL. 2004 Fingerprintingthe impacts of global change on tropical forests.Phil. Trans. R. Soc. Lond. B 359, 437 – 462. (doi:10.1098/rstb.2003.1432)
29. Fauset S, Baker TR, Lewis SL, Feldpausch TR,Affum-Baffoe K, Foli EG, Harner KC, Swaine MD.2012 Drought-induced shifts in the floristic andfunctional composition of tropical forests in Ghana.Ecol. Lett. 15, 1120 – 1129. (doi:10.1111/j.1461-0248.2012.01834.x)
30. Hulme M. 1996 Recent climatic change in theworld’s drylands. Geophys. Res. Lett. 23, 61 – 64.(doi:10.1029/95GL03586)
31. Hulme M. 1996 Global warming. Prog. Phys. Geogr.20, 216 – 223. (doi:10.1177/030913339602000207)
32. Nemani RR, Keeling CD, Hashimoto H, Jolly WM,Piper SC, Tucker CJ, Myneni RB, Running SW. 2003Climate-driven increases in global terrestrial netprimary production from 1982 to 1999. Science 300,1560 – 1563. (doi:10.1126/science.1082750)
33. Alo CA, Wang G. 2008 Hydrological impact of thepotential future vegetation response to climatechanges projected by 8 GCMs. J. Geophys. Res. 113,G03011. (doi:10.1029/2007JG000598)
34. Pan Y et al. 2011 A large and persistent carbon sinkin the world’s forests. Science 333, 988 – 993.(doi:10.1126/science.1201609)
35. Houghton RA, Hackler JL. 2006 Emissions of carbonfrom land use change in sub-Saharan Africa.J. Geophys. Res. 111, G02003. (doi:10.1029/2005JG000076)
36. Achard F, Eva HD, Mayaux P, Stibig Jr H, Belward A.2004 Improved estimates of net carbon emissionsfrom land cover change in the tropics for the 1990s.Glob. Biogeochem. Cycles 18, GB2008. (doi:10.1029/2003GB002142)
37. Weber U et al. 2009 The interannual variability ofAfrica’s ecosystem productivity: a multi-modelanalysis. Biogeosciences 6, 285 – 295. (doi:10.5194/bg-6-285-2009)
38. Churkina G, Running SW. 1998 Contrasting climaticcontrols on the estimated productivity of globalterrestrial biomes. Ecosystems 1, 206 – 215. (doi:10.1007/s100219900016)
39. Jolly WM, Nemani R, Running SW. 2005 Ageneralized, bioclimatic index to predict foliarphenology in response to climate. Glob. ChangeBiol. 11, 619 – 632. (doi:10.1111/j.1365-2486.2005.00930.x)
40. Amthor JS. 1995 Terrestrial higher-plant response toincreasing atmospheric [CO2] in relation to theglobal carbon cycle. Glob. Change Biol. 1, 243 – 274.(doi:10.1111/j.1365-2486.1995.tb00025.x)
41. Lloyd J, Farquhar GD. 1996 The CO2 dependence ofphotosynthesis, plant growth responses to elevatedatmospheric CO2 concentrations and their interactionwith soil nutrient status. I. General principles andforest ecosystems. Funct. Ecol. 10, 4 – 32. (doi:10.2307/2390258)
42. Friedlingstein P et al. 2006 Climate-carbon cyclefeedback analysis: results from the C4MIP modelintercomparison. J. Clim. 19, 3337 – 3353. (doi:10.1175/JCLI3800.1)
43. Stephens BB et al. 2007 Weak northern and strongtropical land carbon uptake from vertical profiles ofatmospheric CO2. Science 316, 1732 – 1735. (doi:10.1126/science.1137004)
44. Ballantyne AP, Alden CB, Miller JB, Tans PP, WhiteJWC. 2012 Increase in observed net carbon dioxideuptake by land and oceans during the past 50years. Nature 488, 70 – 72. (doi:10.1038/nature11299)
45. Higgins SI, Scheiter S. 2012 Atmospheric CO2
forces abrupt vegetation shifts locally, but notglobally. Nature 488, 209 – 213. (doi:10.1038/nature11238)
46. Norby RJ et al. 2005 Forest response to elevated CO2
is conserved across a broad range of productivity.Proc. Natl Acad. Sci. USA 102, 18 052 – 18 056.(doi:10.1073/pnas.0509478102)
47. Fisher JB, Badgley G, Blyth E. 2012 Global nutrientlimitation in terrestrial vegetation from remotesensing. Glob. Biogeochem. Cycles 26, GB3007.(doi:10.1029/2011GB004252)
48. Finzi AC et al. 2007 Increases in nitrogen uptakerather than nitrogen-use efficiency support higherrates of temperate forest productivity underelevated CO2. Proc. Natl Acad. Sci. USA 104,14 014 – 14 019. (doi:10.1073/pnas.0706518104)
49. Leakey ADB, Ainsworth EA, Bernacchi CJ, Rogers A,Long SP, Ort DR. 2009 Elevated CO2 effects on plantcarbon, nitrogen, and water relations: six importantlessons from FACE. J. Exp. Bot. 60, 2859 – 2876.(doi:10.1093/jxb/erp096)
50. Hungate BA, Dukes JS, Shaw MR, Luo Y, Field CB.2003 Nitrogen and climate change. Science 302,1512 – 1513. (doi:10.1126/science.1091390)
51. Gerber S, Hedin LO, Oppenheimer M, Pacala SW,Shevliakova E. 2010 Nitrogen cycling and feedbacksin a global dynamic land model. Glob. Biogeochem.Cycles 24, GB1001. (doi:10.1029/2008GB003336)
52. Fisher JB, Sitch S, Malhi Y, Fisher RA, Huntingford C,Tan S-Y. 2010 Carbon cost of plant nitrogenacquisition: a mechanistic, globally-applicablemodel of plant nitrogen uptake and fixation. Glob.Biogeochem. Cycles 24, GB1014. (doi:10.1029/2009GB003621)
53. Jain A, Yang X, Kheshgi H, McGuire AD, Post W,Kicklighter D. 2010 Nitrogen attenuation ofterrestrial carbon cycle response to globalenvironmental factors. Glob. Biogeochem. Cycles 23,GB4028. (doi:10.1029/2009GB003519)
54. Sokolov AP, Kicklighter DW, Melillo JM, Felzer BS,Schlosser CA, Cronin TW. 2008 Consequences ofconsidering carbon – nitrogen interactions on thefeedbacks between climate and the terrestrialcarbon cycle. J. Clim. 21, 3776 – 3796. (doi:10.1175/2008JCLI2038.1)
55. Thornton PE, Lamarque J-F, Rosenbloom NA,Mahowald NM. 2007 Influence of carbon – nitrogencycle coupling on land model response to CO2
fertilization and climate variability. Glob.Biogeochem. Cycles 21, GB4018. (doi:10.1029/2006GB002868)
56. Zaehle S, Friend AD, Friedlingstein P, Dentener F,Peylin P, Schulz M. 2010 Carbon and nitrogen cycledynamics in the O-CN land surface model. II. therole of the nitrogen cycle in the historical terrestrialC balance. Glob. Biogeochem. Cycles 24, GB1006.(doi:10.1029/2009GB003522)

rstb.royalsocietypublishing.orgPhilTransR
SocB368:20120376
9
on August 12, 2013rstb.royalsocietypublishing.orgDownloaded from
57. Xu R, Prentice IC. 2008 Terrestrial nitrogen cyclesimulation with a dynamic global vegetation model.Glob. Change Biol. 14, 1745 – 1764. (doi:10.1111/j.1365-2486.2008.01625.x)
58. Wang YP, Houlton B, Field CB. 2007 A model ofbiogeochemical cycles of carbon, nitrogen andphosphorus including symbiotic nitrogen fixationand phosphatase production. Glob. Biogeochem.Cycles 21, GB1018. (doi:10.1029/2006GB002797)
59. IPCC. 2007 Contribution of Working Group I to theFourth Assessment Report of the IntergovernmentalPanel on Climate Change. In Climate change 2007:the physical science basis (eds S Solomon, D Qin,M Manning, Z Chen, M Marquis, KB Averyt), pp.996. Cambridge, UK and New York, NY, USA:Cambridge University Press.
60. Sitch S et al. Submitted. Trends and drivers ofregional sources and sinks of carbon dioxide overthe past two decades.
61. Bombelli A et al. 2009 An outlook on the sub-Saharan Africa carbon balance. Biogeosciences 6,2193 – 2205. (doi:10.5194/bg-6-2193-2009)
62. Levy PE, Cannell MGR, Friend AD. 2004 Modellingthe impact of future changes in climate, CO2
concentration and land use on natural ecosystemsand the terrestrial carbon sink. Glob. Environ.Change 14, 21 – 30. (doi:10.1016/j.gloenvcha.2003.10.005)
63. Sitch S et al. 2003 Evaluation of ecosystemdynamics, plant geography and terrestrial carboncycling in the LPJ dynamic global vegetation model.Glob. Change Biol. 9, 161 – 185. (doi:10.1046/j.1365-2486.2003.00569.x)
64. Smith B, Prentice IC, Sykes MT. 2001 Representationof vegetation dynamics in modelling of terrestrial
ecosystems: comparing two contrasting approacheswithin European climate space. Glob. Ecol. Biogeogr.10, 621 – 637. (doi:10.1046/j.1466-822X.2001.00256.x)
65. Krinner G et al. 2005 Evaluation of ecosystemdynamics, plant geography and terrestrial carboncycling in the LPJ dynamic global vegetation model.Glob. Biogeochem. Cycles 19, 1 – 33.
66. Cramer W et al. 2001 Global response of terrestrialecosystem structure and function to CO2 and climatechange: results from six dynamic global vegetationmodels. Glob. Change Biol. 7, 357 – 373. (doi:10.1046/j.1365-2486.2001.00383.x)
67. Clark DB et al. 2011 The joint UK landenvironment simulator (JULES), modeldescription. II. Carbon fluxes and vegetationdynamics. Geosci. Model. Dev. 4, 701 – 722.(doi:10.5194/gmd-4-701-2011)
68. Zeng N, Qian H, Roedenbeck C, Heimann M. 2005Impact of 1998 – 2002 midlatitude drought andwarming on terrestrial ecosystem and the globalcarbon cycle. Geophys. Res. Lett. 32, L22709.(doi:10.1029/2005GL024607)
69. New M, Hulme M, Jones P. 1999 Representingtwentieth-century space-time climate variability.I. Development of a 1961 – 90 mean monthlyterrestrial climatology. J. Clim. 12, 829 – 856.(doi:10.1175/1520-0442(1999)012,0829:RTCSTC.2.0.CO;2)
70. New M, Hulme M, Jones P. 2000 Representingtwentieth-century space-time climate variability. II.Development of 1901 – 1996 monthly grids ofterrestrial surface climate. J. Clim. 13, 2217 – 2238.(doi:10.1175/1520-0442(2000)013,2217:RTCSTC.2.0.CO;2)
71. New M, Lister D, Hulme M, Makin I. 2002 A high-resolution data set of surface climate over globalland areas. Clim. Res. 21, 1 – 25. (doi:10.3354/cr021001)
72. Kalnay E et al. 1996 The NCEP/NCAR 40-yearreanalysis project. Bull. Am. Meteorol. Soc. 77,437 – 471. (doi:10.1175/1520-0477(1996)077,0437:TNYRP.2.0.CO;2)
73. James R, Washington R, Rowell DP. 2013Implications of global warming for the climate ofAfrican rainforests. Phil. Trans. R. Soc. B 368,20120298. (doi:10.1098/rstb.2012.0298)
74. Salinger MJ, Jones PD. 1996 Southern hemisphereclimate: the modern record. Papers Proc. Royal Soc.Tasmania 130, 101 – 107.
75. Galbraith D, Levy PE, Sitch S, Huntingford C, Cox P,Williams M, Meir P. 2010 Multiple mechanisms ofAmazonian forest biomass losses in three dynamicglobal vegetation models under climate change.New Phytol. 187, 647 – 665. (doi:10.1111/j.1469-8137.2010.03350.x)
76. Farquhar GD, Sharkey TD. 1982 Stomatalconductance and photosynthesis. Annu. Rev. PlantPhysiol. 33, 317 – 345. (doi:10.1146/annurev.pp.33.060182.001533)
77. Fisher JB, Badgley G, Kahn BH, Malhi Y. Inpreparation. The Sheltering Sky: presistent cloudcover sustains the African tropical rainforests.
78. Fisher RA, Williams M, Da Costa AL, Malhi Y, DaCosta RF, Almeida S, Meir P. 2007 The response ofan eastern Amazonian rain forest to droughtstress: results and modelling analyses from athroughfall exclusion experiment. Glob. Change Biol.13, 2361 – 2378. (doi:10.1111/j.1365-2486.2007.01417.x)