influences of canopy complexity on carbon, water and energy fluxes
TRANSCRIPT
1
INFLUENCES OF STRUCTURE, PHYSIOLOGICAL-FUNCTION, AND ENVIRONMENT ON CARBON, WATER AND ENERGY FLUXES OF A
TEMPERATE BROADLEAVED DECIDUOUS FOREST―AN ASSESSMENT WITH THE BIOPHYSICAL MODEL, CANOAK
Dennis Baldocchi Ecosystem Science Division
Department of Environmental Science, Policy and Management 151 Hilgard Hall
University of California, Berkeley Berkeley, CA 94720
[email protected] 510-642-2874
Kell Wilson
Atmospheric Turbulence and Diffusion Division, NOAA PO Box 2456
Oak Ridge, TN 37831
Lianhong Gu Ecosystem Science Division
Department of Environmental Science, Policy and Management 151 Hilgard Hall
University of California, Berkeley Berkeley, CA 94720
Keynote presentation at IUFRO Canopy Processes Conference on Linking the Complexity of Forest Canopies to Ecosystem and Landscape Functioning, July 11-19, 2001 Submitted to: Tree Physiology Revised: February 15, 2002
2
ABSTRACT Baldocchi, D.D. et al. 2002. Influences of Structure, Physiological-Function, and
Environment on Carbon, Water and Energy Fluxes of Temperate Broadleaved Deciduous Forests―An Assessment with the Biophysical Model, CANOAK. Tree Physiology. (revised)
How canopy structure, its physiological functioning and environment interact to
control and drive the exchange of carbon dioxide and water vapor between a temperate
forest stand and the atmosphere is the subject of this essay. First, we present an
overview on how temporal and spatial variations in canopy structure (e.g. leaf area index,
species, leaf inclination angles, leaf clumping) and physiological functioning (e.g.
maximal stomatal conductance, photosynthetic capacity) modulate carbon dioxide and
water vapor fluxes. Then, using the biophysical model, CANAOK, we quantify the
effects of leaf dimension and thickness, vertical variations in leaf area and photosynthetic
capacity, leaf clumping, leaf inclination angles, photosynthetic capacity, stomatal
conductance and weather on the annual sums of carbon dioxide, water vapor and sensible
heat exchange. Finally, we discuss issues relating to how much detail is needed in a
model to predict fluxes of carbon dioxide and water vapor with acceptable fidelity.
Key Words: biosphere-atmosphere interactions; biocomplexity, canopy photosynthesis, evaporation, ecophysiology

3
1. Introduction
On walking through a temperate hardwood forest, one of the first impressions one
draws is that a forest is a structurally complex. Immediately, one observes trees of
multiple stature, age and species (Whittaker, 1975; Smith and Huston, 1989; Parker,
1995). Stopping and looking upward into the canopy crown, one sees that many leaves
are sunlit leaves, their inclination angles are rather erect, they are rather thick and they
tend to be arranged in clumps (Hutchison et al., 1983; Kruijt, 1986; Ellsworth and Reich,
1993; Parker, 1995). At eye-level, tree trunks, understorey vines, saplings and shrubs
immediately come to view. Understorey leaves are relatively thin and they tend to be
oriented horizontally, to absorb as much light as possible, in the sun-dappled shade.
Looking downward one sees fresh and decomposing litter, soil, rocks, fallen logs,
seedlings, herbs and shrubs.
Unseen by the naked eye are the physiological activities of the forest. As stomata
open to allow CO2 to diffuse into the mesophyll for photosynthesis, water is lost (Makela
et al., 1996). And under the forest floor, respiration by roots and microbes is releasing
CO2 to the atmosphere.
Structural and functional aspects of a forest are not static. On visiting a forest
many times over a year, one will observe both gradual and dramatic transitions in
structure and function. During the winter, the hardwood forest is leafless and dormant,
but respiring. With the occurrence of spring comes a flush of growth. Rapid changes in
biological activity and structure occur as leaves expand, nodes elongate, roots grow and
reproductive organs emerge (Larcher, 1975; Hutchison and Matt, 1977; Parker, 1995).
Coincidently, photosynthetic capacity of leaves changes rapidly during this period
4
(Wilson et al., 2000, 2001a), as chloroplast with nitrogen-rich RUBP are constructed.
During the summer, gradual changes in canopy structure, maximum stomatal
conductance and physiological capacity occur as leaves age, they experience water
deficits, acclimate, are eaten or drop due to prolonged drought (Falge et al., 1996;
Niinemets et al., 1999; Wilson et al., 2000, 2001a). With the approach of autumn, the
face of the landscape changes yet again. Leaves re-translocate nitrogen back to stems,
their photosynthetic capacity diminishes, they senesce, change color and drop from the
trees (Larcher, 1975; Hutchison and Matt, 1977; Wilson et al., 2000).
Spatial and temporal variations in canopy structure and function, cited above,
affect the canopy microclimate and, consequently, influence carbon dioxide and water
vapor exchange in numerous ways. For example, interactions between structural and
functional properties of forests alter: 1) wind and turbulence within and above the
canopy; 2) the interception and scattering of photons throughout the canopy; 3) the heat
load on leaves and the soil; 4) the physiological resistances to water and CO2 transfer
(Meyers and Paw U, 1986; Baldocchi and Meyers, 1998; Albertson et al., 2001).
The objective of this paper is to discuss and quantify how variations of canopy
structure, physiological function and environment affect carbon dioxide and water vapor
exchange of a temperate broadleaved forest. We accomplish this goal by using a
biophysical model, CANOAK. This work builds upon earlier analyses, which have
focused on how short-term fluxes of carbon dioxide and water respond to environmental
drivers when canopy structural and functional features are altered (e.g. de Wit, 1965;
Duncan et al., 1967; Norman, 1979, 1993; Meyers and Paw U, 1986; Long, 1991;
Baldocchi and Harley, 1995; Leuning et al., 1995; Williams et al., 1998; Raupach, 1998;
5
Baldocchi and Meyers, 1998; Wu et al., 2000; Albertson et al., 2001), by focusing on
annual sums of carbon, water and energy exchange.
2. Concepts and Principles
To quantify fluxes of carbon dioxide, water and energy between a forest and the
atmosphere several subjects must be considered. First, one must first identify the
biophysical and ecophysiological processes that influence trace gas exchange
significantly. Then one needs to represent these processes mathematically and integrate
them throughout the domain of the canopy on the basis of local environmental drivers.
This second task depends upon how we define, geometrically, the forest canopy and the
distribution of leaves throughout. In this section we discuss the biophysical and
mathematical principles used in contemporary biophysical models such as CANOAK.
A. Biophysical Principles
The exchange of carbon dioxide and water vapor between a forest and the
atmosphere is the consequence of a suite of biological, physical and chemical processes
acting in concert. Key features in contemporary soil-vegetation-atmosphere-transfer
(SVAT) models include subroutines that evaluate: 1) the conservation of mass and
energy; 2) the radiation balance of leaves and the soil; 3) turbulent transfer of heat,
moisture and momentum; 4) radiative transfer through the foliage; and 5) a coupling of
stomatal conductance to carbon and water fluxes, nutrient content of leaves and soil
moisture in the root zone (Norman, 1979; Meyers and Paw U, 1986; Leuning et al., 1995;
Sellers et al., 1997; Baldocchi and Meyers, 1998; Wohlfahrt et al., 2001; Williams et al.,
2001; Albertson et al. 2001).
6
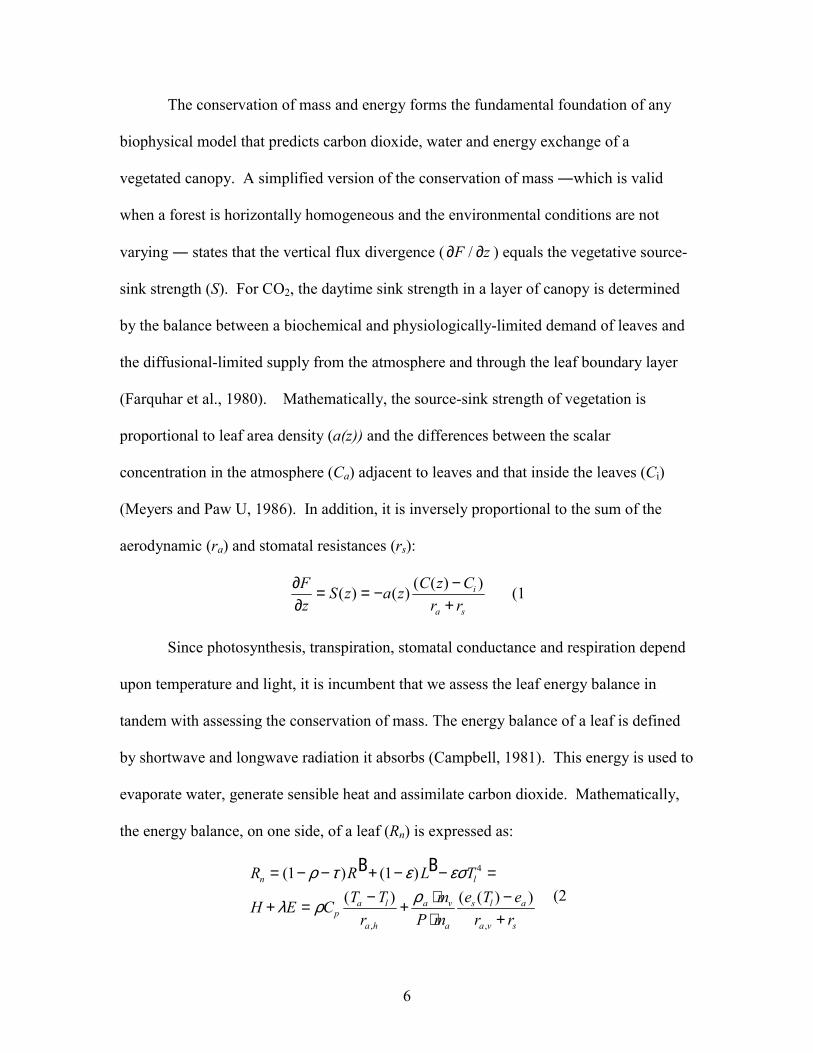
The conservation of mass and energy forms the fundamental foundation of any
biophysical model that predicts carbon dioxide, water and energy exchange of a
vegetated canopy. A simplified version of the conservation of mass ―which is valid
when a forest is horizontally homogeneous and the environmental conditions are not
varying ― states that the vertical flux divergence (∂ ∂F z/ ) equals the vegetative source-
sink strength (S). For CO2, the daytime sink strength in a layer of canopy is determined
by the balance between a biochemical and physiologically-limited demand of leaves and
the diffusional-limited supply from the atmosphere and through the leaf boundary layer
(Farquhar et al., 1980). Mathematically, the source-sink strength of vegetation is
proportional to leaf area density (a(z)) and the differences between the scalar
concentration in the atmosphere (Ca) adjacent to leaves and that inside the leaves (Ci)
(Meyers and Paw U, 1986). In addition, it is inversely proportional to the sum of the
aerodynamic (ra) and stomatal resistances (rs):
∂∂
= = − −+
Fz
S z a z C z Cr r
i
a s
( ) ( ) ( ( ) ) (1
Since photosynthesis, transpiration, stomatal conductance and respiration depend
upon temperature and light, it is incumbent that we assess the leaf energy balance in
tandem with assessing the conservation of mass. The energy balance of a leaf is defined
by shortwave and longwave radiation it absorbs (Campbell, 1981). This energy is used to
evaporate water, generate sensible heat and assimilate carbon dioxide. Mathematically,
the energy balance, on one side, of a leaf (Rn) is expressed as:
R R L T
H E C T Tr
mP m
e T er r
n l
pa l
a h
a v
a
s l a
a v s
= − − + − − =
+ = − + ⋅⋅
−+
B B( ) ( )( ) ( ( ) )
, ,
1 1 4ρ τ ε εσ
λ ρ ρ (2

7
The energy balance of a leaf is a function of the reflectance (ρ), transmittance (τ) and
infrared emissitivity (ε) of a leaf and the flux densities of incoming global solar (R↓ ) and
terrestrial (L↓ ) radiation. The radiation balance is partitioned into sensible (H) and latent
heat (λE) flux densities. In turn, these energy flux densities are evaluated using Ohms
Law resistance analog equations, which are dependent upon air density (ρa), the specific
heat of dry air (Cp), air temperature (Ta), leaf temperature (Tl), boundary layer resistances
for heat and vapor transfer (ra,h and ra,v), stomatal resistance (rs), pressure (P), mv and ma
are the molecular masses of vapor and air, the saturation vapor pressure at leaf
temperature (es(Tl)) and the atmospheric vapor pressure (ea). At the stand level, energy
exchange with the soil and boles must also be considered, too.
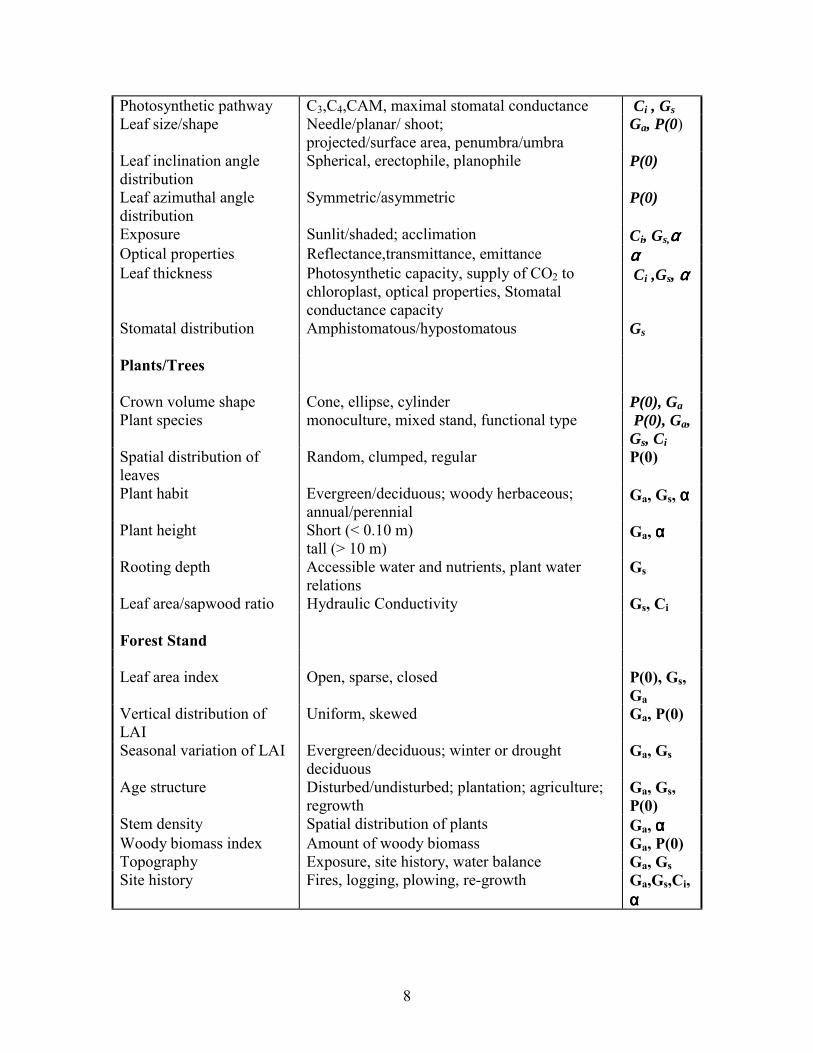
With a biophysical framework in hand (Eqs. 1 and 2), one can associate the
physical and functional attributes of single leaves, individual plants and plant stands with
factors that impact carbon dioxide, water vapor and energy exchange. Such information
is tabulated in Table 1. In principle, the ultimate rates of photosynthesis and transpiration
that a leaf can achieve are constrained by leaf morphology, photosynthetic capacity, root-
shoot allocation and resource acquisition (e.g. nutrients and soil moisture) (Field, 1991;
Schulze, 1994; Schulze et al. 1994; Korner, 1994; Reich et al., 1997). At the stand scale,
structural factors affecting light absorption and the aerodynamics of the canopy govern
ultimate rates of carbon dioxide, water vapor and energy exchange.
Table 1. Structural and functional attributes of leaves, plants and plant stands and their impact on carbon, water and energy fluxes. Impacted factors include: Ga: aerodynamic conductance; Gs: surface conductance; P(0): light transmission through a leaf or canopy; αααα: albedo or reflectivity; Ci: biochemical capacity Characteristic Structural or Functional Attribute Factors Leaves
8
Photosynthetic pathway C3,C4,CAM, maximal stomatal conductance Ci , Gs Leaf size/shape Needle/planar/ shoot;
projected/surface area, penumbra/umbra Ga, P(0)
Leaf inclination angle distribution
Spherical, erectophile, planophile P(0)
Leaf azimuthal angle distribution
Symmetric/asymmetric P(0)
Exposure Sunlit/shaded; acclimation Ci, Gs,αααα Optical properties Reflectance,transmittance, emittance αααα Leaf thickness Photosynthetic capacity, supply of CO2 to
chloroplast, optical properties, Stomatal conductance capacity
Ci ,Gs, αααα
Stomatal distribution Amphistomatous/hypostomatous Gs Plants/Trees Crown volume shape Cone, ellipse, cylinder P(0), Ga Plant species monoculture, mixed stand, functional type P(0), Ga,
Gs, Ci Spatial distribution of leaves
Random, clumped, regular P(0)
Plant habit Evergreen/deciduous; woody herbaceous; annual/perennial
Ga, Gs, α α α α
Plant height Short (< 0.10 m) tall (> 10 m)
Ga, αααα
Rooting depth Accessible water and nutrients, plant water relations
Gs
Leaf area/sapwood ratio Hydraulic Conductivity Gs, Ci Forest Stand Leaf area index Open, sparse, closed P(0), Gs,
Ga Vertical distribution of LAI
Uniform, skewed Ga, P(0)
Seasonal variation of LAI Evergreen/deciduous; winter or drought deciduous
Ga, Gs
Age structure Disturbed/undisturbed; plantation; agriculture; regrowth
Ga, Gs, P(0)
Stem density Spatial distribution of plants Ga, αααα Woody biomass index Amount of woody biomass Ga, P(0) Topography Exposure, site history, water balance Ga, Gs Site history Fires, logging, plowing, re-growth Ga,Gs,Ci,
αααα
9
B. Mathematical Principles
The challenge facing any biophysical model is to represent the information
produced in Table 1 correctly on appropriate time and space scales. In this section we
discuss ways of accomplishing this task.
i. Integrating Non-Linear Functions
Many biophysical processes (photosynthesis, respiration, stomatal conductance,
infrared energy emission, saturation vapor pressure, transpiration) are non-linear
functions of independent environmental variables, such as light (R↓), wind velocity (u),
air temperature (T), humidity deficits (D) and CO2, or themselves. Proper assessment of
non-linear biophysical functions requires translating the state external driving variables to
the point of action―a task performed with the coupling of a micrometeorology model.
For example, it is incorrect to compute photosynthesis rates of a leaf buried deep in the
canopy with the flux density of light energy incident at the top of the canopy.
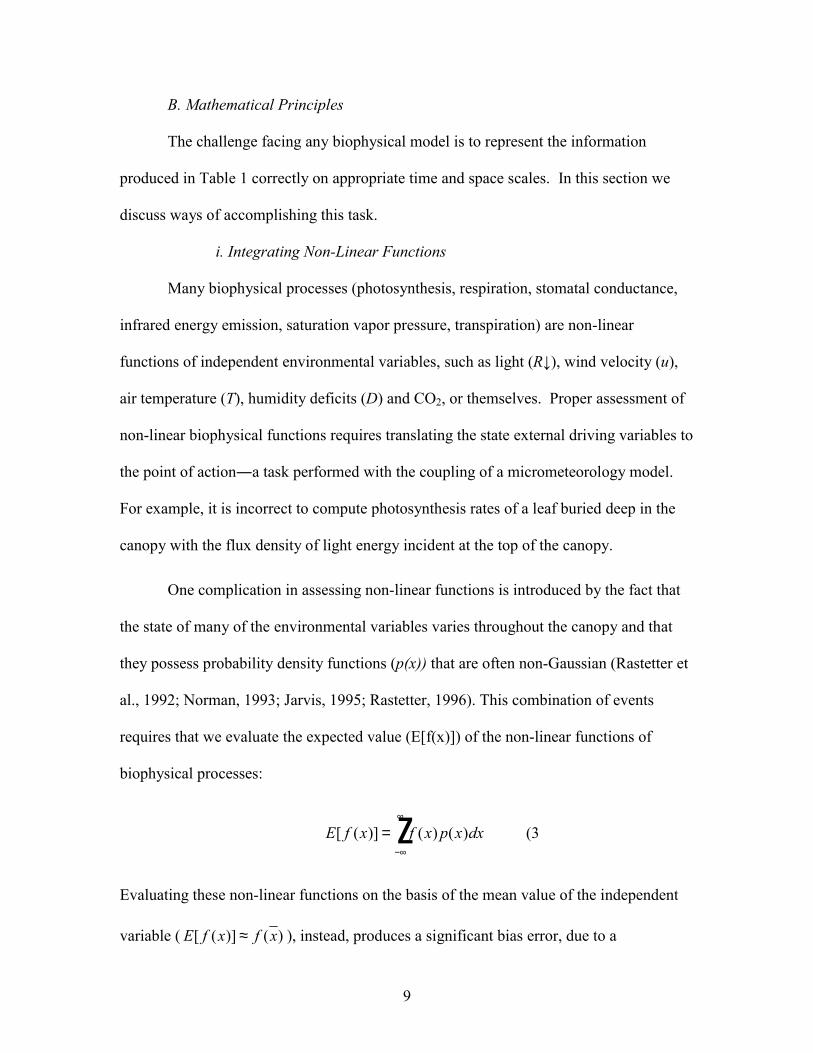
One complication in assessing non-linear functions is introduced by the fact that
the state of many of the environmental variables varies throughout the canopy and that
they possess probability density functions (p(x)) that are often non-Gaussian (Rastetter et
al., 1992; Norman, 1993; Jarvis, 1995; Rastetter, 1996). This combination of events
requires that we evaluate the expected value (E[f(x)]) of the non-linear functions of
biophysical processes:
E f x f x p x dx[ ( )] ( ) ( )=−∞
∞z (3
Evaluating these non-linear functions on the basis of the mean value of the independent
variable ( E f x f x[ ( )] ( )≈ ), instead, produces a significant bias error, due to a
10
phenomenon known as Jensens Inequality (Rastetter et al., 1992; Norman, 1993; Ruel
and Ayers, 1999).
The dual source technique is a discrete, but powerful, means of assessing
Equation 3. It involves computing the fractions of sunlit and shaded leaves and evaluating
the non-linear biophysical functions according to the environment on those two leaf
classes (Sinclair et al., 1976; Norman et al., 1979, 1993; dePury and Farquhar, 1997).
When assessing non-linear biophysical functions over the course of a season or
year one needs to evaluate how model scaling and curvature parameters vary with time
and space (Wilson et al., 2001a), by species (Wohlfarht et al., 2000; Wullschleger, 1993),
or by plant functional type (Schulze et al., 1994; Korner, 1994; Wullschleger, 1993).
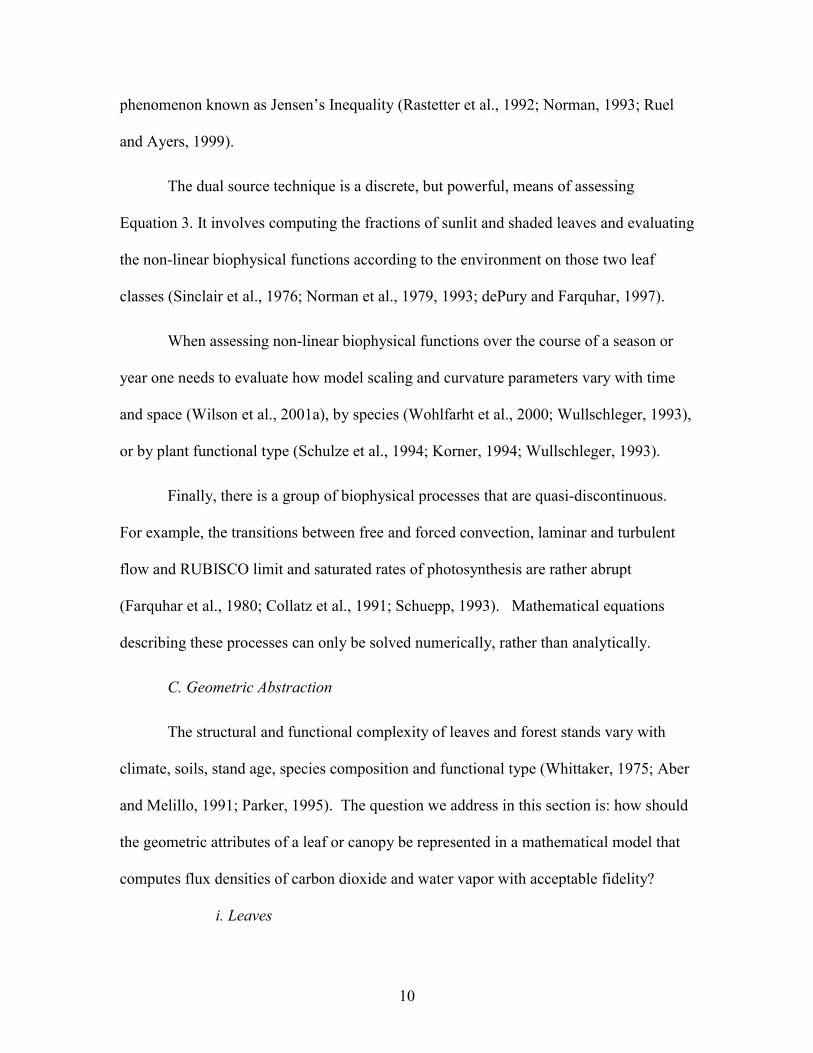
Finally, there is a group of biophysical processes that are quasi-discontinuous.
For example, the transitions between free and forced convection, laminar and turbulent
flow and RUBISCO limit and saturated rates of photosynthesis are rather abrupt
(Farquhar et al., 1980; Collatz et al., 1991; Schuepp, 1993). Mathematical equations
describing these processes can only be solved numerically, rather than analytically.
C. Geometric Abstraction
The structural and functional complexity of leaves and forest stands vary with
climate, soils, stand age, species composition and functional type (Whittaker, 1975; Aber
and Melillo, 1991; Parker, 1995). The question we address in this section is: how should
the geometric attributes of a leaf or canopy be represented in a mathematical model that
computes flux densities of carbon dioxide and water vapor with acceptable fidelity?
i. Leaves
11
The cross section of a leaf consists of the external cuticle, an upper and lower
epidermis, palisade mesophyll, spongy mesophyll, stomata and intercellular space.
Leaves are usually between 50 and 200 µm thick (Parkhurst, 1986; Vogelmann et al.,
1989). In general, sun leaves are thicker than shade leaves, have greater specific mass
and they possess more stomata per unit area (Terashima and Saeki, 1983; Ellsworth and
Reich, 1993; Reich et al., 1997; Terashima et al., 2001).
Information on leaf thickness provides an excellent surrogate for estimating a
number of model parameters. In principle, thicker leaves have more leaf nitrogen content
and greater photosynthetic capacity, respiration rates and stomatal conductances (Evans,
1989; Field, 1991; Schulze et al., 1994; Reich et al., 1997; Wilson et al., 2000).
With regards to water vapor and CO2 diffusion through the stomata, leaves may
be hypostomatous (having stomata on one side) or amphistomatous (having stomata on
both sides of the leaf. Amphistomatous leaves tend to be associated with thicker leaves,
and ones with higher photosynthetic capacity and inhabiting habitats with full sun and
adequate soil moisture (Terashima et al., 2001). With regards to mass and energy
exchange, water vapor originates from the inner side of the guard cells and from the
subsidiary cells. CO2 diffuses across the intercellular air spaces of the mesophyll.
Mathematically, one can treat a leaf in three-dimensional geometric detail
(Parkhurst, 1986; Farquhar, 1989; Roth-Nebelsick, 2001), as a one-dimensional system
(Terashima et al., 2001) or as a holistic, integrated entity (Gaastra, 1959; Norman, 1979).
If one treats the leaf as an integrated unit, diffusion through the stomata on top and
bottom sides of amphistomatous leaves is assumed to occur in parallel.
12
Technically, photosynthesis is a function of the CO2 concentration of the
chloroplast (Farquhar et al., 1980; Farquhar, 1989). In practice, parameters of the
Farquhar photosynthesis model are evaluated from gas exchange measurements and are
evaluated in terms of the intercellular CO2 concentration (Ci). Conceptually,
intercellular CO2 concentration (Ci) is a function of leaf photosynthesis (A) and a leaf
conductance (g) (Farquhar, 1989):
C C Agi a= − (4
By treating a leaf as a lumped entity, one ignores spatial gradients in diffusion (Parkhurst
et al., 1988; Terashima et al., 2001), photosynthetic capacity (Terashima and Saeki, 1983)
and radiation (Terashima and Saeki, 1983; Vogelmann et al., 1989), which occur within
the mesophyll, and across the leaf (Roth-Nebelsick, 2001). Therefore, one either assumes
that the CO2 concentration in the substomatal cavity, in the intercellular spaces and in the
chloroplast stroma are equal or that the boundary layer and mesophyll conductances are
infinite, as compared with the stomatal conductance.
Patchy stomatal closure complicates the assessment of the intercellular CO2
concentration. Calculated values of intercellular CO2 (Ci) from gas exchange can be
erroneous if there is patchy stomatal closure, as when leaves experience low leaf water
potentials (Laisk 1983; Mott and Buckley, 2000). Proper estimates of a bulk average Ci
values requires weighting Ci values of the patches by their respective stomatal
conductances (Farquhar, 1989).
ii. The Forest Stand
At the canopy scale, a hierarchy of biophysical models exists that vary in
complexity on how canopy structure and function is represented (Raupach and Finnigan,
13
1988; Norman, 1993; Sellers et al., 1997). At the simplest level, plant canopies can be
abstracted as a big-leaf (Monteith, 1965; Sellers et al., 1997). But this assumption is an
extreme simplification of how forests exist and function (Pyles et al., 2000). Better
fidelity is achieved by using a dual source abstraction; a concept that accounts for the
different environments on sunlit and shaded leaves, as discussed above (Sinclair et al.,
1976; Norman, 1993; dePury and Farquhar, 1997). For open forest stands, a two-layer
model, with distinct soil and plant compartments, is a reasonable representation (van den
Hurk and McNaughton, 1995; Norman et al. 1995). For multi-storied canopies, one-
dimensional, multi-layer models are able to incorporate as much pertinent detail on
canopy structure that is needed or occurs (Norman, 1979; Meyers and Paw U, 1986;
Leuning et al., 1995; Baldocchi and Meyers, 1998; Wu et al., 2000; Wohlfarht et al.,
2001; Pyles et al., 2000; Williams et al., 2001). Multi-layer models tend to produce
more accurate simulations of mass and energy exchange than do big-leaf models (Sinclair
et al., 1976; Norman, 1980; Pyles et al., 2000).
Detailed multi-layer models can also be used as guides to develop simpler and
mechanistically based big-leaf and dual-source algorithms. For example, Leuning et al.
(1995) used a detailed biophysical model to deduce that the canopy-scale light response
curve for photosynthesis is non-linear on an hour-by-hour basis, but is linear on a daily-
integrated time scale. Baldocchi and Meyers (1998) have used CANOAK to develop
scaling relations for normalized evaporation that are a function of leaf area index and
photosynthetic capacity.
Open canopies are better represented using three-dimensional models that treat
individual trees (Wang and Jarvis, 1990; Sinoquet et al., 2001). But three-dimensional
14
models are extremely difficult to parameterize and implement. Open canopies require
accurate representations of mass and energy exchange at the soil surface, because a
substantial amount of energy exchange occurs there (Baldocchi et al., 2000).
Features such as honami (waving plants in wind), leaf flutter and horizontal scale
variations in canopy and structure are beyond the scope of this paper. But they are
features can alter mass and energy exchange (Raupach and Finnigan, 1997; Ikeda et al.,
2001; Albertson et al., 2001), too.
3. Model Overview
Since the biophysical model, CANOAK, is used to quantify the impacts of varying
canopy structure and physiological function on canopy scale carbon dioxide and water
vapor exchange, a brief overview of the model is presented in this section. The CANOAK
model consists of coupled micrometeorological and physiological modules. The
micrometeorological model computes leaf and soil energy exchange, turbulent diffusion,
scalar concentration profiles and radiative transfer through the canopy at hourly time
steps. Environmental variables, computed with the micrometeorological module, in turn,
drive the physiological models that compute leaf photosynthesis, stomatal conductance,
transpiration, and leaf, bole and soil/root respiration. The model is driven by a minimal
number of external variables that were measured above the forest. Environmental inputs
include incident photosynthetic photon flux density (Qp), air and soil temperature, wind
speed, relative humidity and CO2 concentration. The model and its subcomponents has
been tested and validated with eddy covariance measurements during the summer
growing season (Baldocchi and Harley, 1995; Baldocchi and Meyers, 1998) and over the
course of several years (Baldocchi and Wilson, 2001; Wilson and Baldocchi, 2001).
15
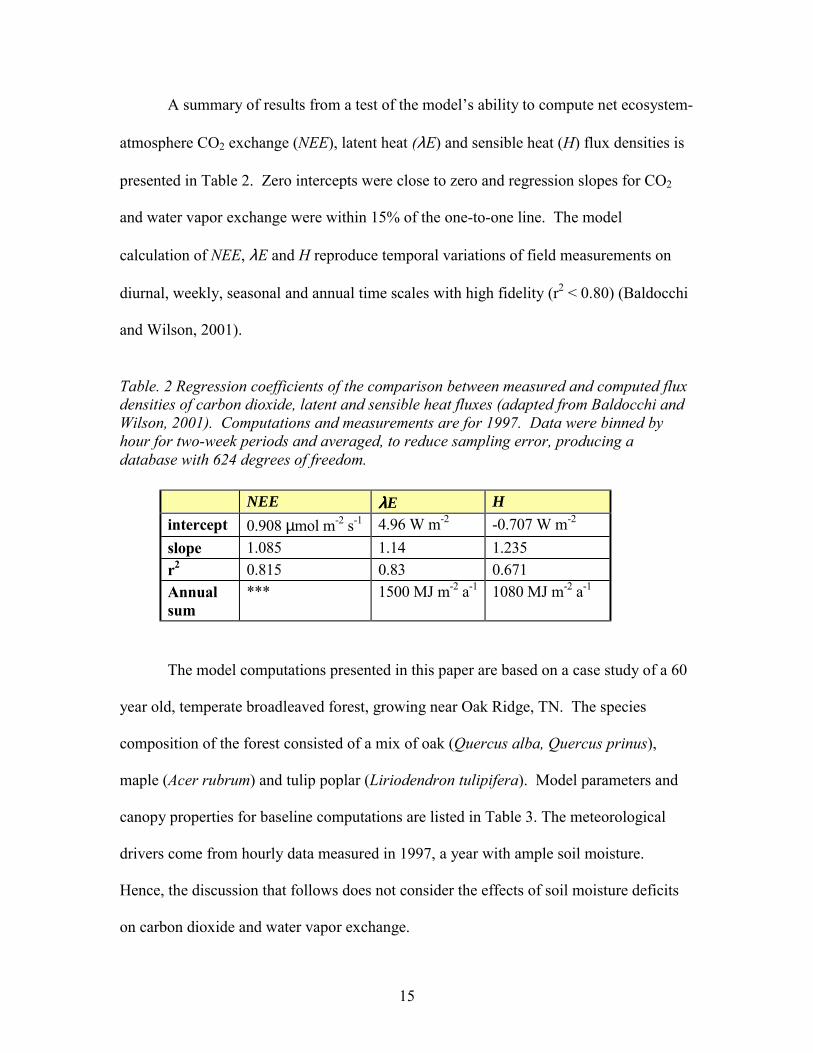
A summary of results from a test of the models ability to compute net ecosystem-
atmosphere CO2 exchange (NEE), latent heat (λE) and sensible heat (H) flux densities is
presented in Table 2. Zero intercepts were close to zero and regression slopes for CO2
and water vapor exchange were within 15% of the one-to-one line. The model
calculation of NEE, λE and H reproduce temporal variations of field measurements on
diurnal, weekly, seasonal and annual time scales with high fidelity (r2 < 0.80) (Baldocchi
and Wilson, 2001).
Table. 2 Regression coefficients of the comparison between measured and computed flux densities of carbon dioxide, latent and sensible heat fluxes (adapted from Baldocchi and Wilson, 2001). Computations and measurements are for 1997. Data were binned by hour for two-week periods and averaged, to reduce sampling error, producing a database with 624 degrees of freedom.
NEE λλλλE H intercept 0.908 µmol m-2 s-1 4.96 W m-2 -0.707 W m-2 slope 1.085 1.14 1.235 r2 0.815 0.83 0.671 Annual sum
*** 1500 MJ m-2 a-1 1080 MJ m-2 a-1
The model computations presented in this paper are based on a case study of a 60
year old, temperate broadleaved forest, growing near Oak Ridge, TN. The species
composition of the forest consisted of a mix of oak (Quercus alba, Quercus prinus),
maple (Acer rubrum) and tulip poplar (Liriodendron tulipifera). Model parameters and
canopy properties for baseline computations are listed in Table 3. The meteorological
drivers come from hourly data measured in 1997, a year with ample soil moisture.
Hence, the discussion that follows does not consider the effects of soil moisture deficits
on carbon dioxide and water vapor exchange.
16
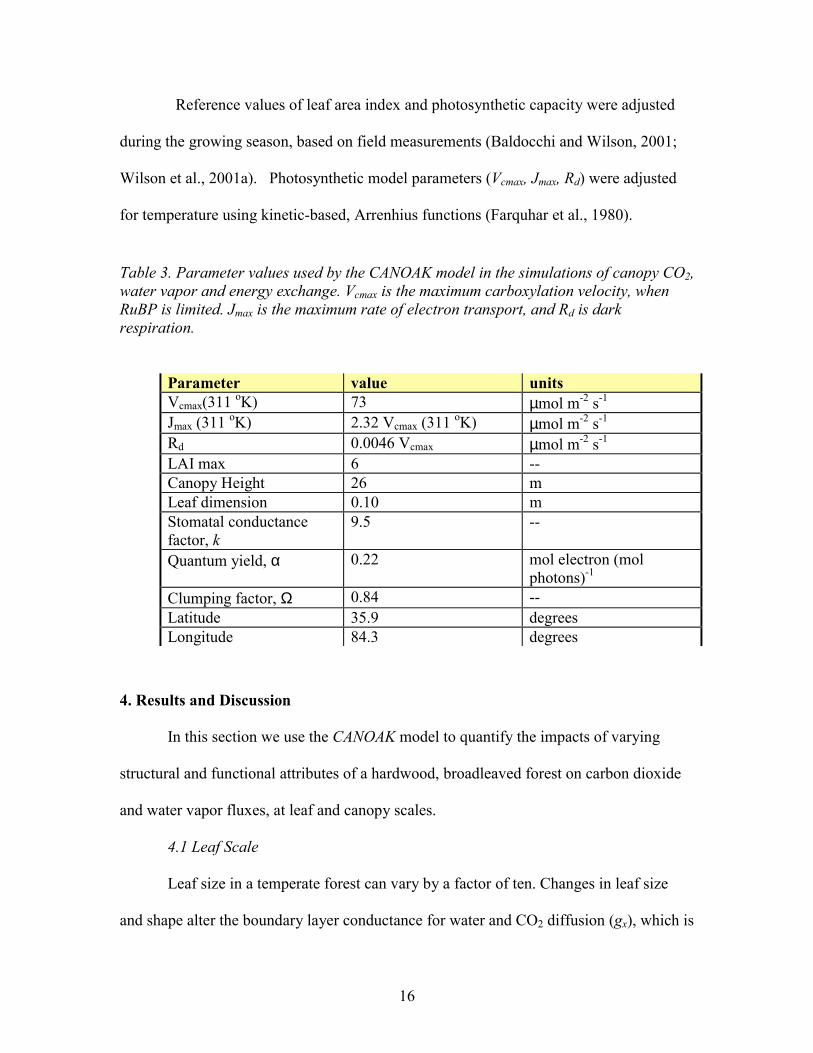
Reference values of leaf area index and photosynthetic capacity were adjusted
during the growing season, based on field measurements (Baldocchi and Wilson, 2001;
Wilson et al., 2001a). Photosynthetic model parameters (Vcmax, Jmax, Rd) were adjusted
for temperature using kinetic-based, Arrenhius functions (Farquhar et al., 1980).
Table 3. Parameter values used by the CANOAK model in the simulations of canopy CO2, water vapor and energy exchange. Vcmax is the maximum carboxylation velocity, when RuBP is limited. Jmax is the maximum rate of electron transport, and Rd is dark respiration.
Parameter value units Vcmax(311 oK) 73 µmol m-2 s-1 Jmax (311 oK) 2.32 Vcmax (311 oK) µmol m-2 s-1 Rd 0.0046 Vcmax µmol m-2 s-1 LAI max 6 -- Canopy Height 26 m Leaf dimension 0.10 m Stomatal conductance factor, k
9.5 --
Quantum yield, α 0.22 mol electron (mol photons)-1
Clumping factor, Ω 0.84 -- Latitude 35.9 degrees Longitude 84.3 degrees
4. Results and Discussion
In this section we use the CANOAK model to quantify the impacts of varying
structural and functional attributes of a hardwood, broadleaved forest on carbon dioxide
and water vapor fluxes, at leaf and canopy scales.
4.1 Leaf Scale
Leaf size in a temperate forest can vary by a factor of ten. Changes in leaf size
and shape alter the boundary layer conductance for water and CO2 diffusion (gx), which is
17
quantitatively a function of molecular diffusivity (Dx), a characteristic length scale (l) and
the dimensionless Sherwood number (Sh), which is a function of wind speed (u):
gr
D Shl
ulx
x
x= = ≈1 1 2( ) / (5
Conceptually, the diffusive boundary layer is much thinner over small leaves and needles
than big leaves or complex shoots (Schuepp, 1993). Smaller leaves, therefore, experience
larger boundary layer conductances. Hence, small leaves and needles are more efficient
at transferring heat, moisture and CO2 between their surface and the atmosphere and are
better coupled to their local environment than are big leaves (Jarvis and McNaughton,
1986; Schuepp, 1993; Roth-Nebelsick, 2001).
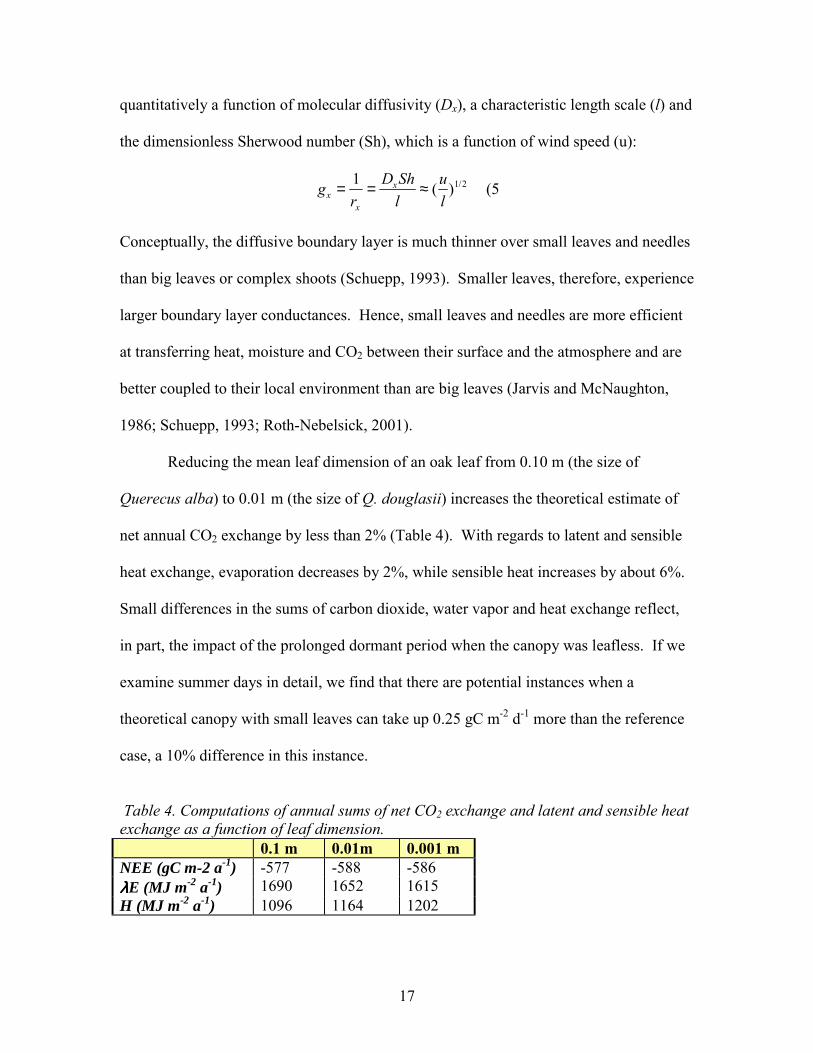
Reducing the mean leaf dimension of an oak leaf from 0.10 m (the size of
Querecus alba) to 0.01 m (the size of Q. douglasii) increases the theoretical estimate of
net annual CO2 exchange by less than 2% (Table 4). With regards to latent and sensible
heat exchange, evaporation decreases by 2%, while sensible heat increases by about 6%.
Small differences in the sums of carbon dioxide, water vapor and heat exchange reflect,
in part, the impact of the prolonged dormant period when the canopy was leafless. If we
examine summer days in detail, we find that there are potential instances when a
theoretical canopy with small leaves can take up 0.25 gC m-2 d-1 more than the reference
case, a 10% difference in this instance.
Table 4. Computations of annual sums of net CO2 exchange and latent and sensible heat exchange as a function of leaf dimension. 0.1 m 0.01m 0.001 m NEE (gC m-2 a-1) -577 -588 -586 λλλλE (MJ m-2 a-1) 1690 1652 1615 H (MJ m-2 a-1) 1096 1164 1202
18
There are several limitations associated with the computations in Table 4. Here,
we have ignored gradients of temperature across leaves (Roth-Nebelsick, 2001), dynamic
responses of photosynthesis and stomatal conductance to sunflecks (Kirschbaum et al.,
1988; Pearcy, 1990), dynamic response of the leaf energy balance to wind (Su et al.,
1996) and the impact of leaf size on penumbra and light distribution through the canopy
(Denholm, 1981). Models with greater mechanistic detail will be needed to address the
impact of these features, but their effects are assumed to be rather small compared with
the leaf boundary layer effect.
In many temperate deciduous forests leaf mass per unit area, maximum
carboxylation capacity (Vcmax) and nitrogen per unit area are well correlated with one
another. These leaf properties vary with height in a concerted manner (Ellsworth and
Reich, 1993; Kull and Niinemets, 1998; Wilson et al., 2000a) and their variation within a
canopy can be as great as their variability across the range of a species or plant functional
types (see Schulze et al., 1994; Reich et al., 1997). We quantify the impact of leaf
thickness on net CO2 exchange by examining how sensitive these fluxes are to leaf
photosynthetic capacity. Reducing Vcmax from the reference value of 73 µmol m-2 s-1 to
50 µmol m-2 s-1 produced a one to two gC m-2 d-1 decrease in NEE during the growing
season. This reduction occurred through the subsequent reduction leaf photosynthesis and
stomatal conductance. On an annual basis, a 21% reduction in NEE is predicted (Table
5).
Calculations presented in Table 5 did not consider the impact of leaf nutrition on
litter composition and soil respiration, which are a function of the ratio between nitrogen
and lignin content (Melillo et al., 1982). Increasing lignin or decreasing nitrogen content
19
causes the rate of litter decomposition to decrease. Had this effect been worked into the
model calculations, it would offset the reduction of canopy photosynthesis that results
from lower Vcmax, and counter the inferred reduction in NEE.
With regard to energy exchange, a concurrent reduction in stomatal conductance
occurs with a reduction in Vcmax (Schulze et al., 1994; Wilson et al., 2000a), which alters
the partitioning of net radiation (Table 5). On an annual basis, latent heat exchange is
reduced 6% and sensible heat exchange increases by 9%.
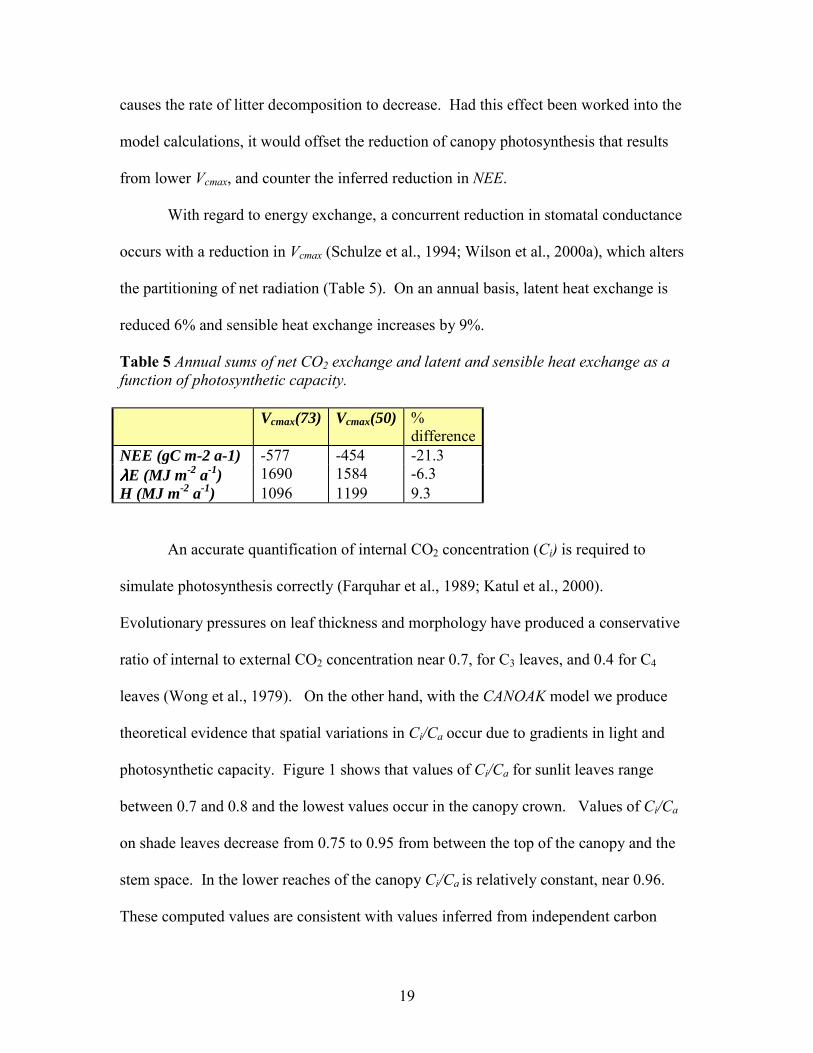
Table 5 Annual sums of net CO2 exchange and latent and sensible heat exchange as a function of photosynthetic capacity. Vcmax(73) Vcmax(50) %
differenceNEE (gC m-2 a-1) -577 -454 -21.3 λλλλE (MJ m-2 a-1) 1690 1584 -6.3 H (MJ m-2 a-1) 1096 1199 9.3
An accurate quantification of internal CO2 concentration (Ci) is required to
simulate photosynthesis correctly (Farquhar et al., 1989; Katul et al., 2000).
Evolutionary pressures on leaf thickness and morphology have produced a conservative
ratio of internal to external CO2 concentration near 0.7, for C3 leaves, and 0.4 for C4
leaves (Wong et al., 1979). On the other hand, with the CANOAK model we produce
theoretical evidence that spatial variations in Ci/Ca occur due to gradients in light and
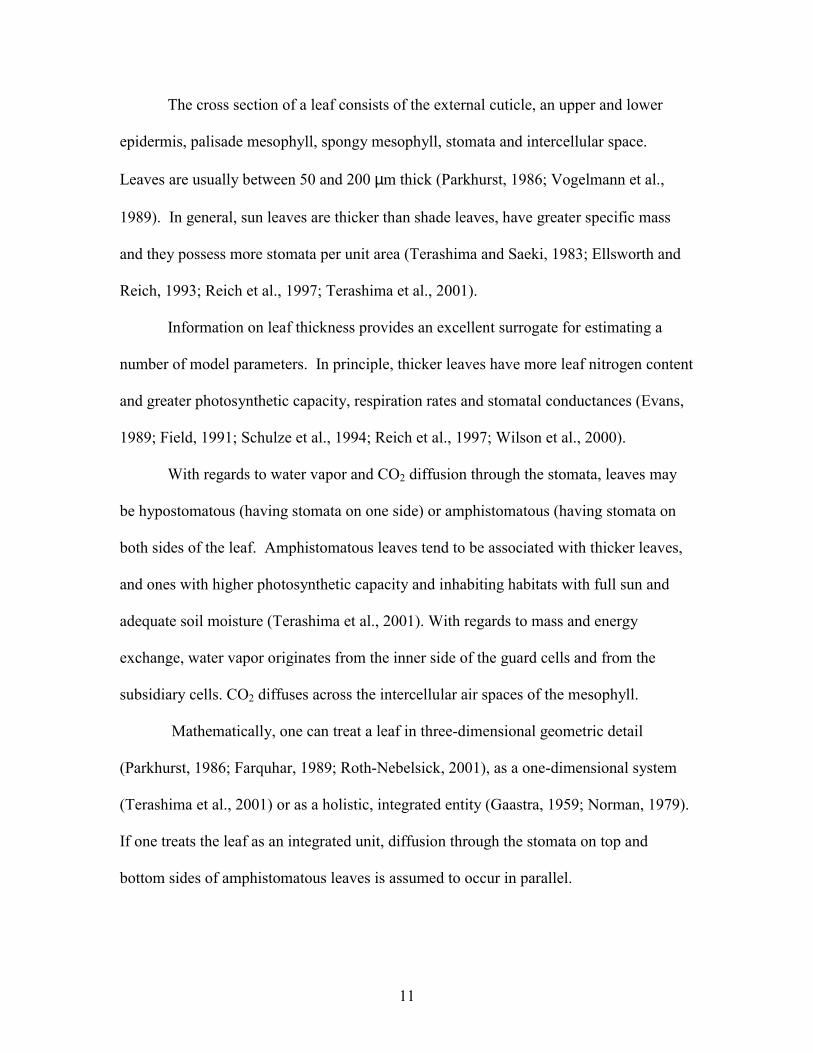
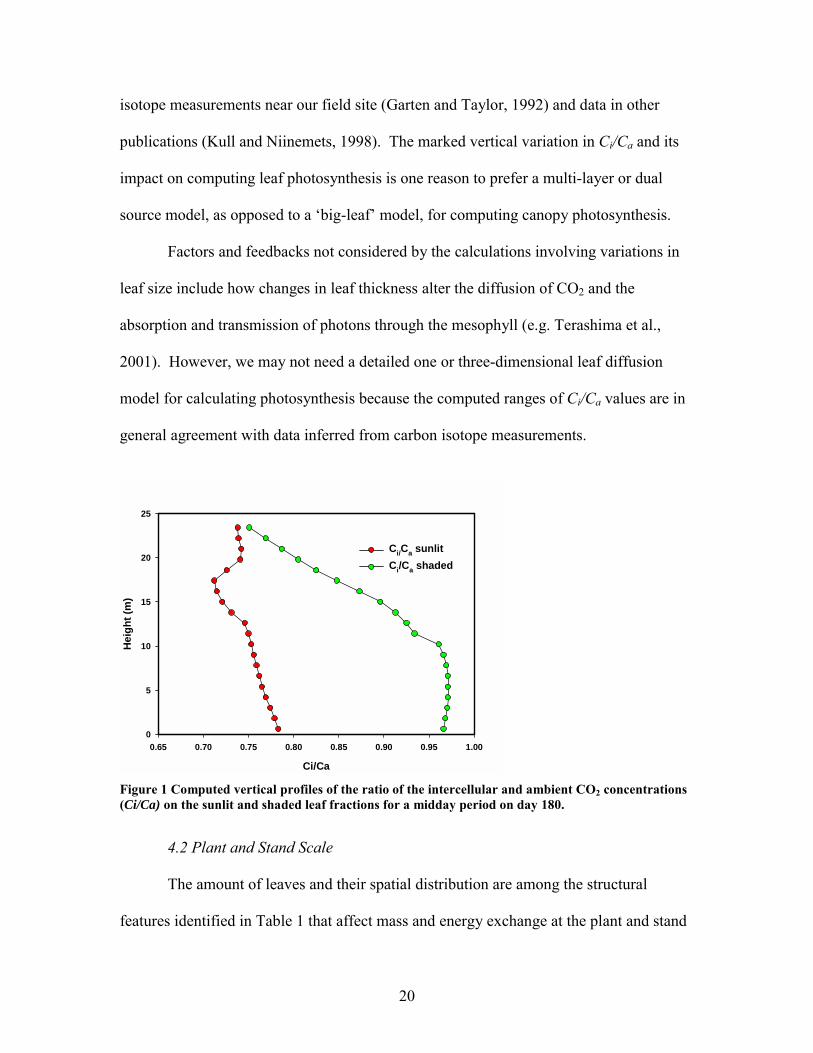
photosynthetic capacity. Figure 1 shows that values of Ci/Ca for sunlit leaves range
between 0.7 and 0.8 and the lowest values occur in the canopy crown. Values of Ci/Ca
on shade leaves decrease from 0.75 to 0.95 from between the top of the canopy and the
stem space. In the lower reaches of the canopy Ci/Ca is relatively constant, near 0.96.
These computed values are consistent with values inferred from independent carbon
20
isotope measurements near our field site (Garten and Taylor, 1992) and data in other
publications (Kull and Niinemets, 1998). The marked vertical variation in Ci/Ca and its
impact on computing leaf photosynthesis is one reason to prefer a multi-layer or dual
source model, as opposed to a big-leaf model, for computing canopy photosynthesis.
Factors and feedbacks not considered by the calculations involving variations in
leaf size include how changes in leaf thickness alter the diffusion of CO2 and the
absorption and transmission of photons through the mesophyll (e.g. Terashima et al.,
2001). However, we may not need a detailed one or three-dimensional leaf diffusion
model for calculating photosynthesis because the computed ranges of Ci/Ca values are in
general agreement with data inferred from carbon isotope measurements.
Ci/Ca
0.65 0.70 0.75 0.80 0.85 0.90 0.95 1.00
Heig
ht (m
)
0
5
10
15
20
25
Ci/Ca sunlitCi/Ca shaded
Figure 1 Computed vertical profiles of the ratio of the intercellular and ambient CO2 concentrations (Ci/Ca) on the sunlit and shaded leaf fractions for a midday period on day 180.
4.2 Plant and Stand Scale
The amount of leaves and their spatial distribution are among the structural
features identified in Table 1 that affect mass and energy exchange at the plant and stand
21
scale. With regards to forest stands, leaf area index is a parameter that experiences
substantial spatial variability across relatively uniform (Chason et al., 1991) and
heterogeneous forest landscapes (Law et al., 2001). At our Oak Ridge field site, leaf area
index can range between 5 and 7 across ridges, slopes and valleys (Chason et al. 1991).
The sensitivities of annual fluxes of carbon dioxide, water vapor and sensible heat
to small differences in LAI are shown in Table 6. In this case, reducing LAI from 6 to
5, a 16% change, reduced NEE by less than 2%. This discrete change in leaf area also had
minor impacts on computations of λE and H. λE decreased by 4% and H increased by
about 4%.
Theoretically, the sensitivity of mass and energy exchange to changes in leaf area
index is hyperbolic. Trace gas fluxes approach a saturating value once the canopy
closes (e.g. deWit, 1965; Williams et al. 1998; Baldocchi and Meyers, 1998). Only as
leaf area drops below three do changes in leaf area index start to force proportional
changes in NEE, λE and H and canopy conductance (Kelliher et al., 1995).
Though the sensitivity of λE to changes in LAI is small, for a closed forest
canopy, picking the right leaf area index has an implication on model verification. Model
computations of annual evaporation at a leaf area index of five (662 mm) produced a
closer value to our measurement of 611 mm (Wilson et al. 2000) than the computations
derived using a leaf area index of six (692 mm). The alternative computation is plausible
considering the range of vegetation viewed by the 200 to 1000 m flux footprint of our
eddy covariance measurement system. Future work needs to combine high-resolution
remote sensing images of the site and flux footprint models to assess the spatially
integrated and representative leaf area index.
22
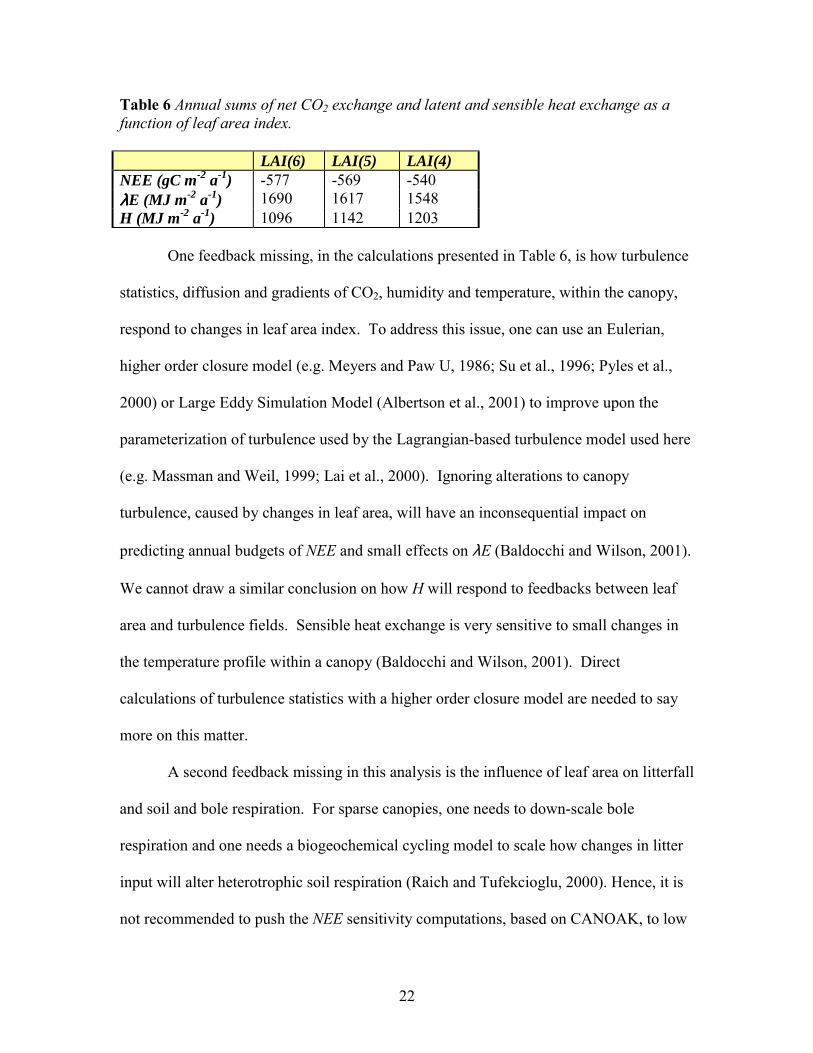
Table 6 Annual sums of net CO2 exchange and latent and sensible heat exchange as a function of leaf area index. LAI(6) LAI(5) LAI(4) NEE (gC m-2 a-1) -577 -569 -540 λλλλE (MJ m-2 a-1) 1690 1617 1548 H (MJ m-2 a-1) 1096 1142 1203
One feedback missing, in the calculations presented in Table 6, is how turbulence
statistics, diffusion and gradients of CO2, humidity and temperature, within the canopy,
respond to changes in leaf area index. To address this issue, one can use an Eulerian,
higher order closure model (e.g. Meyers and Paw U, 1986; Su et al., 1996; Pyles et al.,
2000) or Large Eddy Simulation Model (Albertson et al., 2001) to improve upon the
parameterization of turbulence used by the Lagrangian-based turbulence model used here
(e.g. Massman and Weil, 1999; Lai et al., 2000). Ignoring alterations to canopy
turbulence, caused by changes in leaf area, will have an inconsequential impact on
predicting annual budgets of NEE and small effects on λE (Baldocchi and Wilson, 2001).
We cannot draw a similar conclusion on how H will respond to feedbacks between leaf
area and turbulence fields. Sensible heat exchange is very sensitive to small changes in
the temperature profile within a canopy (Baldocchi and Wilson, 2001). Direct
calculations of turbulence statistics with a higher order closure model are needed to say
A second feedback missing in this analysis is the influence of leaf area on litterfall
and soil and bole respiration. For sparse canopies, one needs to down-scale bole
respiration and one needs a biogeochemical cycling model to scale how changes in litter
input will alter heterotrophic soil respiration (Raich and Tufekcioglu, 2000). Hence, it is
not recommended to push the NEE sensitivity computations, based on CANOAK, to low
23
leaf area indices without the inclusion of algorithms that consider the longer-term cycling
of carbon. New allometric scaling principles, however, may serve as a means for
extending our calculations to other ranges of leaf area index (Enquist and Niklas, 2001).
There is also the potential of scaling root respiration on the basis of canopy
photosynthesis (Hogberg et al., 2001).
As canopies become more open, a larger fraction of heat and vapor exchange will
occur at the soil surface. The partitioning of solar energy into sensible, latent and soil
heat flux will be sensitive to how well the soil physics submodel evaluates atmospheric
thermal stratification, surface wetness and the thickness of the litter layer (Baldocchi et
al, 2000).
One criticism of using multi-layer models has been their dependency on hard-to-
attain information on the vertical profile of leaf area index (Raupach and Finnigan,
1988). An accumulating body of ecological data is giving us a better understanding on
how leaf area index in forests vary with height, so this criticism may not be as valid as it
was a decade ago. For example, a temperate forest contains six distinct zones, an
emergent layer, the outer canopy, the overstory, the middle story, the under story and the
ground layer (Aber and Melillo, 1991; Parker, 1995). Broadleaved forests of
intermediate age tend to have their leaf area distribution skewed with height and
concentrated in the overstorey (Smith and Huston, 1989; Parker, 1995). At the Oak
Ridge site, about 75% of leaf area was in the upper 25% of the forest (Hutchison et al.,
1983). Leaf area profiles in older stands tend to be more uniform and old-age stands tend
to be bottom-heavy, having their leaf area distribution weighted close to the ground
(Aber and Melillo, 1991; Parker, 1995).

24
In Table 7, we compare computations of annual mass and energy fluxes based on
two cases of vertical leaf area distribution. One case assumes the measured leaf area
profile, with the greatest amount of leaf area occurring near the top of the canopy
(Hutchison et al., 1983). The other case assumes that the leaf area distribution was
uniform with height. Our computations show that these distinct differences in leaf area
distribution had a negligible influence on annual fluxes of carbon dioxide, water vapor
and energy. These calculations are supported by a recent analysis by Wu et al. (2000).
What proves to be more important is the number of layers used in the simulation.
Wu et al. (2000) and Pyles et al. (2000) recommend at least 20 layers. Norman (1979)
recommends that the leaf area of a layer should be less than 0.5, to apply statistically-
based, radiative transfer models correctly.
Table 7 Annual sums of net CO2 exchange and latent and sensible heat exchange as a function of leaf area profile. Skewed
distribution uniform %
differenceNEE (gC m-2 a-1) -577 -568 -1.5 λλλλE (MJ m-2 a-1) 1690 1688 -0.1 H (MJ m-2 a-1) 1096 1097 +0.1
Within a forest stand, the inclination angle of leaves will have a major impact
upon light interception. Classical distributions of leaves include spherical, erectophile
and planophile classes (deWit, 1965; Campbell, 1981). How sensitive the annual course
of daily NEE is to leaf inclination angle (θ) is examined for three cases, an erect (θ equal
80 degrees) and planar (θ equal 10 degrees) leaf angle distribution and the measured leaf
angle distribution with clumped leaves. For the reference case with clumped leaves, the
mean leaf angle was 40 degrees at the top and 10 degrees near the bottom of the canopy.
25
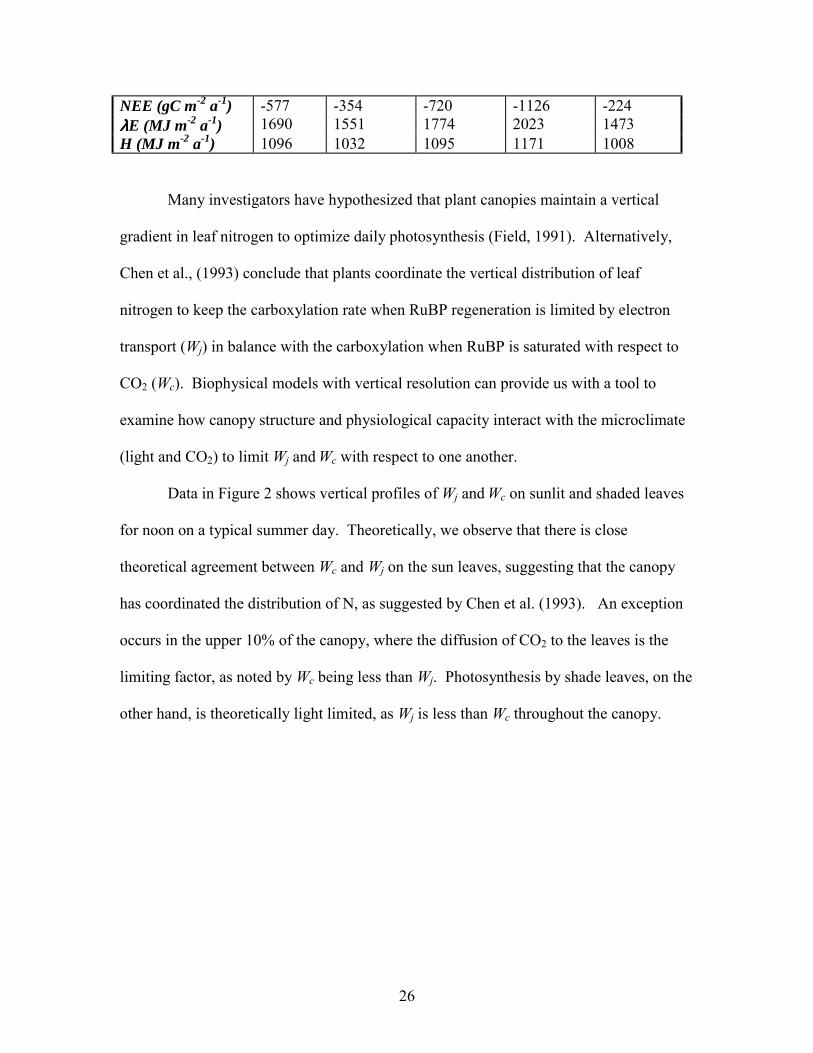
Variations in leaf inclination angle ranging from planar to erect caused NEE to range
between 200 and 1100 gC m-2 a-1, a huge range. The impact of leaf inclination angle on
H and λE, on the other hand, was modest by comparison, less than 25% (Table 8). Also
shown in Table 8 are computations for a spherical leaf angle distribution (θ equals 60
degrees) and one with randomly distributed leaves, but with the measured leaf angle
distribution. These additional cases produce values of NEE that fall between the
reference case and the case with the most erect leaves. Higher sums of net primary
productivity, predicted for canopies with erect leaves growing at mid-latitudes, are
consistent with the short-term calculations pioneered by de Wit (1965) and Duncan et al
(1967).
We also note that canopies with erect leaves had a lower albedo, which produced
a more net radiation and higher values of H and λE than for other cases.
From an evolutionary standpoint maximizing carbon gain or minimizing water
loss are not the only pressures acting on these trees, otherwise more forest canopies
would exist with erect leaves. Shading understorey plants and optimizing the content and
distribution of nitrogen in leaves are other important factors, beside optimal leaf angle,
that merit consideration. On the other hand, these calculations lend support for the
development of fast growing poplar clones with erect leaves.
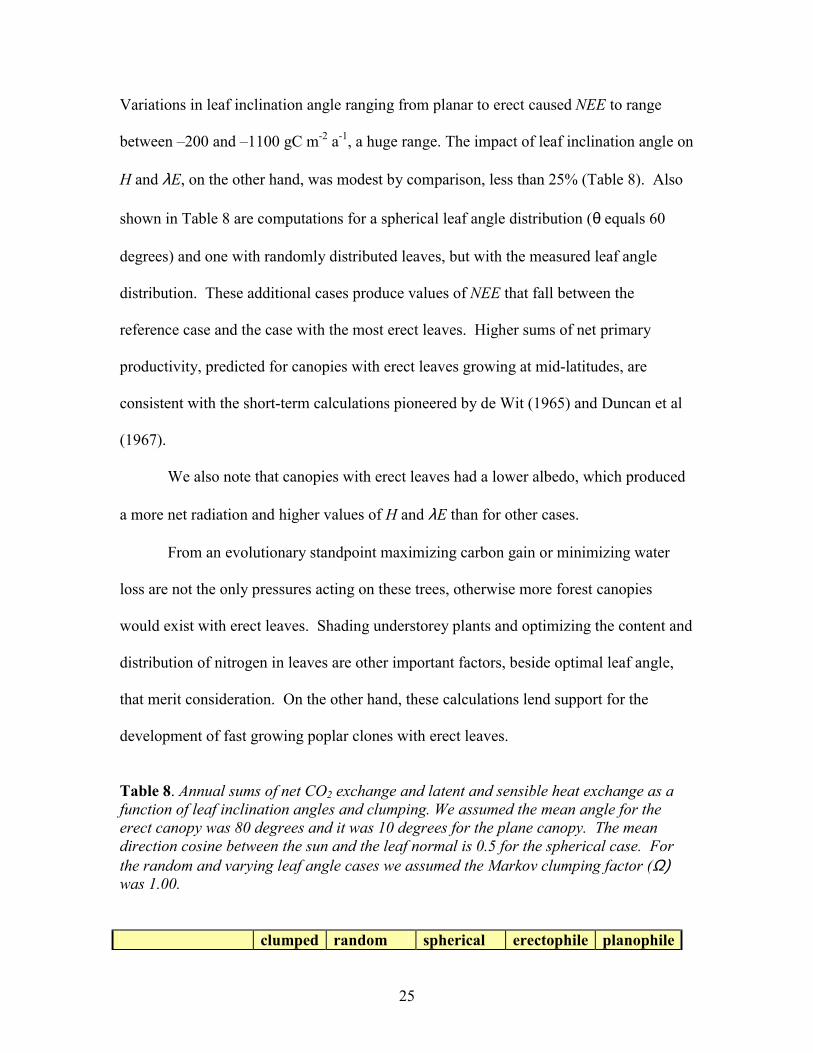
Table 8. Annual sums of net CO2 exchange and latent and sensible heat exchange as a function of leaf inclination angles and clumping. We assumed the mean angle for the erect canopy was 80 degrees and it was 10 degrees for the plane canopy. The mean direction cosine between the sun and the leaf normal is 0.5 for the spherical case. For the random and varying leaf angle cases we assumed the Markov clumping factor (Ω) was 1.00. clumped random spherical erectophile planophile
26
NEE (gC m-2 a-1) -577 -354 -720 -1126 -224 λλλλE (MJ m-2 a-1) 1690 1551 1774 2023 1473 H (MJ m-2 a-1) 1096 1032 1095 1171 1008
Many investigators have hypothesized that plant canopies maintain a vertical
gradient in leaf nitrogen to optimize daily photosynthesis (Field, 1991). Alternatively,
Chen et al., (1993) conclude that plants coordinate the vertical distribution of leaf
nitrogen to keep the carboxylation rate when RuBP regeneration is limited by electron
transport (Wj) in balance with the carboxylation when RuBP is saturated with respect to
CO2 (Wc). Biophysical models with vertical resolution can provide us with a tool to
examine how canopy structure and physiological capacity interact with the microclimate
(light and CO2) to limit Wj and Wc with respect to one another.
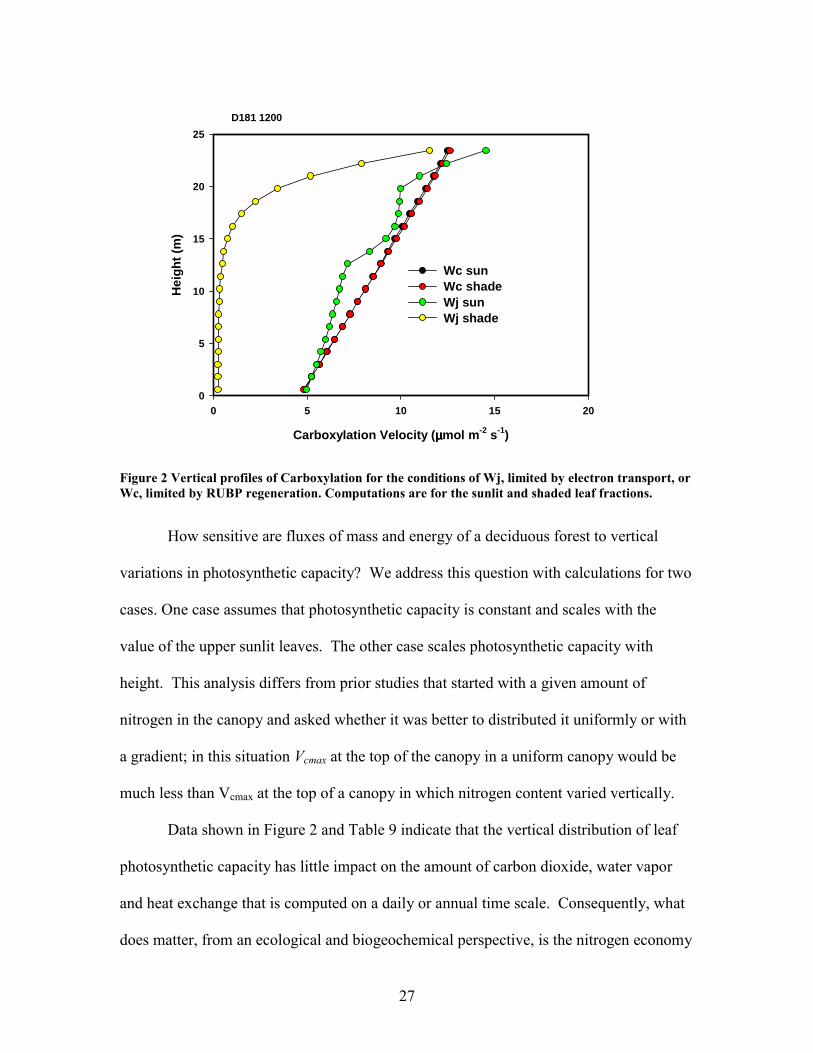
Data in Figure 2 shows vertical profiles of Wj and Wc on sunlit and shaded leaves
for noon on a typical summer day. Theoretically, we observe that there is close
theoretical agreement between Wc and Wj on the sun leaves, suggesting that the canopy
has coordinated the distribution of N, as suggested by Chen et al. (1993). An exception
occurs in the upper 10% of the canopy, where the diffusion of CO2 to the leaves is the
limiting factor, as noted by Wc being less than Wj. Photosynthesis by shade leaves, on the
other hand, is theoretically light limited, as Wj is less than Wc throughout the canopy.
27
Carboxylation Velocity (µµµµmol m-2 s-1)
0 5 10 15 20
Hei
ght (
m)
0
5
10
15
20
25
Wc sunWc shadeWj sunWj shade
D181 1200
Figure 2 Vertical profiles of Carboxylation for the conditions of Wj, limited by electron transport, or Wc, limited by RUBP regeneration. Computations are for the sunlit and shaded leaf fractions.
How sensitive are fluxes of mass and energy of a deciduous forest to vertical
variations in photosynthetic capacity? We address this question with calculations for two
cases. One case assumes that photosynthetic capacity is constant and scales with the
value of the upper sunlit leaves. The other case scales photosynthetic capacity with
height. This analysis differs from prior studies that started with a given amount of
nitrogen in the canopy and asked whether it was better to distributed it uniformly or with
a gradient; in this situation Vcmax at the top of the canopy in a uniform canopy would be
much less than Vcmax at the top of a canopy in which nitrogen content varied vertically.
Data shown in Figure 2 and Table 9 indicate that the vertical distribution of leaf
photosynthetic capacity has little impact on the amount of carbon dioxide, water vapor
and heat exchange that is computed on a daily or annual time scale. Consequently, what
does matter, from an ecological and biogeochemical perspective, is the nitrogen economy
28
of the forest stand. In other words, a forest can maintain the same level of productivity
without investing expensive nitrogen to leaves deep in the canopy, that never experience
high rates of photosynthesis.
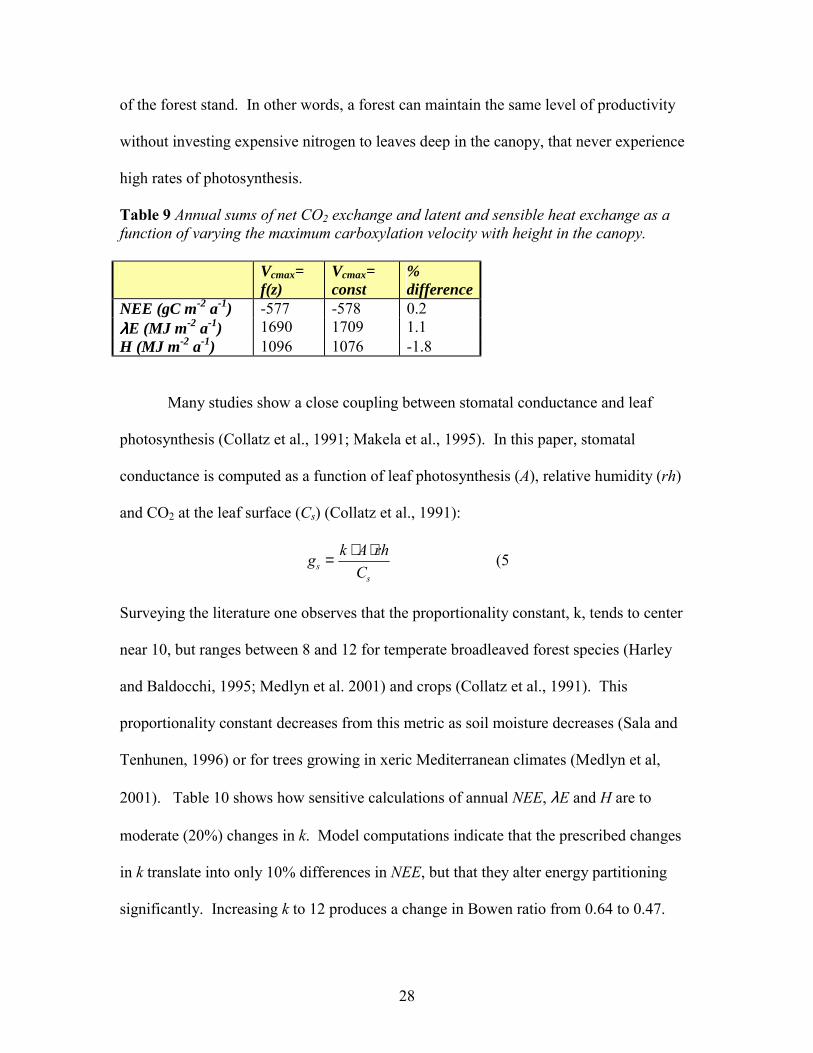
Table 9 Annual sums of net CO2 exchange and latent and sensible heat exchange as a function of varying the maximum carboxylation velocity with height in the canopy. Vcmax=
f(z) Vcmax= const
% difference
NEE (gC m-2 a-1) -577 -578 0.2 λλλλE (MJ m-2 a-1) 1690 1709 1.1 H (MJ m-2 a-1) 1096 1076 -1.8
Many studies show a close coupling between stomatal conductance and leaf
photosynthesis (Collatz et al., 1991; Makela et al., 1995). In this paper, stomatal
conductance is computed as a function of leaf photosynthesis (A), relative humidity (rh)
and CO2 at the leaf surface (Cs) (Collatz et al., 1991):
g k A rhCs
s
= ⋅ ⋅ (5
Surveying the literature one observes that the proportionality constant, k, tends to center
near 10, but ranges between 8 and 12 for temperate broadleaved forest species (Harley
and Baldocchi, 1995; Medlyn et al. 2001) and crops (Collatz et al., 1991). This
proportionality constant decreases from this metric as soil moisture decreases (Sala and
Tenhunen, 1996) or for trees growing in xeric Mediterranean climates (Medlyn et al,
2001). Table 10 shows how sensitive calculations of annual NEE, λE and H are to
moderate (20%) changes in k. Model computations indicate that the prescribed changes
in k translate into only 10% differences in NEE, but that they alter energy partitioning
significantly. Increasing k to 12 produces a change in Bowen ratio from 0.64 to 0.47.

29
Reducing k to 8 increases Bowen ratio to near 0.8. In comparison, the measured Bowen
ratio at this site, during 1997, was 0.72 (Wilson and Baldocchi, 2000).
Table 10. Impacts of the stomatal conductance coefficient on CO2, latent and sensible heat exchange. k=9.5 k=8 k=12 NEE (gC m-2 a-1) -577 -528 -630 λλλλE (MJ m-2 a-1) 1690 1544 1897 H (MJ m-2 a-1) 1096 1233 900
4.3 The Environment
Radiation, temperature, vapor pressure deficit, CO2 concentration and wind speed
are important drivers of biophysical algorithms for photosynthesis, stomatal conductance
and the leaf energy balance of leaves. Yet, the meteorological conditions measured at a
reference station above a forest do not represent the microenvironment adjacent to leaves,
as the environment inside the canopy is often decoupled from that above.
Micrometeorological submodels are, therefore, necessary tools for translating the state
conditions, measured above the canopy, to the local conditions normal to a leaves, buried
throughout in the canopy.
During the day sensible heat is generated at all levels of the canopy by the heat
load of the sun and is directed upwards. The air temperature profile that responds to this
forcing is shown in Figure 3. Starting from the ground, air temperature increase with
height, up to the densest portion of the canopy crown. Then air temperature decreases
with height. The range of temperature, in the canopy, is about 1 oC. Temperature
gradients will be stronger or weaker, depending on the heat load on the vegetation and
degree of turbulent mixing.

30
The temperature profile in Figure 3 represents a distinct case when counter-
gradient transfer is occurring. Simple K-theory models are unable to capture this
physical phenomenon because large scale eddies dominate the transfer of material and
energy in a canopy. K-theory models also do not reflect accurately the feedbacks
between local air temperature and the source-sink strength of sensible heat. Stochastic
Lagrangian (as used here), higher order closure and large eddy simulations models
(Meyers and Paw U, 1986; Su et al., 1996; Pyles et al., 2000; Albertson et al., 2001), on
the other hand, are capable of reproducing counter-gradient transfer of mass and energy
and the source-sink distribution of sensible heat more accurately.
.
D1431100
Temperature (C)
22.6 22.8 23.0 23.2 23.4 23.6
Hei
ght
(m)
0
20
40
60
80
Dij = f(z/L)
neutral thermal stratification Figure 3 Computed profiles of air temperature within and above a deciduous forest
New empirical evidence shows that the statistical prediction of canopy
photosynthesis is improved by using direct and diffuse streams of PAR as independent
variables, rather than air temperature and humidity deficits (Gu et al., 2001).
Furthermore, numerous field and theoretical studies demonstrate that changes in the
31
fraction of diffuse radiation will modulate canopy photosynthesis (deWit, 1965; Gu et al.,
1999). What remains un-quantified is how changes in direct and diffuse solar radiation,
as may occur by volcanic eruptions, dust or aerosols (Olmo et al., 1999), may affect
carbon dioxide, water vapor and energy exchange over the course of a year?
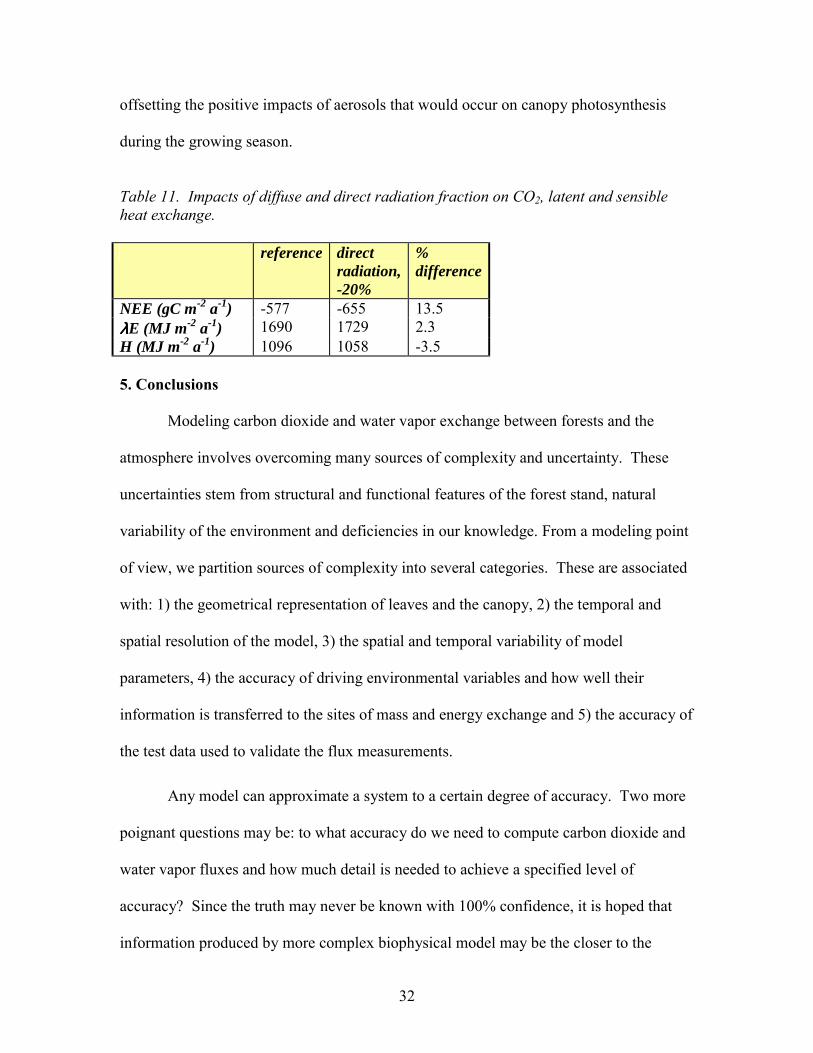
To address this question, we re-computed the annual course of mass and energy
exchange by assuming that the flux density of direct radiation was reduced by 20%, but
that total available energy was unchanged. Data in Table 11 show that reducing direct
radiation flux density by 20% can cause a temperate deciduous forest to assimilate an
extra 78 gC m-2 year-1, a 14% increase (Table 11). Changes in evaporation and sensible
heat exchange due to the directionality of light, on the other hand, were negligible.
On face value, these calculations imply that the Mt. Pinatubo eruption may have
led to an increase in regional photosynthesis, which would be consistent with the slowed
rate of increase of atmospheric CO2 that was observed at Mauna Loa (Keeling and
Whorf, 2000). Yet one has to be careful with extrapolation of our analysis to other
conditions. The calculations presented in Table 11 assumed that changes in radiation did
not affect the annual temperature. Climate records show that the Mt Pinatubo eruption
was followed by a decrease in mean global annual temperature (Hanson et al., 1996), a
33% increase in diffuse radiation and a small reduction (3%) in global solar radiation
(Olmo et al., 1999). Atmospheric cooling can reduce respiration, an occurrence that
would slow the rate of atmospheric CO2 growth, too. Climatic cooling can also shorten
the growing season by delaying the phenological expansion of leaves. This latter effect
can reduce the net uptake of CO2 of temperate deciduous forests by about 6 gC m-2 day-
1for each day that the growing season is shortened (Baldocchi and Wilson, 2001),
32
offsetting the positive impacts of aerosols that would occur on canopy photosynthesis
during the growing season.
Table 11. Impacts of diffuse and direct radiation fraction on CO2, latent and sensible heat exchange. reference direct
radiation, -20%
% difference
NEE (gC m-2 a-1) -577 -655 13.5 λλλλE (MJ m-2 a-1) 1690 1729 2.3 H (MJ m-2 a-1) 1096 1058 -3.5 5. Conclusions
Modeling carbon dioxide and water vapor exchange between forests and the
atmosphere involves overcoming many sources of complexity and uncertainty. These
uncertainties stem from structural and functional features of the forest stand, natural
variability of the environment and deficiencies in our knowledge. From a modeling point
of view, we partition sources of complexity into several categories. These are associated
with: 1) the geometrical representation of leaves and the canopy, 2) the temporal and
spatial resolution of the model, 3) the spatial and temporal variability of model
parameters, 4) the accuracy of driving environmental variables and how well their
information is transferred to the sites of mass and energy exchange and 5) the accuracy of
the test data used to validate the flux measurements.
Any model can approximate a system to a certain degree of accuracy. Two more
poignant questions may be: to what accuracy do we need to compute carbon dioxide and
water vapor fluxes and how much detail is needed to achieve a specified level of
accuracy? Since the truth may never be known with 100% confidence, it is hoped that
information produced by more complex biophysical model may be the closer to the
33
truth (see Kuhn, 1996). Model tests by our colleagues (e.g. Sinclair et al., 1976; dePury
and Farquhar, 1997; Pyles et al., 2000; Williams et al., 2001) and us (Baldocchi and
Meyers, 2000; Baldocchi and Wilson, 2001) tend to support this contention. Detailed
biophysical models perform well (often accounting for over 80% of the variance and
producing flux values within 90% of the mean measured values) because they use
ecophysiological rules to constrain their model parameters (rather than tune them
arbitrarily) and they quantify non-linear functions correctly, by considering the distinct
environments of sun and shade leaves.
The temporal and spatial resolution of a biophysical model has implications on
its accuracy and performance, too. Several investigators have reported that computations
of mass and energy are sensitive to the number of layers into which the canopy is divided
(Norman, 1993; Wu et al., 2000; Pyles et al. 2000). In practice, dividing a canopy into
20 to 30 layers or maintaining a layer thickness that contains less then 0.5 m2 of leaf area
per unit land area seems adequate. With regards to temporal resolution, dynamic and
prognostic biophysical models like SIB-2 (Sellers et al., 1997) and ACASA (Pyles et al.,
2001), which operate on time steps of 15 minutes and diagnostic models, like CANOAK
or CUPID (Norman, 1979, 1993) which operate at hourly time steps, can resolve diurnal
cycles with high fidelity. Ecosystem models based on courser time scales (e.g. daily or
monthly time steps, such as Biome-BGC or CENTURY, see Cramer et al., 1999), on the
other hand, miss a significant fraction of variance associated that is associated with mass
and energy exchange (Baldocchi and Wilson, 2001).
In closing, better representations of canopy carbon dioxide and water vapor
exchange between forests and the atmosphere will come at the expense of more and
34
better data. Long-term eddy flux records, as provided by projects such as FLUXNET
(Baldocchi et al., 2001), will continue to provide a constraint and guide post on the
accuracy of such models. But, application of these biophysical models over longer time
scales will also require information on how leaf area index, soil respiration and
photosynthetic capacity vary over the course of a season (e.g., Niinemets et al, 1999;
Wohlfahrt et al., 2000; Wilson et al., 2001a). Ultimately, we envision a closer coupling
between detailed biophysical models, like CANOAK, with modules that compute the
dynamics of canopy structure, function and composition (e.g. Foley et al., 1997; Cramer
et al., 1999). We also advocate more use of ecophysiological rules and relationships to
constrain and quantify model parameters (e.g. Schulze et al., 1994; Wullschleger, 1993)
and predict their dynamics (Niinemets and Kull, 1999; Wirtz, 2000).
Acknowledgements Several Federal and State Agencies including US Department of Energys
Terrestrial Carbon Program, NASAs EOS Validation FLUXNET Project and the
University of California Agricultural Experiment Station, funded this work. We thank
Dick Waring and Georg Wohlfarht for their critique and comments on a draft of this
manuscript.
References Aber, J.D. and Melillo, J.M.1991. Terrestrial Ecosystems. Saunders College Pub.
Philadelphia. Albertson, J.D., Katul, G.G. and Wiberg. P. 2001. Relative importance of local and
regional controls on coupled water, carbon, and energy fluxes, Advances in Water Resources.24,1103-1118.
Baldocchi, D.D. and P.C. Harley. 1995. Scaling carbon dioxide and water vapor exchange from leaf to canopy in a deciduous forest: model testing and application. Plant, Cell and Environment. 18: 1157-1173.
35
Baldocchi, D.D and T.P. Meyers. 1998. On using eco-physiological, micrometeorological and biogeochemical theory to evaluate carbon dioxide, water vapor and gaseous deposition fluxes over vegetation. Agricultural and Forest Meteorology 90: 1-26.
Baldocchi, D.D., B.E. Law and P. Anthoni. 2000. On measuring and modeling energy
fluxes above the floor of a homogeneous and heterogeneous conifer forest. Agricultural and Forest Meteorology 102, 187-206.
Baldocchi, D.D. and K.B.Wilson. 2001. Modeling CO2 and water vapor exchange of a
temperate broadleaved forest across hourly to decadal time scales. Ecological Modeling. 142, 155-184
Baldocchi, DD, Falge, E, Gu, L., R. Olson, D. Hollinger, S. Running, P. Anthoni, Ch.
Bernhofer, K. Davis, J. Fuentes, A. Goldstein, G. Katul, B. Law, X. Lee, Y. Malhi, T. Meyers, J.W. Munger, W. Oechel, KT Paw U, K. Pilegaard, H.P. Schmid, R. Valentini, S. Verma, T. Vesala, K. Wilson and S. Wofsy. 2001b. FLUXNET: A New Tool to Study the Temporal and Spatial Variability of Ecosystem-Scale Carbon Dioxide, Water Vapor and Energy Flux Densities Bulletin of the American Meteorological Society 82: 2415-2434.
Campbell, G. S. 1981. Fundamentals of radiation and temperature relations. Pages 11-40
in O. L. Lange et al., editors. Physiological plant ecology, I: Responses to the physical environment. Encyclopedia of Plant Physiology 12a. Springer-Verlag. Berlin.
Chason, J., D.D. Baldocchi and M. Huston. 1991. A comparison of direct and indirect
methods for estimating forest canopy leaf area. Agricultural and Forest Meteorology 57:107-128.
Chen, J.L., J.F. Reynolds, P.C. Harley and J.D. Tenhunen. 1993. Coordination theory of
leaf nitrogen distribution in a canopy. Oecologia 93: 63-69. Collatz, G. J., J. T. Ball, C. Grivet, and J. A. Berry. 1991. Regulation of stomatal
conductance and transpiration: a physiological model of canopy processes. Agricultural and Forest Meteorology. 54: 107-136.
Cramer, W.J., D.W. Kicklighter, A. Bondeau et al., 1999. Comparing global models of
terrestrial primary productivity (NPP): overview and key results. Global Change Biology. 5, 1-15.
Denholm, J. V. 1981. The influence of penumbra on canopy photosynthesis. I.
Theoretical considerations. Agricultural Meteorology 25:145-161. DePury, D. and Farquhar. G.D. 1997. Simple scaling of photosynthesis from leaves to
canopies without the errors of big-leaf models. Plant, Cell and Environment. 20, 537-557.
36
deWit, C.T. 1965. Photosynthesis of Leaf Canopies. Agricultural Research Report,
Wageningen. 663, 1-57. Duncan, W.G., Loomis, R.S., Williams, W.A. and Hanau, R. 1967. A model for simulating
photosynthesis in plant communities. Hilgardia. 38, pg 4. Ellsworth, D.S. and P.B. Reich. 1993. Canopy structure and vertical patterns of
photosynthesis and related leaf traits in a deciduous forest. Oecologia. 96: 169-178.
Enquist, B.J. and Niklas, K.J. 2001. Invariant scaling relations across tree-dominated
communities. Nature. 410, 655-660. Evans, J. R. 1989. Photosynthesis and nitrogen relationships in leaves of C3 plants.
Oecologia 78:9-19. Falge, E., Graber, W, Siegwolf, R, Tenhunen, JD. 1996. A model of the gas exchange
response of Picea abies to habitat conditions. Trees. 10, 277-287. Farquhar, GD. 1989. Models of integrated photosynthesis of cells and leaves. Philosophical
Transactions of the Royal Society, London, B. 323, 357-367. Farquhar, G. D., S. von Caemmerer, and J. A. Berry. 1980. A biochemical model of
photosynthetic CO2 assimilation in leaves of C3 species. Planta 149: 78-90. Farquhar, GD, Ehleringer, JR and Hubick, KT. 1989. Carbon isotope discrimination and
photosynthesis. Annual Review of Plant Physiology and Plant Molecular Biology. 40, 503-537.
Field, C. B. 1991. Ecological scaling of carbon gain to stress and resource availability.
Pages 1-32 in H. A. Mooney, W. E. Winner, and E. J. Pell, editors. Integrated Responses of Plants to Stress. Academic Press.
Finnigan, J. J. 1985. Turbulent transport in flexible plant canopies. Pages 443-480 in B.
A. Hutchison and B. B. Hicks, editors. The Forest-Atmosphere Interaction. Reidel Publishing Company, Dordrecht, The Netherlands
Foley, J.A., S. Levis, I.C. Prentice, D. Pollard and S.L. Thompson. 1998. Coupling
dynamic models of climate and vegetation. Global Change Biology. 4, 561-580. Gaastra, P. 1959. Photosynthesis of crop plants as influenced by light, carbon dioxide,
temperature and stomatal diffusion resistance. Mededelingen van de Landbouowhogeschool te Wageningen. 59, 1-68.
37
Garten, C.T. and Taylor, GE Jr. 1992. Foliar δ13 within a temperate deciduous forest: spatial, temporal and species sources of variation. Oecologia. 90, 1-7.
Gu, L., J.D. Fuentes, H.H. Shugart, R.M. Staebler and T.A. Black. 1999. Responses of
net ecosystem exchanges of carbon dioxide to changes in cloudiness: results form two North American deciduous forests. Journal of Geophysical Research 104: 31421-31434.
Gu, L., D.D. Baldocchi, S. B. Verma, T. A. Black, T. Vesala, E. M. Falge, P.R. Dowty.
2001. Superiority of diffuse radiation for terrestrial ecosystem productivity. Journal of Geophysical Research (submitted).
Hanson, J. Ruedy, R, Sato, M and Reynolds, R. 1996. Global surface air temperature in
1995: return to pre-Pinatubo level. Geophysical Research Letters. 23, 1665-1668 Harley, P.C. and J.D. Tenhunen. 1991. Modeling the photosynthetic response of C3
leaves to environmental factors. In: Modeling Photosynthesis From Biochemistry to Canopy. pp. 17-39. American Soc. Agronomy. Madison, WI.
Harley, P.C. and D.D. Baldocchi, 1995.Scaling carbon dioxide and water vapour
exchange from leaf to canopy in a deciduous forest: leaf level parameterization. Plant, Cell and Environment. 18: 1146-1156.
Hogberg, P., Nordrgren, A., Buchmann, N., Taylor, AFS, Ekblad, A., Hogberg, M.,
Nyberg, G., Ottosson-Lofvenius, M. and Read, D.J. 2001. Large-scale forest girdling shows that current photosynthesis drives soil respiration. Nature. 411, 789-792.
Hutchison, BA and Matt, DR. 1977. Distribution of solar-radiation within a deciduous
forest. Ecological Monograph. 47: 185-207. Hutchison, B. A., D. R. Matt, R. T. McMillen, L. J. Gross, S. J. Tajchman, and J. M.
Norman. 1986. The architecture of a deciduous forest in eastern Tennessee, USA. Journal of Ecology 74:635-646.
Ikeda, S., Yamada, T. and Toda, Y. 2001. Numerical study on turbulent flow and honami
in and above flexible plant canopy. International Journal of Heat and Fluid Flow. 22, 252-258.
Jarvis, P.G. 1995. Scaling processes and problems. Plant, Cell and Environment. 18,
1079-1089. Jarvis, P.G. and J.W. Leverenz.1983. Productivity of temperate, deciduous and evergreen
forests. In: Encyclopedia of Plant Physiology, volume 12D. O.L. Lange et al. eds. Springer Verlag, Berlin.
38
Jarvis, P. G. and K. G. McNaughton. 1986. Stomatal control of transpiration: scaling up from leaf to region. Advances in Ecological Research 15:1-48.
Katul, G.G., Ellsworth, D.S. Lai, C.T. 2000. Modelling assimilation and intercellular CO2
from measured conductance: a synthesis of approaches. Plant, Cell and Environment. 23, 1313-1328.
Keeling, C.D. and T.P. Whorf. 2000. Atmospheric CO2 records from sites in the SIO air
sampling network. In Trends: A Compendium of Data on Global Change. Carbon Dioxide Information Analysis Center, Oak Ridge National Laboratory, U.S. Department of Energy, Oak Ridge, Tenn., U.S.A.
Kelliher, F.M., Leuning, R., Raupach, M.R. and Schulze, E.D. 1995. Maximum
conductances for evaporation from global vegetation types. Agricultural and Forest Meteorology. 73, 1-16.
Kirschbaum, M. U. F., L. J. Gross, and R. W. Pearcy. 1988. Observed and modelled
stomatal responses to dynamic light environments in the shade plant Alocasia macrorrhiza. Plant, Cell, and Environment 11:111-121.
Korner, Ch. 1994. Leaf diffusive conductances in the major vegetation types of the globe.
In. Ecophysiology of Photosynthesis.. ED Schulze and MM Caldwell, eds. Springer. Berlin. Pp.463-489.
Kruijt, B. 1989. Estimating canopy structure of an oak forest at several scales. Forestry
62:269-284. Kull, O. and Niinemets, U. 1998. Distribution of leaf photosynthesis properties in tree
canopies: comparision of species with different shade tolerance. Functional Ecology. 12, 472-479.
Kuhn, T.S. 1996. The Structure of Scientific Revolutions. University of Chicago Press.
Chicago, IL. 212 pp. Lai CT, Katul G, Ellsworth D, et al. 2000. Modelling vegetation-atmosphere CO2
exchange by a coupled Eulerian-Langrangian approach. Boundary Layer Meteorology. 95: 91-122.
Laisk, A. 1983. Calculations of leaf photosynthetic parameters considering the statistical
distribution of stomatal apertures. Journal of Experimental Botany. 34, 1627-1635.
Larcher, W. 1975. Physiological Plant Ecology. Springer Verlag, Berlin. 252 pp. Law, B.E., S. van Tuyl, A. Cescatti and D.D. Baldocchi. 2001. Estimation of leaf area
index in open canopy ponderosa pine forests at different successional stages and
39
management treatments in Oregon. Agricultural and Forest Meteorology. 108, 1-14.
Law, B.E., Williams, M., Anthoni, P., Baldocchi, D.D., Unsworth, M.H., 2000.
Measuring and modeling seasonal variation of carbon dioxide and water vapor exchange of a Pinus ponderosa forest subject to soil water deficit. Global Change Biology 6, 613-630.
Law BE, Waring RH, Anthoni PM, Aber JD. 2000. Measurement of gross and
etecosystem productivity and water vapor exchange of a Pinus ponderosa ecosystem, and an evaluation of two generalized models. Global Change Biology 6, 155-168.
Leuning, R., Kelliher, F.M., dePury, D., and Schulze, E.D. 1995. Leaf nitrogen,
photosynthesis, conductance and transpiration: scaling from leaves to canopies. Plant, Cell and Environment. 18, 1183-1200.
Long, S.P. 1991. Modification of the response of photosynthetic productivity to rising
temperature by atmospheric CO2 concentrations: has its importance been underestimated. Plant, Cell and Environment. 14: 729-739.
Makela, A., F. Berninger and P. Hari. 1996. Optimal control of gas exchange during
drought: theoretical analysis. Annals of Botany 77: 461-467. Massman, W.J. and J.C. Weil. 1999. An analytical one-dimensional second order closure
model of turbulence statistics and the Lagrangian time scale within and above plant canopies of arbitrary structure. Boundary Layer Meteorology. 91, 81-107.
Medlyn, B.E., Barton, C., Broadmeadow, M., Ceuleman, R., DeAngelis, P., Forstreuter,
M., Freeman, M., Jackson, S. Kellomaki, S. Laitar, E., Rey, R. Roberntz, P., Sigurdsson, B., Strassemeyer, J., Wang, K., Curtis, P. and Jarvis, P. 2001. Stomatal conductance of forest species after long-term exposure to elevated CO2 concentration: a synthesis. New Phytologist. 149, 247-264.
Melillo, J.M., Aber, J.D., Muratore, J.F. 1982. Nitrogen and lignin control of hardwood
leaf litter decomposition dynamics. Ecology. 63, 621-626. Meyers, T. P. and K. T. Paw U. 1986. Testing of a higher-order closure model for
modeling airflow within and above plant canopies. Boundary-Layer Meteorology 37: 297-311.
Monteith, J.L. 1965. Evaporation and environment. In Symposium, Society of
Experimental Botany. #19. Cambridge University Press. Pp. 205-234. Mott KA and Buckley TN. 2000. Patchy stomatal conductance: emergent collective
behaviour of stomata. Trends in Plant Science. 5: 258-262
40
Niinemets, U., W. Bilger, O. Kull and J.D. Tenhunen. 1999. Responses of foliar
photosynthetic electron transport, pigment, stoichimetry, and stomatal conductance to interacting environmental factors in a mixed species forest canopy. Tree Physiology. 19, 839-852.
Norman, J.M. 1979. Modeling the complete crop canopy. In: Modification of the Aerial
Environment of Crops. American Society of Agricultural Engineers. eds Barfield and Gerber. Pp 249-280.
Norman, J.M. 1993. Scaling processes between leaf and canopy levels. In: Scaling
Physiological Processes: Leaf to Globe. Eds. J.R. Ehleringer and C.B. Field. Academic Press. San Diego. pp 41-76.
Norman, J.M., W.P. Kustas and K.S. Humes. 1995. A two source approach for estimating
soil and vegetation energy fluxes from observations of directional radiometric surface temperature. Agricultural and Forest Meteorology. 77, 263-293.
Olmo, F.J., Tovar, J., Alados-Arboledas, L., Okulov, O. and Ohvril, H.O. 1999. A
comparison of ground level solar radiative effects of recent volcanic eruptions. Atmospheric Environment. 33, 4589-4596.
Parker, G.G. 1995. Structure and Microclimate of Forest Canopies. In: Forest Canopies,
pp 73-106. Parkhurst, D. F. 1986. Internal leaf structure: a three-dimensional perspective. Pages 215-
249 in T. J. Givnish, editor. On The Economy Of Plant Form And Function. Cambridge Press.
Parkhurst, D. F., S. Wong, G. D. Farquhar, and I. R. Cowan. 1988. Gradients of
intercellular CO2 levels across the leaf mesophyll. Plant Physiology 86: 1032-1037.
Pearcy, R. W. 1990. Sunflecks and photosynthesis in plant canopies. Annual Review of
Plant Physiology and Plant Molecular Biology 41: 421-453. Pyles, R.D., Weare, B.C. and Paw U, K.T. 2000. The UCD Advanced Canopy
Atmosphere-Soil algorithm: comparisons with observations from different climates and vegetation regimes. Quarterly Journal of the Royal Meteorological Society. 126, 2951-2980.
Raich, J.W, Tufekcioglu, A. 2000. Vegetation and soil respiration: Correlations and
controls. Biogeochemistry. 48, 71-90. Rastetter, E.B. 1996. Validating models of ecosystem response to global change.
Bioscience. 46: 190-198.
41
Rastetter, E.B., A.W. King, B.J. Cosby, G.M. Hornberger, R.V. ONeill and J.E. Hobbie. 1992. Aggregating fine-scale ecological knowledge to model coarser-scale attributes of ecosystems. Ecological Applications. 2: 55-70.
Raupach, M.R. 1998. Influences of local feedbacks on land-air exchange of energy and
carbon. Global Change Biology. 4, 477-494. Raupach, M.R. and Finnigan, J.J. 1988. Single layer models of evaporation from plant
communities are incorrect, but useful, whereas multi-layer models are correct but useless: discussion. Australian Journal of Plant Physiology. 15: 705-716.
Raupach, MR and Finnigan, JJ. 1997. The influence of topography on meteorological
variables and surface-atmosphere interactions. Journal of Hydrology 190, 182-213
Reich, P.B, M.B. Walters and D.S. Ellsworth. 1997. From tropics to tundra: global
convergence in plant functioning. Proc. National Academy of Sci. USA, 94: 13730-13734.
Roth-Nebelsick, A. 2001. Computer-based analysis of steady-state and transient heat
transfer of small-sized leaves by free and mixed convection. Plant, Cell and Environment. 24, 633-642.
Ruel JJ, Ayres MP. 1999. Jensen's inequality predicts effects of environmental variation.
Trends in Ecology and Evolution. 14: 361-366. Sala, A. and J. Tenhunen. 1996. Simulations of canopy net photosynthesis and
transpiration of Quercus ilex L. under the influence of seasonal drought. Agricultural and Forest Meteorology. 78: 203-222.
Schuepp, P.H. 1993. Tansley review no. 59, leaf boundary-layers. New Phytologist. 125,
477-507. Schulze, E-D. 1994. The regulation of plant transpiration: interactions of feedforward,
feedback and futile cycles. In: Flux control in Biological Systems. Academic Press. Pp. 203-235.
Schulze, E-D, F.M. Kelliher, C. Korner, J. Lloyd and R. Leuning. 1994. Relationships
between maximum stomatal conductance, ecosystem surface conductance, carbon assimilation rate and plant nitrogen nutrition: a global exercise. Annual Review of Ecological Systematics. 25: 629-660.
Sellers PJ, Dickinson RE, Randall DA, Betts AK, Hall FG, Berry JA, Collatz GJ,
Denning AS, Mooney HA, Nobre CA, Sato N, Field CB, Henderson-Sellers, A. 1997. Modeling the exchanges of energy, water, and carbon between continents and the atmosphere. Science, 275: 502-509.

42
Sinclair, T.R., C.E. Murphy, and K.R. Knoerr. 1976. Development and evaluation of simplified models for simulating canopy photosynthesis and transpiration. Journal of Applied Ecology. 13: 813-829.
Sinoquet H, Le Roux X, Adam B, Ameglio T, Daudet FA. 2001. RATP: a model for
simulating the spatial distribution of radiation absorption, transpiration and photosynthesis within canopies: application to an isolated tree crown. Plant, Cell Environment. 24, 395-406.
Smith, T. and M. Huston. 1989. A theory of the spatial and temporal dynamics of plant
communities. Vegetatio. 83: 49-69. Su, H.B., K.T. Paw U, R.H. Shaw. 1996. Development of a coupled leaf and canopy model
for the simulation of plant-atmosphere interaction. Journal of Applied Meteorology. 35: 733-748.
Terashima, I., Miyazawa, S and Hanba, Y. 2001. Why are sun leaves thicker than shade
leaves? Consideration based on analysis of CO2 diffusion in the leaf. Journal of Plant Research, 114, 93-105.
Terashima, I. and T. Saeki. 1985. A new model for leaf photosynthesis incorporating the
gradients of light environment and of photosynthetic properties of chloroplasts within a leaf. Annals of Botany 56:489-499.
Van den Hurk, B.J.J. and K.G. McNaughton. 1995. Implementation of near-field
dispersion in a simple two-layer surface resistance model. Journal of Hydrology. 166, 293-311.
Vogelmann, T.C., Bornman, JF and Josserand, S. 1989. Photosynthetic light gradients and
spectral regime within leaves of Medicago sativa. Transactions of the Royal Society, London, B. 323, 411-421.
Wang, Y. P. and P. G. Jarvis. 1990. Description and validation of an array model -
MAESTRO. Agricultural and Forest Meteorology 51:257-280. Whitakker, R.H. 1975. Communities and Ecosystems. MacMillan Pub. 2nd edition. 385
pp, Williams, M, Law, B.E., Anthoni, P.M. and Unsworth, M.H. 2001. Use of a simulation
model and ecosystem flux data to examine carbon-water interactions in ponderosa pine. Tree Physiology. 21, 287-298.
Williams, M., Malhi, Y., Nobre, A., Rastetter, E.B., Grace, J. and Pereira, M.G.P. 1998.
Seasonal variation in net carbon exchange and evapotranspiration in a Brazilian rain forest: a modeling analysis. Plant, Cell and Environment. 21, 953-968.
43
Wilson, K.B., D.D. Baldocchi and P.J. Hanson. 2000. Spatial and seasonal variability of photosynthesis parameters and their relationship to leaf nitrogen in a deciduous forest. Tree Physiology 20, 787-797.
Wilson, K.B., D.D. Baldocchi and P.J. Hanson. 2001a. Leaf age affects the seasonal
pattern of photosynthetic capacity and net ecosystem exchange of carbon in a deciduous forest. Plant, Cell and Environment. 24, 571-583.
Wilson, K.B., P.J. Hanson, P. Mulholland, D.D. Baldocchi and S. Wullschleger. 2001b.
A comparison of methods for determining forest evapotranspiration and its components: sap flow, soil water budget, eddy covariance and catchment water balance. Agricultural and Forest Meteorology. 106, 153-168.
Wirtz, K.W. 2000. Simulating the dynamics of leaf physiology and morphology with an
extended optimality approach. Annals of Botany. 86, 753-764. Wohlfahrt, G, Bahn, M, Tappeiner, U, and Cernusca, A. 2000. A model of whole plant
gas exchange for herbaceous species from mountain grassland sites differing in land use. Ecological Modeling. 125:173-201.
Wohlfahrt, G, Bahn, M, Tappeiner, U, and Cernusca, A. 2001. A multi-component,
multi-species model of vegetation-atmosphere CO2 and energy exchange for mountain grasslands. Agricultural and Forest Meteorolog, 106: 261-287.
Wu, J. Liu, Y., Jelinski, D.E. 2000. Effects of leaf area profiles and canopy stratification
on simulated energy fluxes: the problem of vertical spatial scale. Ecological Modeling. 134, 283-297.
Wullschleger, S. D. 1993.Biochemical limitations to carbon assimilation in C3 plants, A retrospective analysis of A/Ci curves from 109 species. Journal Experimental Botany. 44: 907-920.
44
LIST OF FIGURES
Figure 1
Computed vertical profiles of the ratio of the intercellular and ambient CO2 concentrations (Ci/Ca) on the sunlit and shaded leaf fractions for a midday period on day 180.
Figure 2
Vertical profiles of Carboxylation for the conditions of Wj, limited by electron transport, or Wc, limited by RUBP regeneration. Computations are for the sunlit and shaded leaf fractions.
Figure 3
Computed profiles of air temperature within and above a deciduous forest