the contribution of hydrological fluxes to carbon sequestration in a temperate forest plantation...
TRANSCRIPT

The contribution of hydrological fluxes to carbon sequestration in a temperate forest
plantation
Kate Heal, Nick Forrest, Paul JarvisSchool of GeoSciences
The University of Edinburgh
Xiangqing Ma Fujian Agriculture and Forestry University,
China
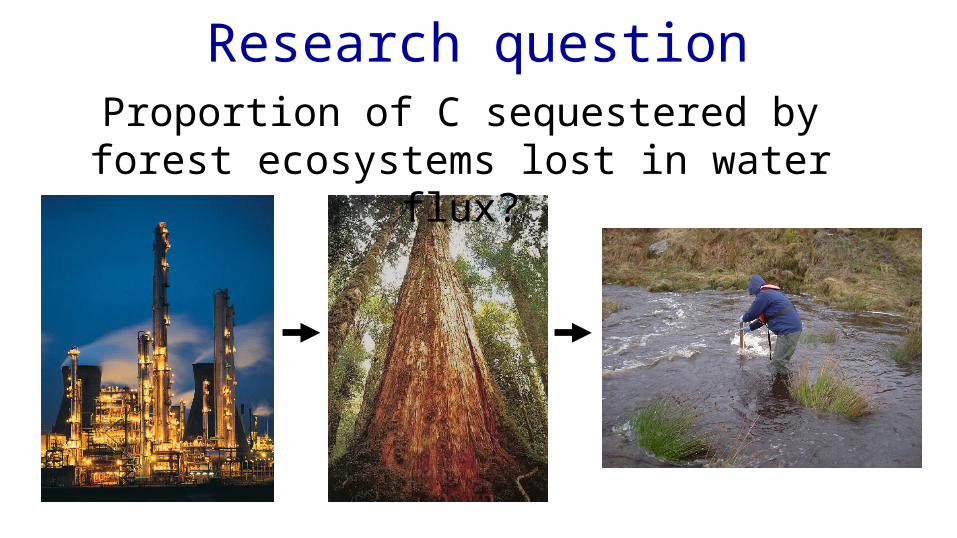
Research questionProportion of C sequestered by forest
ecosystems lost in water flux?
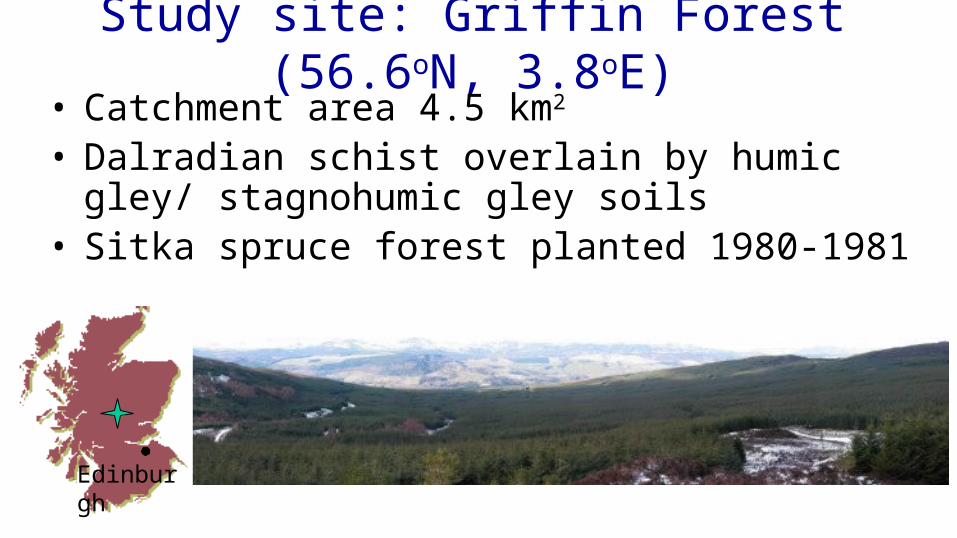
Study site: Griffin Forest (56.6oN, 3.8oE)• Catchment area 4.5 km2
• Dalradian schist overlain by humic gley/ stagnohumic gley soils
• Sitka spruce forest planted 1980-1981
Edinburgh
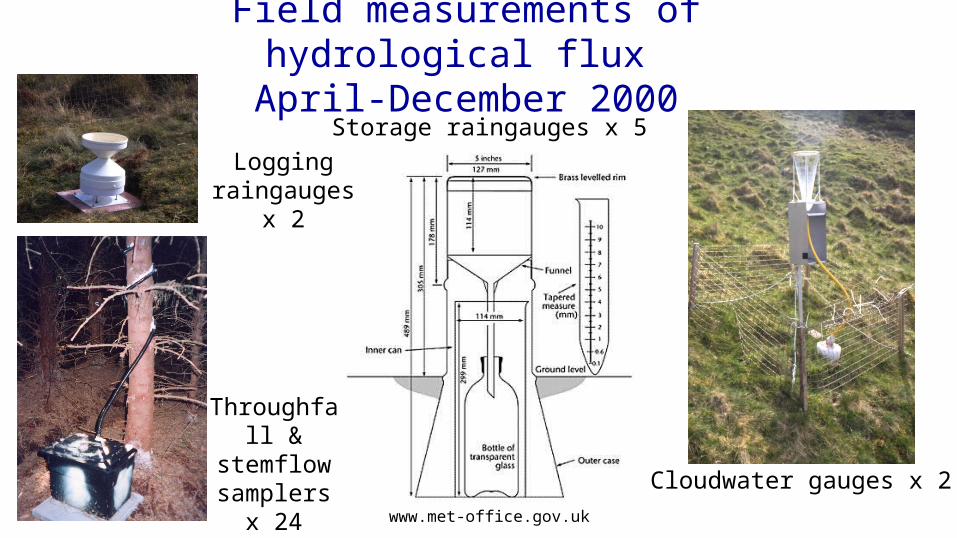
Field measurements of hydrological flux April-December 2000
www.met-office.gov.uk
Storage raingauges x 5
Cloudwater gauges x 2
Logging raingauges x 2
Throughfall & stemflow samplers x
24 trees
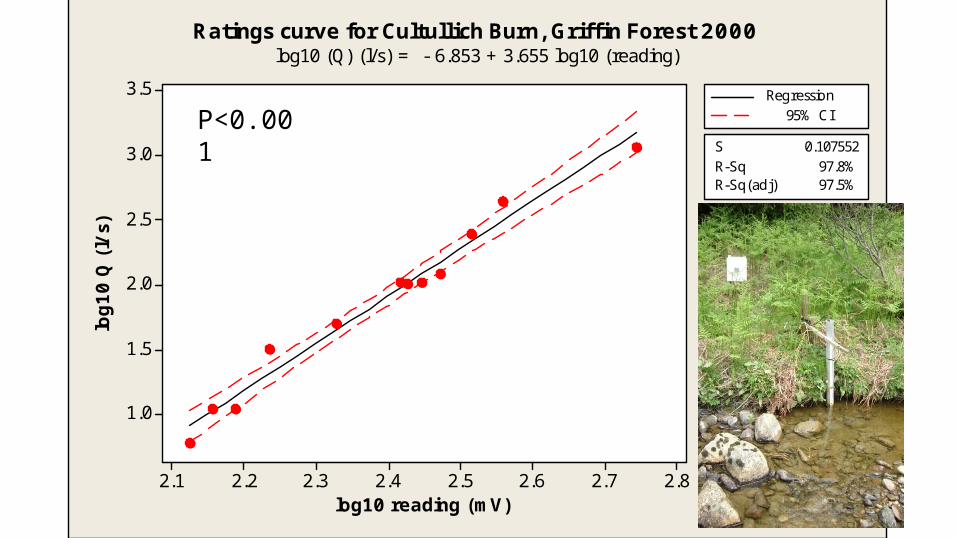
log10 reading (mV)
log10 Q
(l/
s)
2.82.72.62.52.42.32.22.1
3.5
3.0
2.5
2.0
1.5
1.0
S 0.107552R-Sq 97.8%R-Sq(adj) 97.5%
Regression95% CI
Ratings curve for Cultullich Burn, Griffin Forest 2000 log10 (Q) (l/s) = - 6.853 + 3.655 log10 (reading)
P<0.001
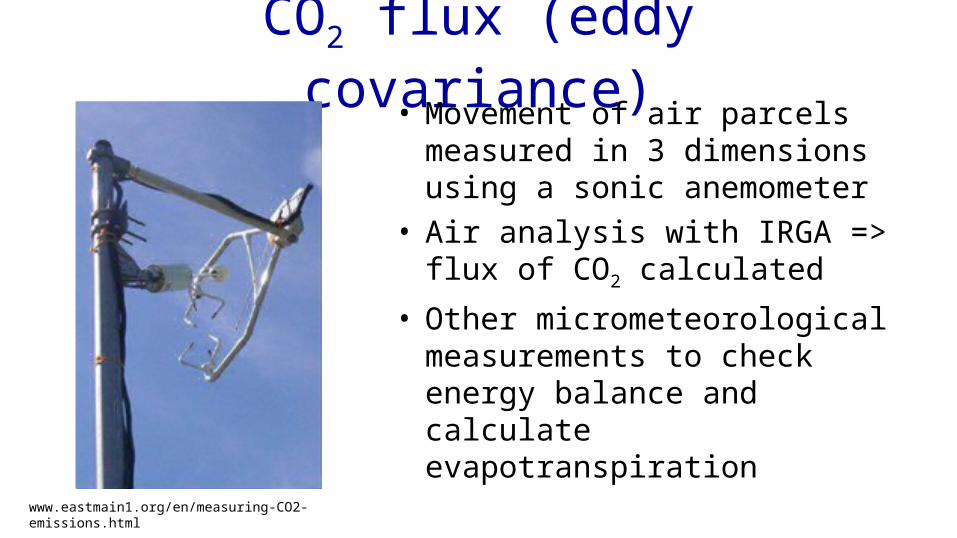
CO2 flux (eddy covariance)• Movement of air parcels
measured in 3 dimensions using a sonic anemometer
• Air analysis with IRGA => flux of CO2 calculated
• Other micrometeorological measurements to check energy balance and calculate evapotranspirationwww.eastmain1.org/en/measuring-CO2-emissions.html
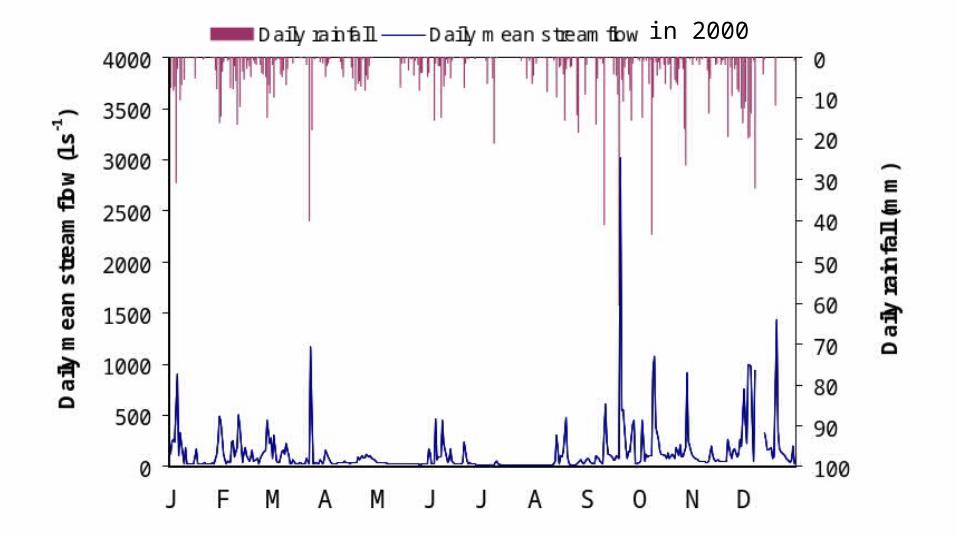
in 2000
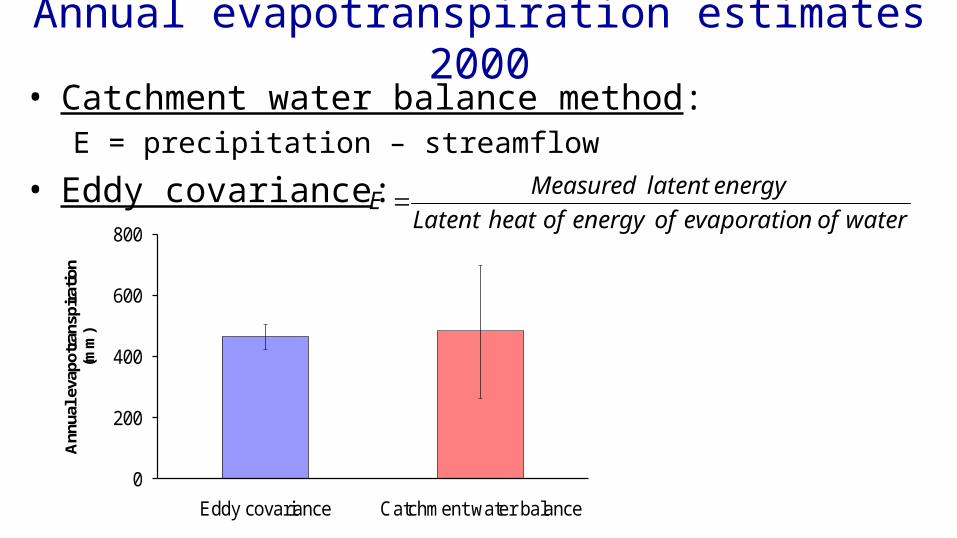
Annual evapotranspiration estimates 2000• Catchment water balance method:
E = precipitation – streamflow
• Eddy covariance:water of nevaporatio of energy of heat Latent
energy latent Measured E
0
200
400
600
800
Eddy covariance Catchment water balance
Ann
ual e
vapo
tran
spir
atio
n (m
m)
• Estimates of evapotranspiration by different methods show close agreement
• Catchment water balance closure within uncertainties
=> Confidence in measurements of hydrological fluxes
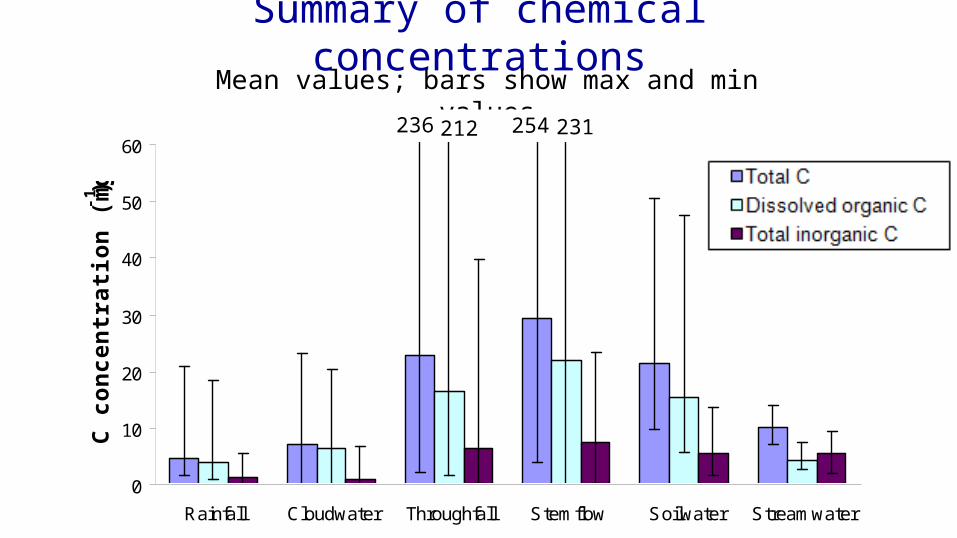
Summary of chemical concentrationsMean values; bars show max and min values
0
10
20
30
40
50
60
Rainfall Cloudwater Throughfall Stemflow Soilwater Streamwater
C c
on
ce
ntr
ati
on
(m
g l
-1)
Total C
Organic C
Inorganic C
236 212 231254
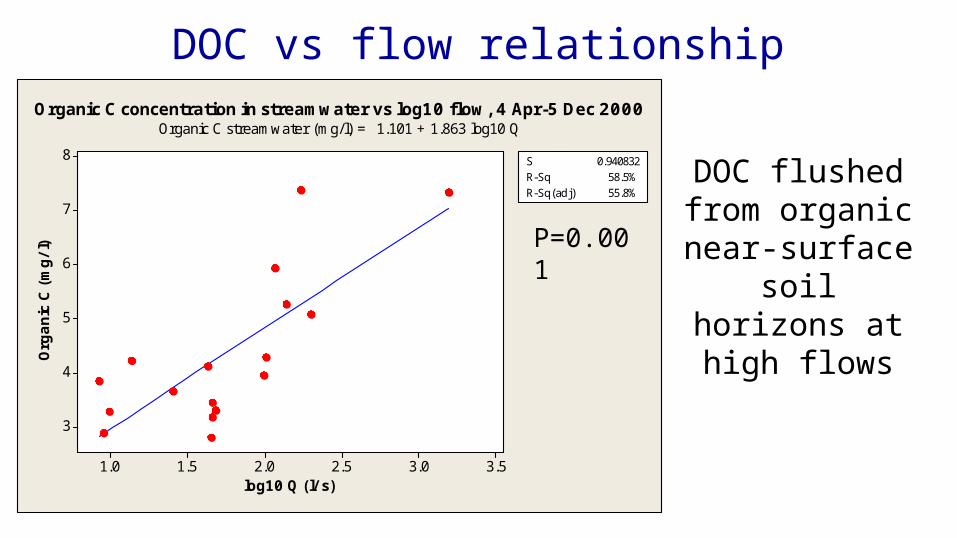
DOC flushed from organic near-surface
soil horizons at high flows
DOC vs flow relationship
log10 Q (l/ s)
Org
anic
C (
mg/l)
3.53.02.52.01.51.0
8
7
6
5
4
3
S 0.940832R-Sq 58.5%R-Sq(adj) 55.8%
Organic C concentration in streamwater vs log10 flow, 4 Apr-5 Dec 2000Organic C streamwater (mg/l) = 1.101 + 1.863 log10 Q
P=0.001
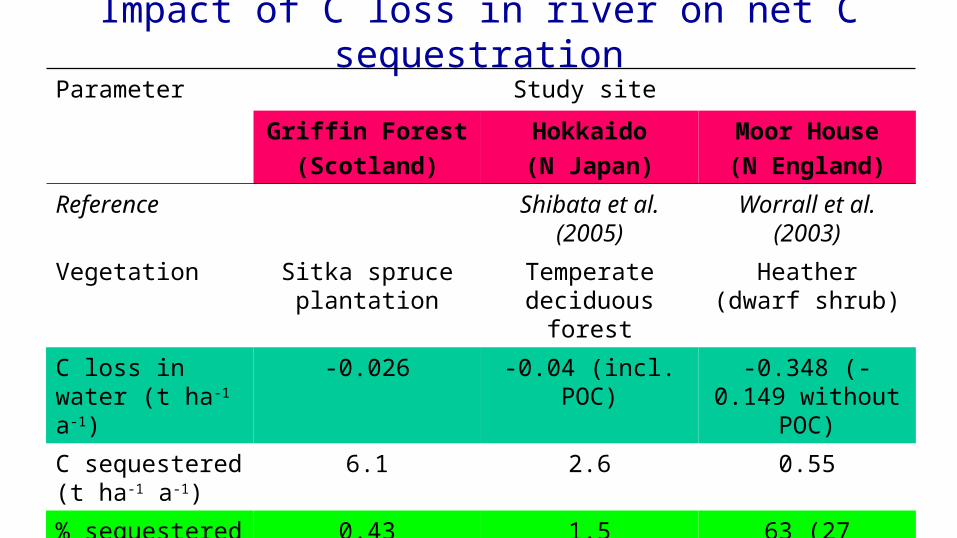
Impact of C loss in river on net C sequestration
Parameter Study site
Griffin Forest
(Scotland)
Hokkaido
(N Japan)
Moor House
(N England)
Reference Shibata et al. (2005)
Worrall et al. (2003)
Vegetation Sitka spruce plantation
Temperate deciduous forest
Heather (dwarf shrub)
C loss in water (t ha-1 a-1)
-0.026 -0.04 (incl. POC) -0.348 (-0.149 without POC)
C sequestered (t ha-1 a-1)
6.1 2.6 0.55
% sequestered C lost in water
0.43 1.5 63 (27 without POC)
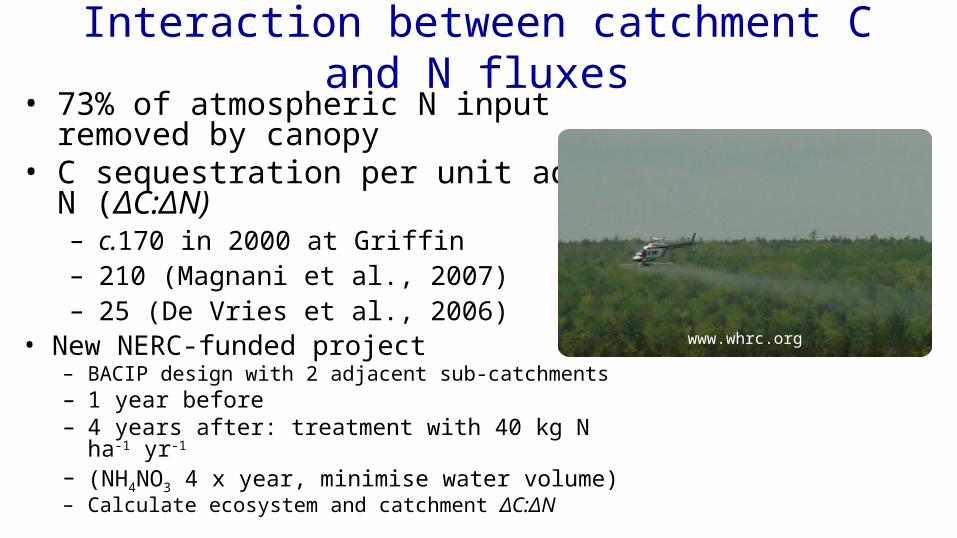
Interaction between catchment C and N fluxes
• 73% of atmospheric N input removed by canopy
• C sequestration per unit added N (ΔC:ΔN)– c.170 in 2000 at Griffin– 210 (Magnani et al., 2007)– 25 (De Vries et al., 2006)
www.whrc.org• New NERC-funded project– BACIP design with 2 adjacent sub-catchments– 1 year before– 4 years after: treatment with 40 kg N ha-1 yr-1
– (NH4NO3 4 x year, minimise water volume)– Calculate ecosystem and catchment ΔC:ΔN