6 air pollution and noise control
TRANSCRIPT
889
6 Air Pollution and Noise Control
ROBERT JACKO AND TIMOTHY LA BRECHEDepartment of Civil EngineeringPurdue UniversityWest Lafayette, Indiana
AIR POLLUTION AND NOISE CONTROLS
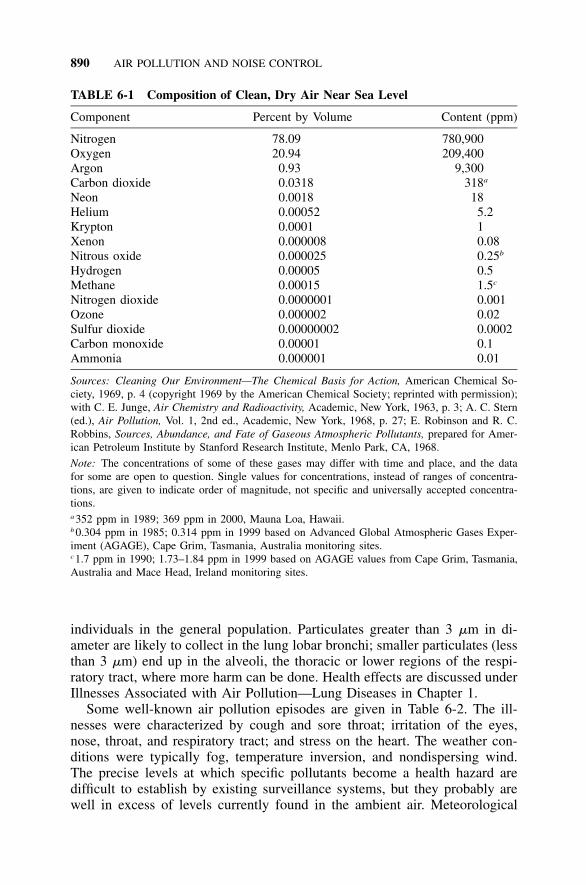
Air pollution is the presence of solids, liquids, or gases in the outdoor air inamounts that are injurious or detrimental to humans, animal, plants, or prop-erty or that unreasonably interfere with the comfortable enjoyment of life andproperty. Air pollution inside dwellings or places of assembly is discussedunder Indoor Air Quality in Chapter 11. The composition of clean air is shownin Table 6-1. The effects of air pollution are influenced by the type andquantity of pollutants and their possible interactions* as well as wind speedand direction, typography, sunlight, precipitation, vertical change in air tem-perature, photochemical reactions, height at which pollutant is released, andsusceptibility of the individual and materials to specific contaminants—sin-gularly and in combination. Air pollution is not a new or recent phenomenon.It has been recognized as a source of discomfort for centuries as smoke, dust,and obnoxious odors.
The solution of any air pollution problem must avoid transferring the pol-lutant removed to another medium, without adequate treatment. See environ-mental engineering multimedia considerations in Chapter 2 and Figure 2-1.
Health Effects
Humans are dependent on air. We breathe about 35 lb of air per day ascompared with the consumption of 3 to 5 lb of water and 1 lb (dry) of food.1–2Pollution in the air may place an undue burden on the respiratory system andcontribute to increased morbidity and mortality, especially among susceptible
*Synergism, antagonism, additive.
Environmental Engineering, fifth edition, Edited by Joseph A. Salvato, Nelson L. Nemerow,and Franklin J. AgardyISBN 0–471-41813-7 � 2003 John Wiley & Sons, Inc., Hoboken, New Jersey
890 AIR POLLUTION AND NOISE CONTROL
TABLE 6-1 Composition of Clean, Dry Air Near Sea Level
Component Percent by Volume Content (ppm)
Nitrogen 78.09 780,900Oxygen 20.94 209,400Argon 0.93 9,300Carbon dioxide 0.0318 318a
Neon 0.0018 18Helium 0.00052 5.2Krypton 0.0001 1Xenon 0.000008 0.08Nitrous oxide 0.000025 0.25b
Hydrogen 0.00005 0.5Methane 0.00015 1.5c
Nitrogen dioxide 0.0000001 0.001Ozone 0.000002 0.02Sulfur dioxide 0.00000002 0.0002Carbon monoxide 0.00001 0.1Ammonia 0.000001 0.01
Sources: Cleaning Our Environment—The Chemical Basis for Action, American Chemical So-ciety, 1969, p. 4 (copyright 1969 by the American Chemical Society; reprinted with permission);with C. E. Junge, Air Chemistry and Radioactivity, Academic, New York, 1963, p. 3; A. C. Stern(ed.), Air Pollution, Vol. 1, 2nd ed., Academic, New York, 1968, p. 27; E. Robinson and R. C.Robbins, Sources, Abundance, and Fate of Gaseous Atmospheric Pollutants, prepared for Amer-ican Petroleum Institute by Stanford Research Institute, Menlo Park, CA, 1968.
Note: The concentrations of some of these gases may differ with time and place, and the datafor some are open to question. Single values for concentrations, instead of ranges of concentra-tions, are given to indicate order of magnitude, not specific and universally accepted concentra-tions.a 352 ppm in 1989; 369 ppm in 2000, Mauna Loa, Hawaii.b 0.304 ppm in 1985; 0.314 ppm in 1999 based on Advanced Global Atmospheric Gases Exper-iment (AGAGE), Cape Grim, Tasmania, Australia monitoring sites.c 1.7 ppm in 1990; 1.73–1.84 ppm in 1999 based on AGAGE values from Cape Grim, Tasmania,Australia and Mace Head, Ireland monitoring sites.
individuals in the general population. Particulates greater than 3 �m in di-ameter are likely to collect in the lung lobar bronchi; smaller particulates (lessthan 3 �m) end up in the alveoli, the thoracic or lower regions of the respi-ratory tract, where more harm can be done. Health effects are discussed underIllnesses Associated with Air Pollution—Lung Diseases in Chapter 1.
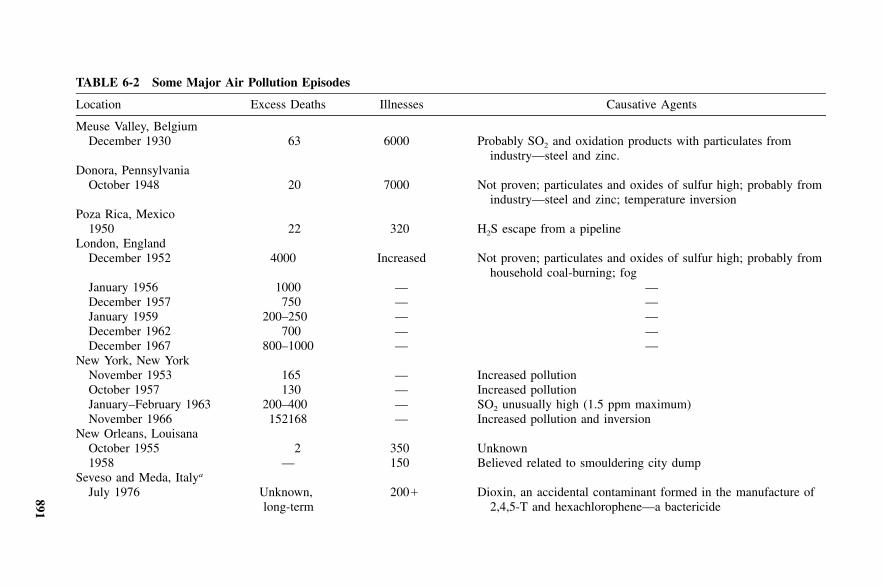
Some well-known air pollution episodes are given in Table 6-2. The ill-nesses were characterized by cough and sore throat; irritation of the eyes,nose, throat, and respiratory tract; and stress on the heart. The weather con-ditions were typically fog, temperature inversion, and nondispersing wind.The precise levels at which specific pollutants become a health hazard aredifficult to establish by existing surveillance systems, but they probably arewell in excess of levels currently found in the ambient air. Meteorological
891
TABLE 6-2 Some Major Air Pollution Episodes
Location Excess Deaths Illnesses Causative Agents
Meuse Valley, BelgiumDecember 1930 63 6000 Probably SO2 and oxidation products with particulates from
industry—steel and zinc.Donora, Pennsylvania
October 1948 20 7000 Not proven; particulates and oxides of sulfur high; probably fromindustry—steel and zinc; temperature inversion
Poza Rica, Mexico1950 22 320 H2S escape from a pipeline
London, EnglandDecember 1952 4000 Increased Not proven; particulates and oxides of sulfur high; probably from
household coal-burning; fogJanuary 1956 1000 — —December 1957 750 — —January 1959 200–250 — —December 1962 700 — —December 1967 800–1000 — —
New York, New YorkNovember 1953 165 — Increased pollutionOctober 1957 130 — Increased pollutionJanuary–February 1963 200–400 — SO2 unusually high (1.5 ppm maximum)November 1966 152168 — Increased pollution and inversion
New Orleans, LouisanaOctober 1955 2 350 Unknown1958 — 150 Believed related to smouldering city dump
Seveso and Meda, Italya
July 1976 Unknown,long-term
200� Dioxin, an accidental contaminant formed in the manufacture of2,4,5-T and hexachlorophene—a bactericide
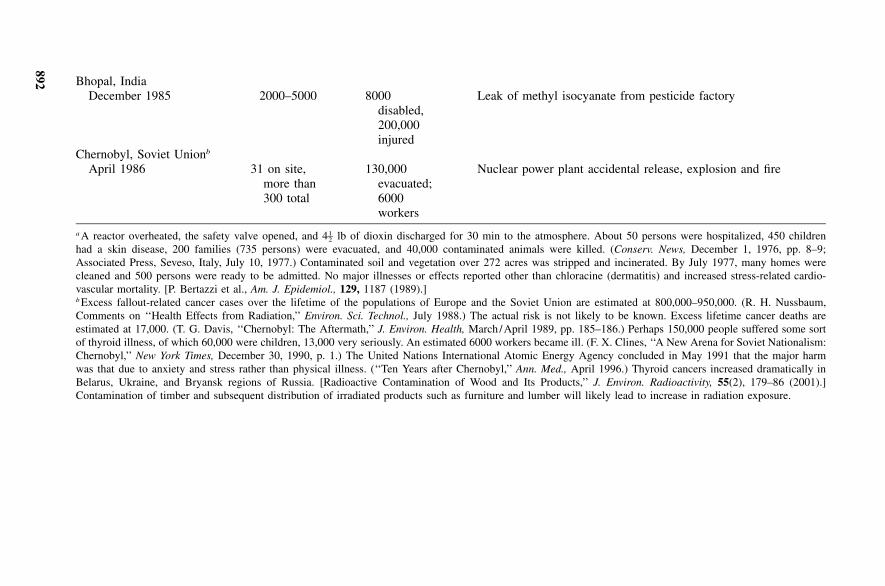
892 Bhopal, IndiaDecember 1985 2000–5000 8000
disabled,200,000injured
Leak of methyl isocyanate from pesticide factory
Chernobyl, Soviet Unionb
April 1986 31 on site,more than300 total
130,000evacuated;6000workers
Nuclear power plant accidental release, explosion and fire
a A reactor overheated, the safety valve opened, and 4 lb of dioxin discharged for 30 min to the atmosphere. About 50 persons were hospitalized, 450 children1–2had a skin disease, 200 families (735 persons) were evacuated, and 40,000 contaminated animals were killed. (Conserv. News, December 1, 1976, pp. 8–9;Associated Press, Seveso, Italy, July 10, 1977.) Contaminated soil and vegetation over 272 acres was stripped and incinerated. By July 1977, many homes werecleaned and 500 persons were ready to be admitted. No major illnesses or effects reported other than chloracine (dermatitis) and increased stress-related cardio-vascular mortality. [P. Bertazzi et al., Am. J. Epidemiol., 129, 1187 (1989).]b Excess fallout-related cancer cases over the lifetime of the populations of Europe and the Soviet Union are estimated at 800,000–950,000. (R. H. Nussbaum,Comments on ‘‘Health Effects from Radiation,’’ Environ. Sci. Technol., July 1988.) The actual risk is not likely to be known. Excess lifetime cancer deaths areestimated at 17,000. (T. G. Davis, ‘‘Chernobyl: The Aftermath,’’ J. Environ. Health, March /April 1989, pp. 185–186.) Perhaps 150,000 people suffered some sortof thyroid illness, of which 60,000 were children, 13,000 very seriously. An estimated 6000 workers became ill. (F. X. Clines, ‘‘A New Arena for Soviet Nationalism:Chernobyl,’’ New York Times, December 30, 1990, p. 1.) The United Nations International Atomic Energy Agency concluded in May 1991 that the major harmwas that due to anxiety and stress rather than physical illness. (‘‘Ten Years after Chernobyl,’’ Ann. Med., April 1996.) Thyroid cancers increased dramatically inBelarus, Ukraine, and Bryansk regions of Russia. [Radioactive Contamination of Wood and Its Products,’’ J. Environ. Radioactivity, 55(2), 179–86 (2001).]Contamination of timber and subsequent distribution of irradiated products such as furniture and lumber will likely lead to increase in radiation exposure.
AIR POLLUTION AND NOISE CONTROLS 893
factors, sample site, frequency and measurement methods, including their ac-curacy and precision, all enter into data interpretation. Nevertheless, standardsto protect the public health are necessary and have been established. (SeeTables 6-5 through 6-7 later in the chapter.)
It should be noted that whereas smoking is a major contributor to respi-ratory disease in the smoker, air pollution, climate, age, sex, and socioeco-nomic conditions affect the incidence of respiratory disease in the generalpopulation. Occupational exposure may also be a significant contributor insome instances. However, the effects may be minimized by engineering andindividual controls. Where engineering controls are not adequate, respiratorscan provide good protection if adapted to the type and concentration of air-borne contaminants, provided they are properly fitted, maintained, and actu-ally used. However, respirators should never be considered an equivalentalternate to engineering controls. They should only be used after a thoroughreview of engineering controls has determined that process modifications andengineering controls are absolutely infeasible or where the risk to humanhealth associated with the failure of an engineering control is excessive.
Economic Effects
Pollutants in the air cause damage to property, equipment, and facilities, inaddition to increased medical costs, lost wages, and crop damage. Sulfur andformaldehyde pollution attack copper roofs and zinc coatings; steel corrodestwo to four times faster in urban and industrial areas due to moisture, chloride,sulfate, and ammonium pollution. The usual electrical equipment contactsbecome unreliable unless serviced frequently; clothing fabric, rubber, plastics,and leather are weakened; lead-based paints, banned in home construction butstill in use in certain industrial applications, are degraded by hydrogen sulfideand oil-based paints by sulfur dioxide; and building surfaces and materials(especially carbonate rock by sulfur dioxide) and works of art are corrodedand deteriorate. In addition, particulates (including smoke) in polluted aircause erosion, accelerate corrosion, and soil clothes, buildings, cars, and otherproperty, making more frequent cleaning and use of indoor air-filtering equip-ment necessary. Ozone reduces the useful life of rubber and other elastomers,attacks some paints, discolors dyes, and damages textiles. See also Measure-ment of Materials’ Degradation, this chapter.
The U.S. Environmental Protection Agency (EPA) is required to periodi-cally assess the cost and benefit of the Clean Air Act (CAA). These reviewshave been both retrospective and prospective. In a retrospective review of thecost and benefit of the CAA between 1970 and 1990, a mean monetizedbenefit of $22.2 trillion (in 1990 dollars) was estimated. The cost of compli-ance in the same period was estimated at $0.5 Trillion. Specific benefits in-cluded in these estimates were Agriculture; net surplus due to ozonereduction, $23 billion; IQ (intelligence quotient, lost IQ points � childrenwith IQ � 70 points), $399 billions; chronic bronchitis, $3.3 trillion; and
894 AIR POLLUTION AND NOISE CONTROL
reduced mortality due to particulate matter reduction, $16.6 billion. All ofthese values are mean values and have varying ranges based on the uncertaintyassociated with estimating each parameter. For example, the 5th percentile‘‘low’’ benefit associated with the period of 1970 to 1990 was $5.6 trillionwhile the 95th percentile ‘‘high’’ benefit was $49.4 trillion. The costs asso-ciated with complying with the CAA are more easily monetized and havemuch less variability because they are primarily associated with pollutioncontrol equipment design, purchase, and maintenance. Other control costsinclude policy development, regulatory enforcement, and regulatory pollutionmonitoring, all of which are eventually borne by shareholders, customers, andtaxpayers.1 The daily personal cost of air pollution can be tallied by over-the-counter medicines to treat the medical symptoms of air pollution as well aslost work days and decreased productivity and quality of life.2
Effects on Plants
It has been suggested that plants be used as indicators of harmful contami-nants because of their greater sensitivity to certain specific contaminants. Hy-drogen fluoride, sulfur dioxide, smog, ozone, and ethylene are among thecompounds that can harm plants. Urban smog is likely to contain carbonmonoxide, soot, dust, and ozone from the reaction of sunlight on nitrogenoxides, hydrocarbons, and other volatile organic compounds. Assessment ofdamage shows that the loss can be significant, although other factors such assoil fertility, temperature, light, and humidity also affect production. Ozonehas been indicated in forest decline and in damage to a variety of otheragriculture products.3 Among the plants that have been affected are truckgarden crops (New Jersey), orange trees (Florida), orchids (California), andvarious ornamental flowers, shade trees, evergreen forests, alfalfa, grains, to-bacco, citrus, lettuce (Los Angeles), and many others. In Czechoslovakia morethan 300 mi2 of evergreen forests was reported severely damaged by sulfurdioxide fumes.4 Smog such as the type found in Los Angeles is the productof a photochemical reaction involving nitrogen oxides, hydrocarbons and ox-ygen. Where local topography and meteorology inhibit dispersion, smog canaccumulate to unhealthy concentrations. Photochemical smog has also beenreported in New York, Japan, Mexico City, Madrid, the United Kingdom, andother congested areas with high motor vehicle traffic. The brown clouds as-sociated with smog are due to excess NOx, which preferentially absorbs lightfrom the blue-green spectrum. The remaining colors result in the brownishcolor associated with smog that can reduce visibility and is aesthetically dis-pleasing.5
Injury to plants due to ozone shows up as flecks, stipple and bleaching,tip burns on conifers, and growth suppression. Peroxyacyl nitrate* (PAN)
*Also cause of eye irritation.
AIR POLLUTION AND NOISE CONTROLS 895
injury is apparent by glazing, silvering, or bronzing on the underside of theleaf. Sulfur dioxide injury shows up as bleached and necrotic areas betweenthe veins, growth suppression, and reduction in yield. Hydrogen fluoride in-jury is evidenced by plant leaf tip and margin burn, chlorosis, dwarfing, abruptgrowth cessation, and lowered yield.6 See also Acid Rain (Acidic Precipita-tion), this chapter.
Effects on Animals
Fluorides have caused crippling skeletal damage to cattle in areas where flu-orides absorbed by the vegetation are ingested. Animal laboratory studiesshow deleterious effects from exposure to low levels of ozone, photochemicaloxidants, and PAN. Lead and arsenic have also been implicated in the poi-soning of sheep, horses, and cattle. All of the canaries and about 50 percentof the animals exposed to hydrogen sulfide in the Poza Rica, Mexico, incident(see Table 6-2) were reported to have died. Morbidity and mortality studiesare ongoing to determine actual impacts of air pollutants on animals.
Aesthetic, Climatic, and Related Effects
Insofar as the general public is concerned, smoke, dust, and haze, which areeasily seen, cause the greatest concern. Reduced visibility not only obscuresthe view but is also an accident hazard to air, land, and water transportation.Soiling of statuary, clothing, buildings, and other property increases municipaland individual costs and aggravates the public to the point of demandingaction on the part of public officials and industry. Correction of the air pol-lution usually results in increased product cost to the consumer, but failureto correct pollution is usually more costly.
Air pollution, both natural and man made, affects the climate. Dust andother particulate matter in the air provide nuclei around which condensationtakes place, forming droplets and thereby playing a role in snowfall and rain-fall patterns. Haze, dust, smoke, and soot reduce the amount of solar radiationreaching the surface of the earth. Aerosol emissions from jet planes alsointercept some of the sun’s rays.
Certain malodorous gases interfere with the enjoyment of life and property.In some instances, individuals are seriously affected. The gases involved in-clude hydrogen sulfide, sulfur dioxide, aldehydes, phenols, polysulfides, andsome olefins. Air pollution control equipment such as thermal oxidizers andcarbon absorbers are available to eliminate or control these objectionablecompounds.
Effect of Carbon Dioxide and Other Gases on Global Warming Solar en-ergy, as light in the form of short-wavelength radiation, that reaches the earthis absorbed and reradiated back to the atmosphere as long-wavelength infraredradiation or heat energy. (Ultraviolet radiation has little effect on earth warm-

896 AIR POLLUTION AND NOISE CONTROL
ing.) However, carbon dioxide, methane, chlorofluorocarbons (CFCs), cloudsand atmospheric water vapor, and nitrous oxides tend to trap the reradiatedheat, causing a reflection of that heat back to the earth and a warming of thelower atmosphere, oceans, and the earth’s surface—known as the greenhouseeffect. According to the EPA, carbon dioxide constitutes 49 percent of thegreenhouse effect, as compared to methane 18 percent, CFCs 14 percent,nitrous oxides 6 percent, and other gases 13 percent.7 Still other estimatesplace the relative contributions as carbon dioxide 57 percent, CFCs 25 per-cent, methane 12 percent, and nitrous oxide 6 percent.8 The relative contri-butions will always be flux depending on the concentration in the atmosphereand because all greenhouse gases are not equal in their warming potential.Certain man-made compounds are far more effective greenhouse gases thanother naturally occurring compounds. Nitrous oxide, both man made and nat-urally occurring, is 310 times more effective than carbon dioxide. Hydrofluo-rocarbon (HFC) 23, a man-made refrigerant, is 11,700 times more effectivethan carbon dioxide.9
Industrial, power plant, and automobile emissions and the burning of fossilfuels and forests contribute carbon dioxide and other gases to the atmosphere.This is in addition to the carbon dioxide naturally released during respirationand decomposition. Methane is produced by the decay of organic matter inwetlands, rice paddies, ruminant animals and termites, forest fires and woodburning, landfills, and gas drilling and releases. Chlorofluorocarbon sourcesinclude refrigerants, solvents, and plastic foam manufacture. Sources of ni-trogen oxides include burning coal and other fossil fuel, fertilizer breakdown,and soil bacteria reactions. Other gases involved to a lesser extent are carbonmonoxide and sulfur dioxide.
The warming effect of the gases in the lower atmosphere is offset to someextent by the cooling effect of the haze, dust, smoke, soot, and dust fromvolcanic eruptions that intercept and reduce the solar radiation reaching theearth. However, evaporation from the warmed oceans and other bodies ofwater and land surfaces due to greenhouse warming would be increased, aswould vegetation transpiration, causing further cooling. The increased evap-oration would also cause an increase in precipitation in some areas. In addi-tion, the oceans, rain, and growing forests and other vegetation duringphotosynthesis altogether remove or absorb significant quantities of carbondioxide. These processes that remove carbon dioxide from the environmentare often referred to as carbon dioxide ‘‘sinks.’’ Tropical rain forests are amajor carbon dioxide sink, and their destruction both adds carbon dioxde tothe atmosphere and removes a carbon repository.
There seems to be agreement that the destruction of tropical rain forestsshould be brought under control and that a massive global reforestation pro-gram is desirable. However, the planting of even a billion trees a year for 10years is estimated to absorb only about 1 to 3 percent of the carbon dioxideproduced by human activity in the United States. Federal analysts havereached similar conclusions. They estimated that planting 20 billion trees per
AIR POLLUTION AND NOISE CONTROLS 897
year could capture up to 67 percent of the nation’s annual emissions of carbondioxide under the best of conditions. Although trees take in carbon dioxideand return oxygen to the air, storing the carbon in the wood, fully maturetrees neither store nor emit carbon. Eventually, annual tree growth roughlyequals the loss and decay of branches and leaves.10 But there are many otherecological and aesthetic reasons to save the tropical forests.
Ultimately, large reductions in oil and coal burning are needed to substan-tially reduce carbon dioxide emissions. Energy conservation and greater useof renewable resources such as hydroelectric power, solar energy, wind power,geothermal energy, wave energy, and biomass energy, where possible, can allreduce the net increase of global warming gases; however, they are not with-out their own technical and feasibility issues. Nuclear power generation isessentially carbon dioxide emission free, but political as well as safety con-cerns have prevented wider adoption of the technology in the United States.The result has been the expansion of fossil-fueled power plants. The releaseof carbon dioxide will expand for many years to come if alternate sources ofenergy are not developed.
New-generation nuclear reactors such as pebble bed systems offer the pos-sibility of intrinsic safety and even decentralized power systems. Recent re-search has shown that if the full production process is considered whencomparing nuclear to coal-fueled power systems, the actual damage to humanhealth has been far greater historically with coal power production than withnuclear production. These analyses consider the total product cycle from raw-material extraction to power delivery. When the dangers of fuel extractionand processing are factored into the risk associated with coal power produc-tion, the nuclear options appear safer.11
In addition to temperature rise, the probable net projected effects of in-creased greenhouse gases include changes in rain, snow, and wind patternsthat affect agriculture, overall precipitation, humidity, soil moisture, and stormfrequency. The growing season would be lengthened. Melting polar ice wouldraise ocean levels.
In spite of many uncertainties, according to Climate Change 2001: TheScience Basis,12 it appears that the carbon dioxide level and global warmingare increasing. However, many scientists believe that the facts (and assump-tions) do not adequately support the predictions.13,14 An astrophysicist withthe Harvard Smithsonian Centre for Astrophysics commented that the ‘‘bestcurrent science offers little justification for rapid cuts in carbon dioxide.’’ Shebelieves ‘‘human-made global warming is relatively minor and will be slowto develop.’’15 In any case, there is agreement on the need to maintain andimprove environmental quality and conserve natural resources.
Effect of Ozone and Chlorofluorocarbons Another global factor is theozone layer in the upper atmosphere (stratosphere), about 8 to 30 miles abovethe earth’s surface. It helps shield the earth by filtering out or absorbingharmful UV solar radiation. Ozone is formed naturally by the action of sun-
898 AIR POLLUTION AND NOISE CONTROL
light on the oxygen molecule. When released in the lower atmosphere (tro-posphere), CFCs and halons (a compound consisting of bromine, chlorine,and carbon) migrate upward to the stratosphere through the mixing force ofwind, where they remain chemically stable as long as 400 years. When ex-posed to UV solar radiation, CFCs release chlorine atoms and certain othergases that react with ozone in the stratosphere, reducing the total amount ofozone available to intercept destructive UV radiation. The chlorine in oneCFC molecule is believed to destroy tens of thousands of ozone molecules.Bromine is more than 40 times as destructive as chlorine. Nitrous oxide alsocontributes to ozone depletion.16 Chemical fertilizers, soil bacteria, burningforests, and fossil fuels are sources of nitrous oxide.
The destruction of ozone by CFCs, halons, and other compounds permitsmore of the solar radiation to reach the earth, which could cause an increasein skin cancer, eye cataracts, and changes in climate and animal and plantlife. This additional solar radiation could also overexpose and kill phytoplank-ton, a major source of food for fish, seals, penguins, and whales. Subsequentphytoplankton reduction, including algae, would result in less uptake of car-bon dioxide. This would cause an increase in the atmospheric carbon dioxidelevel and contribute to the earth’s warming and a reduction in aquatic lifeand our food supply, as previously noted.
Chlorofluorocarbons remain in the stratosphere for 75 to 110 years.17 Be-cause of the potential health and environmental effects, steps have been takento phase out products containing CFCs and halons throughout the world. Theproduct sources include refrigerants (dichlorodifluoromethane, or freon), in-dustrial solvents, volatile paints, plants manufacturing plastic foams, and aer-osol spray cans containing CFC propellant. The CFCs are no longer used asblowing agents in the manufacture of food service disposables.18 Bromine19
from halons used primarily in fire extinguishers and from chemicals used tomake fire retardants, soil fumigants, and agricultural products also destroyozone by reacting with chlorine synergistically in the absence of oxygen andsunlight. Methyl chloroform and carbon tetrachloride contribute to the prob-lem. Existing refrigerating systems using CFCs that are scrapped remain fu-ture sources of CFC release if not contained, recycled, or otherwise controlled.Suggested alternatives to CFCs include hydrochlorofluorocarbons (HCFCs),20
which although not as harmful as CFCs, should nevertheless be recycled. Aglobal attack was started in 1987—the Montreal Protocol on Substances ThatDeplete the Ozone Layer was signed by 32 countries, with a goal to reducethe 1986 level of use of CFCs and halons by 50 percent.21 In May 1989,representatives of the European Economic Community (EEC) and 81 othercountries, including the United States and Canada, agreed to phase out allCFC use by the year 2000, if possible, as well as the use of halons, carbontetrachloride, and methyl chloroform.22 In June 1990, environment ministersfrom 93 nations met in London and agreed to phase out the production anduse of CFCs and related chemicals, including halons and carbon tetrachloride,by the end of the century and methyl chloroform by 2005. The HCFCs areto be phased out between 2000 and 2040.
AIR POLLUTION AND NOISE CONTROLS 899
Ozone is also formed in the lower atmosphere (troposphere), which extendsupward for about 8 miles. There, nitrogen oxides, gasoline vapors, and otherhydrocarbon emissions from refineries, motor vehicles, solvents, and the likereact with sunlight and heat. However, the EPA believes that ozone in thelower atmosphere near the ground level does not replace ozone lost from theupper levels.23 Ozone at ground level causes lung dysfunction and irritationof the mucous membranes of the eyes, nose, and throat as well as tree andcrop damage. Under stable conditions, ozone interactions cause smog anddeterioration of exterior paints, rubber, synthetic fibers, and plastics.
Acid Rain (Acidic Precipitation) Releases of nitrogen and sulfur oxides andcarbon dioxide, as well as other pollutants, are carried into the atmosphere,where they interact with sunlight and vapor and may be deposited as ‘‘acidrain’’ many miles from the source. The term includes rain, snow, sleet, fog,mist, and clouds containing sulfuric acid, nitric acid, and carbonic acid aswell as direct dry deposition. Large regional emissions and then depositionover a limited area exacerbate the acid rain problem, such as in the northeastUnited States and eastern Canada. The Southeast, Midwest, West, RockyMountain states, western Europe, Scandinavia, and eastern Europe are alsoaffected. In New York and the Northeast, 60 to 70 percent of the reportedacidity is due to sulfuric acid, 30 to 40 percent to nitric acid. The relativeproportion of each is indicative of the probable preponderant pollutantsources.24 Major sources of sulfur dioxide, nitrogen oxides, and carbon di-oxide are coal- and oil-burning power plants, refineries, and copper and othermetal smelters. Principal sources of nitrogen oxide emissions25 are electricutility and industrial boilers and motor vehicles. Nitrogen oxides from motorvehicle and high-temperature combustion not only contribute to photochem-ical smog but to changes in the atmosphere, and they return to earth in acidform mixed with precipitation.
High stacks permit the discharge of pollutants into the upper air streamthat are then carried great distances by prevailing winds, usually from westto east in the United States. Natural sources of sulfur dioxide, such as activevolcanoes, the oceans, and anaerobic emissions from decaying plants, fertil-izers, and domestic animals, contribute to the problem. However, the risk tothe public health and welfare is complex and very difficult to quantify.26 Theredoes not appear to be any significant threat to the public health,27 althoughthis is debatable. About half of all atmospheric sulfur worldwide is reportedto come from natural sources.28 The main contributor to natural acidity iscarbon dioxide. The natural acidity of precipitation may vary from pH 5.4 to5.7* (with the lower pH in the northeast United States according to the Na-tional Acid Deposition Program of 1978 to 1984) and may be as low as 4.0to 4.6 or lower. While a forest canopy may reduce acidity and ammonia,particulates in the air may, in part, neutralize the acid.
*Lemon juice has a pH of 2, vinegar 3, pure rain 5.6, distilled water 7, and baking soda 8.2.
900 AIR POLLUTION AND NOISE CONTROL
As previously noted, acidic precipitation contributes to deterioration ofbuildings, monuments and statues, roofing materials, and automobiles. It isalso believed to adversely affect trees (mainly conifers at high altitudes),possibly crops and other vegetation. Ozone at ground level is also reportedto be a major cause of forest decline.29 Acidic precipitation may be tempo-rarily beneficial to some vegetation.30 However, a second stage of acid raincan kill nitrogen-fixing microorganisms and cause decreased production, andthen death, as acidity penetrates the soil profile and root system. Calcium andmagnesium, necessary for tree growth, are leached from the soil. Aluminumin the soil also becomes available for vegetative uptake. The calcium andmagnesium/aluminum ratio is decreased, impairing tree and root growth asthe toxic aluminum accumulates in the roots. Susceptibility to insects andstresses due to cold, drought, and heat increase.31 Forest management, climate,soil nutrients, and geology may also play a role.
Acid rain also adversely affects lakes and streams, where the pH may bereduced to less than 5.0, with resultant reduced fish production. The decom-position of organic deposits contributes to lake acidity. Acidification and de-mineralization of soils cause higher input of toxic aluminum and other metalsto lakes and streams. The condition is more apparent in a lake or groundwaterwhen its buffering capacity and that of the surrounding soil (alkalinity andcalcium) are reduced or exhausted. This leads to the release of toxic metalsto water supply sources, particularly to shallow well-water supplies. Therecould also be accumulation in fish, as for example increased levels of mercury,aluminum, cadmium, and zinc of 10 to 100 times the normal range.
Control measures should start with coal desulfurization at mining sites andsource reduction, such as at high-sulfur oil- and coal-burning plants, and withnitrogen oxides from motor vehicles. Further reduction can be achieved byflue gas desulfurization and the use of scrubbers and other emission controldevices. The use of alternative, low-sulfur fuels, as well as hydroelectric,nuclear, and solar power, should also be considered. The application of limeor limestone to lakes and their watersheds is only a temporary measure, along-term solution must be found.
Acid rain is only one aspect of air pollution. Other toxic stack emissionsrequiring control include hazardous air pollutants (HAPs) such as lead, mer-cury, cadmium, zinc, vanadium, arsenic, copper, selenium, and organic pol-lutants. These must be eliminated or reduced to innocuous levels.
SOURCES AND TYPES OF AIR POLLUTION
The sources of air pollution may be man made, such as the internal combus-tion engine, or natural, such as plants (pollens). The pollutants may be in theform of particulates, aerosols, and gases or microorganisms. Included arepesticides, odors, and radioactive particles carried in the air.
SOURCES AND TYPES OF AIR POLLUTION 901
Particulates range from less than 0.01 to 1000 �m* in size; generally theyare smaller than 50 �m. Smoke is generally less than 0.1 �m size soot orcarbon particles. Those below 10 �m can penetrate the lower respiratory tract;particles less than 3 �m reach the tissues in the deep parts of the lung.Particles over 10 �m are removed by the hairs at front of nose. Included aredust and inorganic, organic, fibrous, and nonfibrous particles. Aerosols areusually particles 50 �m to less than 0.01 �m in size; although generally theyare less than 1 �m in diameter. Gases include organic gases such as hydro-carbons, aldehydes, and ketones and inorganic gases (oxides of nitrogen andsulfur, carbon monoxide, hydrogen sulfide, ammonia, and chlorine).
Man-made Sources
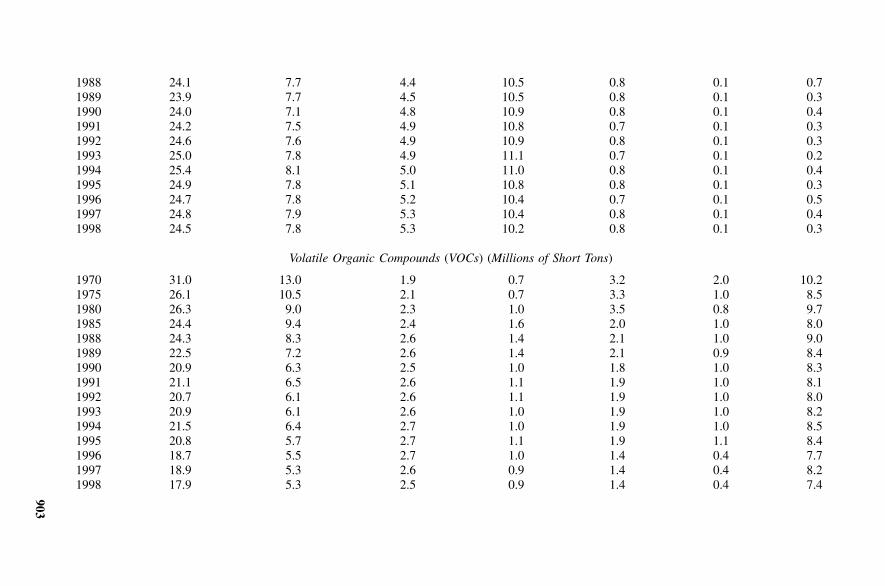
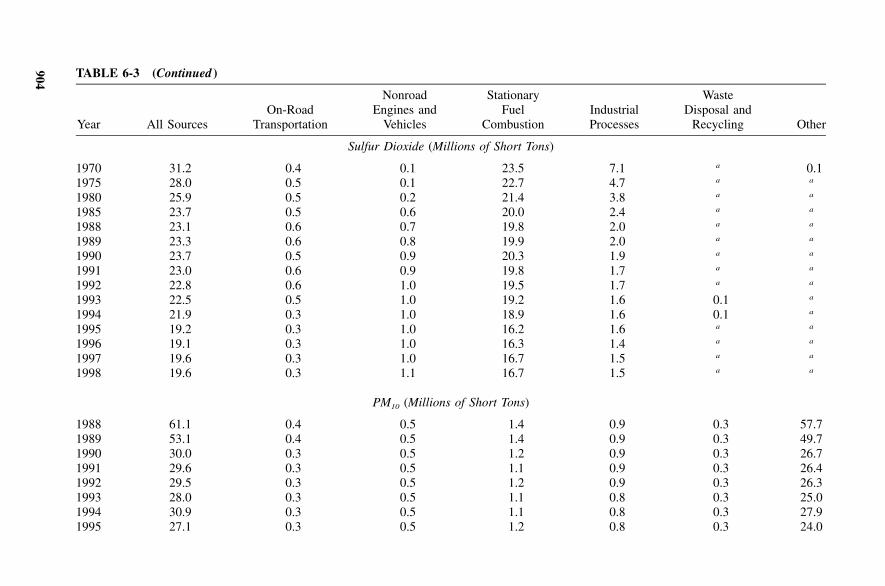
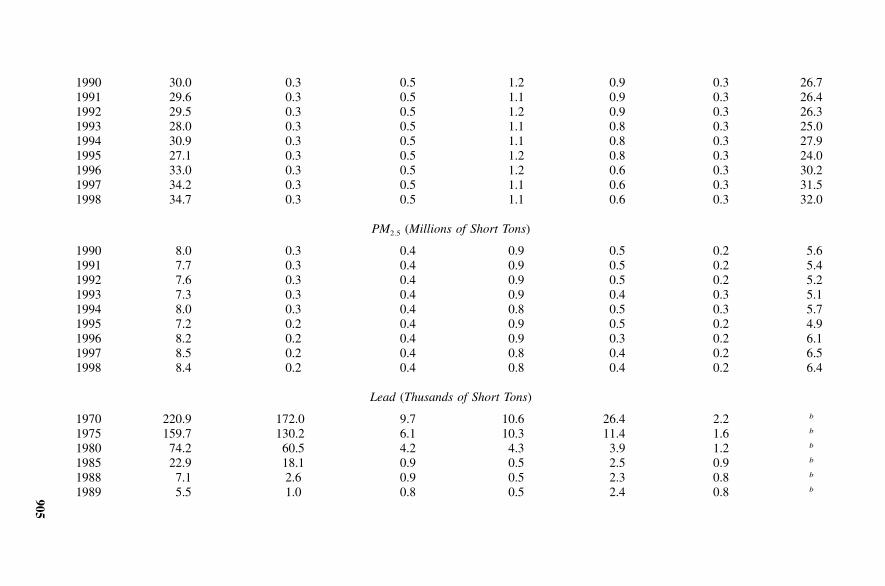
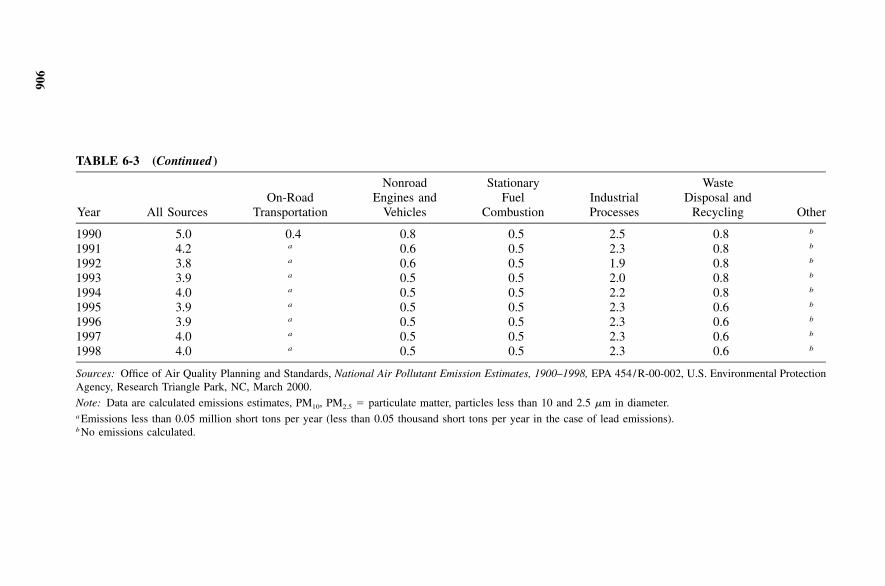
Air pollution in the United States is the result of industrialization and mech-anization. The major sources and pollutants are shown in Table 6-3. It can beseen that carbon monoxide is the principal pollutant by weight and that themotor vehicle is the major contributor, followed by industrial processes andstationary fuel combustion. However, in terms of hazard, it is not the tons ofpollutant that is important but the toxicity or harm that can be done by theparticular pollutant released. Lead has shown the most dramatic reduction,due to the use of nonleaded gasoline.
Agricultural spraying of pesticides, orchard-heating devices, exhaust fromvarious commercial processes, rubber from tires, mists from spray-type cool-ing towers, and the use of cleaning solvents and household chemicals add tothe pollution load. Toxic pollutant emissions and their fate in the environmentneed further study.
Particulates, gases, and vapors that find their way into the air without beingvented through a stack are referred to as fugitive emissions. They includeuncontrolled releases from industrial processes, street dust, and dust fromconstruction and farm cultivation. These need to be controlled at the sourceon an individual basis.
Wood stoves contribute significantly to air pollution. This type of pollutionis a potential health threat to children with asthma and elderly people withchronic lung problems. Wood stove use may have to be limited. Stoves arebeing redesigned to keep the air pollution at acceptable levels.
Natural Sources
Discussions of air pollution frequently overlook the natural sources. Theseinclude dust, plant and tree pollens, arboreal emissions, bacteria and spores,
*A micron (�m) is 1 /1000 of a millimeter, or 1 /25,000 of an inch. Particles of 10 �m and largerin size can be seen with the naked eye.
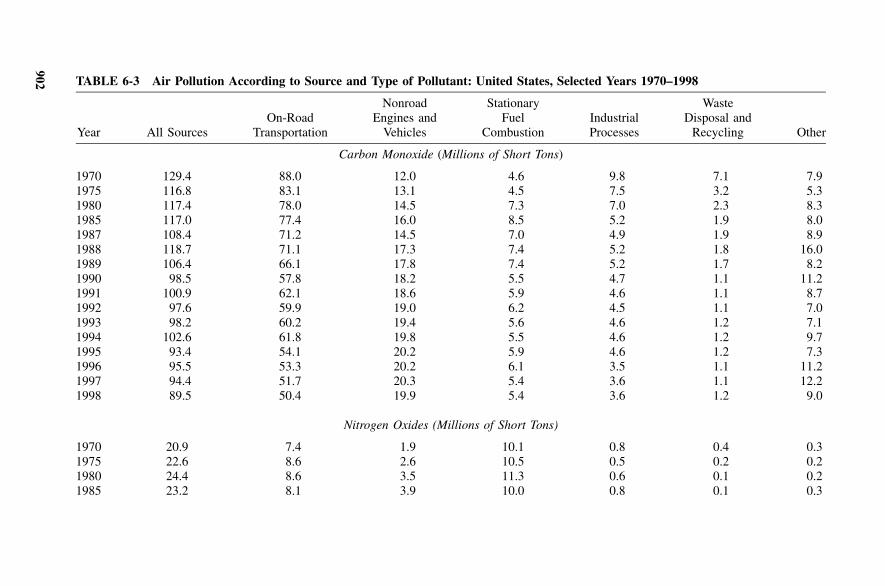
902 TABLE 6-3 Air Pollution According to Source and Type of Pollutant: United States, Selected Years 1970–1998
Year All SourcesOn-Road
Transportation
NonroadEngines and
Vehicles
StationaryFuel
CombustionIndustrialProcesses
WasteDisposal and
Recycling Other
Carbon Monoxide (Millions of Short Tons)
1970 129.4 88.0 12.0 4.6 9.8 7.1 7.91975 116.8 83.1 13.1 4.5 7.5 3.2 5.31980 117.4 78.0 14.5 7.3 7.0 2.3 8.31985 117.0 77.4 16.0 8.5 5.2 1.9 8.01987 108.4 71.2 14.5 7.0 4.9 1.9 8.91988 118.7 71.1 17.3 7.4 5.2 1.8 16.01989 106.4 66.1 17.8 7.4 5.2 1.7 8.21990 98.5 57.8 18.2 5.5 4.7 1.1 11.21991 100.9 62.1 18.6 5.9 4.6 1.1 8.71992 97.6 59.9 19.0 6.2 4.5 1.1 7.01993 98.2 60.2 19.4 5.6 4.6 1.2 7.11994 102.6 61.8 19.8 5.5 4.6 1.2 9.71995 93.4 54.1 20.2 5.9 4.6 1.2 7.31996 95.5 53.3 20.2 6.1 3.5 1.1 11.21997 94.4 51.7 20.3 5.4 3.6 1.1 12.21998 89.5 50.4 19.9 5.4 3.6 1.2 9.0
Nitrogen Oxides (Millions of Short Tons)
1970 20.9 7.4 1.9 10.1 0.8 0.4 0.31975 22.6 8.6 2.6 10.5 0.5 0.2 0.21980 24.4 8.6 3.5 11.3 0.6 0.1 0.21985 23.2 8.1 3.9 10.0 0.8 0.1 0.3
903
1988 24.1 7.7 4.4 10.5 0.8 0.1 0.71989 23.9 7.7 4.5 10.5 0.8 0.1 0.31990 24.0 7.1 4.8 10.9 0.8 0.1 0.41991 24.2 7.5 4.9 10.8 0.7 0.1 0.31992 24.6 7.6 4.9 10.9 0.8 0.1 0.31993 25.0 7.8 4.9 11.1 0.7 0.1 0.21994 25.4 8.1 5.0 11.0 0.8 0.1 0.41995 24.9 7.8 5.1 10.8 0.8 0.1 0.31996 24.7 7.8 5.2 10.4 0.7 0.1 0.51997 24.8 7.9 5.3 10.4 0.8 0.1 0.41998 24.5 7.8 5.3 10.2 0.8 0.1 0.3
Volatile Organic Compounds (VOCs) (Millions of Short Tons)
1970 31.0 13.0 1.9 0.7 3.2 2.0 10.21975 26.1 10.5 2.1 0.7 3.3 1.0 8.51980 26.3 9.0 2.3 1.0 3.5 0.8 9.71985 24.4 9.4 2.4 1.6 2.0 1.0 8.01988 24.3 8.3 2.6 1.4 2.1 1.0 9.01989 22.5 7.2 2.6 1.4 2.1 0.9 8.41990 20.9 6.3 2.5 1.0 1.8 1.0 8.31991 21.1 6.5 2.6 1.1 1.9 1.0 8.11992 20.7 6.1 2.6 1.1 1.9 1.0 8.01993 20.9 6.1 2.6 1.0 1.9 1.0 8.21994 21.5 6.4 2.7 1.0 1.9 1.0 8.51995 20.8 5.7 2.7 1.1 1.9 1.1 8.41996 18.7 5.5 2.7 1.0 1.4 0.4 7.71997 18.9 5.3 2.6 0.9 1.4 0.4 8.21998 17.9 5.3 2.5 0.9 1.4 0.4 7.4
904 TABLE 6-3 (Continued )
Year All SourcesOn-Road
Transportation
NonroadEngines and
Vehicles
StationaryFuel
CombustionIndustrialProcesses
WasteDisposal and
Recycling Other
Sulfur Dioxide (Millions of Short Tons)
1970 31.2 0.4 0.1 23.5 7.1 a 0.11975 28.0 0.5 0.1 22.7 4.7 a a
1980 25.9 0.5 0.2 21.4 3.8 a a
1985 23.7 0.5 0.6 20.0 2.4 a a
1988 23.1 0.6 0.7 19.8 2.0 a a
1989 23.3 0.6 0.8 19.9 2.0 a a
1990 23.7 0.5 0.9 20.3 1.9 a a
1991 23.0 0.6 0.9 19.8 1.7 a a
1992 22.8 0.6 1.0 19.5 1.7 a a
1993 22.5 0.5 1.0 19.2 1.6 0.1 a
1994 21.9 0.3 1.0 18.9 1.6 0.1 a
1995 19.2 0.3 1.0 16.2 1.6 a a
1996 19.1 0.3 1.0 16.3 1.4 a a
1997 19.6 0.3 1.0 16.7 1.5 a a
1998 19.6 0.3 1.1 16.7 1.5 a a
PM10 (Millions of Short Tons)
1988 61.1 0.4 0.5 1.4 0.9 0.3 57.71989 53.1 0.4 0.5 1.4 0.9 0.3 49.71990 30.0 0.3 0.5 1.2 0.9 0.3 26.71991 29.6 0.3 0.5 1.1 0.9 0.3 26.41992 29.5 0.3 0.5 1.2 0.9 0.3 26.31993 28.0 0.3 0.5 1.1 0.8 0.3 25.01994 30.9 0.3 0.5 1.1 0.8 0.3 27.91995 27.1 0.3 0.5 1.2 0.8 0.3 24.0
905
1990 30.0 0.3 0.5 1.2 0.9 0.3 26.71991 29.6 0.3 0.5 1.1 0.9 0.3 26.41992 29.5 0.3 0.5 1.2 0.9 0.3 26.31993 28.0 0.3 0.5 1.1 0.8 0.3 25.01994 30.9 0.3 0.5 1.1 0.8 0.3 27.91995 27.1 0.3 0.5 1.2 0.8 0.3 24.01996 33.0 0.3 0.5 1.2 0.6 0.3 30.21997 34.2 0.3 0.5 1.1 0.6 0.3 31.51998 34.7 0.3 0.5 1.1 0.6 0.3 32.0
PM2.5 (Millions of Short Tons)
1990 8.0 0.3 0.4 0.9 0.5 0.2 5.61991 7.7 0.3 0.4 0.9 0.5 0.2 5.41992 7.6 0.3 0.4 0.9 0.5 0.2 5.21993 7.3 0.3 0.4 0.9 0.4 0.3 5.11994 8.0 0.3 0.4 0.8 0.5 0.3 5.71995 7.2 0.2 0.4 0.9 0.5 0.2 4.91996 8.2 0.2 0.4 0.9 0.3 0.2 6.11997 8.5 0.2 0.4 0.8 0.4 0.2 6.51998 8.4 0.2 0.4 0.8 0.4 0.2 6.4
Lead (Thusands of Short Tons)
1970 220.9 172.0 9.7 10.6 26.4 2.2 b
1975 159.7 130.2 6.1 10.3 11.4 1.6 b
1980 74.2 60.5 4.2 4.3 3.9 1.2 b
1985 22.9 18.1 0.9 0.5 2.5 0.9 b
1988 7.1 2.6 0.9 0.5 2.3 0.8 b
1989 5.5 1.0 0.8 0.5 2.4 0.8 b
906
TABLE 6-3 (Continued )
Year All SourcesOn-Road
Transportation
NonroadEngines and
Vehicles
StationaryFuel
CombustionIndustrialProcesses
WasteDisposal and
Recycling Other
1990 5.0 0.4 0.8 0.5 2.5 0.8 b
1991 4.2 a 0.6 0.5 2.3 0.8 b
1992 3.8 a 0.6 0.5 1.9 0.8 b
1993 3.9 a 0.5 0.5 2.0 0.8 b
1994 4.0 a 0.5 0.5 2.2 0.8 b
1995 3.9 a 0.5 0.5 2.3 0.6 b
1996 3.9 a 0.5 0.5 2.3 0.6 b
1997 4.0 a 0.5 0.5 2.3 0.6 b
1998 4.0 a 0.5 0.5 2.3 0.6 b
Sources: Office of Air Quality Planning and Standards, National Air Pollutant Emission Estimates, 1900–1998, EPA 454/R-00-002, U.S. Environmental ProtectionAgency, Research Triangle Park, NC, March 2000.
Note: Data are calculated emissions estimates, PM10, PM2.5 � particulate matter, particles less than 10 and 2.5 �m in diameter.a Emissions less than 0.05 million short tons per year (less than 0.05 thousand short tons per year in the case of lead emissions).b No emissions calculated.
SOURCES AND TYPES OF AIR POLLUTION 907
gases and dusts from forest and grass fires, ocean sprays and fog, esters andterpenes from vegetation, ozone and nitrogen dioxide from lightning, ash andgases (SO2, HCl, HF, H2S) from volcanoes, natural radioactivity, and micro-organisms such as bacteria, spores, molds, or fungi from plant decay. Mostof these are beyond control or of limited significance.
Ozone is found in the stratosphere at an altitude beginning at 7 to 10 miles.The principal natural sources of ozone in the lower atmosphere are lightningdischarges and, in small amount, reactions involving volatile organic com-pounds released by forests and other vegetation. Ozone is also formed natu-rally in the upper atmosphere by a photochemical reaction with UV solarradiation.
Types of Air Pollutants
The types of air pollutants are related to the original material used for com-bustion or processing, the impurities it contains, the actual emissions, andreactions in the atmosphere. See Table 6-3. A primary pollutant is one thatis found in the atmosphere in the same form as it exists when emitted fromthe stack; sulfur dioxide, nitrogen dioxide, and hydrocarbons are examples.A secondary pollutant is one that is formed in the atmosphere as a result ofreactions such as hydrolysis, oxidation, and photochemistry; photochemicalsmog is an example.
Most combustible materials are composed of hydrocarbons. If the com-bustion of gasoline, oil, or coal, for example, is inefficient, unburned hydro-carbons, smoke, carbon monoxide, and, to a lesser degree, aldehydes andorganic acids are released.
The use of automobile catalytic converters to control carbon monoxide andhydrocarbon emissions causes some increase in sulfates and sulfuric acidemissions, but this is considered to be of minor significance. The eliminationof lead from gasoline has, in some cases, led to the substitution of manganesefor antiknock purposes with the consequent release of manganese compounds,which are also potentially toxic.
Impurities in combustible hydrocarbons (coal and oil), such as sulfur, com-bine with oxygen to produce SO2 when burned. The SO2 subsequently mayform sulfuric acid and other sulfates in the atmosphere. Oxides of nitrogen,from high-temperature combustion in electric utility and industrial boilers andmotor vehicles [above 1200�F (649�C)], are released mostly as NO2 and NO.The source of nitrogen is principally the air used in combustion. Some fuelscontain substantial amounts of nitrogen, and these also react to form NO2 andNO. Fluorides and other fuel impurities may be carried out with the hot stackgases. (The role of sulfur and nitrogen oxides in acid rain is discussed earlierin this chapter.)
Photochemical oxidants* are produced in the lower atmosphere (tropo-sphere) as a result of the reaction of oxides of nitrogen and volatile organics
*Including ozone, PANs, formaldehydes, and peroxides. Nitrogen dioxide colors air reddish-brown.

908 AIR POLLUTION AND NOISE CONTROL
in the presence of solar radiation, as previously noted. Ozone may contributeto smog, respiratory problems, and damage to crops and forests (as previouslystated).
Of the sources noted above, industrial processes are the principal sourceof volatile organics (hydrocarbons), with transportation the next largest con-tributor. Stationary fuel combustion plants and motor vehicles are the majorsources of nitrogen oxides. Ozone, the principal component of modern smog,is the photochemical oxidant actually measured, which is about 90 percent ofthe total (ref. 24, p. 9). Ozone and other photochemical products formed areusually found at some distance from the source of the precursor compounds.
SAMPLING AND MEASUREMENT
State and local government agencies participate in the EPA national air qualitymonitoring system. The EPA focuses on the National Ambient Air QualityStandards—airborne particulate matter, sulfur dioxide, ozone, and lead—inover 4000 locations across the United States.32
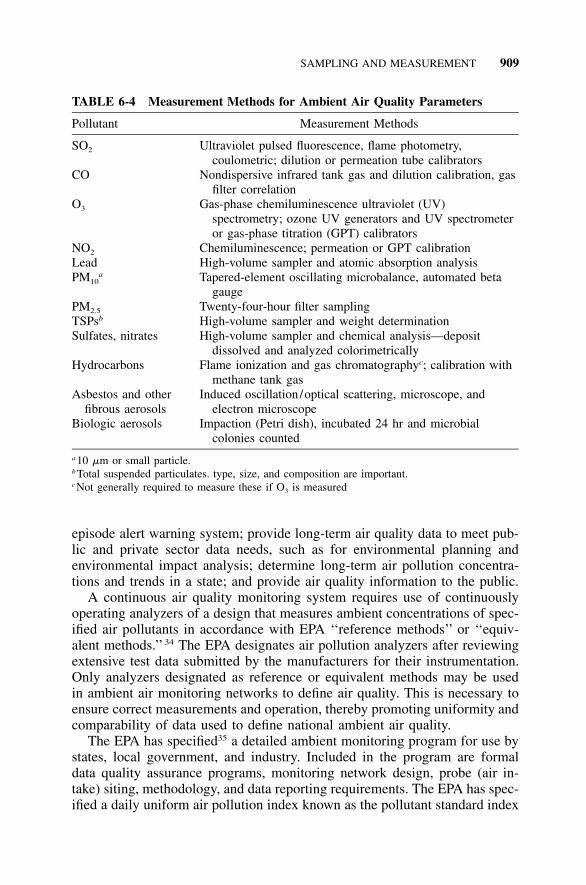
Air-sampling devices are used to detect and measure smoke, particulates,acid deposition, and gaseous contaminants. The equipment selected and usedand its siting are determined by the problem being studied and the purposeto be served. Representative samples free from external contamination mustbe collected and readings or analyses standardized to obtain valid data. Sup-porting meteorological and other environmental information is needed toproperly interpret the data collected. Continuous sampling equipment shouldbe selected with great care. The accuracy and precision of equipment needsto be demonstrated to ensure that it will perform the assigned task with aminimum of calibration and maintenance. Reliable instruments are availablefor the monitoring of ambient air parameters, such as those listed in Table 6-4. Other instruments such as for opacity, hydrocarbons, and sulfur are alsoavailable.
A continuous air quality monitoring system for the measurement of se-lected gaseous air pollutants, particulates, and meteorological conditions overa large geographical area can make possible immediate intelligence and re-action when ambient air quality levels or emissions increase beyond estab-lished standards. In the system, each monitoring station sends data to a datareception center, say every hour, via telephone lines or other communicationnetwork. The collected data are processed by computer and visually displayedfor indicated action. Field operators who can perform weekly maintenanceand calibration checks and a trained central technical staff to coordinate andscrutinize the overall daily monitoring system operation and data validationare essential for the production of usable and valid ‘‘real-time’’ data.33
The air monitoring data can be used to measure ambient air quality andits compliance with state and national standards; detect major local source airquality violations; provide immediate information for a statewide air pollution
SAMPLING AND MEASUREMENT 909
TABLE 6-4 Measurement Methods for Ambient Air Quality Parameters
Pollutant Measurement Methods
SO2 Ultraviolet pulsed fluorescence, flame photometry,coulometric; dilution or permeation tube calibrators
CO Nondispersive infrared tank gas and dilution calibration, gasfilter correlation
O3 Gas-phase chemiluminescence ultraviolet (UV)spectrometry; ozone UV generators and UV spectrometeror gas-phase titration (GPT) calibrators
NO2 Chemiluminescence; permeation or GPT calibrationLead High-volume sampler and atomic absorption analysisPM10
a Tapered-element oscillating microbalance, automated betagauge
PM2.5 Twenty-four-hour filter samplingTSPsb High-volume sampler and weight determinationSulfates, nitrates High-volume sampler and chemical analysis—deposit
dissolved and analyzed colorimetricallyHydrocarbons Flame ionization and gas chromatographyc; calibration with
methane tank gasAsbestos and other
fibrous aerosolsInduced oscillation/optical scattering, microscope, and
electron microscopeBiologic aerosols Impaction (Petri dish), incubated 24 hr and microbial
colonies counted
a 10 �m or small particle.b Total suspended particulates. type, size, and composition are important.c Not generally required to measure these if O3 is measured
episode alert warning system; provide long-term air quality data to meet pub-lic and private sector data needs, such as for environmental planning andenvironmental impact analysis; determine long-term air pollution concentra-tions and trends in a state; and provide air quality information to the public.
A continuous air quality monitoring system requires use of continuouslyoperating analyzers of a design that measures ambient concentrations of spec-ified air pollutants in accordance with EPA ‘‘reference methods’’ or ‘‘equiv-alent methods.’’34 The EPA designates air pollution analyzers after reviewingextensive test data submitted by the manufacturers for their instrumentation.Only analyzers designated as reference or equivalent methods may be usedin ambient air monitoring networks to define air quality. This is necessary toensure correct measurements and operation, thereby promoting uniformity andcomparability of data used to define national ambient air quality.
The EPA has specified35 a detailed ambient monitoring program for use bystates, local government, and industry. Included in the program are formaldata quality assurance programs, monitoring network design, probe (air in-take) siting, methodology, and data reporting requirements. The EPA has spec-ified a daily uniform air pollution index known as the pollutant standard index
910 AIR POLLUTION AND NOISE CONTROL
(or PSI) for public use in comparing air quality. The PSI values are discussedand summarized later in Table 6-7.
Types of analyzers used to measure national ambient air quality parametersare summarized in Table 6-4. Continuous analyzers utilizing ‘‘gas-phase’’measurements with electronic designs, rather than ‘‘wet chemistry’’ measure-ments, are preferred as they are more accurate and reliable. However, inas-much as not all regulatory agencies, particularly those at a local level, havethe resources or need for sophisticated equipment, other devices are also men-tioned below.
Particulate Sampling—Ambient Air
Measurements needing much more development are in the area of particu-lates, where inhalable particles sizing (less than 10–3 �m), identification,metals, sulfates, and nitrates are important. Particulates can also be collectedand tested for their mutagenic properties. Of all the particulate ambient airsampling devices, the high-volume sampler is the one most commonly usedin the United States, although alternate continuous monitoring devices areincreasingly being used. Other devices also have application for the collectionof different-sized particulates.
High-volume (Hi-vol) samplers pass a measured high rate of (40–60 cfm)through a special filter paper (or fiberglass), usually for a 24-hr period. Thefilter is weighed before and after exposure, and the change in weight is ameasure of the suspended particulate matter in (PM) in micrometers persquare meter of air filtered. The particulates can be analyzed for weight,particle size (usually between 50 and 0.1 �m), and composition (such asbenzene solubles, nitrates, lead, and sulfates), and radioactivity. Particle sizeselective inlets can be put on hi-volume samplers, and samples can be sepa-rated into two parts using impactor principles, those in the particle size rang-ing above and below 2 to 3 �m. There is more interest in measuring 10-�mor smaller particles (PM10) since they penetrate deeper into the respiratorytract and are more likely to cause adverse health effects.
High-volume sampling is the EPA reference method. Air flow measurementis very important. An orifice with a manometer is recommended for flowmeasurement.
Sedimentation and settling devices include fallout or dustfall jars, settlingchambers or boxes, Petri dishes, coated metal sheets or trays, and gum-paperstands for the collection of particulates that settle out. Vertically mountedadhesive papers or cylinders coated with petroleum jelly can indicate thedirectional origin of contaminants. Dustfall is usually reported as milligramsper centimeter squared per month. Particulates can also be measured forradioactivity.
The automatic (tape) smoke sampler collects suspended material on a filtertape that is automatically exposed for predetermined intervals over an ex-tended period of time. The opacity of the deposits or spots on the tape to the
SAMPLING AND MEASUREMENT 911
transmission or reflectance of light from a standard source is a measure ofthe air pollution. This instrument provides a continuous electrical output thatcan be telemetered to give immediate data on particulates. Thus, the data areavailable without the delay of waiting for laboratory analysis of the high-volume filter. The equipment is used primarily to indicate the dirtiness of theatmosphere and does not directly measure the particulate total suspended par-ticulate (TSP) ambient air quality standard.
Inertial or centrifugal collection equipment operates on the cyclone col-lection principle. Large particles above 1 �m in diameter are collected, al-though the equipment is most efficient for the collection of particles largerthan 10 �m.
Impingers separate particles by causing the gas stream to make suddenchanges in direction in passing through the equipment. The wet impinger isused for the collection of small particles, the dry impinger for the largerparticles. In the dry impinger, a special surface is provided on which theparticles collide and adhere.
In the cascade impactor, the velocities of the gas stream vary, makingpossible the sorting and collection of different-sized particles on special mi-croscopic slides. Particulates in the range of 0.7 to 50 �m are collected.
Electrostatic precipitator-type sampling devices operate on the ionizationprinciple using a platinum electrode. Particles less than 1 �m in size collecton an electrode of opposite charge and are then removed for examination.Combustible gases, if present, can affect results.
Nuclei counters measure the number of condensation nuclei in the atmo-sphere. They are a useful reference for weather commentators. A sample ofair is drawn through the instrument, raised to 100 percent relative humidity,and expanded adiabatically, with resultant condensation on the nuclei present.The droplets formed scatter light in proportion to the number of water drop-lets, which are counted by a photomultiplier tube. Concentrations of conden-sation nuclei may range from 10 to 10,000,000 particles/cm3.36 Condensationnuclei are believed to result from a combination of natural and man-madecauses, including air pollution. A particle count above 50,000 is said to becharacteristic of an urban area.
Pollen samplers generally use petroleum-jelly-coated slides placed on acovered stand in a suitable area. The slides are usually exposed for 24 hr, andthe pollen grains are counted with the aid of a microscope. The counts arereported as grains per centimeter squared. See Chapter 10 for ragweed controland sampling.
Gas Sampling
Gas sampling requires separation of the gas or gases being sampled fromother gases present. The temperature and pressure conditions under which asample is collected must be accurately noted. The pressure of a gas mixtureis the sum of the individual gas pressures, as each gas has its own pressure.
912 AIR POLLUTION AND NOISE CONTROL
The volumes of individual gases at the same pressure in a mixture are alsoadditive. Concentrations of gases when reported in terms of ppm and ppb areby volume rather than by weight.* Proper sampling and interpretation ofresults require competency and experience, knowledge concerning the con-ditions under which the samples are collected, and an understanding of thelimitations of the testing procedures. Automated and manual instruments andequipment for gas sampling and analysis include the following.
Pulsed Fluorescent Analyzer37 This instrument measures sulfur dioxide bymeans of absorption of UV light. Pulsating UV light is focused through anarrow-bandpass filter that reduces the outgoing light to a narrow wavelengthband of 230 to 190 nm and directs it into the fluorescent chamber. Ambientair containing SO2 flows continuously through this chamber where the UVlight excites the SO2 molecules, which in turn emit their characteristic decayradiation. This radiation, specific for SO2, passes through a second filter andonto a sensitive photomultiplier tube. This incoming light energy is trans-formed electronically into an output voltage that is directly proportional tothe concentration of SO2 in the sample air. The World Health Organization(WHO) Global Environmental Monitoring System determinations use the fol-lowing methods: acidimetric titration or hydrogen peroxide, the colormetricpararosaniline or West-Gaeke, the amperometric or coulometric, and the con-ductimetric.
Atomic Spectrometry In atomic spectrometry a sample solution is atomizedinto a flame that produces a characteristic and measurable spectrum of lightwavelengths. Gas chromatography separates compounds that can be volatil-ized, while liquid chromatography separates compounds that are not volatile.Mass spectrometry identifies a separated pure component by its characteristicmass spectrum. Sampling analytical methods for the examination of toxic andhazardous organic materials include gas chromatography with flame ioniza-tion detector, gas chromatography–mass spectrometry, gas chromatography–photoionization detector, and electron capture. Calibration is accomplishedthrough laboratory standards and certified permeation tubes.
Some continuous monitoring instruments for atmospheric measurement ofpollution are quite elaborate and costly. The simplest readily available instru-ment should be selected that meets the required sensitivity and specificity.Power requirements, service, maintenance, calibration frequency, and timerequired to collect and transmit information are important considerations.
Nitrogen Oxide Chemiluminescence Analyzer37 Nitric oxide (NO) is mea-sured by the gas-phase chemiluminescent reaction between nitric oxide andozone. This technique is also used to determine nitrogen dioxide (NO2) by
*In either metric (SI) or customary (U.S.) units.
SAMPLING AND MEASUREMENT 913
catalytically reducing NO2 in the sample air to a quantitative amount of NO.Sample air is drawn through a capillary into a chamber held at 25 in. Hgvacuum. Ozone produced by electrical discharge in oxygen is also introducedinto the chamber.
The luminescence resulting from the reaction between NO and ozone isdetected by a temperature-stabilized photomultiplier tube and wavelength fil-ter. An automatic valving system periodically diverts the sample air througha heated activated-carbon catalyst bed to convert NO2 to NO before it entersthe reaction chamber. The sample measured from the converter is called NOx.Since it contains the original NO plus NO produced from the NO2 conversion,the differences between the sequential NOx and NO readings are reported asNOx. Primary dynamic calibrations are performed with gas-phase titrationusing ozone and nitric oxide standards and with NO2 permeation tubes.
Ozone Chemiluminescence Analyzer37 Ozone is measured by the gas-phasechemiluminescence technique, which utilizes the reaction between ethyleneand ozone (O3). Sample air is drawn into a mixing chamber at a flow rate of1 l/min where it is mixed with ethylene gas and introduced at a flow rate of25 cc/min. The luminescence resulting from the reaction of the ethylene withambient ozone in the air supply is detected by a temperature-stabilized pho-tomultiplier tube. This signal is then amplified and monitored by telemetryand on-site recorders. These ozone instruments contain provision for weeklyzero and span checks. Primary dynamic calibrations are peri-odically performed that require standardization against a known, artificiallygenerated ozone atmosphere. Ozone is also measured by UV light instru-mentation.
Carbon Monoxide Infrared (IR) Analyzer37 This method utilizes dual-beam photometers with detection accomplished by means of parallel absorp-tion chambers or cells that are separated by a movable diaphragm. The IRenergy passes into each chamber—one containing the sample with CO, theother containing the reference gas. The reference gas heats up more than theambient air sample with CO since CO absorbs more of the IR energy. Thisresults in higher temperature and, hence, the volume–pressure in the referencechamber that is transmitted to the separating diaphragm designed to providean electrical output to measure the CO concentration. However, it is necessaryto remove water vapor interference as the humidity in ambient air absorbedby IR energy can introduce a significant error in CO readings. In one instru-ment (the EPA reference method), the interference due to water vapor iseliminated by first passing one portion of the ambient air sample through acatalytic converter where CO is converted to CO2 prior to entry into thereference chamber. The other half of the air sample containing CO passesdirectly into the sample chamber. This procedure cancels out the effect ofmoisture since both gas streams are identical except for the presence of CO.37
Carbon monoxide is also measured by gas-phase correlation.
914 AIR POLLUTION AND NOISE CONTROL
Smoke and Soiling Measurement
Historically, smoke and/or opacity was measured by The Ringelmann smokechart.38 This consists of five* rectangular grids produced by black lines ofdefinite width and spacing on a white background. When held at a distance,about 50 ft from the observer, the grids appear to give shades of gray betweenwhite and black. The grid shadings are compared with the pollution source(stack), and the grid number closest to the shade of the pollution source isrecorded. About 30 observations are made in 15 min, and a weighted averageis computed of the recorded Ringelmann numbers. The chart is used to de-termine whether smoke emissions are within the standards established by law;the applicable law is referenced to the chart. The system cannot be appliedto dusts, mists, and fumes. Inspectors need training in making smoke readings.A reading of zero would correspond to all white; a reading of 5 would cor-respond to all black.
The Ringelmann chart has been replaced by a determination of the percentopacity of a particular emission as seen by a trained observer.† For example,a Ringelmann reading of 1 would correspond to an opacity of about 20 per-cent.
Tape Sampler—Soiling Soiling can be indicated as RUDS (reflectance unitsof dirt shade). One RUDS is defined as an optical reflectance of 0.01 causedby 10,000 ft of air passing through 0.786 in.2 (1-in.-diameter circle) of filterpaper. A vacuum pump draws the air to be sampled through the filter tape.The particles collected soil a spot on the tape. The tape is advanced auto-matically after a 2-hr period; the air flow rate used is 0.455 cfm. A filter isused with the light source that admits light with a wavelength of approxi-mately 400 nm to measure the light reference, which information can be sentto a monitor. The sampling time period and air flow rate were chosen toconform with ASTM (American Society for Testing and Materials) standards.
Tape Sampler—Coefficient of Haze (COH) The tape sampler can be de-signed to measure light transmittance rather than reflectance. This will pro-duce soiling measurements expressed as COH, an index of contaminantconcentration, which is the EPA preferred method. The method is similar tothat outlined above except the photocell is under the tape. White light is used.It is necessary to automatically rezero the instrument near each spot to com-pensate for tape thickness variation. The compensation is performed by solid-state electronics.
The automated filter tape air sampler can also be used to monitor somegases. Special filter tapes are used to measure hydrogen sulfide, fluorides, and
*Reduced to four grids or charts in the United States. The width or thickness of lines and theirspacing in each grid or chart vary. A handy reduction of the Ringelmann smoke chart is thePower’s Micro-Ringelmann available from Power, 33 West 42nd Street, New York, NY 10036.†See U.S. EPA Method 9, Appendix A, 40 CFR 60, 2001.
SAMPLING AND MEASUREMENT 915
other gases. The spots produced by the gaseous pollutant are chemicallytreated and evaluated using the reflectance or transmission method.
Many of these measures of smoke and or opacity have been moved backto the source (smoke stack) where more enforceable standards can be applied.Industrial operation permits can require the installation of electronic opacitymonitors. These monitors measure either the transmission of light from asource to a sensor across the stack (extinction) or the variability of lighttransmission across the stack (scintillation). Inspectors may request operationrecords and maintenance logs during facility inspection.
Stack Sampling
The collection of stack samples, such as fly ash and dust emissions, requiresspecial filters of known weight and a measure of the volume of gases sampled.The sample must be collected at the same velocity at which the gases nor-mally pass through the stack. The gain in weight divided by the volume ofgases sampled corrected to 0�C (or 21�C) temperature and 760 mm Hg givesa measure of the dust and fly ash going out of the stack, usually as grainsper cubic foot. When a series of samples is to be collected or measurementsmade, a ‘‘sampling train’’ is put together. It may consist of a sampling nozzle,several impingers, a freeze-out train, a weighed paper filter, dry gas meter,thermometers, and pump.
A common piece of equipment for boiler and incinerator stack samplingis the Orsat apparatus. By passing a sample of the stack gas through each ofthree different solutions, the percent carbon dioxide, carbon monoxide, andoxygen constituents in the flue gas are measured. The remainder of the gasin the mixture is usually assumed to be nitrogen. Special methods are usedto test for other gases and metals.
Tracer materials may be placed in a stack to indicate the effect of a pol-lution source on the surrounding area. The tracer may be a fluorescent ma-terial, a dye, a compound that can be made radioactive, a special substanceor chemical, or a characteristic odor-producing material. The tracer techniquecan be used in reverse—that is, to detect the source of a particular pollutant,provided there are no interfering sources.
Measurement of Materials’ Degradation
The direct effects of air pollution can be observed by exposing various ma-terials to the air at selected monitoring stations. The degradation of materialsis measured for a selected period on a scale of 1 to 10, with 1.0 representingthe least degradation and 10.0 the worst, as related to the sample showingthe least degradation. Materials exposed and conditions measured includesteel corrosion, dyed fabric (nonspecific) for color fading, dyed fabric (NOx
sensitive), dyed fabric (ozone sensitive), dyed fabric (fabric soiling), dyedfabric (SO2 sensitive), silver tarnishing, nylon deterioration, rubber cracking(crack depth), leather deterioration, copper pitting, and others. The samples
916 AIR POLLUTION AND NOISE CONTROL
are exposed for a selected period, such as rubber, 7 days at a time; silver, 30days at a time; nylon, 30 or 90 days at a time; cotton, 90 days at a time;steel, 90 days and 1 year at a time; and zinc, 1 year at a time. Shrubs, trees,and other plants sensitive to certain contaminants or pollutants can also beused to monitor the effects of air pollution.
ENVIRONMENTAL FACTORS
The behavior of pollutants released to the atmosphere is subject to diverseand complex environmental factors associated with meteorology and topog-raphy. Meteorology involves the physics, chemistry, and dynamics of the at-mosphere and includes many direct effects of the atmosphere on the earth’ssurface, ocean, and life. Topography refers to both the natural and man-madefeatures of the earth’s surface. The pollutants can be either accumulated ordiluted, depending on the nature and degree of the physical processes oftransport, dispersion, and removal and the chemical changes taking place.Because of the complexities of pollutant behavior in the atmosphere, it isimportant to distinguish between the activity of short-range primary pollutants(total suspended solids, sulfur dioxide), to which micrometeorology applies,and long-range secondary pollutants (ozone, acid rain), to which regionalmeteorology applies.
Within the scope of this text, the intention is not to provide a completetechnical understanding of all the meteorological and topographical factorsinvolved but to provide an insight into the relationships to air pollution of themore important processes.
Meteorology
The meteorological elements that have the most direct and significant effectson the distribution of air pollutants are wind speed and direction, solar radi-ation, stability, and precipitation. Therefore, it is important to have a contin-uing baseline of meteorological data, including these elements, to interpretand anticipate probable effects of air pollution emissions. Data on tempera-ture, humidity, wind speed and direction, and precipitation are generally avail-able through official government weather agencies. The National WeatherService (formerly U.S. Weather Bureau), Asheville, North Carolina, is a majorsource of information. Other potential sources of information are local air-ports, stations of the state fire weather service, military installations, publicutilities and industrial complexes, and colleges and universities.
Wind Wind is the motion of the air relative to the earth’s surface. Althoughit is three dimensional in its movement, generally only the horizontal com-ponents are denoted when used because the vertical component is very muchsmaller than the horizontal. This motion derives from the unequal heating of
ENVIRONMENTAL FACTORS 917
the earth’s surface and the adjacent air, which in turn gives rise to a horizontalvariation in temperature and pressure. The variation in pressure (pressuregradient) constitutes an imbalance in forces so that air motion from hightoward low pressure is generated.
The uneven heating of the surface occurs over various magnitudes of space,resulting in different magnitudes of organized air motions (circulations) inthe atmosphere. Briefly, in descending order of importance, these are
1. the primary or general (global) circulation associated with the large-scale hemispheric motions between the tropical and polar regions,
2. the secondary circulation associated with the relatively large-scale mo-tions of migrating pressure systems (highs and lows) developed by theunequal distribution of large land and water masses, and
3. the tertiary circulation (local) associated with small-scale variations inheating, such as valley winds and land and sea breezes.
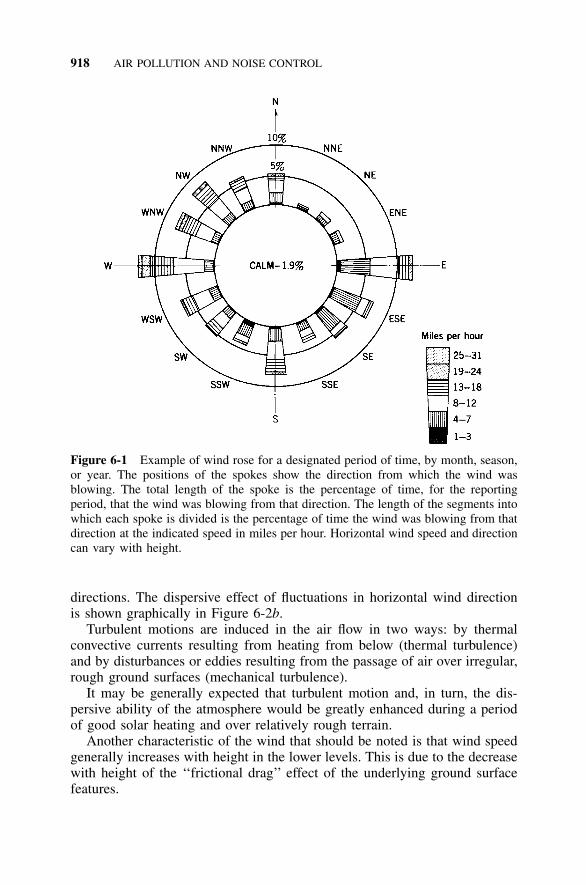
For a particular area, the total effect of these various circulations estab-lishes the hourly, daily, and seasonal variations in wind speed and direction.With respect to a known source or distribution of sources of pollutants, thefrequency distribution of wind direction will indicate toward which areas thepollutants will be most frequently transported. It is customary to present long-term wind data at a given location graphically in the form of a ‘‘wind rose,’’an example of which is shown in Figure 6-1.
The concentration resulting from a continuous emission of a pollutant isinversely proportional to wind speed. The higher the wind speed, the greaterthe separation of the particles or molecules of the pollutant as they are emit-ted, and vice versa. This is shown graphically in Figure 6-2a. Wind speed,therefore, is an indicator of the degree of dispersion of the pollutant andcontributes to the determination of the area most adversely affected by anemission. Although an area may be located in the most frequently occurringdownwind direction from a source, the wind speeds associated with this di-rection may be quite high so that resulting pollutant concentrations will below as compared to another direction occurring less frequently but with lowerwind speeds.
Smaller in scale than the tertiary circulation mentioned above, there is ascale of air motion that is extremely significant in the dispersion of pollutants.This is referred to as the micrometeorological scale and consists of the veryshort term, on the order of seconds and minutes, fluctuations in speed anddirection. As opposed to the ‘‘organized’’ circulations discussed above, theseair motions are rapid and random and constitute the wind characteristic called‘‘turbulence.’’ The turbulent nature of the wind is readily evident upon watch-ing the rapid movements of a wind vane. These air motions provide the mosteffective mechanism for the dispersion or dilution of a cloud or plume ofpollutants. The turbulent fluctuations occur in both the horizontal and vertical
918 AIR POLLUTION AND NOISE CONTROL
Figure 6-1 Example of wind rose for a designated period of time, by month, season,or year. The positions of the spokes show the direction from which the wind wasblowing. The total length of the spoke is the percentage of time, for the reportingperiod, that the wind was blowing from that direction. The length of the segments intowhich each spoke is divided is the percentage of time the wind was blowing from thatdirection at the indicated speed in miles per hour. Horizontal wind speed and directioncan vary with height.
directions. The dispersive effect of fluctuations in horizontal wind directionis shown graphically in Figure 6-2b.
Turbulent motions are induced in the air flow in two ways: by thermalconvective currents resulting from heating from below (thermal turbulence)and by disturbances or eddies resulting from the passage of air over irregular,rough ground surfaces (mechanical turbulence).
It may be generally expected that turbulent motion and, in turn, the dis-persive ability of the atmosphere would be greatly enhanced during a periodof good solar heating and over relatively rough terrain.
Another characteristic of the wind that should be noted is that wind speedgenerally increases with height in the lower levels. This is due to the decreasewith height of the ‘‘frictional drag’’ effect of the underlying ground surfacefeatures.

ENVIRONMENTAL FACTORS 919
Figure 6-2 (a) Effect of wind speed on pollutant concentration from constant source;(b). Effect of variability of wind direction on pollutant concentration from constantsource (continuous emission of 4 units /sec).
Stability and Instability The stability of the atmosphere is its ability toenhance or suppress vertical air motions. Under unstable conditions the airmotion is enhanced, and under stable conditions the air motion is suppressed.The conditions are determined by the vertical distribution of temperature.
In vertical motion, parcels of air are displaced. Due to the decrease ofpressure with height, a parcel displaced upward will encounter decreasedpressure and expand. If this expansion process is relatively rapid or over alarge area so that there is little or no exchange of heat with the surroundingair or by a change of state of water vapor, the process is dry adiabatic andthe parcel of air will be cooled. Likewise, if the displacement is downwardso that an increase in pressure and compression is experienced, the parcel ofair will be heated.
The rate of cooling of a mass of warm dry air in a dry environment withheight is the dry adiabatic process lapse rate and is approximately �5.4�F/1000 ft (�1�C/100 m). The normal lapse rate (cooling) on the average is�3.5�F/1000 ft (�0.65�C/100 m). This relationship holds true in the tropo-sphere up to about 10 km (6 miles). Temperature increases above this levelin the stratosphere.
The prevailing or environmental lapse rate is the decrease of temperaturewith height that may exist at any particular time and place. It can be shownthat if the decrease of temperature with height is greater than �5.4�F/1000
920 AIR POLLUTION AND NOISE CONTROL
ft, parcels displaced upward will attain temperatures higher than their sur-roundings. Air parcels displaced downward will attain lower temperaturesthan their surroundings. The displaced parcels will tend to continue in thedirection of displacement. Under these conditions, the vertical motions areenhanced and the layer of air is defined as ‘‘unstable.’’
Furthermore, if the decrease of temperature with height is less than �5.4�F/1000 ft, it can be shown that air parcels displaced upward attain temperatureslower than their surroundings and will tend to return to their original posi-tions. Air parcels displaced downward attain higher temperatures than theirsurroundings and also tend to return to their original position. Under theseconditions, vertical motions are suppressed and the layer of air is defined as‘‘stable.’’
Finally, if the decrease of temperature with height is equal to �5.4�F/1000ft, displaced air parcels attain temperatures equal to their surroundings andtend to remain at their position of displacement. This is called ‘‘neutral sta-bility.’’
Inversions Up to this point, the prevailing temperature distribution in thevertical has been referred to as a ‘‘lapse rate,’’ which indicates a decrease oftemperature with height. However, under certain meteorological conditions,the distribution can be such that the temperature increases with height withina layer of air. This is called an ‘‘inversion’’ and constitutes an extremely stablecondition.
There are three types of inversions that develop in the atmosphere: radia-tional (surface), subsidence (aloft), and frontal (aloft).
Radiational inversion is a phenomenon that develops at night under con-ditions of relatively clear skies and very light winds. The earth’s surface coolsby reradiating the heat absorbed during the day. In turn, the adjacent air isalso cooled from below so that within the surface layer of air there is anincrease of temperature with height.
Subsidence inversion develops in high-pressure systems (generally asso-ciated with fair weather) within a layer of air aloft when the air layer sinksto replace air that has spread out at the surface. Upon descent, the air heatsadiabatically, attaining temperatures greater than the air below.
A condition of particular significance is the subsidence inversion that de-velops with a stagnating high-pressure system. Under these conditions, thepressure gradient becomes progressively weaker so that the winds becomevery light, resulting in a great reduction in the horizontal transport and dis-persion of pollutants. At the same time, the subsidence inversion aloft con-tinuously descends, acting as a barrier (lid) to the vertical dispersion of thepollutants. These conditions can persist for several days so that the resultingaccumulation of pollutants can cause a serious health hazard.
Frontal inversion forms when air masses of different temperature charac-teristics meet and interact so that warm air overruns cold air.
There are many and varied effects of stability conditions and inversions onthe transport and dispersion of pollutants in the atmosphere. In general, en-
ENVIRONMENTAL FACTORS 921
hanced vertical motions under unstable conditions increase the turbulent mo-tions, thereby enhancing the dispersion of the pollutants. Obviously, the stableconditions have the opposite effect.
For stack emissions in inversions—depending on the elevation of emissionwith respect to the distribution of stability in the lower layers of air—behaviorof the plumes can be affected in many different ways. Pollutants emittedwithin the layer of a surface-based (radiational) inversion by low stacks candevelop very high and hazardous concentrations at the surface level. On theother hand, when pollutants are emitted from stacks at a level aloft withinthe surface inversion, the stability of the air tends to maintain the pollutantat this level, preventing it from reaching the surface. However, after sunriseand continued radiation from the sun resulting in heating of the earth’s surfaceand adjacent air, the inversion is ‘‘burned off.’’ Once this condition is reached,the lower layer of air becomes unstable and all of the pollutant that hasaccumulated at the level aloft is rapidly dispersed downward to the surface.This behavior is called ‘‘fumigation’’ and can result in very high concentra-tions during the period. See Figure 6-3.
Precipitation Precipitation constitutes an effective cleansing process of pol-lutants in the atmosphere in three ways: the washing out or scavenging oflarge particles by falling raindrops or snowflakes (washout), accumulation ofsmall particles in the formation of raindrops or snowflakes in clouds (rainout),and removal of gaseous pollutants by dissolution and absorption.
The most effective and prevalent process is the washout of large particles,particularly in the lower layer of the atmosphere, where most of the pollutantsare released. The efficiencies of the various processes depend on complexrelationships between properties of the pollutants and the characteristics ofthe precipitation.
Topography
The topographic features of a region include both the natural (e.g., valleys,oceans, rivers, lakes, foliages) and man-made (e.g., cities, bridges, roads, ca-nals) elements distributed within the region. These elements, per se, have littledirect effect on pollutants in the atmosphere. The prime significance of to-pography is its effects on the meteorological elements. As stated previously,the variation in the distribution of land and water masses gives rise to varioustypes of circulations. Of particular significance are the local or small-scalecirculations that develop. These circulations can contribute either favorablyor unfavorably to the transport and dispersion of the pollutants.
Along a coastline during periods of weak pressure gradient, intense heatingof the land surface, as opposed to the lesser heating of the contiguous watersurface, develops a temperature and pressure differential that generates anonshore air circulation. This circulation can extend to a considerable distanceinland. At times during stagnating high-pressure systems, when the transportand dispersion of pollutants have been greatly reduced, this short-period af-
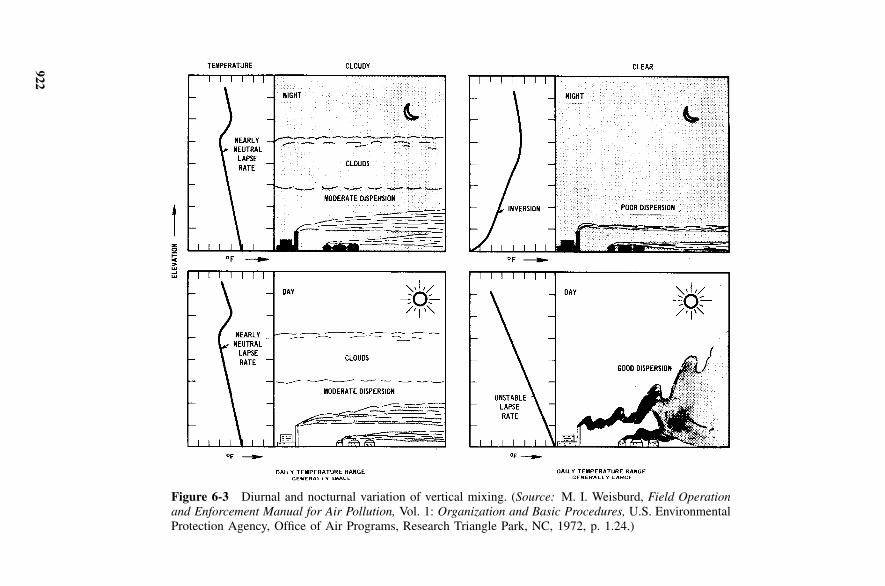
922
Figure 6-3 Diurnal and nocturnal variation of vertical mixing. (Source: M. I. Weisburd, Field Operationand Enforcement Manual for Air Pollution, Vol. 1: Organization and Basic Procedures, U.S. EnvironmentalProtection Agency, Office of Air Programs, Research Triangle Park, NC, 1972, p. 1.24.)
AIR POLLUTION SURVEYS 923
ternoon increase in airflow may well prevent the critical accumulation ofpollutants.
In valley regions, particularly in the winter, intense surface inversions aredeveloped by the drainage down the slopes of air cooled by the radiationallycooled valley wall surfaces. Bottom valley areas that are significantly popu-lated and industrialized can be subject to critical accumulation of pollutantsduring these periods.
The increased roughness of the surface created by the widespread distri-bution of buildings throughout a city can significantly enhance the turbulenceof the airflow over the city, thereby improving the dispersion of the pollutantsemitted. But at the same time the concrete, stone, and brick buildings andasphalt streets of the city act as a heat reservoir for the radiation receivedfrom the sun during the day. This, plus the added heat from nighttime spaceheating during the cool months of the year, creates a temperature and pressuredifferential between the city and the surrounding rural area so that a localcirculation inward to the city is developed. The circulation tends to concen-trate the pollutants in the city. This phenomenon called the ‘‘urban heat islandeffect.’’
Areas on the windward side of mountain ranges can expect added precip-itation due to the forced rising, expansion, and cooling of the moving air masswith resultant release of available moisture. This increased precipitationserves to increase the removal of the pollutants.
It is apparent, then, that topographical features can have many and diverseeffects in the meteorological elements and the behavior of pollutants in theatmosphere.
AIR POLLUTION SURVEYS
An air pollution survey of a region having common topographical and me-teorological characteristics is a necessary first step before a meaningful airresources management plan and program can be established. The survey in-cludes an inventory of source emissions and a contaminant and meteorologicalsampling network, supplemented by study of basic demographic, economic,land-use, and social factors.
Inventory
The inventory includes the location, height, exit velocity, and temperature ofemission sources and identification of the processes involved; the air pollutioncontrol devices installed and their effectiveness; and the pounds or tons ofspecific air pollutants emitted per day, week, month, and year, together withdaily and seasonal variations in production. Inventories of area sources (e.g.,home heating, small dry cleaners) can be done simply through fuel use andsolvent sales data. The emissions are calculated from emission tables or by

924 AIR POLLUTION AND NOISE CONTROL
material balance. An estimate can then be made of the total pollution burdenon the atmospheric resources of any given air basin.39 Tables have been de-veloped to assist in the calculation of the amounts and types of contaminantsreleased; they can also be used to check on information received throughpersonal visits, questionnaires, telephone calls, government reports, and tech-nical and scientific literature.40 Additional sources of information are the com-plaint files of the health department, municipal and private agencies, publishedinformation, university studies, state and local chamber of commerce reportsand files, and results of traffic surveys as well the Census of Housing localfuel and gasoline sales. Much of this material is now available electronicallyvia the internet. Data about concentration of primary pollutants for exam-ple is available via the Aerometric Information Retrieval System (AIRS) atwww.epa.gov/airs.
Air Sampling
Air and meteorological sampling equipment located in the survey area willvary, depending on a number of factors such as land area, topography, pop-ulation densities, industrial complexes, and manpower and budget availability.A minimum number of stations is necessary to obtain meaningful data.
Specific sampling sites for a comprehensive survey or for monitoring areselected on the basis of objective, scope, and budgetary limitations; acces-sibility for year-round operation, availability of reliable electrical power,amount and type of equipment available, program duration, and personnelavailable to operate stations; meteorology of the area, topography, adjacentobstructions, and vertical and horizontal distribution of equipment; and sam-pler operator problems, space requirements, protection of equipment and site,possible hazards, and public attitude toward the program.41 The EPA canprovide monitoring and siting guidance.42,43 Careful attention must also begiven to the elimination of sampling bias and variables as related to size ofsample, rate of sampling, collection and equipment limitations, and analyticallimitations.
Basic Studies and Analyses
Basic studies include population densities and projections; land-use analysis;mapping; and economic studies and proposals, including industrialization,transportation systems, community institutions, environmental health and en-gineering considerations, relationship to federal, state, and local planning, andrelated factors. Liaison with other planning agencies can be helpful in ob-taining needed information that may already be available. See Chapter 2.
When all the data from the emission inventory, air sampling, and basicstudies are collected, analyzed, and evaluated, a report is usually prepared.The analysis step should include calculations to show how the pollutants
AMBIENT AIR QUALITY STANDARDS 925
released to the atmosphere are dispersed and their possible effects under ex-isting conditions and with future development.
Mathematical models could be developed, or commercially available mod-eling packages could be utilized, based on certain assumptions and the datacollected, to estimate the pollution levels that might result under various emis-sion, topographical, and meteorological conditions. A data bank and a systemfor the collection and retrieval of information would generally be indicated.The approximate cost to achieve selected levels of air quality (for health,aesthetic, plant, and animal considerations) and the possible effect on indus-trial expansion, transportation modes and systems, availability and cost offuel, and community goals and objectives should be determined. See also (a)Planning and Zoning and (b) Air Quality Modeling, this chapter.
The report would recommend air quality objectives based on EPA stan-dards for areas in the region studied based on existing and proposed landuses. This will require consultation and coordination with state and localplanning agencies.44
Short- and long-term objectives and priorities should be established toachieve the desired air quality. Recommendations to reduce air pollutionmight include control of pollutant emissions and limits in designated areasand under hazardous weather conditions and predictions; time schedules forstarting control actions; control of fuel composition; requirement of plans fornew or altered emission sources and approval of construction for compliancewith emission standards; denial of certain plan approvals and prohibition ofactivities, or requirement of certain types of control devices; and performancestandards to be met by existing and new structures and facilities.
The report is then formally submitted to the regulatory agency, board, orcommission for further action. It would generally include recommendationsfor needed laws, rules, and regulations and administrative organization andstaffing for the control of existing and new sources of air pollution.
AMBIENT AIR QUALITY STANDARDS*
Topographic, meteorological, and land-use characteristics of areas within anair region will vary. The social and economic development of an area willresult in different degrees of air pollution and demands for air quality. Becauseof this, it is practical and reasonable to establish different levels of air purity
*‘‘Ambient air’’ means that portion of the atmosphere, external to buildings, to which the generalpublic has access.
926 AIR POLLUTION AND NOISE CONTROL
for certain areas within a region. However, any standards adopted must en-sure, at a very minimum, no adverse effects on human health.*
Federal Standards
The federal Air Quality Act of 1967 (Public Law 90-148) was amended in1970, 1974, 1977, 1990, and 1997 and is now know as the Clean Air Act(CAA). The original act was passed in 1955. Emissions from stationarysources and motor vehicles are regulated under the act. Stationary sourcesmust obtain permits that specify the amount and type of allowable emissionsfrom the air quality regulatory agency. Modifications to an existing facilityare subject to the provisions of the Act. The Act requires that the administratorof the EPA develop and issue to the states criteria of air quality for theprotection of public health and welfare and further specifies that such criteriashall reflect the latest scientific knowledge useful in indicating the kind andextent of all identifiable effects on health and welfare that may be expectedfrom the presence of an air contaminant, or combination of contaminants, invarying quantities.
The Act requires the administrator to designate interstate or intrastate airquality control regions throughout the country as considered necessary toensure adequate implementation of air quality standards. These regions are tobe designated on the basis of meteorological, social, and political factors,which suggests that a group of communities should be treated as a unit.
The federal Clean Air Act, as amended, requires that the administrator ofthe EPA promulgate national ambient air quality standards (NAAQSs) forsulfur oxides, particulate matter, carbon monoxide, photochemical oxidants,hydrocarbons, and nitrogen oxides. These standards are included in Table6-5.
The Act requires each state to adopt
*In the United States national primary and secondary ambient air quality standards were prom-ulgated effective April 30, 1971. Primary ambient air quality standards are those that, in thejudgment of the EPA administrator, based on the air quality criteria and allowing an adequatemargin of safety, are required to protect the public health. Secondary ambient air quality standardsare those that, in the judgment of the administrator, based on the air quality criteria, are requiredto protect the public welfare from any known or anticipated adverse effects associated with thepresence of air pollutants in the ambient air (on soil, water, vegetation, materials, animals, weather,visibility, personal comfort, and well-being).
In England (Ministry of Housing and Local Government 1966B), the standard states, in part:‘‘No emission discharged in such amount or manner as to constitute a demonstrable health hazardin either the short or long term can be tolerated. Emissions, in terms of both concentration andmass rate of emission, must be reduced to the lowest practicable amount.’’
In the Soviet Union, the goal is protection from any agent in the atmosphere that can bedemonstrated to produce physiological effect, even if the effect cannot be shown to be harmful.
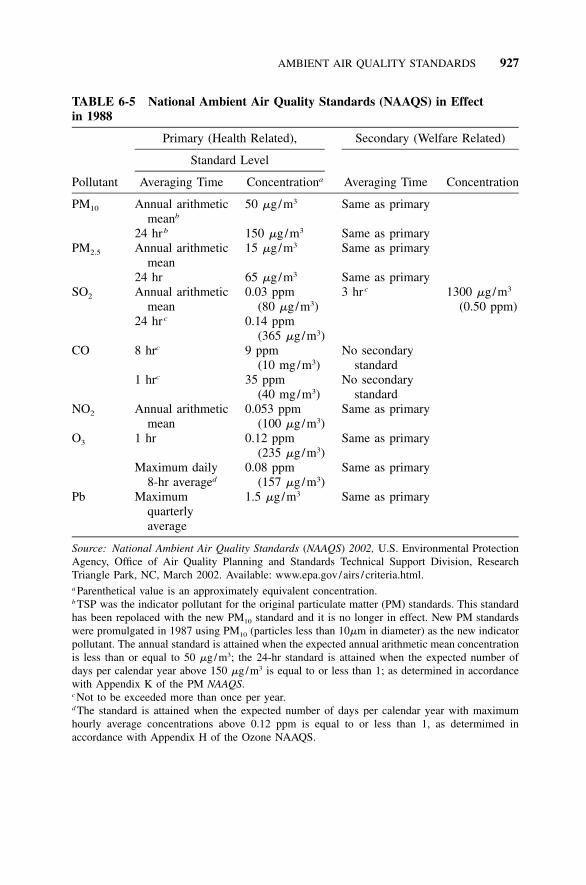
AMBIENT AIR QUALITY STANDARDS 927
TABLE 6-5 National Ambient Air Quality Standards (NAAQS) in Effectin 1988
Pollutant
Primary (Health Related),
Standard Level
Averaging Time Concentrationa
Secondary (Welfare Related)
Averaging Time Concentration
PM10 Annual arithmeticmeanb
50 �g/m3 Same as primary
24 hr b 150 �g/m3 Same as primaryPM2.5 Annual arithmetic
mean15 �g/m3 Same as primary
24 hr 65 �g/m3 Same as primarySO2 Annual arithmetic
mean0.03 ppm
(80 �g/m3)3 hr c 1300 �g/m3
(0.50 ppm)24 hr c 0.14 ppm
(365 �g/m3)CO 8 hrc 9 ppm
(10 mg/m3)No secondary
standard1 hrc 35 ppm
(40 mg/m3)No secondary
standardNO2 Annual arithmetic
mean0.053 ppm
(100 �g/m3)Same as primary
O3 1 hr 0.12 ppm(235 �g/m3)
Same as primary
Maximum daily8-hr averaged
0.08 ppm(157 �g/m3)
Same as primary
Pb Maximumquarterlyaverage
1.5 �g/m3 Same as primary
Source: National Ambient Air Quality Standards (NAAQS) 2002, U.S. Environmental ProtectionAgency, Office of Air Quality Planning and Standards Technical Support Division, ResearchTriangle Park, NC, March 2002. Available: www.epa.gov /airs / criteria.html.a Parenthetical value is an approximately equivalent concentration.b TSP was the indicator pollutant for the original particulate matter (PM) standards. This standardhas been repolaced with the new PM10 standard and it is no longer in effect. New PM standardswere promulgated in 1987 using PM10 (particles less than 10�m in diameter) as the new indicatorpollutant. The annual standard is attained when the expected annual arithmetic mean concentrationis less than or equal to 50 �g /m3; the 24-hr standard is attained when the expected number ofdays per calendar year above 150 �g /m3 is equal to or less than 1; as determined in accordancewith Appendix K of the PM NAAQS.c Not to be exceeded more than once per year.d The standard is attained when the expected number of days per calendar year with maximumhourly average concentrations above 0.12 ppm is equal to or less than 1, as determimed inaccordance with Appendix H of the Ozone NAAQS.
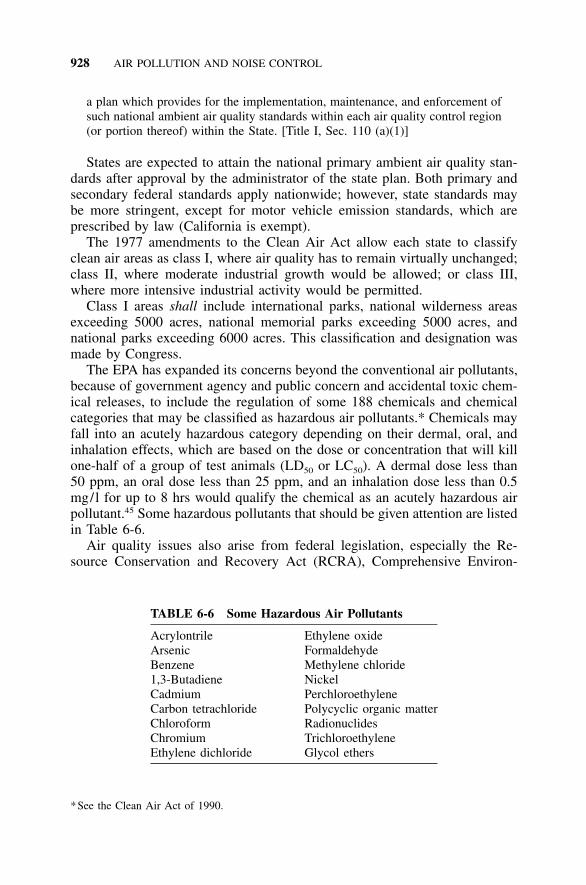
928 AIR POLLUTION AND NOISE CONTROL
TABLE 6-6 Some Hazardous Air Pollutants
AcrylontrileArsenicBenzene1,3-ButadieneCadmiumCarbon tetrachlorideChloroformChromiumEthylene dichloride
Ethylene oxideFormaldehydeMethylene chlorideNickelPerchloroethylenePolycyclic organic matterRadionuclidesTrichloroethyleneGlycol ethers
a plan which provides for the implementation, maintenance, and enforcement ofsuch national ambient air quality standards within each air quality control region(or portion thereof) within the State. [Title I, Sec. 110 (a)(1)]
States are expected to attain the national primary ambient air quality stan-dards after approval by the administrator of the state plan. Both primary andsecondary federal standards apply nationwide; however, state standards maybe more stringent, except for motor vehicle emission standards, which areprescribed by law (California is exempt).
The 1977 amendments to the Clean Air Act allow each state to classifyclean air areas as class I, where air quality has to remain virtually unchanged;class II, where moderate industrial growth would be allowed; or class III,where more intensive industrial activity would be permitted.
Class I areas shall include international parks, national wilderness areasexceeding 5000 acres, national memorial parks exceeding 5000 acres, andnational parks exceeding 6000 acres. This classification and designation wasmade by Congress.
The EPA has expanded its concerns beyond the conventional air pollutants,because of government agency and public concern and accidental toxic chem-ical releases, to include the regulation of some 188 chemicals and chemicalcategories that may be classified as hazardous air pollutants.* Chemicals mayfall into an acutely hazardous category depending on their dermal, oral, andinhalation effects, which are based on the dose or concentration that will killone-half of a group of test animals (LD50 or LC50). A dermal dose less than50 ppm, an oral dose less than 25 ppm, and an inhalation dose less than 0.5mg/l for up to 8 hrs would qualify the chemical as an acutely hazardous airpollutant.45 Some hazardous pollutants that should be given attention are listedin Table 6-6.
Air quality issues also arise from federal legislation, especially the Re-source Conservation and Recovery Act (RCRA), Comprehensive Environ-
*See the Clean Air Act of 1990.
AMBIENT AIR QUALITY STANDARDS 929
mental Response, Compensation, and Liability Act (CERCLA or Superfund),and the Emergency Planning and Community Right-to-Know Act, also calledSuperfund Amendments and Reauthorization Act Title III (SARA Title III).Of these, SARA Title III has the most dramatic and far-reaching impact onindustry regarding the control of toxic chemicals in air. In addition, the EPAhas proposed standards limiting emissions of volatile organic pollutants fromprocess vents and equipment leaks at new and existing hazardous waste trans-fer, storage, treatment, and disposal facilities. These regulations will imposeadditional air monitoring and emission control responsibilities on RCRA-permitted facilities. Current air quality aspects of RCRA apply to hazardouswaste incinerators and land treatment and disposal facilities as well as toremedial action to clean designated sites.
Clean Air Act of 1990
The Clean Air Act amendments of 1990 have added significantly to potentialambient air quality improvement. Some of the major features follow.
Title I deals with the attainment of ambient air quality standards. The EPAmay establish geographical boundaries and grade nonattainment areas thatexceed standards for carbon monoxide, ozone, and particulate matter. Statesmust reduce overall emissions, and the EPA can impose sanctions (loss offunds for highways and construction) against states and cities for noncom-pliance.
Title II deals with mobile sources of air pollution. Stricter tailpipe emissionlimits are established for oxides of nitrogen, hydrocarbons, and carbon mon-oxide. Cleaner fuel and vehicles will be required in certain cities havingozone, smog, or carbon monoxide problems.
Title III deals with the reduction and regulation of 188 toxic air emissionsfrom commercial and industrial sources and municipal incinerators. The‘‘maximum achievable control technology’’ will be required at existing, new,or modified sources.
Title IV deals with the control of acid deposition, commonly referred toas acid rain, primarily from plants burning fossil fuels. Reductions in sulfurdioxide emissions will be required on an EPA-phased-time basis, taking intoconsideration location of sources and existing emissions. Emissions of nitro-gen oxides are to be reduced, and standards are to be issued by the EPA.Continuous monitoring of sulfur dioxide, nitrogen oxides, and opacity will berequired. Utilities may save, buy, or sell pollution emission allowances.
Title V deals with the development and requirement of a permit system bythe EPA similar to the National Pollutant Discharge Elimination System usedunder the Clean Water Act. All sources of toxic air pollutants will be requiredto obtain an operating permit valid for up to five years. The permit will listthe compliance requirements; the program will be administered by the states.
Title VI deals with the phasing out of ozone-depleting chemicals, includingCFCs, halons, HCFCs, carbon tetrachloride, and methyl chloroform. Under
930 AIR POLLUTION AND NOISE CONTROL
the law, CFCs, halons, and carbon tetrachloride are to be phased out by theyear 2000. Methyl chloroform is to be phased out in 2002 and HCFCs by2030. Recycling of refrigerants from motor vehicle air-conditioning units isrequired. The Act requires that assistance be provided to developing countries.
Title VII deals with enforcement. Corporations and corporate officials aresubject to civil and criminal liabilities. The EPA may issue administrativepenalties of up to $200,000 and field citations up to $5000. Also, privatecitizens or groups may take action against violators.
Title VIII deals with the study of visibility impairment, regulation of airpollution from outer continental shelf activities, monitoring of carbon dioxideemissions by utilities, and grants for air pollution planning and control pro-grams.
Title IX requires that the EPA conduct a research program that includessampling, measurement, monitoring, analysis, and modeling of air pollution.
Title X requires that the EPA ensure, to the extent possible, that 10 percentof research funding be made available to disadvantaged business concerns.
Title XI authorizes a training and benefits program for workers who be-come unemployed because of the Act.
Clean Air Act Amendments of 1997
In 1997, the EPA proposed more restrictive NAAQSs for ozone and particu-late matter. A new standard for particulate matter was drafted that regulatedparticulates less than 2.5 �m in diameter. These fine particulates are impli-cated in respiratory distress because of their ability to penetrate deep into thelungs. The proposed ozone standard reduced the permissible concentration toan 8-hr average of 0.080 ppm. This is in contrast to the previous 12-hr 0.120-ppm standard. The EPA estimated these standards would affect 125 millionpeople including 35 million children in the United States. The proposed ruleswere challenged in court in 1997 and remained in litigation until the SupremeCourt of the United States and subsequently the District of Columbia CircuitCourt sided with the EPA in 2002. The standards will should have a significanteffect on the number of communities that will have to address ground-levelozone issues. Mobile sources of PM2.5, such as heavy-duty diesel trucks, mayalso be significantly affected by these amendments.
Pollutant Standards Index (PSI)
The pollutant standards index is a uniform method recommended* to classifyand report urban air quality. Five criteria pollutants are judged for the amount
*Recommendation of task force consisting of the Council on Environmental Quality, the EPA,Department of Commerce, National Oceanic and Atmospheric Administration, and the NationalBureau of Standards.
CONTROLS 931
and adverse effects on human health, as shown in Table 6-7. On that basis,the air quality evaluated is designated as presenting ‘‘hazardous conditions’’if the PSI is greater than 300; ‘‘very unhealthful conditions’’ if the PSI isbetween 200 and 300; ‘‘unhealthful conditions’’ if the PSI is between 100and 200; ‘‘moderate’’ if the PSI is 50 to 100; and ‘‘good’’ if the PSI is between0 and 50. The PSI for one day rises above 100, that is, to the ‘‘Alert’’ levelor higher, when any one of the five criteria pollutants reaches a level that maybe judged to have adverse effects on human health.
CONTROLS
Air pollution involves a source such as a power-generating plant burningheavy fuel oil; a production byproduct or waste such as particulates, vapors,or gases; release of pollutants into the atmosphere, such as smoke or sulfurdioxide; transmission by airflows; and receptors who are affected, such aspeople, animals, plants, structures, and clothing. Controls can be applied atone or more points between the source and the receptor, starting preferablyat the source. The application of control procedures and devices is moreeffective when supported by public information, raw-material or productionand process revision, and installation of proper air-cleaning equipment. Reg-ulatory persuasion and, if necessary, legal action would follow.
Source Control
Processes that are sources of air pollution include chemical reaction, evapo-ration, crushing and grinding, drying and baking, and combinations of theseoperations.
For stationary combustion installations, such as fossil-fuel-fired electricgenerating stations and plants generating steam for space heating or processes,the amounts and types of pollutants can be kept to a minimum using a fuelwith less air pollution potential. Some examples of the types and amounts ofcontaminants from different types of fuels are given in Table 6-8. As can beseen, sulfur dioxide is a major pollutant in all fuels. Its removal for healthand environmental (acid rain) reasons has a high priority.
Processes can also be designed and modified to reduce waste and the pol-lutants produced at the source. This has been a fundamental step in the re-duction of industrial wastewater pollution and can certainly be applied to airpollution control.
The internal combustion engine is a major producer of air pollutants. Achange from gasoline to another fuel or a major improvement in the efficiencyof the gasoline engine would attack that problem at the source. Inspection ofcars and light trucks for compliance with exhaust emissions standards cansignificantly reduce hydrocarbon and carbon monoxide levels in the ambientair. Heavy-duty gasoline trucks also add a large percentage of carbon mon-

932
TABLE 6-7 Comparison of PSI Values with Pollutant Concentrations and Health Effects
IndexValue
AirQualityLevel
Pollutant Levels
PM2.5,24 hr
(�g /m3)
SO2,24 hr(ppm)
CO,8 hr
(ppm)
O3,8 hr
(ppm)
NO2,1 hr
(ppm)Health Effect
Descriptor General Health Effects Cautionary Statements
500 Significantharm
500 1.004 50.4 — 2.04 Hazardous Premature death of ill and elderly.Healthy people will experienceadverse symptoms that affecttheir normal activity.
All persons should remainindoors, keeping windows anddoors closed. All personsshould minimize physicalexertion and avoid traffic.
400 Emergency 350 0.804 40.4 — 1.64 Hazardous Premature onset of certaindiseases in addition tosignificant aggravation ofsymptoms and decreasedexercise tolerance in healthypersons.
Elderly and persons with existingdiseases should stay indoorsand avoid physical exertion.General populations shouldavoid outdoor activity.
300 Warning 250 0.604 30.4 0.374a 1.24 Veryunhealthful
Significant aggravation ofsymptoms and decreasedexercise tolerance in personswith heart or lung disease, withwidespread symptoms in thehealthy population.
Elderly and persons with existingheart or lung disease shouldstay indoors and reducephysical activity.
200 Alert 150.4 0.304 15.4 0.124 0.65 Unhealthful Mild aggravation of symptoms insusceptible persons, withirritation symptoms in thehealthy population.
Persons with existing heart orrespiratory ailments shouldreduce physical exertion andoutdoor activity.
100 Moderate 40.4 0.144 9.4 0.084 b Moderate50 Good 15.4 0.034c 4.4 0.064 b
Source: Guideline for Public Reporting of Daily Air Quality—Pollutant Standards Index (PSI), EPA 454/R-99-010, U.S. Enironmental Protection Agency, Officeof Air Quality Planning and Standards (OAQPS), Research Triangle Park, NC, 1999, Table 7, p. 13.a When 8-hr O2 concentrations exceed 0.374 ppm, air quality index (AQI) values of 301 or higher must be calculated with 1-hr O3 concentrations.b NO2 has no short-term NAAQS and can generate an AQI only above AQI value of 200.c Annual primary National Ambient Air Quality Standards (NAAQS); see Table 6-5.
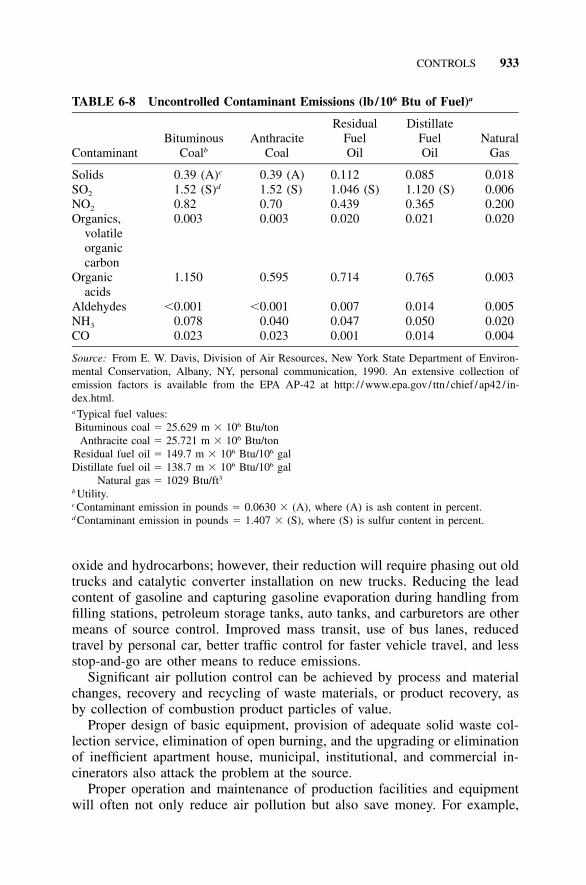
CONTROLS 933
TABLE 6-8 Uncontrolled Contaminant Emissions (lb/106 Btu of Fuel)a
ContaminantBituminous
Coalb
AnthraciteCoal
ResidualFuelOil
DistillateFuelOil
NaturalGas
Solids 0.39 (A)c 0.39 (A) 0.112 0.085 0.018SO2 1.52 (S)d 1.52 (S) 1.046 (S) 1.120 (S) 0.006NO2 0.82 0.70 0.439 0.365 0.200Organics,
volatileorganiccarbon
0.003 0.003 0.020 0.021 0.020
Organicacids
1.150 0.595 0.714 0.765 0.003
Aldehydes �0.001 �0.001 0.007 0.014 0.005NH3 0.078 0.040 0.047 0.050 0.020CO 0.023 0.023 0.001 0.014 0.004
Source: From E. W. Davis, Division of Air Resources, New York State Department of Environ-mental Conservation, Albany, NY, personal communication, 1990. An extensive collection ofemission factors is available from the EPA AP-42 at http: / /www.epa.gov / ttn / chief / ap42 / in-dex.html.a Typical fuel values:
6Bituminous coal � 25.629 m � 10 Btu/ton6Anthracite coal � 25.721 m � 10 Btu/ton
6 6Residual fuel oil � 149.7 m � 10 Btu/10 gal6 6Distillate fuel oil � 138.7 m � 10 Btu/10 gal
3Natural gas � 1029 Btu/ftb Utility.c Contaminant emission in pounds � 0.0630 � (A), where (A) is ash content in percent.d Contaminant emission in pounds � 1.407 � (S), where (S) is sulfur content in percent.
oxide and hydrocarbons; however, their reduction will require phasing out oldtrucks and catalytic converter installation on new trucks. Reducing the leadcontent of gasoline and capturing gasoline evaporation during handling fromfilling stations, petroleum storage tanks, auto tanks, and carburetors are othermeans of source control. Improved mass transit, use of bus lanes, reducedtravel by personal car, better traffic control for faster vehicle travel, and lessstop-and-go are other means to reduce emissions.
Significant air pollution control can be achieved by process and materialchanges, recovery and recycling of waste materials, or product recovery, asby collection of combustion product particles of value.
Proper design of basic equipment, provision of adequate solid waste col-lection service, elimination of open burning, and the upgrading or eliminationof inefficient apartment house, municipal, institutional, and commercial in-cinerators also attack the problem at the source.
Proper operation and maintenance of production facilities and equipmentwill often not only reduce air pollution but also save money. For example,

934 AIR POLLUTION AND NOISE CONTROL
air–fuel ratios can determine the amount of unburned fuel going up the stack,combustion temperature can affect the strain placed on equipment when op-erated beyond rated capacity, and the competency of supervision can deter-mine the quantity and type of pollutants released and the quality of theproduct.
Emission Control Equipment
Municipal waste incinerators can emit hazardous levels of dioxins and otherorganic chemicals, metals, and acid gases if not regulated. In view of this,the EPA is requiring strict controls on air emissions from such facilities.46 Inaddition to dioxins, the organics include furans, chlorobenzenes, chlorophen-ols, formaldehyde, polycyclic aromatic hydrocarbons, and polychlorinated bi-phenyls. The metals are arsenic, beryllium, cadmium, chromium, lead, andmercury. The EPA believes that proper incinerator combustion, acid gas scrub-ber, and particulate removal can achieve 99 percent or greater reduction ofdioxins and furans, 95 percent or greater reduction of organics, 90 percent orgreater reduction of hydrogen chloride, and 97 to 99 percent reduction ofmetals.
Emission control equipment is designed to remove or reduce particulates,aerosols (solids and liquid forms), and gaseous byproducts from varioussources and, in some instances, emissions resulting from inefficient designand operation.
The operating principles of aerosol collection equipment include
1. inertial entrapment by altering the direction and velocity of the effluent;2. increasing the size of the particles through conglomeration or liquid
mist entrainment to subject the particles to inertial and gravitationalforces within the operational range of the control device;
3. impingement of particles on impact surfaces, baffles, or filters; and4. precipitation of contaminants in electrical fields or by thermal convec-
tion.47
The collection of gases and vapors is based on the particular physical andchemical properties of the gases to be controlled.
Particulate Collectors and Separators
Some of the more common collectors and separators are identified below.These have application in mechanical operations for dust control such as inpulverizing, grinding, blending, woodworking, and handling flour as well asat power stations, incinerators, cement plants, heavy metallurgical operations,and other dusty operations. In general, collector efficiencies increase withparticle size and from a low efficiency with baffled settling chambers, in-
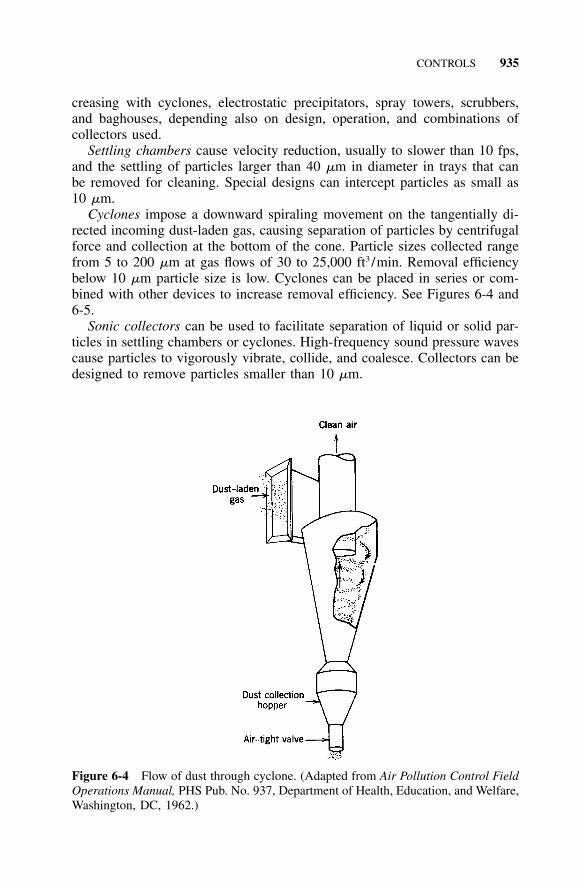
CONTROLS 935
Figure 6-4 Flow of dust through cyclone. (Adapted from Air Pollution Control FieldOperations Manual, PHS Pub. No. 937, Department of Health, Education, and Welfare,Washington, DC, 1962.)
creasing with cyclones, electrostatic precipitators, spray towers, scrubbers,and baghouses, depending also on design, operation, and combinations ofcollectors used.
Settling chambers cause velocity reduction, usually to slower than 10 fps,and the settling of particles larger than 40 �m in diameter in trays that canbe removed for cleaning. Special designs can intercept particles as small as10 �m.
Cyclones impose a downward spiraling movement on the tangentially di-rected incoming dust-laden gas, causing separation of particles by centrifugalforce and collection at the bottom of the cone. Particle sizes collected rangefrom 5 to 200 �m at gas flows of 30 to 25,000 ft3 /min. Removal efficiencybelow 10 �m particle size is low. Cyclones can be placed in series or com-bined with other devices to increase removal efficiency. See Figures 6-4 and6-5.
Sonic collectors can be used to facilitate separation of liquid or solid par-ticles in settling chambers or cyclones. High-frequency sound pressure wavescause particles to vigorously vibrate, collide, and coalesce. Collectors can bedesigned to remove particles smaller than 10 �m.
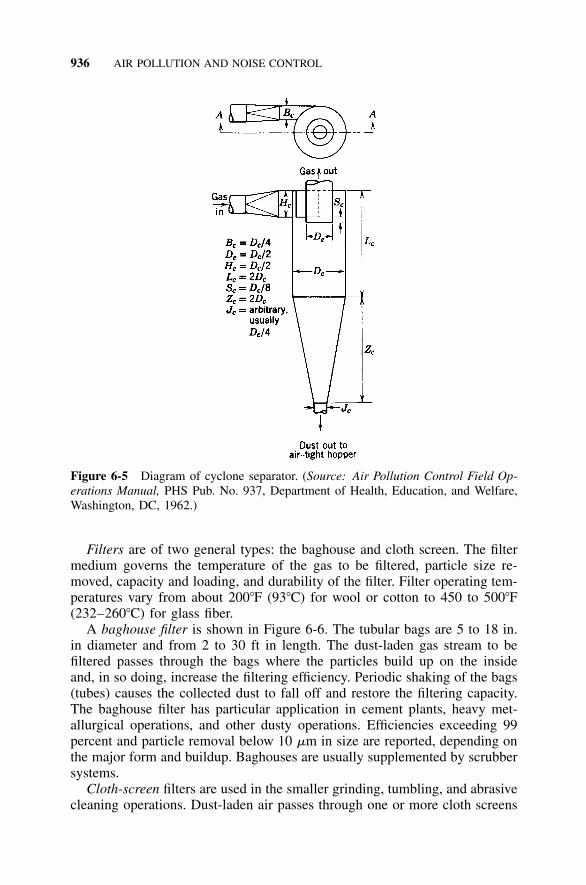
936 AIR POLLUTION AND NOISE CONTROL
Figure 6-5 Diagram of cyclone separator. (Source: Air Pollution Control Field Op-erations Manual, PHS Pub. No. 937, Department of Health, Education, and Welfare,Washington, DC, 1962.)
Filters are of two general types: the baghouse and cloth screen. The filtermedium governs the temperature of the gas to be filtered, particle size re-moved, capacity and loading, and durability of the filter. Filter operating tem-peratures vary from about 200�F (93�C) for wool or cotton to 450 to 500�F(232–260�C) for glass fiber.
A baghouse filter is shown in Figure 6-6. The tubular bags are 5 to 18 in.in diameter and from 2 to 30 ft in length. The dust-laden gas stream to befiltered passes through the bags where the particles build up on the insideand, in so doing, increase the filtering efficiency. Periodic shaking of the bags(tubes) causes the collected dust to fall off and restore the filtering capacity.The baghouse filter has particular application in cement plants, heavy met-allurgical operations, and other dusty operations. Efficiencies exceeding 99percent and particle removal below 10 �m in size are reported, depending onthe major form and buildup. Baghouses are usually supplemented by scrubbersystems.
Cloth-screen filters are used in the smaller grinding, tumbling, and abrasivecleaning operations. Dust-laden air passes through one or more cloth screens
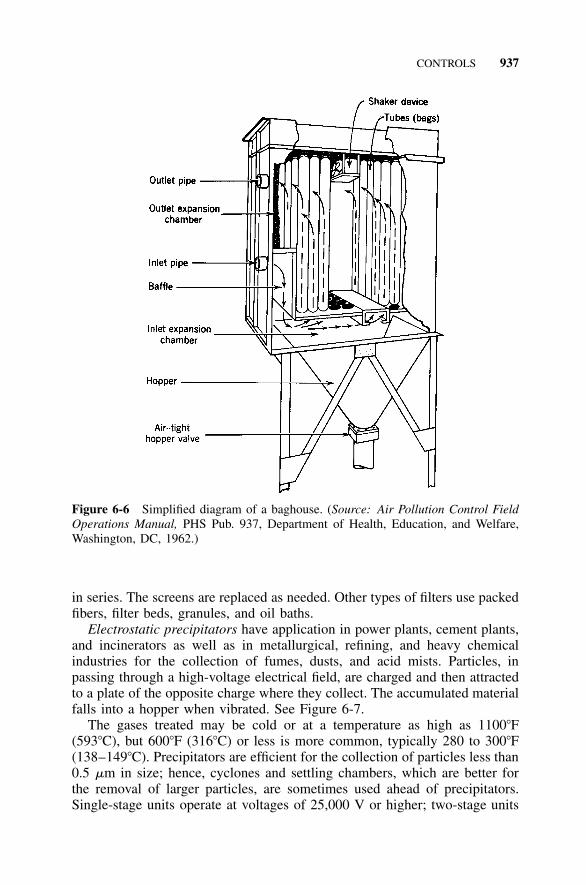
CONTROLS 937
Figure 6-6 Simplified diagram of a baghouse. (Source: Air Pollution Control FieldOperations Manual, PHS Pub. 937, Department of Health, Education, and Welfare,Washington, DC, 1962.)
in series. The screens are replaced as needed. Other types of filters use packedfibers, filter beds, granules, and oil baths.
Electrostatic precipitators have application in power plants, cement plants,and incinerators as well as in metallurgical, refining, and heavy chemicalindustries for the collection of fumes, dusts, and acid mists. Particles, inpassing through a high-voltage electrical field, are charged and then attractedto a plate of the opposite charge where they collect. The accumulated materialfalls into a hopper when vibrated. See Figure 6-7.
The gases treated may be cold or at a temperature as high as 1100�F(593�C), but 600�F (316�C) or less is more common, typically 280 to 300�F(138–149�C). Precipitators are efficient for the collection of particles less than0.5 �m in size; hence, cyclones and settling chambers, which are better forthe removal of larger particles, are sometimes used ahead of precipitators.Single-stage units operate at voltages of 25,000 V or higher; two-stage units
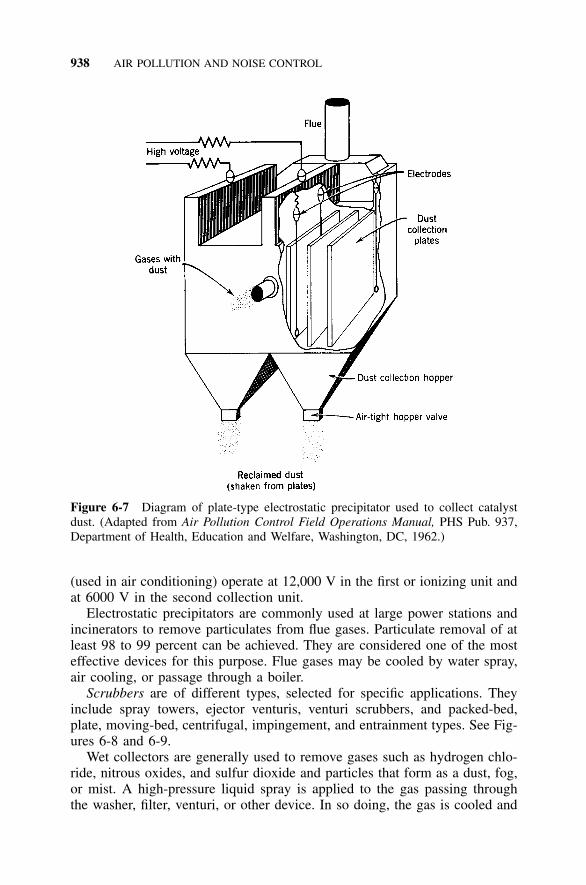
938 AIR POLLUTION AND NOISE CONTROL
Figure 6-7 Diagram of plate-type electrostatic precipitator used to collect catalystdust. (Adapted from Air Pollution Control Field Operations Manual, PHS Pub. 937,Department of Health, Education and Welfare, Washington, DC, 1962.)
(used in air conditioning) operate at 12,000 V in the first or ionizing unit andat 6000 V in the second collection unit.
Electrostatic precipitators are commonly used at large power stations andincinerators to remove particulates from flue gases. Particulate removal of atleast 98 to 99 percent can be achieved. They are considered one of the mosteffective devices for this purpose. Flue gases may be cooled by water spray,air cooling, or passage through a boiler.
Scrubbers are of different types, selected for specific applications. Theyinclude spray towers, ejector venturis, venturi scrubbers, and packed-bed,plate, moving-bed, centrifugal, impingement, and entrainment types. See Fig-ures 6-8 and 6-9.
Wet collectors are generally used to remove gases such as hydrogen chlo-ride, nitrous oxides, and sulfur dioxide and particles that form as a dust, fog,or mist. A high-pressure liquid spray is applied to the gas passing throughthe washer, filter, venturi, or other device. In so doing, the gas is cooled and
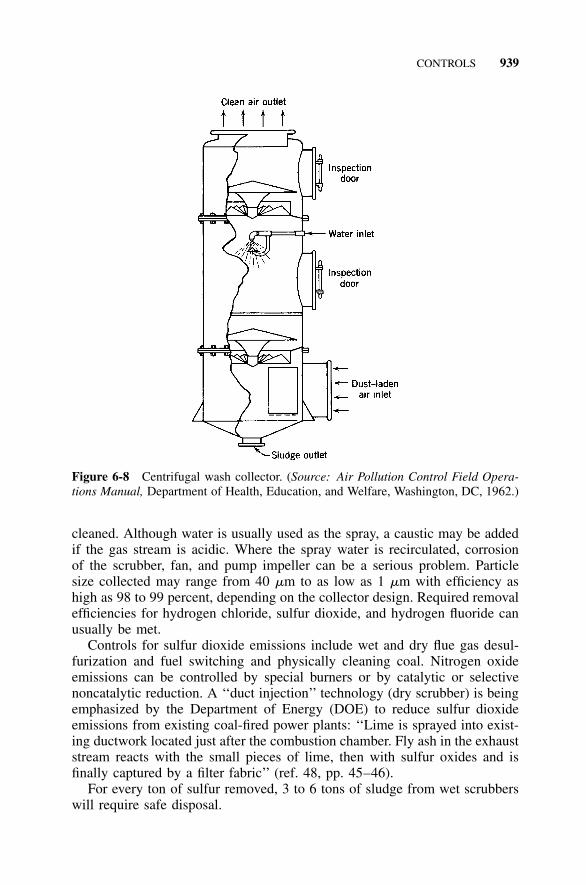
CONTROLS 939
Figure 6-8 Centrifugal wash collector. (Source: Air Pollution Control Field Opera-tions Manual, Department of Health, Education, and Welfare, Washington, DC, 1962.)
cleaned. Although water is usually used as the spray, a caustic may be addedif the gas stream is acidic. Where the spray water is recirculated, corrosionof the scrubber, fan, and pump impeller can be a serious problem. Particlesize collected may range from 40 �m to as low as 1 �m with efficiency ashigh as 98 to 99 percent, depending on the collector design. Required removalefficiencies for hydrogen chloride, sulfur dioxide, and hydrogen fluoride canusually be met.
Controls for sulfur dioxide emissions include wet and dry flue gas desul-furization and fuel switching and physically cleaning coal. Nitrogen oxideemissions can be controlled by special burners or by catalytic or selectivenoncatalytic reduction. A ‘‘duct injection’’ technology (dry scrubber) is beingemphasized by the Department of Energy (DOE) to reduce sulfur dioxideemissions from existing coal-fired power plants: ‘‘Lime is sprayed into exist-ing ductwork located just after the combustion chamber. Fly ash in the exhauststream reacts with the small pieces of lime, then with sulfur oxides and isfinally captured by a filter fabric’’ (ref. 48, pp. 45–46).
For every ton of sulfur removed, 3 to 6 tons of sludge from wet scrubberswill require safe disposal.
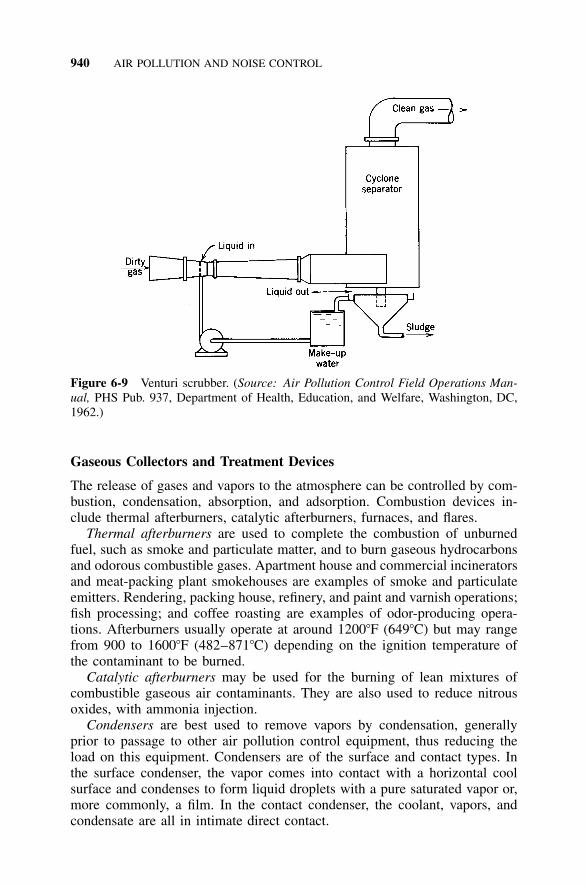
940 AIR POLLUTION AND NOISE CONTROL
Figure 6-9 Venturi scrubber. (Source: Air Pollution Control Field Operations Man-ual, PHS Pub. 937, Department of Health, Education, and Welfare, Washington, DC,1962.)
Gaseous Collectors and Treatment Devices
The release of gases and vapors to the atmosphere can be controlled by com-bustion, condensation, absorption, and adsorption. Combustion devices in-clude thermal afterburners, catalytic afterburners, furnaces, and flares.
Thermal afterburners are used to complete the combustion of unburnedfuel, such as smoke and particulate matter, and to burn gaseous hydrocarbonsand odorous combustible gases. Apartment house and commercial incineratorsand meat-packing plant smokehouses are examples of smoke and particulateemitters. Rendering, packing house, refinery, and paint and varnish operations;fish processing; and coffee roasting are examples of odor-producing opera-tions. Afterburners usually operate at around 1200�F (649�C) but may rangefrom 900 to 1600�F (482–871�C) depending on the ignition temperature ofthe contaminant to be burned.
Catalytic afterburners may be used for the burning of lean mixtures ofcombustible gaseous air contaminants. They are also used to reduce nitrousoxides, with ammonia injection.
Condensers are best used to remove vapors by condensation, generallyprior to passage to other air pollution control equipment, thus reducing theload on this equipment. Condensers are of the surface and contact types. Inthe surface condenser, the vapor comes into contact with a horizontal coolsurface and condenses to form liquid droplets with a pure saturated vapor or,more commonly, a film. In the contact condenser, the coolant, vapors, andcondensate are all in intimate direct contact.
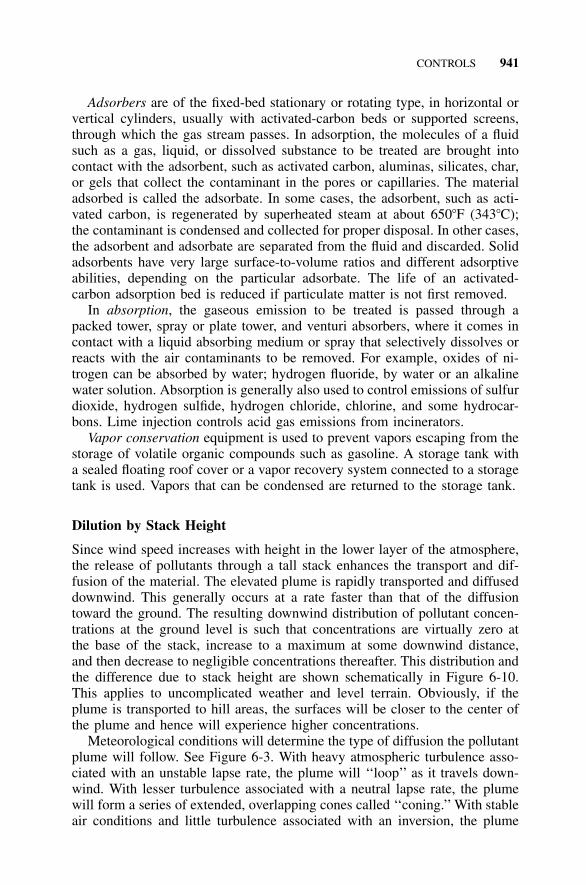
CONTROLS 941
Adsorbers are of the fixed-bed stationary or rotating type, in horizontal orvertical cylinders, usually with activated-carbon beds or supported screens,through which the gas stream passes. In adsorption, the molecules of a fluidsuch as a gas, liquid, or dissolved substance to be treated are brought intocontact with the adsorbent, such as activated carbon, aluminas, silicates, char,or gels that collect the contaminant in the pores or capillaries. The materialadsorbed is called the adsorbate. In some cases, the adsorbent, such as acti-vated carbon, is regenerated by superheated steam at about 650�F (343�C);the contaminant is condensed and collected for proper disposal. In other cases,the adsorbent and adsorbate are separated from the fluid and discarded. Solidadsorbents have very large surface-to-volume ratios and different adsorptiveabilities, depending on the particular adsorbate. The life of an activated-carbon adsorption bed is reduced if particulate matter is not first removed.
In absorption, the gaseous emission to be treated is passed through apacked tower, spray or plate tower, and venturi absorbers, where it comes incontact with a liquid absorbing medium or spray that selectively dissolves orreacts with the air contaminants to be removed. For example, oxides of ni-trogen can be absorbed by water; hydrogen fluoride, by water or an alkalinewater solution. Absorption is generally also used to control emissions of sulfurdioxide, hydrogen sulfide, hydrogen chloride, chlorine, and some hydrocar-bons. Lime injection controls acid gas emissions from incinerators.
Vapor conservation equipment is used to prevent vapors escaping from thestorage of volatile organic compounds such as gasoline. A storage tank witha sealed floating roof cover or a vapor recovery system connected to a storagetank is used. Vapors that can be condensed are returned to the storage tank.
Dilution by Stack Height
Since wind speed increases with height in the lower layer of the atmosphere,the release of pollutants through a tall stack enhances the transport and dif-fusion of the material. The elevated plume is rapidly transported and diffuseddownwind. This generally occurs at a rate faster than that of the diffusiontoward the ground. The resulting downwind distribution of pollutant concen-trations at the ground level is such that concentrations are virtually zero atthe base of the stack, increase to a maximum at some downwind distance,and then decrease to negligible concentrations thereafter. This distribution andthe difference due to stack height are shown schematically in Figure 6-10.This applies to uncomplicated weather and level terrain. Obviously, if theplume is transported to hill areas, the surfaces will be closer to the center ofthe plume and hence will experience higher concentrations.
Meteorological conditions will determine the type of diffusion the pollutantplume will follow. See Figure 6-3. With heavy atmospheric turbulence asso-ciated with an unstable lapse rate, the plume will ‘‘loop’’ as it travels down-wind. With lesser turbulence associated with a neutral lapse rate, the plumewill form a series of extended, overlapping cones called ‘‘coning.’’ With stableair conditions and little turbulence associated with an inversion, the plume
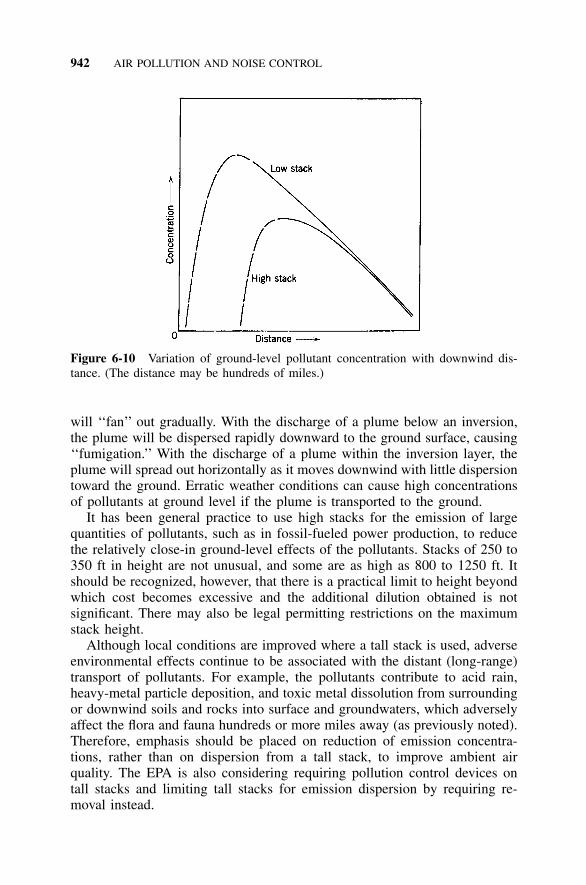
942 AIR POLLUTION AND NOISE CONTROL
Figure 6-10 Variation of ground-level pollutant concentration with downwind dis-tance. (The distance may be hundreds of miles.)
will ‘‘fan’’ out gradually. With the discharge of a plume below an inversion,the plume will be dispersed rapidly downward to the ground surface, causing‘‘fumigation.’’ With the discharge of a plume within the inversion layer, theplume will spread out horizontally as it moves downwind with little dispersiontoward the ground. Erratic weather conditions can cause high concentrationsof pollutants at ground level if the plume is transported to the ground.
It has been general practice to use high stacks for the emission of largequantities of pollutants, such as in fossil-fueled power production, to reducethe relatively close-in ground-level effects of the pollutants. Stacks of 250 to350 ft in height are not unusual, and some are as high as 800 to 1250 ft. Itshould be recognized, however, that there is a practical limit to height beyondwhich cost becomes excessive and the additional dilution obtained is notsignificant. There may also be legal permitting restrictions on the maximumstack height.
Although local conditions are improved where a tall stack is used, adverseenvironmental effects continue to be associated with the distant (long-range)transport of pollutants. For example, the pollutants contribute to acid rain,heavy-metal particle deposition, and toxic metal dissolution from surroundingor downwind soils and rocks into surface and groundwaters, which adverselyaffect the flora and fauna hundreds or more miles away (as previously noted).Therefore, emphasis should be placed on reduction of emission concentra-tions, rather than on dispersion from a tall stack, to improve ambient airquality. The EPA is also considering requiring pollution control devices ontall stacks and limiting tall stacks for emission dispersion by requiring re-moval instead.
CONTROLS 943
Planning and Zoning
The implementation of planning and zoning controls requires professionalanalysis and the cooperation of the state and regional planning agencies andthe local county, city, village, and town units of government.
The local economic, social, and political factors may limit what can real-istically be achieved in many instances. For example, a combination of fac-tors, including planning and zoning means, should be considered in locatinga new plant. These means could include plant siting downwind from residen-tial, work, and recreational areas, with consideration given to climate andmeteorological factors, frequency of inversions, topography, air movement,stack height, and adjacent land uses. Additional factors are distance separa-tion, open-space buffers, designation of industrial areas, traffic and transpor-tation control, and possible regulation of plant raw materials and processes.All these controls must recognize the present and future land use and espe-cially the air quality needed for health and comfort, regardless of the landownership.
The maintenance of air quality that meets established criteria requires reg-ulation of the location, density, and/or type of plants and plant emissions thatcould cause contravention of air quality standards. This calls for local andregional land-use control and cooperation to ensure that the permitted con-struction of plants would incorporate practices and control equipment thatwould not emit pollution that could adversely influence the air quality of thecommunity in the airshed. See Tables 6-6 and 6-7 and Ambient Air QualityStandards, this chapter.
Monitoring of the air at carefully selected locations would continually in-form and alert the regulatory agency of the need for additional source controland enforcement of emission standards. Conceivably, under certain unusuallyadverse weather conditions, a plant may have to take previously plannedemergency actions to reduce or practically eliminate emissions for a periodof time.
Air zoning establishes different air quality standards for different areasbased on the most desirable and feasible use of land. As discussed earlier inthis chapter, the 1977 amendments to the Clean Air Act allow each state toclassify air areas as either class I, II, or III. Class I areas would remainvirtually unchanged and class III could permit intensive industrial activity.Specific standards are established for each classification level. In all levels,however, protection of the public health is paramount. Insofar as air zoningis concerned, an industry should be able to choose its location and types ofemission controls provided the air quality standards are not violated.
Although air zoning provides a system or basis for land use and devel-opment, sound planning can assist in greatly minimizing the effects of airpollution. A WHO Expert Committee suggests the following:49
1. The siting of new towns should be undertaken only after a thoroughstudy of local topography and meteorology.
944 AIR POLLUTION AND NOISE CONTROL
2. New industries using materials or processes likely to produce air con-taminants should be so located as to minimize the effects of air pollu-tion.
3. Satellite (dormitory) towns should restrict the use of pollution-producing fuels.
4. Provision should be made for greenbelts and open spaces to facilitatethe dilution and dispersion of unavoidable pollution.
5. Greater use should be made of hydroelectric and atomic power and ofnatural gas for industrial processes and domestic purposes, thereby re-ducing the pollution resulting from the use of conventional fossil fuels.
6. Greater use should be made of central plants for the provision of bothheat and hot water for entire (commercial or industrial) districts.
7. As motor transport is a major source of pollution, traffic planning canmaterially affect the level of pollution in residential areas.
It is apparent that more needs to be learned and applied concerning openspaces, bodies of water, and trees and other vegetation to assist in air pollutioncontrol. For example, parks and greenbelts appear to be desirable locationsfor expressways because vegetation, in the presence of light, will utilize thecarbon dioxide given off by automobiles and release oxygen. In addition,highway designers must give consideration to such factors as road grades,speeds and elevations, natural and artificial barriers, interchange locations,and adjacent land uses as means of reducing the amounts and effects ofautomobile noise and emissions.
Air Quality Modeling
It is possible to calculate and predict, within limits, the approximate effectsof existing and proposed air pollution sources on the ambient air quality.50–53
A wide variety of models are used to estimate the air quality impacts ofsources on receptors, to prepare or review new industrial and other sourceapplications, and to develop air quality management plans for an area orregion.
Air quality models can be categorized into four classes.
1. Gaussian Most often used for estimating the ground-level impact ofnonreactive pollutants from stationary sources in a smooth terrain.
2. Numerical Most often used for estimating the impact of reactive andnonreactive pollutants in complex terrain.
3. Statistical Employed in situations where physical or chemical pro-cesses are not well understood.
4. Physical Involves experimental investigation of source impact in awind tunnel facility.
CONTROLS 945
Because of the almost limitless variety of situations for which modelingmay be employed, no single model can be considered ‘‘best.’’ Instead, theuser is encouraged to examine the strengths and weaknesses of the variousmodels available and select the one best suited to the particular job at hand.
The EPA has made a number of models available to the general pub-lic through its User’s Network for Applied Modeling of Air Pollution(UNAMAP). These models can be obtained from the National TechnicalInformation Service (NTIS).
The information needed to use an air quality model includes source emis-sion data, meteorological data, and pollutant concentration data.
Source Emission Data Sources of pollutants can generally be classified aspoint, line, or area sources. Point sources are individual stacks and are iden-tified by location, type and rate of emission, and stack parameters (stackheight, diameter, exit gas velocity, and temperature). Line sources are gen-erally confined to roadways and can be located by the ends of roadway seg-ments. Area sources include all the minor point and line sources that are toosmall to require individual consideration. These sources are usually treatedas a grid network of square areas, with pollutant emissions totaled and dis-tributed uniformly within each grid square.
Meteorological Data The data needed to represent the meteorological char-acteristics of a given area consist of (as a minimum) wind direction, windspeed, atmospheric stability, and mixing height. The representativeness of thedata for a given location will be dependent upon the proximity of the mete-orological monitoring site to the area being studied, the period of time duringwhich data are collected, and the complexity of terrain in the area. Localuniversities, industries, airports, and government agencies can all be used assources of such data.
Pollutant Concentration Data In order to assess the accuracy of a modelfor a particular application, predicted concentrations must be comparedagainst observed values. This can be done by obtaining historical pollutantconcentration data from air quality monitors located in the study area. Airquality data from monitors located in remote areas should also be obtainedto determine if a background concentration should be included in the model.Data should be verified using appropriate statistical procedures.
The accuracy of the model used depends upon the following factors:
1. How closely do the assumptions upon which the model is based cor-respond to the actual conditions for which the model is being used? Forexample, a model that assumes that the area being modeled is a flatplain of infinite extent may work well in Kansas but not in Wyoming.
946 AIR POLLUTION AND NOISE CONTROL
2. How accurate is the information being used as input for the model? Ofparticular importance here is verifying the accuracy of source emissiondata. Some points to consider are as follows:a. Should the source emission data be given in terms of potential, ac-
tual, or allowable emissions? ‘‘Actual’’ emissions should always beused for model verification.
b. Does emission rate vary by time of day or time of year?c. What level of production, percent availability, and so on should be
assumed for each emission source? The emission rates for industrialsources will often decline significantly during periods of economicrecession. Similarly, stationary fuel combustion sources (for spaceheating) will vary according to the severity of the winter.
d. Are stack parameters correct? Are there nearby structures or terrainfeatures that could influence the dispersion patterns of individualsources?
e. Is the source location correctly identified?f. How reliable is the pollution control equipment installed on each
emission source?
The user will often find that the job of verifying the input data is the mostdifficult and time-consuming part of the modeling process.
As the cost of computer services continues to decline, it is expected thatair quality modeling will become an available technology for smaller agenciessuch as local health and planning departments. The person who performs thismodeling will have to be knowledgeable not only in traditional air pollutioncontrol engineering but also in the fields of air pollution meteorology andcomputer programming.
PROGRAM AND ENFORCEMENT
General
A program for air resources management should be based on a comprehensiveareawide air pollution survey including air sampling, basic studies and anal-yses, and recommendations for ambient air quality standards. The studyshould be followed by an immediate and long-term plan to achieve the com-munity air quality goals and objectives, coupled with a surveillance and mon-itoring system and regulation of emissions.
MacKenzie proposes the following conclusions and decisions for the im-plementation of a study46:
1. Select air quality standard, possibly with variations in various parts ofthe area.
PROGRAM AND ENFORCEMENT 947
2. Cooperate with other community planners in allocating land uses.3. Design remedial measures calculated to bring about the air quality de-
sired. Such measures might include several or all of the following: lim-itations on pollutant emissions, variable emission limits for certainweather conditions and predictions, special emission limits for certainareas, time schedules for commencing certain control actions, controlof fuel composition, control of future sources by requiring plan ap-provals, prohibition of certain plan approvals, prohibition of certain ac-tivities or requirements for certain types of control equipment, andperformance standards for new land uses.
4. Outline needs for future studies pertaining to air quality and pollutantemissions and design systems for collection, storage, and retrieval ofthe resultant data.
5. Establish priorities among program elements and set dates for imple-mentation.
6. Prepare specific recommendations as to administrative organizationneeded to implement the program, desirable legislative changes, rela-tionships with other agencies and programs in the area and adjoiningareas and at higher governmental levels, and funds, facilities, and staffrequired.
As in most studies, a continual program of education and public infor-mation supplemented by periodic updating is necessary. People must learnthat air pollution can be a serious hazard and must be motivated to supportthe need for its control. In addition, surveys and studies must be kept current;otherwise, the air resources management activities may be based on false oroutdated premises.
International treaties, interstate compacts or agreements, and regional or-ganizations are sometimes also needed to resolve air pollution problems thatcross jurisdictional boundaries. This becomes more important as industriali-zation increases and as people become more concerned about the quality oftheir environment.
It becomes apparent that the various levels of government each have im-portant complementary and cooperative roles to play in air pollution control.
The federal government role includes research into the causes and effectsof air pollution as well as the control of international and interstate air pol-lution on behalf of the affected parties. It should also have responsibility fora national air-sampling network, training, preparation of manuals and dissem-ination of information, and assisting state and local governments. In theUnited States, this is done primarily through the EPA. Other federal agenciesmaking major contributions are the U.S. Weather Service; the Nuclear Reg-ulatory Commission, in relation to the effects of radioactivity; the Departmentof Agriculture, in relation to the effects of air pollution on livestock and crops;
948 AIR POLLUTION AND NOISE CONTROL
the Department of Interior; the Department of Commerce, including the Na-tional Bureau of Standards; and the Civil Aeronautics Administration.
The state role is similar to the federal role. It would include, in addition,the setting of statewide standards and establishment of a sampling network,the authority to declare emergencies and possession of appropriate powersduring emergencies, the delegation of powers to local agencies for controlprograms, and the conducting of surveys, demonstration projects, public hear-ings, and special investigations.
The role of local government is that delegated to it by the state and couldinclude complete program implementation and enforcement.
Organization and Staffing
Organization and staffing will vary with the level of government, the legislatedresponsibility, funds provided, government commitment, extent of the air pol-lution, and other factors. Generally, air pollution programs are organized andstaffed on the state, county, large-city, and federal levels. In some instances,limited programs of smoke and nuisance abatement are carried out in smallcities, towns, and villages as part of a health, building, or fire departmentprogram. Because of the complexities involved, competent direction, staff,and laboratory support are needed to carry out an effective and comprehensiveprogram. A small community usually cannot afford and, in fact, might nothave need for a full staff, but it could play a needed supporting role to thecounty and state programs. In this way, uniform policy guidance and technicalsupport could be provided and local on-the-spot assistance utilized. The localgovernment should be assigned all the responsibilities it is capable of handlingeffectively.
An organization chart for an air resources management agency is shownin Figure 6-11. There are many variations.
Regulation and Administration
A combination of methods and techniques is generally used to prevent andcontrol air pollution after a program is developed, air quality objectives es-tablished, and problem areas defined. These include
1. public information and education;2. source registration;3. plan review and construction operation approval;4. emission standards;5. monitoring and surveillance;6. technical assistance and training;7. inspection and compliance follow-up;
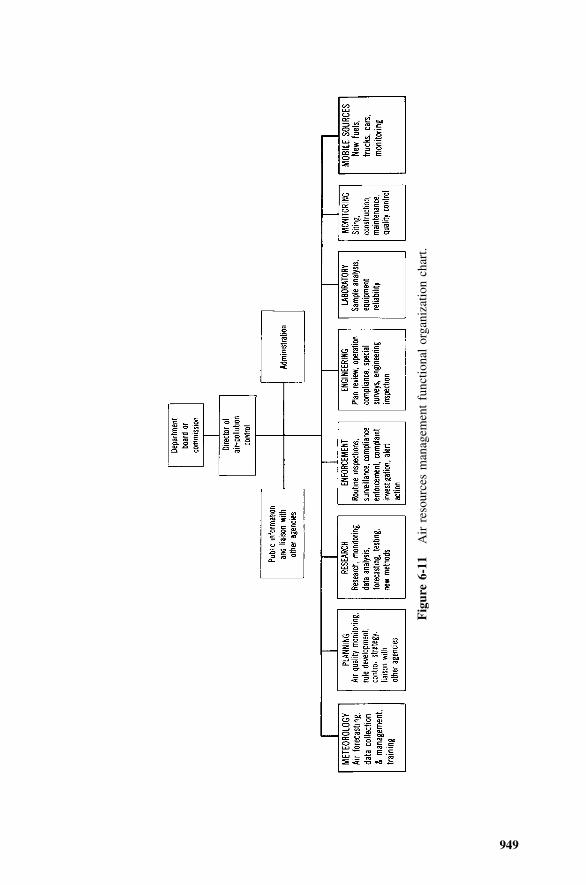
949
Fig
ure
6-11
Air
reso
urce
sm
anag
emen
tfu
nctio
nal
orga
niza
tion
char
t.
950 AIR POLLUTION AND NOISE CONTROL
8. conference, persuasion, and administrative hearing;9. rescinding or suspension of operation permit; and
10. legal action—fine, imprisonment, misdemeanor, injunction.
Effective administration requires the development and retention of com-petent staff and the assignment of responsibilities. In a small community, theresponsibilities would probably be limited to source location and surveillance,data collection, smoke and other visible particulate detection, complaint in-vestigation, and abatement as an arm of a county, regional, or state enforce-ment unit.
Regulatory agencies usually develop their own procedures, forms, and tech-niques to carry out the functions listed above. Staffing, in addition to thedirector of air pollution control, may include one or more of the following:engineers, scientists, sanitarians, chemists, toxicologists, epidemiologists,public information specialists, technicians, inspectors, attorneys, administra-tive assistants, statisticians, meteorologists, electronic data processing spe-cialists, and personnel in supporting services.
Detailed information on inspection and enforcement is given in the liter-ature. Air Pollution Field Operations Manual Additional information is alsogiven in Chapter 12 of the fourth edition.
Important in regulation is the development of working relationships andmemoranda of agreements with various public and private agencies. For in-stance, government construction, equipment, and vehicles could set examplesof air pollution prevention. The building department would ensure that newincinerators and heating plants have the proper air pollution control equip-ment. The police would enforce vehicular air pollution control requirements.The fire department would carry out fire prevention and perhaps boiler in-spections. The planning and zoning boards would rely on the director of airpollution control and the director’s staff for technical support, guidance, andtestimony at hearings. Equipment manufacturers would agree to sell onlymachinery, equipment, and devices that complied with the emission standards.The education department would incorporate air pollution prevention and con-trol in its environmental health curriculum. Industry, realty, and chain-storemanagement would agree to abide by the rules and police itself. Cooperativetraining and education programs would be provided for personnel responsiblefor operating boilers, equipment, and other facilities that may contribute toair pollution. These are but a few examples. With ingenuity, many more vol-untary arrangements can be devised to make regulation more acceptable andeffective.
NOISE CONTROL
One of the most important tasks of architects, builders, acoustic engineers,urban planners, industrial hygiene engineers, equipment manufacturers, and

NOISE CONTROL 951
Figure 6-12 Pure tone, sine wave.
public health personnel is to ensure that noise and vibration are kept to anacceptable level in the general environment, in the workplace, and insidedwellings. Noise is of special concern in occupational health where hearingloss has been documented.
The discussion that follows will touch upon some of the fundamentals ofnoise and its effects, measurement, reduction, and control. Special problemsshould involve experts such as acoustical consultants.
Definitions and Explanation of Selected Terms and Properties of Sound
Sound Sound, and therefore all noise, is physically a rapid alteration of airpressure above and below atmospheric pressure. Basically, all sounds travelas sound pressure waves from a vibrating body such as a human larynx, radio,TV, record player speaker, or vibrating machine.
A sound that contains only one frequency is a pure tone, which is expressedin Figure 6-12 as a sine curve. Most sounds contain many frequencies. Ingeneral, the waves travel outward from the source in three dimensions. Thepitch of a sound is determined primarily by frequency: vibrations per second.The amplitude or magnitude of sound is the sound pressure.
The distance that a sound wave travels in one cycle or period is the wave-length of the sound. This is illustrated in Figure 6-12. Wavelength is givenby the equation
c� �
ƒ
where � � wavelength, ftƒ � frequency, Hz (cycles/sec)c � speed of sound, ft /sec
Sound travels through gases, liquids, and solids but not through a vacuum.The speed with which sound travels through a particular medium is dependent
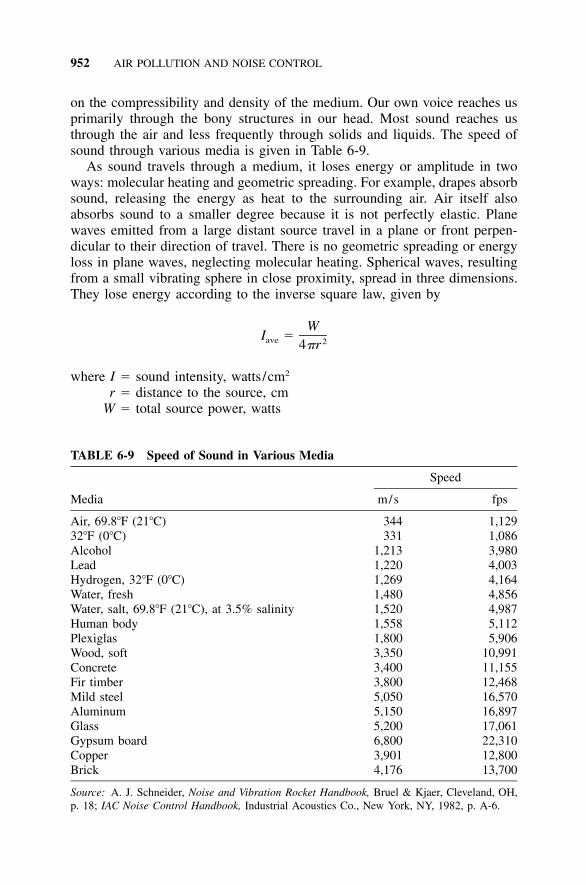
952 AIR POLLUTION AND NOISE CONTROL
TABLE 6-9 Speed of Sound in Various Media
Media
Speed
m/s fps
Air, 69.8�F (21�C) 344 1,12932�F (0�C) 331 1,086Alcohol 1,213 3,980Lead 1,220 4,003Hydrogen, 32�F (0�C) 1,269 4,164Water, fresh 1,480 4,856Water, salt, 69.8�F (21�C), at 3.5% salinity 1,520 4,987Human body 1,558 5,112Plexiglas 1,800 5,906Wood, soft 3,350 10,991Concrete 3,400 11,155Fir timber 3,800 12,468Mild steel 5,050 16,570Aluminum 5,150 16,897Glass 5,200 17,061Gypsum board 6,800 22,310Copper 3,901 12,800Brick 4,176 13,700
Source: A. J. Schneider, Noise and Vibration Rocket Handbook, Bruel & Kjaer, Cleveland, OH,p. 18; IAC Noise Control Handbook, Industrial Acoustics Co., New York, NY, 1982, p. A-6.
on the compressibility and density of the medium. Our own voice reaches usprimarily through the bony structures in our head. Most sound reaches usthrough the air and less frequently through solids and liquids. The speed ofsound through various media is given in Table 6-9.
As sound travels through a medium, it loses energy or amplitude in twoways: molecular heating and geometric spreading. For example, drapes absorbsound, releasing the energy as heat to the surrounding air. Air itself alsoabsorbs sound to a smaller degree because it is not perfectly elastic. Planewaves emitted from a large distant source travel in a plane or front perpen-dicular to their direction of travel. There is no geometric spreading or energyloss in plane waves, neglecting molecular heating. Spherical waves, resultingfrom a small vibrating sphere in close proximity, spread in three dimensions.They lose energy according to the inverse square law, given by
WI �ave 24�r
where I � sound intensity, watts/cm2
r � distance to the source, cmW � total source power, watts
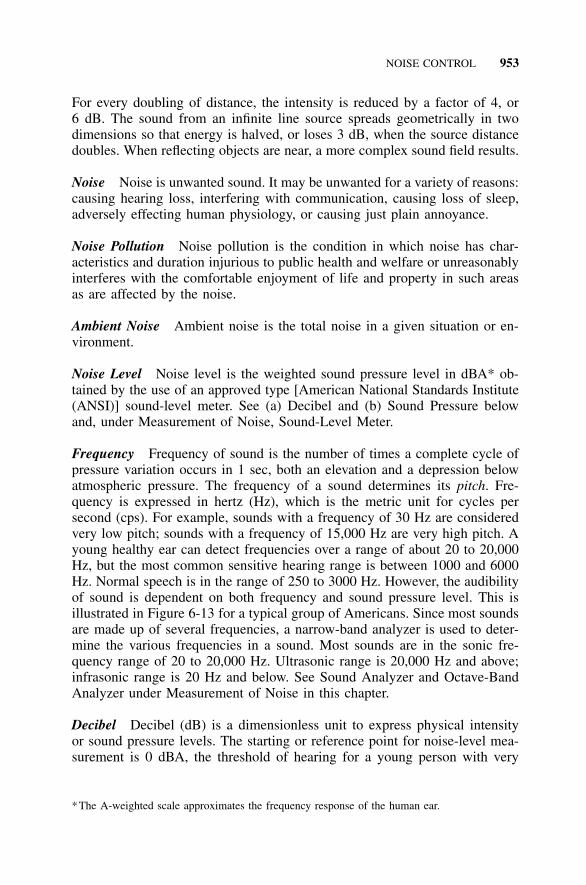
NOISE CONTROL 953
For every doubling of distance, the intensity is reduced by a factor of 4, or6 dB. The sound from an infinite line source spreads geometrically in twodimensions so that energy is halved, or loses 3 dB, when the source distancedoubles. When reflecting objects are near, a more complex sound field results.
Noise Noise is unwanted sound. It may be unwanted for a variety of reasons:causing hearing loss, interfering with communication, causing loss of sleep,adversely effecting human physiology, or causing just plain annoyance.
Noise Pollution Noise pollution is the condition in which noise has char-acteristics and duration injurious to public health and welfare or unreasonablyinterferes with the comfortable enjoyment of life and property in such areasas are affected by the noise.
Ambient Noise Ambient noise is the total noise in a given situation or en-vironment.
Noise Level Noise level is the weighted sound pressure level in dBA* ob-tained by the use of an approved type [American National Standards Institute(ANSI)] sound-level meter. See (a) Decibel and (b) Sound Pressure belowand, under Measurement of Noise, Sound-Level Meter.
Frequency Frequency of sound is the number of times a complete cycle ofpressure variation occurs in 1 sec, both an elevation and a depression belowatmospheric pressure. The frequency of a sound determines its pitch. Fre-quency is expressed in hertz (Hz), which is the metric unit for cycles persecond (cps). For example, sounds with a frequency of 30 Hz are consideredvery low pitch; sounds with a frequency of 15,000 Hz are very high pitch. Ayoung healthy ear can detect frequencies over a range of about 20 to 20,000Hz, but the most common sensitive hearing range is between 1000 and 6000Hz. Normal speech is in the range of 250 to 3000 Hz. However, the audibilityof sound is dependent on both frequency and sound pressure level. This isillustrated in Figure 6-13 for a typical group of Americans. Since most soundsare made up of several frequencies, a narrow-band analyzer is used to deter-mine the various frequencies in a sound. Most sounds are in the sonic fre-quency range of 20 to 20,000 Hz. Ultrasonic range is 20,000 Hz and above;infrasonic range is 20 Hz and below. See Sound Analyzer and Octave-BandAnalyzer under Measurement of Noise in this chapter.
Decibel Decibel (dB) is a dimensionless unit to express physical intensityor sound pressure levels. The starting or reference point for noise-level mea-surement is 0 dBA, the threshold of hearing for a young person with very
*The A-weighted scale approximates the frequency response of the human ear.
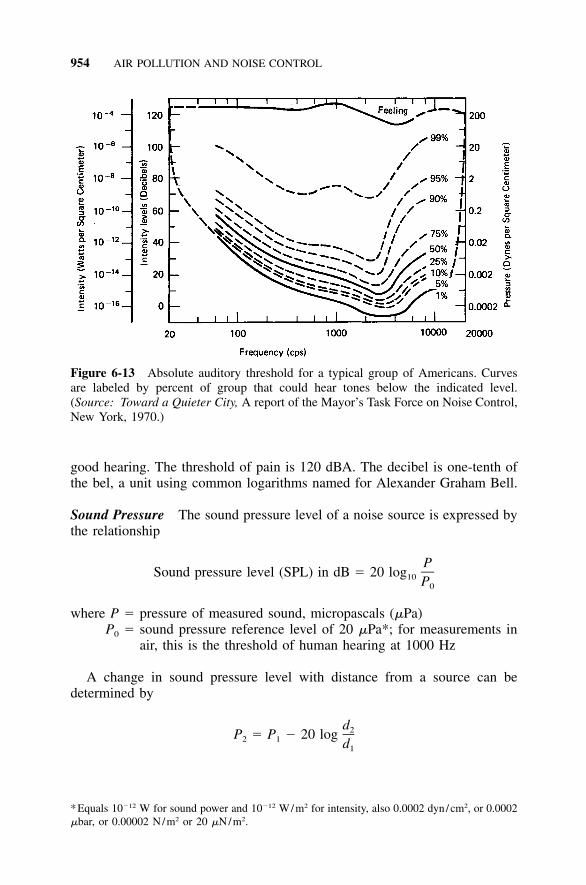
954 AIR POLLUTION AND NOISE CONTROL
Figure 6-13 Absolute auditory threshold for a typical group of Americans. Curvesare labeled by percent of group that could hear tones below the indicated level.(Source: Toward a Quieter City, A report of the Mayor’s Task Force on Noise Control,New York, 1970.)
good hearing. The threshold of pain is 120 dBA. The decibel is one-tenth ofthe bel, a unit using common logarithms named for Alexander Graham Bell.
Sound Pressure The sound pressure level of a noise source is expressed bythe relationship
PSound pressure level (SPL) in dB � 20 log10 P0
where P � pressure of measured sound, micropascals (�Pa)P0 � sound pressure reference level of 20 �Pa*; for measurements in
air, this is the threshold of human hearing at 1000 Hz
A change in sound pressure level with distance from a source can bedetermined by
d2P � P � 20 log2 1 d1
*Equals 10�12 W for sound power and 10�12 W/m2 for intensity, also 0.0002 dyn /cm2, or 0.0002�bar, or 0.00002 N/m2 or 20 �N/m2.

NOISE CONTROL 955
TABLE 6-10 Sound Pressures for Selected Decibel Values
Sound Pressurea
�bar �PaSound Pressure Level
(dB)b
0.0002 20 0c
0.00063 63 100.002 200 200.0063 630 300.02 2,000 400.063 6,300 500.2 20,000 600.63 63,000 701.0 100,000 742.0 200,000 806.3 630,000 90
20 2,000,000 10063 6,300,000 110
200 20,000,000 1202,000 200,000,000 140
a 0.0002 microbars (�bar) for sound pressure in air � 20 �Pa � 0.00002N/m2 (20 �N/m2) � 2.9 � 10�9 psi � 0.0002 dyn/cm2.b Relative to 20 �Pa or 0.0002 �bar � standard reference value.c 0 dB � 2.9 � 10�9 psi � 1016 W/cm2 � 10�12 W/m2 for sound intensity� threshold of human hearing.
where P1 � sound pressure level at location 1, dBP2 � sound pressure level at location 2, dBd1 � distance from noise source to location 1d2 � distance from noise source to location 2
The sound pressure level is measured by a standard sound-level meter. Themeter has built into it electrical characteristics or weighting that simulates theway the ear actually hear sound.
Pascal (Pa) is a unit of pressure corresponding to a force of 1 N actinguniformly upon an area of 1 m2; 1 Pa � 1 N/m2.
Newton (N) is the force required to accelerate 1 kg mass at 1 m/s2. It isapproximately equal to the gravitational force on a 100g mass. The A-weighting, which simulates the frequency bias of the human ear, is mostcommonly used in measurements regarding impact on humans and the soundlevels are read in dBA. The B, C, and D scales are normally used only forspecial occasions. For example, the D scale is used to measure and comparethe effect of airplane noise on the human ear. The C scale is used for veryloud sounds and the B scale for moderately loud sounds. See Sound-LevelMeter under Measurement of Noise for further discussion.
Table 6-10 shows the calculated sound pressure levels in decibels for se-lected sound pressure values.
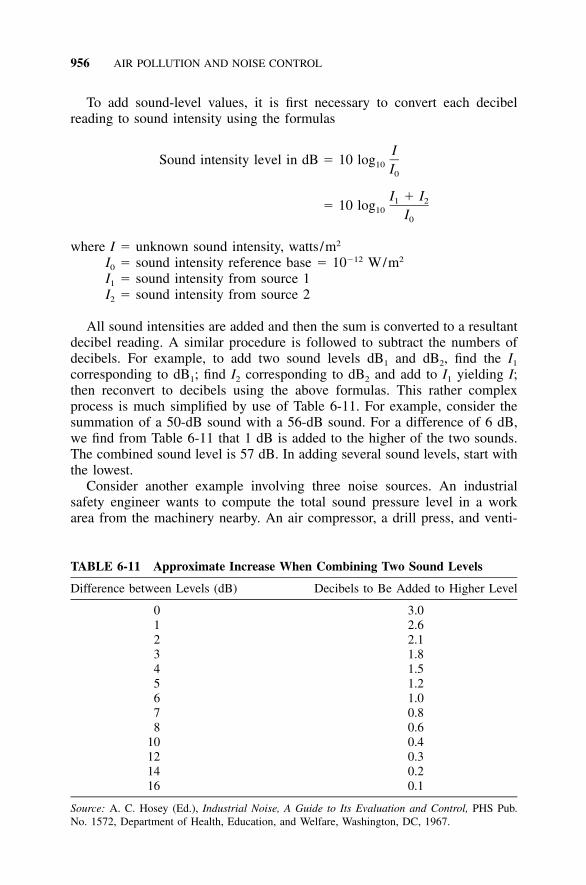
956 AIR POLLUTION AND NOISE CONTROL
TABLE 6-11 Approximate Increase When Combining Two Sound Levels
Difference between Levels (dB) Decibels to Be Added to Higher Level
0 3.01 2.62 2.13 1.84 1.55 1.26 1.07 0.88 0.6
10 0.412 0.314 0.216 0.1
Source: A. C. Hosey (Ed.), Industrial Noise, A Guide to Its Evaluation and Control, PHS Pub.No. 1572, Department of Health, Education, and Welfare, Washington, DC, 1967.
To add sound-level values, it is first necessary to convert each decibelreading to sound intensity using the formulas
ISound intensity level in dB � 10 log10 I0
I � I1 2� 10 log10 I0
where I � unknown sound intensity, watts/m2
I0 � sound intensity reference base � 10�12 W/m2
I1 � sound intensity from source 1I2 � sound intensity from source 2
All sound intensities are added and then the sum is converted to a resultantdecibel reading. A similar procedure is followed to subtract the numbers ofdecibels. For example, to add two sound levels dB1 and dB2, find the I1
corresponding to dB1; find I2 corresponding to dB2 and add to I1 yielding I;then reconvert to decibels using the above formulas. This rather complexprocess is much simplified by use of Table 6-11. For example, consider thesummation of a 50-dB sound with a 56-dB sound. For a difference of 6 dB,we find from Table 6-11 that 1 dB is added to the higher of the two sounds.The combined sound level is 57 dB. In adding several sound levels, start withthe lowest.
Consider another example involving three noise sources. An industrialsafety engineer wants to compute the total sound pressure level in a workarea from the machinery nearby. An air compressor, a drill press, and venti-
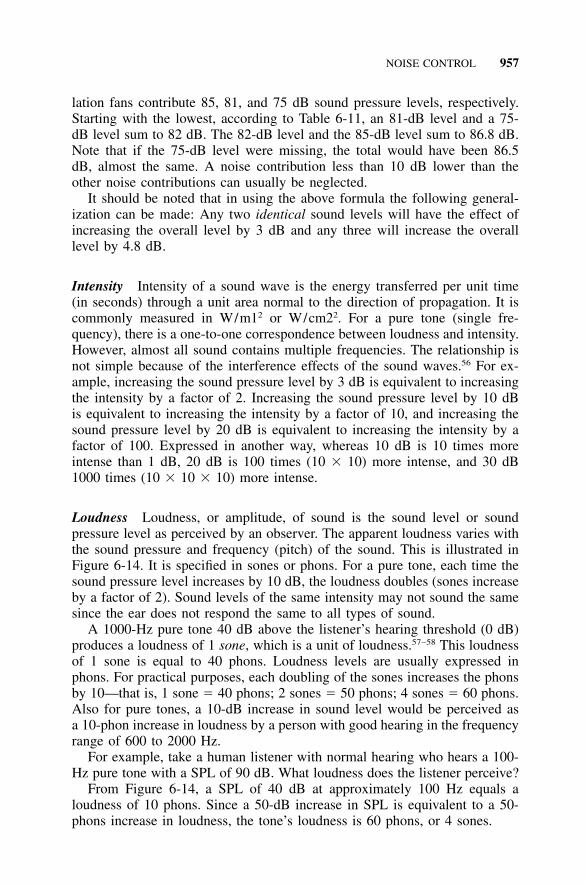
NOISE CONTROL 957
lation fans contribute 85, 81, and 75 dB sound pressure levels, respectively.Starting with the lowest, according to Table 6-11, an 81-dB level and a 75-dB level sum to 82 dB. The 82-dB level and the 85-dB level sum to 86.8 dB.Note that if the 75-dB level were missing, the total would have been 86.5dB, almost the same. A noise contribution less than 10 dB lower than theother noise contributions can usually be neglected.
It should be noted that in using the above formula the following general-ization can be made: Any two identical sound levels will have the effect ofincreasing the overall level by 3 dB and any three will increase the overalllevel by 4.8 dB.
Intensity Intensity of a sound wave is the energy transferred per unit time(in seconds) through a unit area normal to the direction of propagation. It iscommonly measured in W/m12 or W/cm22. For a pure tone (single fre-quency), there is a one-to-one correspondence between loudness and intensity.However, almost all sound contains multiple frequencies. The relationship isnot simple because of the interference effects of the sound waves.56 For ex-ample, increasing the sound pressure level by 3 dB is equivalent to increasingthe intensity by a factor of 2. Increasing the sound pressure level by 10 dBis equivalent to increasing the intensity by a factor of 10, and increasing thesound pressure level by 20 dB is equivalent to increasing the intensity by afactor of 100. Expressed in another way, whereas 10 dB is 10 times moreintense than 1 dB, 20 dB is 100 times (10 � 10) more intense, and 30 dB1000 times (10 � 10 � 10) more intense.
Loudness Loudness, or amplitude, of sound is the sound level or soundpressure level as perceived by an observer. The apparent loudness varies withthe sound pressure and frequency (pitch) of the sound. This is illustrated inFigure 6-14. It is specified in sones or phons. For a pure tone, each time thesound pressure level increases by 10 dB, the loudness doubles (sones increaseby a factor of 2). Sound levels of the same intensity may not sound the samesince the ear does not respond the same to all types of sound.
A 1000-Hz pure tone 40 dB above the listener’s hearing threshold (0 dB)produces a loudness of 1 sone, which is a unit of loudness.57–58 This loudnessof 1 sone is equal to 40 phons. Loudness levels are usually expressed inphons. For practical purposes, each doubling of the sones increases the phonsby 10—that is, 1 sone � 40 phons; 2 sones � 50 phons; 4 sones � 60 phons.Also for pure tones, a 10-dB increase in sound level would be perceived asa 10-phon increase in loudness by a person with good hearing in the frequencyrange of 600 to 2000 Hz.
For example, take a human listener with normal hearing who hears a 100-Hz pure tone with a SPL of 90 dB. What loudness does the listener perceive?
From Figure 6-14, a SPL of 40 dB at approximately 100 Hz equals aloudness of 10 phons. Since a 50-dB increase in SPL is equivalent to a 50-phons increase in loudness, the tone’s loudness is 60 phons, or 4 sones.
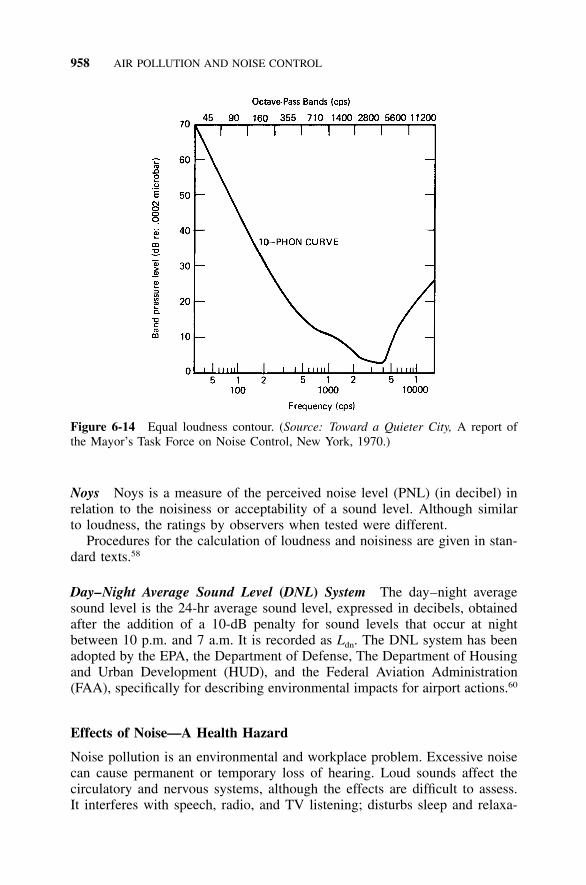
958 AIR POLLUTION AND NOISE CONTROL
Figure 6-14 Equal loudness contour. (Source: Toward a Quieter City, A report ofthe Mayor’s Task Force on Noise Control, New York, 1970.)
Noys Noys is a measure of the perceived noise level (PNL) (in decibel) inrelation to the noisiness or acceptability of a sound level. Although similarto loudness, the ratings by observers when tested were different.
Procedures for the calculation of loudness and noisiness are given in stan-dard texts.58
Day–Night Average Sound Level (DNL) System The day–night averagesound level is the 24-hr average sound level, expressed in decibels, obtainedafter the addition of a 10-dB penalty for sound levels that occur at nightbetween 10 p.m. and 7 a.m. It is recorded as Ldn. The DNL system has beenadopted by the EPA, the Department of Defense, The Department of Housingand Urban Development (HUD), and the Federal Aviation Administration(FAA), specifically for describing environmental impacts for airport actions.60
Effects of Noise—A Health Hazard
Noise pollution is an environmental and workplace problem. Excessive noisecan cause permanent or temporary loss of hearing. Loud sounds affect thecirculatory and nervous systems, although the effects are difficult to assess.It interferes with speech, radio, and TV listening; disturbs sleep and relaxa-
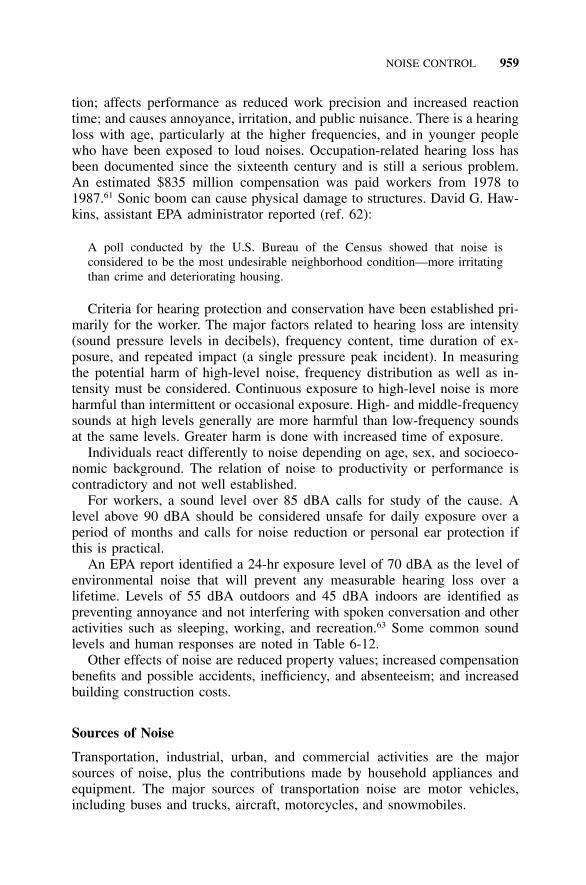
NOISE CONTROL 959
tion; affects performance as reduced work precision and increased reactiontime; and causes annoyance, irritation, and public nuisance. There is a hearingloss with age, particularly at the higher frequencies, and in younger peoplewho have been exposed to loud noises. Occupation-related hearing loss hasbeen documented since the sixteenth century and is still a serious problem.An estimated $835 million compensation was paid workers from 1978 to1987.61 Sonic boom can cause physical damage to structures. David G. Haw-kins, assistant EPA administrator reported (ref. 62):
A poll conducted by the U.S. Bureau of the Census showed that noise isconsidered to be the most undesirable neighborhood condition—more irritatingthan crime and deteriorating housing.
Criteria for hearing protection and conservation have been established pri-marily for the worker. The major factors related to hearing loss are intensity(sound pressure levels in decibels), frequency content, time duration of ex-posure, and repeated impact (a single pressure peak incident). In measuringthe potential harm of high-level noise, frequency distribution as well as in-tensity must be considered. Continuous exposure to high-level noise is moreharmful than intermittent or occasional exposure. High- and middle-frequencysounds at high levels generally are more harmful than low-frequency soundsat the same levels. Greater harm is done with increased time of exposure.
Individuals react differently to noise depending on age, sex, and socioeco-nomic background. The relation of noise to productivity or performance iscontradictory and not well established.
For workers, a sound level over 85 dBA calls for study of the cause. Alevel above 90 dBA should be considered unsafe for daily exposure over aperiod of months and calls for noise reduction or personal ear protection ifthis is practical.
An EPA report identified a 24-hr exposure level of 70 dBA as the level ofenvironmental noise that will prevent any measurable hearing loss over alifetime. Levels of 55 dBA outdoors and 45 dBA indoors are identified aspreventing annoyance and not interfering with spoken conversation and otheractivities such as sleeping, working, and recreation.63 Some common soundlevels and human responses are noted in Table 6-12.
Other effects of noise are reduced property values; increased compensationbenefits and possible accidents, inefficiency, and absenteeism; and increasedbuilding construction costs.
Sources of Noise
Transportation, industrial, urban, and commercial activities are the majorsources of noise, plus the contributions made by household appliances andequipment. The major sources of transportation noise are motor vehicles,including buses and trucks, aircraft, motorcycles, and snowmobiles.

960 AIR POLLUTION AND NOISE CONTROL
TABLE 6-12 Sound Levels and Human Response
Sources Noise Level (dBA) Response
Carrier deck, jet operation 140 Painfully loudLive rock music 130 Limits amplified speechJet takeoff (200 ft) 120 Maximum vocal effectDiscotheque 115Rock band (10 ft) 115Auto horn (3 ft) loud 110Riveting machine 110Jet takeoff (2000 ft) 110Garbage truck, snowmobile 100Power lawn mower (operator) 95New York subway station 90 Very annoyingHeavy truck (50 ft) 90 Hearing damage (8 hr)Food blender 90Pneumatic drill (50 ft) 85Diesel truck, 40 mph (50 ft) 85Dishwasher 80Alarm clock 80 AnnoyingGarbage collection 80Freeway traffic (50 ft) 70 Telephone use difficultVacuum cleaner 70Normal speech 60Air-conditioning unit (20 ft) 60 IntrusiveLight auto traffic (100 ft) 50 QuietLiving room 40 QuietBedroom 40Public library 35Soft whisper (15 ft) 30 Very quietBroadcasting studio 20Breathing 10 Just audible
0 Threshold of hearing
Sources: Sound Levels and Human Responses, Office of Planning Management, U.S. Environ-mental Protection Agency, Washington, DC, July 1973; MMWR, March 1986, p. 185.
Industrial, urban, and commercial noises emanate from factories, equip-ment serving commercial establishments, and construction activities. Con-struction equipment sources are power tools, air compressors, earthmovers,dump trucks, garbage collection trucks, diesel cranes, pneumatic drills, andchain saws. Compactor trucks manufactured after October 1, 1980 may notexceed a noise level of 79 decibels and may not exceed 76 decibels after July1, 1982 measured on the A-weighted scale 7 m from the front, side, and rearof the vehicle while empty and operating.
Residential noise is associated with dishwashers, garbage disposal units,air conditioners, power lawn mowers, and home music amplifier units.
NOISE CONTROL 961
Measurement of Noise
Noise measurement equipment selection is dependent upon the task to beperformed. For an initial survey, a sound-level meter is adequate for a rapidevaluation and identification of potential problem areas. To study and alsodetermine the characteristics of a noise problem area, a sound-level meter,frequency analyzer, and recorder are needed to determine sound pressure dis-tribution with frequency and time. More sophisticated equipment would beneeded for research or solution of special noise problems.
Sound-Level Meter A sound-level meter is used to measure the sound pres-sure level; it is the basic instrument for noise measurement.
Meters are available to cover the range of 20 to 180 dB. The specificationsusually refer to the American National Standards Institute (ANSI) and partic-ularly to the standard Specification for Sound Level Meters, ANSI S1.4-1971.Three weighting networks, A, B, and C, are provided to give a number thatbest approximates the total loudness level for a particular situation, with con-sideration of the sound frequency, intensity, and impact levels. There are threetypes of meters. Type I is highest quality; type III is lowest quality and notsuitable for public health professionals. Type II is the most common typeused by public health officials. Most noise laws and regulations permit eithertype I or II but not type III meters.
The B and C networks are no longer normally used. The A-weighted scaleis most commonly used. It discriminates against frequencies below 500 Hzand most nearly encompasses the most sensitive hearing range of sound, thatis, 1000 to 6000 Hz. The symbol dBA is used to designate the A-weighteddecibel scale, which combines both frequency and pressure levels; it measuresenvironmental noise and should be supplemented by the time or duration todetermine the total quantity of sound affecting people. The sound level meterprovides the total quantity of sound affecting people. The sound-level meterprovides settings for ‘‘F’’ (fast time response) and ‘‘S’’ (slow time response).
The most important part of the equipment is a calibrator that generates aknown decibel standard. Without a calibration before and after a measure-ment, the measurement is suspect.
Noise Dosimeter The noise dosimeter will measure the amount of poten-tially injurious noise to which an individual is exposed over a period of time.A dosimeter can be set to the desired level and will then total the exposuretime to noise above the set level. The noise dosimeter does not, however,identify noise sources. Therefore, if a study is being conducted to determinenoise exposure and culpability, it is imperative that the dosimeter be coupledwith a frequency analyzer or better still with a human observer to recordnoise source identities.
962 AIR POLLUTION AND NOISE CONTROL
Sound Analyzer A frequency analyzer may be necessary to measure com-plex sound and sound pressure according to frequency distribution. It willsupplement readings obtained with a sound-level meter. Noise analyzers coverdifferent frequency bands. The octave-band analyzer is the most common.The impact noise analyzer is used to measure the peak level and duration ofimpact noise. Examples of impact noises are drop hammer machines and gunfire.
Cathode-Ray Oscillograph This makes possible observing the wave formof a noise and pattern. The magnetic tape recorder makes possible the col-lection of noise information in the field and subsequent analysis of the datain the office or laboratory. Environmental noise monitors are now availablethat can be located in a community and will retain noise levels in a memory.
Octave-Band Analyzer This has filters that usually divide a noise into eightpossible frequency categories. Each category is called an octave band, withfrequency ranges of 45 to 90, 90 to 180, 180 to 355, 355 to 710, 710 to 1400,1400 to 2800, 2800 to 5600, and 5600 to 11,200 Hz (or cps). The bands areidentified by their center or midfrequencies: 63, 125, 250, 500, 1000, 2000,4000, and 8000 Hz. With center-frequency bands at 31.5 and 16,000 Hz, theaudible frequency range of 20 to 20,000 Hz is then covered with 10 octavebands.
Background Noise Background noise is noise in the absence of the soundbeing measured that may contribute to and obscure the sound being measured.A rough correction could be made by applying the correction factors givenin Table 6-13. However, such subtractions typically introduce significant errorin the final result. The message to be obtained from Table 6-13 is that thebackground noise should be at least 10 dB lower than the noise being mea-sured. This will introduce negligible error (less than 0.5 dB) due to interferingbackground.
Methods for Noise Control
Noise can be controlled at the source, in its path of transmission (through asolid, air, or liquid), or where it is received. Sometimes, because no onemethod is sufficiently effective, controls are instituted at two or at all threesteps in the path of noise travel from the source to the receptor. In general,it is best to reduce the noise at the source. This should include establishmentof clear, reasonable, and enforceable noise design objectives for manufactur-ers and installers.
Noise control generally involves adoption and effective enforcement ofreasonable and workable regulations; protection of workers from hazardous
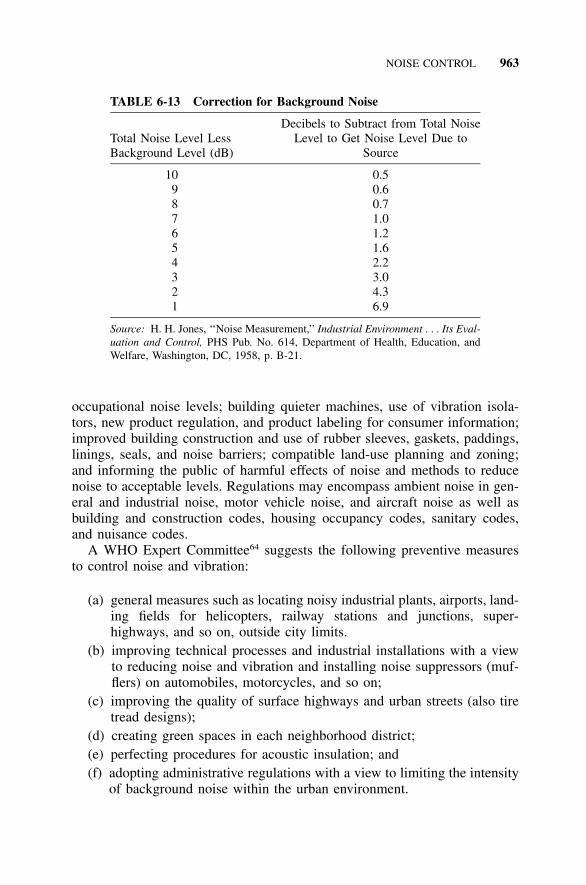
NOISE CONTROL 963
TABLE 6-13 Correction for Background Noise
Total Noise Level LessBackground Level (dB)
Decibels to Subtract from Total NoiseLevel to Get Noise Level Due to
Source
10 0.59 0.68 0.77 1.06 1.25 1.64 2.23 3.02 4.31 6.9
Source: H. H. Jones, ‘‘Noise Measurement,’’ Industrial Environment . . . Its Eval-uation and Control, PHS Pub. No. 614, Department of Health, Education, andWelfare, Washington, DC, 1958, p. B-21.
occupational noise levels; building quieter machines, use of vibration isola-tors, new product regulation, and product labeling for consumer information;improved building construction and use of rubber sleeves, gaskets, paddings,linings, seals, and noise barriers; compatible land-use planning and zoning;and informing the public of harmful effects of noise and methods to reducenoise to acceptable levels. Regulations may encompass ambient noise in gen-eral and industrial noise, motor vehicle noise, and aircraft noise as well asbuilding and construction codes, housing occupancy codes, sanitary codes,and nuisance codes.
A WHO Expert Committee64 suggests the following preventive measuresto control noise and vibration:
(a) general measures such as locating noisy industrial plants, airports, land-ing fields for helicopters, railway stations and junctions, super-highways, and so on, outside city limits.
(b) improving technical processes and industrial installations with a viewto reducing noise and vibration and installing noise suppressors (muf-flers) on automobiles, motorcycles, and so on;
(c) improving the quality of surface highways and urban streets (also tiretread designs);
(d) creating green spaces in each neighborhood district;(e) perfecting procedures for acoustic insulation; and(f) adopting administrative regulations with a view to limiting the intensity
of background noise within the urban environment.
964 AIR POLLUTION AND NOISE CONTROL
The committee recommends close international collaboration and close co-operation between metropolitan planners and environmental health personnelto reduce noise and vibration to a minimum.
Control of Industrial Noise
Noise control should start in the planning of a new plant or when planningto modernize an existing plant. Consideration should be given at that time tominimizing the effects of noise on the workers, office personnel, and nearbyresidents. The control of an existing noise problem first requires suitable noisestandards and an identification of the location, extent, and type of noisesources. This would be followed by the application of needed noise controlmeasures to achieve the required or desired levels.
Factors to be taken into consideration in industrial noise control are asfollows65–67:
1. Selection of building site that is isolated or an area where there is ahigh background noise level. Topography and prevailing winds shouldbe considered, as well as the use of landscaping and embankments, toreduce the noise travel where it may cause a nuisance.
2. Building layout to separate and isolate noisy operations from quiet ar-eas.
3. Substitution of low-noise-level processes for noisy operations, such aswelding instead of riveting, metal pressing instead of rolling or forging,compression riveting instead of pneumatic riveting, and belt drives inplace of gears.
4. Selection of new equipment with the lowest possible noise level (alsomodification of existing equipment with better mufflers).
5. Reduction of noise at its source through maintenance of machinery,covers and safety shields, and replacement of worn parts; reduction ofdriving forces; reduction of response of vibrating surfaces; intake anddischarge sound attenuation and flexible connections or collars; use oftotal or partial enclosures, with sound-absorbing materials (also coatingsor sound-absorbing materials on metals to dampen vibration noise); andisolation of vibration and its transmission. See (a) Noise Control and(b) Noise Reduction, this chapter.
6. Use of acoustic absorption materials to prevent noise reflections.7. Control of noise in ventilation ducts or conveyor systems.8. Use of personnel shelters.
Sometimes the only practical and economical method of noise control isthrough the use of personal protective devices. These may also be a supple-
NOISE CONTROL 965
ment to the applied engineering, worker, and education controls. Personal earprotector types include properly fitted and sized earplugs, earmuffs, and hel-mets providing a good seal around the ear. They should meet establishedcriteria for comfort, tension, sound attenuation (at least 15 dBA), simplicity,durability, and so on. To be effective, however, the worker must cooperate bywearing the protective device where needed. Dry cotton plugs do not providesignificant sound attenuation.
Control of Transport Noise
Noise from various forms of transport and its transmission into the home maybe reduced as follows68:
1. at the source, that is, by controlling the emission of noise;2. by means of town and country planning and traffic engineering, that is,
by controlling the transmission of noise; and3. in the home, that is, by controlling the reception of noise by the oc-
cupants.
Some specific measures to reduce the effect of highway noise include thefollowing:
1. Enclosure of highways going through residential areas.2. Wider rights-of-way, that is, separation or buffer zone between the
source and the receptor.3. Walls designed to deflect or absorb noise (earth berms covered with
vegetation are more effective).69
4. Changes in highway alignment and grade to avoid sensitive areas, min-imizing stop-and-go traffic, and shifting to low gears.
5. Setting lower speed limits for certain sections of a highway.6. Adjacent barriers, nonresidential buildings in sound transmission path,
earth embankments or berms, and elevation or depression of highways.It is reported, however, that barriers provide little attenuation of low-frequency sounds and that a thick band of deciduous trees 200 to 300ft in width is relatively ineffective in cutting down traffic noises, reduc-ing them only on the order of 4 or 5 dB.70 Separation distance is mosteffective in reducing noise from highways.
7. Establishing alternate truck routes.8. Building codes requiring building insulation to limit interior transmis-
sion of noise. Additional measures are masonry walls, elimination ofwindows, use of double windows or glazing, soundproofing of ceilings,thick carpeting, overstuffed furniture, and heavy drapes.
966 AIR POLLUTION AND NOISE CONTROL
Noise Reduction
Sound Absorption The amount of sound energy a material can absorb (soakup) is a function of its absorption coefficient (�) at a specified frequency. Thesound absorption coefficient is the fractional part of the energy of an incidentsound wave that is absorbed by a material. A material with an absorptioncoefficient of 0.8 will absorb 80 percent of the incident sound energy. Amaterial that absorbs all incident energy, such as an open window, has anabsorption coefficient of 1. The sound absorption of a surface is measured insabins. A surface having an area of 100 ft2 made of material having an ab-sorption coefficient of 0.06 has an absorption of 6 sabin units (100 � 0.06).To determine the noise reduction in a room, the floor, walls, and ceilingsurface areas multiplied by the absorption coefficient of each surface, at agiven frequency, before and after treatment, must be added to obtain the totalroom surface absorption in sabin units.
The noise reduction (NR) in decibels at a given frequency of a surfacebefore and after treatment can be determined by
A2NR � 10 log10 A1
where A2 � total room surfaces absorption after treatment, sabinsA1 � total room surfaces absorption before treatment, sabins
Incremental noise reduction from a piece of machinery can be obtained bya rigid, sealed enclosure, plus vibration isolation of a machine from the floorusing spring mounts or absorbent mounts and pads, plus acoustical absorbingmaterial on the inside of the enclosure, plus mounting the enclosure on vi-bration isolators and enclosing, without contact, in another enclosure havinginside acoustical absorbing material. If machinery air cooling and air circu-lation are needed, provide baffled air intakes. Insert a flexible connector, if aphysical pipe or duct connection is needed between the machinery and otherbuilding piping or duct work, to reduce noise transmission.
However, sound energy can go around or through a particular material(around corners) or pass through openings (cracks, windows, ducts) andthereby nullify the sound absorption as well as transmission reduction efforts.For example, 1 in.2 of opening transmits as much sound as about 100 ft2 ofa 40-dB wall.71 This emphasizes the importance of sealing all cracks, pipeand conduit sleeves, electrical receptacles, or openings with nonsetting caulk-ing compound.
Sound absorptive materials include rugs, carpets with felt pads, heavydrapes, stuffed furniture, and ceiling and wall acoustical materials designedto absorb sound. These materials absorb high-frequency sounds much moreeffectively than low frequency. Sound absorptive materials are most effective
NOISE CONTROL 967
to the occupant when used in and near the areas of high-level noise. Thesematerials can control interior noise, sound reflection, and reverberation*; how-ever, noise easily passes through. Hard, smooth, impervious materials reflectsound. Some absorption coefficients at 1000 Hz are plate glass 0.03; brickwall 0.01 to 0.04; linoleum, asphalt, or rubber tile on concrete 0.03; smoothplaster on brick or hollow tile 0.03; -in. plywood paneling 0.09; felt-lined3–8carpet on concrete 0.69; velour (14 oz/yd2) 0.75; painted concrete block 0.07;and unpainted concrete block 0.29.
Sound Transmission Sound transmission loss (TL) is the ratio of the energypassing through a wall, floor, or ceiling to the energy striking it—that is, howeffective a material is in stopping the passage of sound. The sound transmis-sion varies with the frequency of the sound, the weight or mass, and thestiffness of the construction. Hence, any reduction of noise transmission fromoutside to inside a building is accomplished through control of the design,thickness, and weight of wall, floor, door, window, and ceiling materials.Improved design of building equipment and its installation, noise and vibra-tion isolation, and discontinuance or gaps in structural members are interiorfactors also to be considered. The transmission loss increases as the frequencyincreases. Hollow doors readily transmit sound; solid wood or solid core doorsdo not.
Mechanical equipment, household appliances, and other stationary sourcesof noise should be isolated from the floors or walls or on mountings by meansof rubber or similar resilient pads to absorb vibration and prevent or reducesound transmission to the structure, as noted above under Sound Absorption.Small-diameter pipe carrying water at high velocity causes noise to travellong distances. Air chambers on pipelines may also be needed to preventwater hammer.
Sound transmission class (STC) loss ratings for various types of materialsare given in decibels in design handbooks, texts, and standards such as theNational Bureau of Standards, Building Materials and Structures Report BMS144 for ‘‘Insulation of Wall and Floor Construction.’’ For example, 4-in. cin-der block weighing 25 lb/ft2 has an average approximate STC loss rating of25 dB; if the block is plastered on one side, its rating is 40 dB. A 4-in. brickwall weighing 40 lb/ft2 has a rating of approximately 45 dB. A 4-in. concreteslab with a resiliently suspended ceiling has a rating of 55 dB. A -in. ply-1–4wood sheet nailed to studs has an STC rating of 24 dB; -in. gypsum board1–2on studs has a rating of 32 dB. The frequency of the sound affects the soundtransmission loss. In general, the sound transmission loss rating increases withfrequency increase. Theoretically, transmission loss increases at the rate of 6dB per doubling of the weight of the construction. Some building codes rec-
*The sound that persists in an enclosed space after the sound source has stopped, which isreflected by the wall, floor, or ceiling.
968 AIR POLLUTION AND NOISE CONTROL
ognize the need to prevent sound transmission between apartments in a mul-tiple dwelling or in row houses. A double separated wall with two layers ofinsulation is effective. A sound-pressure-level reduction of about 50 dB in thenormal speaking range (250–3000 Hz) is suggested.
Since a room floor, wall, and ceiling are usually constructed of differentmaterials, an average transmission coefficient must be calculated taking intoconsideration the coefficient for each material (including doors, windows, andvents) and its area to determine the room noise insulation factor in decibels.The total noise reduction level accomplished by a wall or other divider is afunction of the wall transmission loss, the room absorption characteristics,and the absorption in the rooms separated. It is determined by measuring thedifference in sound levels in the rooms. The types of windows (single ordouble-hung) and doors can have a major effect on the overall noise insulationfactor. For example, opening a window can double the interior noise.
Numerous sample calculations for sound and vibration control situationsare given in various texts, including the ASHRAE Guide and Data Book,Systems, 1970 (see Bibliography).
Mechanical noises such as high-velocity noises require proper design ofventilation systems and plumbing systems to reduce flow velocity. Hammer-ing noise in a plumbing system is usually due to a quick-closing valve in theplumbing system, which requires installation of an air chamber on the line ora pressure or vacuum-breaker air-relief valve to absorb the pressure changecreated when the momentum of the flowing water suddenly stops.
Separation distance between the sound source and receptor should be em-phasized and not overlooked in the planning stages as a practical noise re-duction method. In general, if there are no sound-reflecting surfaces in thevicinity, a sound pressure level will be reduced approximately 6 dB for eachdoubling of the distance. Doubling the air space between panels increases thetransmission loss by about 5 dB. When a sound barrier, such as a wall, iserected between a source and a receptor, some sound is reflected back towardthe source, some is transmitted through the barrier, and some is diffractedover and around the barrier. With a partition close to the source, part of thesound is absorbed, part is reflected back, and part is transmitted through.
Federal Regulations
Maximum acceptable or permissible noise levels are established for certaincategories by federal or state regulations or by local ordinances. Some guidesare given in Table 6-14.
In May 1969 the Department of Labor issued the first federal standards foroccupational exposure to noise. The Occupational Safety and Health Admin-istration (OSHA) sets and enforces regulations, under the Occupational Safetyand Health Act of 1970, for the protection of workers’ hearing. These stan-dards have been made more stringent over the years as more human hearingloss research has become available. Table 6-15 shows the year 2000 American
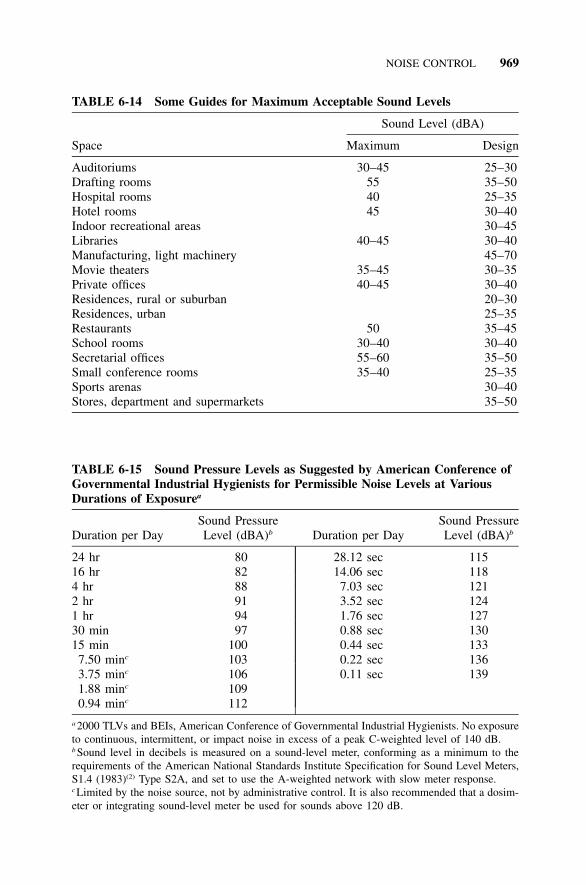
NOISE CONTROL 969
TABLE 6-14 Some Guides for Maximum Acceptable Sound Levels
Space
Sound Level (dBA)
Maximum Design
Auditoriums 30–45 25–30Drafting rooms 55 35–50Hospital rooms 40 25–35Hotel rooms 45 30–40Indoor recreational areas 30–45Libraries 40–45 30–40Manufacturing, light machinery 45–70Movie theaters 35–45 30–35Private offices 40–45 30–40Residences, rural or suburban 20–30Residences, urban 25–35Restaurants 50 35–45School rooms 30–40 30–40Secretarial offices 55–60 35–50Small conference rooms 35–40 25–35Sports arenas 30–40Stores, department and supermarkets 35–50
TABLE 6-15 Sound Pressure Levels as Suggested by American Conference ofGovernmental Industrial Hygienists for Permissible Noise Levels at VariousDurations of Exposurea
Duration per DaySound PressureLevel (dBA)b Duration per Day
Sound PressureLevel (dBA)b
24 hr 8016 hr 824 hr 882 hr 911 hr 9430 min 9715 min 1007.50 minc 1033.75 minc 1061.88 minc 1090.94 minc 112
28.12 sec 11514.06 sec 1187.03 sec 1213.52 sec 1241.76 sec 1270.88 sec 1300.44 sec 1330.22 sec 1360.11 sec 139
a 2000 TLVs and BEIs, American Conference of Governmental Industrial Hygienists. No exposureto continuous, intermittent, or impact noise in excess of a peak C-weighted level of 140 dB.b Sound level in decibels is measured on a sound-level meter, conforming as a minimum to therequirements of the American National Standards Institute Specification for Sound Level Meters,S1.4 (1983)(2) Type S2A, and set to use the A-weighted network with slow meter response.c Limited by the noise source, not by administrative control. It is also recommended that a dosim-eter or integrating sound-level meter be used for sounds above 120 dB.

970 AIR POLLUTION AND NOISE CONTROL
TABLE 6-16 Design Noise Level–Land Use Relationships
Design Noise Level(dBA) Description of Land-Use Category
60 (exterior) Areas such as amphitheaters, certain parks, or open spacesin which local officials agree serenity and quiet are ofextraordinary significance
70 (exterior) Residences, motels, hotels, public meeting rooms, schools,churches, libraries, hospitals, recreational areas
75 (exterior) Developed land, properties, or activities not included inabove two categories
55 (interior) Residences, motels, hotels, public meeting rooms, schools,churches, libraries, hospitals, auditoriums
Source: U.S. Department of Transportation, Policy Procedure Memorandum 90-2 Appendix B,Transmittal 279, February 8, 1973.
Conference of Governmental Hygienists suggested daily durations and soundpressure levels. The federal regulatory approach is to start control at the pointof manufacture.
The Federal Highway Act of 1970 led to design noise levels related toland use as a condition to federal aid participation. If the design noise levelsshown in Table 6-16 are exceeded, noise abatement measures are required inthe highway design. Federal highway funds may also be used to abate noiseon previously approved highway projects.
The Noise Control Act of 1972 [Public Law (PL) 92-574] directed the EPAto promote an environment for all Americans free from noise that jeopardizestheir health and welfare. It is required to set limits on noise emission, andthe Act requires manufacturers to warrant product performance and labelproducts. Regulation of noise from a broad range of sources and products isrequired. The EPA and the Department of Transportation (DOT) have beengiven the responsibilities to implement the law. The EPA estimates that 16million people are exposed to aircraft noise levels with effects ranging frommoderate to very severe.
The Aviation Safety and Noise Abatement Act of 1979 requires the FAAto develop a single system for measuring noise at airports and under certainconditions to prepare and publish noise maps. The Noise Abatement Criteriaestablished by the Federal Highway Administration for residential areas,schools, parks, hospitals, and other sensitive areas is 67 dBA equivalent steadystate and 72 dBA for commercial land use.*
The FAA, in the Department of Transportation, has primary authority foraircraft noise regulations and standards. The FAA has adopted noise emissionstandards for new aircraft and has a plan to retrofit older aircraft.
*A. Charabegian, ‘‘GIS /CAD Enhance Traffic Noise Study,’’ Public Works, November 1990, pp.61–62.
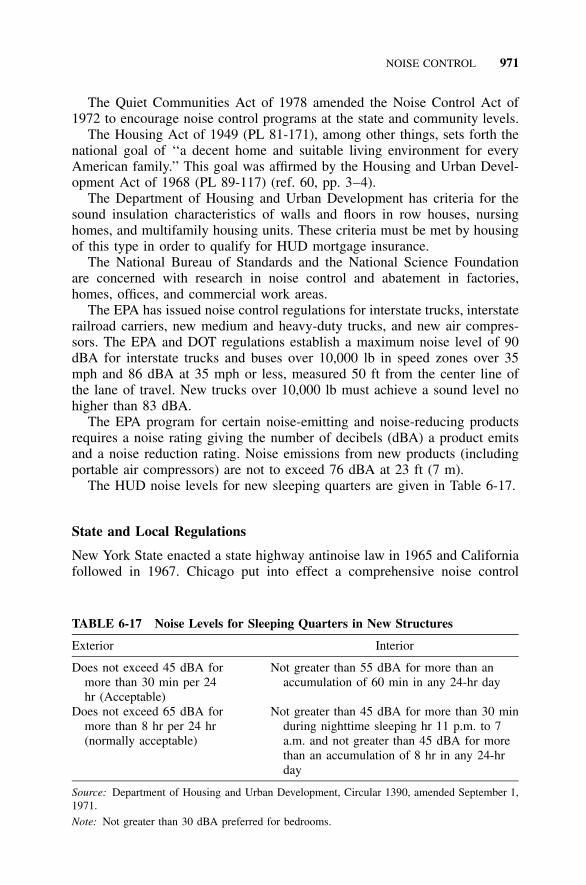
NOISE CONTROL 971
TABLE 6-17 Noise Levels for Sleeping Quarters in New Structures
Exterior Interior
Does not exceed 45 dBA formore than 30 min per 24hr (Acceptable)
Not greater than 55 dBA for more than anaccumulation of 60 min in any 24-hr day
Does not exceed 65 dBA formore than 8 hr per 24 hr(normally acceptable)
Not greater than 45 dBA for more than 30 minduring nighttime sleeping hr 11 p.m. to 7a.m. and not greater than 45 dBA for morethan an accumulation of 8 hr in any 24-hrday
Source: Department of Housing and Urban Development, Circular 1390, amended September 1,1971.
Note: Not greater than 30 dBA preferred for bedrooms.
The Quiet Communities Act of 1978 amended the Noise Control Act of1972 to encourage noise control programs at the state and community levels.
The Housing Act of 1949 (PL 81-171), among other things, sets forth thenational goal of ‘‘a decent home and suitable living environment for everyAmerican family.’’ This goal was affirmed by the Housing and Urban Devel-opment Act of 1968 (PL 89-117) (ref. 60, pp. 3–4).
The Department of Housing and Urban Development has criteria for thesound insulation characteristics of walls and floors in row houses, nursinghomes, and multifamily housing units. These criteria must be met by housingof this type in order to qualify for HUD mortgage insurance.
The National Bureau of Standards and the National Science Foundationare concerned with research in noise control and abatement in factories,homes, offices, and commercial work areas.
The EPA has issued noise control regulations for interstate trucks, interstaterailroad carriers, new medium and heavy-duty trucks, and new air compres-sors. The EPA and DOT regulations establish a maximum noise level of 90dBA for interstate trucks and buses over 10,000 lb in speed zones over 35mph and 86 dBA at 35 mph or less, measured 50 ft from the center line ofthe lane of travel. New trucks over 10,000 lb must achieve a sound level nohigher than 83 dBA.
The EPA program for certain noise-emitting and noise-reducing productsrequires a noise rating giving the number of decibels (dBA) a product emitsand a noise reduction rating. Noise emissions from new products (includingportable air compressors) are not to exceed 76 dBA at 23 ft (7 m).
The HUD noise levels for new sleeping quarters are given in Table 6-17.
State and Local Regulations
New York State enacted a state highway antinoise law in 1965 and Californiafollowed in 1967. Chicago put into effect a comprehensive noise control
972 AIR POLLUTION AND NOISE CONTROL
program in July 1971. Regulations require reduced noise levels after 1979for vehicles, construction machinery, home-powered equipment, and like-manufactured equipment. St. Louis County has a noise code that limits noisein residential areas to 55 dBA and in industrial areas to 80 dBA. New Jerseyenacted comprehensive noise legislation January 1972. Most states in thesnow belt have established a maximum noise level for snowmobiles of 78dBA at 50 ft. Some 12,000 states and municipalities have noise control leg-islation, but enforcement has been weak and spotty.
Local regulations consistent with federal and state laws and enforced lo-cally are encouraged as being more practical for enforcement. Model noisecontrol ordinances are available to assist local communities in the develop-ment of a local program.72,73*
Maximum acceptable sound levels for different situations are given in Ta-bles 6-14, 6-16, and 6-17. Maximum permissible sound levels for workers inindustrial plants and factories regulated by the Occupational Safety and HealthAct are given in Table 6-15.
REFERENCES
1. EPA Section 812 Cost Benefit Analysis of the Clean Air Act: 1970–1990, EPA,Washington, DC, October 1997.
2. D. Zmirou, A. Deloraine, F. Balducci, C. Boudet, and J. Dechenaux. ‘‘HealthEffects Costs of Particulate Air Pollution,’’ J. Occup. Environ. Med., 41(10), 847–856 (October 1999).
3. W. W. Heck, C. S. Furiness, E. B. Cowling, and C. K. Sims, ‘‘Effects of Ozoneon Crop, Forest, and Natural Ecosystems: Assessment of Research Needs,’’ EM:Air Waste Manage. Assoc. Mag. Environ. Managers, October 1998, pp. 11–22.
4. Associated Press, Prague, Czechoslovakia, May 30, 1970.5. C. D. Cooper and F. C. Alley, Air Pollution Control, Waveland Press, Prospect
Heights, IL, 1994, Chapter 1.6. ‘‘The Effects of Air Pollution,’’ Air Pollution Control Orientation Course, Office
of Air Programs, Air Pollution Training Institute, EPA, Washington, DC, 1972, p.86.
7. D. Rind, ‘‘A Character Sketch of Greenhouse,’’ EPA J., January/February 1989,pp. 4–7.
8. C. Flavin, Slowing Global Warming: A Worldwide Strategy, Worldwatch Paper 91,Worldwatch Institute, Washington, DC, 1989
9. J. T. Houghton, L. G. Meirafilho, B. Lim, K. Treanton, I. Mamaty, Y. Bonduki,D. J. Griggs, B. A. Callendar, Revised 1996 IPCC Guidelines for National Green-house Gas Inventories, Intergovernmental Panel on Climate Change, UnitedNations Environment Programme, Organization for Economic Co-Operation and
*The EPA maintains up-to-date compilation of city and state noise control ordinances.

REFERENCES 973
Development, International Energy Agency, UK Meteorologica Office, Bracknell,England.
10. P. Shabecoff, ‘‘Bush Wants Billions of Trees for War Against Polluted Air,’’ NewYork Times, January 28, 1990, p. 25; R. J. Moulton and K. Andrasko, ‘‘Refores-tation,’’ EPA J., March/April 1990, pp. 14–16.
11. T. Takeshita, Y. Uchiyama, K. Ito, and H. Hayashibe, ‘‘Life Cycle Analysis ofWorld Electricity in the 21st Century Using the World Energy LCA Model.’’ In-ternational J. of Global Energy Issues 1, (1998), pp. 42–50.
12. J. T. Houghton, Y. Ding, D. J. Griggs M. Noguer, P. J. van der Linden, X. Dai,K. Maskell, C. A. Johnson (Eds.), Climate Change 2001: The Scientific Basis,Cambridge University Press, New York, 2001.
13. S. H. Schneider, ‘‘The Global Warming Debate: Science or Politics?’’ Environ.Sci. Technol., April 1990, pp. 432–435.
14. P. Roger, ‘‘Climate Change and Global Warming,’’ Environ. Sci. Technol., April1990, pp. 428–430.
15. S. Balianas, ‘‘Kyoto Science Just Doesn’t Add Up,’’ CanWest Interactive, CalgaryHerald, Calgary, Alberta, Canada, May 27, 2002, p. A13.
16. ‘‘Environmental Indicators: Ozone Depletion,’’ EPA Bulletin, Washington, DC,2002, available www.epa.gov/ozone/science/ indicat.
17. Charles Stewart Mott Foundation and the Conservation Foundation, State of theEnvironment: A Vew Toward the Nineties, Conservation Foundation, Washington,DC, 1987, p. 82.
18. Environmental News Digest, Food Service and Packaging Institute, Fall 1989,p. 3.
19. A. K. Naj, ‘‘Bromines May Be Harming Ozone Layer as Much as Fluorocarbon,Report Says,’’ Wall Street Journal, August 30, 1988, sec. 1, p. 10.
19a. J. W. Bow, ‘‘Containers Easy on the Ozone Layer,’’ New York Times, May 21,1991 sec. A, p. 20.
20. M. McFarland, ‘‘Chlorofluorocarbons and Ozone,’’ Environ. Sci. Technol., October1989, pp. 1203–1207.
21. I. M. Mintzer and A. S. Miller, ‘‘The Ozone Layer,’’ Environ. Sci. Technol., De-cember 1987, pp. 1167–1169.
22. W. Glaze, ‘‘ES&T Currents,’’ Environ. Sci. Technol., August 1989, p. 909.23. Ozone in the Lower Atmosphere: A Threat to the Health and Welfare, EPA-86-
010, EPA, Washington, DC, December 1986, p. 1.24. N. R. Glass, G. E. Glass, and P. J. Rennie, ‘‘Effects of Acid Precipitation,’’ En-
viron. Sci. Technol., November 1979, pp. 1350–1354.25. ‘‘Latest Findings on National Air Quality: 2001 Status and Trends,’’ U.S. EPA,
September 2002, available www.epa.gov/air /aqtrnd01.26. J. Heritage (Ed.), Acid Rain: An EPA Journal Special Supplement, EPA, Office of
Public Affairs, Washington, DC, June–July 1986, pp. 13–23.27. M. A. Benarde, ‘‘Health Effects of Acid Rain: Are There Any?’’ J. R. Soc. Health,
4, 139–145 (1987).28. D. L. Ray, ‘‘Acid Rain—What To Do?’’ Environ. Sci. Technol., April 1988, p.
348.
974 AIR POLLUTION AND NOISE CONTROL
29. J. N. Woodman and E. B. Cowling, ‘‘Airborne Chemicals and Forest Health,’’Environ. Sci. Technol., 21, 2 (1987).
30. R. A. Olson, ‘‘The Impacts of Acid Deposition on N and S Cycling,’’ (1983),Environ Exp Botany, 23, 3, 211.
31. W. K. Stevens, ‘‘Researchers Find Acid Rain Imperils Forests Over Time,’’ NewYork Times, December 31, 1989, pp. 1, 22.
32. EPA Aerometric Information Retrieval System, available www.epa.gov/air /data /info.html, 2002.
33. Environmental Protection Agency, Quality Assurance Handbook for Air PollutionMeasurement Systems, Vols. I–III, Doc. EPA 600/9-76-005, EPA, EnvironmentalMonitoring Systems Laboratory, Research Triangle Park, NC, 1984.
34. National Exposure Research Laboratory, Human Exposure & Atmospheric Sci-ences Division (MD-46), EPA, Research Triangle Park, NC, www.epa.gov/ ttn /amtic /criteria.html.
35. Fed. Reg. 40 CFR Part 58, 2001.36. A. Rihm, ‘‘Air Pollution,’’ in N. Irving Sax (Ed.), Dangerous Properties of Indus-
trial Materials, Van Nostrand Reinhold, New York, 1969.37. New York State Air Quality Report, Annual 1978 DAR-79-1, Division of Air, New
York State Department of Environmental Conservation, Albany, NY, September1979, pp. 240–243.
38. Bureau of Mines, Bureau of Mines Information Circular No. 8333 (revision of IC7718), Publications Distribution Section, U.S. Dept. of Interior, Pittsburgh, PA,1967.
39. H. Power and J. M. Baldasano (eds.), Air Pollution Emissions Inventory, Com-putational Mechanics Inc.; Billerica, MA, 1998.
40. H. H. Hovey, A. Risman, and J. F. Cunnan, ‘‘The Development of Air ContaminantEmission Tables for Nonprocess Emissions,’’ J. Air Pollut. Control Assoc., 16,362–366 (July 1966).
41. Quality Assurance Handbook for Air Pollution Measurement Systems, Vol. II:Ambient Air Specific Methods, Doc. EPA-600/4-77-027a, Environmental Moni-toring Systems Laboratory, Research Triangle Park, NC, July 1984.
42. Quality Planning and Standards Report No. 1.2-012, Supplement A, September1975, and related reports.
43. F. L. Ludwig, ‘‘Siting Air Monitoring Stations,’’ Environ. Sci. Technol., July 1978,pp. 774–778.
44. V. G. MacKenzie, ‘‘Management of Our Air Resources,’’ paper presented at theGrowth Conference on Air, Land, and Water Resources, University of Californiaat Riverside, October 7, 1963.
45. R. M. Dowd, ‘‘Hazardous Air Pollution Control,’’ Environ. Sci. Technol., February1986, p. 122.
46. J. Heritage (Ed.), ‘‘Update,’’ EPA J., July/August 1987, p. 36.47. Air Pollution Control Field Operations Manual, PHS Pub. 937, DHEW, Washing-
ton, DC, 1962.48. R. Voelker, ‘‘Power without Acid,’’ Civil Eng., ASCE, July 1989, pp. 45–47.49. World Health Organization Expert Committee on Environmental Health Aspects
of Metropolitan Planning and Development, ‘‘Environmental Health Aspects ofMetropolitan Planning and Development,’’ WHO Tech. Rep. Ser., 297, 1965.
REFERENCES 975
50. M. Smith, Recommended Guide for the Prediction of the Dispersion of AirborneEffluents, American Society of Mechanical Engineers, New York, 1968.
51. A. C. Stern, H. C. Wohlers, R. W. Boubel, and W. P. Lowry, Fundamentals of AirPollution, Academic, New York, 1973, pp. 274–287.
52. R. E. Munn, ‘‘Air Pollution Meteorology,’’ in M. J. Suess and S. R. Craxford,(Eds.), Manual on Urban Air Quality Management, WHO Regional PublicationEuropean Series No. 1, Copenhagen, Denmark, 1976, pp. 101–126.
53. A. T. Rossano and T. A. Rolander, ‘‘The Preparation of an Air Pollution SourceInventory,’’ in M. J. Suess and S. R. Craxford (Eds.), Manual on Urban Air QualityManagement, WHO Regional Publication European Series No. 1, Copenhagen,Denmark, 1976, pp. 127–152.
54. M. I. Weisburd and S. Smith Griswold, PHS Pub. 937, DHEW, Washington, DC,1962.
55. D. Harrop, Air Quality Assessment and Management: A Practical Guide, SponPress, New York, 2002.
56. M. I. Davis, Air Resources Management Primer, ASCE, New York, August 1973.57. C. D. Jaffe, ‘‘Sound and Noise,’’ in The Industrial Environment . . . Its Evaluation
and Control, PHS Pub. 614, U.S. Government Printing Office, Washington, DC,1958, pp. B-20, 2.
58. Environmental Health Criteria 12, Noise, WHO, Geneva, 1980, pp. 24–25.59. A. P. G. Peterson and E. E. Gross, Jr., Handbook of Noise Measurement, General
Radio Company, Concord, MA, 1974, pp. 23–35.60. The Noise Guidebook, HUD-953-CPD, HUD, Washington, DC, March 1985, p.
3.61. ‘‘Self-Reported Hearing Loss among Workers Potentially Exposed to Industrial
Noise—United States,’’ MMWR, March 1986, pp. 185–188, and March 18, 1988,pp. 158–167.
62. ‘‘E.P.A., Battling Noise Pollution, Tells of Extent of Damage to Ears,’’ UnitedPress International, New York Times, November 11, 1979.
63. Information on Levels of Environmental Noise Requisite to Protect Public Healthand Welfare with an Adequate Margin of Safety, EPA/550/9-74-004, EPA, Wash-ington, DC, March 1974.
64. ‘‘Environmental Health Aspects of Metropolitan Planning and Development,’’WHO Tech. Rep. Ser., 297, 52 (1965).
65. H. H. Jones, ‘‘Principles of Noise Control,’’ in A. D. Hosey and C. H. Powell(Eds.), Industrial Noise, a Guide to Its Evaluation and Control, PHS Pub. 1572,DHEW, Washington, DC, 1967, pp. N-10-1 to N-10-5.
66. Guidelines to the Department of Labor’s Occupational Noise Standards, Bulletin334, OSHA, Washington, DC, 1971.
67. M. Witt (Ed.), Noise Control, OSHA 3048, U.S. Department of Labor, Office ofInformation, Washington, DC, 1980.
68. Health Hazards of the Human Environment, WHO, Geneva, 1972, p. 265.69. Engineering Times, June 1989, p. 11.70. J. E. Heer, Jr., D. J. Hagerty, and J. L. Pavoni, ‘‘Noise in the Urban Environment,’’
Public Works, October 1971, pp. 60–64.71. J. N. Boaz (Ed.), Architectural Graphic Standards, Wiley, New York, 1970, pp.
504–512.
976 AIR POLLUTION AND NOISE CONTROL
72. National Environmental Health Association, ‘‘A Model for Community NoiseControl,’’ J. Environ. Health, July/August 1977, pp. 24–44.
73. National Institute of Municipal Law Officers, Model Communuity Noise ControlOrdinance, Doc. EPA 550/9; 76-003. EPA, Research Triangle Park, NC, 1975.
BIBLIOGRAPHY
Air Pollution
‘‘Air Pollution,’’ WHO Monograph Series 46, Columbia University Press, New York,1961.
Cost Benefit Analysis of the Clean Air Act: 1970 to 1990, EPA Section 812, EPA.October 1997.
Danielson, J. A. (Ed.), Air Pollution Engineering Manual, Pub. AP-40, EPA, Office ofAir Quality Planning and Standards, Research Triangle Park, NC, May 1973.
Davis, M. L., Air Resources Management Primer, ASCE, New York, 1973.Godish, T., Air Quality, Lewis Publishers, Chelsea, MI, 1985.Guideline for Public Reporting of Daily Air Quality—Pollutant Standards Index (PSI),
EPA 454/R-99-010, Office of Air Quality Planning and Standards, EPA, ResearchTriangle Park, NC, 1999, Table 7, p. 13.
Heck, W. W., C. S., Furiness, E. B. Cowling, and C. K. Sims, ‘‘Effects of Ozone onCrop, Forest, and Natural Ecosystems: Assessment of Research Needs,’’ EM: AirWaste Manag. Assoc. Mag. Environ. Managers, October 1998, pp. 11–22.
Houghton, J. T., L. G. Meir, FILHO, P. Lim, K. Treanton, I. Mamaty, Y. Bonduki, D.J. Griggs, and B. A. Callendar, Revised 1996 IPCC Guidelines for National Green-house Gas Inventories, Intergovernmental Panel on Climate Change, United NationsEnvironment Programme, Organization for Economic Co-Operation and Develop-ment, International Energy Agency, Bracknell Meteorologica Office, England, 1997.
Hus, M., K. Kosutic, and S. Lulic, ‘‘Radioactive Contamination of Wood and Its Prod-ucts,’’ J. Environ. Radioactivity, 55(2), 179–86 (2001).
Interim Guidelines on Air Quality Models, Office of Air Quality Planning and Stan-dards Pub. 1.2–080, EPA, Research Triangle Park, NC, October 1977.
National Exposure Research Laboratory, Human Exposure & Atmospheric SciencesDivision (MD-46), EPA, Research Triangle Park, NC, www.epa.gov/ ttn /amtic /criteria.html.
‘‘Research into Environmental Pollution,’’ WHO Technical Report Series 406, WHO,Geneva, 1968.
Rytoma, T., ‘‘Ten Years after Chernobyl,’’ Ann. Med., 28(2), 83–87 (April 1996).Smith, M. E. (Ed.), Recommended Guide for the Prediction of the Dispersion of Air-
borne Effluents, American Society of Mechanical Engineers, New York, May 1968.Stern, A. C. (Ed.), Air Pollution, Academic, New York. Vol. I: Air Pollutants, Their
Transformation, and Transport, 1976; Vol. II: The Effects of Air Pollution, 1977;Vol. III: Measuring, Monitoring, and Surveillance of Air Pollution, 1976; Vol. IV:Engineering Control of Air Pollution, 1977; Vol. V: Air Quality Management, 1977.
BIBLIOGRAPHY 977
Stern, A. C., H. C. Wohlers, R. W. Boubel, and W. P. Lowry, Fundamentals of AirPollution, Academic, New York, 1973.
Subcommittee on Environmental Improvement, Cleaning Our Environment—A Chem-ical Perspective, American Chemical Society, Washington, DC, 1978.
Suess, M. J., and S. R. Craxford, Manual on Urban Air Quality Management, WHO,Regional Office for Europe, Copenhagen, Denmark, 1976.
Takeshita, T., Y. Uchiyama, K. Ito, and H. Hayashibe. ‘‘Life Cycle Analysis of WorldElectricity in the 21st Century Using the World Energy LCA Model.’’ InternationalJournal of Global Energy Issues, 11(1), 42–50 (1998).
Vesilind, P. A., and J. Jeffrey Peirce, Environmental Engineering, Ann Arbor Science,Ann Arbor, MI, 1982.
Weisburd, M. I., and S. Smith Griswold (Eds.), Air Pollution Control Field OperationsManual, PHS Pub. 937, DHEW, Washington, DC, 1962.
WHO Expert Committee, Air Quality Criteria and Guides for Urban Air Pollutants,WHO Technical Report Series, No. 506, WHO, Geneva, 1972.
Zmirou, D., A. Deloraine, F. Balducci, C. Boudet, and J. Dechenaux, ‘‘Health EffectsCosts of Particulate Air Pollution,’’ J. Occup. Environ. Med., 41(10), 847–856 (Oc-tober 1999).
Noise ControlNational Environmental Health Association Noise Committee, ‘‘A Model for Com-
munity Noise Control,’’ J. Environ. Health, July/August 1977, pp. 25–44.Berendt, R. D., E. L. R. Corliss, and M. S. Ojalvo, Quieting: A Practical Guide to
Noise Control, U.S. Department of Commerce, National Bureau of Standards, U.S.Government Printing Office Washington, DC, July 1976.
Burns, W., Noise and Man, J. B. Lippincott, Philadelphia, PA, 1973.Crocker, M. J., and A. J. Price, Noise and Noise Control, Vols. 1 and 2, CRC Press,
Cleveland, OH.Environmental Health Criteria 12, Noise, WHO, Geneva, 1980.‘‘Information on Levels of Environmental Noise Requisite to Protect Public Health
and Welfare with an Adequate Margin of Safety,’’ EPA 550/9-74-004, EPA, Wash-ington, DC, March 1974.
Local Noise Ordinance Handbook, Bureau of Noise Control, Division of Air Re-sources, New York State Department of Environmental Conservation, Albany, NY,October 1977.
Peterson, A. P. G., and E. E. Gross, Jr., Handbook of Noise Measurement, GeneralRadio Company, Concord, MA, 1974.
‘‘Sound and Vibration Control,’’ in ASHRAE Guide and Data Book, Systems, 1970,American Society of Heating, Refrigerating, and Air-Conditioning Engineers, At-lanta, GA, Chapter 33.
The Industrial Environment—Its Evaluation & Control, DHEW, PHS, CDC, NIOSH,U.S. Government Printing Office, Washington, DC, 1973.
The Noise Guidebook, HUD-953-CPD, HUD, Washington, DC, March 1985.Witt, M. (Ed.), Noise Control, U.S. Department of Labor, Office of Information, OSHA
3048, U.S. Government Printing Office, Washington, DC, 1980.