noise and ambient air pollution monitoring and its effects ... · noise and ambient air pollution...
TRANSCRIPT

Academia Journal of Environmental Sciences 2(2): 015-028, February 2014 DOI: http://dx.doi.org/10.15413/ajes.2013.031 ISSN: 2315-778X ©2014 Academia Publishing
Research Paper
Noise and ambient air pollution monitoring and its effects on local community in Faisalabad, Pakistan
Accepted 28th November, 2013 ABSTRACT An ambient air and noise pollution survey was carried out at 10 sites in Faisalabad, Pakistan simultaneously from 1 h to 24 h average for 3 consecutive days in November 2009 which also included meteorological measurements. The monitoring sites were included the blend of industrial, commercial, residential and heavy traffic roads with thick population trend. Major pollutants analyzed were carbon monoxide (CO), nitrogen dioxide (NO2), sulphur dioxide (SO2), total suspended particulates (TSP), particulate matter (PM10) and noise level. Carbon monoxide levels in the ambient air were found to reach 0.8–10 ppm in 1 h monitoring and for 24 h average was 7 ppm. Our survey indicates that NO2 levels were exceeding (21–66 ppb) during the daytime for 1 h and maximum concentration was 40-60 ppb for 24 h average. The range of SO2Concentration was from 14-62 ppb in 1 h reading and it was in limits for 24 h average. The values of TSP and PM10 were exceeding the limit in 1 h and 24 h averages. The maximum concentration of TSP was found 1822 μg/m3 in 1 h and 392-1235 μg/m3 for 24 h averages. The PM10 was exceeding the limits and reached to 824 μg/m3 in 1 h and 305-534 μg/m3 for 24 h average at all monitoring sites. Noise levels were within the permissible limits at all sites in 1 h and 24 h average. To manage and improve ambient air quality within the city, the basic strategies are: establishment of ambient air quality objectives and criteria for assessment of air quality, and promote increased level of cooperation among the population of this city in reducing pollution load. Keywords: Air Pollutants- Ambient Air Quality-Noise Pollution- Particulate Matter-Total suspended Matter.
INTRODUCTION Pakistan is facing population boom during the last two decades, which is causing an extensive escalation in urbanization, transportation, industrialization and energy consumption. As a result, a substantial increase in the emission sources of various air pollutants has taken place because of infrastructure development in major cities.The rapid and necessary development of large urban areas (‘megacities’), especially in developing countries, causes and will cause serious air-quality issues (Valerie et al., 2007). However, due to the lack of air quality monitoring and management system, thereby giving rise to poor planning, faulty traffic network systems and poor vehicle
maintenance (Tariq and Ali, 1998; Wahid et al, 1994; Shamsiet al., 2000).
Faisalabad is the Manchester of Pakistan and ambient air pollution is one of the major problems of this city, which requires special attention. The release of different pollutants into the environment has increased noticeably as a result of industrialization and thereby lowered the quality of the environment to alarming levels (Aziz, 1999).
The ambient air may contain a high number of pollutants depending upon natural and anthropogenic activities. More than 300 substances are known which can be emitted into the air and are significant air pollutants. Substances are
Saima Aslam Bharwana1, Shafaqat Ali1*, Mujahid Farid1, Mohsin Jamshaid2, Muhammad Azeem2, Muhammad Bilal Shakoor1, Rehan Ahmad1, Fakhir Hannan1
1Department of Environmental Sciences, Government College University, 38000 Faisalabad, Pakistan 2Klimatic Environmental Consultant, CEES, University of the Punjab Lahore, Pakistan. Corresponding author: e-mail:[email protected]

Academia Journal of Environmental Sciences; Bharwana et al. 016 continually growing in number due to the introduction of technological advancement. There are 6 pollutants that account for the large majority of air pollution worldwide and for which standards are usually specified include carbon monoxide (CO), ozone (O3), oxides of nitrogen (NOx), sulfur dioxide (SO2), lead (Pb) and suspended particulate matter (SPM). For SPM, 2 classifications are generally employed, i.e. total suspended particulate matter (TSP) and particulate matter less than 10 μm in diameter (PM10). NOxare generally reported as nitrogen dioxide (NO2)(National air quality and emissions trends report, 1992). These pollutants showed the highest levels in summer and spring, while the lowest were observed in winter and monsoon (Badaret al.,2007)
Transportation system has contributed significantly to the development of human civilization; on the other hand it has an enormous impact on the ambient air quality in several ways (Mehboob and Makhshoof, 2008). In particular, massive industrial development, rapid increase of automobiles and exponential growth of world population together with its food consumption result in air quality deterioration (Ainaet al., 1989; Montgomery, 1990; Carbajo and Faiz, 1994).
Air pollution is a significant risk to the environment, quality of life and health of the population. Ambient air quality monitoring in long term on regular basis is still not systematic in Pakistan. Moreover, ambient air quality standards have not yet been established and implemented properly. There is no reliable epidemiological/toxicological monitoring system in place in Pakistan to provide a basis for establishing guidelines for various air pollutants (Aziz et al., 2006). All the available information is based on random and short-term sampling conducted to assess the concentrations of various pollutants. The Government has taken positive steps toward air quality management in the form of the Pakistan Clean Air Program and has recently established a small number of continuous monitoring stations. Many such studies have been reported the ambient concentration of air pollutants in various urban and rural centers of Pakistan including Karachi (Nizami, 1985;Badaret al., 1994;Yousufzai and Hashmi, 1997; Shamsi, 2000), Hyderabad, Jamshoro (Rehman and Ali, 1994), Lakhra (Shahida et al., 2006), Multan, Dera Ghazi Khan, Faisalabad, Lahore (EPD, 1997; Azizand Qureshi, 2002), Gujranwala (Majeed, 1996), PindDadan Khan, Sargodha, Fateh Jang, Khewra, Sialkot, Rawalpindi, Islamabad andPeshawar (Hayat, 1994).
In this survey, the concentrations of ambient air pollutants and noise pollution only give a general idea about the prevailing situation. A true picture of ambient air quality can only be obtained through well-defined long-term monitoring programmes and establishment of standards and guidelines (Aziz, 2006).The criteria used to establish air quality guidelines should be the production of technical documents, and the establishment of regional collaboration centers and codes of best practice (Schwela,
1997). The most widely implemented ambient air quality guidelines are those recommended by World Health Organization (WHO) and these are used by many developing countries as guidelines for ambient air pollution (Air quality guidelines for Europe and Geneva, 2000). METHODOLOGY STUDY AREA An air and noise pollution survey was carried out at 10 sites in Faisalabad, Pakistan simultaneously from 1 h to 24 h average for 3 consecutive days in November 2009, which also included meteorological measurements. The monitoring sites include the blend of industrial, commercial, residential and heavy traffic roads with thick population trend. Major pollutants included in this study were carbon monoxide (CO), nitrogen dioxide (NO2), sulphur dioxide (SO2), total suspended particulates (TSP), particulate matter (PM10) and noise level. All 10 monitoring sites were arranged in four groups such that a maximum of four locations could be monitored repeatedly for three times during a single 24 hours cycle. In this regard, selected sites in nearer localities were placed in the same group so as to save time and traveling cost. The four groups were as follows: I) First group: It included Dost Street Samundari Road, Faisal Street, Samundari road andNarwalaChowk II) Second group: Razabad, Ghulam Muhammadabad and Small Industrial Estate III) Third group: It covered the areas of Allied hospital, Ashrafabad and Malikpur, Kashmir Road IV) Fourth group: The surroundings of Mian Muhammad Trust hospital TYPE OF SAMPLING A 1-hour average sampling was done at above all 10 locations. At each location, monitoring for all parameters was started at the same time and completed in a similar way. A 1 hour time gap between two successive sampling locations was fixed in terms of mobilization and preparation of monitoring instruments. SAMPLING ROUNDS At each of the scheduled locations, monitoring was carried out 3 times per 24 hours cycle in a way that two samples were collected in day time while during night one time sampling was done. In this way, three rounds were completed at selected sites for a particular day.
Academia Journal of Environmental Sciences; Bharwana et al. 017
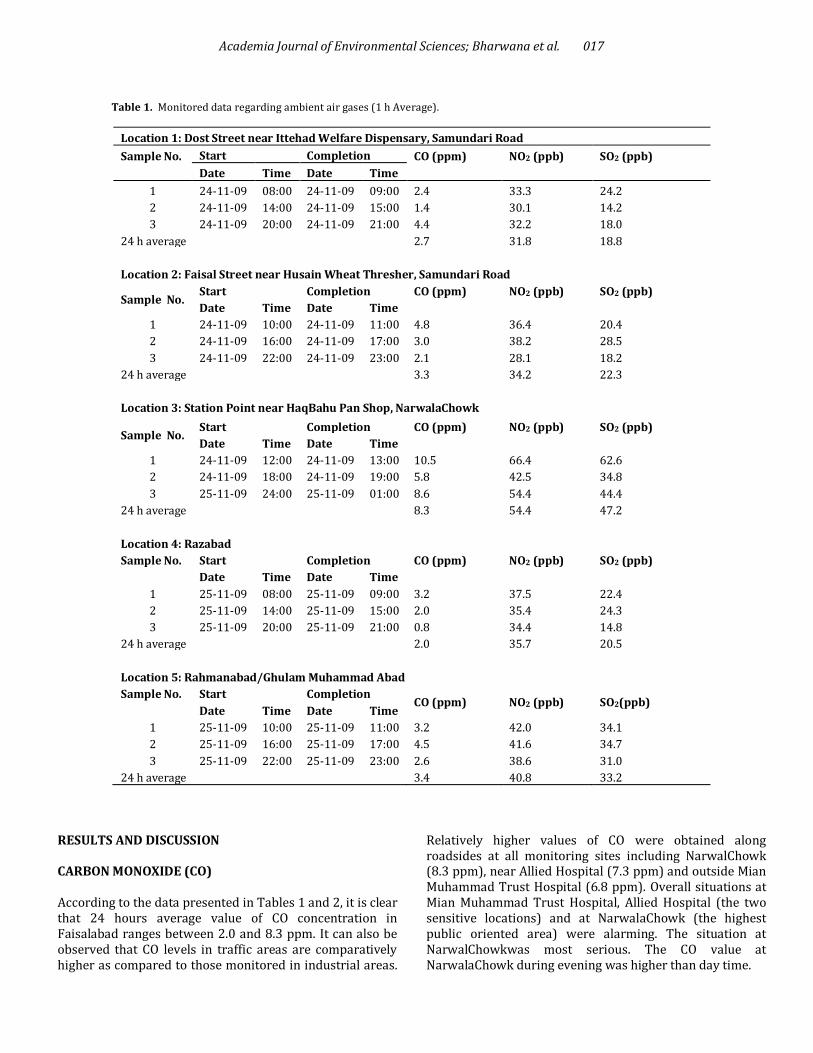
Table 1. Monitored data regarding ambient air gases (1 h Average).
Location 1: Dost Street near Ittehad Welfare Dispensary, Samundari Road
Sample No.
Start Completion CO (ppm)
NO2 (ppb)
SO2 (ppb)
Date Time Date Time
1 24-11-09 08:00 24-11-09 09:00 2.4 33.3 24.2
2 24-11-09 14:00 24-11-09 15:00 1.4 30.1 14.2
3 24-11-09 20:00 24-11-09 21:00 4.4 32.2 18.0
24 h average 2.7 31.8 18.8
Location 2: Faisal Street near Husain Wheat Thresher, Samundari Road
Sample No. Start Completion CO (ppm)
NO2 (ppb)
SO2 (ppb)
Date Time Date Time
1 24-11-09 10:00 24-11-09 11:00 4.8 36.4 20.4
2 24-11-09 16:00 24-11-09 17:00 3.0 38.2 28.5
3 24-11-09 22:00 24-11-09 23:00 2.1 28.1 18.2
24 h average 3.3 34.2 22.3
Location 3: Station Point near HaqBahu Pan Shop, NarwalaChowk
Sample No. Start Completion CO (ppm)
NO2 (ppb)
SO2 (ppb)
Date Time Date Time
1 24-11-09 12:00 24-11-09 13:00 10.5 66.4 62.6
2 24-11-09 18:00 24-11-09 19:00 5.8 42.5 34.8
3 25-11-09 24:00 25-11-09 01:00 8.6 54.4 44.4
24 h average 8.3 54.4 47.2
Location 4: Razabad
Sample No.
Start Completion CO (ppm)
NO2 (ppb)
SO2 (ppb)
Date Time Date Time
1 25-11-09 08:00 25-11-09 09:00 3.2 37.5 22.4
2 25-11-09 14:00 25-11-09 15:00 2.0 35.4 24.3
3 25-11-09 20:00 25-11-09 21:00 0.8 34.4 14.8
24 h average 2.0 35.7 20.5
Location 5: Rahmanabad/Ghulam Muhammad Abad
Sample No.
Start Completion CO (ppm) NO2 (ppb) SO2(ppb)
Date Time Date Time
1 25-11-09 10:00 25-11-09 11:00 3.2 42.0 34.1
2 25-11-09 16:00 25-11-09 17:00 4.5 41.6 34.7
3 25-11-09 22:00 25-11-09 23:00 2.6 38.6 31.0
24 h average 3.4 40.8 33.2
RESULTS AND DISCUSSION CARBON MONOXIDE (CO) According to the data presented in Tables 1 and 2, it is clear that 24 hours average value of CO concentration in Faisalabad ranges between 2.0 and 8.3 ppm. It can also be observed that CO levels in traffic areas are comparatively higher as compared to those monitored in industrial areas.
Relatively higher values of CO were obtained along roadsides at all monitoring sites including NarwalChowk (8.3 ppm), near Allied Hospital (7.3 ppm) and outside Mian Muhammad Trust Hospital (6.8 ppm). Overall situations at Mian Muhammad Trust Hospital, Allied Hospital (the two sensitive locations) and at NarwalaChowk (the highest public oriented area) were alarming. The situation at NarwalChowkwas most serious. The CO value at NarwalaChowk during evening was higher than day time.

Academia Journal of Environmental Sciences; Bharwana et al. 018
Table 2. Monitored data regarding ambient air gases (1 h Average).
Location 6: Small industrial estate
Sample No.
Start Completion CO(ppm) NO2(ppb) SO2(ppb)
Date Time Date Time
1 25-11-09 12:00 25-11-09 13:00 2.5 40.5 29.4
2 25-11-09 18:00 25-11-09 19:00 3.9 38.2 32.5
3 26-11-09 24:00 26-11-09 01:00 1.8 34.5 24.4
24 h average 2.7 37.7 28.7
Location 7:Allied Hospital near Incinerator
Sample No.
Start Completion CO(ppm)
NO2(ppb)
SO2(ppb)
Date Time Date Time
1 26-11-09 08:00 26-11-09 09:00 8.2 48.5 44.0
2 26-11-09 14:00 26-11-09 15:00 6.1 44.0 32.1
3 26-11-09 20:00 26-11-09 21:00 7.8 41.1 27.3
24 h average 7.3 44.5 34.4
Location 8: St. No. 2 Ashrafabad, SKB Road
Sample No.
Start Completion CO(ppm)
NO2(ppb)
SO2(ppb)
Date Time Date Time
1 26-11-09 10:00 26-11-09 11:00 1.2 26.6 14.5
2 26-11-09 16:00 26-11-09 17:00 2.0 24.5 16.5
3 26-11-09 22:00 26-11-09 23:00 1.0 21.4 12.4
24 h average 1.4 24.1 14.6
Location 9: Malikpur, Kashmir Road
Sample No.
Start Completion CO(ppm)
NO2(ppb)
SO2(ppb)
Date Time Date Time
1 26-11-09 12:00 26-11-09 13:00 3.5 34.4 24.5
2 26-11-09 18:00 26-11-09 19:00 3.1 38.5 23.2
3 27-11-09 24:00 27-11-09 01:00 2.8 22.4 17.6
24 h average 3.1 31.7 21.7
Location 10: Near Mian Muhammad Trust Hospital
Sample No.
Start Completion CO(ppm)
NO2(ppb)
SO2(ppb)
Date Time Date Time
1 27-11-09 08:00 27-11-09 09:00 7.2 56.4 39.6
2 27-11-09 14:00 27-11-09 15:00 8.5 49.0 38.5
3 27-11-09 20:00 27-11-09 21:00 4.8 42.1 33.6
24 h average 6.8 49.1 37.2
This is because due to Eid shopping days, people mostly rushed towards markets in the evening. As for as data regarding industrial areas are concerned, monitored values vary from 2.0 to 3.4 ppm (24 hours average). The lowest result was obtained at Rezaabad, while highest value was noted at Ghulam Muhammad Abad. These values were comparatively moderate. However, when we observed on 1-hour monitored data, it can be concluded that CO values during day hours are usually higher than at night. This was because during day time, most of the industrial units were
operational and being run at their maximum load capacity while during night, some industrial units were not operational at their full load capacity. The National Environment Quality Standards (NEQs) of Pakistan do not provide 24 hours average standard for CO value in ambient air; therefore, monitored data was checked against 1-hour average NEQs value of 10 mg/m3 (9 ppm) (National air quality and emissions trends report, 1992).The 1-hour average values obtained at all monitored locations during all monitoring hours (Tables 1 and 2) are in compliance of

Academia Journal of Environmental Sciences; Bharwana et al. 019
Figure 1. 24 h average concentration of CO at Faisalabad.
NEQs 1-hour standard value of 9 ppm (10 mg/m3) except for monitored value at NarwalChowk (10.5 ppm) in the evening. The 1-hour average values obtained at all monitored locations during all monitoring hours (Figure 1) are in compliance of NEQs 1-hour standard value of 9 ppm (10 mg/m3).
The data presented in Table 8 gives the comparison of maximum CO concentration (24-hours average) measured at Faisalabad by various agencies and organizations during different periods of time. Previously monitored data only fromJapan International Corporation Agency (JICA) for year 2002 was available for its comparison with the currently monitored data while monitoring results for CO concentration fromFederal Bureau of Statistics (FBS) and Environmental Protection Agency (EPA) Punjab could not be made available. It is clear from the Table 8 that level of CO both along roadsides and in industrial areas has increased during last few years. NITROGEN DIOXIDE (NO2) According to the data presented in Tables 1 and 2, it is clear that level of NO2 as monitored in Faisalabad varies from 24.1 to 54.4 ppb (48.2-108.8 µg/m3). The values of NO2 concentration measured in traffic congested areas are higher than in other areas. The detected values of this pollutant near Allied Hospital, Mian Muhammad Trust Hospital and NarwalaChowk sites, as shown in the Tables 1 and 2, range between 44.5 ppb and 54.4 ppb. These values are very high. The reason is very simple that these areas are mostly exposed to high levels of public and private transport and combustion of fuels like petrol and diesel along with compressed natural gas (CNG) produces higher concentrations of NO2 in the atmosphere. Moreover, due to Eid shopping activities, traffic density on roads was even greater than normal days. The situation in these areas is
dangerous posing bad effects on health of general public. The value of this pollutant increases as we go from less traffic congested area to more dense area. The highest levels were noted at NarwalaChowk (54.4ppb) the densest area.
In industrial areas, NO2 level varies from24.1 ppb to 40.8 ppb. Concentration of NO2 monitored in Faisal Street is higher than in Dost Street. This is because the selected monitoring point at Faisal Street is exposed to more traffic pollution in addition to industrial emissions than in Dost Street which comparatively acts as lower traffic way than Faisal Street. The highest average 98 value was measured at Ghulam Muhammad Abad (40.8 ppb). It is because, NO2 from domestic fuel burning and traffic flows also adds up here along with industrial pollution like steel foundries. The value of NO2 obtained at Small Industrial Estate (SMIE) is a rationale. The lowest value was obtained at Ashraf Abad where the monitored value is 24.1 ppb. Here, industries involving fuel combustion were lower in numbers and also less operational due to Eid festival coming day after tomorrow.
NEQs of Pakistan give a limiting value of 40 ppb (80µg/m3) for this parameter in ambient air. The values of NO2 monitored at all monitoring sites including Allied Hospital (44.5 ppb / 89 µg/m3), Mian Muhammad Trust Hospital (49.1 ppb / 98.2 µg/m3) and NarwalaChowk (54.4 ppb / 108.8 µg/m3) as shown in Figure 2 are in violation of NEQs limiting value of 40 ppb (80 µg/m3). The measured values obtained in industrial areas range between 24.1 ppb to 40.8 ppb. The values of NO2 at Dost Street (31.8 ppb), Faisal Street (34.2 ppb), Rezaabad (35.7 ppb), Small Industrial Estate (37.7 ppb) and Kashmir Road (31.7 ppb) though lie on higher side but are in compliance of NEQs value of 40 ppb (80 µg/m3). However, the value at Ghulam Muhammad Abad (40.8 ppb) slightly violates NEQs.
The monitored data on NO2 reported by various institutions are given in Table-8. Monitoring results from all
0 5 10
CO
Dost Street
Faisal Street
Narwala Chowk
Raza-bad
G.M.
SMIE
Allied Hospital
Ashrafabad
Kashmir Road
MMTH
NEQs
Locat
ion
CO (ppm)
CO Lo
cati
on

Academia Journal of Environmental Sciences; Bharwana et al. 020
Figure 2. 24 h average concentration of NO2 at Faisalabad.
listed organizations except EPA were available(JICA and EPA Report, 2000).In industrial areas, a notable increase in the concentration of NO2 occurred from 1996 to 2002 and then the increase in NO2 level onwards till 2009 was obvious due to the increase in number of industrial units. Along Road sides, levels of NO2 have also increased due to a higher number of vehicles. Higher levels of NO2 along roadsides given by JICA than those observed for this research depend upon weather conditions, range, sensitivity and resolution of monitoring and sampling equipment used and location of selected monitoring sites. However, an overall increase in NO2 levels is observed over the years since 1996 till 2009 (Table 8). SULFUR DIOXIDE (SO2) According to the data presented in Tables 1 and 2, it is clear that value of SO2 as monitored in different areas of Faisalabad ranges between 14.6 ppb to 47.2 ppb i.e. 38.0 µg/m3 to 122.7 µg/m3. The values of SO2 concentration measured in traffic oriented areas was higher than those measured in industrial areas. Along roadsides, in high traffic areas, SO2concentrations range between 34.4 ppb to 47.2 ppb (89.4-122.7 µg/m3). Higher value of SO2 in traffic bearing areas is mostly due to the public transport particularly large buses which use diesel oil and petrol oil as fuel. The Sulfur present in the composition of oil when burnt yields oxides of Sulfur especially SO2 as the main component. Again the NarwalaChowk is the highest area of SO2 release due to its largest exposure to the SO2 emissions among all monitored locations.
In industrial areas, SO2 level varies from18.8 ppb to 33.2 ppb (48.8 µg/m3 to 86.3 µg/m3). The lowest value was obtained in Dost Street (18.8 ppb) while the highest value was measured at Ghulam Muhammad Abad (33.2 ppb). It is because, SO2 from domestic fuel burning and traffic flows also adds up here. The value of SO2 at all other locations
remain intermediate between both. The NEQs give a limiting value of 120µg/m3 (46 ppb) for this parameter. The monitored values along road sides are in compliance of NEQs limiting value except for SO2 measured at NarwalaChowk. All monitored values in different industrial areas are in compliance of above mentioned NEQs value.
The monitored data on SO2 reported by various institutions is given in Table 8. No monitoring results were available after 1996 and thus currently monitored data is directly compared with that monitored in 1996 and reported by FBS in 1998. The level of SO2in ambient air has increased over the years due to increased vehicles’ numbers and increased utilization of Sulfur containing fuels by the growing industrial units in Faisalabad. The maximum level of SO2 monitored in 1996 along roadsides was 6.8 ppb while recently monitored SO2 concentration in 2009 was 47.2 ppb. Similarly, in industrial areas, the level of this pollutant has increased from 1996 to 2009 by many folds (Figure 3). PARTICULATE MATTER TOTAL SUSPENDED PARTICULATES (TSP) The monitored data regarding total suspended particulates (TSP) for 1 hour average basis range between 314 µg/m3and 1822 µg/m3 on all ten monitoring locations in Faisalabad is shown in Tables 3 and 4. The values regarding TSP for 24 hours average basis range between 378µg/m3and 1463 µg/m3. The monitored values indicate that concentration of particulate matter along road sides is greater than in industrial areas. The TSP values monitored along all road sides including NarwalaChowk, Mian Muhammad Trust Hospital and Allied Hospital are very much high. The reason for such higher TSP value is the fuel combustion, poor road construction, poor sanitation conditions and industrial releases reaching here along with
0 20 40 60
SO2
Dost Street
Faisal Street
Narwala Chowk
Raza-bad
G.M.Abad
SMIE
Allied Hospital
Ashrafabad
Kashmir road
MMTH
NEQs
Loca
tion NEQs
NO2(ppb)
NO2 Lo
cati
on
NO2
(ppb)

Academia Journal of Environmental Sciences; Bharwana et al. 021
Figure 3. 24 h average concentration of SO2 at Faisalabad.
air current. The situation is alarming posing health risks on sensitive receptors especially human being.
The monitored values in industrial areas vary from 360 µg/m3 to 808 µg/m3. Industrial activities involving particulates emissions are less in number in the area near Kashmir Road monitoring site resulting in low value of particulates emissions in the atmosphere. The reason for low value of TSP as obtained in Dost Street is that the monitoring site is less exposed to industrial emissions. The street is not much wider and also involves commercial activities. In such case, the particulates terrain developed is such that particulate matter when emitted in air first goes high rise in the atmosphere due to pressure and then after travelling some distance comes down due to the force of gravity. The TSP in Ashraf Abad is moderate because of moderate industrial activities involving particulate emissions and gentle traffic flows. While TSP in Faisal Street (that is exposed to vehicular traffic along with industrial setups) is comparatively higher due to industrial as well as vehicular emissions. Similarly, higher value of TSP in Razabad is attributed to the domestic anthropogenic activities, domestic fuel combustion and some traffic activities. Due to an increased extent of these activities along with industrial operations, still higher value of particulates was monitored at Ghulam Muhammad Abad. At small industrial state, the site selected was in Open Street. Due to unpaved roads, poor sanitation conditions along with fuel combustion and process emissions, the measured value of TSP was the highest among all industrial sites.
NEQs of Pakistan gave a standard value of 550µg/m3 (24-hours average) for TSP. The values of TSP were monitored in Dost Street (378 µg/m3), at Ashraf Abad (392 µg/m3) and at Kashmir Road (360 µg/m3) are well within NEQs limiting value. The data obtained in Faisal Street (465 µg/m3) and Razaabad (498 µg/m3) though not in violation of National Environmental Quality Standards (NEQs) but still lie on higher side. The values monitored at Ghulam Muhammad Abad (668 µg/m3) and Small Industrial Estate (808 µg/m3)
are in violation of NEQs-Pakistan). The monitored data along roads of Faisalabad at NarwalaChowk (1463 µg/m3), near Allied Hospital (852 µg/m3) and near Mian Muhammad Trust Hospital (1235 µg/m3) are in violation of NEQs standard value. The values of monitored data regarding TSP for one hour average basis are given in Tables 3 and 4 while comparison of 24 hours mean values with NEQs- Pakistan is given in Figure 4.
The monitored data regarding TSPreported by various laboratories is given in Table 8. Monitoring results from all listed organizations except EPA were available. Higher levels of TSP were monitored in Faisalabad in 1996 and reported by FBS in 1998 as given in Table 8 which then further increased and in 2002 became much higher as compared to previously monitored level in 1996. Similarly, increased levels of TSP both along roadsides and in industrial areas have also been reported in 2009. The lower levels of TSP monitored in 2009 were found because monitored data depends upon weather conditions, range, sensitivity and resolution of monitoring and sampling equipment used and location of selected monitoring sites. However, an overall increase in NO2 levels was observed over the years from 1996 to 2009. RESPIRABLE PARTICULATE MATTER (PM10) The monitored data regarding Respirable Particulate Matter (PM10) for 1 hour basis varies between 222 µg/m3and 824 µg/m3 as shown in Tables 3 and 4. The highest value for 1 hour basis was observed on location 7 near Incinerator of Allied Hospital while the lowest value wa measured on location 1 Dost Street near Ittehad Welfare Dispensary, Samundari Road. The data monitored regarding PM10for 24 hours average basis in Faisalabad range between 246 µg/m3and 622 µg/m3. The monitored values for 24 hours average basis indicate that concentration of particulate matter along road sides is
0 10 20 30 40 50
SO2
Dost Street
Faisal Street
Narwala Chowk
Raza-bad
G.M.Abad
SMIE
Allied Hospital
Ashrafabad
Kashmir Road
MMTH
NEQS
Loca
tion NEQs
SO2(ppb)
Loca
tio
n
SO2
SO2
(ppb)

Academia Journal of Environmental Sciences; Bharwana et al. 022
Table 3. Monitored data regarding ambient air particulates (1 h average).
Location 1: Dost Street near Ittehad Welfare Dispensary, Samundari Road
Sample No.
Start Completion TSP(µg/m3)
PM10(µg/m3)
Date Time Date Time
1 24-11-09 08:00 24-11-09 09:00 432 270
2 24-11-09 14:00 24-11-09 15:00 314 248
3 24-11-09 20:00 24-11-09 21:00 388 222
24 h average 378 246
Location 2: Faisal Street near Husain Wheat Thresher, Samundari Road
Sample No.
Start Completion TSP(µg/m3)
PM10(µg/m3)
Date Time Date Time
1 24-11-09 10:00 24-11-09 11:00 564 282
2 24-11-09 16:00 24-11-09 17:00 348 246
3 24-11-09 22:00 24-11-09 23:00 485 262
24 h average 465 263
Location 3: Station Point near HaqBahu Pan Shop, NarwalaChowk
Sample No.
Start Completion TSP(µg/m3)
PM10(µg/m3)
Date Time Date Time
1 24-11-09 12:00 24-11-09 13:00 1822 824
2 24-11-09 18:00 24-11-09 19:00 1025 418
3 25-11-09 24:00 25-11-09 01:00 1544 626
24 h average 1463 622
Location 4: Razabad
Sample No.
Start Completion TSP(µg/m3)
PM10(µg/m3)
Date Time Date Time
1 25-11-09 08:00 25-11-09 09:00 698 314
2 25-11-09 14:00 25-11-09 15:00 480 305
3 25-11-09 20:00 25-11-09 21:00 318 243
24 h average 498 287
Location 5: Rahmanabad/ Ghulam Muhammad Abad
Sample No.
Start Completion TSP(µg/m3)
PM10(µg/m3)
Date Time Date Time
1 25-11-09 10:00 25-11-09 11:00 706 332
2 25-11-09 16:00 25-11-09 17:00 720 348
3 25-11-09 22:00 25-11-09 23:00 578 306
24 h average 668 326
greater than in industrial areas. The PM10 values monitored along all road sides including NarwalaChowk (622 µg/m3), Mian Muhammad Trust Hospital (534 µg/m3) and Allied Hospital (316 µg/m3) range between 316-622 µg/m3. The reason for such higher PM10 value was the fuel combustion by vehicles, poor road construction, poor sanitation conditions and industrial releases reaching here along with air current.Like TSP, comparatively low values of PM10 were obtained in industrial areas as compared to those monitored in traffic areas. However, due to uniform mixing
in air and having low weight, the values of PM10 are still high enough to pose health effects on people and other flora and fauna of these areas.
NEQs-Pakistan gives 24-hours average standard value of 250µg/m3 for PM10. The values monitored at NarwalaChowk, Allied Hospital and Mian Muhammad Trust Hospital wasvery high compared to NEQs-Pakistan. The monitored and processed data obtained at all measurement sites except Dost Street are in violation of NEQs-Pakistan. The values of monitored data regarding PM10 for one hour

Academia Journal of Environmental Sciences; Bharwana et al. 023
Table 4. Monitored data regarding ambient air particulates (1 h average).
Location 6: Small industrial estate
Sample No.
Start Completion TSP(µg/m3)
PM10(µg/m3)
Date Time Date Time
1 25-11-09 12:00 25-11-09 13:00 924 468
2 25-11-09 18:00 25-11-09 19:00 714 332
3 26-11-09 24:00 26-11-09 01:00 786 356
24 h average 808 385
Location 7: Allied Hospital near Incinerator
Sample No.
Start Completion TSP(µg/m3)
PM10(µg/m3)
Date Time Date Time
1 26-11-09 08:00 26-11-09 09:00 878 332
2 26-11-09 14:00 26-11-09 15:00 865 320
3 26-11-09 20:00 26-11-09 21:00 815 298
24 h average 852 316
Location 8: St. No. 2 Ashrafabad, SKB Road
Sample No.
Start Completion TSP(µg/m3)
PM10(µg/m3)
Date Time Date Time
1 26-11-09 10:00 26-11-09 11:00 426 320
2 26-11-09 16:00 26-11-09 17:00 410 255
3 26-11-09 22:00 26-11-09 23:00 342 342
24 h average 392 305
Location 9: Malikpur, Kashmir Road
Sample No.
Start Completion TSP(µg/m3)
PM10(µg/m3)
Date Time Date Time
1 26-11-09 12:00 26-11-09 13:00 394 268
2 26-11-09 18:00 26-11-09 19:00 364 253
3 27-11-09 24:00 27-11-09 01:00 323 245
24 h average 360 255
Location 10: Near Mian Muhammad Trust Hospital
Sample No.
Start Completion TSP(µg/m3)
PM10(µg/m3)
Date Time Date Time
1 27-11-09 08:00 27-11-09 09:00 1445 788
2 27-11-09 14:00 27-11-09 15:00 1320 514
3 27-11-09 20:00 27-11-09 21:00 940 302
24 h average 1235 534
average basis are given in Tables 3 and 4 while comparison of 24 hours mean values with NEQs-Pakistan is given in Figure 5.
The PM10 is the only parameter for which monitored data have been reported from all listed departments along with results currently obtained values in 2009. Monitoring results are reproduced in Table 8. Higher levels of PM10
were detectedin Faisalabad every time when monitoring was carried out i.e. in 1996, 2002, 2005 and now in 2009. The ups and downs in level of PM10 reported during different time periods depends upon various factors
including whether conditions, monitoring start and ending times, range, sensitivity and resolution of monitoring and sampling equipment used and location of selected monitoring sites. However, an overall increase in PM10 levels is observed over the year from 1996 to 2009 (Air quality guidelines for Europe and Geneva, 2000). NOISE LEVELS The data monitored (1-hour interval) regarding Noise in

Academia Journal of Environmental Sciences; Bharwana et al. 024
Figure 4. 24 h average concentration of TSP at Faisalabad.
Figure 5. 24 h average concentration of PM10 at Faisalabad.
the industrial area of Faisalabad range between 63-67 dB (A) for day time, while for night time the observed value was 66 dB (A) and both were complying NEQs- Pakistan limiting values as presented in Tables 5 and 6. Similarly data monitored along roadsides (Table 8) ranges from 58-74 dB (A) and they are complying with NEQs-Pakistan limiting value of 85 dB (A). The monitored values indicate that noise levels along road sides are greater than in industrial areas. The reason for higher noise level in traffic area wasdue to the greater number of noise sources on roads than in industrial areas. Also, walls of industrial units and other structures act as sound barriers in industrial units while road sides lack any sound reducers.
The data monitored (1-hour interval) regarding Noise in the residential areas of Faisalabad ranges between 73-76 dB (A) for day time and violating the limiting value of NEQs-Pakistan which is 65 dB (A) while for night time it ranges between 60-71 dB (A) and violating the NEQs-
Pakistan value of 50 dB (A). Similarly, the values measured in commercial area were also violating the limiting values of NEQs-Pakistan which 70 dB (A) for day time and 60 dB (A) for night time. The observed values range between 74-81 dB (A) for day time while at night time, it was observed as 82 dB (A). The higher values in commercial area were due to the rush of people because of the Eid Day shopping and people usually use to go for shopping during night times.
The values measured (1-hour interval) regarding Noise in the silence zones of Faisalabad range between 72-79 dB (A) for day time and are violating the NEQs-Pakistan value of 55 dB (A) in the same way the values for night time were observed between 70-73 dB (A) for night time and both sampling points were violating NEQs-Pakistan Value of 45 dB (A), as presented in Table 4. These high values of Noise Level were due to the rush of patients with in the hospital and arrival of vehicles in the area. Noise levels monitored
0 500 1000 1500
Total Suspended Particles
Dost Street
Faisal Street
Narwala Chowk
Raza-bad
G.M.Abad
SMIE
Allied Hospital
Ashrafabad
Kashmir Road
MMTH
NEQs
Loca
tion
NEQs
TSP (µg/m3)
TSP (µg/m3)
TSP
SO2
Loca
tio
n
0 200 400 600 800
PM 10
Dost Street
Faisal Street
Narwala Chowk
Raza-bad
G.M.Abad
SMIE
Allied Hospital
Ashrafabad
Kashmir Road
MMTH
NEQs
Loca
tion
NEQs
PM 10 (µg/m3)
PM10
Loca
tio
n
PM10 (µg/m3)

Academia Journal of Environmental Sciences; Bharwana et al. 025
Table 5. Monitored data regarding noise levels (1h Average).
Location 1: Dost Street near Ittehad Welfare Dispensary, Samundari Road
Sample No. Start Completion NoisedB(A)
Date Time Date Time
1 24-11-09 08:00 24-11-09 09:00 71
2 24-11-09 14:00 24-11-09 15:00 64
3 24-11-09 20:00 24-11-09 21:00 60
24 h average 65
Location 2: Faisal Street near Husain Wheat Thresher, Samundari Road
Sample No. Start Completion NoisedB(A)
Date Time Date Time
1 24-11-09 10:00 24-11-09 11:00 70
2 24-11-09 16:00 24-11-09 17:00 58
3 24-11-09 22:00 24-11-09 23:00 73
24 h average 67
LOCATION 3: St. Point near HaqBahu Pan Shop, NarwalaChowk(Commercial Area)
Sample No. Start Completion NoisedB(A)
Date Time Date Time
1 24-11-09 12:00 24-11-09 13:00 81
2 24-11-09 18:00 24-11-09 19:00 74
3 25-11-09 24:00 25-11-09 01:00 82
24 h average 79
Location 4: Razabad(Residential Area)
Sample No.
Start Completion NoisedB(A)
Date Time Date Time
1 25-11-09 8:00 25-11-09 9:00 73
2 25-11-09 14:00 25-11-09 15:00 64
3 25-11-09 20:00 25-11-09 21:00 60
24 h average 65
Location 5: Rahmanabad/ Ghulam Muhammad Abad(Residential Area)
Sample No.
Start Completion NoisedB(A)
Date Time Time
1 25-11-09 10:00 25-11-09 11:00 74
2 25-11-09 16:00 25-11-09 17:00 76
3 25-11-09 22:00 25-11-09 23:00 73
24 h average 74
Table 6. Monitored data regarding noise levels (1 h Average).
Location 6: Small Industrial Estate(Industrial Area)
Sample No. Start Completion NoisedB(A)
Date Time Date Time
1 25-11-09 12:00 25-11-09 13:00 67
2 25-11-09 18:00 25-11-09 19:00 63
3 26-11-09 24:00 26-11-09 01:00 66
24 h average 65

Academia Journal of Environmental Sciences; Bharwana et al. 026
Table 5. cont.
Location 7:Allied Hospital near Incinerator(Silence Zone)
Sample No. Start Completion NoisedB(A)
Date Time Time
1 26-11-09 08:00 26-11-09 09:00 72
2 26-11-09 14:00 26-11-09 15:00 74
3 26-11-09 20:00 26-11-09 21:00 73
24 h average 73
Location 8: St. No. 2 Ashrafabad, SKB Road
Sample No. Start Completion NoisedB(A)
Date Time Time
1 26-11-09 08:00 26-11-09 09:00 72
2 26-11-09 14:00 26-11-09 15:00 74
3 26-11-09 20:00 26-11-09 21:00 73
24 h average 73
Location 9: Malikpur, Kashmir Road
Sample No.
Start Completion Noise dB(A)
Date Time Time
1 26-11-09 12:00 26-11-09 13:00 65
2 26-11-09 18:00 26-11-09 19:00 60
3 27-11-09 24:00 27-11-09 01:00 66
24 h average 63
Location 10: Near Mian Muhammad Trust Hospital(Silence Zone)
Sample No.
Start Completion NoisedB(A)
Date Time Time
1 26-11-09 8:00 26-11-09 09:00 79
2 26-11-09 14:00 26-11-09 15:00 77
3 26-11-09 20:00 26-11-09 21:00 70
24 h average 75
Table 7. Comparison of noise levels of Faisalabad with NEQs-Pakistan.
Reference Standard Specification of area Limiting
value dB (A)
No. of sampling Points
Sampling points in violations (1 h interval basis)
NEQS-Pakistan value
(day time) 6 am to 10 pm
For industrial Area 80 1 0
For residential Area 65 2 2
For commercial Area 70 1 1
For silence zone 55 2 1
NEQS-Pakistan value (night time) 10 pm to 6am
For industrial area 75 1 0
For residential area 50 2 2
For commercial area 60 1 1
For silence zone 45 2 1
NEQS of for vehicle noise Roadside 85 4 0

Academia Journal of Environmental Sciences; Bharwana et al. 027
Table 8. Over the years in Faisalabad.
Monitoring Site Parameter FBS (1996) JICA (2002) EPA (2005) Observed value (2009)
Road Side CO --- 7.0 --- 8.3
NO2 8.2 75.1 --- 54.4 (as NO2)
SO2 6.8 --- --- 47.2
TSP (µg/m3) 870 3477 --- 1463
PM10(µg/m3) 490 815 112 622
dB(A) ---- 89 ---- 79
Industrial CO ---- 0.2 --- 3.4
NO2 7.1 29.1 --- 40.8 (as NO2)
SO2 5.5 --- --- 33.2
TSP (µg/m3) 685 1400 --- 808
PM10(µg/m3) 440 381 500 385
dB(A) ---- 60 ---- 74
data as reported from JICA and recently measured values are presented in Table 8 and this comparison is showing that Noise level along road side is decreased while in industrial area it is increased. The decrease along roadside may be due to different traffic patterns and different timings and days because value of Noise level varies between different time intervals. The increase in Noise level of industrial area is because of rapid industrialization in Faisalabad city. CONCLUSION The present state of quality of air requires an immediate action to overcome this problem in an industrial city of Pakistan. The implementation of air quality standards and guidelines, an establishment of continuous monitoring systems, and the improvement of emission control technologies and strategies are essential. REFERENCES Aina TA, Davilla JD, Hardoy JE, Satterthwaite D (1989). eds. Environment
and Urbanization: Environmental Problems in the Third World Cities. 1: 1.Printed by the Russell Press, Nottingham, United Kingdom.
World Health Organization Regional Office for Europe (2000). Air quality guidelines for Europe. Copenhagen (WHO Regional Publications, European Series No. 91).
Aziz JA, Quraishi TA (2002). Ambient particulate and carbon monoxide measurements in Pakistan. Res. J. Univ. Eng. Technol. Lahore, Pakistan. 13:1–3.
Aziz JA (1999). Legislative and regulatory considerations in EIA. In: Proceedings of the short course on practical IEE/EIA, 15–17 February, 1999. Lahore, Pakistan, Instittute of Environmental Engineering and Research.
Aziz JA (2006). Report towards establishing air quality guidelines for Pakistan. J. Env. Res.12(6):886-893.
Badar G, Arifa L, Mansha M (2007). Development of baseline (air quality) data in Pakistan. Env. Monitoring and assessment. 127(1-3):237-252.
Badar G, Mnazar SM, Ishaq M (1994). An assessment of air quality in Karachi, Pakistan. Env. Monitoring and assessment. 32(1):37-45.
Carbajo JC, Faiz A (1994). Motor vehicle emissions control: some policy options for developing countries. The Sci. Total Environ. 146:11-18.
Guidelines for air quality. Geneva, World Health Organization (2000). (WHO/SDE/OEH/00.02).
EPD (1997). Environmental Protection Department, Pakistan. Ambient air surveillance in big cities of Punjab. Lahore.
Hayat S (1994). Country report: Pakistan air pollution control. Presented at WHO Regional training course on GEM/air quality monitoring. World Health Organization Centre for Environmental Health Activities, Amman, Jordan, 23–27.
Japan International Corportion Agency/Pakisstan Environmental Protection Agency (Islamabad, 2000). Lahore, Rawalpindi, Islamabad, Investigation of air and water quality.
Majeed K (1996). Measurements of total suspended particulates and lead concentrattions in the ambient air of Gujranwala [MSc thesis]. Lahore, Pakistan, Institute of Public Health Engineering and Research, University of Engineering and Technology.
Mehboob A, Makshoof A (2008). Air pollution due to traffic, air quality monitoring along the sections of National Highway N-5 Pakistan. Environment Monitoring and assessment. 136(1-3):219-226.
Montgomery JD (1990). Environmental management as a third world problem. Pol. Sci. 23:163-176.
National air quality and emissions trends report (1992). North Carolina, United States Environment Protection Agency, Office of Air Quality and Standards, 1993 (EPA 454/R-93-031).
Nizami HM (1985). Environmental pollution in the city and its problems. Karachi, Institute of Environmental Studies, University of Karrachi and Karachi Development Authority.
Rehman ZU, Ali I (1994). Environmental impact assessment of air pollution, Karachi. Presented at WHO Regional training course on GEM/air quality monitoring. World Health Organization Centre for Environmental Health Activities, Amman, Jordan.
Schwela D (1997). Air quality guidelines/standards in healthy cities. Geneva, World Health Organization, (CD-ROM of the Health Cities Air Management Information System AMIS 10)
Shahida W, Rahman A, Khalid N, Shujaat A (2006). Assessment of air quality of two metropolitan cities in Pakistan: Elemental analysis using INAA and AAS. Radiochimica Acta. 94(3):161-166.
Shamsi SRA, Ashmore MR, Bell JNB, Maggs R, Kafiat U, Wahid A (2000). The impacts of air pollution on crops in developing countries – A case study in Pakistan. In: Environmental Stress: Indication, Mitigation and Eco-conservation (Yunuset al., eds.). Kluwer Academic Publishers, the Netherlands. pp.63-72.
Tariq MN, Ali W (1998). Air quality surveillance needs of Pakistan. A Report for the Government of Pakistan and Commission of European Communities (Tariq. M.N. and Hayat, T.A.Q.S., eds.) Govt. of Pakistan, Ministry of Housing and Works: Environment and Urban Affairs
Academia Journal of Environmental Sciences; Bharwana et al. 028
Division, Islamabad. Valerie G, Jean S, Yong Yu (2007). Air quality measurements in megacities:
focus on gaseous organic and particulate pollutants and comparison between two contrasted cities, Paris and Bejing. Comptes Rendus Geoscience. 339(11-12):764-774.
Wahid A, Shamsi SRA, Maggs R, Bell JNB, Ashmore MR (1994). The impact of ambient air pollution on agricultural crops in Punjab, Final Technical Report. European Commission Res. Pro. No.CI 1-CT90-0789.
Yousufzai AHK, Hashmi DR (1997). Measurements of major ambient air pollution compponents at a sub-urban area of Karachi. Pak. J. Sci. Industr. Res. 3:54-67.
Cite this article as: Bharwana SA, Ali S, Farid M, Jamshaid M, Azeem M, Shakoor MB, Ahmad R, Hannan F (2014). Noise and ambient air pollution monitoring and its effects on local community in Faisalabad, Pakistan. Acad. J. Environ. Sci. 2(2): 015-028. Submit your manuscript at: www.academiapublishing.org/journals/ajes