20th-century u.s. generations · population bulletin march 2009 vol. 64, no. 1 population...
TRANSCRIPT

Pop
ulation
Bulletin
www.prb.org
march 2009
Vol. 64, No. 1
PoPulation RefeRence BuReau
20th-Century u.S. GenerationS
Vol. 64, No. 1
march 2009
BY elwood CarlSon

ABout the Author elwood caRlson is the Charles B. Nam Professor in Sociology of
Population at Florida State University. His research concentrates on
generational cycles in populations, social determinants of infant and
reproductive health, and working-age mortality, using evidence from
Europe and the Middle East as well as American society.
This Population Bulletin benefited from suggestions of several
anonymous reviewers.
PoPUlATioN BUllETiN 64.1 2009
PoPulAtioN refereNce BureAu
The Population Reference Bureau infoRms people around the world about population, health, and the environment, and emPoweRs them to use that information to advance the well-being of current and future generations.
Funding for this Population Bulletin was provided through the generosity of the William and Flora Hewlett Foundation, and the David and lucile Packard Foundation.
officers
Francis L. Price, Chairman of the Board President and Chief Executive officer, Q3 Stamped Metal, inc. and Q3 JMC inc., Columbus, ohio
Faith mitchell, Vice Chairwoman of the Board Vice President for Program and Strategy, Grantmakers in Health, Washington, D.C.
montague Yudelman, Secretary of the Board Senior Fellow, World Wildlife Fund, Washington, D.C.
richard F. hokenson, Treasurer of the Board Director, Hokenson and Company, lawrenceville, New Jersey
William P. Butz, President and Chief Executive officer Population Reference Bureau, Washington, D.C.
trustees
George alleyne, Director Emeritus, Pan American Health organization/World Health organization, Washington, D.C.
Wendy Baldwin, Director, Poverty, Gender, and Youth Program, The Population Council, New York
Felicity Barringer, National Correspondent, Environment, The New York Times, San Francisco
Joel E. cohen, Abby Rockefeller Mauzé Professor of Populations, Rockefeller University and Head, laboratory of Populations, Rockefeller and Columbia Universities, New York
Bert T. Edwards, Executive Director, office of Historical Trust Accounting, Department of the interior, Washington, D.C.
Wolfgang Lutz, Professor and leader, World Population Project, international institute for Applied Systems Analysis and Director, Vienna institute of Demography of the Austrian Academy of Sciences, Vienna, Austria
Elizabeth maguire, President and Chief Executive officer, ipas, Chapel Hill, North Carolina
Leela Visaria, independent Researcher, Ahmedabad, india
marlene Lee, Population Bulletin Editor; Senior Research Associate, Domestic Programs
Eric Zuehlke, Editor
michelle corbett, Black Mountain Creative, Design and Production
The Population Bulletin is published four times a year and distributed to members of the Population Reference Bureau. Population Bulletins are also available for $7 each (discounts for bulk orders). To become a PRB member or to order PRB materials, contact PRB, 1875 Connecticut Ave., NW, Suite 520, Washington, DC 20009-5728; Tel.: 800-877-9881; Fax: 202-328-3937; E-mail: [email protected]; Website: www.prb.org.
the suggested citation, if you quote from this publication, is: Elwood Carlson, “20th-Century U.S. Generations,” Population Bulletin 64, no. 1 (2009). For permission to reproduce portions from the Population Bulletin, write to PRB, Attn: Permissions; or e-mail: [email protected].
Cover photo: © 2001-2009 by Corbis Corporation. All visual media © by Corbis Corporation and/or its media providers.
© 2009 Population Reference Bureau. All rights reserved. iSSN 0032-468X

www.prb.org PoPUlATioN BUllETiN 64.1 2009 1
intRoduction .............................................................................................................................2
defining geneRations ......................................................................................................2
the RolleR coasteR of geneRation size ....................................................3Box 1. Seven U.S. Generations ........................................................................................3figure 1. U.S. Generations at Age 30 ........................................................................4
contRasts in childhood...............................................................................................4table 1. Parental Households for Children Under Age 10 by Generation ..................................................................................................................................5
Rise of mass education ..................................................................................................5table 2. Completed Education for Generations of Men and Women ..........................................................................................................................5
JoBs foR geneRations .....................................................................................................5Box 2. Cohort Size and Personal Welfare According to Easterlin .........................................................................................................................................6figure 2. Percent Employed by Age and Generation for Men and Women ..................................................................................................................7
fall and Rise of maRRiage ages ...........................................................................7Table 3. Percent Ever Married by Sex and Percent of Women With Births at Age 20 and 29 ..............................................................................................8
motheRhood mania and the BaBy Boom......................................................8
tRansfoRmation of occuPations ......................................................................8table 4. occupations for Generations of Men and Women in Midlife ...................................................................................................9
union Boom ................................................................................................................................10table 5. Percent of Men in labor Unions .............................................................10
militaRy seRvice ...................................................................................................................10figure 3. Years of Active Duty per 100 Person-Years lived, Ages 17-54 ......................................................................................................................................10
Political identities..........................................................................................................11figure 4. Political identities of Generations .......................................................11
national oRigins and Race ......................................................................................12
suRvival of geneRations ...........................................................................................12table 6. Dependents by Age and Sex per Employed Worker .............12
disaBility vs. active life ............................................................................................13
maRRiage ......................................................................................................................................13figure 5. Marital Status by Sex and Generation at Median Age 70................14
tRends in indePendent living ..............................................................................13figure 6. living Arrangements by Sex and Generation at Median Age 70 .........................................................................................15
geneRational contRasts .........................................................................................15
RefeRences ...............................................................................................................................16
table of Contents
march 2009
Vol. 64, No. 1
20th-ceNtury U.s. Generations
PoPulation RefeRence BuReau
Population Bulletin
BY elwood CarlSon

www.prb.org PoPUlATioN BUllETiN 64.1 20092
The myriad decisions we make throughout our lives—choices
about education, joining the military, marriage, having children,
changing jobs, moving, caring for aging parents, saving for retirement,
and dealing with challenges in old age—affect not only our individual
lives, but public policy and business practices as well.
20th-Century U.s. Generations
Generation size influences opportunities for education, career access and advance-ment, and retirement. The composition of a generation influences attitudes about immigrants and the mean-ing of concepts like race.
The share of employed women in the clerical/secretarial “pink collar ghetto” peaked for the Lucky Few generation.
IN 1900,children without both parents usually lived with grandparents, but by 2000, living with an unmarried mother became the most common alternative.
The seven generations in this comparison start as far back as 1870, the decade following the Civil War, and cover the entire period from then to the end of the 20th century.
Governments formulate laws and policies about child and health care and Social Security based on the life choices they expect us to make. Private businesses make plans based on the life choices they expect from us as employees and customers. The 2008 U.S. presidential election clearly demonstrated that individual choices and expectations vary considerably across U.S. generations. Generational differences in demographic experiences provide some clues about the sources of the generational divide seen in some political, social, and consumption choices.
By virtue of when they were born, members of each generation live through unique times shaped by unexpected historical events, changing political climates, and evolving socioeconomic conditions. Generations also come in different sizes and changing mixtures of ethnicity, helping to shape the choices individuals will make in life. A generational perspective offers fresh insights into contemporary society by emphasizing both the distinctiveness of each generation in its particular historical context and the persistence of such distinctions across an individual’s life.
When different generations respond in unique ways to common problems and choices, businesses, governments, and we as individuals need to recognize and understand such
distinctions. This Population Bulletin highlights contrasting American generations of the 20th
century, showing how each one influenced and reacted to the social and economic landscape over which we all must travel during our lives.
Defining GenerationsPeople use the word “generation” in two distinct ways. A family generation counts the years between the births of each parent and child. Because the ages of the mother and father differ, parents of the same child can have different family generation lengths.1 Since babies are born every day, these personal generations do not translate into distinct groups in any larger population at any particular time. individuals with family generation length of 20 years, for example, could consist of 30-year-olds each with a 10-year-old child and 50-year-olds with 30-year-old children.
in contrast, all people born together in a particular year or group of years (groups Norman Ryder preferred to call “cohorts”) are sometimes also called historical or cohort generations.2 As William Straus and Neil Howe write in Generations: The History of America’s Future, “…cohort generations are to societies what family generations are to families...the earlier generation is always older than the next and normally exercises authority over those that follow—the cohort type in a public setting, the family type in a private setting.”3
A recent study of the United States identifies seven historical generations (groups of annual birth
33%

www.prb.org PoPUlATioN BUllETiN 64.1 2009 3
Box 1
seven u.s. Generations1. The New Worlders (born from 1871 through 1889, median member born in 1880) lived on farms more than any other American generation during the 20th century. One-fifth of all children born into this generation died in childhood. They are known as New Worlders because about one of every four people in this generation immigrated to the United States.
2. The Hard Timers (born from 1890 through 1908, median member born in 1899) first fought in World War I, then struggled through the Great Depression, and finally finished their working lives in the wartime economy of World War II. They often married late, had fewer children, and generally had the fewest choices about the direction of their lives of any generation during the century.
3. The Good Warriors (born from 1909 through 1928, median member born in 1918) were called the Greatest Generation by Tom Brokaw in 1998. They fought in World War II and led all other generations in blue-collar jobs and union membership. They and the Lucky Few were the most native-born generations in U.S. history.
4. The Lucky Few (born from 1929 through 1945, median member born in 1937) had the smallest share of immigrants of any generation in the century, and were the first generation in U.S. history with fewer people than the preceding generation.
Many educated Lucky Few men skipped blue-collar jobs for white-collar careers. Their military service came mostly during peacetime rather than wartime. Lucky Few women married earlier than any other generation in U.S. history.
5. The Baby Boomers (born from 1946 through 1964, median member born in 1955) nearly doubled the number of people in the Lucky Few to become the largest generation of the century. While baby-boomer men had problems finding jobs, women in this generation nearly matched men in education and made great strides in the career world.
6. Generation X (born from 1965 through 1982, median member born in 1974) marks the first generation with a greater share of women than men graduating from college. Generation X once again includes many foreign-born immigrants. They delayed marriage and parenthood more than any other generation before them in the century. Men continued to struggle with jobs while women moved forward in careers as well as education.
7. The New Boomers (born from 1983 through 2001, median member born in 1992) include almost as many births as the original baby boom and will add a larger share of new immigrants in adulthood than any generation since the New Worlders. They will become the largest generation of any living during the century. Most of their lives will take place in the 21st century, however, so we only get a few hints about them here.
source: Elwood Carlson, The Lucky Few: Between the Greatest Generation and the Baby Boom (New York: Springer Publishers, 2008).
cohorts set off from other groups by strong historical boundaries) who composed American society during the 20th century.4 The seven generations compared here start as far back as 1870, the decade following the Civil War, and cover the entire period from then to the end of the 20th century. Each generation’s name reflects its most distinctive demographic feature or historical experience. Most names of the youngest generations (such as the baby boomers and Generation X) are borrowed from conventional usage, but some of the earliest generations, such as the New Worlders and Hard Timers, required new names of their own (see Box 1).
The Roller Coaster of Generation SizeGenerations mattered so much throughout the 20th century partly because they were not all the same size. Generations did not even exhibit a smooth, steady increase in population from one generation to the next. Generation sizes at age 30, shown in Figure 1 (page 4), instead reveal a series of demographic booms and busts. After a couple of decades of population growth for early generations due to natural increase and a wave of immigration, the lucky Few (those born during the Great Depression and World War ii, when birth
rates fell to historic lows) gave us the first generation in U.S. history smaller than the one before it.5 While some scholars further subdivide this group (the “depression kids” and “war babies”),6 we count them together based on the common ground of small annual birth cohorts. No sooner had this unusual generation appeared than the birth rate exploded in the postwar period to produce the baby-boom generation, nearly twice the size of the lucky Few. When this huge group ran into problems in life, birth rates fell again, and Generation X repeated the pattern of being a generation smaller than the one before it.7 Since then, birth rates have recovered to yield the New Boomer generation, reinforced by a new tide of immigration to make it the biggest generation yet in U.S. history.
This picture would shift slightly if we observed these generations at a different age. For example, a picture of relative generation sizes at birth instead of age 30 would show the earliest generations as relatively larger than they appear in Figure 1 because one-fifth of all children died before age 15. By contrast, the later generations were born when the risk of infant and child deaths had fallen dramatically, losing few members before age 15 and gaining millions of new members between the ages of 15 and 30 as new immigrants

www.prb.org PoPUlATioN BUllETiN 64.1 20094
note: Projections used for Generation Xers and New Boomers born after 1978. sources: U.S. Census Bureau, Series P-25 Population Estimates and Projections, numbers 311, 314, 321, 352, 441, 519, 917, 1045, 1957, and 1095 (www.census.gov, accessed Mar. 11, 2008).
18
70
18
80
18
90
19
00
19
10
19
20
19
30
19
40
19
50
19
60
19
70
19
80
19
90
20
00
New Worlders1871-1889
Hard Timers1890-1908
Good Warriors1909-1928
Lucky Few1929-1945
Baby Boomers1946-1964
Generation X1965-1982
New Boomers1983-2001
Millions of Persons
Year of Birth (t-30)
5
4
3
2
1
0
outnumbered the deaths of young adults. Similarly, improvements in the likelihood of surviving to old age meant that by 2007, when the lucky Few reached a median age of 70, this generation was larger than the Good Warrior generation had been in 1988 at the same median age.
Contrasts in Childhood Differences in the lives of U.S. generations during the 20th century started in childhood. These contrasts ranged from where they lived to the makeup of family households. For instance, nearly half (41 percent) of Hard Timer children counted at ages under 10 in the 1900 and 1910 censuses lived on farms.8 About one-third (35 percent) of children under age 10 in the Good Warrior generation in 1910, 1920, and 1930 still lived on farms. For lucky Few children, this share dropped to one-fourth (26 percent), while less than a tenth (9 percent) of baby boomers were counted on farms as children. only 1 percent or 2 percent of Generation X and the New Boomers were ever counted by a census as children living on farms; for most of them farms became places where they might visit an elderly relative on rare occasions.
inside their homes, generations of children experienced the ebb and flow of a tide of family disruption during the 20th century. High death rates in the early 1900s led to a large number of widowed parents and orphans for the first two generations of the 20th century, as documented in Table 1 (page 5) showing the presence of parents in children’s households.
As death rates fell, later generations of children were more likely to live with both parents—the middle generations of the 20th century came closer than any other generation in U.S. history to achieving the traditional ideal of a married mother and father living together in an independent household with their children.9 Almost 90 percent of all children under age 10 in the Good Warrior generation were living with both their parents when captured by census counts around mid-century. Together with the lucky Few and the baby boomers, Good Warriors experienced childhood during the high tide of stable, intact nuclear family households.
After mid-century, this high tide of two-parent homes ebbed because delayed marriage and increasing divorce rates outweighed continued improvements in survival. Generation X children lived less often with both parents than any of the earlier generations in the 20th century. When counted in the 1990 and 2000 censuses, more than one-fourth of all New Boomer children under age 10 appeared in homes missing one or both parents.
in 1900, children without both parents usually lived with grandparents, but by 2000, living with an unmarried mother became the most common alternative. Such census counts only give cross-sectional “snapshots” of the population; even greater shares of children in each generation actually experienced missing parents at some time between birth and the end of childhood.
fiGure 1
U.S. Generations at age 30 (With Projections for Births after 1978)

www.prb.org PoPUlATioN BUllETiN 64.1 2009 5
Rise of Mass EducationBeyond the family makeup of their households, children in different generations experienced another fundamental change over the course of the 20th century. Spurred by two major changes in law and policy, formal schooling expanded to dominate childhood and adolescence between 1900 and 2000.10 The first change outlawed child labor in industry, removing the earlier incentive for families to put children to work rather than keeping them in school.11 The second change made school attendance compulsory up to a minimum age.12
Table 2 shows how this expansion of formal schooling affected successive generations. over 80 percent of adult New Worlders left school without finishing the 12th grade, and only about one in 20 finished college. Hard Timers only went a little further in school—fully three-fourths of them never completed 12th grade and very few graduated from college. The Good Warrior generation made the first big jump toward mass education, with about half of them completing high school and a noticeably larger share than for earlier generations graduating from college. However, lucky Few men promptly outdid the achievements of the Good Warriors with the largest schooling improvement of the century. More than three-fourths of all lucky Few men finished high school and about one-fourth of them graduated from college—more than double the share of male college graduates in the Good Warrior generation.
lucky Few women made almost as much progress as men in completing high school, but this generation of women lagged far behind men in graduating from college. As a result, the college gap between women and men opened wider among the lucky Few than in any other generation in U.S. history. Earlier generations had
less education, so naturally the gap between men and women was much smaller. But both the baby boomers and Generation X, who completed even more education than the lucky Few, registered a more equal pattern of college attendance for men and women. in fact, in Generation X, a greater percentage of women graduated from college than men for the first time.
Jobs for GenerationsUnlike these continued gains in education from one generation to the next, contrasting generation sizes translated into uneven results for people in their first direct encounter with market forces—their entry into paying jobs. As Easterlin and oppenheimer pointed out, the small lucky Few generation came along just in time for a sustained postwar economic expansion beginning in the 1950s, a classic combination of a shrinking supply of labor combined with a strongly expanding demand for workers.13 By contrast, the arrival of the huge baby-boom generation in the work force coincided with the oil shock and economic slump of the 1970s—an equally classic combination
tABle 1
Parental households for children Under age 10 by Generation (Percent)
note: Each generation of children spans multiple censuses to count each child exactly once before age 10; e.g., baby boomers enumerated at ages under 10 in the 1950, 1960, and 1970 censuses combine to produce figures shown. source: original calculations from U.S. Census integrated Public Use Microdata Samples.
GeNeraTioNBoTH
PareNTsMoTHer
oNLyFaTHer
oNLyNeiTHer PareNT
Hard Timers 81 6 2 11
Good Warriors 89 3 1 7
Lucky Few 85 4 1 9
Baby Boomers 86 6 1 7
Generation X 79 12 2 7
New Boomers 69 16 4 11
tABle 2
completed Education for Generations of men and Women (Percent)
source: original calculations from integrated Public Use Microdata Samples of 1940 and 1960 censuses, and 1977, 1996, and 2007 Current Population Surveys.
GeNeraTioNsLess THaN
HiGH scHooLHiGH scHooL
Grad4 years oF
coLLeGe
NeW WorLders (aGes 51 To 69 iN 1940)
Men 84 11 4
Women 82 15 3
Hard TiMers (aGes 32 To 50 iN 1940)
Men 77 17 6
Women 73 23 4
Good Warriors (aGes 32 To 48 iN 1960)
Men 54 35 11
Women 50 44 6
LUcKy FeW (aGes 32 To 48 iN 1977)
Men 25 52 23
Women 25 61 13
BaBy BooMers (aGes 32 To 50 iN 1996)
Men 13 59 28
Women 12 62 26
GeNeraTioN X (aGes 24 To 42 iN 2007)
Men 14 56 30
Women 11 55 34

www.prb.org PoPUlATioN BUllETiN 64.1 20096
Box 2
cohort size and Personal Welfare According to easterlinRichard Easterlin laid the groundwork for many of the ideas in this Bulletin in a slim, influential volume published nearly 30 years ago. The highlights of his writings concern the interactions between generations of different sizes.
“The key links in the chain that connects a generation’s size to its fortunes and to the state of the economy and society may be put as follows:
1. Marriage, childbearing, and many other aspects of family formation and growth depend crucially on how the ‘typical’ young couple assesses its ‘relative income,’ that is, the prospects for achieving the economic life-style to which they aspire. . . If young men and women can more readily realize their life-style aspirations and expected family roles, they will experience less psychological stress. But if they have difficulty in achieving their goals, such feelings as inadequacy, hopelessness, despair, resentment, and bitterness will be more widespread. These feelings will be reflected in a variety
of social conditions—in an above-average frequency among young adults of illegitimacy, divorce, crime, alcoholism, motor vehicle accidents, suicide, political alienation, and so on. Such developments give a negative tone to the health of the society generally.
2. A young couple’s relative income depends in large part on the supply of younger workers relative to older when the partners are in the early working ages. If younger workers are in relatively short supply, their earnings, unemployment experience, and rate of advancement will be favorably affected—all of which increases their relative income. If the opposite is true, the relative income of young couples will suffer.
3. The supply of younger workers relative to older depends chiefly on their generation size, the national birth rate about 20 years earlier. Small generations, hailing from low birth rate periods, such as the 1930s, are in short supply when working age is reached. Large generations, such as those born in the high birth rate era of the 1950s, are in excess supply.
The story of the past 40 years is in part one of the impact of major swings in generation size on the economy and society.”
source: Richard Easterlin, Birth and Fortune (Chicago: University of Chicago Press, 1980): 146-47.
of an expanding supply of labor in the face of a slowdown in demand (see Box 2). Even a slight acquaintance with basic economic principles of supply and demand is enough to predict the results for men’s careers—unprecedented economic good luck for the lucky Few and unusually troubled early careers for baby boomers.
Figure 2 (page 7) shows the percentage of all men and women employed in each generation. These data were taken each year from Current Population Surveys starting in 1962 to capture each generation as their median ages advanced through adulthood. The picture for the lucky Few is almost complete, but it is less clear for older or younger generations. in 1969, when the lucky Few reached median age 32, nearly 95 percent of men in their generation held paying jobs—the highest employment rate of the century. This early success and their leap into white-collar jobs detailed below might help explain why lucky Few men began withdrawing from paying jobs earlier than the Good Warriors or Hard Timers before them. Figure 2 also shows this early retirement trend.
By contrast, when baby-boomer men reached median ages in their early 30s, only about 85 percent held paying jobs. Even in their peak employment year of 1990, baby-boomer men failed to reach an employment rate of 90 percent. About twice as many of these young men lacked paying jobs at peak employment ages compared with the lucky Few. it is too soon to tell what the baby boomers will do when they write their chapter on retirement, though that time is not far off.
Young men in Generation X, however, provide clear evidence that although generation size has important market consequences, it is not the whole story. like the lucky Few, Generation X formed another group smaller than the generation before them. if small generation size were enough to bring economic good fortune, they should have repeated the career success of the lucky Few. instead, the men of Generation X have followed in the shallower economic footsteps of young baby-boomer men, plagued by more unemployment, later labor force entry, and slower career advancement. We could not ask for clearer evidence that general macroeconomic conditions matter at least as much as generation size in determining our fates in the work force.
Despite such generational fluctuations, the general age profile of paid work for men remained basically the same throughout the 20th century. By comparison, Figure 2 (page 7) shows nothing short of a revolution in terms of paying jobs for women.14 Along with starting work earlier and reaching higher levels of employment in middle adulthood, each new generation of women also stayed at work longer than the generation before them.
Earlier generations of women usually sequenced motherhood and paid employment rather than combining them, so women tended to reach their peak years of paid employment much later in life than men. Women in the Good Warrior generation reached a peak employment rate of 50 percent at median age 52 in 1970. By comparison, lucky Few women reached a higher peak employment rate of 63 percent in

www.prb.org PoPUlATioN BUllETiN 64.1 2009 7
1989, also at median age 52. This looks like an impressive gain in jobs for women, until we observe that baby-boomer women reached a peak employment rate of 75 percent a decade earlier in their lives in 1998, when the median baby-boomer woman was only 45 years old.
Attention to gender thus reveals mirror-image generational contrasts for women compared to men. Among the lucky Few, men set economic records while women showed much slower progress. For baby boomers, women set economic records while men showed much slower progress. Generation X women, though they have barely begun their working careers, are already running ahead of baby boomers in their early and widespread entry into paying jobs and once again, this trend seems to be paired with sluggish progress for men.15
Fall and Rise of Marriage AgesJust as there are employment contrasts across generations over the life-course, there are also contrasts in home and family life. Table 3 (page 8) shows the percentage of men and women in each generation
who had married by age 20 and the percentage married by age 29, spanning the ages when the majority of first marriages happen in every generation. lucky Few women got married earlier than any other generation in American history.16 Earlier and later generations entered marriage at a slower pace. The other small generation, Generation X, married later than any of the other generations observed so far.
Most people do not marry while still in school. Yet the lucky Few men, who advanced much further in school than earlier generations, also married earlier than any other generation in the history of the United States. How did they manage to combine more schooling with earlier marriage?
in 1900, half of all men and women had stopped going to school by age 15. in the same year, half of all men still remained unmarried at age 25, so for men the window between leaving school and entering marriage averaged about 10 years. Women were almost 23 years old before half of them had gotten married, leaving a window of eight years on average between school and marriage at the start of the century.
Percent of All Persons Employed
Age of Median Birth Cohort
Generation X MenBaby Boomer Men
Lucky Few Men
Good Warrior Men
Hard Timer Men
Generation X Women
Baby Boomer Women
Lucky Few WomenGood Warrior Women
Hard Timer Women
0
100
90
80
70
60
50
40
30
20
10
20 25 30 35 40 45 50 55 60 65 70
source: original calculations from Current Population Survey integrated Public Use Microdata Samples, 1962-2007.
fiGure 2
Percent Employed by age and Generation for men and Women

www.prb.org PoPUlATioN BUllETiN 64.1 20098
For each succeeding generation prior to the lucky Few, this window between finishing school and getting married gradually narrowed. The bottom of the window closed upward as people stayed in school longer. The top of the window also closed downward as people married earlier. For the lucky Few, the window of time between the median age at leaving school and the median age at first marriage was smaller than for all other generations. in fact, this window almost closed altogether for lucky Few women, who on average married only a little more than a year after leaving school.
Since that time, however, the window has begun to open again. While baby boomers completed even more formal schooling than the lucky Few, they also delayed their marriages to a much greater degree. The gap between leaving school and getting married continued to widen for Generation X. Eventually it will be evident whether this trend also continues for the New Boomers born at the close of the 20th century.
Motherhood Mania and the Baby BoomTable 3 also shows proportions of women who had become mothers by age 20 and by age 29 for the Good Warrior, lucky Few, and baby- boomer generations. (Since the 1920 and 1930 censuses did not
ask women about the number of children born, we cannot include earlier generations like the Hard Timers. Since the youngest member of Generation X only reached age 18 by 2000, we cannot yet include younger generations either.)
lucky Few women began having babies earlier than either the Good Warriors before them or the baby boomers who followed them. Birth statistics for even older or younger generations would make the uniqueness of the lucky Few stand out more sharply, since Generation X women so far have delayed their first births more than the baby boomers. From what we do know about the Hard Timers’ lives, we can guess that they probably also delayed their births just as they delayed their marriages.17
Transformation of OccupationsEach generation that lived through the 20th century encountered a new and different social landscape as they sought their places in the huge, complex system of jobs and businesses in the United States. Table 4 (page 9) shows that more than one-fifth of all New Worlder men were still farming when counted by the 1920 Census at ages 31 through 49, but later generations abandoned farms almost completely as noted for children above.
After the New Worlder generation, Hard Timer and Good Warrior men moved to the industrial cities of America to work in factories and other blue-collar jobs. in fact, a larger share of Good Warrior men worked as skilled craftsmen than for any other 20th-century generation. The next shift in employment, from blue-collar to white-collar jobs, occurred for lucky Few men, consistent with their impressive leap forward in formal schooling. over one-third of all lucky Few men became professionals or managers, rising quickly within new corporate structures where they found jobs right out of school. Baby-boomer men later mainly repeated the occupational mix of the lucky Few, with a few minor shifts, but Hughes and o’Rand also note that internal disparities of income and wealth became more pronounced among the boomers.18 Generation X has not yet reached ages where lifetime career choices can be assessed.
Women living and working beside their husbands on farms were not counted in early censuses as farmers, so the female labor force for New Worlders in particular was systematically undercounted. For people who were counted in the labor force, Table 4 (page 9) shows a higher share of professionals for women than for men in each generation, though for women the leading professions throughout most of the 20th century included nursing and teaching in elementary and high schools, while for men the leading professions included law, medicine, college and university teaching, and other higher-status, higher-paid jobs. Yet it remains true that the female labor force (small though it was at first) always has a more white-collar, professional character than the work force of men in the United States.
At the start of the 20th century, however, most of the few New Worlder and Hard Timer women with paid jobs worked in service occupations—as maids, housecleaners, nannies, hired help on farms, or custodial employees. The share of women working in such service jobs, the biggest single category for New Worlder women, shrank significantly for each successive generation.
tABle 3
Percent Ever married by Sex and Percent of Women With Births, ages 20 and 29
— Not available.
note: Each generation spans multiple censuses to count all men and women in a generation exactly once between ages 20 and 29; e.g., lucky Few were enumerated at ages 20 and 21 in 1950, ages 20 through 29 in 1960, and at ages 25 to 29 in 1970, all combined to produce figures shown. source: original calculations from U.S. Census integrated Public Use Microdata Samples.
PerceNT ever Married
PerceNT MoTHers
aGe 20 aGe 29 aGe 20 aGe 29
MeN
New Worlders 7.6 66.0 — —
Hard Timers 11.3 69.9 — —
Good Warriors 11.8 78.8 — —
Lucky Few 21.6 84.9 — —
Baby Boomers 18.3 70.6 — —
Generation X 10.7 60.7 — —
WoMeN
New Worlders 36.3 80.5 — —
Hard Timers 37.6 82.5 — —
Good Warriors 37.7 86.3 21.7 68.0
Lucky Few 52.6 90.8 29.4 82.8
Baby Boomers 36.7 79.7 25.3 67.2
Generation X 19.5 70.3 — —

www.prb.org PoPUlATioN BUllETiN 64.1 2009 9
The share of women employed in industry peaked among the still-small female labor force of the Good Warrior generation, just as it did for men. in the case of women, these factory jobs actually peaked during World War ii when women took the place of men serving in the military. However, after mid-century, these blue-collar jobs for women also began to decline, replaced by a new concentration of jobs in white-collar clerical occupations for women in the later generations. Some have even called these clerical occupations the “pink-collar ghetto” because they absorbed so much of the rapidly expanding female labor force—particularly for lucky Few women. A full one-third of lucky Few women with paying jobs at ages 35 to 51 in 1980 (the peak working ages for their generation) reported clerical occupations—the most intense concentration in this one occupational group seen for any generation.
Table 4 also shows important gains in both managerial and professional jobs for lucky Few women. This trend continued to accelerate when the baby-boomer women, with their substantial educational gains, came on the scene. The pink-collar ghetto began to shrink as a result of computerization, office automation, and other technological changes, so that the occupational distribution of baby-boomer women actually resembles that of baby-boomer men (though women still tend to have the secretarial jobs and men still tend to be the craftsmen and equipment operators). By the end of the 20th century, women had not only made inroads into occupations previously open only to men, but women’s labor force participation had expanded to the point that women made up almost half of the labor force.
tABle 4
Occupations for Generations of men and Women in midlife (Percent)
note: Totals in labor force: New Worlders 13.3 million (men) and 2.5 million (women); Hard Timers 16.3 million (men) and 4.5 million (women); Good Warriors 21.5 million (men) and 10.2 million (women); lucky Few 18.7 million (men) and 13.3 million (women); and Baby Boomers 33.5 million (men) and 29.6 milion (women). note: “Farmers” do not include farm workers, hired hands, or day laborers. Those who work the land without owning it or having permanent residences there appear instead among the “laborers” category in the table. source: original tabulations from U.S. Census integrated Public Use Microdata Samples.
occUPaTioNaL GroUPs
NeW WorLders (1920 ceNsUs)
Hard TiMers (1940 ceNsUs)
Good Warriors (1960 ceNsUs)
LUcKy FeW (1980 ceNsUs)
BaBy BooMers (2000 ceNsUs)
MeN
Farmers 22 13 5 2 1
Laborers 18 16 8 5 6
Service 4 6 5 7 8
Operators 14 18 21 17 15
Crafts 19 18 25 23 21
Sales 5 6 7 6 6
Clerical 4 7 6 6 7
Managers 10 11 13 17 16
Professions 4 6 10 17 21
WoMeN
Farmers 4 1 0 0 0
Laborers 10 3 2 2 1
Service 31 28 22 17 15
Operators 20 20 20 13 7
Crafts 2 2 2 2 2
Sales 6 5 9 6 6
Clerical 11 21 29 33 29
Managers 4 5 4 7 11
Professions 12 14 12 19 29
www.prb.org PoPUlATioN BUllETiN 64.1 200910
tABle 5
Percent of men in Labor Unions
— Not available.
source: original calculations from Gallup Polls and General Social Surveys.
New Worlders1870-1889
Hard Timers1890-1909
Good Warriors1910-1928
Lucky Few1929-1945
Baby Boomers1946-1964
Wartime Peacetime
0
1
2
3
4
5
6
7
8
0.40.2
0.9
0.9
1.9
4.5
4.0
2.1
2.9
1.1
fiGure 3
Years of active Duty per 100 Person-Years Lived, ages 17-54
sources: Numerators of person-years of active duty from U.S. Department of Defense Military Manpower Statistics. Denominators of person-years lived by all men in each generation from decennial censuses and intercensal straight-line cohort interpolation. original tabulations of census data used 1% Public Use Microdata Samples of decennial censuses (www.ipums.umn.edu).
Union BoomThe share of workers belonging to labor unions rose dramatically in the aftermath of the Great Depression, gaining tremendous ground during World War ii as manufacturing industries expanded quickly under the stimulus of wartime production. The peak in union membership came shortly after mid-century, but membership rates began to drop again as industrial employment declined. By the end of the 20th century, American workers were just about back where they had started in 1900, with less than 10 percent of the total employed population reporting union membership.
Good Warrior men made the leap from farming to blue-collar and crafts occupations—the kinds of jobs most likely to be involved with labor union membership. on the other hand, the lucky Few men made the biggest jump of the century from blue-collar jobs to white-collar occupations, jobs in which union membership never took root to the extent it did in blue-collar jobs. Therefore, we would expect the Good Warriors to be the champions of labor unions and the lucky Few to leave this form of collective organization behind.
Table 5 shows precisely this pattern. The experience of the Hard Timers (“young workers” in 1937 and “mature workers” in 1957) shows the upswing in industrial manufacturing and union jobs that resulted from World War ii production and the postwar industrial boom. The experience of Good Warriors (“young workers” in 1957 and “mature workers” in 1973) shows the peak of the union boom. Nearly four of every 10 Good Warrior men reported belonging to a labor union by 1973.
The lucky Few, already past the peak of blue-collar industrial employment and rising into management and professional jobs on the basis of their higher education, never reached a level of union membership near that of the Good Warriors. Even as “young workers” in 1973, the lucky Few men were only as unionized as the mature Hard Timers had been 20 years earlier—only a little over a fourth reported union membership. By the time they reached mature working ages, union membership among the lucky Few actually fell, making them the first generation of the century to move away from unions
NeW WorLders
Hard TiMers
Good War-
riorsLUcKy
FeWBaBy
BooMers
1937 15 16 — — —
1957 — 27 31 — —
1973 — — 40 29 —
1989 — — — 20 18
as they grew older, rather than gaining more union membership with increasing age and job seniority. Mature lucky Few workers were only about as likely to belong to unions as the young baby boomers.
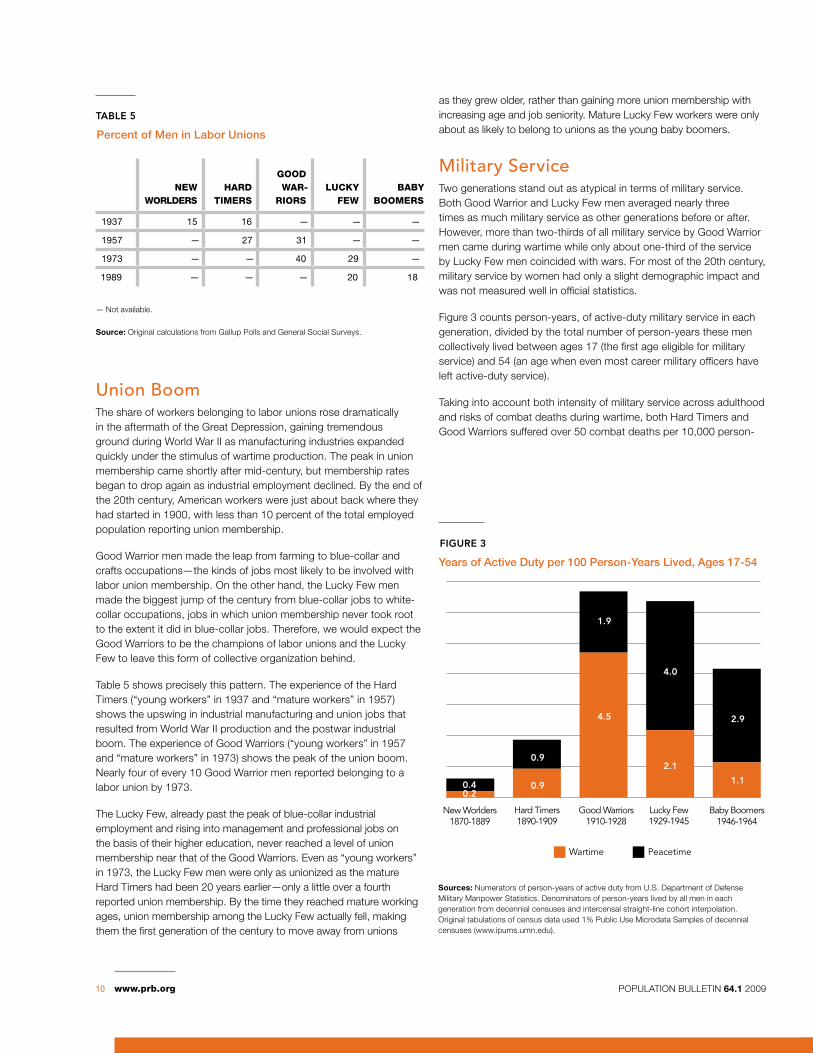
Military ServiceTwo generations stand out as atypical in terms of military service. Both Good Warrior and lucky Few men averaged nearly three times as much military service as other generations before or after. However, more than two-thirds of all military service by Good Warrior men came during wartime while only about one-third of the service by lucky Few men coincided with wars. For most of the 20th century, military service by women had only a slight demographic impact and was not measured well in official statistics.
Figure 3 counts person-years, of active-duty military service in each generation, divided by the total number of person-years these men collectively lived between ages 17 (the first age eligible for military service) and 54 (an age when even most career military officers have left active-duty service).
Taking into account both intensity of military service across adulthood and risks of combat deaths during wartime, both Hard Timers and Good Warriors suffered over 50 combat deaths per 10,000 person-

www.prb.org PoPUlATioN BUllETiN 64.1 2009 11
years of military service, while both lucky Few and baby-boomer men experienced fewer than 10 combat deaths per 10,000 person-years of service.19 The lucky Few, in other words, were just as “military” as the Good Warriors, but their mostly peacetime military service meant they only suffered casualties like the other less-military generations of the century.
Political IdentitiesThe journalistic shorthand of “red” states and “blue” states not only represent places where the Republican or Democratic party dominates the electoral process, but also places where generally conservative or liberal political positions and values are believed to be more prevalent. However, equating Republicans with conservatives and Democrats with liberals does not apply consistently across American generations.20 Figure 4, based on General Social Survey responses for the last quarter of the 20th century, shows a separate pie chart of political orientation and party identification within each generation.
Conservatives actually equal or outnumber liberals among Democrats from earlier generations. These are the Democrats who remember FDR, World War ii, and growing up in the Great Depression. Newer generations of Democrats are more likely to call themselves liberals. They remember the civil rights movement, the Vietnam War, and other facets of a very different historical period. in fact, liberal identification has crowded out both conservatives and moderates among younger generations of self-identified Democrats, polarizing the shrinking share of Americans who still identify with this political party.
Republicans have always been more conservative than Democrats or independents, but only slightly more than half of Republicans in every generation actually identified themselves as conservatives. As declared Republicans shrank to a smaller share of each new generation, they also became slightly more conservative; both Republicans and Democrats became more polarized politically as the parties shrank. The lucky Few emerge as the most conservative Republicans of any generation in the 20th century. Since then, newer generations of Republicans have become more moderate (notably Generation X), and perhaps as a result have expanded to claim a larger share of this youngest generation.
The number of independents grew in each new generation at the expense of both political parties. The share of people omitting party identification and claiming to be independents captures more of Generation X (nearly half—43 percent) than any group before them. Conservatives outnumbered liberals by 2 to 1 among independent Hard Timers and Good Warriors, but liberals actually outnumber conservatives among both baby-boomer and Generation X independents. The lucky Few independents provide the transition or “tipping point” between these two contrasting patterns for older and younger generations of independent voters. More than ever before, moderate independents are the biggest single political category in the youngest generations, outnumbering both liberal Democrats and conservative Republicans.
Liberal Democrat
Moderate Democrat
Conservative Democrat
Liberal Independent
Moderate Independent
Conservative Independent
Liberal Republican
Moderate Republican
Conservative Republican
A
B
C
D
E
F
G
H
I
Hard Timers
12%
18%
12%
3%9%7%
5%
13%
19%
G
H
F
A
D
C
B
E
I
Lucky Few
14%
17%
10%
8%14%
11%
3%
8%
16%
I
G
H
F
E
A
C
D
B
Good Warriors
12%
20%
13%
5%12%
9%
3%
10%
15%
G
H
F
A
D
C
B
E
I
Generation X
13%
11%
6%
13%
19%
11%
4%
9%
14%
I
E
F
G
H
C
D
B
A
Baby Boomers
15%
13%
7%
13%16%
11%
4%
8%
14%
G
H
F
A
B
C
DE
I
fiGure 4
Political Identities of Generations
source: original calculations from General Social Survey cumulative file.
National Origins and RaceThe earliest generations living at the beginning of the 20th century (the New Worlders and Hard Timers) grew up during a great wave of immigration into the United States.21 As a result, because migrants tend disproportionately to be young adults, one of every four New Worlders was foreign-born by the time their generation reached middle age, a fraction far above that of any other generation of the

www.prb.org PoPUlATioN BUllETiN 64.1 200912
the Hard Timers who died before age 15 (20 percent of men and 17 percent of women), a tremendous improvement in survival during the 20th century. in fact, in recent decades death rates fell fastest at the oldest ages, and deaths prevented at these ages make the population older.
in 1900, a total of nearly two dependents relied on every worker in the labor force. This level of dependency was almost cut in half by 2000. Apart from a short interruption due to more young dependents during the baby boom, there was a continuous century-long improvement in the balance of dependents and workers. Table 6 also separates males and females outside the labor force into those who are under age 15, ages 15 through 64, and ages 65 and over. Dividing totals for each of these subgroups of the dependent population by the number of workers in the labor force shows the number of each kind of dependent per worker. This method of looking at economic dependency in the population is more precise than assuming that everyone ages 15 to 64 is in the labor force and everyone else is not.
As Table 6 shows, a dramatic decline in dependents under age 15 (caused by falling birth rates) contributed to the overall reduction in dependency. Throughout the 20th century, however, a major and rapidly changing share of dependents actually appeared within what people often call the “working ages.” in fact, working-age dependents vastly outnumber dependents ages 65 and over throughout the entire century, right down to the present day, even though rising employment rates for women have reduced this group of dependents decade by decade.
The number of dependents ages 65 and older per worker increased due to population aging. Fewer children in the population, however, and the shift of working-age women into the labor force more than compensated for rising shares of older people. The net result was a long-term decline in dependents per worker—an important cause of higher material living standards enjoyed by Americans in the final decades of the 20th century.
Disability vs. Active LifeRetirement decisions of people in every generation are based on a variety of factors. Some people may live part of their lives in good health, but may suffer later from various chronic ailments that multiply
century. in those early decades, a widespread and well-established consensus viewed diverse national origins in terms of “race,” in the sense that this biologism (a concept pretending biological origins, but without rigorous biological scientific content) was understood then. Race was not only a question of skin color, but of nationality—the italian race was seen as distinct from the German or irish races.
By mid-century, however, Americans shifted to a more simplistic, streamlined concept of race, mainly focused on black and white. Drastic reductions in immigration, beginning with legal restrictions in the 1920s and compounded by the Great Depression and World War ii, weakened nationality as a basis for “racial” identity. National origins became less salient simply because nearly everyone shared a single national origin—they were native-born Americans. More than nine of every 10 people among the lucky Few and the Good Warriors were born inside the United States.22
By the end of the 20th century, due in part to renewed immigration from the 1960s onward, America’s self-image began to swing back toward national origins as the basis for constructing race—though with a new twist.23 After the lucky Few, to some extent among the baby boomers but especially for Generation X and the New Boomers, diverse new immigrant streams from latin America and Asia began to pull constructed racial identity back toward complexity. Thus, one out of every six people in Generation X could claim to be foreign-born by 2000, and continued immigration is now increasing this share further as well as for the New Boomers coming after them. This new diversity already has powerful implications for how Americans think of race, beyond black and white, as well as nationality.24
Under the race and ethnicity classification scheme currently used for official U.S. census forms, Hispanics may be of any race. People in the United States who see themselves as Hispanic increasingly insist that this category should be recognized as a race rather than separated as an ethnicity. Asians and other immigrants, concentrated in the newest generations, also do not fit easily into the simplistic black-white dichotomy that prevailed in mid-century generations. Some people in each generation have been changing self-identification between censuses. For example, the share of American indians counted in successive censuses within each generation has increased. Such growth could not be due to immigration or to differences in mortality. The only possible answer is that some people are reclassifying themselves officially as American indians although they had not done so before.25
Survival of GenerationsAccording to cohort death rates estimated from the Human Mortality Database, about one-fifth of Hard Timer boys and girls died in childhood. Child survival improved significantly for each generation. only about 2 percent of Generation X failed to reach age 15. These survival improvements in childhood actually made the United States younger.
Although adult survival didn’t increase as fast as improvements for children, a century of steady progress against mortality at all ages meant that the share in Generation X eventually dying by age 65 (20 percent of men and 12 percent of women) should rival the share of
tABle 6
Dependents by age and Sex per Employed Worker
note: Dependents by age and sex in each census year divided by total labor force regardless of age.source: original calculations from U.S. Census integrated Public Use Microdata Samples.
MeN
<15
WoMeN
<15
MeN
15-64
WoMeN
15-64
MeN
65+
WoMeN
65+ ToTaL
1900 0.48 0.47 0.09 0.66 0.02 0.05 1.78
1950 0.34 0.32 0.12 0.55 0.06 0.10 1.48
2000 0.22 0.21 0.15 0.22 0.08 0.13 1.01

www.prb.org PoPUlATioN BUllETiN 64.1 2009 13
with increasing age and often play some role in retirement decisions. The most common measurements of health outcomes identify limitations in certain activities of daily living (ADls). National statistics on ADls record chronic problems with key areas of personal care: bathing or showering, dressing, getting in or out of bed or a chair, using the toilet, and eating. A person is considered to have an ADl limitation if any chronic condition creates a need for regular, ongoing help with one or more of these specific activities.
We compare responses to the National Health interview Survey (NHiS) question about ADl limitations for three generations—Hard Timers reaching ages 62 through 80 at the time of the 1970 NHiS, Good Warriors who were ages 62 to 81 when interviewed in 1990, and the lucky Few reaching ages 61 through 77 in time for the 2006 NHiS. Each successive generation reported better health than the previous one as they reached these early retirement ages.26
When Hard Timers reached their 60s and 70s, women reported themselves to be in better health than men. Two-thirds (66 percent) of all Hard Timer women in 1970 said they had no physical limitations in their daily lives, while the equivalent share of men without such problems stood almost 10 percentage points lower at 58 percent. By 1990, when the Good Warriors reached these same ages, the share of men reporting no limitations increased to match the two-thirds of women still reporting no problems with such activities. The positive trend in disability-free living advanced even more for the lucky Few. once again, men gained faster than women. By 2006, a full three-fourths of all lucky Few men in their 60s and 70s reported no limitations in activity, actually higher than the 73 percent of lucky Few women who could make the same claim.
one important reason for the greater gains by men in avoiding disability probably involved the long-term shift from farm occupations (more common for New Worlders and Hard Timers) and blue-collar occupations (in which the Good Warriors led the way) into white-collar and professional careers (characterized by the lucky Few). This dramatic shift in working conditions cut the chances for work-related injuries and the bodily wear and tear of jobs involving hard physical labor. Rising real income for each generation provided better health care as well, and the preponderance of peacetime military service for the many lucky Few veterans also contributed to their avoidance of disabilities.
All in all, not only has the number of years lived increased for each new generation, but also the number of disability-free years. By 2026, the baby boomers will be in the same age range as reported here for these earlier generations. For this generation, increasing obesity rates threaten the progress made in avoiding disability, but medical advances in drug therapies and assistive technology may counterbalance these effects.
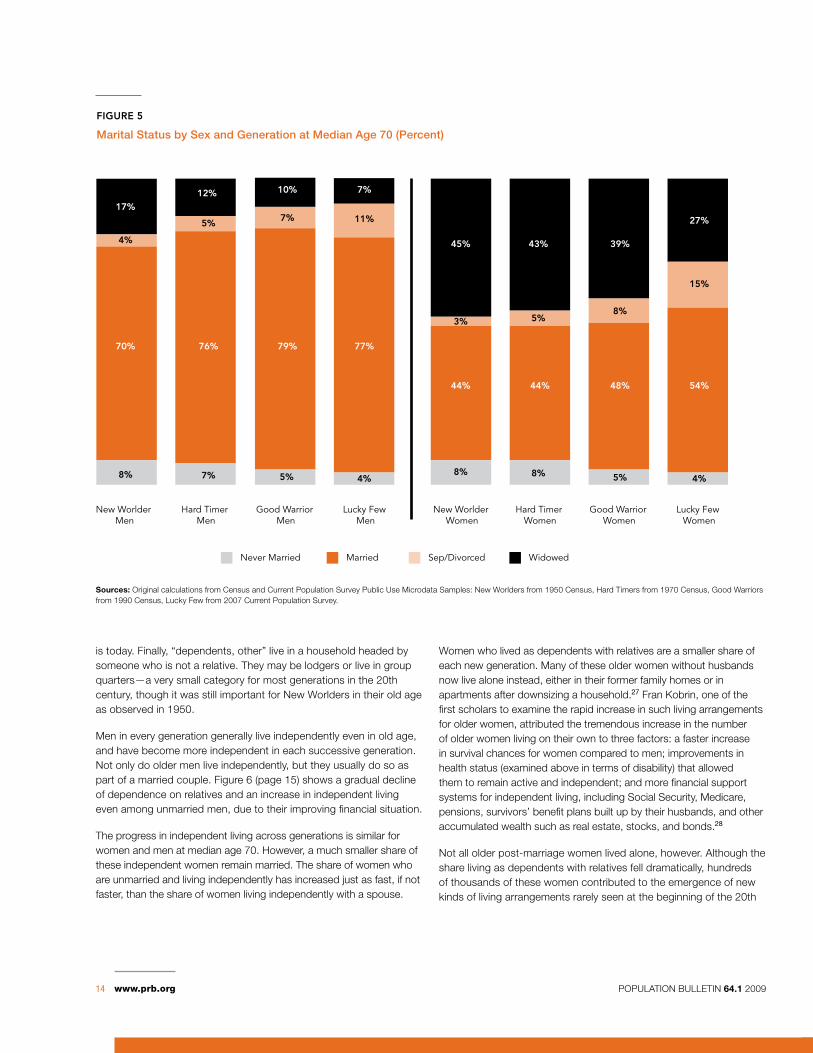
Marriageone way to look at everyday living arrangements for people reaching older ages is to consider the marriages they entered earlier in life. Figure 5 (page 14) shows marital status for four generations, measured when each had reached a median age of 70 (using the 1950 Census for New Worlders, the 1970 Census for Hard Timers,
the 1990 Census for Good Warriors, and the 2007 Current Population Survey for the lucky Few). We cannot yet see this far into the life course for the baby boomers and other younger generations.
At an average age of 70, each generation of women included a larger share that was married than previous generations. The picture is not quite so clear for men. Hard Timer, Good Warrior, and lucky Few men all reported similar percentages married at these ages. one reason for the rising share of those married in each new generation can be found in the steady contraction of those who never married, particularly for women. However, the dramatic decline in widowhood played an even bigger role in more marriages surviving to older ages. The share of widowers among men at median age 70 fell by more than half from the New Worlders to the lucky Few (from 17 percent to 7 percent). While the equivalent share of widows among women did not fall by half, the absolute decline of 18 percentage points (from 45 percent of New Worlder women to 27 percent of lucky Few women widowed) was actually much greater than the absolute decline for men.
The share of people separated and divorced increased over time. in this respect the lucky Few do not appear to be so lucky. The percentage of men reporting that they were divorced when their generation averaged 70 years old nearly tripled from 4 percent of New Worlders to 11 percent of the lucky Few and will undoubtedly be much higher for younger generations in the future. For women, the share separated or divorced increased even faster, from 3 percent to 15 percent for the New Worlders to the lucky Few. This only counts people still reporting themselves as divorced at each census or survey date—it does not include any formerly divorced people who have married again. This is one important reason why fewer men than women report themselves as divorced—men remarry after divorce more frequently and sooner than do women.
Trends in Independent Livingliving arrangements for people as they grow older provide another way to look at everyday life, a slightly different point of view from the discussion of marriage, divorce, and widowhood above. Figure 6 (page 15) collapses many detailed categories of living arrangements into four main groups, again comparing generations at median age 70.
Those classified as living independently with a spouse are married couples with one partner identified as the head of a household. A few married couples at these advanced ages are no longer able to live independently, and spouses live together as dependents in someone else’s household.
individuals living independently but with no spouse are not married. These include people who live alone, single parents heading a household with their dependent children, or people living with an unmarried partner or housemate and so on. Many more women fall into this category than men.
A dependent living with relatives is a member of a household headed by a relative other than a spouse. This relative is most often an adult child of the respondent, and sometimes a sibling or other relative. This arrangement, more common for women than for men in old age, was much more prevalent in the beginning of the 1900s than it
www.prb.org PoPUlATioN BUllETiN 64.1 200914
is today. Finally, “dependents, other” live in a household headed by someone who is not a relative. They may be lodgers or live in group quarters—a very small category for most generations in the 20th century, though it was still important for New Worlders in their old age as observed in 1950.
Men in every generation generally live independently even in old age, and have become more independent in each successive generation. Not only do older men live independently, but they usually do so as part of a married couple. Figure 6 (page 15) shows a gradual decline of dependence on relatives and an increase in independent living even among unmarried men, due to their improving financial situation.
The progress in independent living across generations is similar for women and men at median age 70. However, a much smaller share of these independent women remain married. The share of women who are unmarried and living independently has increased just as fast, if not faster, than the share of women living independently with a spouse.
Women who lived as dependents with relatives are a smaller share of each new generation. Many of these older women without husbands now live alone instead, either in their former family homes or in apartments after downsizing a household.27 Fran Kobrin, one of the first scholars to examine the rapid increase in such living arrangements for older women, attributed the tremendous increase in the number of older women living on their own to three factors: a faster increase in survival chances for women compared to men; improvements in health status (examined above in terms of disability) that allowed them to remain active and independent; and more financial support systems for independent living, including Social Security, Medicare, pensions, survivors’ benefit plans built up by their husbands, and other accumulated wealth such as real estate, stocks, and bonds.28
Not all older post-marriage women lived alone, however. Although the share living as dependents with relatives fell dramatically, hundreds of thousands of these women contributed to the emergence of new kinds of living arrangements rarely seen at the beginning of the 20th
New Worlder Men
Hard Timer Men
Good Warrior Men
Lucky Few Men
New Worlder Women
Hard Timer Women
Good Warrior Women
Lucky Few Women
Never Married Married Sep/Divorced Widowed
17%
4%
70%
8%
12%
5%
76%
7%
10%
7%
79%
5%
7%
11%
77%
4%
45%
3%
44%
8%
44%
43%
5%
8%
39%
8%
48%
5%
27%
15%
54%
4%
fiGure 5
marital Status by Sex and Generation at median age 70 (Percent)
sources: original calculations from Census and Current Population Survey Public Use Microdata Samples: New Worlders from 1950 Census, Hard Timers from 1970 Census, Good Warriors from 1990 Census, lucky Few from 2007 Current Population Survey.

www.prb.org PoPUlATioN BUllETiN 64.1 2009 15
century.29 in the last quarter of the 20th century, pioneering ad hoc communities have been joined by a vast, rapidly expanding universe of new housing patterns including congregate housing, independent living complexes, assisted-living facilities, and other special structures and organizations. in fact, we have not yet seen the real growth spurt of this new industry at all. it is just beginning today, as the enormous baby-boom generation reaches the ages where these new and complex living arrangements become a part of their world.
Generational ContrastsThroughout the life course, generations matter. Each of the vantage points for viewing generations discussed in this Population Bulletin adds weight to this overall conclusion. Generation size influences opportunities for education, career access and advancement, and options for retirement. The composition of a generation, in terms of nationalities, influences attitudes about immigrants and the meaning of concepts like race.
Changes from one generation to the next in urban/rural makeup, education, family formation, military service, and occupational options shape distinctive generational outlooks on fundamental questions. Do daughters need college educations? Should people forming intimate unions get married, or can they just live together? Do political leaders need to be military veterans? Can a “normal” marriage do without children? Are blue-collar or white-collar jobs “typical” occupations? Should married women pursue careers of their own? When is the normal time to retire? Context-specific responses to these and many other questions produce shifting patterns observed across different generations.
The repeated contrasts noted earlier between the two small generations, the lucky Few and Generation X, highlight the unique historical context that separates each generation from others, limiting or expanding possibilities as well as shaping outlooks on life. Although both the lucky Few and Generation X were small generations, men in the lucky Few experienced the best luck of
0
20
40
60
80
100
New WorlderMen
Hard TimerMen
Good WarriorMen
Lucky FewMen
New WorlderWomen
Hard TimerWomen
Good WarriorWomen
Lucky FewWomen
Independent, with spouse Independent, no spouse Dependent, relatives Dependent, other
66%
14%
9%
10%
74%
16%
5%
4%
77%
17%
3%3%
75%
21%
4%
41%
29%
22%
8%
42%
40%
13%
4%
47%
43%
7%
3%
53%
40%
7%
fiGure 6
Living arrangements by Sex and Generation at median age 70 (Percent)
sources: original calculations from Census and Current Population Survey Public Use Microdata Samples: New Worlders from 1950 Census, Hard Timers from 1970 Census, Good Warriors from 1990 Census, lucky Few from 2007 Current Population Survey.

www.prb.org PoPUlATioN BUllETiN 64.1 200916
the century in terms of education and employment opportunities, while men in Generation X struggle just to keep up with the weaker economic record of the baby boomers. Being a part of a smaller generation has not helped the men of Generation X very much. Contrasting macroeconomic conditions during their working lives explain the contrast between these two smaller generations.
Similarly, lucky Few women contrast with Generation X women. Women in the lucky Few married early, had many children, and lagged far behind men in schooling and career advancement. Generation X women, in contrast, have postponed marriage and children and instead have graduated from college more often than men in their generation. in addition, they have almost matched them in labor force participation and in occupational choices. Changing norms about roles
for men and women as well as economic conditions played a part in creating this generational contrast.
“As a social category, a generation probably offers a safer basis for personality generalization than such other social categories as sex, race, region, or age.”30 This audacious claim by Strauss and Howe remains just as worthy of consideration now as when they stated it a generation ago. No matter how contrasts between generations have been created, one fundamental fact of life remains true in the United States: Generations matter. To understand other people, and even to fully understand ourselves, we must consider generational identity at least as carefully as we consider any other social characteristic. And a salient part of generational differences in identity may be captured by contrasting generations’ demographic experiences.
References1 Norman Ryder, “The Cohort as a Concept in the Study of Social Change,” American
Sociological Review 30, no. 6 (1965): 843-61; and William Strauss and Neil Howe, Generations: The History of America’s Future, 1584 to 2069 (New York: William Morrow, 1991).
2 Gosta Carlsson and Katharina Karlsson, “Age, Cohorts, and the Generation of Generation,” American Sociological Review 35, no. 4 (1970): 710-18; and Elwood Carlson, The Lucky Few: Between the Greatest Generation and the Baby Boom (New York: Springer Publishers, 2008).
3 Strauss and Howe, Generations.
4 Carlson, The Lucky Few.
5 Carlson, The Lucky Few.
6 Mary Elizabeth Hughes and Angela M. o’Rand, The Lives and Times of the Baby Boomers (New York: Population Reference Bureau/Russell Sage Foundation, 2004).
7 Richard A. Easterlin, Birth and Fortune: The Impact of Numbers on Personal Welfare (Chicago: University of Chicago Press,1980); leon Bouvier and Carol De Vita, “The Baby Boom—Entering Midlife,” Population Bulletin 46, no. 3 (1991); and Diane J. Macunovich, et al., “Echoes of the Baby Boom and Bust: Recent and Prospective Changes in living Alone Among Elderly Widows in the United States,” Demography 32, no. 1 (1995): 17-28.
8 Since generations cover more than a decade each, to count all of them at ages under 10 we must find them in several different censuses and combine these figures to get results for the whole generation. in other examples elsewhere in this Bulletin, we look instead at the whole generation in one year, and discuss each one in terms of the median age of the whole generation in that year. These complementary approaches give us different perspectives on generational comparisons. in fact, Figure 1 actually considers the number of people at a single age—30 years old—taken from the population estimates for every year of the century.
9 Peter Uhlenberg, “Cohort Variations in Family life Cycle Experiences of U.S. Females,” Journal of Marriage and the Family 36, no. 2 (1974): 284-92; and Donald J. Hernandez, America’s Children: Resources From Family, Government, and the Economy (New York: Russell Sage Foundation, 1993).
10 Claudia Goldin, “America’s Graduation From High School: The Evolution and Spread of Secondary Schooling in the 20th Century,” Journal of Economic History 58, no. 2 (1998): 345-74.
11 owen R. lovejoy, “Seven Years of Child labor Reform,” Annals of the American Academy of Political and Social Science 38 (1911): 31-38; and Pamela Walters and Carl M. Briggs, “The Family Economy, Child labor and Schooling: Evidence From the Early-Twentieth-Century South,” American Sociological Review 58, no. 2 (1993):163-81.
12 John G. Richardson, “Variation in Date of Enactment of Compulsory School Attendance laws: an Empirical inquiry,” Sociology of Education 53, no. 3 (1980):153-63; and Walters and Briggs, “The Family Economy, Child labor, and Schooling.”
13 Easterlin, Birth and Fortune; and Valerie Kincaid oppenheimer, Work and the Family: A Study in Social Demography (New York: Academic Press, 1982).
14 Valerie Kincaid oppenheimer, The Female Labor Force in the United States: Demographic and Economic Factors Governing its Growth and Composition (Berkeley, CA: institute of international Studies, University of California, 1970); and Suzanne Bianchi and Daphne Spain, “Women, Work, and Family in America,” Population Bulletin 51, no. 3 (1996).
15 For possible heterogeneity within Generation X itself on this point, see James Vere, “Fertility, Female labor Supply, and the New life Choices of Generation X,” Demography 44, no. 4 (2007): 821-28.
16 Kingsley Davis, “The Early Marriage Trend,” What’s New 207 (1958): 36-39.
17 Deborah A. Dawson, D.J. Meny, and Jeanne Clare Ridley, “Fertility Control in the U.S. Before the Contraceptive Revolution,” Family Planning Perspectives 12, no. 2 (1980): 76-86.
18 Hughes and o’Rand, The Lives and Times of the Baby Boomers.
19 Elwood Carlson and Joel Andress, “Military Service by Twentieth-Century Generations of American Men,” Armed Forces and Society 35, no. 1 (2009): 385-400.
20 Philip E. Converse, The Dynamics of Party Support: Cohort-Analyzing Party Identification (Beverly Hills, CA: Sage Publications, 1976); and Neal E. Cutler, “Generational Approaches to Political Socialization,” Youth and Society 8, no. 2 (1976):175-206.
21 Philip Martin and Elizabeth Midgley, “immigration: Shaping and Reshaping America” (2nd edition), Population Bulletin 61, no. 4 (2006).
22 Carlson, The Lucky Few.
23 Margaret Farnsworth Riche, “America’s Diversity and Growth: Signposts for the 21st Century,” Population Bulletin 55, no. 2 (2000).
24 Nancy Foner and George Fredrickson, eds., Not Just Black and White (New York: Russell Sage Foundation, 2004).
25 Karl Eschbach, Khalil Supple, and C. Matthew Snipp, “Changes in Racial identification and the Educational Attainment of American indians, 1970-1990,” Demography 35, no. 1 (1990): 35-43.
26 Eileen M. Crimmins, Yasuhiko Saito, and Dominique ingegneri, “Trends in Disability-Free life Expectancy in the United States, 1970-90,” Population and Development Review 23, no. 3 (1997): 555-72; and Vicki A. Freedman, et al., “Resolving inconsistencies in Trends in old-Age Disability: Report From a Technical Working Group,” Demography 41, no. 3 (2004): 417-41.
27 Macunovich, et al., “Echoes of the Baby Boom and Bust.”
28 Frances E. Kobrin, “The Fall in Household Size and the Rise of the Primary individual in the United States,” Demography 13, no. 1 (1976): 127-38.
29 Arlie Hochschild, The Unexpected Community (Englewood Cliffs, NJ: Prentice-Hall, 1973).
30 Strauss and Howe, Generations: 63.

www.prb.org PoPUlATioN BUllETiN 64.1 2009 17
Visit WWW.PrB.orG to fiNd:
aRticles and RePoRts. New data and analysis on topics as diverse as gender, reproductive health, environment, and race/ethnicity.
gRaPhics Bank. PowerPoint slides of population-related information, ready for use in presentations or in the classroom.
PRB discuss online. Available at http://discuss.prb.org. Join online discussions with experts on newsworthy population, health, and environment topics, trends, and issues. Transcripts of each discussion are archived on PRB’s website.
datafindeR. Search a world database of 133 population, health, and environment variables for 210 countries, 27 world regions and subregions, and the world. A separate U.S. database includes 579 social, economic, and demographic variables for each of the 50 states and the District of Columbia.
foR educatoRs. Access online lesson plans, maps, and educational resources.
foR JouRnalists. Highlights news releases, frequently asked questions, webcasts, and a dictionary of population terms.
“PRB news” and “events & tRaining.” Announces monthly policy seminars, intern and fellowship applications, and workshops, as well as news from PRB’s Communications, Domestic, and international programs.
e-mail this. Send e-mails to others with links to PRB content.
countRy Pages. Scan up-to-date population, health, and environment data for any of 210 countries, and find links to related PRB articles and reports and organizations’ websites.
weBuPdate. Sign up to receive e-mail announcements about new web content and PRB-sponsored seminars and briefings.
Become A memBer of PrB
With new perspectives shaping public policies every day, you need to be well informed. As a member of the Population Reference Bureau, you will receive reliable information on United States and world population trends—properly analyzed and clearly presented in readable language. Each year you will receive four Population Bulletins, the annual World Population Data Sheet, and complimentary copies of special publications. We welcome you to join PRB today.
individual $50
liBRaRy $75
coRPoRation $300
lifetime memBeRshiP $5,000
PoPulation RefeRence BuReau Circulation Dept., P.o. Box 96152 Washington, DC 20077-7553
For faster service, call 800-877-9881 or visit www.prb.org or e-mail [email protected] or fax 202-328-3937
Recent Population Bulletinsvolume 64 (2009)
No. 1 20th-Century U.S. Generations by Elwood Carlson
volume 63 (2008)
No. 1 Managing Migration: The Global Challenge by Philip Martin and Gottfried Zürcher
No. 2 U.S. labor Force Trends by Marlene A. Lee and Mark Mather
No. 3 World Population Highlights: Key Findings From PRB’s 2008 World Population Data Sheet by Population Reference Bureau staff
No. 4 Rethinking Age and Aging by Warren Sanderson and Sergei Scherbov
volume 62 (2007)
No. 1 Population: A lively introduction, 5th ed. by Joseph A. McFalls Jr.
No. 2 Challenges and opportunities—The Population of the Middle East and North Africa by Farzaneh Roudi-Fahimi and Mary Mederios Kent
No. 3 World Population Highlights: Key Findings From PRB’s 2007 World Population Data Sheet by Population Reference Bureau staff
No. 4 immigration and America’s Black Population by Mary Mederios Kent
volume 61 (2006)
No. 1 The Global Challenge of HiV and AiDS by Peter R. Lamptey, Jami L. Johnson, and Marya Khan
No. 2 Controlling infectious Diseases by Mary M. Kent and Sandra Yin
No. 3 india’s Population Reality: Reconciling Change and Tradition by Carl Haub and O.P. Sharma
No. 4 immigration: Shaping and Reshaping America by Philip Martin and Elizabeth Midgley

www.prb.org
1875 Connecticut Avenue., NW Suite 520 Washington, DC 20009
202 483 1100 PHoNe 202 328 3937 fAx
[email protected] emAil
POPULaTIOn rEFErEncE BUrEaU
1875 Connecticut Ave., NW Suite 520 Washington, DC 20009 USA
202 483 1100 PhoNe 202 328 3937 fAx
[email protected] e-mAil
POPULaTIOn rEFErEncE BUrEaU
20th-Century U.s. Generations
Generational differences in demographic experiences provide
some clues about sources of the generational divide seen in some
political and social choices. By virtue of when they were born,
members of each generation live through unique times shaped by
unexpected historical events, changing political climates, and evolving
socioeconomic conditions. Generation size influences opportunities for
education, career access and advancement, and options for retirement.
A generation’s ethnic composition influences attitudes about
immigrants and the meaning of concepts like race. The generational
perspective taken in this Population Bulletin provides key insights into
the distinctiveness of the generations shaping contemporary society.